freshwater ecosystems - csir · 26 6.9.4 freshwater ecosystems and biota (combined) 81 27 6.10...
TRANSCRIPT

1

ST RAT EGIC ENVIRONMENT AL ASSESS MENT F OR GA S P I PE L INE DEVELOP MENT IN SOU T H AFRICA
WET LANDS AND R IVER S S PECIAL IST REPORT
Page 1
STRATEGIC ENVIRONMENTAL ASSESSMENT FOR GAS PIPELINE DEVELOPMENT 1
2
Draft v3 Specialist Assessment Report for Stakeholder Review 3
4
FRESHWATER ECOSYSTEMS 5
6
Contributing Authors Gary de Winnaar1, Dr Vere Ross-Gillespie1
7 1 GroundTruth, Hilton 8
9
10
11

ST RAT EGIC ENVIRONMENT AL ASSESS MENT F OR GA S P I PE L INE DEVELOP MENT IN SOU T H AFRICA
WET LANDS AND R IVER S S PECIAL IST REPORT
Page 2
1
2
3
4
5 TABLES 4 6
FIGURES 4 7
ABBREVIATIONS AND ACRONYMS 7 8
9
1 SUMMARY 8 10
2 INTRODUCTION 9 11
3 SCOPE OF THIS STRATEGIC ISSUE 11 12
4 APPROACH AND METHODOLOGY 13 13
4.1 STUDY METHODOLOGY 13 14
4.1.1 Briefing session 13 15
4.1.2 Literature review and data collation 14 16
4.1.3 Assigning a suitable spatial scale for analysis 14 17
4.1.4 Analysis and integration of GIS data 14 18
4.1.5 Application of metrics for sensitivity analyses 14 19
4.1.5.1 River threat status and sensitivity: 14 20
4.1.5.2 Wetlands threat status and sensitivity: 15 21
4.1.5.3 Freshwater biota (species and families): 16 22
4.1.5.4 Freshwater plants (Kingdom: Plantae): 16 23
4.1.6 Integration of taxonomic groups 18 24
4.1.7 Producing integrated four tier sensitivity maps 18 25
4.2 DATA SOURCES 19 26
4.3 ASSUMPTIONS AND LIMITATIONS 23 27
4.4 RELEVANT REGULATORY INSTRUMENTS 24 28
5 BASELINE DESCRIPTION OF THE PROPOSED GAS PIPELINE CORRIDORS 31 29
6 SENSITIVITY MAPPING 47 30
6.1 IDENTIFICATION SENSITIVITY CRITERIA FOR FEATURES 47 31
6.2 PHASE 1 CORRIDOR 50 32
6.2.1 Rivers 50 33
6.2.2 Wetlands 51 34
6.2.3 Freshwater biota (fauna and flora) 52 35
6.2.4 Freshwater ecosystems and biota (combined) 53 36
6.3 PHASE 2 CORRIDOR 54 37
6.3.1 Rivers 54 38
6.3.2 Wetlands 55 39
6.3.3 Freshwater biota (fauna and flora) 56 40
6.3.4 Freshwater ecosystems and biota (combined) 57 41
6.4 PHASE 3 CORRIDOR 58 42
6.4.1 Rivers 58 43
6.4.2 Wetlands 59 44
6.4.3 Freshwater biota (fauna and flora) 60 45

ST RAT EGIC ENVIRONMENT AL ASSESS MENT F OR GA S P I PE L INE DEVELOP MENT IN SOU T H AFRICA
WET LANDS AND R IVER S S PECIAL IST REPORT
Page 3
6.4.4 Freshwater ecosystems and biota (combined) 61 1
6.5 PHASE 4 CORRIDOR 62 2
6.5.1 Rivers 62 3
6.5.2 Wetlands 63 4
6.5.3 Freshwater biota (fauna and flora) 64 5
6.5.4 Freshwater ecosystems and biota (combined) 65 6
6.6 PHASE 5 CORRIDOR 66 7
6.6.1 Rivers 66 8
6.6.2 Wetlands 67 9
6.6.3 Freshwater biota (fauna and flora) 68 10
6.6.4 Freshwater ecosystems and biota (combined) 69 11
6.7 PHASE 6 CORRIDOR 70 12
6.7.1 Rivers 70 13
6.7.2 Wetlands 71 14
6.7.3 Freshwater biota (fauna and flora) 72 15
6.7.4 Freshwater ecosystems and biota (combined) 73 16
6.8 PHASE 7 CORRIDOR 74 17
6.8.1 Rivers 74 18
6.8.2 Wetlands 75 19
6.8.3 Freshwater biota (fauna and flora) 76 20
6.8.4 Freshwater ecosystems and biota (combined) 77 21
6.9 PHASE 8 CORRIDOR 78 22
6.9.1 Rivers 78 23
6.9.2 Wetlands 79 24
6.9.3 Freshwater biota (fauna and flora) 80 25
6.9.4 Freshwater ecosystems and biota (combined) 81 26
6.10 INLAND CORRIDOR 82 27
6.10.1 Rivers 82 28
6.10.2 Wetlands 83 29
6.10.3 Freshwater biota (fauna and flora) 84 30
6.10.4 Freshwater ecosystems and biota (combined) 85 31
7 KEY POTENTIAL IMPACTS AND MITIGATION 86 32
8 RISK ASSESSMENT 94 33
9 BEST PRACTICE GUIDELINES AND MONITORING REQUIREMENTS 98 34
9.1 PLANNING PHASE 98 35
9.2 CONSTRUCTION PHASE 98 36
9.3 OPERATIONS PHASE 98 37
9.4 REHABILITATION AND POST CLOSURE 99 38
9.5 MONITORING REQUIREMENTS 99 39
10 GAPS IN KNOWLEDGE 100 40
11 CONCLUSIONS AND FURTHER RECOMMENDATIONS 100 41
12 REFERENCES 102 42
43
44
ST RAT EGIC ENVIRONMENT AL ASSESS MENT F OR GA S P I PE L INE DEVELOP MENT IN SOU T H AFRICA
WET LANDS AND R IVER S S PECIAL IST REPORT
Page 4
Appendix 1: Selected flora used in the assessment of freshwater biota 105 1
Appendix 2: Selected fauna according the taxonomic groups used in the assessment of freshwater biota 108 2
3
TABLES 4
Table 1: Criteria for assigning sensitivity classes for wetland attributes. 15 5
Table 2: Data used in this assessment. 19 6
Table 3: Assumptions and limitations. 23 7
Table 4: International, national and provincial regulatory instruments relevant to freshwater ecosystems. 24 8
Table 5: Description of freshwater ecosystems and species of the proposed Gas Pipeline corridors, including 9 existing drivers and pressures. 31 10
Table 6: Data and criteria used to assign sensitivity to freshwater ecosystems within the proposed Gas Pipeline 11 corridors. 47 12
Table 7: Sensitivity ratings assigned to freshwater ecosystem features in all of the proposed Gas Pipeline 13
corridors. 49 14
Table 8: Key potential impacts to freshwater ecosystems and associated fauna and flora by gas pipeline 15 development, and their mitigation. 89 16
Table 9: Assessment of risk associated with impacts to freshwater ecosystems resulting from gas pipeline 17 development with respect to the four-tiered sensitivity classes for freshwater attributes. 95 18
19
FIGURES 20
Figure 1: Overview of the proposed gas pipeline corridors 11 21
Figure 2: Flow (perennial and non-perennial) and threat status of rivers that flow through the gas pipeline 22 corridors developed using the PES, EI and ES data from DWS (2014). 43 23
Figure 3: Wetland threat status based on the national wetland vegetation group regions of Nel and Driver (2012) 24 applied to all wetlands of the collated wetland coverage developed for the gas pipeline corridors 44 25
Figure 4: Point localities and corresponding threat status of freshwater plants based on known occurrence data 26 within the gas pipeline corridors 45 27
Figure 5: Point localities and corresponding threat status of freshwater fauna based on known occurrence data 28 within the gas pipeline corridors 46 29
Figure 6: River threat status and sensitivity calculated for sub-quaternary catchments in the gas pipeline phase 1 30 corridor using PES, EI and ES data from DWS (2014). 50 31
Figure 7: Wetland threat status and sensitivity calculated in relation to areas of sub-quaternary catchments in the 32 gas pipeline phase 1 corridor. 51 33
Figure 8: Threat and sensitivity status calculated for different freshwater taxonomic groups (flora and fauna) in 34 the gas pipeline phase 1 corridor in relation to sub-quaternary catchments. 52 35
Figure 9: Integrated sensitivity and threat status map for freshwater ecosystems and biota in the gas pipeline 36 phase 1 corridor. 53 37
Figure 10: River threat status and sensitivity calculated for sub-quaternary catchments in the gas pipeline phase 38 2 corridor using PES, EI and ES data from DWS (2014). 54 39
Figure 11: Wetland threat status and sensitivity calculated in relation to areas of sub-quaternary catchments in 40
the gas pipeline phase 2 corridor. 55 41
Figure 12: Threat and sensitivity status calculated for different freshwater taxonomic groups (flora and fauna) in 42 the gas pipeline phase 2 corridor in relation to sub-quaternary catchments 56 43
Figure 13: Integrated sensitivity and threat status map for freshwater ecosystems and biota in the gas pipeline 44 phase 2 corridor. 57 45
Figure 14: River threat status and sensitivity calculated for sub-quaternary catchments in the gas pipeline phase 46 3 corridor using PES, EI and ES data from DWS (2014). 58 47
ST RAT EGIC ENVIRONMENT AL ASSESS MENT F OR GA S P I PE L INE DEVELOP MENT IN SOU T H AFRICA
WET LANDS AND R IVER S S PECIAL IST REPORT
Page 5
Figure 15: Wetland threat status and sensitivity calculated in relation to areas of sub-quaternary catchments in 1 the gas pipeline phase 3 corridor. 59 2
Figure 16: Threat and sensitivity status calculated for different freshwater taxonomic groups (flora and fauna) in 3 the gas pipeline phase 3 corridor in relation to sub-quaternary catchments 60 4
Figure 17: Integrated sensitivity and threat status map for freshwater ecosystems and biota in the gas pipeline 5 phase 3 corridor. 61 6
Figure 18: River threat status and sensitivity calculated for sub-quaternary catchments in the gas pipeline phase 7 4 corridor using PES, EI and ES data from DWS (2014). 62 8
Figure 19: Wetland threat status and sensitivity calculated in relation to areas of sub-quaternary catchments in 9 the gas pipeline phase 4 corridor. 63 10
Figure 20: Threat and sensitivity status calculated for different freshwater taxonomic groups (flora and fauna) in 11 the gas pipeline phase 4 corridor in relation to sub-quaternary catchments 64 12
Figure 21: Integrated sensitivity and threat status map for freshwater ecosystems and biota in the gas pipeline 13 phase 4 corridor. 65 14
Figure 22: River threat status and sensitivity calculated for sub-quaternary catchments in the gas pipeline phase 15 5 corridor using PES, EI and ES data from DWS (2014). 66 16
Figure 23: Wetland threat status and sensitivity calculated in relation to areas of sub-quaternary catchments in 17 the gas pipeline phase 5 corridor. 67 18
Figure 24: Threat and sensitivity status calculated for different freshwater taxonomic groups (flora and fauna) in 19 the gas pipeline phase 5 corridor in relation to sub-quaternary catchments 68 20
Figure 25: Integrated sensitivity and threat status map for freshwater ecosystems and biota in the gas pipeline 21 phase 5 corridor. 69 22
Figure 26: River threat status and sensitivity calculated for sub-quaternary catchments in the gas pipeline phase 23 6 corridor using PES, EI and ES data from DWS (2014). 70 24
Figure 27: Wetland threat status and sensitivity calculated in relation to areas of sub-quaternary catchments in 25 the gas pipeline phase 6 corridor. 71 26
Figure 28: Threat and sensitivity status calculated for different freshwater taxonomic groups (flora and fauna) in 27 the gas pipeline phase 6 corridor in relation to sub-quaternary catchments 72 28
Figure 29: Integrated sensitivity and threat status map for freshwater ecosystems and biota in the gas pipeline 29 phase 6 corridor. 73 30
Figure 30: River threat status and sensitivity calculated for sub-quaternary catchments in the gas pipeline phase 31 7 corridor using PES, EI and ES data from DWS (2014). 74 32
Figure 31: Wetland threat status and sensitivity calculated in relation to areas of sub-quaternary catchments in 33 the gas pipeline phase 7 corridor. 75 34
Figure 32: Threat and sensitivity status calculated for different freshwater taxonomic groups (flora and fauna) in 35 the gas pipeline phase 7 corridor in relation to sub-quaternary catchments 76 36
Figure 33: Integrated sensitivity and threat status map for freshwater ecosystems and biota in the gas pipeline 37 phase 7 corridor. 77 38
Figure 34: River threat status and sensitivity calculated for sub-quaternary catchments in the gas pipeline phase 39 8 corridor using PES, EI and ES data from DWS (2014). 78 40
Figure 35: Wetland threat status and sensitivity calculated in relation to areas of sub-quaternary catchments in 41 the gas pipeline phase 8 corridor. 79 42
Figure 36: Threat and sensitivity status calculated for different freshwater taxonomic groups (flora and fauna) in 43 the gas pipeline phase 8 corridor in relation to sub-quaternary catchments 80 44
Figure 37: Integrated sensitivity and threat status map for freshwater ecosystems and biota in the gas pipeline 45
phase 8 corridor. 81 46
Figure 38: River threat status and sensitivity calculated for sub-quaternary catchments in the gas pipeline inland 47 corridor using PES, EI and ES data from DWS (2014). 82 48
Figure 39: Wetland threat status and sensitivity calculated in relation to areas of sub-quaternary catchments in 49
the gas pipeline inland corridor 83 50
Figure 40: Threat and sensitivity status calculated for different freshwater taxonomic groups (flora and fauna) in 51 the gas pipeline inland corridor in relation to sub-quaternary catchments 84 52

ST RAT EGIC ENVIRONMENT AL ASSESS MENT F OR GA S P I PE L INE DEVELOP MENT IN SOU T H AFRICA
WET LANDS AND R IVER S S PECIAL IST REPORT
Page 6
Figure 41: Integrated sensitivity and threat status map for freshwater ecosystems and biota in the gas pipeline 1 inland corridor. 85 2
3

ST RAT EGIC ENVIRONMENT AL ASSESS MENT F OR GA S P I PE L INE DEVELOP MENT IN SOU T H AFRICA
WET LANDS AND R IVER S S PECIAL IST REPORT
Page 7
ABBREVIATIONS AND ACRONYMS 1
2
ADU Animal Demographic Unit
AOO Area of Occupancy
ASPT Average Score Per Taxon
BSP Biodiversity Sector Plan
CBA Critical Biodiversity Area
C-Plan Conservation Plan
CR Critically Endangered
CSIR Council for Scientific and Industrial Research
DEA Department of Environmental Affairs
DWS Department of Water and Sanitation
EA Environmental Authorisation
ECO Environmental Control Officer
EI Ecological Importance
EMPr Environmental Management Programme
EN Endangered
EOO Extent of Occurrence
ES Ecological Sensitivity
GBIF Global Biodiversity Information Facility
GIS Geographic Information System
GP Gas Pipeline
HGM Hydrogeomorphic
IAP Invasive Alien Plant
IHI Index of Habitat Integrity
IRP Integrated Resource Plan
IUCN International Union for Conservation of Nature
LC Least Concern
m.a.s.l Metres above sea level
NBA National Biodiversity Assessment (2011)
NDP National Development Plan
NFEPA National Freshwater Ecosystem Priority Areas
PA Protected Area - statutory
PES Present Ecological State
QV Quality Value
ROW Right of way
SA South Africa
SAIAB South African Institute for Aquatic Biodiversity
SANBI South African National Biodiversity Institute
SASS South African Scoring System
SEA Strategic Environmental Assessment
Spp Species
SQ4 Sub-quaternary catchment
ToPs Threatened or Protected species
TSP Threatened Species Programme
VU Vulnerable
WULA Water Use License Application
3
4

ST RAT EGIC ENVIRONMENT AL ASSESS MENT F OR GA S P I PE L INE DEVELOP MENT IN SOU T H AFRICA
WET LANDS AND R IVER S S PECIAL IST REPORT
Page 8
1 SUMMARY 1
In order to realise the potential of gas reserves in South Africa, and to contribute to the transition to a low 2
carbon economy, the Operation Phakisa Offshore Oil and Gas Lab has set a target of achieving 30 3
exploration wells in the next ten years (from 2014). This sparked plans to accelerate gas to power 4
development as recognised by the Government’s Integrated Resource Plan (IRP), which included pre-5
planning for State Owned Entities to develop gas transmission servitudes across South Africa. As a result, 6
initiatives were identified – development of a phased gas pipeline network being one of the identified 7
initiatives. However, in order for gas pipeline development to go-ahead, Environmental Authorisation (EA) in 8
terms of the Environmental Impact Assessment Regulations, 2014 (as amended in 2017) would be 9
required. Strategic planning for gas servitudes also needs to be undertaken well in advance of final 10
planning as a means to uphold Operation Phakisa, while preventing unnecessary delays through the EA 11
process. The Council for Scientific and Industrial Research (CSIR) was commission by the National 12
Department of Environmental Affairs (DEA) to undertake a Strategic Environmental Assessment (SEA) in 13
order to identify and pre-assess environmental sensitivities within the identified gas pipeline corridors. 14
GroundTruth was appointed by the CSIR to assess the corridors specifically in terms of freshwater 15
ecosystems (i.e. wetland and river ecosystems) and fauna and flora associated with these systems. 16
17
The scope for the freshwater ecosystem/biodiversity study was provided by the CSIR to ensure that the 18
approach and methodology followed was scientifically defendable and adequately defined within the 19
context of the SEA. In particular, the approach was intended to be spatially explicit, drawing from available 20
data depicting the distribution and extent, as well as importance and sensitivity of freshwater ecosystems 21
and selected fauna and flora that inhabit these systems. 22
23
The study was based on a combination of desktop assessments building on strengths of mapping and 24
geospatial analyses using geographical information systems (GIS), with input from meetings and 25
discussions with relevant authorities and experts. This ensured a thorough interpretation of existing data 26
incorporating defensible and rigorous methodologies. Data was sourced from various custodians, which 27
was largely facilitated through the South African National Biodiversity Institute (SANBI) and their online data 28
portal, BGIS (Biodiversity GIS). The data covered a range of spatial scales, from local (i.e. municipalities) to 29
regional (i.e. provinces) to national. For wetlands, the spatial data was obtained as polygon features, while 30
rivers were defined as lines and fauna/flora as points. Fauna and flora selected for the freshwater study 31
included conservation important species (based on the latest available conservation assessments) that are 32
dependent of wetland and river systems that include surrounding fringe habitats. In terms of fauna, the 33
data collation and analysis focused on certain taxonomic groups, namely: aquatic macro-invertebrate (at 34
the family level), dragonflies and damselflies (Family: Odonata), freshwater fish (Class: Actinopterygii), 35
amphibians (Order: Anura), reptiles (Order: Reptilia) and mammals (Order: Mammalia). All data of 36
freshwater ecosystem and selected key species was reviewed and refined to allow for integration to an 37
appropriate scale/resolution. The sub-quaternary (SQ4) catchments for South Africa were used as the most 38
appropriate scale for the spatial analyses and assessments of freshwater ecosystems within the SEA 39
corridors. All spatial/GIS data was assessed firstly in terms of applicability/suitability, then merged/joined 40
with other layers, then clipped according to the relevant gas pipeline corridors in order to assess the 41
sensitivity-level of the corridors. Metrices were also used to calculate sensitivity using a four-tiered 42
categorisation (i.e. low, medium, high and very high) as requested by the CSIR. A more detailed description 43
of the data used and methods followed is presented in Section 4 of the freshwater specialist report, along 44
with the relevant legislation/regulatory requirements and applicable assumptions and limitations for the 45
study. 46
47
The results from the freshwater study are presented as a series of maps illustrating freshwater features 48
and their current sensitivity (as per the four-tiered sensitivity classes) for each of the nine gas pipeline 49
corridors as provided by the CSIR. Maps are arranged according to the respective corridors in Section 6 to 50
provide an overview of river, wetland and freshwater biota sensitivity. In addition, a brief summary of the 51
present state of freshwater ecosystems/biodiversity within each corridor is also provided in Section 5, 52
which describes some of the key sensitivities, as well as drivers and pressures affecting freshwater 53

ST RAT EGIC ENVIRONMENT AL ASSESS MENT F OR GA S P I PE L INE DEVELOP MENT IN SOU T H AFRICA
WET LANDS AND R IVER S S PECIAL IST REPORT
Page 9
ecosystems and biodiversity. Corridors found to be most sensitive (with high to very high sensitivity) are as 1
follows: 2
3
In terms of river ecosystems the Phase 3 Corridor is most sensitive, followed by Phase 8, then 4
Phase 2. 5
In terms of wetland ecosystems the Phase 2 Corridor is most sensitive, followed by Phase 1, then 6
Phase 8. 7
In terms of freshwater biota (i.e. fauna and flora) the Phase 1 Corridor is most sensitive, followed 8
by Phase 8, then Phase 2. 9
In terms of overall sensitivity (i.e. combined river, wetland and biota) the Phase 1 Corridor is most 10
sensitive, followed closely by Phase 2 and Phase 8. 11
12
The primary purpose of the maps and spatial products are to assist the CSIR in integrating a number of key 13
strategic issues such as (but not limited to) terrestrial biodiversity and socio-economics into the overall SEA, 14
as well as to identify problem areas (or nick points) where special precautions and measures may be 15
required to limit impacts from gas pipeline development. In terms of the freshwater study the spatial 16
deliverables can assist planning and development of gas pipelines through a two-step process: firstly, to 17
use the SQ4 catchments maps to identify areas where pipeline construction and operation will have the 18
lowest impact on freshwater ecosystems, and secondly, to use the actual feature data to plan pipeline 19
routing within the SQ4 catchments of each corridor. 20
21
Impacts that will potentially affect river and wetland ecosystems and associated fauna and flora have been 22
identified to provide a generic evaluation of pipeline activities for various stages of development, from 23
planning to construction to operation. Each activity is discussed in terms of the cause and effects that 24
these will have on freshwater ecosystems. Appropriate, and again generic, mitigation measures are also 25
provided as recommendations for preventing and/or minimising impacts to freshwater 26
ecosystems/biodiversity. Part of the evaluation includes a risk assessment to rate the identified impacts 27
with respect to the four-tiered sensitivity classes. The risk assessment also includes an evaluation of 28
impacts both with and without mitigation. However, it is acknowledged that additional steps will be 29
required once pipeline routes and alternatives have been established (i.e. desktop screening, ground-30
truthing and infield delineation and assessments). 31
32
In addition to the recommended mitigation measures, “best practice” (or “good practice”) guidelines and 33
management actions are provided, and include practical, target-directed recommendations for monitoring 34
of aspects, along with considerations on how to interpret and implement the four-tiered maps. Lastly, 35
several gaps in knowledge are mentioned in terms of influencing this freshwater study and assessment. 36
37
38
2 INTRODUCTION 39
In 2012, the National Development Plan (NDP) was adopted to accelerate infrastructure development in 40
order to address service delivery, backlogs and facilitate economic growth and job creation. This led to the 41
launch of Operation Phakisa in July 2014 to fast-track service delivery, and to help implement the NDP. 42
43
The oil and gas sector within South Africa is in an early development phase, but nevertheless has the 44
potential to create large value for the country in the long-term. Added to this are potential resources of oil 45
and gas. In order to realise the potential of the gas reserves in the country, and to contribute to the 46
transition to a low carbon economy, the Operation Phakisa Offshore Oil and Gas Lab has set a target of 47
achieving 30 exploration wells in the next ten years (from 2014). In addition, the need to accelerate the 48
planning for gas to power as part of the Government’s Integrated Resource Plan (IRP) and for State Owned 49
Entities to pre-plan for the logical development of gas transmission servitudes within South Africa was 50
recognised. Based on these needs, initiatives were identified with the development of a phased gas 51
pipeline network being one of them. 52
53
ST RAT EGIC ENVIRONMENT AL ASSESS MENT F OR GA S P I PE L INE DEVELOP MENT IN SOU T H AFRICA
WET LANDS AND R IVER S S PECIAL IST REPORT
Page 10
The development and operation of infrastructure for the bulk transportation of dangerous goods (including 1
gas using a pipeline exceeding 1000 m in length) is identified as activity 7 of Listing Notice 2 of 2014 as 2
amended (GN R325, 2017) and therefore requires Environmental Authorisation (EA) in terms of the 3
Environmental Impact Assessment Regulations, 2014 (as amended in 2017). Strategic planning for 4
servitudes also needs to be undertaken well in advance of the final planning of a gas transmission pipeline 5
system. To ensure that when required, obtaining an EA is not a cause for delay and to support the 6
Operation Phakisa, the National Department of Environmental Affairs (DEA) in partnership with the National 7
Department of Energy (DoE) and the National Department of Public Enterprises (DPE), representing iGas, 8
Eskom and Transnet, has commissioned the Council for Scientific and Industrial Research (CSIR) in April 9
2017 to undertake a Strategic Environmental Assessment (SEA). The aim of this SEA is to identify and pre-10
assess environmental sensitivities within suitable gas routing corridors and, where required, expand the 11
identified electricity power corridors (DEA, 2016: https://egi.csir.co.za), to facilitate a streamlined EA 12
process for the development of energy infrastructure related to gas and electricity. 13
14
Upon gazetting of the energy corridors, it is envisaged that the EA process for gas pipeline and transmission 15
infrastructure will be streamlined in specific areas identified through the SEA process as being less 16
sensitive to the negative impacts associated with the development of these infrastructure. This should 17
incentivise potential developers to plan and develop in the least sensitive areas. The SEA process also 18
provides a platform for coordination between the various authorities responsible for issuing authorisations, 19
permits or consents and thereby will further contribute to a more streamlined EA process. The preliminary 20
corridors were identified as part of the Operation Phakisa and will link specific supply and demand areas. 21
This study is therefore intended to inform the SEA, specifically in terms of freshwater ecosystems and biota 22
(fauna and flora) in relation to the preliminary corridors. This specialist report focuses on the impact of the 23
proposed gas pipeline development on freshwater ecosystems. 24
25
Freshwater ecosystems, i.e. wetlands and rivers, are valuable ecosystems and it is well documented that 26
they provide numerous ecological and hydrological functions (Cowan, 1995; Breen et al., 1997; Mitchell, 27
2002). These functions include improving water quality (reductions in suspended sediments, excess plant 28
nutrients and other pollutants), streamflow regulation (flood attenuation, water storage and sustaining 29
streamflow), groundwater recharge, erosion control, and the maintenance of biodiversity for wetland-30
dependant fauna and flora (Kotze and Breen, 1994). Consequently, wetlands and rivers provide many 31
important services to human society. At the same time, through continued negative perceptions by 32
humanity, they remain ecologically sensitive and vulnerable systems (Turner et al., 2003). Historically, 33
freshwater ecosystems have been subjected to numerous pressures from surrounding developments and 34
changing land use, to the extent that many wetlands and rivers have been severely degraded or completely 35
lost (Kotze et al., 1995). This has largely been as a result of human activities, either through direct 36
disturbance, or indirectly from impacts upstream (Breen et al., 1997). More than two decades ago, it was 37
estimated that over half of South Africa’s wetlands had been lost (Kotze et al., 1995). The current situation 38
is no doubt even greater, and of the remaining systems, 48% are classified as Critically Endangered (Nel 39
and Driver, 2012). Thus, freshwater ecosystems need to be safeguarded as much as possible from on-40
going and future development in order to maintain, or even improve the status of existing wetland and river 41
habitats. 42

ST RAT EGIC ENVIRONMENT AL ASSESS MENT F OR GA S P I PE L INE DEVELOP MENT IN SOU T H AFRICA
WET LANDS AND R IVER S S PECIAL IST REPORT
Page 11
3 SCOPE OF THIS STRATEGIC ISSUE 1
The primary objective of this study is to provide an assessment of freshwater ecosystems (i.e. rivers and 2
wetlands) and associated biodiversity within pre-identified corridors (Figure 1). The assessments will inform 3
the SEA through identification of constraints (e.g. sensitive rivers and wetland ecosystems, critical areas for 4
aquatic fauna and flora, etc.) and opportunities for the development of gas pipelines. 5
6
This assessment is focused primarily on the interpretation of existing data, and is based on defensible and, 7
if available, standardised and recognised methodologies. The focus is primarily to review the environmental 8
wall-to-wall mapping outputs produced by the CSIR and SANBI (specifically relating to the gas pipeline 9
corridors), and to discuss the direct, indirect and cumulative impacts. Any gaps in information linked to 10
aquatic biodiversity associated with rivers and wetlands with respect to the gas pipeline corridors were 11
identified as potential shortcomings needing to be addressed through further screening and ground-12
truthing assessments. 13
14
15 Figure 1: Overview of the proposed gas pipeline corridors 16
17
The study methodology developed as part of this project is intended to inform future SEAs in terms of 18
specialist assessment methodologies. The study also incorporates a review of available data and 19
information (e.g. the CSIR environmental wall-to-wall mapping, SANBI datasets, etc.), and builds on 20
discussions with the relevant organisations related to aquatic ecosystems and biodiversity (e.g. SANBI, 21
National Department of Water and Sanitation (DWS), etc.). This is to ensure that the outcomes of the study 22
are accepted by these agencies, and will be taken into consideration for future authorisation and 23
commenting within the areas assessed. 24
25
26

ST RAT EGIC ENVIRONMENT AL ASSESS MENT F OR GA S P I PE L INE DEVELOP MENT IN SOU T H AFRICA
WET LANDS AND R IVER S S PECIAL IST REPORT
Page 12
The assessment of freshwater ecosystems and biodiversity includes the following: 1
Review of existing literature (including the latest research undertaken both locally, nationally and 2
internationally), mapping/aerial photographs, and habitat and species data to compile a baseline 3
description applicable to each corridor; 4
Identification of any additional features of interest (large waterfalls, spray zones etc.) or any gaps 5
in information within the corridors not identified in the existing sensitivity analysis, making use of 6
datasets made available through the draft environmental constraints map and additional 7
information sourced by the specialist; 8
High level distribution mapping for sensitive aquatic species occurring within South Africa; 9
Review and update, where required, the environmental sensitivity/attribute map for the proposed 10
gas pipeline corridors provided by the CSIR and SANBI and develop/verify the approach for 11
classing each sensitivity feature according to a four-tiered sensitivity rating system (i.e. very high, 12
high, medium or low); 13
Assess the proposed corridors in terms of the potential impacts associated with the construction 14
and operation of gas pipelines, taking cognisance of the relative sensitivity of areas, and outline 15
proposed management actions to enhance benefits and avoid/reduce/offset negative impacts – 16
this was done as per the impact assessment methodology provided by the CSIR Project Team; 17
Based on the findings of the assessment, provide the relevant information and produce an 18
updated four-tiered sensitivity map related to the field of expertise and the relevant corridors. 19
Provide input to the pre-construction site specific environmental assessment protocol (e.g. 20
additional information and level of assessment required in each sensitivity category before an 21
authorisation with respect to aquatic biodiversity impacts), checklist, norms or 22
standards/Minimum Information Requirements, and Environmental Management Programme 23
(EMPr) for the development of the gas pipelines. 24
25
Further to the above scope of work, the following information and data was considered as a minimum as 26
part of the study, with more recent data consulted as appropriate: 27
The latest Systematic Biodiversity Plans relevant to the study area, including input layers where 28
applicable, as well as relevant land-use and impact assessment guidelines associated with these 29
plans, e.g. the National Freshwater Ecosystem Priority Areas (NFEPA) technical report (Nel et al. 30
2011), and its associated implementation manual (Driver et al., 2011). 31
The 2011 National Biodiversity Assessment (NBA), including its spatial layers (specifically layers 32
that were not used for the environmental constraints map), but that are relevant at a finer scale 33
(Nel and Driver, 2012). 34
The latest species information available for the study area in particular, but not limited to, sensitive 35
species that are dependent on these riparian zones, including specific Red Listed plants 36
(Raimondo et al., 2009), butterflies, (Mecenero et al., 2013), reptiles (Bates et al., 2014). 37
Fine-scale spatial biodiversity information, e.g. additional wetland or species information that may 38
not have been included in a systematic biodiversity plan. 39
40
It is important to note that the outputs from this study will form the basis of a planning and decision-41
support document for gas pipeline development in the respective corridors. The aim of the planning 42
document will be to inform and focus further aquatic project-level assessments (as they relate to rivers and 43
wetlands) with respect to gas pipeline development in the respective corridors (i.e. serve as a scoping 44
exercise). 45
46
The key deliverables and reporting requirements of this project include: 47
Specialist Assessment Report based on a specialist report template provided by the CSIR for the 48
SEA, for review and comment, but covering the following: 49
○ Summary of key points, including degree-of-certainty terms; 50
○ Introduction – brief discussion of the essential background on the Strategic Issue; 51
○ Definition of issue scope and key terms; 52
○ Key attributes and sensitivities of the study areas towards the development of a gas 53
pipeline within the Gas corridors - baseline description of each proposed corridor (study 54

ST RAT EGIC ENVIRONMENT AL ASSESS MENT F OR GA S P I PE L INE DEVELOP MENT IN SOU T H AFRICA
WET LANDS AND R IVER S S PECIAL IST REPORT
Page 13
area) relating to the issue topic and spatial sensitivity analysis (for spatially explicit topics), 1
inclusive of a literature review in line with the strategic issue; 2
○ Description of methodology and approach to the study; 3
○ Description of the key potential impacts (positive and negative, including direct, indirect 4
and cumulative) that are associated with gas pipeline development activities relating to 5
the issue topic (inferred and distilled from the Project Description document provided to 6
Authors), and their spatial and temporal distributions, including required mitigation 7
measures; 8
○ The sensitivity delineation should be undertaken in the context of the development of a 9
gas pipelines; 10
○ The results of a structured risk and opportunity assessment which evaluates the impacts, 11
with and without mitigation, for each study area, and clearly defines consequence terms; 12
○ Updated four-tiers sensitivity map; 13
○ Outline proposed mitigation measures and management actions to enhance benefits and 14
avoid/reduce/offset negative impacts for construction and operation phase. This will form 15
part of the EMPr; 16
○ Best practice and management guidelines for gas pipeline development (including inputs 17
in the norms or standards/Minimum Information Requirements, and the Site Specific 18
Environmental Assessment Protocols and Checklist), monitoring requirements and 19
recommendations for future site-specific assessment in relation to the Strategic Issue; 20
○ Gaps in knowledge; and 21
○ References. 22
Geographic Information System (GIS) Assessment Dataset and additional information sourced by 23
the specialist; 24
Metadata for the Assessment Dataset (DEA metadata template, must be used - template will be 25
provided upon appointment); 26
GIS based four-tiered consolidated sensitivity map of all sensitivity features identified through the 27
assessment showing the location and spatial extent for each sensitivity feature and associated 28
buffering. The sensitivity rating should be illustrated according to the following coloration scheme: 29
Dark Red/Very High, Red/High, Orange/Medium, Green/Low; and 30
A guideline on the interpretation and implementation of the four tier maps as well as permit 31
requirements (where applicable) for each corridor. This section should also make 32
recommendations on requirements for additional terrestrial and aquatic biodiversity specialist 33
studies (if any) within the different tiers of sensitivity specialist before an authorisation can be 34
considered. Recommendations should be focused around the objective of streamlining without 35
compromising environmental protection. This information will be incorporated into the Decision-36
Making Tools that will ultimately govern development in the corridors. 37
38
39
4 APPROACH AND METHODOLOGY 40
4.1 Study Methodology 41
The study was based on a combination of desktop assessments building on strengths of GIS mapping and 42
geospatial analyses, and builds on meetings and discussions with relevant authorities and experts. This 43
ensured a thorough interpretation of existing data incorporating defensible and rigorous methodologies. 44
The following steps outlined below were followed. 45
46
4.1.1 Briefing session 47
A representative from the GroundTruth team attended a one-day briefing session at the CSIR in 48
Stellenbosch to meet the Integrating Authors and Contributing Authors to discuss and define the 49
assessment phase of the project. The briefing session served to refine/agree on the scope of work, 50
deliverables and timing, as well as to make sure all available data and information from the CSIR could be 51
obtained upfront and as timeously as possible. 52

ST RAT EGIC ENVIRONMENT AL ASSESS MENT F OR GA S P I PE L INE DEVELOP MENT IN SOU T H AFRICA
WET LANDS AND R IVER S S PECIAL IST REPORT
Page 14
4.1.2 Literature review and data collation 1
The accuracy of information generated for the SEA is only as good as the information on which they are 2
derived. Thus, as far as possible, the quality and validity of data obtained for the assessment of aquatic 3
biota and ecosystems has been reviewed and refined to allow for integration to an appropriate 4
scale/resolution. This process included the collation of datasets from a variety of sources, which were 5
subsequently reviewed and assessed for suitability/relevance for the spatial assessments associated with 6
freshwater rivers and wetlands. The datasets used in this component of the SEA, and sources where the 7
data was obtained are indicated in Section 4.2. 8
9
4.1.3 Assigning a suitable spatial scale for analysis 10
All spatial data obtained for the freshwater ecosystem component were considered in terms of a suitable 11
spatial unit/scale of measurement deemed practical for the purpose of assessing the gas pipeline 12
corridors, as well as the alignment of associated infrastructure within the corridors. The sub-quaternary 13
(SQ4) catchments for South Africa was decided as the most appropriate scale for the spatial analyses and 14
assessment of freshwater ecosystems within the SEA corridors. This allowed for the scaling up of data to 15
assess the corridors relative to each other. 16
17
4.1.4 Analysis and integration of GIS data 18
All spatial/GIS data obtained for the freshwater component were assessed firstly in terms of 19
applicability/suitability, then merged/joined with other layers, then clipped according to the relevant gas 20
pipeline corridors as provided by the CSIR in order to assess the sensitivity-level of the corridors. All spatial 21
analyses were undertaken using ArcGIS 10 software (version 10.4.1). 22
23
4.1.5 Application of metrics for sensitivity analyses 24
4.1.5.1 River threat status and sensitivity: 25
Threat status has been applied to river ecosystems as per thresholds defined in the Freshwater Component 26
of the 2011 South African NBA (Nel and Driver, 2012), but using updated Present Ecological State (PES) 27
information. The 2011 NBA used PES data from 2000 (Kleynhans, 2000) whereas the report here draws on 28
the more recent PES, Ecological Importance (EI) and Ecological Sensitivity (ES) data from the DWS (2014). 29
30
In addition to the threat status calculation, a metric was developed to integrate EI and ES component 31
scores from the 2014 DWS study, the derived threat status (as above), as well as stream order. EI and ES 32
scores represent ecological importance and sensitivity scores for freshwater ecosystems as separate, yet 33
complimentary, components of PES. They are not currently accounted for in the threat status calculation, 34
which uses river length and overall PES category/river health condition, but nevertheless provide valuable 35
information regarding ecological sustainability. EI refers to biophysical aspects in the reach that relates to 36
its capacity to function sustainably, whereas ES considers reach attributes that relate to the sensitivity of 37
biophysical components to general environmental changes such as flow, physico-chemical and geomorphic 38
modifications. EI and ES categories were ranked as scores from one to four (i.e. very low and Low = 1, 39
moderate = 2, high = 3, and very high = 4), along with threat status (i.e. Critically Endangered or CR = 4, 40
Endangered or EN = 3, Vulnerable or VU = 2, Least Concern or LC = 1). These scores were then considered 41
in relation to stream order as per the following equation, such that the higher the score, the higher the 42
overall sensitivity of the river ecosystem: 43
44
River Sensitivity = Threat Score + (EI Score + ES Score / Stream Order) 45
46
In basic terms, the higher the score the more sensitive the freshwater system. In addition, the metric 47
favours higher order streams in the catchment which feed downstream systems. 48
49
ST RAT EGIC ENVIRONMENT AL ASSESS MENT F OR GA S P I PE L INE DEVELOP MENT IN SOU T H AFRICA
WET LANDS AND R IVER S S PECIAL IST REPORT
Page 15
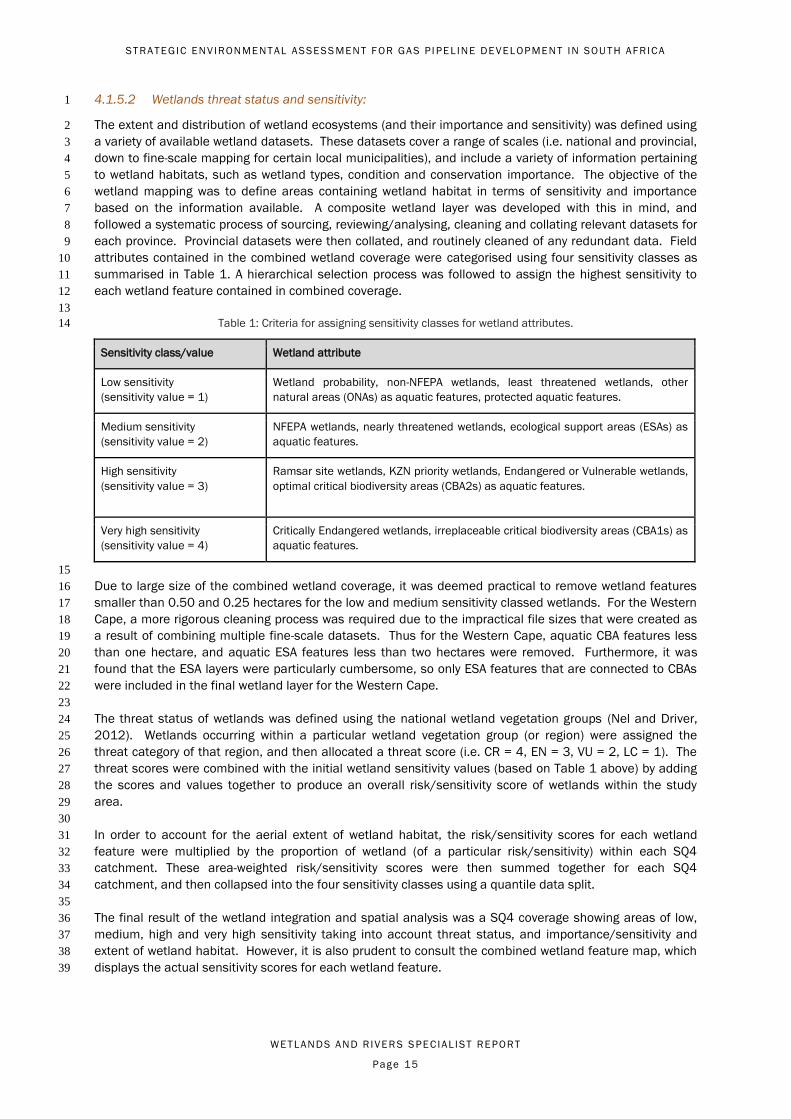
4.1.5.2 Wetlands threat status and sensitivity: 1
The extent and distribution of wetland ecosystems (and their importance and sensitivity) was defined using 2
a variety of available wetland datasets. These datasets cover a range of scales (i.e. national and provincial, 3
down to fine-scale mapping for certain local municipalities), and include a variety of information pertaining 4
to wetland habitats, such as wetland types, condition and conservation importance. The objective of the 5
wetland mapping was to define areas containing wetland habitat in terms of sensitivity and importance 6
based on the information available. A composite wetland layer was developed with this in mind, and 7
followed a systematic process of sourcing, reviewing/analysing, cleaning and collating relevant datasets for 8
each province. Provincial datasets were then collated, and routinely cleaned of any redundant data. Field 9
attributes contained in the combined wetland coverage were categorised using four sensitivity classes as 10
summarised in Table 1. A hierarchical selection process was followed to assign the highest sensitivity to 11
each wetland feature contained in combined coverage. 12
13
Table 1: Criteria for assigning sensitivity classes for wetland attributes. 14
Sensitivity class/value Wetland attribute
Low sensitivity
(sensitivity value = 1)
Wetland probability, non-NFEPA wetlands, least threatened wetlands, other
natural areas (ONAs) as aquatic features, protected aquatic features.
Medium sensitivity
(sensitivity value = 2)
NFEPA wetlands, nearly threatened wetlands, ecological support areas (ESAs) as
aquatic features.
High sensitivity
(sensitivity value = 3)
Ramsar site wetlands, KZN priority wetlands, Endangered or Vulnerable wetlands,
optimal critical biodiversity areas (CBA2s) as aquatic features.
Very high sensitivity
(sensitivity value = 4)
Critically Endangered wetlands, irreplaceable critical biodiversity areas (CBA1s) as
aquatic features.
15
Due to large size of the combined wetland coverage, it was deemed practical to remove wetland features 16
smaller than 0.50 and 0.25 hectares for the low and medium sensitivity classed wetlands. For the Western 17
Cape, a more rigorous cleaning process was required due to the impractical file sizes that were created as 18
a result of combining multiple fine-scale datasets. Thus for the Western Cape, aquatic CBA features less 19
than one hectare, and aquatic ESA features less than two hectares were removed. Furthermore, it was 20
found that the ESA layers were particularly cumbersome, so only ESA features that are connected to CBAs 21
were included in the final wetland layer for the Western Cape. 22
23
The threat status of wetlands was defined using the national wetland vegetation groups (Nel and Driver, 24
2012). Wetlands occurring within a particular wetland vegetation group (or region) were assigned the 25
threat category of that region, and then allocated a threat score (i.e. CR = 4, EN = 3, VU = 2, LC = 1). The 26
threat scores were combined with the initial wetland sensitivity values (based on Table 1 above) by adding 27
the scores and values together to produce an overall risk/sensitivity score of wetlands within the study 28
area. 29
30
In order to account for the aerial extent of wetland habitat, the risk/sensitivity scores for each wetland 31
feature were multiplied by the proportion of wetland (of a particular risk/sensitivity) within each SQ4 32
catchment. These area-weighted risk/sensitivity scores were then summed together for each SQ4 33
catchment, and then collapsed into the four sensitivity classes using a quantile data split. 34
35
The final result of the wetland integration and spatial analysis was a SQ4 coverage showing areas of low, 36
medium, high and very high sensitivity taking into account threat status, and importance/sensitivity and 37
extent of wetland habitat. However, it is also prudent to consult the combined wetland feature map, which 38
displays the actual sensitivity scores for each wetland feature. 39
ST RAT EGIC ENVIRONMENT AL ASSESS MENT F OR GA S P I PE L INE DEVELOP MENT IN SOU T H AFRICA
WET LANDS AND R IVER S S PECIAL IST REPORT
Page 16
4.1.5.3 Freshwater biota (species and families): 1
Information of freshwater biota was used as an additional level of detail in order to assess the 2
sensitivity/importance of SQ4 catchments within the gas pipeline corridors. To achieve this, taxonomic 3
groups that are representative of freshwater ecosystems were considered, especially where data of known 4
localities was found to be sufficiently detailed and accessible. These groups include: freshwater plants, 5
aquatic macro-invertebrates, dragonflies/damselflies (i.e. Family: Odonata), freshwater fish, amphibians, 6
obligate reptiles and obligate mammals. Information of the conservation status/importance of species 7
from these taxonomic groups was considered particularly important in terms of being able to establish the 8
sensitivity of areas. To achieve this, data of Red Listed species was sourced to obtain the latest available 9
assessments (global and national) of species done according to the International Union for Conservation of 10
Nature (IUCN) criteria and Red Listing requirements (IUCN, 2012). Species selected primarily for this study 11
included freshwater species of conservation importance, i.e. species listed as Threatened (i.e. Critically 12
Endangered, Endangered and Vulnerable), Near Threatened and Data Deficient. 13
14
4.1.5.4 Freshwater plants (Kingdom: Plantae): 15
The conservation status of a large number of plants occurring within South Africa has been assessed by 16
Raimondo et al. (2009). As with the other taxa, freshwater plants listed as Threatened, Near Threatened 17
and Data Deficient were selected for this study, which includes 141 species of plants (Appendix 1) that 18
inhabit a range of freshwater habitats, broadly including wetlands, rivers and riparian areas. Point localities 19
(approximately 4 129 records) for the selected plant species were obtained from the SANBI Threatened 20
Species Programme (TSP) database (SANBI, 2018). As with the other taxonomic groups, these point 21
records were assigned to SQ4 catchments to derive a presence/absence coverage, which were then 22
classified into the four sensitivity classes (i.e. low, medium, high, very high). 23
24
Aquatic macro-invertebrates (Class: Insecta): 25
Species-level data for invertebrates is generally limited or biased toward certain groups (e.g. butterflies and 26
dragonflies/damselflies), however, family-level data is more obtainable. Furthermore, families of most 27
macro-invertebrates (94 families) have variable tolerances to water quality and quantity impacts with 28
specific Quality Values (QV - an indication of their sensitivity to land use and water quality/quantity impacts 29
ranging from 1 to 15) - this is the basis of river health biomonitoring. 30
31
Point localities for the 94 macro-invertebrate families recorded from a total of 4 350 river sites in South 32
Africa, of which 3 202 (or 73%) are located within the gas pipeline corridors, were assigned to a 1:10 000 33
grid vector. For each grid cell the total diversity was calculated from which two separate but 34
complementary indices were then derived, namely: 35
36
South African Scoring System (SASS) Score - sum of all families multiplied by their respective QV as 37
occurring within a particular grid cell; and 38
Average Score Per Taxon (ASPT) - the SASS Score divided by the total number of recorded families 39
for a particular grid cell. 40
41
SASS Scores and ASPT values were then assigned to a river ecoregion (Level 2) by selecting grid cells 42
where more than half of the grid cell falls within a particular ecoregion. Average SASS Scores and ASPT 43
values was calculated for each river ecoregion using all grid cell data within each ecoregion. Average ASPT 44
values were then classified into four sensitivity classes (i.e. low, medium, high, very high) using a Quantile 45
split in the dataset using ArcGIS 10 software (version 10.4.1). 46
47
Dragonflies and Damselflies (Family: Odonata): 48
All species of Odonata (i.e. dragonflies and damselflies) have been assessed in terms of their conservation 49
status/importance within South Africa (IUCN, 2017; Samways and Simaika, 2016). Species listed as 50
Threatened, Near Threatened and Data Deficient, were selected for this study, which includes 27 listed 51
species (Appendix 2). Point localities (approximately 712 records) where these conservation important 52
dragonflies and damselflies have been recorded were obtained from the SANBI (TSP) database (SANBI, 53

ST RAT EGIC ENVIRONMENT AL ASSESS MENT F OR GA S P I PE L INE DEVELOP MENT IN SOU T H AFRICA
WET LANDS AND R IVER S S PECIAL IST REPORT
Page 17
2018). Point records were assigned to SQ4 catchments to derive a presence/absence coverage of each 1
species per catchment. The SQ4 catchments were then classified into four sensitivity classes (i.e. low, 2
medium, high, very high) based on the presence/absence of conservation important dragonflies and 3
damselflies where catchments supporting Critically Endangered species have a “very high” sensitivity, 4
Endangered and Vulnerable species have a “high” sensitivity, Near Threatened and Data Deficient species 5
have a “medium” sensitivity, and all remaining catchments not known to support conservation important 6
species have a “low” sensitivity. 7
8
Freshwater Fish (Class: Actinopterygii): 9
Most of the freshwater fish that occur within South Africa have been recently assessed and are now Red 10
Listed, with only a few species still requiring assessments (Coetzer, 2017). Forty nine species of 11
conservation importance were selected for this study (Appendix 2). Point localities (approximately 1 194 12
records) for 28 of these selected species were obtained from the Global Biodiversity Information Facility 13
(GBIF) database via the South African Institute for Aquatic Biodiversity (SAIAB). These point records were 14
assigned to SQ4 catchments to derive a coverage of presence or absence of each species per catchment 15
based on known point locations. Distribution data for the other 21 selected fish species was spatially 16
defined by selecting SQ4 catchments where each species occurs as inferred from the IUCN Red List of 17
Threatened Species Map Viewer (IUCN, 2017). As with dragonflies and damselflies, all SQ4 catchments 18
were then classified into four sensitivity classes (i.e. low, medium, high, very high) based on the 19
presence/absence of conservation important freshwater fish. 20
21
Amphibians (Order: Anura): 22
The conservation status of most amphibians occurring within South Africa has been assessed by Minter et 23
al. (2004). As with the other freshwater taxa, amphibians listed as Threatened, Near Threatened and Data 24
Deficient selected for this study includes 29 listed species (Appendix 2). Point localities (approximately 25
11 444 records) for these selected species were obtained from the SANBI (TSP) database (SANBI, 2018). 26
These point records were assigned to SQ4 catchments to derive a coverage of presence or absence of each 27
species per catchment based on the known point locations. The SQ4 catchments were then classified into 28
four sensitivity classes (i.e. low, medium, high, very high) based on the presence/absence as done for the 29
other freshwater taxonomic groups. 30
31
Reptiles (Order: Reptilia): 32
The conservation status of most reptiles (i.e. terrapins, geckos, lizards, chameleons, and snakes) that occur 33
within South Africa have been assessed by Bates et al. (2014). Reptiles listed as Threatened, Near 34
Threatened and Data Deficient selected for this study includes six listed species (Appendix 2). In addition, 35
only those reptiles that are defined as freshwater ecosystem obligates (i.e. species that is entirely or mostly 36
dependent on aquatic, wetland and riparian habitats to exist) were considered. Point localities 37
(approximately 4 452 records) for these selected species were obtained from the SANBI (TSP) database 38
(SANBI, 2018). These point records were assigned to SQ4 catchments to derive a coverage of presence or 39
absence of each species per catchment based on the known point locations. The SQ4 catchments were 40
then classified into four sensitivity classes (i.e. low, medium, high, very high) based on the 41
presence/absence as done for the other freshwater taxonomic groups. 42
43
Mammals (Order: Mammalia): 44
The conservation status of most mammals that occur within South Africa have been assessed by Child et 45
al. (2016). As with the other taxa, only mammals listed as Threatened, Near Threatened and Data Deficient 46
were selected for this study, which includes 11 listed species (Appendix 2). In addition, only those 47
mammals that are defined as freshwater ecosystem obligates (i.e. species that is entirely or mostly 48
dependent on aquatic, wetland and riparian habitats to exist) were considered. Point localities 49
(approximately 3 072 records) for these selected species were obtained from the SANBI (TSP) database 50
(SANBI, 2018). These point records were assigned to SQ4 catchments to derive a coverage of presence or 51
absence of each species per catchment based on the known point locations. The SQ4 catchments were 52
then classified into four sensitivity classes (i.e. low, medium, high, very high) based on the 53
presence/absence as done for the other freshwater taxonomic groups. 54
55
ST RAT EGIC ENVIRONMENT AL ASSESS MENT F OR GA S P I PE L INE DEVELOP MENT IN SOU T H AFRICA
WET LANDS AND R IVER S S PECIAL IST REPORT
Page 18
4.1.6 Integration of taxonomic groups 1
Sensitivity values of the aforementioned taxonomic groups, ranging from one to four (i.e. low to very high 2
sensitivity), were combined into a single layer in order to calculate overall biotic sensitivity for each SQ4 3
catchment. Linear weightings were applied to each of the groups based on the ability of respective species 4
being able to escape/disperse away from disturbance and impacts to habitats. Plants being sedentary were 5
thus given the highest weighting of seven, followed by amphibians (six), reptiles (five), mammals (four), fish 6
(three), dragonflies and damselflies (two), and macro-invertebrates (one). The weighted sensitivity values 7
were summed together to produce a total score for each SQ4 catchment, which were then collapsed into 8
the four sensitivity classes using a quantile data split. 9
10
4.1.7 Producing integrated four tier sensitivity maps 11
The sensitivity maps produced for rivers, wetlands and combined freshwater biota were also integrated into 12
a single layer by summing the sensitivity values for each component. The total score for each SQ4 13
catchment were collapsed into the four sensitivity classes using a quantile data split. This coverage 14
provides an integration of all data pertaining to freshwater biodiversity and ecosystems, and is particularly 15
useful for identifying preferred alignments for gas pipeline infrastructure in order to reduce impacts on 16
freshwater ecosystems and associated biodiversity. 17

ST RAT EGIC ENVIRONMENT AL ASSESS MENT F OR GA S P I PE L INE DEVELOP MENT IN SOU T H AFRICA
WET LANDS AND R IVER S S PECIAL IST REPORT
Page 19
4.2 Data Sources 1
Table 2: Data used in this assessment. 2
Data title Source and date of publication Data Description
SQ4 sub-quaternary drainage regions (referred
to as SQ4 catchments)
DWS (2009) Catchment areas that define the drainage regions of the NEFPA river reaches, which include 9
433 catchments ranging from 0.25 to 400 000 hectares. The gas pipeline corridors include 4
843 SQ4 catchments ranging from 0.1 to 115 000 hectares. These catchment areas are
used as the primary spatial unit for analysis in the freshwater component.
River Ecoregions (Level 1 and 2) Kleynhans et al. (2005) A delineation of ecoregions for South Africa as derived from terrain, vegetation, altitude,
geomorphology, rainfall, runoff variability, air temperature, geology and soil. There are 31
Level 1 and 219 Level 2 River Ecoregions in South Africa, of which 25 Level 1 and 97 Level 2
River Ecoregions occur within the gas pipeline corridors.
River Present Ecological State (PES), Ecological
Importance (EI) and Ecological Sensitivity (ES)
DWS (2014) A Desktop Assessment of the Present Ecological State, Ecological Importance and Ecological
Sensitivity per Sub Quaternary Reaches for Secondary Catchments in South Africa conducted
in 2013.
NFEPA rivers and wetlands Nel et al. (2011)
The NFEPA coverages provide specific spatial information for rivers according to the DWS
1:500 000 rivers coverage, including river condition, river ecosystem types, fish sanctuaries,
and flagship/free-flowing rivers. The NFEPA coverages also provide specific information for
wetlands such as wetland ecosystem types and condition (note: wetland delineations were
based largely on remotely-sensed imagery and therefore did not include historic wetlands lost
through transformation and land use activities).
Ramsar Sites Ramsar (2018) Distribution and extent of areas that contain wetlands of international importance in South
Africa.
National Wetland Vegetation Groups Nel and Driver (2012)
A vector layer developed during the 2011 NBA to define wetland vegetation groups to classify
wetlands according to Level 2 of the national wetland classification system (SANBI, 2010).
The wetland vegetation groups provide the regional context within which wetlands occur, and
is the latest available classification of threat status of wetlands that are broadly defined by
the associated wetland vegetation group. This is considered more practical level of
classification to the Level 4 wetland types owing to the inherent low confidence in the desktop
classification of hydrogeomorphic units (HGM) that was used at the time of the 2011 NBA.
Provincial Wetland Probability Mapping Collins (2017) Mapping of wetland areas based on a concept of water accumulation in the lowest position of
the landscape, which is likely to support wetlands assuming sufficient availability water to
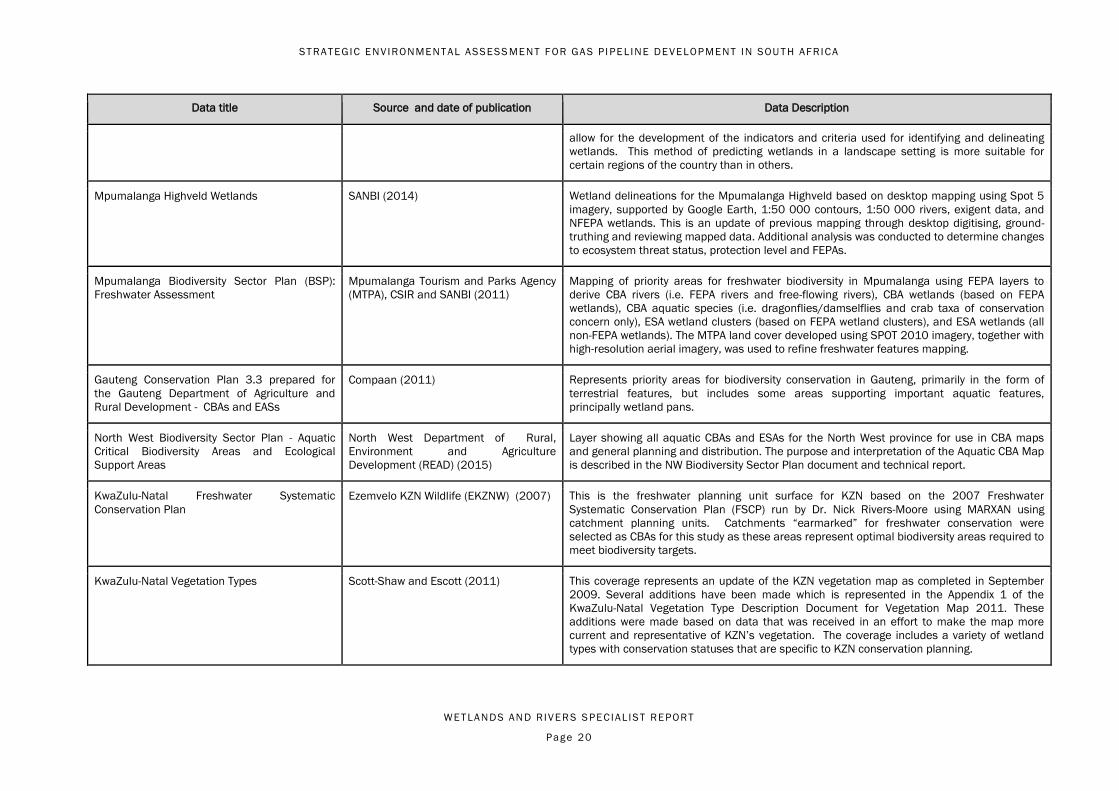
ST RAT EGIC ENVIRONMENT AL ASSESS MENT F OR GA S P I PE L INE DEVELOP MENT IN SOU T H AFRICA
WET LANDS AND R IVER S S PECIAL IST REPORT
Page 20
Data title Source and date of publication Data Description
allow for the development of the indicators and criteria used for identifying and delineating
wetlands. This method of predicting wetlands in a landscape setting is more suitable for
certain regions of the country than in others.
Mpumalanga Highveld Wetlands SANBI (2014) Wetland delineations for the Mpumalanga Highveld based on desktop mapping using Spot 5
imagery, supported by Google Earth, 1:50 000 contours, 1:50 000 rivers, exigent data, and
NFEPA wetlands. This is an update of previous mapping through desktop digitising, ground-
truthing and reviewing mapped data. Additional analysis was conducted to determine changes
to ecosystem threat status, protection level and FEPAs.
Mpumalanga Biodiversity Sector Plan (BSP):
Freshwater Assessment
Mpumalanga Tourism and Parks Agency
(MTPA), CSIR and SANBI (2011)
Mapping of priority areas for freshwater biodiversity in Mpumalanga using FEPA layers to
derive CBA rivers (i.e. FEPA rivers and free-flowing rivers), CBA wetlands (based on FEPA
wetlands), CBA aquatic species (i.e. dragonflies/damselflies and crab taxa of conservation
concern only), ESA wetland clusters (based on FEPA wetland clusters), and ESA wetlands (all
non-FEPA wetlands). The MTPA land cover developed using SPOT 2010 imagery, together with
high-resolution aerial imagery, was used to refine freshwater features mapping.
Gauteng Conservation Plan 3.3 prepared for
the Gauteng Department of Agriculture and
Rural Development - CBAs and EASs
Compaan (2011) Represents priority areas for biodiversity conservation in Gauteng, primarily in the form of
terrestrial features, but includes some areas supporting important aquatic features,
principally wetland pans.
North West Biodiversity Sector Plan - Aquatic
Critical Biodiversity Areas and Ecological
Support Areas
North West Department of Rural,
Environment and Agriculture
Development (READ) (2015)
Layer showing all aquatic CBAs and ESAs for the North West province for use in CBA maps
and general planning and distribution. The purpose and interpretation of the Aquatic CBA Map
is described in the NW Biodiversity Sector Plan document and technical report.
KwaZulu-Natal Freshwater Systematic
Conservation Plan
Ezemvelo KZN Wildlife (EKZNW) (2007) This is the freshwater planning unit surface for KZN based on the 2007 Freshwater
Systematic Conservation Plan (FSCP) run by Dr. Nick Rivers-Moore using MARXAN using
catchment planning units. Catchments “earmarked” for freshwater conservation were
selected as CBAs for this study as these areas represent optimal biodiversity areas required to
meet biodiversity targets.
KwaZulu-Natal Vegetation Types
Scott-Shaw and Escott (2011) This coverage represents an update of the KZN vegetation map as completed in September
2009. Several additions have been made which is represented in the Appendix 1 of the
KwaZulu-Natal Vegetation Type Description Document for Vegetation Map 2011. These
additions were made based on data that was received in an effort to make the map more
current and representative of KZN’s vegetation. The coverage includes a variety of wetland
types with conservation statuses that are specific to KZN conservation planning.
ST RAT EGIC ENVIRONMENT AL ASSESS MENT F OR GA S P I PE L INE DEVELOP MENT IN SOU T H AFRICA
WET LANDS AND R IVER S S PECIAL IST REPORT
Page 21
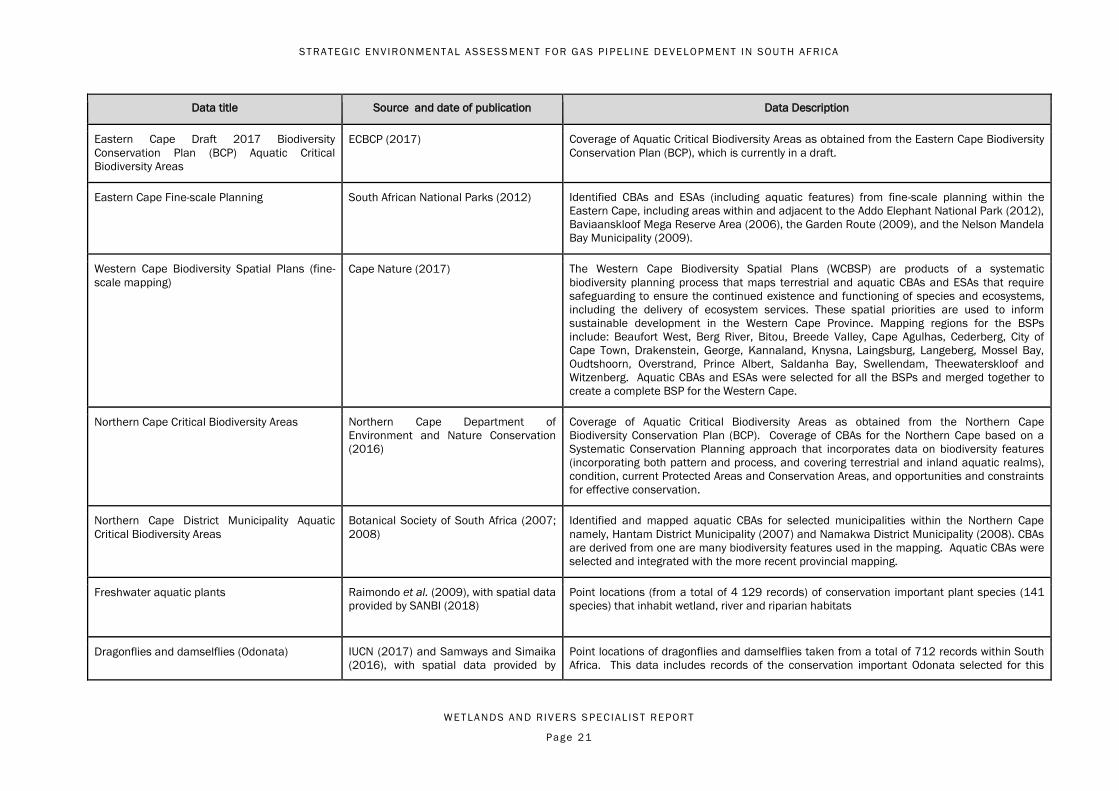
Data title Source and date of publication Data Description
Eastern Cape Draft 2017 Biodiversity
Conservation Plan (BCP) Aquatic Critical
Biodiversity Areas
ECBCP (2017) Coverage of Aquatic Critical Biodiversity Areas as obtained from the Eastern Cape Biodiversity
Conservation Plan (BCP), which is currently in a draft.
Eastern Cape Fine-scale Planning South African National Parks (2012) Identified CBAs and ESAs (including aquatic features) from fine-scale planning within the
Eastern Cape, including areas within and adjacent to the Addo Elephant National Park (2012),
Baviaanskloof Mega Reserve Area (2006), the Garden Route (2009), and the Nelson Mandela
Bay Municipality (2009).
Western Cape Biodiversity Spatial Plans (fine-
scale mapping)
Cape Nature (2017) The Western Cape Biodiversity Spatial Plans (WCBSP) are products of a systematic
biodiversity planning process that maps terrestrial and aquatic CBAs and ESAs that require
safeguarding to ensure the continued existence and functioning of species and ecosystems,
including the delivery of ecosystem services. These spatial priorities are used to inform
sustainable development in the Western Cape Province. Mapping regions for the BSPs
include: Beaufort West, Berg River, Bitou, Breede Valley, Cape Agulhas, Cederberg, City of
Cape Town, Drakenstein, George, Kannaland, Knysna, Laingsburg, Langeberg, Mossel Bay,
Oudtshoorn, Overstrand, Prince Albert, Saldanha Bay, Swellendam, Theewaterskloof and
Witzenberg. Aquatic CBAs and ESAs were selected for all the BSPs and merged together to
create a complete BSP for the Western Cape.
Northern Cape Critical Biodiversity Areas
Northern Cape Department of
Environment and Nature Conservation
(2016)
Coverage of Aquatic Critical Biodiversity Areas as obtained from the Northern Cape
Biodiversity Conservation Plan (BCP). Coverage of CBAs for the Northern Cape based on a
Systematic Conservation Planning approach that incorporates data on biodiversity features
(incorporating both pattern and process, and covering terrestrial and inland aquatic realms),
condition, current Protected Areas and Conservation Areas, and opportunities and constraints
for effective conservation.
Northern Cape District Municipality Aquatic
Critical Biodiversity Areas
Botanical Society of South Africa (2007;
2008)
Identified and mapped aquatic CBAs for selected municipalities within the Northern Cape
namely, Hantam District Municipality (2007) and Namakwa District Municipality (2008). CBAs
are derived from one are many biodiversity features used in the mapping. Aquatic CBAs were
selected and integrated with the more recent provincial mapping.
Freshwater aquatic plants Raimondo et al. (2009), with spatial data
provided by SANBI (2018)
Point locations (from a total of 4 129 records) of conservation important plant species (141
species) that inhabit wetland, river and riparian habitats
Dragonflies and damselflies (Odonata) IUCN (2017) and Samways and Simaika
(2016), with spatial data provided by
Point locations of dragonflies and damselflies taken from a total of 712 records within South
Africa. This data includes records of the conservation important Odonata selected for this

ST RAT EGIC ENVIRONMENT AL ASSESS MENT F OR GA S P I PE L INE DEVELOP MENT IN SOU T H AFRICA
WET LANDS AND R IVER S S PECIAL IST REPORT
Page 22
Data title Source and date of publication Data Description
SANBI (2018) assessment.
Aquatic macro-invertebrates DWS (2015) Point shapefiles of 94 aquatic macro-invertebrate families recorded from 3 202 monitoring
sites on rivers within South Africa.
Freshwater fish Coetzer (2017) Point locations for freshwater fish for South Africa taken from a total of 1 194 records. This
data includes records for approximately half of the conservation important fish in South Africa.
Fish distributions International Union for the Conservation
of Nature (2017)
Distribution data for selected fish species where point data was found to be
lacking/insufficient was obtained from the IUCN Red List of Threatened Species Map Viewer
with data presented as catchment distributions. The IUCN distributions were spatially inferred
using the SQ4 catchments for 21 of the selected fish species.
Amphibians Minter et al. (2004), with spatial data
provided by SANBI (2018)
Point localities (approximately 11 444 records) for these selected species were obtained from
the SANBI TSP database (SANBI, 2018).
Reptiles Bates et al. (2014), with spatial data
provided by SANBI (2018)
Point locations of reptiles was taken from a total of 4 452 records.
Mammals Child et al. (2016), with spatial data
provided by SANBI (2018)
Point locations of mammals was taken from a total of 3 072 records.
1
2
ST RAT EGIC ENVIRONMENT AL ASSESS MENT F OR GA S P I PE L INE DEVELOP MENT IN SOU T H AFRICA
WET LANDS AND R IVER S S PECIAL IST REPORT
Page 23
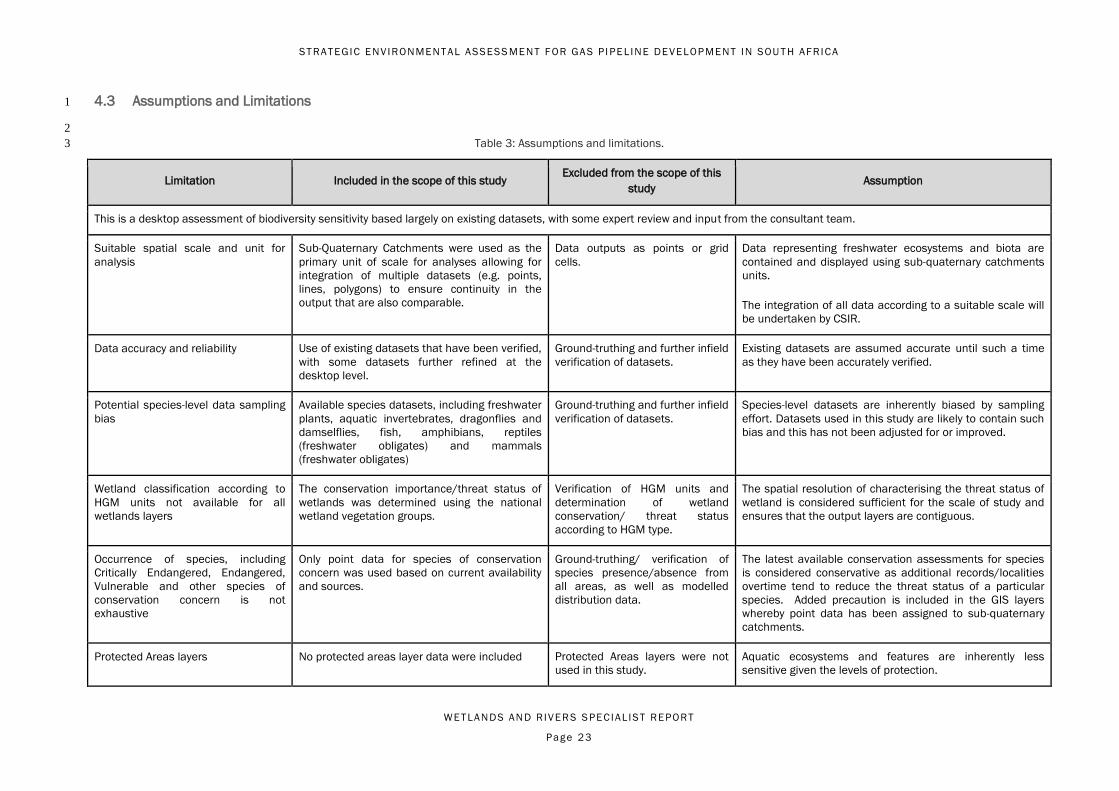
4.3 Assumptions and Limitations 1
2
Table 3: Assumptions and limitations. 3
Limitation Included in the scope of this study Excluded from the scope of this
study Assumption
This is a desktop assessment of biodiversity sensitivity based largely on existing datasets, with some expert review and input from the consultant team.
Suitable spatial scale and unit for
analysis
Sub-Quaternary Catchments were used as the
primary unit of scale for analyses allowing for
integration of multiple datasets (e.g. points,
lines, polygons) to ensure continuity in the
output that are also comparable.
Data outputs as points or grid
cells.
Data representing freshwater ecosystems and biota are
contained and displayed using sub-quaternary catchments
units.
The integration of all data according to a suitable scale will
be undertaken by CSIR.
Data accuracy and reliability Use of existing datasets that have been verified,
with some datasets further refined at the
desktop level.
Ground-truthing and further infield
verification of datasets.
Existing datasets are assumed accurate until such a time
as they have been accurately verified.
Potential species-level data sampling
bias
Available species datasets, including freshwater
plants, aquatic invertebrates, dragonflies and
damselflies, fish, amphibians, reptiles
(freshwater obligates) and mammals
(freshwater obligates)
Ground-truthing and further infield
verification of datasets.
Species-level datasets are inherently biased by sampling
effort. Datasets used in this study are likely to contain such
bias and this has not been adjusted for or improved.
Wetland classification according to
HGM units not available for all
wetlands layers
The conservation importance/threat status of
wetlands was determined using the national
wetland vegetation groups.
Verification of HGM units and
determination of wetland
conservation/ threat status
according to HGM type.
The spatial resolution of characterising the threat status of
wetland is considered sufficient for the scale of study and
ensures that the output layers are contiguous.
Occurrence of species, including
Critically Endangered, Endangered,
Vulnerable and other species of
conservation concern is not
exhaustive
Only point data for species of conservation
concern was used based on current availability
and sources.
Ground-truthing/ verification of
species presence/absence from
all areas, as well as modelled
distribution data.
The latest available conservation assessments for species
is considered conservative as additional records/localities
overtime tend to reduce the threat status of a particular
species. Added precaution is included in the GIS layers
whereby point data has been assigned to sub-quaternary
catchments.
Protected Areas layers No protected areas layer data were included Protected Areas layers were not
used in this study.
Aquatic ecosystems and features are inherently less
sensitive given the levels of protection.

ST RAT EGIC ENVIRONMENT AL ASSESS MENT F OR GA S P I PE L INE DEVELOP MENT IN SOU T H AFRICA
WET LANDS AND R IVER S S PECIAL IST REPORT
Page 24
Limitation Included in the scope of this study Excluded from the scope of this
study Assumption
Protected areas will be accounted for in the main
integration of all data layers and development of the cost
surface - in this regard all freshwater ecosystems and
features will be treated with a high sensitivity.
Working with large datasets,
particularly fine-scale plans
The fine-scale GIS layers have been thinned out
to make processing more efficient - allowing a
suitable fine scale resolution for strategic
planning, whilst ensuring efficient processing.
Small wetland fragments from
fine-scale GIS data layers were
excluded, and scaled according to
sensitivity.
Site specific studies will utilise all information available
(SEA threat and sensitivity layers) as well as the detailed
fine-scale GIS layers. Such fine-scale detail is potentially
excessive at the strategic planning phase.
1
4.4 Relevant Regulatory Instruments 2
A detailed list and description of all relevant regulatory instruments associated with freshwater ecosystems at an international, national scale, as well as provincial scale 3
as per the compendium of South African Environmental Legislation (van der Linde, 2006) for each focus area (Table 4). 4
5
Table 4: International, national and provincial regulatory instruments relevant to freshwater ecosystems. 6
Instrument Key objective Feature
International Instrument
Ramsar Convention (The Convention of
Wetlands of International Importance (1971
and amendments)
Protection and conservation of wetlands, particularly those of importance to waterfowl
and waterfowl habitat. South Africa is a signatory to the Ramsar Convention and is thus
obliged to promote the conservation of listed wetlands and the ‘wise management’ of all
others.
Ramsar Wetlands
IUCN Red List of threatened species Provides the most comprehensive inventory of the global conservation status of plant and
animal species. Uses a set of criteria to evaluate the extinction risk of thousands of
species and subspecies. The criteria used are relevant to all species and all regions of
the world.
Species diversity
The Convention on Biological Diversity (1992) Focused on the conservation of biological diversity, the sustainable use of its
components, the fair and equitable sharing of the benefits from the use of genetic
resources
Species diversity

ST RAT EGIC ENVIRONMENT AL ASSESS MENT F OR GA S P I PE L INE DEVELOP MENT IN SOU T H AFRICA
WET LANDS AND R IVER S S PECIAL IST REPORT
Page 25
Instrument Key objective Feature
Regional Instrument
SADC Protocol on Shared Watercourse
Systems (1995)
The protocol provides for the utilisation of a shared watercourse system for the purpose
of agricultural, domestic and industrial use and navigation within the SADC region. The
protocol established river basin management institutions for shared watercourse systems
and provides for all matters relating to the regulation of shared watercourse systems
Transboundary Rivers
National Instrument
National Environmental Management:
Biodiversity Act, 2004 (Act 10 of 2004)
The National Environmental Management: Biodiversity Act, 2004 (Act 10 of 2004)
provides for listing threatened or protected ecosystems, in one of four categories:
critically endangered (CR), endangered (EN), vulnerable (VU) or protected. Activity 12 in
Listing Notice 3 (of the 2014 EIA Regulations (as amended) in Government Notice R324
of 2017) relates to the clearance of 300 m2 or more of vegetation, within Critical
Biodiversity Areas.
Relevant to rivers and wetlands, critical
biodiversity areas, threatened ecosystems
and endangered species during all
phases
National Environmental Management Act (Act
107 of 1998) as amended.
NEMA sets out the fundamental principles that apply to environmental decision making,
some of which derive from international environmental law and others from the
constitution.
The National Environmental Management Act of 1998 (NEMA), outlines measures
that….”prevent pollution and ecological degradation; promote conservation; and secure
ecologically sustainable development and use of natural resources while promoting
justifiable economic and social development.” Of particular relevance to this assessment
is Chapter 1(4r), which states that sensitive, vulnerable, highly dynamic or stressed
ecosystems, such as coastal shores, estuaries, wetlands, and similar systems require
specific attention in management and planning procedures, especially where they are
subject to significant human resource usage and development pressure.
Relevant to rivers and wetlands during all
phases
NEMA EIA 2014 Regulations, as amended
April 2017 (Government Gazette 40772
These regulations provide listed activities that require EA prior to development because
they are identified as having a potentially detrimental effect on natural ecosystems,
including freshwater ecosystems. Different sorts of activities are listed as environmental
triggers that determine different levels of impact assessment and planning required. The
regulations detail the procedures and timeframes to be followed for a basic or full
scoping and environmental impact assessment.
Relevant for gas pipeline construction/
development in proximity to wetlands,
rivers and critical biodiversity areas
National Water Act (Act 36, 1998) This act provides the legal framework for the effect and sustainable management of
water resources. It provides for the protection, use, development, conservation,
management and control of water resources as a whole. Water use pertains to the
Relevant to rivers and wetlands during all
phases

ST RAT EGIC ENVIRONMENT AL ASSESS MENT F OR GA S P I PE L INE DEVELOP MENT IN SOU T H AFRICA
WET LANDS AND R IVER S S PECIAL IST REPORT
Page 26
Instrument Key objective Feature
consumption of water and activities that may affect water quality and condition of the
resource such as alteration of a watercourse. Water use requires authorisation in terms
of a Water use licence (WUL) or General Authorisation (GA), irrespective of the condition
of the affected watercourse. Includes international management of water.
Conservation of Agricultural Resources Act
(CARA, Act 43 of 1983).
Key aspects include legislation that allows for: Section 6: Prescription of control
measures relating to the utilisation and protection of vleis, marshes, water sponges and
water courses. These measures are described in regulations promulgated in terms of the
Act, as follows; Regulation 7(1): Subject to the Water Act of 1956 (since amended to the
Water Act 36 of 1998), no land user shall utilise the vegetation of a vlei, marsh or water
sponge or within the flood area of a water course or within 10 m horizontally outside such
flood area in a manner that causes or may cause the deterioration or damage to the
natural agricultural resources. Regulation 7(3) and (4): Unless written permission is
obtained, no land user may drain or cultivate any vlei, marsh or water sponge or cultivate
any land within the flood area or 10 m outside this area (unless already under
cultivation).
Rivers and wetlands
National Environmental Management Waste
Act (No. 59 of 2008)
Minimising the consumption of natural resources; avoiding and minimising the
generation of waste; reducing, re-using, recycling and recovering waste; treating and
safely disposing of waste as a last resort; preventing pollution and ecological
degradation; securing ecologically sustainable development while promoting justifiable
economic and social development; promoting and ensuring the effective delivery of waste
services; remediating land where contamination presents, or may present, a significant
risk of harm to health or the environment: and achieving integrated waste management
reporting and planning; to ensure that people are aware of the impact of waste on their
health, well-being and the environment; to provide for compliance with the measures set
out in paragraph (a) and generally, to give effect to section 24 of the Constitution in order
to secure an environment that is not harmful to health and well-being.
Relevant to construction and operation
phases of gas development projects,
which may impact rivers and wetlands
National Environmental Management:
Protected Areas Act (No. 57 of 2003 as
amended) {NEM:PPA}
To provide, within the framework of national legislation, including the National
Environmental Management Act, for the declaration and management of protected
areas; to provide for co-operative governance in the declaration and management of
protected areas; to effect a national system of protected areas in South Africa as part of
a strategy to manage and conserve its biodiversity; to provide for a representative
network of protected areas on state land, private land and communal land; to promote
sustainable utilisation of protected areas for the benefit of people, in a manner that
would preserve the ecological character of such areas; and to promote participation of
local communities in the management of protected areas, where appropriate.
Any protected areas - and related
freshwater ecosystems affected by gas
development

ST RAT EGIC ENVIRONMENT AL ASSESS MENT F OR GA S P I PE L INE DEVELOP MENT IN SOU T H AFRICA
WET LANDS AND R IVER S S PECIAL IST REPORT
Page 27
Instrument Key objective Feature
Draft biodiversity offset policy A Draft National Biodiversity Offset Policy was recently gazetted in March 2017 (NEMBA,
2017), and is in the process of being finalised. The offset policy is intended to establish
the foundation for establishing an offset for biodiversity (including river and wetland
ecosystems), ensuring that offset procedures are properly integrated into the EIA process
to make sure that the mitigation hierarchy is exhausted. Should it be determined in the
EIA that there will be residual impact that cannot be avoided and/or mitigate, then an
offset will need to be established to account for the loss of biodiversity. The core
principles for offsetting, as set out in the policy, should be used to guide the process of
evaluating, designing and implementing an offset. It is essential that the offset process is
introduced from the outset of the EIA.
River and wetland ecosystems and
associated fauna and flora
National Water Resource Strategy (NWRS)
2004 and NWRS2 2013
Facilitate the proper management of the nation’s water resources; provide a framework
for the protection, use, development, conservation, management and control of water
resources for the country as a whole; provide a framework within which water will be
managed at regional or catchment level, in defined water management areas; provide
information about all aspects of water resource management; identify water-related
development opportunities and constraints
All rivers, wetlands and freshwater
resources
The Water Services Act, (No. 108 of 1997
(RSA, 1997a)
The right of access to basic water supply and the right to basic sanitation necessary to
secure sufficient water and an environment not harmful to human health or well-being;
the setting of national standards and norms and standards for tariffs in respect of water
services; the preparation and adoption of water services development plans by water
services authorities; a regulatory framework for water services institutions and water
services intermediaries; the establishment and disestablishment of water boards and
water services committees and their duties and powers; the monitoring of water services
and intervention by the Minister or by the 5 relevant Province; financial assistance to
water services institutions; the gathering of information in a national information system
and the distribution of that information; the accountability of water services providers:
and the promotion of effective water resource management and conservation.
Water supply services in an efficient equitable manner, as well as measures to promote
water conservation and demand management which through Water Conservation and
Water Demand Management (WC/WDM) strategies
Water resource allocation to develop gas
pipelines - during construction and
operation phases. Relevant to water
resources in the vicinity of gas pipelines.
Resource Directed Measures including: the
Ecological Reserve, National Water Resource
Classification System (NWRCS) and Resource
Quality Objectives (RQO’s)
The main objective of the Chief Directorate: Resource Directed Measures (RDM) is to
ensure protection of water resources, as described in Chapter 3 of the South African
National Water Act - 1998 (No. 36 of 1998) and other related water management
legislation and policies. The role of RDM is to provide a framework to ensure sustainable
utilization of water resources to meet ecological, social and economic objectives and to
Benchmark used for monitoring and
evaluation of freshwater resources
especially rivers in relation to the Reserve.

ST RAT EGIC ENVIRONMENT AL ASSESS MENT F OR GA S P I PE L INE DEVELOP MENT IN SOU T H AFRICA
WET LANDS AND R IVER S S PECIAL IST REPORT
Page 28
Instrument Key objective Feature
audit the state of South Africa’s water resources against these objectives
The aim of Water Resource Quality Objectives is to delineate units of analysis and
describe the status quo of water resources, initiate stakeholder process and catchment
visioning, quantify EWR’s and changes in ecosystem services, identify scenarios within
IWRM, draft management classes, produce RQO’s (EcoSpecs, water quality), Gazette
class configuration
Water Research Act (Act 34 of 1971) Promotes water related research All water resources, and associated
ecosystems
Provincial Instrument
Catchment Management Strategies
applicable to all provinces
Progressively develop a catchment management strategy for the water resources within
its water management area. Catchment management strategies must be in harmony with
the national water resource strategy. CMA must seek cooperation and agreement on
water -related matters from the various stakeholders and interested persons. CMA must
be reviewed and include a water allocation plan, set principles for allocating water to
existing and prospective users, taking into account all matters relevant to the protection
use, development conservation, management and control of resources
Rivers and wetlands
Western Cape
Nature and Environmental Conservation
Ordinance (Ordinance 19 of 1974; amended
in 2000).
This ordinance is applicable in the Western Cape, Eastern Cape, Northern Cape and parts
of the North West Province. This ordinance provides measures to protect the natural flora
and fauna, as well as listing nature reserves in these provinces. This ordinance was
amended in 2000 to become the Nature Conservation Laws Amendment Act. Lists of
endangered flora and fauna can be found in this act.
Species diversity
Eastern Cape
Cape Local Authorities Gas Ordinance 7 of
1912
Regulates gas and control gas related water pollution Gas pipeline development affecting rivers
and wetlands
Divisional Councils Ordinance 18 of 1976 Provides for the regulation and control of effluents refuse and stormwater Gas pipeline development affecting rivers
and wetlands
Nature and Environmental Conservation This ordinance is applicable in the Western Cape, Eastern Cape, Northern Cape and parts Species diversity

ST RAT EGIC ENVIRONMENT AL ASSESS MENT F OR GA S P I PE L INE DEVELOP MENT IN SOU T H AFRICA
WET LANDS AND R IVER S S PECIAL IST REPORT
Page 29
Instrument Key objective Feature
Ordinance (Ordinance 19 of 1974; amended
in 2000).
of the North West Province. This ordinance provides measures to protect the natural flora
and fauna, as well as listing nature reserves in these provinces. This ordinance was
amended in 2000 to become the Nature Conservation Laws Amendment Act. Lists of
endangered flora and fauna can be found in this act.
KwaZulu-Natal
KwaZulu-Natal Nature Conservation Act, 1992
(Act 29 of 1992) as an amendment to the
Natal Nature Conservation Ordinance (No. 15
of 1974)
According to the Natal Nature Conservation Ordinance No. 15 of 1974 and the KwaZulu-
Natal Nature Conservation Act, 1992 (Act 29 of 1992), no person shall, among others:
damage, destroy, or relocate any specially protected indigenous plant, except under the
authority and in accordance with a permit from Ezemvelo KZN Wildlife (EKZNW).
Species diversity
Ezemvelo KZN Wildlife Guideline: Biodiversity
Impact Assessment in KwaZulu-Natal
Provides guidelines for developers, applicants, environmental consultants and specialists
to ensure that projects investigation timeframes are accurately determined, that
feasibility studies accurately determine fatal flaws regarding biodiversity, and that the
scope and reporting requirements of specialist studies allow for informed and sustained
decisions to be made in terms of biodiversity.
Conservation and protection of river and
wetland habitats and associated fauna
and flora
South Barrow Loan and Ext Powers Ordinance
12 of 1920
Regulates water pollution Rivers and wetlands
South Shepstone Loan and Extended Powers
Ordinance 20 of 1920
Regulates water pollution and other pollutants Rivers and wetlands
Water Services Ordinance 27 of 1963 Regulates matters relating to water , water pollution and sewage Rivers and wetlands
Kloof Loan and Extended Powers Ordinance
16 of 1967
Regulates water pollution and other pollutants Rivers and wetlands
Umhlanga Extended Powers and Loan
Ordinance 17 of 1975
Regulates water pollution within Umhlanga and surrounding areas Rivers and wetlands
Durban Extended Powers Cons Ordinance 18
of 1976
Regulates water pollution and other pollutants Rivers and wetlands
Kwa-Zulu and Natal Joint Services Act 84 of
1990
Regulates pollution of land water and waste management Rivers and wetlands
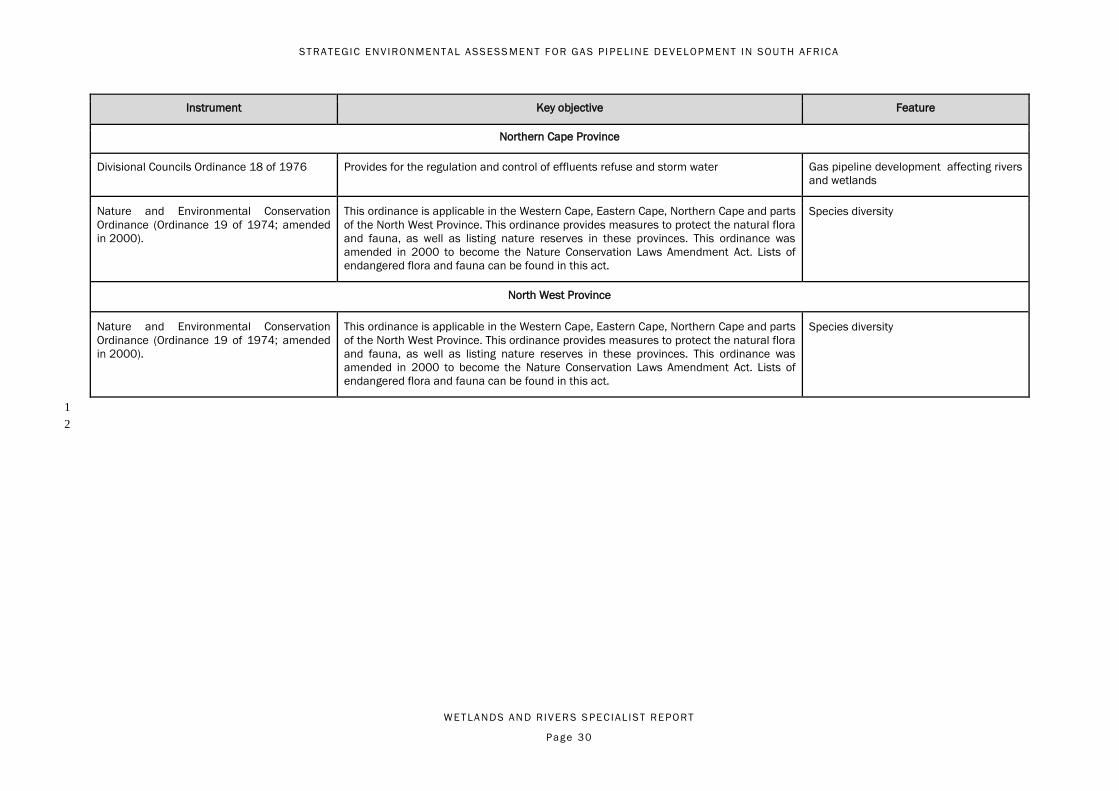
ST RAT EGIC ENVIRONMENT AL ASSESS MENT F OR GA S P I PE L INE DEVELOP MENT IN SOU T H AFRICA
WET LANDS AND R IVER S S PECIAL IST REPORT
Page 30
Instrument Key objective Feature
Northern Cape Province
Divisional Councils Ordinance 18 of 1976 Provides for the regulation and control of effluents refuse and storm water Gas pipeline development affecting rivers
and wetlands
Nature and Environmental Conservation
Ordinance (Ordinance 19 of 1974; amended
in 2000).
This ordinance is applicable in the Western Cape, Eastern Cape, Northern Cape and parts
of the North West Province. This ordinance provides measures to protect the natural flora
and fauna, as well as listing nature reserves in these provinces. This ordinance was
amended in 2000 to become the Nature Conservation Laws Amendment Act. Lists of
endangered flora and fauna can be found in this act.
Species diversity
North West Province
Nature and Environmental Conservation
Ordinance (Ordinance 19 of 1974; amended
in 2000).
This ordinance is applicable in the Western Cape, Eastern Cape, Northern Cape and parts
of the North West Province. This ordinance provides measures to protect the natural flora
and fauna, as well as listing nature reserves in these provinces. This ordinance was
amended in 2000 to become the Nature Conservation Laws Amendment Act. Lists of
endangered flora and fauna can be found in this act.
Species diversity
1
2

ST RAT EGIC ENVIRONMENT AL ASSESS MENT F OR GA S P I PE L INE DEVELOP MENT IN SOU T H AFRICA
WET LANDS AND R IVER S S PECIAL IST REPORT
Page 31
5 BASELINE DESCRIPTION OF THE PROPOSED GAS PIPELINE CORRIDORS 1
A description of the freshwater ecosystems within corridors that stand to be impacted by the phased development of the gas pipeline in South Africa is presented in Table 2
5. These descriptions are provided together with a summary of the existing drivers and pressures, relating primarily to land use, within these corridors 3
4
Table 5: Description of freshwater ecosystems and species of the proposed Gas Pipeline corridors, including existing drivers and pressures. 5
Gas
pipeline
corridor
Description Existing drivers and pressures
Phase 1
Corridor
Rivers within the Phase 1 Corridor are either perennial/permanently-flowing (approximately 55%)
or ephemeral/non-perennial (approximately 45%), and are characteristic of the South Western
Coastal Belt, Western Folded Mountains, Southern Folded Mountains and the Southern Coastal
Belt ecoregions. Major river systems include the Berg, Bree, Gourits and Doring Rivers. Most
(approximately 65%) of the river habitat in the corridor is currently Threatened (i.e. Critically
Endangered, Endangered and Vulnerable). The upper reaches of the Doring River is a
flagship/free-flowing river that drains the corridor. 30% of rivers in this corridor are in a
natural/good condition, while 20% are in a fair condition, 44% are in a poor condition, and 6% are
either very poor/critical condition. Overall river sensitivity for the Phase 1 Corridor is as follows:
very high (38%), high (30%), medium (27%), and low (5%).
Wetland habitats within the Phase 1 Corridor occupy a fair proportion of the corridor (~7%)
comprising up to 221 different wetland types, dominated by channelled-valley bottom wetlands
and floodplain wetlands, particularly within the East Coast Shale Renosterveld region. The
corridor boasts five Ramsar wetlands, namely Langebaan, False Bay Nature Reserve, Bot-
Kleinmond Estuarine System, De Mond (Heuningnes Estuary) and De Hoop Vlei. A moderate
proportion (~18%) of the wetlands in the corridor are characterised as NFEPA wetlands. Most
notable is that 50% of the wetlands of the corridor are associated with the Critically Endangered
wetland groups: East Coast Shale Renosterveld (20%), Rainshadow Valley Karoo (15%), West
Coast Shale Renosterveld (9%) and Western Fynbos-Renosterveld Shale Renosterveld (6%).
Overall wetland sensitivity for the Phase 1 Corridor is as follows: very high (25%), high (60%),
medium (13%), and low (2%).
Threatened aquatic biota: Three Endangered Odonata (Proischnura polychromatica, Orthetrum
rubens and Spesbona angusta), as well as four Vulnerable and three Near Threatened species.
Orthetrum rubens is a restricted species that is only known from the mountains of the Western
Cape: since 2016 the only known extant population is in the Hottenstots-Holland Mountains, at
Approximately 67% of the Phase 1 Corridor comprises land that is largely
natural with a small proportion (~1%) degraded. A significant proportion
(20%) of the corridor is protected by over 100 different conservation areas
(e.g. Koue Bokkeveld Mountain Catchment Area, Matroosberg Mountain
Catchment Area, Langeberg Mountain Catchment Area). The remaining
area is largely transformed by cultivation (~29%), but also urbanisation in
and around Cape Town (2%) and plantations (1%). Impacts on freshwater
ecosystems caused by land use activities vary across the corridor,
however, combined effect has had a significant effect on freshwater
ecosystem functioning and integrity. Key impacts include:
There has been rapid population growth within the Western
Cape, and thus urbanization has increased, particularly since
2009. Informal settlements in particular have expanded and
reactive spatial planning has led to poor or even absent basic
service infrastructure. The result is unsustainable practices
including increased illegal dumping and waste disposal in rivers,
contributing to water pollution. The greatest instances of
transformation are reported to be in Cape Town itself and other
coastal nodes.
Very high (unacceptable) faecal contamination in the Berg, Bree,
Diep, Gouritz and Kuils River systems. Inland water is generally
considered not fit even for agricultural or industrial use.
Alien invasive species, which reduce both surface and ground
water availability, increase fire risk and compete with indigenous
species, which result in habitat loss and degradation. Alien
invasive plants are a large problem, as are invasive fish species

ST RAT EGIC ENVIRONMENT AL ASSESS MENT F OR GA S P I PE L INE DEVELOP MENT IN SOU T H AFRICA
WET LANDS AND R IVER S S PECIAL IST REPORT
Page 32
Gas
pipeline
corridor
Description Existing drivers and pressures
Victoria Peak. Spesbona angusta is also restricted to a wetland at the base of Franschhoek pass,
and thus careful conservation planning and improvement of wetland in terms of water depth and
density of pools is required for this species (Veldtman et al., 2017). Proischnura polychromatica
has also only been recently recorded near Ceres, and also at the base of Franschhoek Pass, and
are only known from sites where alien invasive trees have been removed (Veldtman et al., 2017).
The corridor supports an exceptionally high number of Red Listed fish (up to 22 species) of which
four are Critically Endangered: Pseudobarbus burchelli, which is found in the Breede and Tradouw
river systems, Pseudobarbus erubescens (endemic to the Twee River Catchment within Olifants
system), Pseudobarbus sp. nov. 'doring' (Breekkrans and Driehoeks Tributaries of the Doring
river, Olifants system), and Pseudobarbus sp. nov. 'heuningnes' (Heuningnes River System). In
addition, 10 fish species are Endangered, three are Vulnerable, four are Near Threated and one
is Data Deficient. The corridor also supports a high number of Red Listed amphibians (up to 16
species) of which five are Critically Endangered (Arthroleptella rugosa, A. subvoce, Capensibufo
rosei, Heleophryne rosei and Microbatrachella capensis), two are Endangered, six are Near
Threated and three are Data Deficient. Arthroleptella rugosa (Rough Moss frog) is a highly
restricted species occurring only on the Klein Swartberg Mountain near Caledon, A. subvoce’s
status may be changed to a more threatened category (Turner and de Villiers, 2017);
Capensibufo rosei is only found to occur on the Cape Peninsula, in two or three remaining
populations; Heleophryne rosei is restricted to four streams on Table mountain area, and
Microbatrachella capensis is a vital indicator of a unique and threatened ecosystem: coastal
lowland blackwater wetlands. There is only one Red Listed reptile that occurs within the corridor,
namely the Vulnerable Bradypodion pumilum. The Phase 1 Corridor supports known occurrences
of the Critically Endangered Riverine Rabbit Bunolagus monticularis, which is restricted to the
semi-arid Karoo, with an estimated Extent of Occurrence (EOO) of 54,227 km2 and Area of
Occupancy (AOO) 2,943 km2 (2016 Mammal Red List Bunolagus monticularis CR). The Riverine
Rabbit inhabits dense, discontinuous scrub vegetation along seasonal river beds and is
dependent on soft, deep alluvial spoils along these river courses, for constructing burrows in
order to breed. Other Red Listed mammals include the Vulnerable Dasymys capensis, as well as
three species that are Near Threatened. This corridor supports the highest diversity of Red Listed
plants with up to 75 species. Of this diversity, 16 are Critically Endangered, 23 are Endangered,
22 are Vulnerable, six are Near Threatened, four are Data Deficient and four are rare. Overall
species sensitivity for the Phase 1 Corridor is as follows: very high (50%), high (40%), medium
(8%), and low (2%).
within rivers – 17 in total.
Agriculture, also reported to be increasing in the Western Cape
region, contributes to the pollution of freshwater resources, as a
result of run-off of pesticides and fertilizers. In addition, over-
abstraction of water for both agriculture and urban use forms a
major problem in many areas.
Damage to river beds, wetlands and floodplains (channel
modification) as a result of agricultural practices is also
considered to be a major threat to freshwater ecosystems in this
region.
Other pressures which impact on these systems include
overgrazing and illegal harvesting of species
Further to this, within the Western Cape, water has been
identified as a provincial risk, based on increased urbanization,
climate change, failing infrastructure and consumer behaviour.
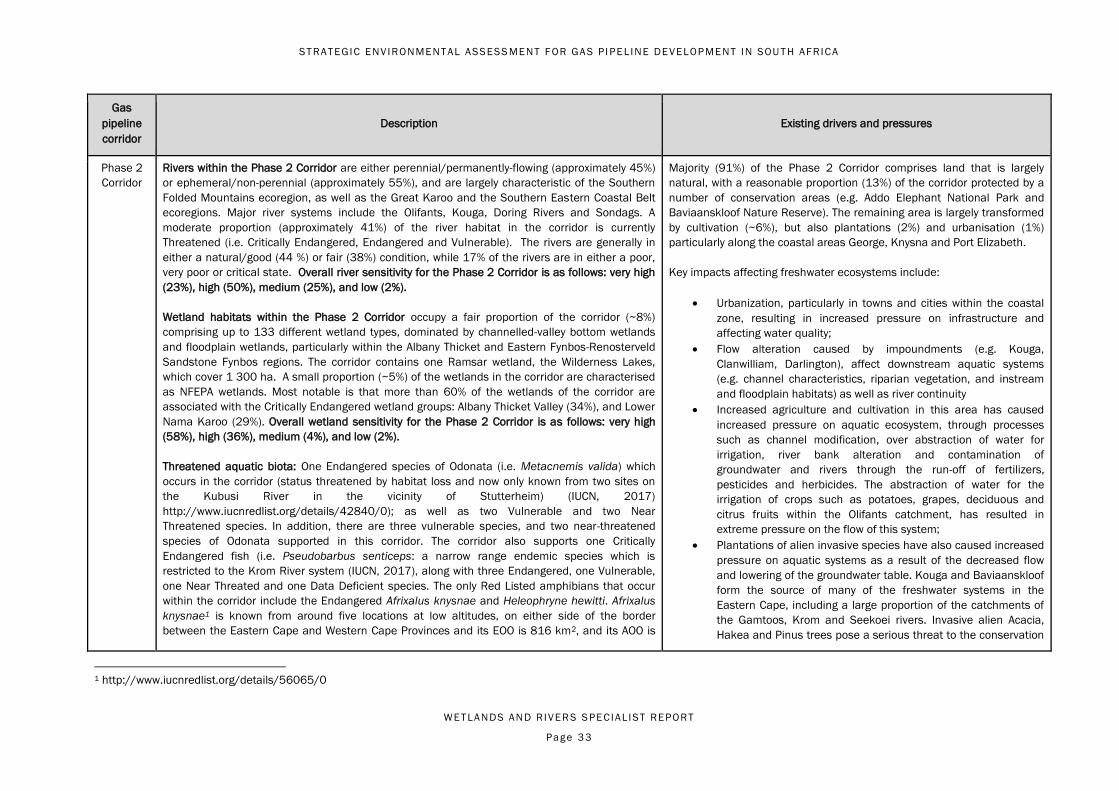
ST RAT EGIC ENVIRONMENT AL ASSESS MENT F OR GA S P I PE L INE DEVELOP MENT IN SOU T H AFRICA
WET LANDS AND R IVER S S PECIAL IST REPORT
Page 33
Gas
pipeline
corridor
Description Existing drivers and pressures
Phase 2
Corridor
Rivers within the Phase 2 Corridor are either perennial/permanently-flowing (approximately 45%)
or ephemeral/non-perennial (approximately 55%), and are largely characteristic of the Southern
Folded Mountains ecoregion, as well as the Great Karoo and the Southern Eastern Coastal Belt
ecoregions. Major river systems include the Olifants, Kouga, Doring Rivers and Sondags. A
moderate proportion (approximately 41%) of the river habitat in the corridor is currently
Threatened (i.e. Critically Endangered, Endangered and Vulnerable). The rivers are generally in
either a natural/good (44 %) or fair (38%) condition, while 17% of the rivers are in either a poor,
very poor or critical state. Overall river sensitivity for the Phase 2 Corridor is as follows: very high
(23%), high (50%), medium (25%), and low (2%).
Wetland habitats within the Phase 2 Corridor occupy a fair proportion of the corridor (~8%)
comprising up to 133 different wetland types, dominated by channelled-valley bottom wetlands
and floodplain wetlands, particularly within the Albany Thicket and Eastern Fynbos-Renosterveld
Sandstone Fynbos regions. The corridor contains one Ramsar wetland, the Wilderness Lakes,
which cover 1 300 ha. A small proportion (~5%) of the wetlands in the corridor are characterised
as NFEPA wetlands. Most notable is that more than 60% of the wetlands of the corridor are
associated with the Critically Endangered wetland groups: Albany Thicket Valley (34%), and Lower
Nama Karoo (29%). Overall wetland sensitivity for the Phase 2 Corridor is as follows: very high
(58%), high (36%), medium (4%), and low (2%).
Threatened aquatic biota: One Endangered species of Odonata (i.e. Metacnemis valida) which
occurs in the corridor (status threatened by habitat loss and now only known from two sites on
the Kubusi River in the vicinity of Stutterheim) (IUCN, 2017)
http://www.iucnredlist.org/details/42840/0); as well as two Vulnerable and two Near
Threatened species. In addition, there are three vulnerable species, and two near-threatened
species of Odonata supported in this corridor. The corridor also supports one Critically
Endangered fish (i.e. Pseudobarbus senticeps: a narrow range endemic species which is
restricted to the Krom River system (IUCN, 2017), along with three Endangered, one Vulnerable,
one Near Threated and one Data Deficient species. The only Red Listed amphibians that occur
within the corridor include the Endangered Afrixalus knysnae and Heleophryne hewitti. Afrixalus
knysnae1 is known from around five locations at low altitudes, on either side of the border
between the Eastern Cape and Western Cape Provinces and its EOO is 816 km2, and its AOO is
Majority (91%) of the Phase 2 Corridor comprises land that is largely
natural, with a reasonable proportion (13%) of the corridor protected by a
number of conservation areas (e.g. Addo Elephant National Park and
Baviaanskloof Nature Reserve). The remaining area is largely transformed
by cultivation (~6%), but also plantations (2%) and urbanisation (1%)
particularly along the coastal areas George, Knysna and Port Elizabeth.
Key impacts affecting freshwater ecosystems include:
Urbanization, particularly in towns and cities within the coastal
zone, resulting in increased pressure on infrastructure and
affecting water quality;
Flow alteration caused by impoundments (e.g. Kouga,
Clanwilliam, Darlington), affect downstream aquatic systems
(e.g. channel characteristics, riparian vegetation, and instream
and floodplain habitats) as well as river continuity
Increased agriculture and cultivation in this area has caused
increased pressure on aquatic ecosystem, through processes
such as channel modification, over abstraction of water for
irrigation, river bank alteration and contamination of
groundwater and rivers through the run-off of fertilizers,
pesticides and herbicides. The abstraction of water for the
irrigation of crops such as potatoes, grapes, deciduous and
citrus fruits within the Olifants catchment, has resulted in
extreme pressure on the flow of this system;
Plantations of alien invasive species have also caused increased
pressure on aquatic systems as a result of the decreased flow
and lowering of the groundwater table. Kouga and Baviaanskloof
form the source of many of the freshwater systems in the
Eastern Cape, including a large proportion of the catchments of
the Gamtoos, Krom and Seekoei rivers. Invasive alien Acacia,
Hakea and Pinus trees pose a serious threat to the conservation
1 http://www.iucnredlist.org/details/56065/0
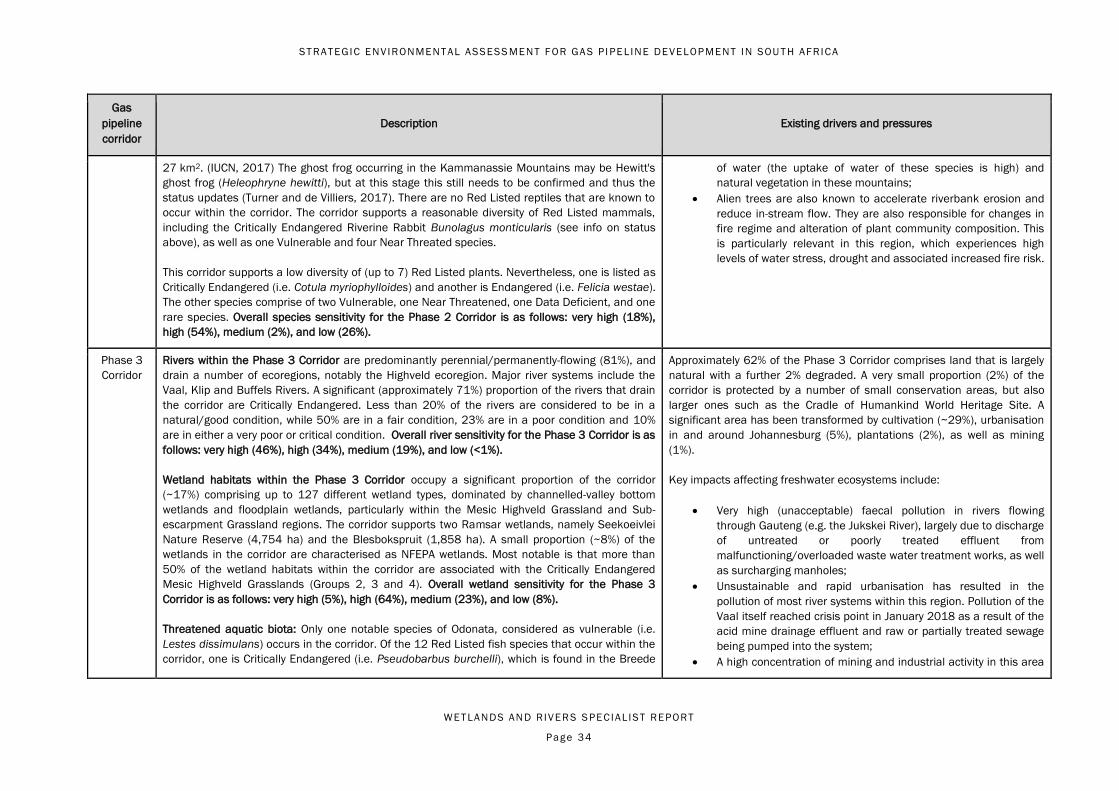
ST RAT EGIC ENVIRONMENT AL ASSESS MENT F OR GA S P I PE L INE DEVELOP MENT IN SOU T H AFRICA
WET LANDS AND R IVER S S PECIAL IST REPORT
Page 34
Gas
pipeline
corridor
Description Existing drivers and pressures
27 km2. (IUCN, 2017) The ghost frog occurring in the Kammanassie Mountains may be Hewitt's
ghost frog (Heleophryne hewitti), but at this stage this still needs to be confirmed and thus the
status updates (Turner and de Villiers, 2017). There are no Red Listed reptiles that are known to
occur within the corridor. The corridor supports a reasonable diversity of Red Listed mammals,
including the Critically Endangered Riverine Rabbit Bunolagus monticularis (see info on status
above), as well as one Vulnerable and four Near Threated species.
This corridor supports a low diversity of (up to 7) Red Listed plants. Nevertheless, one is listed as
Critically Endangered (i.e. Cotula myriophylloides) and another is Endangered (i.e. Felicia westae).
The other species comprise of two Vulnerable, one Near Threatened, one Data Deficient, and one
rare species. Overall species sensitivity for the Phase 2 Corridor is as follows: very high (18%),
high (54%), medium (2%), and low (26%).
of water (the uptake of water of these species is high) and
natural vegetation in these mountains;
Alien trees are also known to accelerate riverbank erosion and
reduce in-stream flow. They are also responsible for changes in
fire regime and alteration of plant community composition. This
is particularly relevant in this region, which experiences high
levels of water stress, drought and associated increased fire risk.
Phase 3
Corridor
Rivers within the Phase 3 Corridor are predominantly perennial/permanently-flowing (81%), and
drain a number of ecoregions, notably the Highveld ecoregion. Major river systems include the
Vaal, Klip and Buffels Rivers. A significant (approximately 71%) proportion of the rivers that drain
the corridor are Critically Endangered. Less than 20% of the rivers are considered to be in a
natural/good condition, while 50% are in a fair condition, 23% are in a poor condition and 10%
are in either a very poor or critical condition. Overall river sensitivity for the Phase 3 Corridor is as
follows: very high (46%), high (34%), medium (19%), and low (<1%).
Wetland habitats within the Phase 3 Corridor occupy a significant proportion of the corridor
(~17%) comprising up to 127 different wetland types, dominated by channelled-valley bottom
wetlands and floodplain wetlands, particularly within the Mesic Highveld Grassland and Sub-
escarpment Grassland regions. The corridor supports two Ramsar wetlands, namely Seekoeivlei
Nature Reserve (4,754 ha) and the Blesbokspruit (1,858 ha). A small proportion (~8%) of the
wetlands in the corridor are characterised as NFEPA wetlands. Most notable is that more than
50% of the wetland habitats within the corridor are associated with the Critically Endangered
Mesic Highveld Grasslands (Groups 2, 3 and 4). Overall wetland sensitivity for the Phase 3
Corridor is as follows: very high (5%), high (64%), medium (23%), and low (8%).
Threatened aquatic biota: Only one notable species of Odonata, considered as vulnerable (i.e.
Lestes dissimulans) occurs in the corridor. Of the 12 Red Listed fish species that occur within the
corridor, one is Critically Endangered (i.e. Pseudobarbus burchelli), which is found in the Breede
Approximately 62% of the Phase 3 Corridor comprises land that is largely
natural with a further 2% degraded. A very small proportion (2%) of the
corridor is protected by a number of small conservation areas, but also
larger ones such as the Cradle of Humankind World Heritage Site. A
significant area has been transformed by cultivation (~29%), urbanisation
in and around Johannesburg (5%), plantations (2%), as well as mining
(1%).
Key impacts affecting freshwater ecosystems include:
Very high (unacceptable) faecal pollution in rivers flowing
through Gauteng (e.g. the Jukskei River), largely due to discharge
of untreated or poorly treated effluent from
malfunctioning/overloaded waste water treatment works, as well
as surcharging manholes;
Unsustainable and rapid urbanisation has resulted in the
pollution of most river systems within this region. Pollution of the
Vaal itself reached crisis point in January 2018 as a result of the
acid mine drainage effluent and raw or partially treated sewage
being pumped into the system;
A high concentration of mining and industrial activity in this area
ST RAT EGIC ENVIRONMENT AL ASSESS MENT F OR GA S P I PE L INE DEVELOP MENT IN SOU T H AFRICA
WET LANDS AND R IVER S S PECIAL IST REPORT
Page 35
Gas
pipeline
corridor
Description Existing drivers and pressures
and Tradouw river systems, while two are Endangered, two are Vulnerable, five are Near
Threatened and two are Data Deficient. The only Red Listed amphibian that occurs within the
corridor includes the Near Threatened Hemisus guttatus. There are no Red Listed reptiles that
are known to occur within the corridor. The corridor supports the highest number of Red Listed
mammals (up to 9 species) of which four are Vulnerable and five are Near Threated. This corridor
supports a low diversity of (up to 8) Red Listed plants, but which includes two Endangered
species (i.e. Disa zuluensis and Kniphofia flammula). Other Red Listed species include three
Vulnerable and three Near Threatened species. Overall species sensitivity for the Phase 3
Corridor is as follows: very high (8%), high (9%), medium (35%), and low (48%).
places enormous pressure on the aquatic systems and has
caused contamination of these systems though chemical
leaching;
Transformation and damage of wetlands e.g. Klip River wetland,
through illegal dumping, high levels of urbanization, poor
infrastructure and wastewater treatment works, and erosion
through the high volumes of wastewater that flow through the
wetland;
Over-abstraction of water, and various impoundments
(construction of dams e.g. the Vaal in particular), place huge
pressure on the flow of rivers in this region;
The effects of agriculture are evident and contribute to the
pollution of freshwater resources as a result of run-off of
pesticides and fertilizers.
Phase 4
Corridor
Rivers within the Phase 4 Corridor largely form part of the Lowveld and Natal Coastal Plain
ecoregions, with a smaller number of rivers draining off from the Lebombo Uplands. The rivers
are either perennial/permanently-flowing (approximately 62%) or ephemeral/non-perennial
(approximately 38%). Major river systems include the Phongolo and Mkuze Rivers – the Mkuze
River and one of its tributaries, the Msunduzi, are the only flagship/free-flowing rivers that drain
the corridor. Less than 30% of the rivers are considered to be Threatened (i.e. Critically
Endangered, Endangered and Vulnerable). Almost half of the rivers are in a natural/good
condition, 36% are in a fair condition, while 16% are in a poor/very poor condition. Overall river
sensitivity for the Phase 4 Corridor is as follows: very high (15%), high (35%), medium (48%), and
low (2%).
Wetland habitats within the Phase 4 Corridor occupy a small proportion of the corridor (~4%)
comprising up to 47 different wetland types, dominated by floodplain wetlands, particularly within
the Indian Ocean Coastal Belt region. The corridor boasts four Ramsar wetlands covering up to
185 000 ha, namely Ndumo Game Reserve, Kosi Bay, Lake Sibaya, and the St. Lucia System. A
significant proportion (~51%) of the wetlands in the corridor are characterised as NFEPA
wetlands. Most notable is that 65% of the wetland habitats within the corridor are associated with
the Endangered Lowveld wetland vegetation (Group 10). Overall wetland sensitivity for the Phase
4 Corridor is as follows: very high (20%), high (43%), medium (28%), and low (9%).
Approximately 72% of the Phase 4 Corridor comprises land that is largely
natural, with a significant proportion of the area protected by existing
conservation areas (e.g. Isimangaliso Wetland Park, Tembe Elephant Park,
Ndumo Game Reserve, Ithala Game Reserve). The remaining area has
been largely degraded (~15%) or is transformed by cultivation,
plantations, urbanisation and rural settlements. Impacts on freshwater
ecosystems caused by land use activities vary across the corridor,
however, combined effect has had a significant effect on freshwater
ecosystem functioning and integrity.
Key impacts affecting freshwater ecosystems include:
Extensive urbanisation causing transformation and degradation
of freshwater ecosystems, notably in the greater Durban region,
which continues to expand up along the coast, as well as
Richards Bay;
Water quality impacts and pollution associated with urban areas
(e.g. domestic and industrial effluents, failing water treatment
infrastructure, etc.) and agriculture (e.g. pesticides, herbicides

ST RAT EGIC ENVIRONMENT AL ASSESS MENT F OR GA S P I PE L INE DEVELOP MENT IN SOU T H AFRICA
WET LANDS AND R IVER S S PECIAL IST REPORT
Page 36
Gas
pipeline
corridor
Description Existing drivers and pressures
Threatened aquatic biota: The only Critically Endangered Odonata for South Africa occurs along
the Phongolo River in the north-western corner of the Phase 4 Corridor, namely Chlorocypha
consueta. The Endangered Diplacodes pumila also occurs in the corridor along with six species
listed as Vulnerable and four species listed as Near Threatened. One Endangered fish,
Silhouettea sibayi occurs in coastal rivers that flow through the corridor. The corridor also
supports two vulnerable species, three Near Threatened and two Data Deficient species of fish.
The only Red Listed amphibians that occur within the corridor include the Endangered Hyperolius
pickersgilli and the Near Threatened Hemisus guttatus. The corridor supports two Red Listed
reptiles, namely the Hinged Terrapin Pelusios rhodesianus, (Vulnerable) which is known from a
few water bodies along the coastal region – and Macrelaps microlepidotus (Near Threatened),
which is found in forests and coastal bush. Up to eight Red Listed mammals occur within the
Phase 4 Corridor, including five rodents/shrews, as well as Spotted-necked Otter Hydrictis
maculicollis (Vulnerable) and Cape Otter Aonyx capensis (Near Threatened). This corridor
supports a moderate diversity of (up to 24) Red Listed plants, including two that are Endangered
(i.e. Albizia suluensis and Mondia whitei). The majority of the Red Listed plants occurring with the
corridor are either Vulnerable (12 species) or Near Threatened (9 species), while one is
considered rare. Overall species sensitivity for the Phase 4 Corridor is as follows: very high (54%),
high (12%), medium (31%), and low (3%).
and fertiliser applications) all of which are contaminating
receiving aquatic environments;
Flow alteration caused by large impoundments (e.g. Inanda,
Hazelmere and Goedertrouw and Pongolapoort Dams), inter-
basin transfers, WWTW return flows, and stormwater runoff from
hardened surfaces and sewer reticulation, all of which affect
downstream aquatic systems (e.g. channel characteristics,
riparian vegetation, and instream and floodplain habitats) as
well as river continuity;
Cultivation of wetlands and floodplains (notably sugarcane),
especially along the coastal region;
Illegal sand mining, as well as and other mining activities,
particularly in the Richards Bay region;
Transformation and alteration of watercourses through canals,
diversion structures, weirs, road crossings, flood control berms;
Abstraction of water for irrigation and extensive forestry, which is
having a significant impact on groundwater and linked wetlands
in the Maputaland region;
Erosion and degradation, especially linked to overgrazing, which
is notable in the more rural areas; and
Excessive infestation of numerous IAPs, particularly along rivers
and around wetlands, as well as instream (e.g. Water Hyacinth).
Phase 5
Corridor
Rivers within the Phase 5 Corridor are mostly ephemeral/non-perennial (approximately 61%),
while around 39% are considered to be perennial/permanently-flowing. These rivers drain a
number of ecoregions, such as the South Western Coastal Belt, Western Folded Mountains and
the Great Karoo. Major river systems include the Doring, Olifant and Sout. Less than 25% of the
rivers are considered to be Threatened (i.e. Critically Endangered, Endangered and Vulnerable).
More than 60% of the rivers are in a natural/good condition, 8% are in a fair condition, while 30%
are in a poor/very poor condition. Overall river sensitivity for the Phase 5 Corridor is as follows:
very high (27%), high (35%), medium (36%), and low (2%).
Wetland habitats within the Phase 5 Corridor occupy a small proportion of the corridor (~3%)
comprising up to 90 different wetland types, dominated by channelled-valley bottom wetlands,
A large portion (81%) of the Phase 5 Corridor comprises land that is
largely natural, with a fairly small proportion (8%) of the corridor protected
by a number of conservation areas (e.g. Cederberg Wilderness Area,
Moedverloren Nature Reserve and Tankwa Karoo National Park). The
remaining area is mostly transformed by cultivation (~19%), with <1%
attributed to plantations, urbanisation (e.g. Citrusdal and Vredendal) and
mining.
Key impacts affecting freshwater ecosystems include:
Pollution from application of fertilizers, herbicides and

ST RAT EGIC ENVIRONMENT AL ASSESS MENT F OR GA S P I PE L INE DEVELOP MENT IN SOU T H AFRICA
WET LANDS AND R IVER S S PECIAL IST REPORT
Page 37
Gas
pipeline
corridor
Description Existing drivers and pressures
particularly within the Northwest Sand Fynbos region. The corridor contains a single Ramsar
wetland, namely Verlorenvlei, which is approximately 1,500 ha. A moderate proportion (~23%) of
the wetlands in the corridor are characterised as NFEPA wetlands. Almost all of the wetland
habitats within the corridor are associated with Least Threatened wetland vegetation groups (e.g.
the Knersvlakte and Trans-Escarpment Succulent Karoo). Overall wetland sensitivity for the
Phase 5 Corridor is as follows: high (15%), medium (30%), and low (55%).
Threatened aquatic biota: Two species of Odonata that are listed as Vulnerable (i.e. Syncordulia
gracilis and S. legator) occur in the corridor, along with two species that are Near Threated. Of the
14 Red Listed fish species that occur within the corridor, three are listed as Critically Endangered
(i.e. Pseudobarbus burchelli, P. erubescens and P. sp. Nov. ‘doring’), while six are considered
Endangered, four are Near Threatened, and one is Data Deficient. The only Red Listed amphibian
that occurs within the corridor includes the Near Threatened Breviceps gibbosus. There is also
only one Red Listed reptile that occurs within the corridor, namely the Vulnerable Bradypodion
pumilum. The Critically Endangered Riverine Rabbit Bunolagus monticularis occurs in a few,
isolated localities within the corridor (see above for ecology and habitat). The only other Red
Listed mammals include two that are Near Threatened. This corridor supports a moderate
diversity of Red Listed plants of up to 25 species, including two that are Critically Endangered (i.e.
Pilularia bokkeveldensis and Senecio cadiscus), while ten are Endangered, nine are Vulnerable
and four are Near Threatened. Overall species sensitivity for the Phase 5 Corridor is as follows:
very high (34%), high (18%), medium (12%), and low (36%).
pesticides, as well as point-source discharges from urban
centres (e.g. Bitterfontein);
Grazing by livestock, particularly high/concentrated levels of
along watercourses, causing overgrazing and trampling within
and adjacent to river and wetland systems, which in turn leads
to increased erosion and changes in vegetation structure
(notably, the loss of riparian habitat);
Increases in woody vegetation along rivers, in particular by
Acacia karoo, as well as infestations of invasive alien species
(e.g. Tamarix spp. and Prosopis glandulosa). These deep-rooted
species are able to readily consume groundwater. Heavily
infested areas have a significant impact on the hydrology of
catchments, as well as outcompeting indigenous species;
More localised, yet severe impacts, linked to sand mining and
other mining activities (e.g. alluvial diamond mining at the mouth
of the Gariep River and along the west coast);
Groundwater utilisation both for domestic and agricultural uses;
Construction of weirs and dams along river systems, which alters
the natural hydrological flows, which is most notable for the
Gariep River as a consequence of numerous, large
dams/impoundments in the catchment; and
Road crossings, which cause concentration of surface runoff and
localised sheet and gulley erosion in proximity to rivers and
wetlands.
Phase 6
Corridor
Rivers within the Phase 6 Corridor are all non-perennial/ephemeral in character with exception of
the Gariep River, which receives most of its flow from its headwaters in Lesotho and the Vaal
River. Most of the river habitats fall within the Namaqua Highland Ecoregion, while a smaller
number of systems occur within the Nama Karoo and the Orange River Gorge. Only 5% of the
river habitat is considered to be Threatened (i.e. Endangered and Vulnerable). The Doring River
and the lower Olifants River are the only flagship/free-flowing rivers in the corridor. The PES of
rivers is generally good, with 30% of the rivers assessed to be in fair condition, while a very small
proportion (1%) are in a poor state. Overall river sensitivity for the Phase 6 Corridor is as follows:
very high (1%), high (25%), medium (21%), and low (53%).
Approximately 98% of the Phase 6 Corridor comprises land that is largely
natural, thus only a very small proportion is transformed through
urbanisation, agricultural and mining developments. A reasonable
proportion (12%) of the corridor is protected by a number of conservation
areas (e.g. Richtersveld National Park and Namaqua National Park).
Impacts on freshwater ecosystems from associated land use activities of
the transformed landscape are relatively localised within the corridor
context. More widespread impacts to freshwater systems tend to be linked
to livestock farming practices and infestation of invasive alien plants. The

ST RAT EGIC ENVIRONMENT AL ASSESS MENT F OR GA S P I PE L INE DEVELOP MENT IN SOU T H AFRICA
WET LANDS AND R IVER S S PECIAL IST REPORT
Page 38
Gas
pipeline
corridor
Description Existing drivers and pressures
Wetland habitats occupy a very low proportion of the corridor (<1%) owing to the xeric climatic
conditions of the Succulent Karoo. Nevertheless, the area supports up to 44 wetland types,
dominated by floodplain wetland habitat along the lower Gariep River and channelled-valley
bottom wetlands within the Namaqualand Hardeveld region. One Ramsar wetland occurs within
the corridor, and is located at the mouth of the Gariep River. A moderate proportion (17%) of the
wetlands in the corridor are characterised as NFEPA wetlands, which predominantly include
floodplain wetland along the Gariep River and seeps within the Namaqualand Hardeveld region. A
small proportion (12%) of the wetland habitats are associated with the Endangered Gariep Desert
wetland vegetation group. Overall wetland sensitivity for the Phase 6 Corridor is as follows: very
high (5%), high (23%), medium (57%), and low (15%)
Threatened aquatic biota: There are no known occurrences of Red Listed Odonata and fish from
the Phase 6 Corridor. Three Red Listed amphibians are known to occur in the corridor, namely
Breviceps macrops (Near Threatened), which inhabits sandy habitats along Namaqualand coast,
Capensibufo deceptus2 (Data Deficient) which occurs in shallow temporary pools with emergent
sedge-like plants in Mountain Fynbos or Grassy Fynbos in the Fynbos Biome (IUCN, 2017) and
Breviceps branchi (Data Deficient), which is only known from a single specimen collected near
the Holgat River. One Critically Endangered reptile, Pachydactylus rangei, inhabits dry river beds
and surrounding dunes/sanding environments in the north western corner of the corridor. One
Red Listed mammal occurs within the corridor, namely the Near Threatened Otomys auratus. This
corridor supports a low diversity of (up to 6) Red Listed plants. Of these, two are Vulnerable (i.e.
Isoetes eludens and Oxalis dines), while four are Near Threatened. Overall species sensitivity for
the Phase 6 Corridor is as follows: very high (5%), high (0%), medium (32%), and low (63%).
combined effect of anthropogenic pressures results in both localised and
widespread impacts that affect functioning and integrity of freshwater
ecosystems.
Key impacts affecting freshwater ecosystems include:
Pollution from application of fertilizers, herbicides and
pesticides, as well as point-source discharges from urban
centres (e.g. Springbok and Vioolsdrif);
Grazing by livestock, particularly high/concentrated levels of
along watercourses, causing overgrazing and trampling within
and adjacent to river and wetland systems, which in turn leads
to increased erosion and changes in vegetation structure
(notably, the loss of riparian habitat);
Increases in woody vegetation along rivers, in particular by
Acacia karoo, as well as infestations of invasive alien species
(e.g. Tamarix spp. and Prosopis glandulosa). These deep-rooted
species are able to readily consume groundwater. Heavily
infested areas have a significant impact on the hydrology of
catchments, as well as outcompeting indigenous species;
More localised, yet severe impacts, linked to sand mining and
other mining activities (e.g. alluvial diamond mining at the mouth
of the Gariep River and along the west coast);
Groundwater utilisation both for domestic and agricultural uses;
Construction of weirs and dams along river systems, which alters
the natural hydrological flows, which is most notable for the
Gariep River as a consequence of numerous, large
dams/impoundments in the catchment; and
Road crossings, which cause concentration of surface runoff and
localised sheet and gulley erosion in proximity to rivers and
wetlands.
2 http://www.iucnredlist.org/details/112716175/0

ST RAT EGIC ENVIRONMENT AL ASSESS MENT F OR GA S P I PE L INE DEVELOP MENT IN SOU T H AFRICA
WET LANDS AND R IVER S S PECIAL IST REPORT
Page 39
Gas
pipeline
corridor
Description Existing drivers and pressures
Phase 7
Corridor
Rivers within the Phase 7 Corridor flow through a number of ecoregions, notably the South
Eastern Uplands, but also the Norther Eastern Uplands, North Eastern Coastal Belt and Eastern
Coastal Belt. The rivers are predominantly perennial/permanently-flowing (87%), and major river
systems include the Groot-Kei, Mbhashe, Mzimvubu, Mzimkhulu, Mkomazi, uMngeni, Thukela,
Mhlatuze and Mfolozi Rivers. Less than 30% of the rivers are considered to be Threatened (i.e.
Critically Endangered, Endangered and Vulnerable). This corridor contains a significant number of
the remaining flagship/free-flowing rivers in the country, namely: the Mfolozi and Thukela River
systems in the northern parts of the corridor, and the Mzimkhulu, Mtamvuna, Mtentu, Ntakatye,
Nqabarha, Kobonqaba River. More than 60% of the rivers are in a natural/good condition, 8% are
in a fair condition, while 30% are in a poor/very poor condition. Overall river sensitivity for the
Phase 7 Corridor is as follows: very high (14%), high (44%), medium (40%), and low (2%).
Wetland habitats within the Phase 7 Corridor occupy a large proportion of the corridor (~12%)
comprising up to 155 different wetland types dominated by channelled-valley bottom wetlands
and floodplain wetlands, particularly within the Subescarpment Grassland region. The supports
three Ramsar wetlands, including parts of the St. Lucia System, located in the north eastern
corner of the corridor, as well as uMgeni Vlei Nature Reserve (958 ha) and Ntsikeni Nature
Reserve (9,200 ha). A moderate proportion (~20%) of the wetlands in the corridor are
characterised as NFEPA wetlands. A very small proportion (3%) of the wetland habitats are
associated with the Endangered Lowveld wetland vegetation (Group 10), while 56% occur within
the Vulnerable Lowveld wetland vegetation (Group 11). Overall wetland sensitivity for the Phase 7
Corridor is as follows: high (10%), medium (52%), and low (38%).
Threatened aquatic biota: Of the ten species of Red Listed Odonata that are known to occur
within the corridor, three are listed as Endangered (i.e. Chlorolestes apricans, Diplacodes pumila
and Metacnemis valida), while five are considered Vulnerable and two near threatened. The
corridor also supports up to 15 Red Listed fish, of which seven are Endangered and three are
Vulnerable, two are near threatened and three are Date Deficient. Of the 9 Red Listed
amphibians that occur within the corridor, one is Critically Endangered (i.e. Vandijkophrynus
amatolicus), while five are Endangered, one is Vulnerable and two are Near Threatened.
Vandijkophrynus amatolicus3 has a severely fragmented population and is known only from the
Winterberg and Amathole Mountains, centred on Hogsback. The species has a very narrow EOO is
Approximately 65% of the Phase 7 Corridor, which stretches across most
of the Eastern Cape and KwaZulu-Natal, comprises land that is largely
natural, with a fairly large area (6%) degraded by existing land
management practices. A small proportion (4%) of the area is protected by
a number of small conservation areas, but also larger ones (e.g. Addo
Elephant National Park, Hluhluwe-Imfolozi Game Reserve and
Isimangaliso Wetland Park). The remaining area is transformed by
cultivation (19%), urbanisation and rural settlements (5%) and plantations
(5%).
Key impacts affecting freshwater ecosystems include:
Extensive urbanisation causing transformation and degradation
of freshwater ecosystems, notably in the greater Durban area,
which continues to expand down? along the coast, as well as
Pietermaritzburg and a within numerous of coastal towns south
of Durban;
Water quality impacts and pollution associated with urban areas
(e.g. domestic and industrial effluents, failing water treatment
infrastructure, etc.) and agriculture (e.g. pesticides, herbicides
and fertiliser applications), all of which are contaminating
receiving aquatic environments;
Very high (unacceptable) faecal contamination in the uMngeni,
Mlazi and Mdloti Rivers, as well as numerous rivers draining the
eThekwini Metropolitan and Pietermaritzburg;
Stormwater runoff from hardened surfaces and sewer
reticulation in and around urban areas;
Altered flows and water quality caused by large impoundments
(e.g. Midmar, Albert Falls, Inanda, Goedertrouw and Umtata
Dams), inter-basin transfers, which severely affect downstream
3 http://www.iucnredlist.org/details/3176/0
ST RAT EGIC ENVIRONMENT AL ASSESS MENT F OR GA S P I PE L INE DEVELOP MENT IN SOU T H AFRICA
WET LANDS AND R IVER S S PECIAL IST REPORT
Page 40
Gas
pipeline
corridor
Description Existing drivers and pressures
98 km2, and there is ongoing decline in the extent and quality of habitat. (IUCN, 2017) This
corridor supports the highest number of Red Listed reptiles, including two Vulnerable, one Near
Threatened and one Data Deficient species. The corridor also supports a high diversity of Red
Listed mammals (up to 8 species), including three that are Vulnerable and five that are Near
Threatened. This corridor supports a high diversity of (up to 39) Red Listed plants. Of these, two
are Critically Endangered (i.e. Isoetes wormaldii and Kniphofia leucocephala), while six are
Endangered, 17 are Vulnerable, 11 are Near Threatened, two are Data Deficient and one is rare.
Overall species sensitivity for the Phase 7 Corridor is as follows: very high (26%), high (10%),
medium (47%), and low (17%).
aquatic systems (e.g. channel characteristics, riparian
vegetation, thermal regimes, instream and floodplain habitats,
etc.), as well as upstream/downstream river continuity;
Illegal sand mining, as well as and other mining activities,
particularly along coastal areas;
Transformation and alteration of watercourses through canals,
diversion structures, weirs, road crossings, flood control berms;
Cultivation of wetlands and floodplains (notably sugarcane),
especially along the coastal region;
Abstraction of water for large-scale irrigation, as well as
streamflow reduction associated with extensive plantations;
Erosion and degradation, especially linked to overgrazing, which
is notable in the more rural areas; and
Excessive infestation of numerous IAPs, particularly along rivers
and around wetlands, as well as instream (e.g. Water Hyacinth).
Phase 8
Corridor
Rivers within the Phase 8 Corridor are predominantly perennial/permanently-flowing (80%), and
flow through ecoregions such as the Highveld, Northern Escarpment Mountains, North Eastern
Highlands, and down through the Lowveld. Major river systems include the Olifants, Komati,
Crocodile and Sabie Rivers. A significant proportion (approximately 71%) of the rivers are
considered to be Threatened (i.e. Critically Endangered, Endangered and Vulnerable). The Elands
River (tributary of the Olifants River) is the only flagship/free-flowing river within the corridor. Less
than 25% of the rivers are in a natural/good condition, 47% are in a fair condition, 23% are in a
poor condition, while 6% are in a poor condition. Overall river sensitivity for the Phase 8 Corridor
is as follows: very high (46%), high (32%), medium (21%), and low (<1%).
Wetland habitats within the Phase 8 Corridor occupy a large proportion of the corridor (~12%)
comprising up to 93 different wetland types, dominated by channelled-valley bottom wetlands,
and largely characteristic of the Mesic Highveld Grassland region. There are no Ramsar wetlands
that occur within the corridor, and a small proportion (~8%) of the wetlands are classified as
NFEPA wetlands, mostly in the form of channelled-valley bottoms, depressions and seeps.
Nevertheless, a significant (75%) of the wetlands are associated with Critically Endangered
wetland groups, notably the Mesic Highveld Grassland Group 4 (54%) and Group 3 (9%). Overall
wetland sensitivity for the Phase 8 Corridor is as follows: very high (12%), high (72%), medium
Approximately 65% of the Phase 8 Corridor comprises land that is largely
natural with a further 2% degraded. A fairly large proportion (16%) of the
corridor is protected by conservation areas, including parts of Kruger
National Park. The remaining area is mostly transformed by cultivation
(~19%) and plantations (11%), and to a lesser extent by urbanisation (3%)
and mining (1%).
Key impacts affecting freshwater ecosystems include:
Plantations, concentrated in the central highlands, resulting in a
number of impacts to freshwater ecosystems (e.g. streamflow
reduction particularly dry-season baseflows, increased turbidity
and sedimentation, removal of riparian vegetation and buffer
zones, invasive alien plant infestation, loss of species diversity
and abundance, etc.);
Mining related acitivities (notably for coal resources) resulting in
pollution of surface waters caused predominantly by acidification
(i.e. acid mine drainage) and other mining-related effluents;

ST RAT EGIC ENVIRONMENT AL ASSESS MENT F OR GA S P I PE L INE DEVELOP MENT IN SOU T H AFRICA
WET LANDS AND R IVER S S PECIAL IST REPORT
Page 41
Gas
pipeline
corridor
Description Existing drivers and pressures
(13%), and low (3%).
Threatened aquatic biota: The corridor supports two species of Odonata that are listed as
Endangered (i.e. Ceriagrion suave and Diplacodes pumila), along with three that are Near
Threatened. There are also 13 Red Listed fish that are known to inhabit the corridor, including the
Critically Endangered Chiloglanis bifurcus and Enteromius treurensi. Chiloglanis bifurcus4 is an
instream species, endemic to the Inkomati River System and within this system it is restricted to
altitudes between 900 metres above sea level (m.a.s.l) to 1200 m.a.s.l. In addition there are also
3 endangered fish species, one Vulnerable, five Near Threatened, and two Data Deficient. There
are no Red Listed amphibians that are known to occur within the corridor. Only one Red Listed
reptile occurs within the corridor, namely the Near Threatened Macrelaps microlepidotus. The
corridor supports a high diversity of Red Listed mammals (up to 7 species), including three that
are Vulnerable and four that are Near Threatened. This corridor supports a moderate diversity of
Red Listed plants, including one that is Critically Endangered (i.e. Aloe simii) and one that is
Endangered (i.e. Disa zuluensis). The majority of the Red Listed plants occurring with the corridor
are either Vulnerable (7 species) or Near Threatened (7 species), while one is Data Deficient and
two are rare. Overall species sensitivity for the Phase 8 Corridor is as follows: very high (41%),
high (34%), medium (9%), and low (16%).
Run-of-river abstraction and small farm dams for irrigation,
which is more pronounced in the western parts of the corridor;
Urbanisation in and around towns such as Emalahleni,
Middleberg, Ermelo and Nelspruit placing increased pressure on
water resources, largely due to increased stormwater runoff and
decreased water quality from both point and non-point sources
linked to residential and industrial areas);
Very high (unacceptable) faecal pollution in regions such as
Witbank/Middleburg and Nelspruit, which is affecting river
systems such as the Crocodile and Olifants; and
Extensive maize cultivation and livestock farming resulting in
removal and/or degradation of freshwater habitat.
Inland
Corridor
Rivers within the Inland Corridor are mostly ephemeral/non-perennial (95%), and are largely
characteristic of the Great Karoo ecoregion, but also form part of the Nama Karoo and Drought
Corridor ecoregions. Major river systems include the Dwyka, Kariega and Sondags Rivers. Less
than 25% of the river habitat in the corridor is currently Threatened (i.e. Critically Endangered and
Endangered). The rivers are mostly in a natural/good condition (60%), 34% of rivers are in a fair
condition, while 6% are in a poor condition. Overall river sensitivity for the Inland Corridor is as
follows: very high (14%), high (50%), medium (31%), and low (5%).
Wetland habitats within the Inland Corridor occupy a fair proportion of the corridor (~7%), with up
to 62 different wetland types dominated by channelled-valley bottom wetlands and depressions
that are largely characteristic of the Nama Karoo. There are no Ramsar wetlands within the
corridor, and a very small proportion (~1%) of wetlands are classified as NFEPA wetlands.
Nevertheless, a significant portion (79%) of the wetlands are associated with Critically
Almost the entire (99%) area of the Inland Corridor comprises land that is
largely natural, with only a very small proportion transformed by cultivation
(1%) and urbanisation (<1%). A very small proportion (3%) of the corridor
is protected by a few conservation areas (e.g. Karoo National Park and
Tankwa Karoo National Park). Impacts on freshwater ecosystems from
associated land use activities of the transformed landscape are thus
relatively localised. More widespread impacts to freshwater systems tend
to be linked to livestock farming practices and infestation of invasive alien
plants. The combined effect of anthropogenic pressures results in both
localised and widespread impacts that affect functioning and integrity of
freshwater ecosystems.
4 http://www.iucnredlist.org/details/4632/0
ST RAT EGIC ENVIRONMENT AL ASSESS MENT F OR GA S P I PE L INE DEVELOP MENT IN SOU T H AFRICA
WET LANDS AND R IVER S S PECIAL IST REPORT
Page 42
Gas
pipeline
corridor
Description Existing drivers and pressures
Endangered wetland groups, notably the Lower Nama Karoo (60%) and the Rainshadow Valley
Karoo (11%). Overall wetland sensitivity for the Inland Corridor is as follows: very high (26%), high
(56%), medium (4%), and low (14%).
Threatened aquatic biota: There are no Red Listed species of Odonata known to occur within the
Inland Corridor. Only two Red Listed fish occur within the corridor, namely the Endangered
Pseudobarbus asper, and the Data Deficient Sandelia capensis. There are no Red Listed
amphibians and reptiles that are known to occur within the Inland Corridor. The corridor is most
notable in terms of supporting significant populations of the Critically Endangered Riverine Rabbit
Bunolagus monticularis, which is restricted to the semi-arid Karoo, with an estimated EOO of
54,227 km2 and AOO of 2,943 km2 (2016 Mammal Red List Bunolagus monticularis CR). The
Riverine Rabbit inhabits dense, discontinuous scrub vegetation along seasonal river beds and is
dependent on soft, deep alluvial spoils along these river courses, for constructing burrows in
order to breed. Other Red Listed mammals include the Near Threatened Serval Leptailurus and
the Near Threatened Otomys auratus. This corridor supports the lowest number of Red Listed
plants, with only one Vulnerable plant (i.e. Lachenalia longituba) and one rare plant (i.e.
Pelargonium denticulatum) occurring within the corridor. Overall species sensitivity for the Inland
Corridor is as follows: very high (11%), high (13%), medium (6%), and low (70%).
Key impacts affecting freshwater ecosystems include:
Weirs and dams (including large water supply dams, e.g. De
Hoop, Leeugamka, Vanrynevelspas), which affect instream and
riparian habitat continuity, as well as regulate flows downstream;
Livestock grazing and trampling (including overgrazing,
particularly in more rural areas), leading to increased erosion
and sedimentation of systems;
Intensive cultivation immediately adjacent and along the banks
of rivers;
Encroachment and infestation of woody vegetation, including
invasive Tamarix spp.; and
Channel incision and headcut erosion, resulting in lowered
groundwater table and drying of riparian and wetland habitats.
1
The following figures (Figure 2 to 5) show the distribution of freshwater features (i.e. rivers, wetlands, flora and fauna) associated with the various gas corridors as 2
developed following the collation and compilation of available spatial datasets (see data sources in Section 4.2). 3
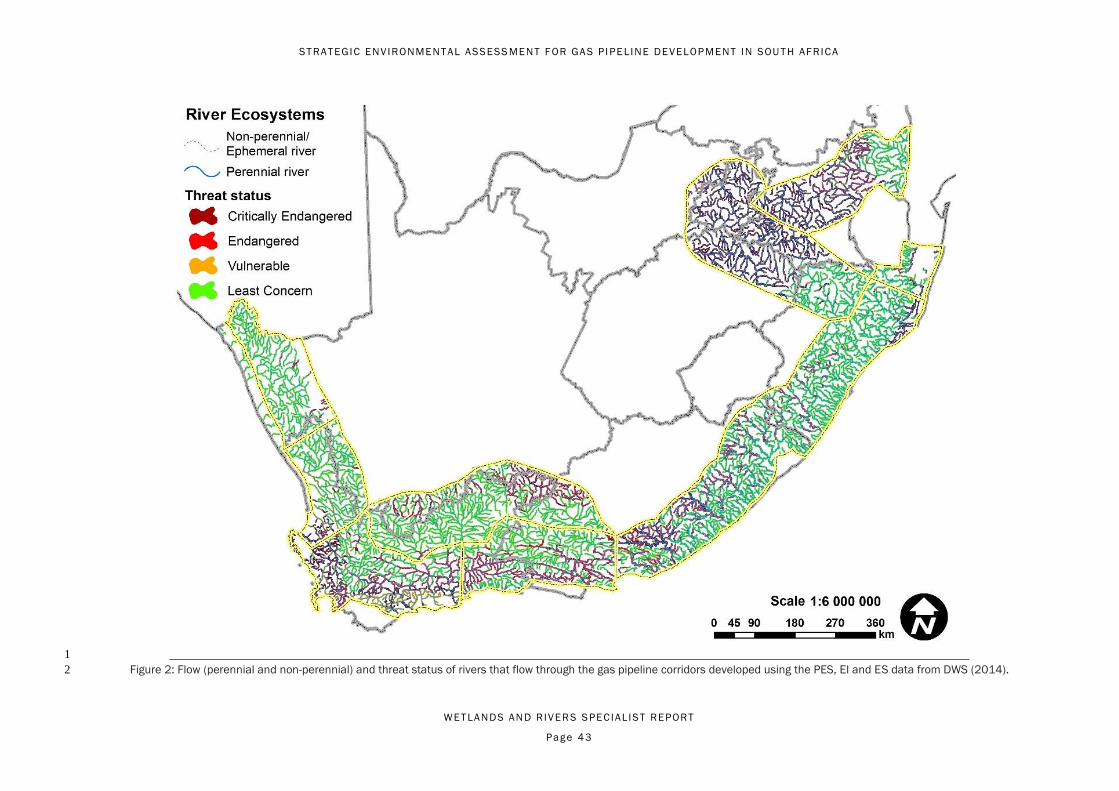
ST RAT EGIC ENVIRONMENT AL ASSESS MENT F OR GA S P I PE L INE DEVELOP MENT IN SOU T H AFRICA
WET LANDS AND R IVER S S PECIAL IST REPORT
Page 43
1
Figure 2: Flow (perennial and non-perennial) and threat status of rivers that flow through the gas pipeline corridors developed using the PES, EI and ES data from DWS (2014). 2

ST RAT EGIC ENVIRONMENT AL ASSESS MENT F OR GA S P I PE L INE DEVELOP MENT IN SOU T H AFRICA
WET LANDS AND R IVER S S PECIAL IST REPORT
Page 44
1
Figure 3: Wetland threat status based on the national wetland vegetation group regions of Nel and Driver (2012) applied to all wetlands of the collated wetland coverage developed for the 2 gas pipeline corridors 3
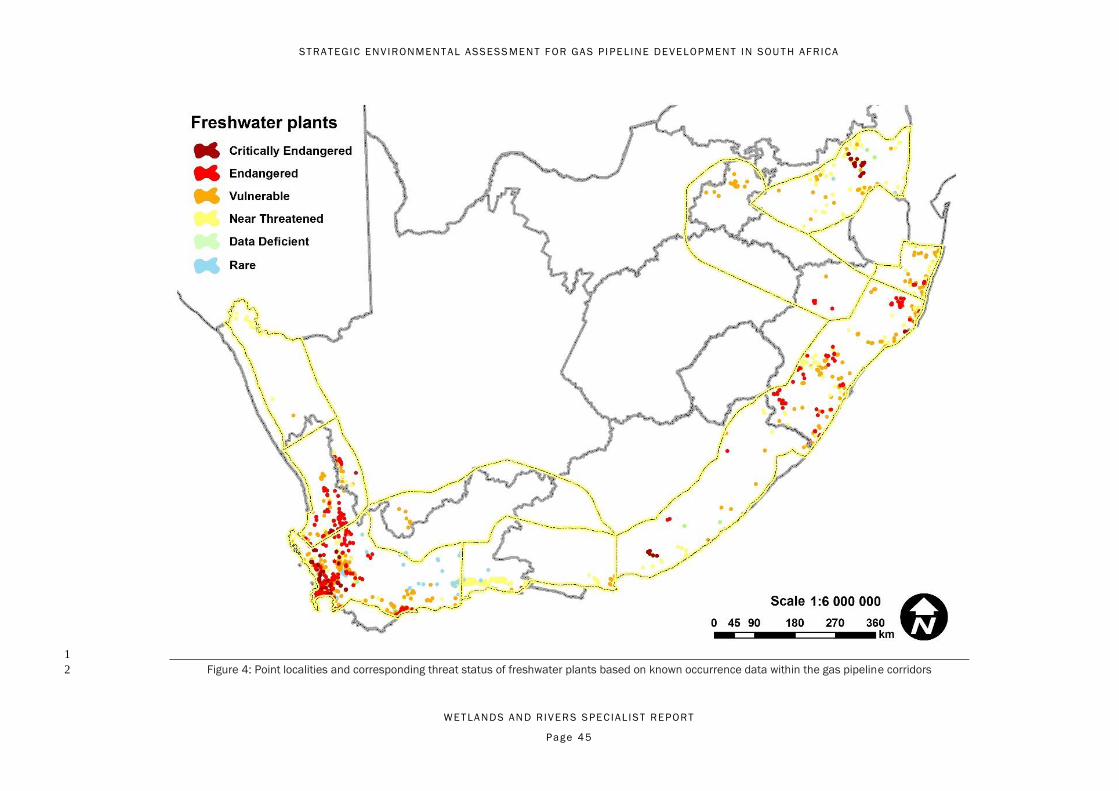
ST RAT EGIC ENVIRONMENT AL ASSESS MENT F OR GA S P I PE L INE DEVELOP MENT IN SOU T H AFRICA
WET LANDS AND R IVER S S PECIAL IST REPORT
Page 45
1
Figure 4: Point localities and corresponding threat status of freshwater plants based on known occurrence data within the gas pipeline corridors 2
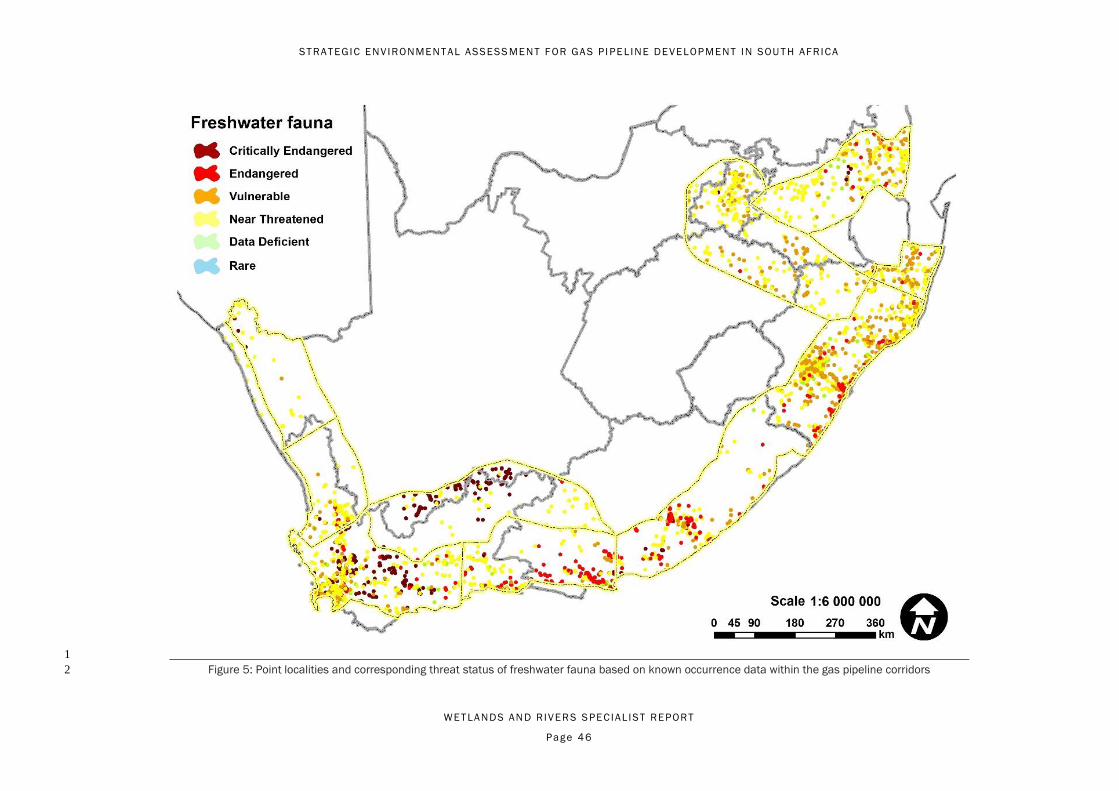
ST RAT EGIC ENVIRONMENT AL ASSESS MENT F OR GA S P I PE L INE DEVELOP MENT IN SOU T H AFRICA
WET LANDS AND R IVER S S PECIAL IST REPORT
Page 46
1
Figure 5: Point localities and corresponding threat status of freshwater fauna based on known occurrence data within the gas pipeline corridors 2

ST RAT EGIC ENVIRONMENT AL ASSESS MENT F OR GA S P I PE L INE DEVELOP MENT IN SOU T H AFRICA
WET LANDS AND R IVER S S PECIAL IST REPORT
Page 47
6 SENSITIVITY MAPPING 1
6.1 Identification sensitivity criteria for features 2
Table 6 provides a list and description of the sensitivity criteria considered during this assessment of the proposed Gas Pipeline corridors. 3
4
Table 6: Data and criteria used to assign sensitivity to freshwater ecosystems within the proposed Gas Pipeline corridors. 5
Category Feature Class Data Source + Date of Publications Data Description, Preparation and Processing
Freshwater
ecosystems
Wetlands Combined wetlands layer comprising:
NFEPA (2011); Provincial Wetland Probability Mapping (2017); Fine
scale planning - Western Cape (2017); Conservation Plans,
Biodiversity Sector Plans (BSP’s), and Critical Biodiversity Areas
(CBA’s) and Ecological Support Areas (ESAs) - KZN (2007) and
Northern Cape (2016); National wetland vegetation groups (2012);
KZN wetlands/vegetation types (2011); KZN Priority Wetlands; Ramsar
Sites.
The combined wetland layer was processed according to two
metrics as described in more detail in Section 4.1.
Threat:
National Wetland Vegetation Groups (2012)
Sensitivity:
Ramsar wetlands, Threatened wetlands, Irreplaceable and Optimal
CBAs as aquatic features, KZN priority wetlands, NFEPA wetlands,
ESAs as aquatic features, wetland probability mapping, and ONAs
as aquatic features.
Rivers PES EI and ES DWS Resource Quality Information Services (2014),
using the NFEPA rivers coverage (2011)
Metrics were applied that integrate data pertaining to river
ecosystems to define river threat status and river
importance/sensitivity (as described in Section 4.1). PES, river
types and river length were used to derive river threat using
updated PES data (2014) based on thresholds defined in the
2011 NBA. River sensitivity/importance was based on the 2014 EI
and ES dataset.
Overall river sensitivity scores were determined as: Threat Score
(PES score and river length as per NBA) + (EI+ES score/ Stream
Order)
Freshwater
biota
Flora:
Plants
Raimondo et al. (2009), with spatial data provided from the SANBI
Threatened Species Programme database (2018)
Species of conservation concern, and their respective conservation
status (i.e. CR, EN, VU, NT, DD and rare), that inhabit freshwater
ecosystems and adjacent fringe habitats/ buffers were selected
based on known point localities, and assigned to sub-quaternary
(SQ4) catchments. The SQ4 catchments were then classified into
four sensitivity classes based on presence/ absence of selected
Fauna:
Aquatic macro-
invertebrates
DWS Resource Quality Information Services (2015)
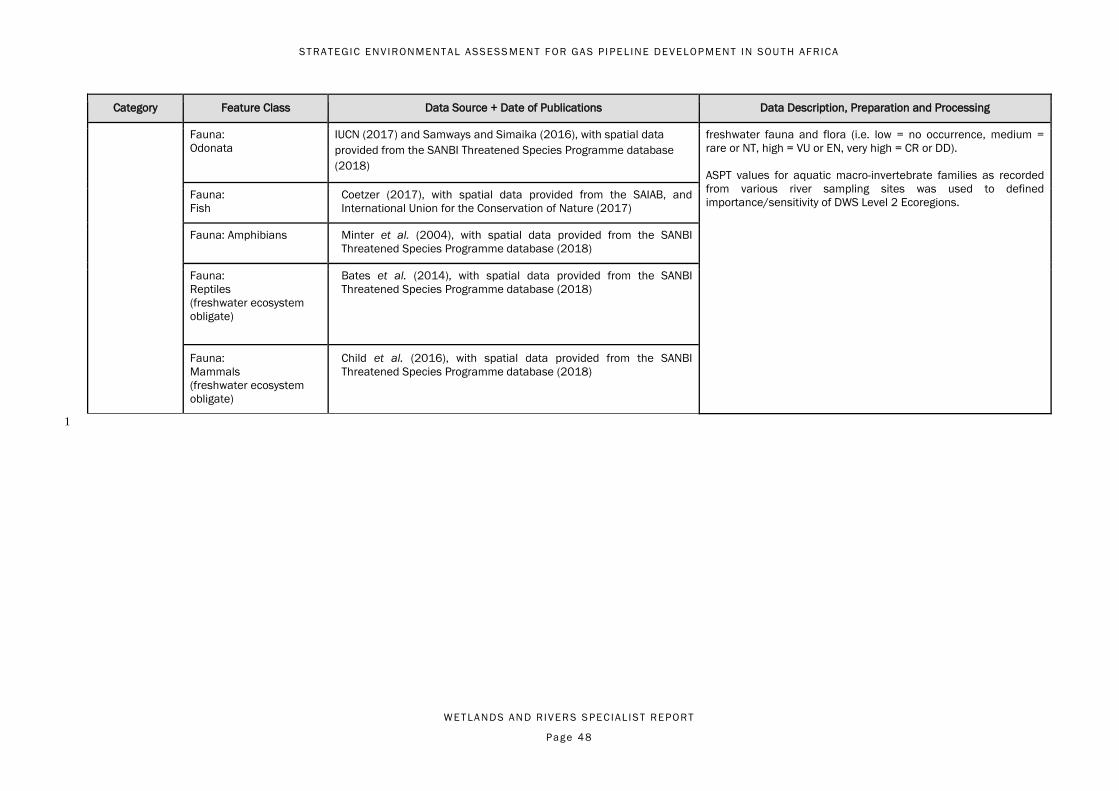
ST RAT EGIC ENVIRONMENT AL ASSESS MENT F OR GA S P I PE L INE DEVELOP MENT IN SOU T H AFRICA
WET LANDS AND R IVER S S PECIAL IST REPORT
Page 48
Category Feature Class Data Source + Date of Publications Data Description, Preparation and Processing
Fauna:
Odonata
IUCN (2017) and Samways and Simaika (2016), with spatial data
provided from the SANBI Threatened Species Programme database
(2018)
freshwater fauna and flora (i.e. low = no occurrence, medium =
rare or NT, high = VU or EN, very high = CR or DD).
ASPT values for aquatic macro-invertebrate families as recorded
from various river sampling sites was used to defined
importance/sensitivity of DWS Level 2 Ecoregions. Fauna:
Fish
Coetzer (2017), with spatial data provided from the SAIAB, and
International Union for the Conservation of Nature (2017)
Fauna: Amphibians
Minter et al. (2004), with spatial data provided from the SANBI
Threatened Species Programme database (2018)
Fauna:
Reptiles
(freshwater ecosystem
obligate)
Bates et al. (2014), with spatial data provided from the SANBI
Threatened Species Programme database (2018)
Fauna:
Mammals
(freshwater ecosystem
obligate)
Child et al. (2016), with spatial data provided from the SANBI
Threatened Species Programme database (2018)
1
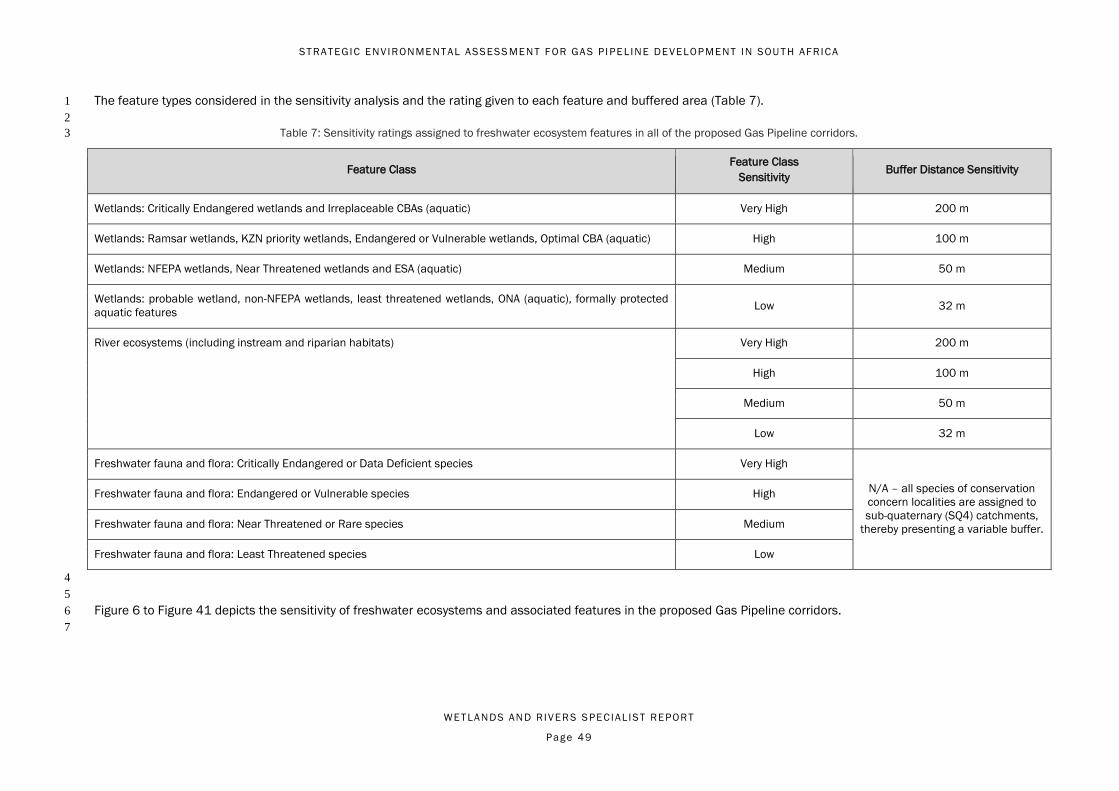
ST RAT EGIC ENVIRONMENT AL ASSESS MENT F OR GA S P I PE L INE DEVELOP MENT IN SOU T H AFRICA
WET LANDS AND R IVER S S PECIAL IST REPORT
Page 49
The feature types considered in the sensitivity analysis and the rating given to each feature and buffered area (Table 7). 1
2
Table 7: Sensitivity ratings assigned to freshwater ecosystem features in all of the proposed Gas Pipeline corridors. 3
Feature Class Feature Class
Sensitivity Buffer Distance Sensitivity
Wetlands: Critically Endangered wetlands and Irreplaceable CBAs (aquatic) Very High 200 m
Wetlands: Ramsar wetlands, KZN priority wetlands, Endangered or Vulnerable wetlands, Optimal CBA (aquatic) High 100 m
Wetlands: NFEPA wetlands, Near Threatened wetlands and ESA (aquatic) Medium 50 m
Wetlands: probable wetland, non-NFEPA wetlands, least threatened wetlands, ONA (aquatic), formally protected
aquatic features Low 32 m
River ecosystems (including instream and riparian habitats) Very High 200 m
High 100 m
Medium 50 m
Low 32 m
Freshwater fauna and flora: Critically Endangered or Data Deficient species Very High
N/A – all species of conservation
concern localities are assigned to
sub-quaternary (SQ4) catchments,
thereby presenting a variable buffer.
Freshwater fauna and flora: Endangered or Vulnerable species High
Freshwater fauna and flora: Near Threatened or Rare species Medium
Freshwater fauna and flora: Least Threatened species Low
4
5
Figure 6 to Figure 41 depicts the sensitivity of freshwater ecosystems and associated features in the proposed Gas Pipeline corridors. 6
7

ST RAT EGIC ENVIRONMENT AL ASSESS MENT F OR GA S P I PE L INE DEVELOP MENT IN SOU T H AFRICA
WET LANDS AND R IVER S S PECIAL IST REPORT
Page 50
6.2 Phase 1 Corridor 1
6.2.1 Rivers 2
3 4
Figure 6: River threat status and sensitivity calculated for sub-quaternary catchments in the gas pipeline phase 1 corridor using PES, EI and ES data from DWS (2014). 5
6
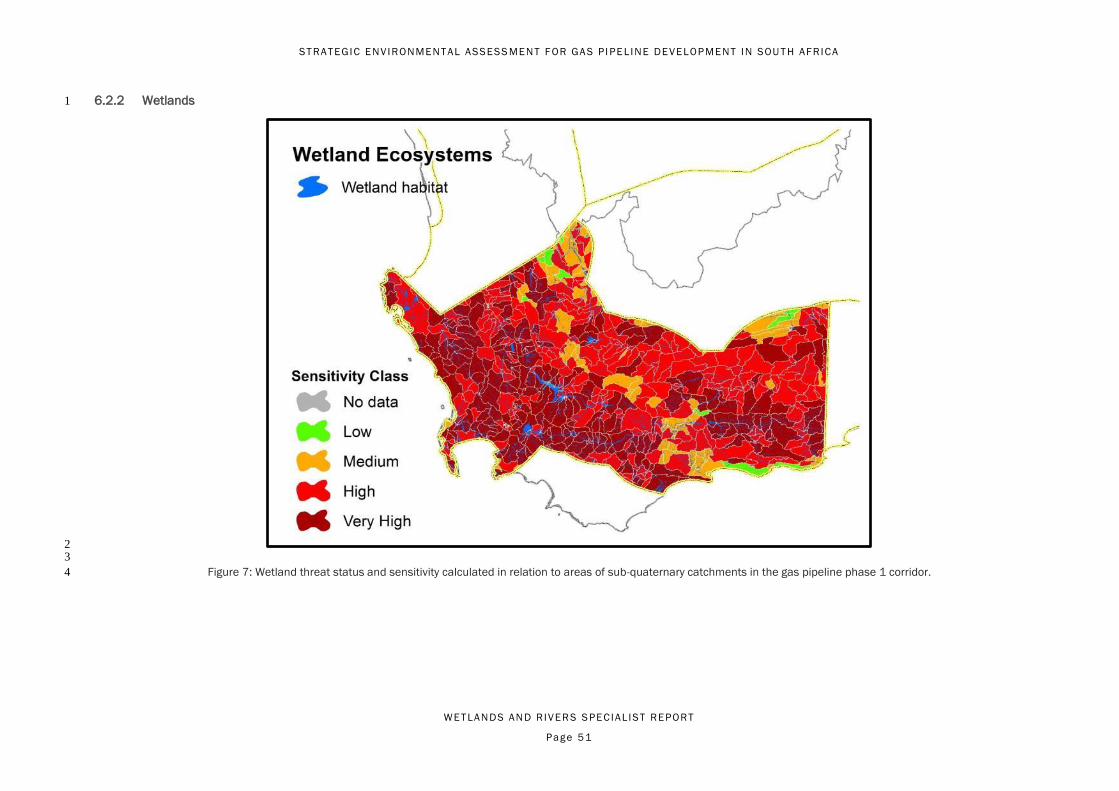
ST RAT EGIC ENVIRONMENT AL ASSESS MENT F OR GA S P I PE L INE DEVELOP MENT IN SOU T H AFRICA
WET LANDS AND R IVER S S PECIAL IST REPORT
Page 51
6.2.2 Wetlands 1
2 3
Figure 7: Wetland threat status and sensitivity calculated in relation to areas of sub-quaternary catchments in the gas pipeline phase 1 corridor. 4

ST RAT EGIC ENVIRONMENT AL ASSESS MENT F OR GA S P I PE L INE DEVELOP MENT IN SOU T H AFRICA
WET LANDS AND R IVER S S PECIAL IST REPORT
Page 52
6.2.3 Freshwater biota (fauna and flora) 1
2 3
Figure 8: Threat and sensitivity status calculated for different freshwater taxonomic groups (flora and fauna) in the gas 4 pipeline phase 1 corridor in relation to sub-quaternary catchments. 5

ST RAT EGIC ENVIRONMENT AL ASSESS MENT F OR GA S P I PE L INE DEVELOP MENT IN SOU T H AFRICA
WET LANDS AND R IVER S S PECIAL IST REPORT
Page 53
6.2.4 Freshwater ecosystems and biota (combined) 1
2
3 4
Figure 9: Integrated sensitivity and threat status map for freshwater ecosystems and biota in the gas pipeline phase 1 corridor. 5
6

ST RAT EGIC ENVIRONMENT AL ASSESS MENT F OR GA S P I PE L INE DEVELOP MENT IN SOU T H AFRICA
WET LANDS AND R IVER S S PECIAL IST REPORT
Page 54
6.3 Phase 2 Corridor 1
6.3.1 Rivers 2
3
4 5
Figure 10: River threat status and sensitivity calculated for sub-quaternary catchments in the gas pipeline phase 2 corridor using PES, EI and ES data from DWS (2014). 6
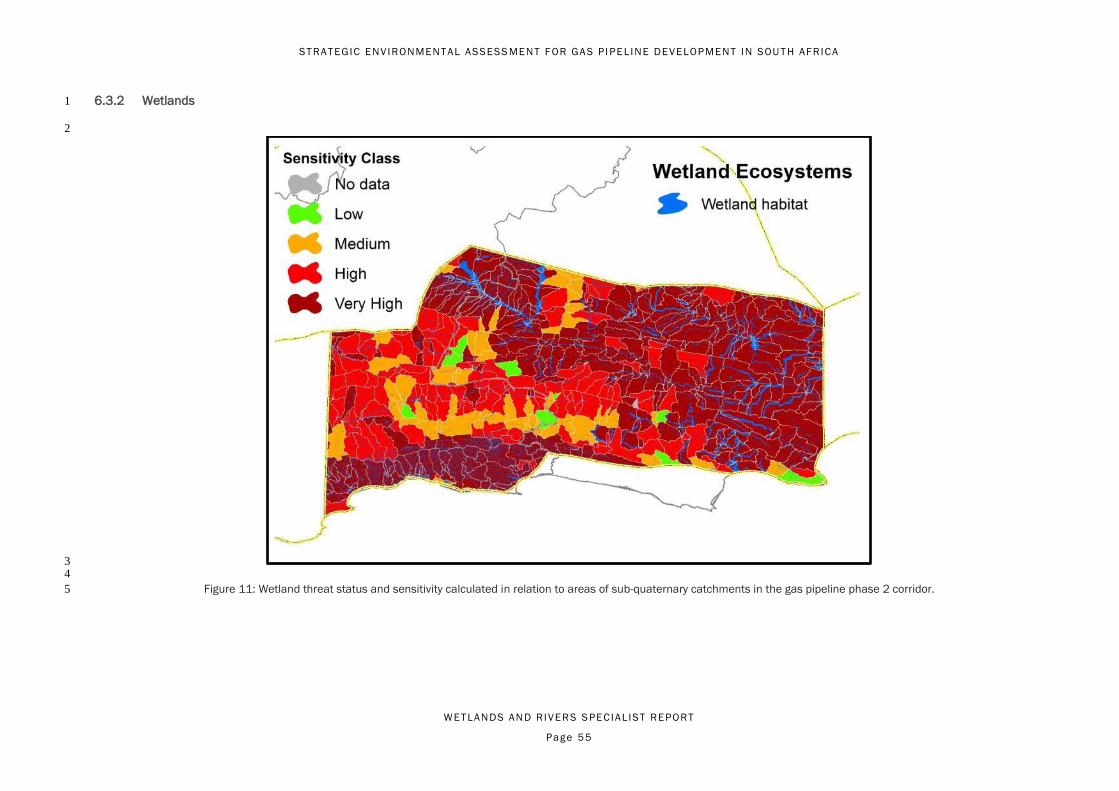
ST RAT EGIC ENVIRONMENT AL ASSESS MENT F OR GA S P I PE L INE DEVELOP MENT IN SOU T H AFRICA
WET LANDS AND R IVER S S PECIAL IST REPORT
Page 55
6.3.2 Wetlands 1
2
3 4
Figure 11: Wetland threat status and sensitivity calculated in relation to areas of sub-quaternary catchments in the gas pipeline phase 2 corridor. 5
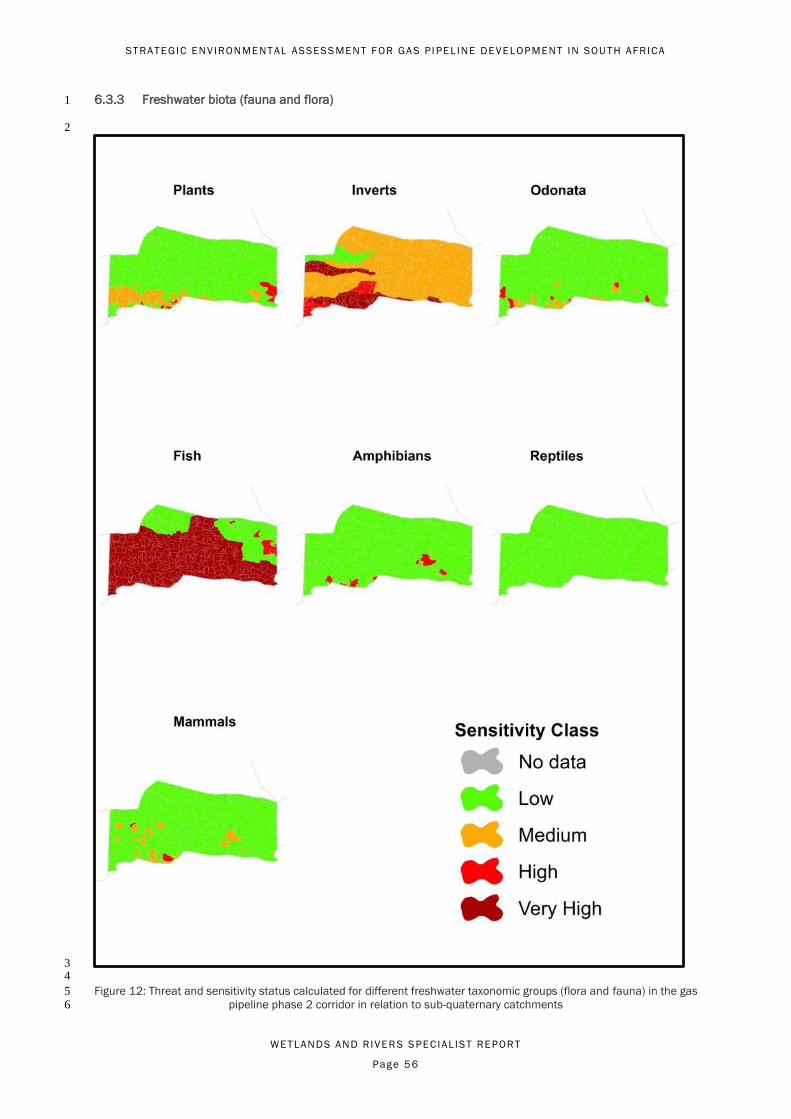
ST RAT EGIC ENVIRONMENT AL ASSESS MENT F OR GA S P I PE L INE DEVELOP MENT IN SOU T H AFRICA
WET LANDS AND R IVER S S PECIAL IST REPORT
Page 56
6.3.3 Freshwater biota (fauna and flora) 1
2
3 4
Figure 12: Threat and sensitivity status calculated for different freshwater taxonomic groups (flora and fauna) in the gas 5 pipeline phase 2 corridor in relation to sub-quaternary catchments 6

ST RAT EGIC ENVIRONMENT AL ASSESS MENT F OR GA S P I PE L INE DEVELOP MENT IN SOU T H AFRICA
WET LANDS AND R IVER S S PECIAL IST REPORT
Page 57
6.3.4 Freshwater ecosystems and biota (combined) 1
2
3 4
Figure 13: Integrated sensitivity and threat status map for freshwater ecosystems and biota in the gas pipeline phase 2 corridor. 5
6
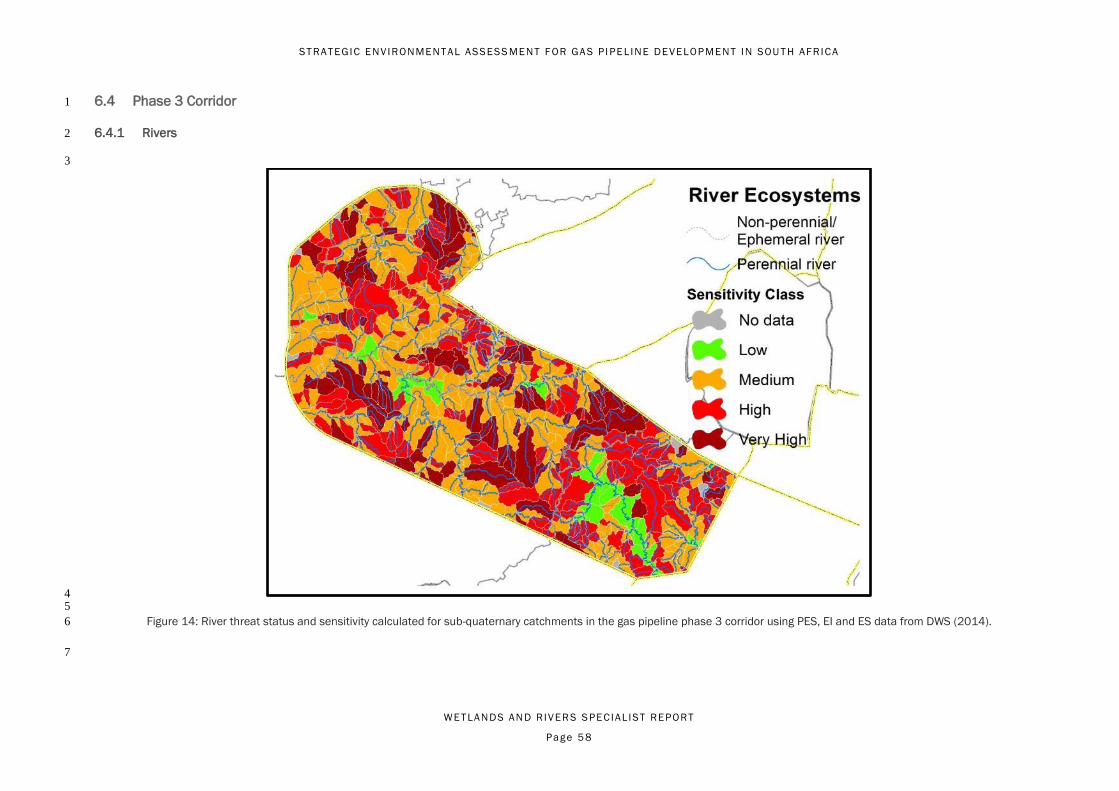
ST RAT EGIC ENVIRONMENT AL ASSESS MENT F OR GA S P I PE L INE DEVELOP MENT IN SOU T H AFRICA
WET LANDS AND R IVER S S PECIAL IST REPORT
Page 58
6.4 Phase 3 Corridor 1
6.4.1 Rivers 2
3
4 5
Figure 14: River threat status and sensitivity calculated for sub-quaternary catchments in the gas pipeline phase 3 corridor using PES, EI and ES data from DWS (2014). 6
7

ST RAT EGIC ENVIRONMENT AL ASSESS MENT F OR GA S P I PE L INE DEVELOP MENT IN SOU T H AFRICA
WET LANDS AND R IVER S S PECIAL IST REPORT
Page 59
6.4.2 Wetlands 1
2 3
Figure 15: Wetland threat status and sensitivity calculated in relation to areas of sub-quaternary catchments in the gas pipeline phase 3 corridor. 4

ST RAT EGIC ENVIRONMENT AL ASSESS MENT F OR GA S P I PE L INE DEVELOP MENT IN SOU T H AFRICA
WET LANDS AND R IVER S S PECIAL IST REPORT
Page 60
6.4.3 Freshwater biota (fauna and flora) 1
2 3
Figure 16: Threat and sensitivity status calculated for different freshwater taxonomic groups (flora and fauna) in the gas 4 pipeline phase 3 corridor in relation to sub-quaternary catchments5
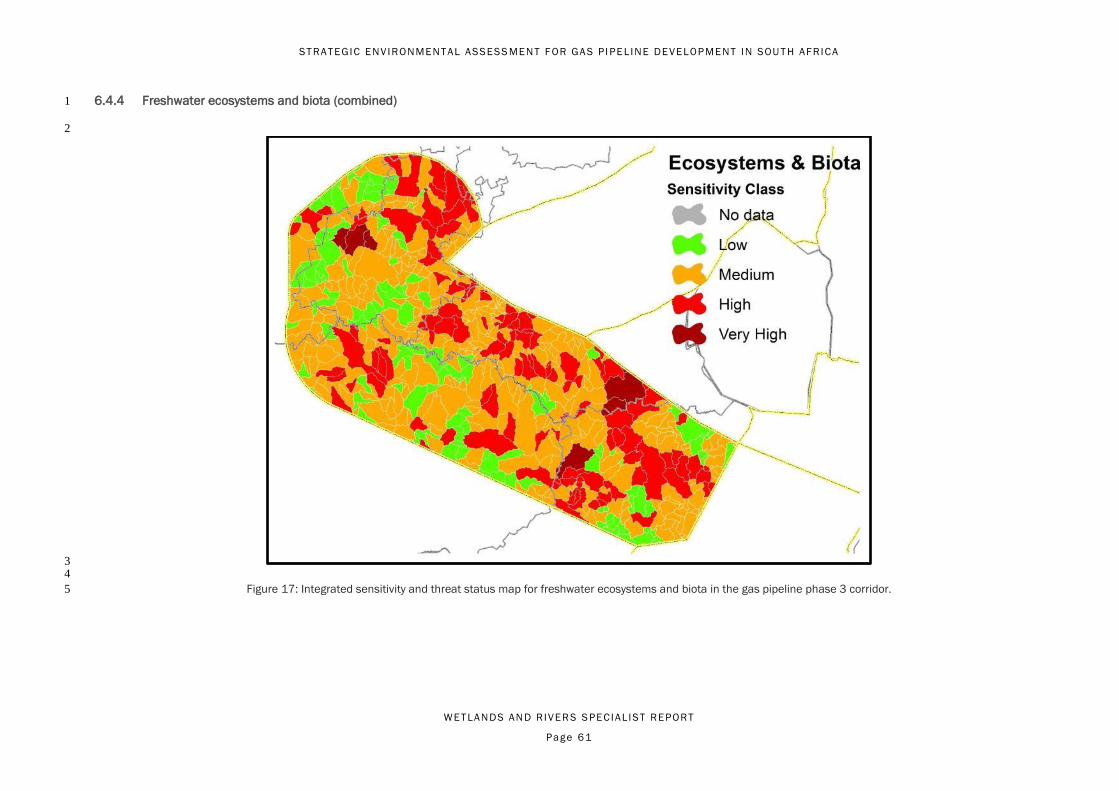
ST RAT EGIC ENVIRONMENT AL ASSESS MENT F OR GA S P I PE L INE DEVELOP MENT IN SOU T H AFRICA
WET LANDS AND R IVER S S PECIAL IST REPORT
Page 61
6.4.4 Freshwater ecosystems and biota (combined) 1
2
3 4
Figure 17: Integrated sensitivity and threat status map for freshwater ecosystems and biota in the gas pipeline phase 3 corridor. 5

ST RAT EGIC ENVIRONMENT AL ASSESS MENT F OR GA S P I PE L INE DEVELOP MENT IN SOU T H AFRICA
WET LANDS AND R IVER S S PECIAL IST REPORT
Page 62
6.5 Phase 4 Corridor 1
6.5.1 Rivers 2
3
4 5
Figure 18: River threat status and sensitivity calculated for sub-quaternary catchments in the gas pipeline phase 4 corridor using PES, EI and ES data from DWS (2014). 6
7
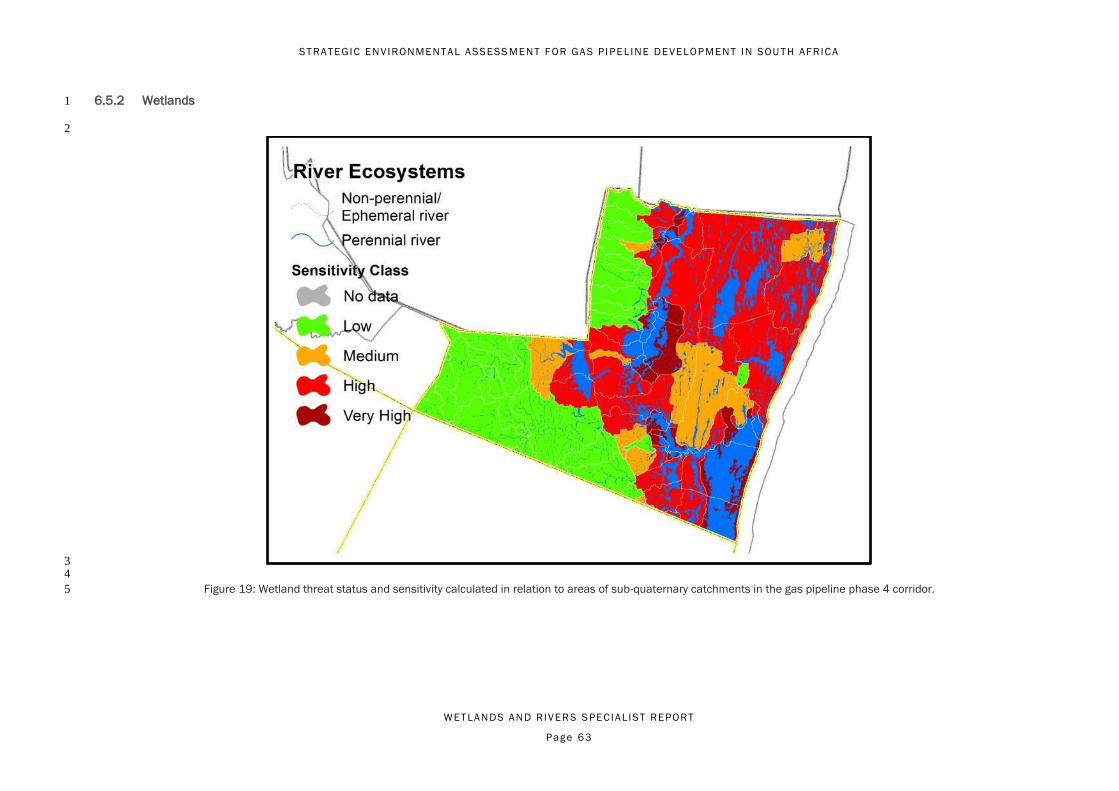
ST RAT EGIC ENVIRONMENT AL ASSESS MENT F OR GA S P I PE L INE DEVELOP MENT IN SOU T H AFRICA
WET LANDS AND R IVER S S PECIAL IST REPORT
Page 63
6.5.2 Wetlands 1
2
3 4
Figure 19: Wetland threat status and sensitivity calculated in relation to areas of sub-quaternary catchments in the gas pipeline phase 4 corridor. 5

ST RAT EGIC ENVIRONMENT AL ASSESS MENT F OR GA S P I PE L INE DEVELOP MENT IN SOU T H AFRICA
WET LANDS AND R IVER S S PECIAL IST REPORT
Page 64
6.5.3 Freshwater biota (fauna and flora) 1
2 3
Figure 20: Threat and sensitivity status calculated for different freshwater taxonomic groups (flora and fauna) in the gas 4 pipeline phase 4 corridor in relation to sub-quaternary catchments5

ST RAT EGIC ENVIRONMENT AL ASSESS MENT F OR GA S P I PE L INE DEVELOP MENT IN SOU T H AFRICA
WET LANDS AND R IVER S S PECIAL IST REPORT
Page 65
6.5.4 Freshwater ecosystems and biota (combined) 1
2
3 4
Figure 21: Integrated sensitivity and threat status map for freshwater ecosystems and biota in the gas pipeline phase 4 corridor. 5
6

ST RAT EGIC ENVIRONMENT AL ASSESS MENT F OR GA S P I PE L INE DEVELOP MENT IN SOU T H AFRICA
WET LANDS AND R IVER S S PECIAL IST REPORT
Page 66
6.6 Phase 5 Corridor 1
6.6.1 Rivers 2
3
4 5
Figure 22: River threat status and sensitivity calculated for sub-quaternary catchments in the gas pipeline phase 5 corridor using PES, EI and ES data from DWS (2014). 6
7
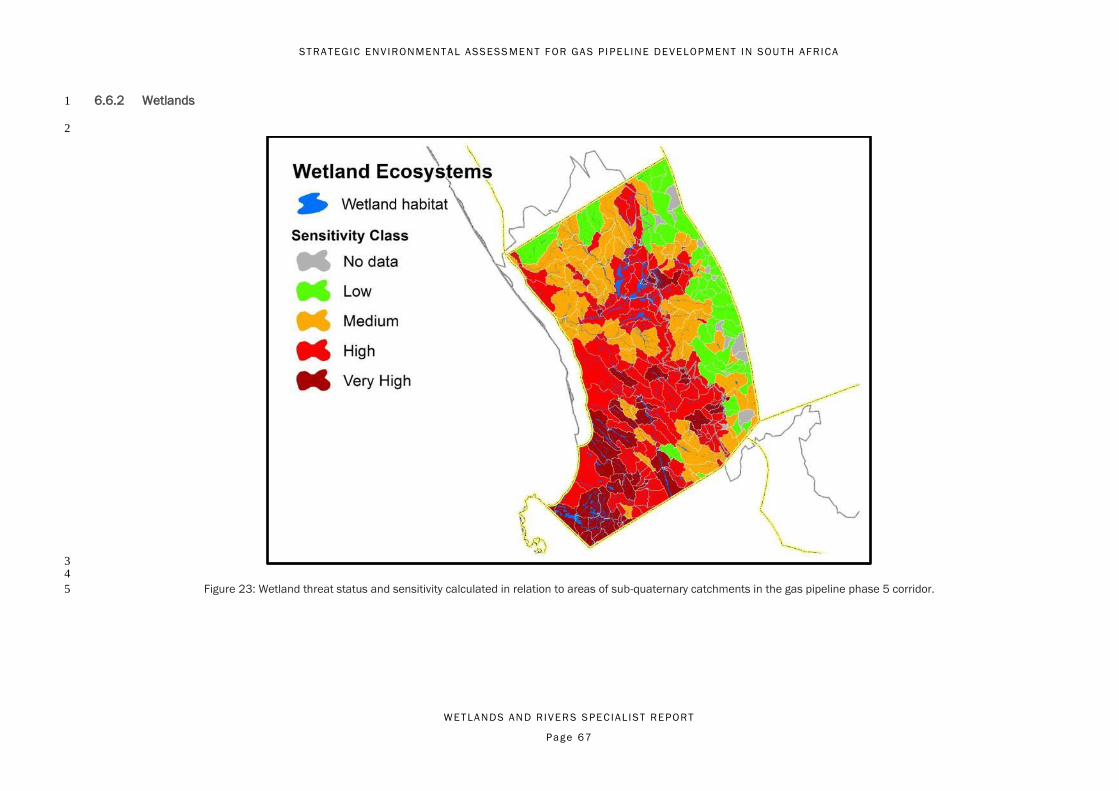
ST RAT EGIC ENVIRONMENT AL ASSESS MENT F OR GA S P I PE L INE DEVELOP MENT IN SOU T H AFRICA
WET LANDS AND R IVER S S PECIAL IST REPORT
Page 67
6.6.2 Wetlands 1
2
3 4
Figure 23: Wetland threat status and sensitivity calculated in relation to areas of sub-quaternary catchments in the gas pipeline phase 5 corridor. 5
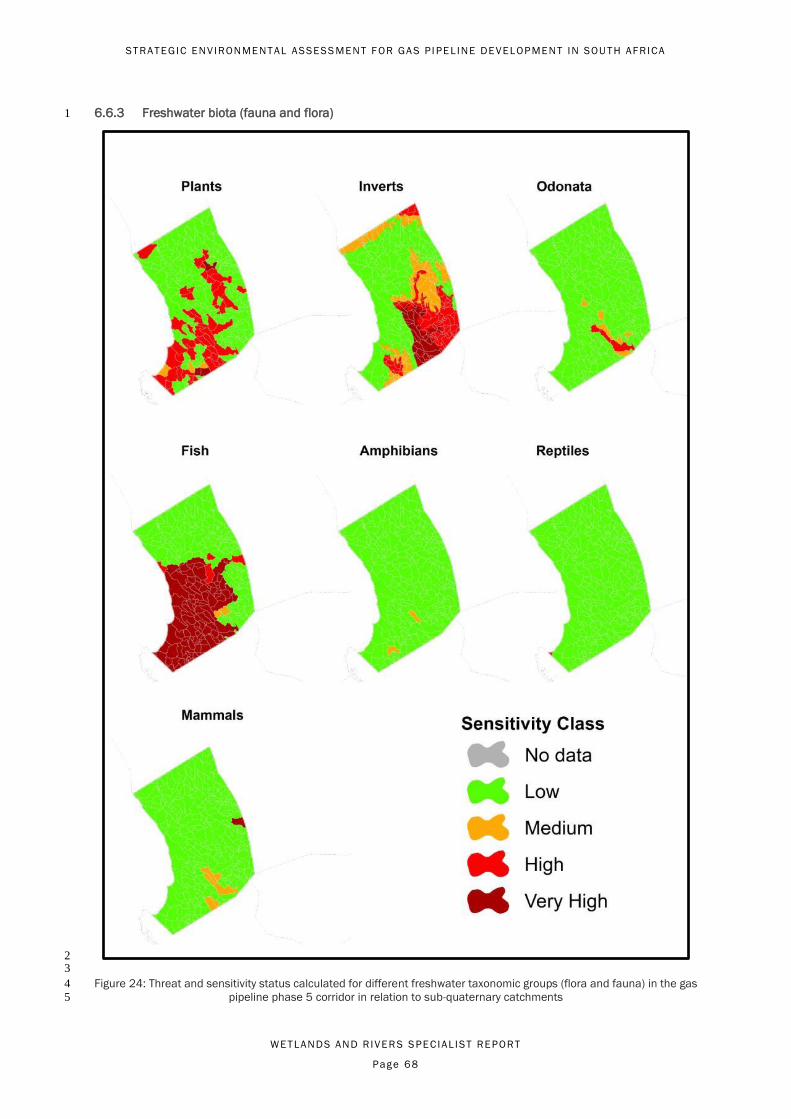
ST RAT EGIC ENVIRONMENT AL ASSESS MENT F OR GA S P I PE L INE DEVELOP MENT IN SOU T H AFRICA
WET LANDS AND R IVER S S PECIAL IST REPORT
Page 68
6.6.3 Freshwater biota (fauna and flora) 1
2 3
Figure 24: Threat and sensitivity status calculated for different freshwater taxonomic groups (flora and fauna) in the gas 4 pipeline phase 5 corridor in relation to sub-quaternary catchments5
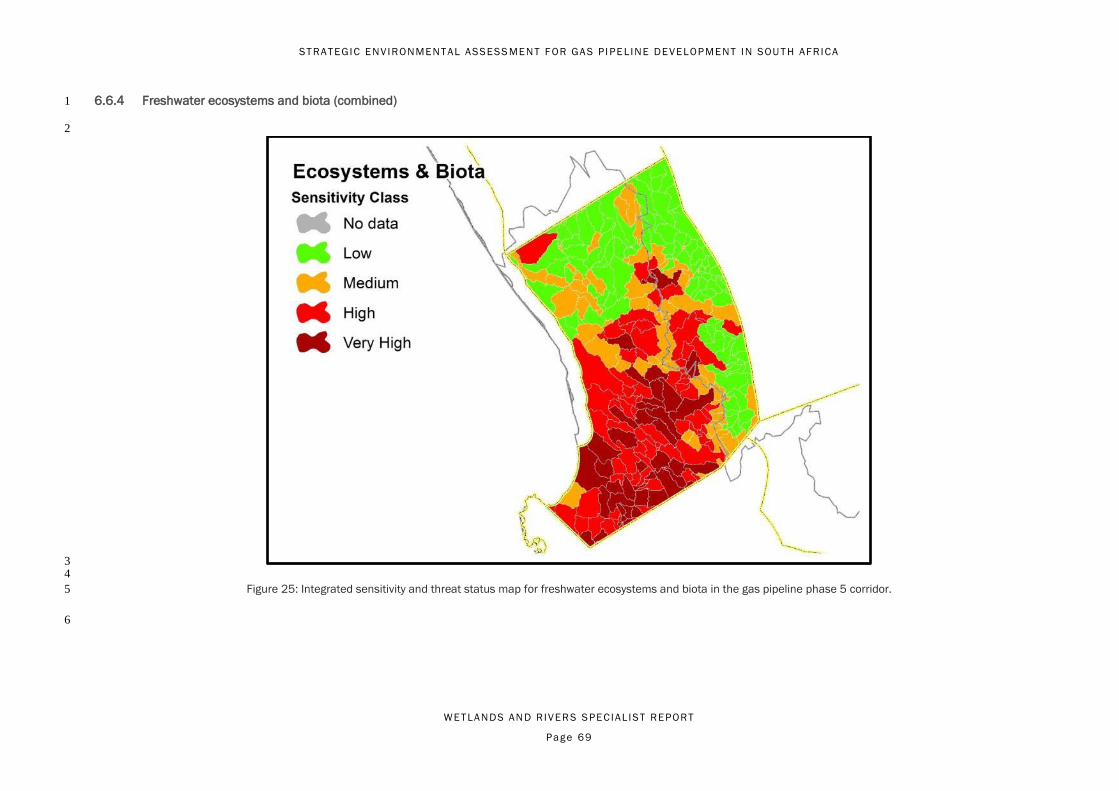
ST RAT EGIC ENVIRONMENT AL ASSESS MENT F OR GA S P I PE L INE DEVELOP MENT IN SOU T H AFRICA
WET LANDS AND R IVER S S PECIAL IST REPORT
Page 69
6.6.4 Freshwater ecosystems and biota (combined) 1
2
3 4
Figure 25: Integrated sensitivity and threat status map for freshwater ecosystems and biota in the gas pipeline phase 5 corridor. 5
6
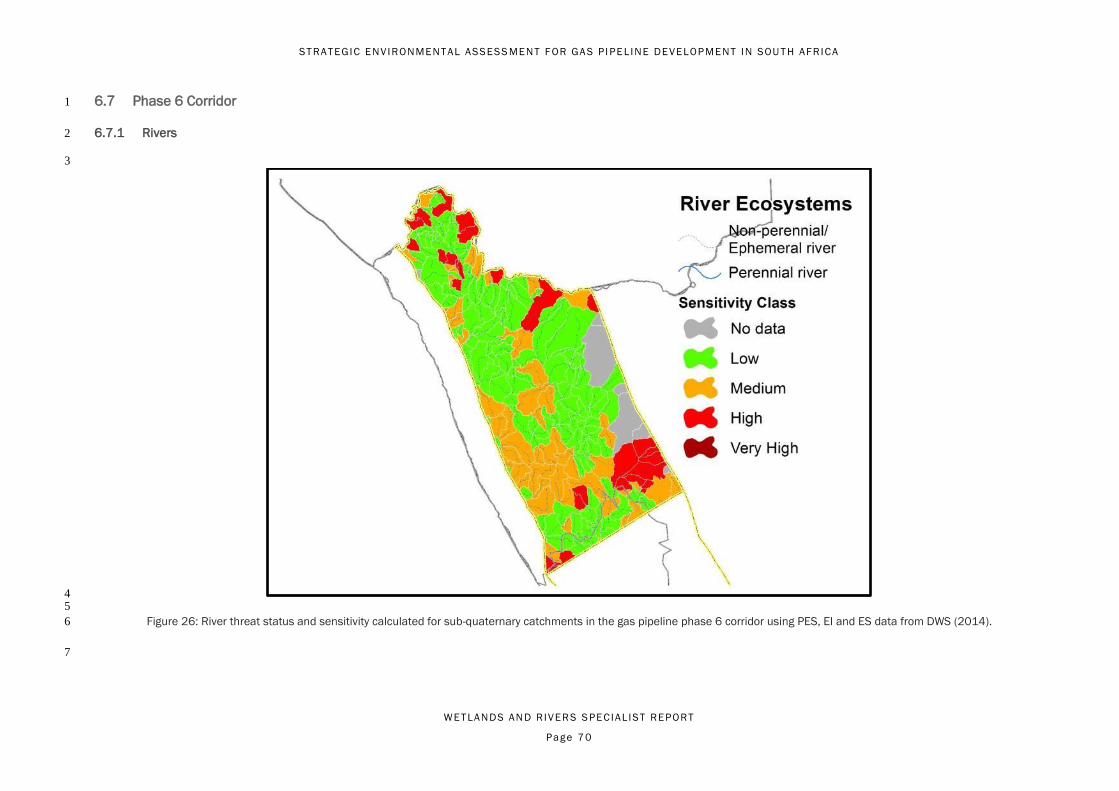
ST RAT EGIC ENVIRONMENT AL ASSESS MENT F OR GA S P I PE L INE DEVELOP MENT IN SOU T H AFRICA
WET LANDS AND R IVER S S PECIAL IST REPORT
Page 70
6.7 Phase 6 Corridor 1
6.7.1 Rivers 2
3
4 5
Figure 26: River threat status and sensitivity calculated for sub-quaternary catchments in the gas pipeline phase 6 corridor using PES, EI and ES data from DWS (2014). 6
7

ST RAT EGIC ENVIRONMENT AL ASSESS MENT F OR GA S P I PE L INE DEVELOP MENT IN SOU T H AFRICA
WET LANDS AND R IVER S S PECIAL IST REPORT
Page 71
6.7.2 Wetlands 1
2
3 4
Figure 27: Wetland threat status and sensitivity calculated in relation to areas of sub-quaternary catchments in the gas pipeline phase 6 corridor. 5
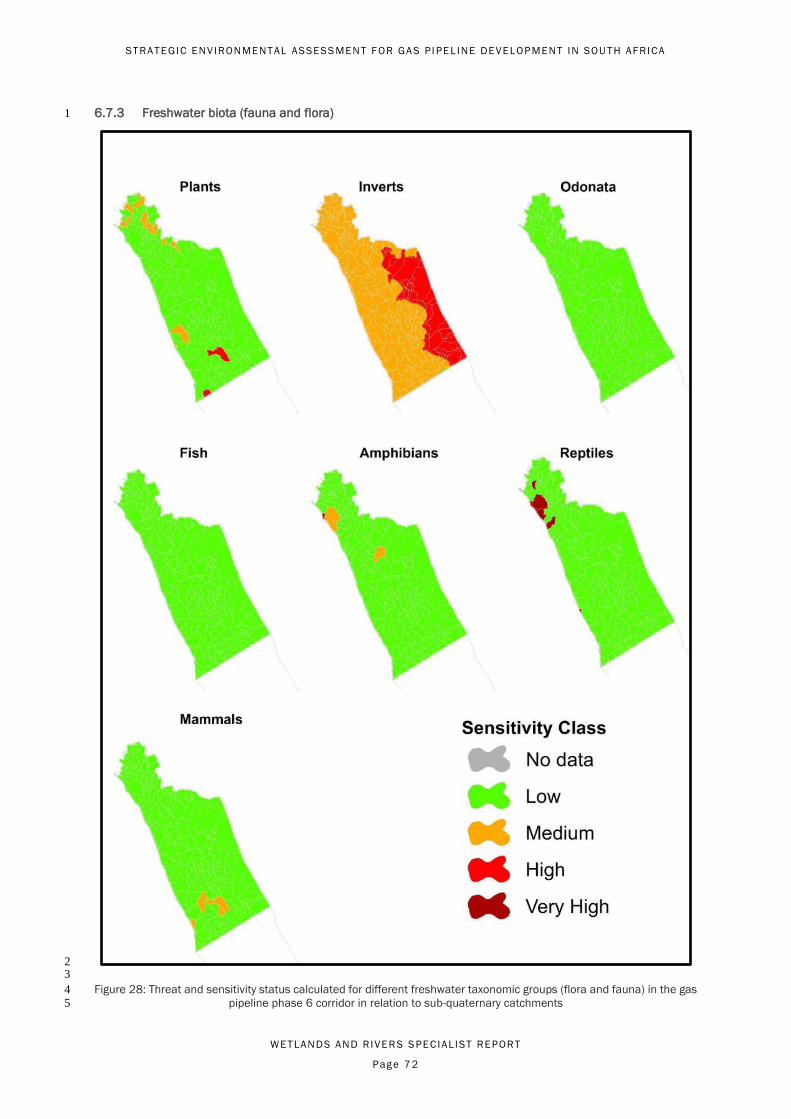
ST RAT EGIC ENVIRONMENT AL ASSESS MENT F OR GA S P I PE L INE DEVELOP MENT IN SOU T H AFRICA
WET LANDS AND R IVER S S PECIAL IST REPORT
Page 72
6.7.3 Freshwater biota (fauna and flora) 1
2 3
Figure 28: Threat and sensitivity status calculated for different freshwater taxonomic groups (flora and fauna) in the gas 4 pipeline phase 6 corridor in relation to sub-quaternary catchments5
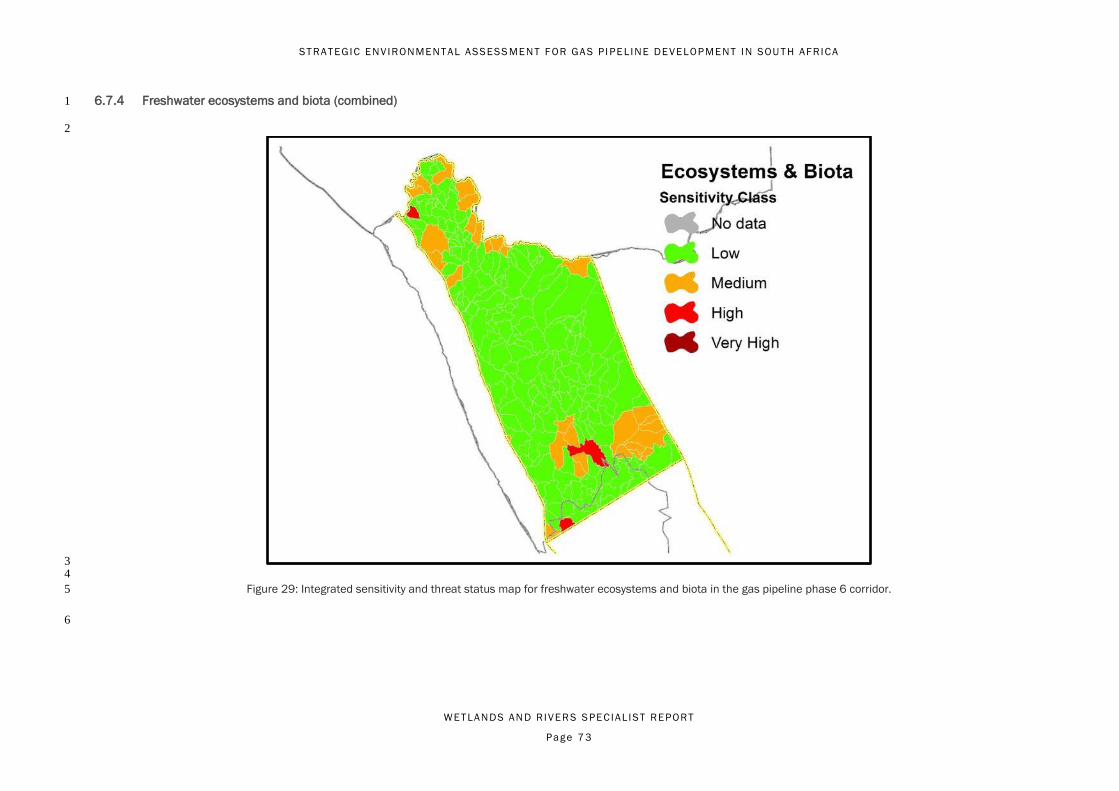
ST RAT EGIC ENVIRONMENT AL ASSESS MENT F OR GA S P I PE L INE DEVELOP MENT IN SOU T H AFRICA
WET LANDS AND R IVER S S PECIAL IST REPORT
Page 73
6.7.4 Freshwater ecosystems and biota (combined) 1
2
3 4
Figure 29: Integrated sensitivity and threat status map for freshwater ecosystems and biota in the gas pipeline phase 6 corridor. 5
6
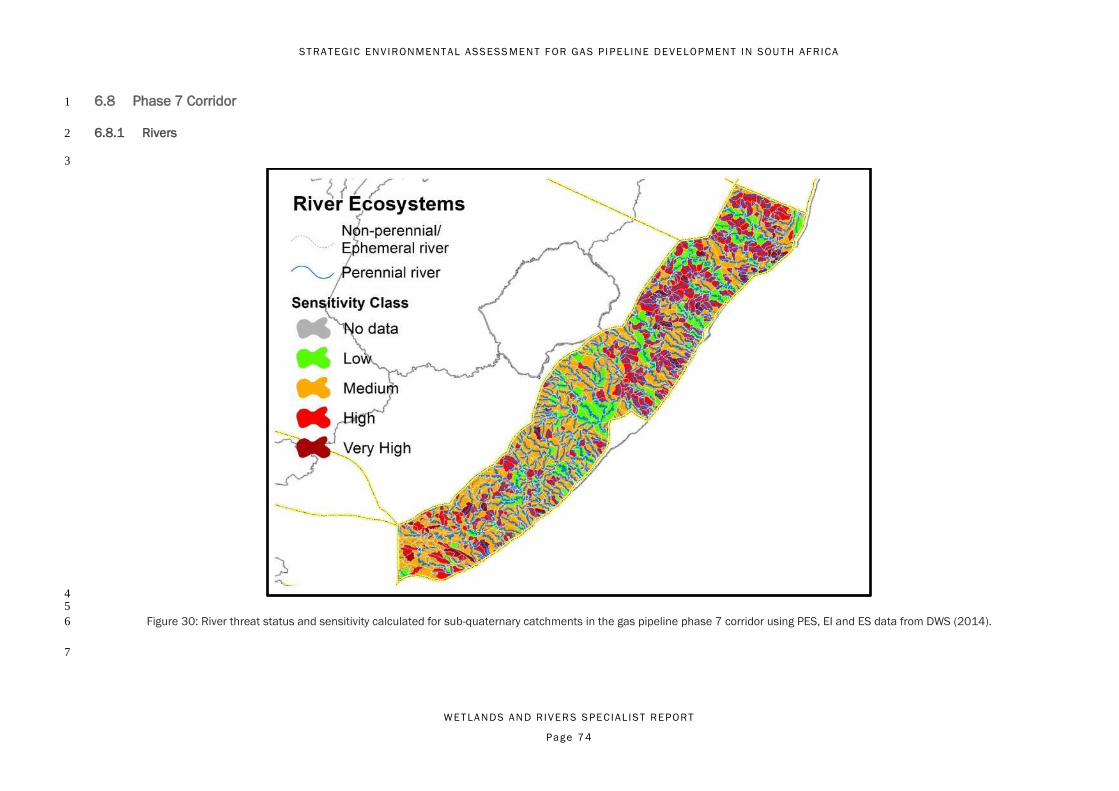
ST RAT EGIC ENVIRONMENT AL ASSESS MENT F OR GA S P I PE L INE DEVELOP MENT IN SOU T H AFRICA
WET LANDS AND R IVER S S PECIAL IST REPORT
Page 74
6.8 Phase 7 Corridor 1
6.8.1 Rivers 2
3
4 5
Figure 30: River threat status and sensitivity calculated for sub-quaternary catchments in the gas pipeline phase 7 corridor using PES, EI and ES data from DWS (2014). 6
7

ST RAT EGIC ENVIRONMENT AL ASSESS MENT F OR GA S P I PE L INE DEVELOP MENT IN SOU T H AFRICA
WET LANDS AND R IVER S S PECIAL IST REPORT
Page 75
6.8.2 Wetlands 1
2
3 4
Figure 31: Wetland threat status and sensitivity calculated in relation to areas of sub-quaternary catchments in the gas pipeline phase 7 corridor. 5
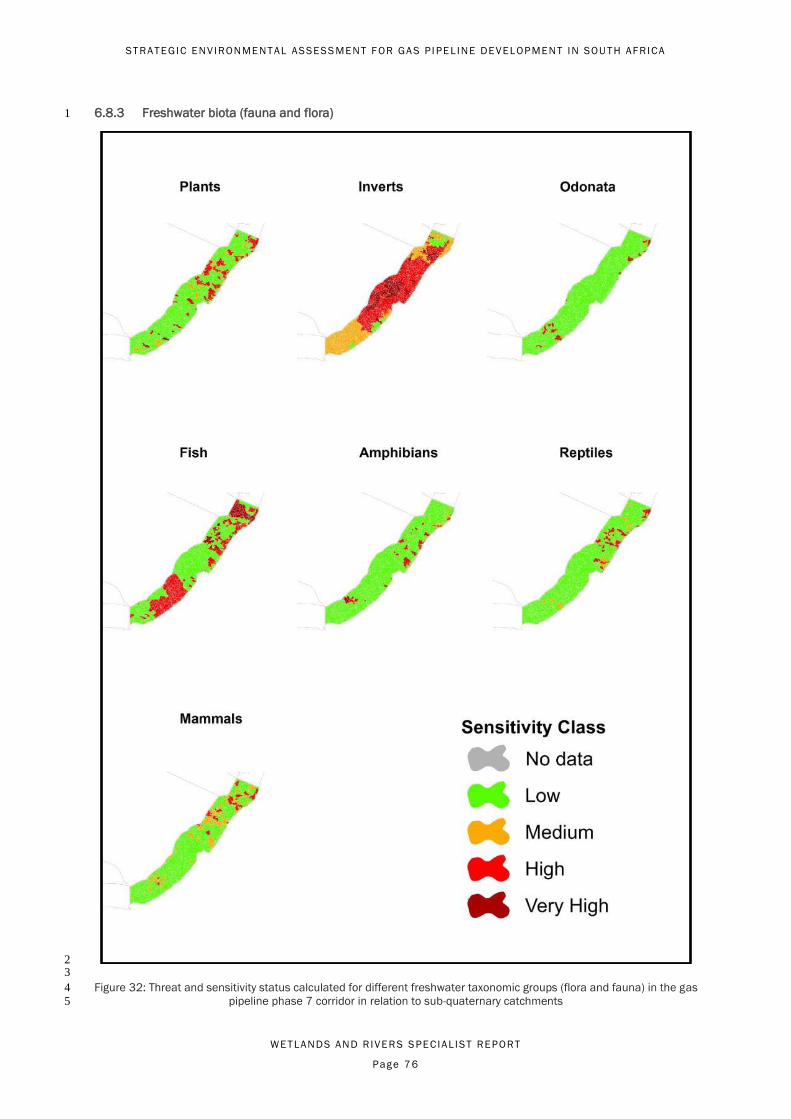
ST RAT EGIC ENVIRONMENT AL ASSESS MENT F OR GA S P I PE L INE DEVELOP MENT IN SOU T H AFRICA
WET LANDS AND R IVER S S PECIAL IST REPORT
Page 76
6.8.3 Freshwater biota (fauna and flora) 1
2 3
Figure 32: Threat and sensitivity status calculated for different freshwater taxonomic groups (flora and fauna) in the gas 4 pipeline phase 7 corridor in relation to sub-quaternary catchments5

ST RAT EGIC ENVIRONMENT AL ASSESS MENT F OR GA S P I PE L INE DEVELOP MENT IN SOU T H AFRICA
WET LANDS AND R IVER S S PECIAL IST REPORT
Page 77
6.8.4 Freshwater ecosystems and biota (combined) 1
2
3 4
Figure 33: Integrated sensitivity and threat status map for freshwater ecosystems and biota in the gas pipeline phase 7 corridor. 5
6

ST RAT EGIC ENVIRONMENT AL ASSESS MENT F OR GA S P I PE L INE DEVELOP MENT IN SOU T H AFRICA
WET LANDS AND R IVER S S PECIAL IST REPORT
Page 78
6.9 Phase 8 Corridor 1
6.9.1 Rivers 2
3
4 5
Figure 34: River threat status and sensitivity calculated for sub-quaternary catchments in the gas pipeline phase 8 corridor using PES, EI and ES data from DWS (2014). 6
7
8

ST RAT EGIC ENVIRONMENT AL ASSESS MENT F OR GA S P I PE L INE DEVELOP MENT IN SOU T H AFRICA
WET LANDS AND R IVER S S PECIAL IST REPORT
Page 79
6.9.2 Wetlands 1
2
3 4
Figure 35: Wetland threat status and sensitivity calculated in relation to areas of sub-quaternary catchments in the gas pipeline phase 8 corridor. 5

ST RAT EGIC ENVIRONMENT AL ASSESS MENT F OR GA S P I PE L INE DEVELOP MENT IN SOU T H AFRICA
WET LANDS AND R IVER S S PECIAL IST REPORT
Page 80
6.9.3 Freshwater biota (fauna and flora) 1
2 3
Figure 36: Threat and sensitivity status calculated for different freshwater taxonomic groups (flora and fauna) in the gas 4 pipeline phase 8 corridor in relation to sub-quaternary catchments5

ST RAT EGIC ENVIRONMENT AL ASSESS MENT F OR GA S P I PE L INE DEVELOP MENT IN SOU T H AFRICA
WET LANDS AND R IVER S S PECIAL IST REPORT
Page 81
6.9.4 Freshwater ecosystems and biota (combined) 1
2
3 4
Figure 37: Integrated sensitivity and threat status map for freshwater ecosystems and biota in the gas pipeline phase 8 corridor. 5
6
7
8
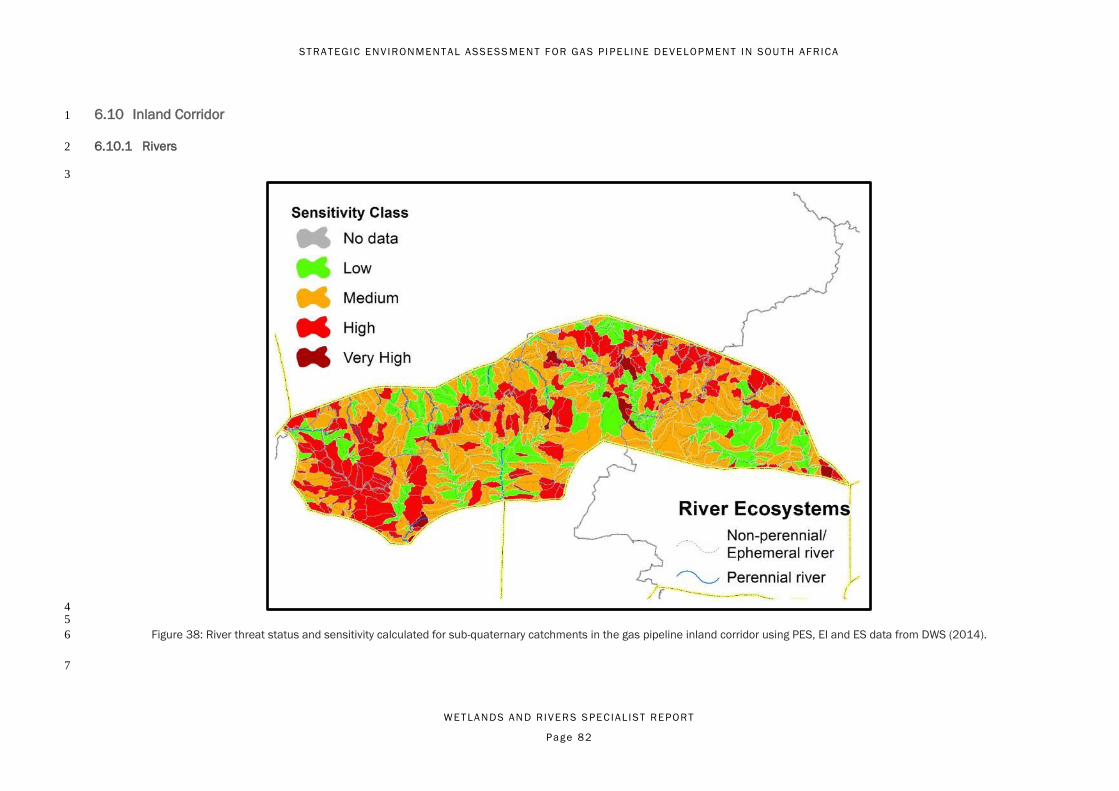
ST RAT EGIC ENVIRONMENT AL ASSESS MENT F OR GA S P I PE L INE DEVELOP MENT IN SOU T H AFRICA
WET LANDS AND R IVER S S PECIAL IST REPORT
Page 82
6.10 Inland Corridor 1
6.10.1 Rivers 2
3
4 5
Figure 38: River threat status and sensitivity calculated for sub-quaternary catchments in the gas pipeline inland corridor using PES, EI and ES data from DWS (2014). 6
7
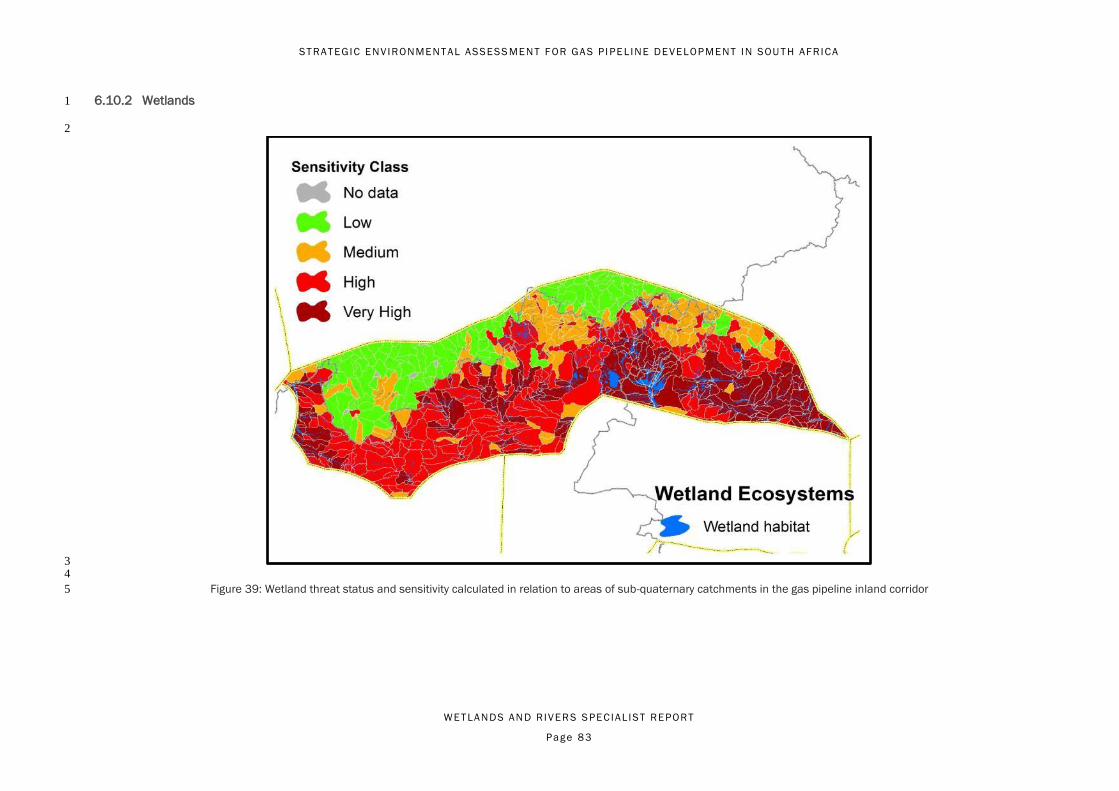
ST RAT EGIC ENVIRONMENT AL ASSESS MENT F OR GA S P I PE L INE DEVELOP MENT IN SOU T H AFRICA
WET LANDS AND R IVER S S PECIAL IST REPORT
Page 83
6.10.2 Wetlands 1
2
3 4
Figure 39: Wetland threat status and sensitivity calculated in relation to areas of sub-quaternary catchments in the gas pipeline inland corridor 5
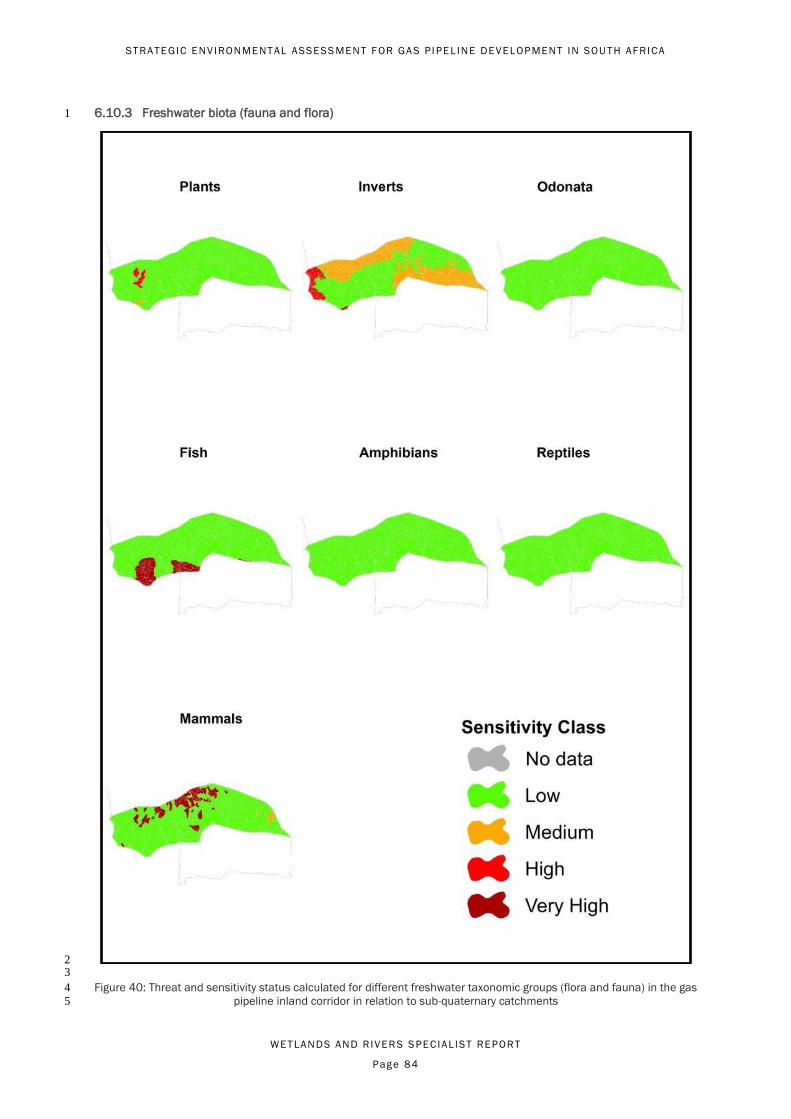
ST RAT EGIC ENVIRONMENT AL ASSESS MENT F OR GA S P I PE L INE DEVELOP MENT IN SOU T H AFRICA
WET LANDS AND R IVER S S PECIAL IST REPORT
Page 84
6.10.3 Freshwater biota (fauna and flora) 1
2 3
Figure 40: Threat and sensitivity status calculated for different freshwater taxonomic groups (flora and fauna) in the gas 4 pipeline inland corridor in relation to sub-quaternary catchments5

ST RAT EGIC ENVIRONMENT AL ASSESS MENT F OR GA S P I PE L INE DEVELOP MENT IN SOU T H AFRICA
WET LANDS AND R IVER S S PECIAL IST REPORT
Page 85
6.10.4 Freshwater ecosystems and biota (combined) 1
2
3 4
Figure 41: Integrated sensitivity and threat status map for freshwater ecosystems and biota in the gas pipeline inland corridor. 5
6
7
8
ST RAT EGIC ENVIRONMENT AL ASSESS MENT F OR GA S P I PE L INE DEVELOP MENT IN SOU T H AFRICA
WET LANDS AND R IVER S S PECIAL IST REPORT
Page 86
7 KEY POTENTIAL IMPACTS AND MITIGATION 1
The impacts associated with gas pipeline development range from those that are direct (e.g. excavation of 2
trenches for pipelines and maintenance of vegetation within pipeline servitudes) to those that are more 3
subtle (indirect) and which occur over longer timeframes (e.g. vegetation compositional changes from 4
continued servitude maintenance, habitat fragmentation, and alien plant infestation). The majority of the 5
impacts identified in this assessment are relevant to the scope of the present study, and have been 6
contextualised here in relation to the following activities and their associated impacts to aquatic 7
ecosystems and biota. 8
9
● Developing access roads – Development of new access roads to enable construction, as well as 10
ongoing maintenance during the operational phase may result in the following impacts: 11
○ Direct loss of riparian and wetland vegetation (and associated buffers), including 12
potentially sensitive/important freshwater ecosystems and/or habitat supporting species 13
of conservation concern; 14
○ Fragmentation of freshwater ecosystems and flow patterns, resulting in an indirect loss of 15
ecological patterns and processes such as species movement and dispersal, habitat 16
connectivity, increased edge effects and disturbance, establishment of invasive alien 17
vegetation, etc.; 18
○ Stormwater runoff resulting in increased flows within receiving aquatic environments, 19
particularly in relation to runoff discharge points, which in turn has a number of indirect 20
issues such as bank erosion and collapse, scouring and channel incision, headcut erosion, 21
desiccation of wetland/riparian soils and vegetation, increased turbidity, sedimentation 22
and smothering of benthos. The combined effects will negatively affect the ecological 23
integrity and ability of the freshwater ecosystems to function properly; 24
○ Waste pollution and contamination of aquatic environments from foreign materials (e.g. 25
fuels/hydrocarbons, cement, and building materials) being dumped and/or carried into 26
aquatic environments; 27
○ Compaction of soils and creation of preferential flow paths with and adjacent to wetland 28
and river habitats; and 29
○ Direct loss (i.e. fatality) of flora and fauna (including Threatened or other species of 30
conservation concern) that inhabit wetland/river ecosystems and adjacent buffer/fringe 31
habitats, including accidental road kills caused by increased traffic on both existing and 32
new roads. 33
● Vegetation clearing and grading – The stripping/removal of vegetation and topsoil to prepare the 34
right of way (ROW) for pipeline construction will result in similar impacts to the development of 35
access roads (as above), but will differ in terms of extent, duration and intensity. Typical ROWs are 36
between 30 to 50 metres wide, translating to roughly one hectare for every 200 to 300 metres of 37
pipeline constructed. Thus, the total area of wetland and riparian vegetation that is removed will 38
be based on the total length of pipeline that passes through these freshwater ecosystems and 39
their associated buffer habitats. 40
● Trenching and excavation – Trenches to bury pipelines will also need to be excavated during the 41
pipeline construction process. This will also include excavations for pigging stations, which will be 42
positioned every 250 to 500 km (based on new technology). Trenching and excavations have the 43
potential to cause direct mortality of fauna that inhabit freshwater and fringe habitats, in particular 44
fossorial fauna (i.e. animals adapted to living underground), but also small fauna that are moving 45
across the excavation path that then fall into trenches or excavation where they become trapped 46
and eventually die. 47
● Rehabilitation and maintenance – Gas pipeline servitudes for accessing the pipeline and pigging 48
stations will require ongoing vegetation management and clearing to maintain a strip of 49
grass/herbaceous vegetation, with trees/shrubs removed in most cases. 50
51
52

ST RAT EGIC ENVIRONMENT AL ASSESS MENT F OR GA S P I PE L INE DEVELOP MENT IN SOU T H AFRICA
WET LANDS AND R IVER S S PECIAL IST REPORT
Page 87
In addition to the main activities and key impacts resulting from gas pipeline development and operation, 1
other more specific impacts that may occur as a result include: 2
3
● Habitat fragmentation – one of the more concerning issues of linear developments such as gas 4
pipelines, and the associated servitudes for ongoing maintenance, is the fragmentation of 5
freshwater habitat and associated buffers, especially where areas are permanently impacted (e.g. 6
through roads and pigging stations). This presents a potential serious issue particularly to 7
freshwater fauna, and leads to populations becoming more isolated, resulting in a reduction of 8
inter-population connectivity and compromised genetic viability. For example, inappropriately 9
designed and constructed river crossings could prevent fish from moving/migrating freely within a 10
river system. Habitat fragmentation also has the potential to exacerbate impacts to freshwater 11
ecosystems, such as through altering micro-climatic conditions (e.g. fire, wind, desiccation, etc.). 12
These alterations in turn affect the perimeter of wetland and riparian habitats resulting in edge 13
effects and development of transitional habitats. This presents a favourable situation for invasive 14
alien plants (IAPs) to establish, with knock-on effects for freshwater ecosystem and associated 15
fauna and flora (as discussed in the following point). 16
● Habitat alteration and knock-on effects caused by IAPs – IAPs that already occur in an area are 17
likely to invade newly disturbed areas, by gradual (or even rapid) encroachment into disturbed 18
areas (e.g. ROWs, temporary construction camps, borrow pits, vehicle parking, pipeline stockpiles, 19
etc.), transitional habitats, as well as areas along access roads. The spread of existing, and the 20
introduction of new, problem plant species may be facilitated by movement of people and 21
construction vehicles. IAP infestation within freshwater ecosystems will further degrade habitats 22
and habitat availability for associated biota. Secondary impacts (caused by IAPs) include, but are 23
not limited to: 24
○ Competition with native plant species, especially when considering the severity of 25
allelopathic influences caused by certain IAP (e.g. Acacia mearnsii); 26
○ Shading of banks and instream habitats, which in turn impacts on water temperatures and 27
freshwater fauna and flora that are intolerant; 28
○ Shift in allochthonous and autochthonous organic compounds within wetland and river 29
ecosystems; 30
○ Bank instability, erosion and collapse, with exacerbated deposition of sediments and 31
debris; and 32
○ In more severe cases, reduced water availability due to excessive water consumption from 33
most IAPs (in particular, deep-rooted tree species such as Eucalyptus spp.). 34
● Mortality of fauna – Earthworks and excavations would mainly affect fossorial fauna (i.e. animal 35
adapted to living underground), as well as small, less-mobile fauna (e.g. amphibians, as well as 36
freshwater obligate reptiles and shrews/rodents). Mortality of fauna from accidental collisions due 37
to the movement of vehicles/machinery across the site would also be an issue for smaller, less 38
mobile species of fauna. In addition there is the risk of fauna falling into and getting trapped 39
within trenches and excavations, which may lead to further mortality cases. Lastly, illegal 40
hunting/poaching could also present a significant impact during the construction phase whereby 41
certain personnel/contractors engage in such activities. 42
● Disturbance of fauna – Certain fauna are more susceptible to impacts from increased noise, 43
vibrations, dust and/or artificial lighting. Artificial lighting in and around construction camps and 44
pipeline stockpiles may for example have a significant impact on normal life cycles of adult forms 45
of aquatic macro-invertebrates, as well as increased mortality rate. Noise impacts will affect noise-46
sensitive mammals, particularly larger mammals such as Otter species and Servals. Noise and 47
light impacts ultimately result in the displacement of fauna away from the noise impact area, but is 48
expected to be temporary, and restricted to the construction phase. 49
● Water quality impacts – One of the main impacts that result from construction activities within 50
and/or adjacent to rivers and wetlands is the increase in suspended solids and deposition of 51
sediments causing habitat destruction due to sediment ‘smothering’, which in turn affects 52
composition, feeding, reproduction, and wellbeing of aquatic biota. Other impacts that may also 53
occur include accidental spills and vehicle leakages (e.g. fuels, oils, cement, etc.) that result in 54
contamination of aquatic environments. 55

ST RAT EGIC ENVIRONMENT AL ASSESS MENT F OR GA S P I PE L INE DEVELOP MENT IN SOU T H AFRICA
WET LANDS AND R IVER S S PECIAL IST REPORT
Page 88
Overall, in this study impacts are characterised at the broadest scale in relation to the corridors as a means 1
to identify preferred routings that will have the least possible impact on freshwater ecosystems and/or 2
associated biota. Nevertheless, an inadequately positioned pipeline alignment through a particular corridor 3
could potentially impact areas with severe consequences for freshwater biodiversity. Taking this into 4
consideration, it is thus important to acknowledge impacts at a finer scale (i.e. sub-quaternary catchment) 5
in order to identify preferred alignments/positions of gas pipelines within the proposed corridors. Lastly, 6
data within the catchments at a site specific/habitat scale have been interrogated to guide the finer 7
alignment of infrastructure, as well as inform the specialist assessments required and the mitigation 8
measures. 9
10
Table 8 provides detail in terms of key impacts and possible effects on freshwater ecosystems and 11
associated fauna and flora that are linked to gas pipeline phases and development activities. Mitigation 12
measures are included to ensure that impacts are avoided where necessary and/or minimised in terms of 13
mitigation hierarchy. 14
15
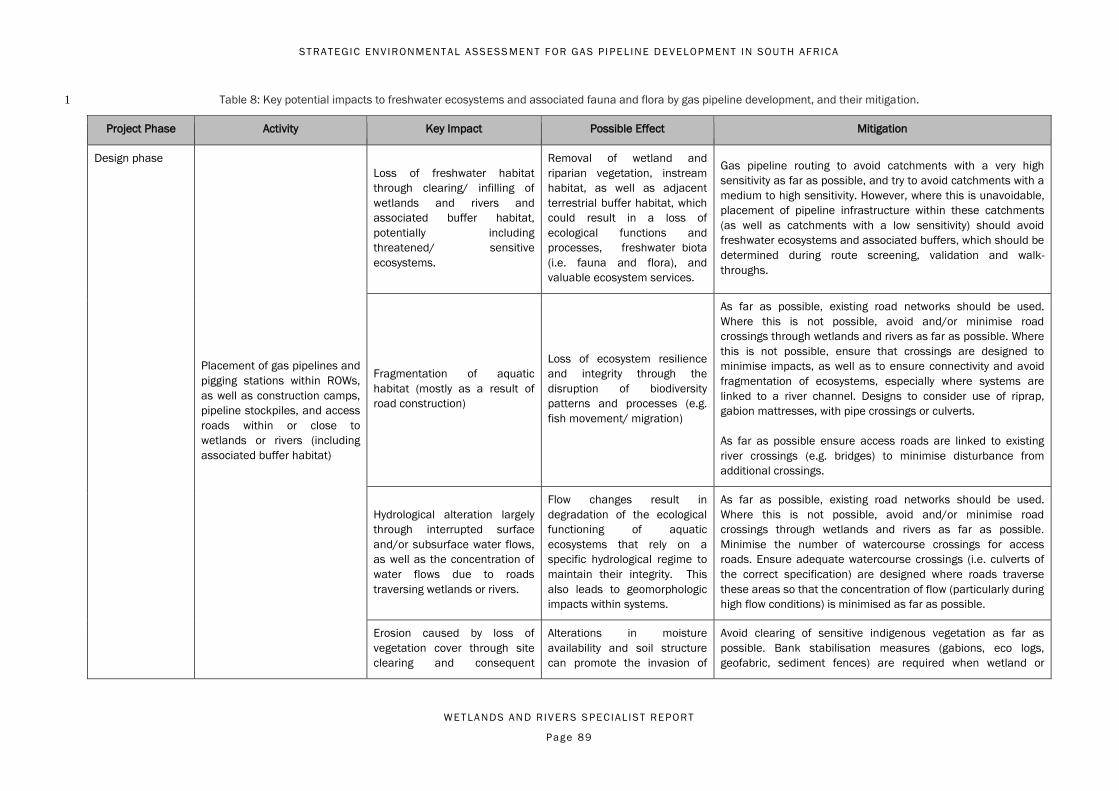
ST RAT EGIC ENVIRONMENT AL ASSESS MENT F OR GA S P I PE L INE DEVELOP MENT IN SOU T H AFRICA
WET LANDS AND R IVER S S PECIAL IST REPORT
Page 89
Table 8: Key potential impacts to freshwater ecosystems and associated fauna and flora by gas pipeline development, and their mitigation. 1
Project Phase Activity Key Impact Possible Effect Mitigation
Design phase
Placement of gas pipelines and
pigging stations within ROWs,
as well as construction camps,
pipeline stockpiles, and access
roads within or close to
wetlands or rivers (including
associated buffer habitat)
Loss of freshwater habitat
through clearing/ infilling of
wetlands and rivers and
associated buffer habitat,
potentially including
threatened/ sensitive
ecosystems.
Removal of wetland and
riparian vegetation, instream
habitat, as well as adjacent
terrestrial buffer habitat, which
could result in a loss of
ecological functions and
processes, freshwater biota
(i.e. fauna and flora), and
valuable ecosystem services.
Gas pipeline routing to avoid catchments with a very high
sensitivity as far as possible, and try to avoid catchments with a
medium to high sensitivity. However, where this is unavoidable,
placement of pipeline infrastructure within these catchments
(as well as catchments with a low sensitivity) should avoid
freshwater ecosystems and associated buffers, which should be
determined during route screening, validation and walk-
throughs.
Fragmentation of aquatic
habitat (mostly as a result of
road construction)
Loss of ecosystem resilience
and integrity through the
disruption of biodiversity
patterns and processes (e.g.
fish movement/ migration)
As far as possible, existing road networks should be used.
Where this is not possible, avoid and/or minimise road
crossings through wetlands and rivers as far as possible. Where
this is not possible, ensure that crossings are designed to
minimise impacts, as well as to ensure connectivity and avoid
fragmentation of ecosystems, especially where systems are
linked to a river channel. Designs to consider use of riprap,
gabion mattresses, with pipe crossings or culverts.
As far as possible ensure access roads are linked to existing
river crossings (e.g. bridges) to minimise disturbance from
additional crossings.
Hydrological alteration largely
through interrupted surface
and/or subsurface water flows,
as well as the concentration of
water flows due to roads
traversing wetlands or rivers.
Flow changes result in
degradation of the ecological
functioning of aquatic
ecosystems that rely on a
specific hydrological regime to
maintain their integrity. This
also leads to geomorphologic
impacts within systems.
As far as possible, existing road networks should be used.
Where this is not possible, avoid and/or minimise road
crossings through wetlands and rivers as far as possible.
Minimise the number of watercourse crossings for access
roads. Ensure adequate watercourse crossings (i.e. culverts of
the correct specification) are designed where roads traverse
these areas so that the concentration of flow (particularly during
high flow conditions) is minimised as far as possible.
Erosion caused by loss of
vegetation cover through site
clearing and consequent
Alterations in moisture
availability and soil structure
can promote the invasion of
Avoid clearing of sensitive indigenous vegetation as far as
possible. Bank stabilisation measures (gabions, eco logs,
geofabric, sediment fences) are required when wetland or

ST RAT EGIC ENVIRONMENT AL ASSESS MENT F OR GA S P I PE L INE DEVELOP MENT IN SOU T H AFRICA
WET LANDS AND R IVER S S PECIAL IST REPORT
Page 90
Project Phase Activity Key Impact Possible Effect Mitigation
sedimentation of aquatic
ecosystems. Erosion is
particularly a high risk in steep
systems, and in drainage lines
that lack channel features and
are naturally adapted to lower
energy runoff with dispersed
surface flows (such as
unchannelled valley-bottom
wetlands).
weedy and/or alien species at
the expense of more natural
vegetation and thus a loss of
habitat integrity and/or
biodiversity. Loss of vegetation
altogether can lead to erosion
and increased sedimentation
and therefore loss or
degradation of
riverine/wetland habitats
watercourse banks steeper than 1:5 are denuded during
construction. Appropriate rehabilitation procedures/measures
should be planned.
Construction
phase
Establishment of ROWs and
construction of gas pipelines
and pigging stations (including
trenching/ excavations), as
well as camps, pipeline
stockpiles, and access roads
within or close to wetlands or
rivers (including associated
buffer habitat)
Physical destruction or damage
of freshwater ecosystems and
adjacent fringe habitats by
workers and machinery
operating within or in close
proximity to wetlands or
drainage lines, and through the
establishment of construction
camps or temporary laydown
areas within or in close
proximity to wetlands or
watercourses.
Loss of ecosystem services
provided by these habitats, as
well as mortality of fauna and
flora directly through clearing
and trenching/ excavation, as
well as indirectly through
poaching/hunting.
All wetlands and watercourses should generally be treated as
“no-go” areas (as far as possible) and appropriately demarcated
as such. No vehicles, machinery, personnel, construction
materials, cement, fuel, oil or waste should be allowed into
these areas without the express permission of and supervision
by an on-site Environmental Control Officer (ECO).
Construction camps, toilets, temporary laydown areas should be
located outside of the recommended buffer areas around
wetlands and watercourses and should be rehabilitated
following construction.
Ensure that a WUL is undertaken where developments will
occur within 500 metres of a wetland or 100 metres from a
river to authorise certain activities as per Section 21 of the
National Water Act (Act No. 36 of 1998).
Trenches/excavations should be backfilled and rehabilitated
immediately after the pipes/pigging stations have been
installed, and should be done concurrently as the pipeline
construction process progresses along the ROW.
Trenches/excavations that are open should be inspected daily
by an ECO and plans put in place to rescue any vertebrate
fauna that have become trapped within a trench/excavation.
Low fences that will prevent fauna from entering the ROW

ST RAT EGIC ENVIRONMENT AL ASSESS MENT F OR GA S P I PE L INE DEVELOP MENT IN SOU T H AFRICA
WET LANDS AND R IVER S S PECIAL IST REPORT
Page 91
Project Phase Activity Key Impact Possible Effect Mitigation
should be used especially in situations where
trenches/excavations remain open for longer periods of time
(i.e. a few weeks to several months).
All construction activities (including establishment of
construction camps, temporary lay-down areas, construction of
haul roads and operation of heavy machinery, should ideally
take place during the dry season to reduce potential impacts to
freshwater ecosystems that are linked to rainfall-runoff.
Stockpiling of materials and
washing of equipment within or
in close proximity to wetlands
or watercourses
Pollution (water quality
deterioration) of freshwater
ecosystems through the runoff
of contaminants such as fuel,
oil, concrete, wash-water,
sediment and sewage into
these ecosystems.
Habitat degradation which
results in the loss of resilience
of ecosystems through the
disruption of ecological
processes and thus a loss of
ecosystem integrity
Construction activities associated with the establishment of
access roads through wetlands or watercourses (if unavoidable)
should be restricted to a working area of ten metres in width
either side of the road, and these working areas should be
clearly demarcated. No vehicles, machinery, personnel,
construction material, cement, fuel, oil or waste should be
allowed outside of the demarcated working areas.
Vehicles and machinery should not be washed within 30 metres
of the edge of any wetland or watercourse.
Construction of haul roads for
movement of machinery and
materials
Reduction in habitat quality
through erosion and
sedimentation of wetlands and
rivers
Excessive dust generation from
road construction and vehicle
traffic/haulage leading to
impact on surrounding
vegetation health and
suspended solids/sediment
entering nearby watercourses.
There should be as little disturbance to surrounding vegetation
as possible when construction activities are undertaken, as
intact vegetation adjacent to construction areas will assist in
the control of sediment dispersal from exposed areas.
Furthermore dust suppression methods (e.g. spraying surfaces
with water) should be used to minimise the transport of wind-
blown dust.
Any roads/crossings not needed after the construction process
should be decommissioned and rehabilitated in accordance
with detailed rehabilitation plans.
Excavation of borrow pits for
road construction
Excavation of borrow pits can
act as pitfall traps for
amphibians and other
Borrow pits should be located outside of the recommended
buffer areas around wetlands and watercourses and should be
rehabilitated following construction in accordance with detailed
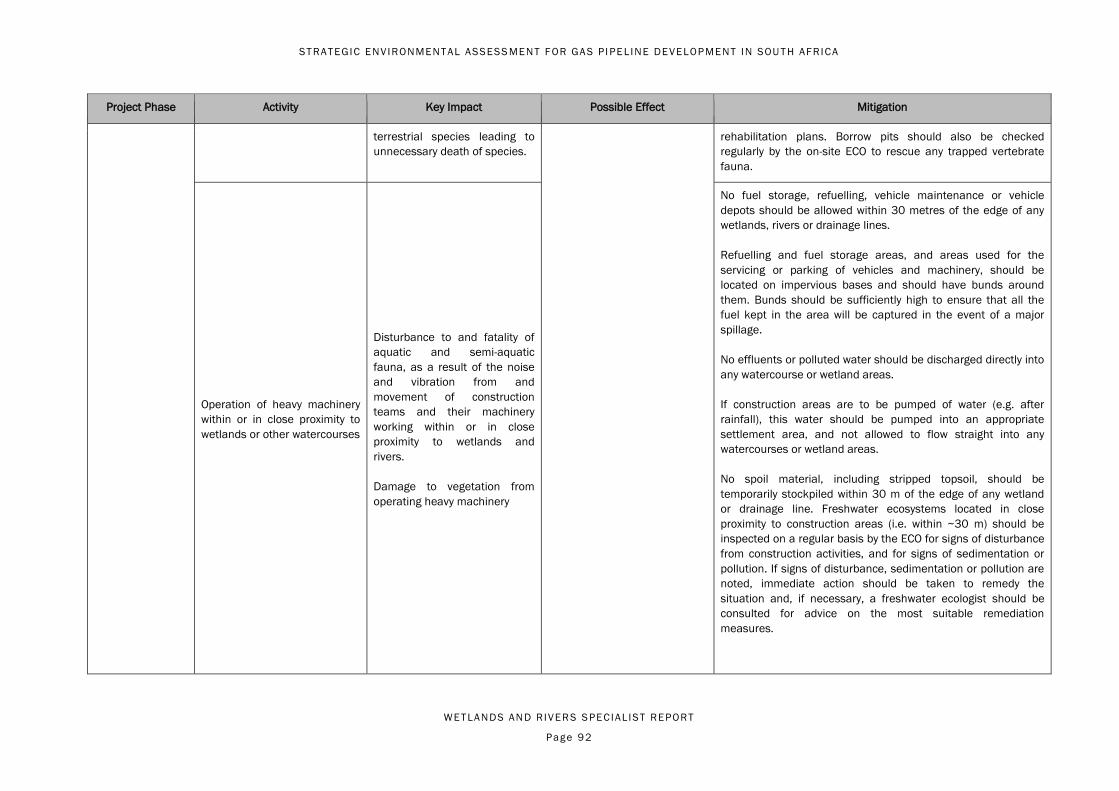
ST RAT EGIC ENVIRONMENT AL ASSESS MENT F OR GA S P I PE L INE DEVELOP MENT IN SOU T H AFRICA
WET LANDS AND R IVER S S PECIAL IST REPORT
Page 92
Project Phase Activity Key Impact Possible Effect Mitigation
terrestrial species leading to
unnecessary death of species.
rehabilitation plans. Borrow pits should also be checked
regularly by the on-site ECO to rescue any trapped vertebrate
fauna.
Operation of heavy machinery
within or in close proximity to
wetlands or other watercourses
Disturbance to and fatality of
aquatic and semi-aquatic
fauna, as a result of the noise
and vibration from and
movement of construction
teams and their machinery
working within or in close
proximity to wetlands and
rivers.
Damage to vegetation from
operating heavy machinery
No fuel storage, refuelling, vehicle maintenance or vehicle
depots should be allowed within 30 metres of the edge of any
wetlands, rivers or drainage lines.
Refuelling and fuel storage areas, and areas used for the
servicing or parking of vehicles and machinery, should be
located on impervious bases and should have bunds around
them. Bunds should be sufficiently high to ensure that all the
fuel kept in the area will be captured in the event of a major
spillage.
No effluents or polluted water should be discharged directly into
any watercourse or wetland areas.
If construction areas are to be pumped of water (e.g. after
rainfall), this water should be pumped into an appropriate
settlement area, and not allowed to flow straight into any
watercourses or wetland areas.
No spoil material, including stripped topsoil, should be
temporarily stockpiled within 30 m of the edge of any wetland
or drainage line. Freshwater ecosystems located in close
proximity to construction areas (i.e. within ~30 m) should be
inspected on a regular basis by the ECO for signs of disturbance
from construction activities, and for signs of sedimentation or
pollution. If signs of disturbance, sedimentation or pollution are
noted, immediate action should be taken to remedy the
situation and, if necessary, a freshwater ecologist should be
consulted for advice on the most suitable remediation
measures.
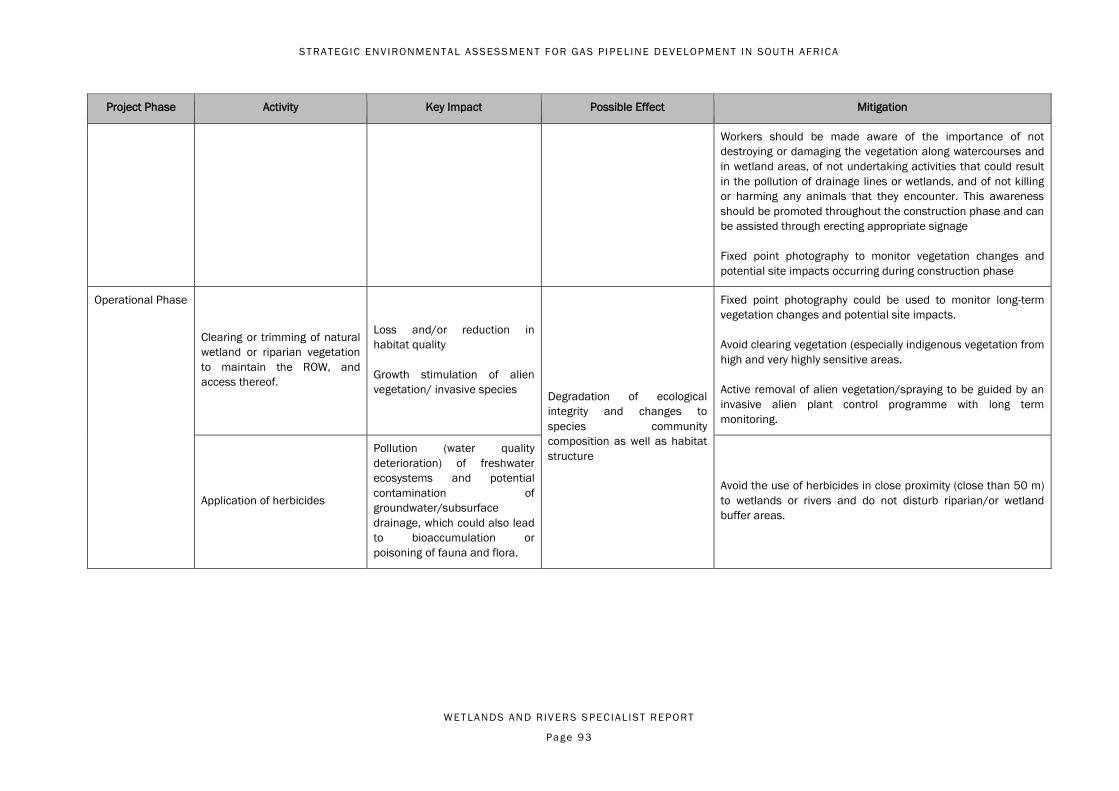
ST RAT EGIC ENVIRONMENT AL ASSESS MENT F OR GA S P I PE L INE DEVELOP MENT IN SOU T H AFRICA
WET LANDS AND R IVER S S PECIAL IST REPORT
Page 93
Project Phase Activity Key Impact Possible Effect Mitigation
Workers should be made aware of the importance of not
destroying or damaging the vegetation along watercourses and
in wetland areas, of not undertaking activities that could result
in the pollution of drainage lines or wetlands, and of not killing
or harming any animals that they encounter. This awareness
should be promoted throughout the construction phase and can
be assisted through erecting appropriate signage
Fixed point photography to monitor vegetation changes and
potential site impacts occurring during construction phase
Operational Phase
Clearing or trimming of natural
wetland or riparian vegetation
to maintain the ROW, and
access thereof.
Loss and/or reduction in
habitat quality
Growth stimulation of alien
vegetation/ invasive species Degradation of ecological
integrity and changes to
species community
composition as well as habitat
structure
Fixed point photography could be used to monitor long-term
vegetation changes and potential site impacts.
Avoid clearing vegetation (especially indigenous vegetation from
high and very highly sensitive areas.
Active removal of alien vegetation/spraying to be guided by an
invasive alien plant control programme with long term
monitoring.
Application of herbicides
Pollution (water quality
deterioration) of freshwater
ecosystems and potential
contamination of
groundwater/subsurface
drainage, which could also lead
to bioaccumulation or
poisoning of fauna and flora.
Avoid the use of herbicides in close proximity (close than 50 m)
to wetlands or rivers and do not disturb riparian/or wetland
buffer areas.
ST RAT EGIC ENVIRONMENT AL ASSESS MENT F OR GA S P I PE L INE DEVELOP MENT IN SOU T H AFRICA
WET LANDS AND R IVER S S PECIAL IST REPORT
Page 94
8 RISK ASSESSMENT 1
The following risk assessment (as presented in Table 9 below) was carried out for all of the identified 2
impacts described in Section 7. For each impact the consequence (ranging from slight to extreme) of the 3
impact affecting freshwater systems and/or biota was defined as a combination of three factors, namely: 4
impact severity, spatial scale and duration. The probability is based on the likelihood of an impact 5
occurring from extremely unlikely to very likely. The overall risk of a particular impact is based on the 6
combined consequence of the impact and the probability/likelihood that the impact will occur, with each 7
impact evaluated according to the four-tiered rating scale as used in the sensitivity mapping. 8
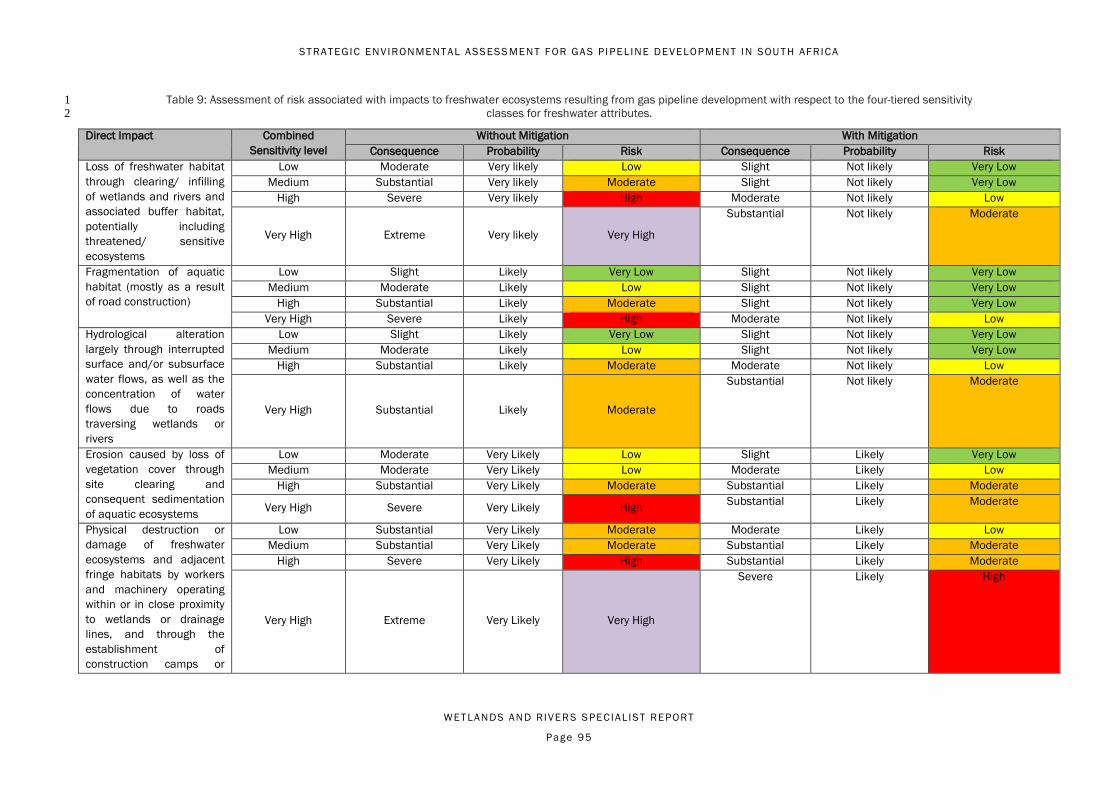
ST RAT EGIC ENVIRONMENT AL ASSESS MENT F OR GA S P I PE L INE DEVELOP MENT IN SOU T H AFRICA
WET LANDS AND R IVER S S PECIAL IST REPORT
Page 95
Table 9: Assessment of risk associated with impacts to freshwater ecosystems resulting from gas pipeline development with respect to the four-tiered sensitivity 1 classes for freshwater attributes. 2
Direct Impact Combined
Sensitivity level
Without Mitigation With Mitigation
Consequence Probability Risk Consequence Probability Risk
Loss of freshwater habitat
through clearing/ infilling
of wetlands and rivers and
associated buffer habitat,
potentially including
threatened/ sensitive
ecosystems
Low Moderate Very likely Low Slight Not likely Very Low
Medium Substantial Very likely Moderate Slight Not likely Very Low
High Severe Very likely High Moderate Not likely Low
Very High Extreme Very likely Very High
Substantial Not likely Moderate
Fragmentation of aquatic
habitat (mostly as a result
of road construction)
Low Slight Likely Very Low Slight Not likely Very Low
Medium Moderate Likely Low Slight Not likely Very Low
High Substantial Likely Moderate Slight Not likely Very Low
Very High Severe Likely High Moderate Not likely Low
Hydrological alteration
largely through interrupted
surface and/or subsurface
water flows, as well as the
concentration of water
flows due to roads
traversing wetlands or
rivers
Low Slight Likely Very Low Slight Not likely Very Low
Medium Moderate Likely Low Slight Not likely Very Low
High Substantial Likely Moderate Moderate Not likely Low
Very High Substantial Likely Moderate
Substantial Not likely Moderate
Erosion caused by loss of
vegetation cover through
site clearing and
consequent sedimentation
of aquatic ecosystems
Low Moderate Very Likely Low Slight Likely Very Low
Medium Moderate Very Likely Low Moderate Likely Low
High Substantial Very Likely Moderate Substantial Likely Moderate
Very High Severe Very Likely High Substantial Likely Moderate
Physical destruction or
damage of freshwater
ecosystems and adjacent
fringe habitats by workers
and machinery operating
within or in close proximity
to wetlands or drainage
lines, and through the
establishment of
construction camps or
Low Substantial Very Likely Moderate Moderate Likely Low
Medium Substantial Very Likely Moderate Substantial Likely Moderate
High Severe Very Likely High Substantial Likely Moderate
Very High Extreme Very Likely Very High
Severe Likely High

ST RAT EGIC ENVIRONMENT AL ASSESS MENT F OR GA S P I PE L INE DEVELOP MENT IN SOU T H AFRICA
WET LANDS AND R IVER S S PECIAL IST REPORT
Page 96
Direct Impact Combined
Sensitivity level
Without Mitigation With Mitigation
Consequence Probability Risk Consequence Probability Risk
temporary laydown areas
Pollution (water quality
deterioration) of freshwater
ecosystems through the
runoff of contaminants
such as fuel, oil, concrete,
wash-water, sediment and
sewage into these
ecosystems
Low Moderate Likely Low Slight Likely Very Low
Medium Substantial Likely Moderate Slight Likely Very Low
High Severe Likely High Moderate Likely Low
Very High Extreme Likely High
Substantial Likely Moderate
Clearing or trimming of
natural wetland or riparian
vegetation leading to loss
and/or reduction in habitat
quality
Low Moderate Likely Low Slight Likely Very Low
Medium Moderate Likely Low Slight Likely Very Low
High Substantial Likely Moderate Moderate Likely Low
Very High Substantial Likely Moderate Moderate Likely Low
Reduction in habitat quality
through erosion and
sedimentation of wetlands
and rivers
Low Moderate Very Likely Low Slight Likely Very Low
Medium Moderate Very Likely Low Slight Likely Very Low
High Substantial Very Likely Moderate Moderate Likely Low
Very High Substantial Very Likely Moderate Moderate Likely Low
Excessive dust generation
from road construction and
vehicle traffic/haulage
leading to impact on
surrounding vegetation
health and suspended
solids/sediment entering
nearby watercourses
Low Slight Very Likely Very low Slight Likely Very Low
Medium Slight Very Likely Very Low Slight Likely Very Low
High Moderate Very Likely Low Moderate Likely Low
Very High Substantial Very Likely Moderate
Moderate Likely Low
Excavation of borrow pits
for road construction acting
as pitfall traps for
amphibians and other
terrestrial species leading
to unnecessary death of
species.
Low Slight Very Likely Very Low Slight Likely Very Low
Medium Substantial Very Likely Moderate Slight Likely Very Low
High Severe Very Likely High Moderate Likely Low
Very High Severe Very Likely High
Substantial Likely Moderate
Disturbance to and fatality
of aquatic and semi-
aquatic fauna, as a result
Low Slight Likely Very Low Slight Not likely Very Low
Medium Slight Very Likely Very Low
Slight Not likely Very Low
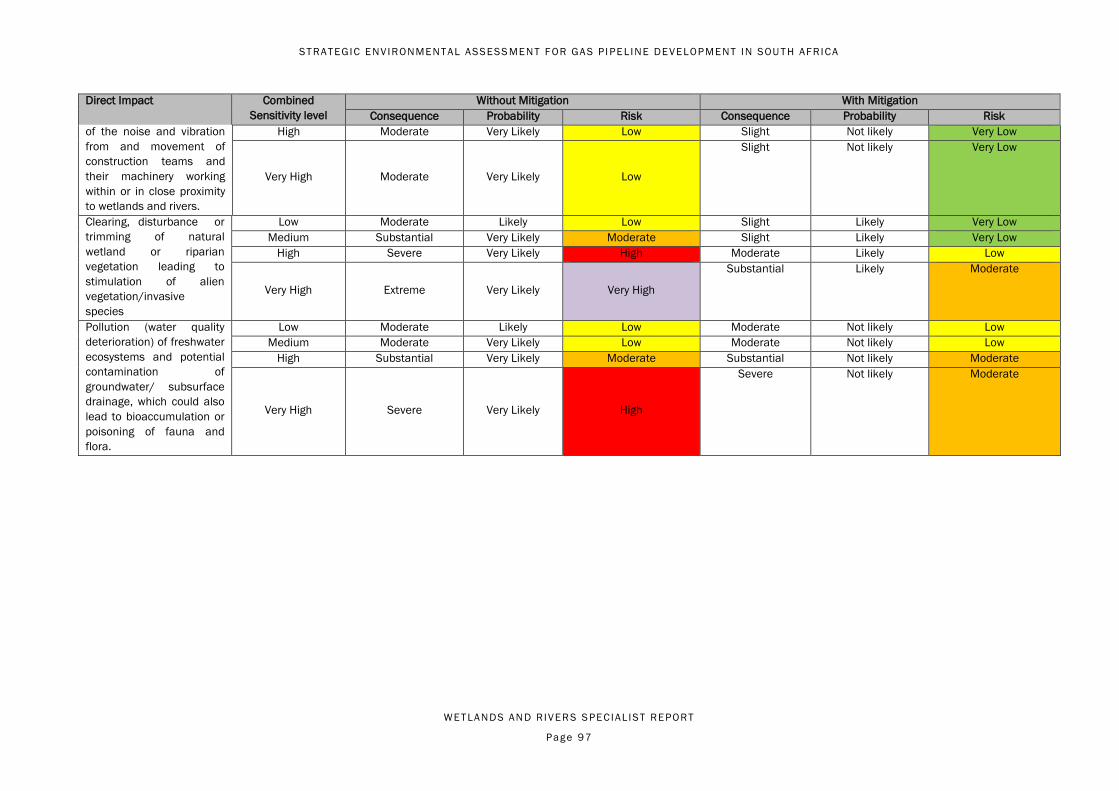
ST RAT EGIC ENVIRONMENT AL ASSESS MENT F OR GA S P I PE L INE DEVELOP MENT IN SOU T H AFRICA
WET LANDS AND R IVER S S PECIAL IST REPORT
Page 97
Direct Impact Combined
Sensitivity level
Without Mitigation With Mitigation
Consequence Probability Risk Consequence Probability Risk
of the noise and vibration
from and movement of
construction teams and
their machinery working
within or in close proximity
to wetlands and rivers.
High Moderate Very Likely Low Slight Not likely Very Low
Very High Moderate Very Likely Low
Slight Not likely Very Low
Clearing, disturbance or
trimming of natural
wetland or riparian
vegetation leading to
stimulation of alien
vegetation/invasive
species
Low Moderate Likely Low Slight Likely Very Low
Medium Substantial Very Likely Moderate Slight Likely Very Low
High Severe Very Likely High Moderate Likely Low
Very High Extreme Very Likely Very High
Substantial Likely Moderate
Pollution (water quality
deterioration) of freshwater
ecosystems and potential
contamination of
groundwater/ subsurface
drainage, which could also
lead to bioaccumulation or
poisoning of fauna and
flora.
Low Moderate Likely Low Moderate Not likely Low
Medium Moderate Very Likely Low Moderate Not likely Low
High Substantial Very Likely Moderate Substantial Not likely Moderate
Very High Severe Very Likely High
Severe Not likely Moderate
ST RAT EGIC ENVIRONMENT AL ASSESS MENT F OR GA S P I PE L INE DEVELOP MENT IN SOU T H AFRICA
WET LANDS AND R IVER S S PECIAL IST REPORT
Page 98
9 BEST PRACTICE GUIDELINES AND MONITORING REQUIREMENTS 1
This section provides “best practice” (or “good practice”) guidelines and management actions (including 2
relevant standards and protocols) that cover the following development stages, and include practical, 3
target-directed recommendations for monitoring of specified aspects raised in previous sections: During 4
planning, construction, operations, rehabilitation. These guidelines and monitoring requirements must also 5
take into consideration mitigation measures provided in Section 0. 6
7
9.1 Planning phase 8
The planning phase for gas pipeline development through firstly establishing preferred pipeline routings 9
and alignments, and needs for ancillary infrastructure (e.g. access roads, water abstraction points, etc.) has 10
the potential to greatly reduce impacts on freshwater ecosystems and associated fauna and flora through 11
simply avoiding areas of very high sensitivity, and as far as possible avoiding areas of high sensitivity. In 12
order to significantly reduce potential impacts on freshwater biodiversity, then sub-quaternary catchments 13
classified with a very high or high sensitivity should be avoided. Where these areas cannot be avoided, 14
then a detailed desktop investigation should be followed to determine whether the gas pipeline alignment 15
and development footprint can avoid the actual freshwater ecosystems (i.e. wetland and river habitats) and 16
associated buffers (see Section 6.1). This process should also be followed for all other sub-quaternary 17
catchments (including medium and low sensitivities). 18
19
Where it is impossible to avoid freshwater ecosystems (i.e. wetland and river habitats) and associated 20
buffers altogether, then it will be necessary to undertake more detailed specialist studies, impacts 21
assessments, and if necessary investigate needs and opportunities for offsets. Preference should be given 22
to position of gas pipelines within already disturbed/degraded areas (e.g. freshwater ecosystems and 23
buffers that are already invaded by IAPs). Mitigation specific to impact significance should be considered 24
that is cognisant of the mitigation hierarchy, where very high significance impacts are avoided, while high 25
and medium significance impacts are mitigated as far as possible. Offsets should only be considered once 26
alternatives and mitigation measures have been exhausted, and in instances where it is provided that there 27
are significant residual impacts due to the proposed development. Any freshwater ecosystems that will be 28
affected by gas pipeline development must be subject to a project level assessment. 29
30
9.2 Construction phase 31
This phase may include the establishment of ROWs and construction of pipelines and pigging stations, and 32
will thus include a number of impacts typical of construction activities, such as disturbance to wildlife 33
through noise/light pollution, creation of dust, erosion and degradation/disturbance of habitats and 34
vegetation (including areas for access via roads and servitudes and movement of heavy machinery), and 35
bulldozing and vegetation/habitat clearing. Specific measures and actions required during the construction 36
phase are presented in Section 0, but key to the process to include: 37
38
Timing of construction activities to occur in the dry season as much as possible; 39
Appointment and involvement of an ECO to provide oversight and guidance to all construction 40
activities, as well as ensure full consideration and implementation of the EMPr; and 41
Environmental monitoring (or biomonitoring) required for pre-construction, during construction and 42
post construction at strategically selected monitoring sites based on additional detail specified in 43
Section 9.5 below. 44
45
9.3 Operations phase 46
This phase will predominantly include activities typical of routine maintenance, such as clearing/trimming 47
of natural wetland or riparian vegetation (to maintain pipeline servitudes), as well as IAP control and 48
application of herbicides. Specific measures to be considered are provided in in Section 9.1. 49
ST RAT EGIC ENVIRONMENT AL ASSESS MENT F OR GA S P I PE L INE DEVELOP MENT IN SOU T H AFRICA
WET LANDS AND R IVER S S PECIAL IST REPORT
Page 99
9.4 Rehabilitation and post closure 1
Rehabilitation and post-closure measures would be mostly required for ROWs within or in proximity to 2
freshwater ecosystems, as well as for areas degraded by access routes, operation of vehicles/heavy 3
machinery, and infestation of servitudes by IAPs. In general, the following processes/procedures as 4
recommended by James and King (2010): 5
6
Initiation – to assemble the rehabilitation project team/specialists, identify problem/target areas, 7
establish reference condition and desired states, and define rehabilitation targets and objectives; 8
Planning- to account for constraints, budgeting and timeframes; 9
Analysis – evaluation of alternatives and strategies to achieve the objectives, and to develop 10
preliminary designs and inform feasibility; 11
Implementation – a including detailed engineering designs, construction and inspections; and 12
Monitoring – to establish need for maintenance and repair of interventions, as well as provide 13
feedback regarding success and failure. 14
15
Additional points to be considered regarding rehabilitation of degraded areas within and adjacent to 16
freshwater ecosystems include: 17
18
IAP clearing and control – an IAP control programme should be developed and implemented based 19
on site-specific details, including, but not limited to, types of IAPs, growth forms, densities and 20
levels of infestation, potential dispersal mechanisms, knock-on impacts to freshwater ecosystems 21
caused during implementation (e.g. herbicide drift and contamination), etc.; 22
Erosion control and re-vegetation – the objective should be to establish indigenous vegetation 23
cover as soon as possible, as well as to control and limit secondary impacts caused by rainfall-24
runoff. Where necessary geotextile fabrics, brush mattresses/bundles, geocells, and hydroseeding 25
with a suitable grass seed mix should be considered, while more severe cases of erosion/bank 26
collapse will require more advanced stabilisation methods (e.g. reshaping, planting, concrete 27
blocks, riprap, gabions/reno mattresses, etc.). 28
9.5 Monitoring requirements 29
Sites/areas where freshwater ecosystems are likely to be affected by gas pipeline development, according 30
to the various phases of development (including rehabilitation), appropriate measures of monitoring should 31
be considered, including: 32
33
Upstream and downstream biomonitoring to include appropriate indicators/measures of assessing 34
rivers (e.g. diatoms, water quality/clarity, macro-invertebrates using the SASS5 method, instream 35
and riparian habitat using the Index of Habitat Integrity (IHI) method) and wetland habitats (e.g. 36
WET-Health and WET-EcoServices) of a potential impact is recommended at suitable sites to be 37
determined in-field by a specialist. 38
Monitoring/sampling is to be conducted by suitably qualified specialists (e.g. DWS accredited SASS 39
5 practitioners) with sufficient experience in assessing aquatic ecology and water quality; 40
A single sampling event is recommended prior to construction taking place to serve as a reference 41
condition; 42
Monthly monitoring is recommended for the duration of construction to evaluate trends; 43
Biannual monitoring is recommended thereafter during the operation phase, up to the point in time 44
when the monitoring can establish that the systems are stable; 45
Fixed point photography to monitor changes and long term impacts. 46
47
ST RAT EGIC ENVIRONMENT AL ASSESS MENT F OR GA S P I PE L INE DEVELOP MENT IN SOU T H AFRICA
WET LANDS AND R IVER S S PECIAL IST REPORT
Page 10 0
10 GAPS IN KNOWLEDGE 1
The following gaps in knowledge are presented as follows in terms of influencing the freshwater 2
assessment: 3
4
This SEA study was developed using available spatial data covering freshwater habitats and 5
species, and these datasets are not exhaustive across the entire study area. Species occurrence 6
data in particular is only based on known records, and thus does not necessarily account for the 7
true distribution of species. Furthermore, occurrence data for certain taxanomic groups is poorly 8
represented, particularly in certain corridors (e.g. Odonata within the Phase 6 and Inland corridors, 9
as well as in large parts of the Phase 3 and 7 corridors). 10
Complete data of wetland habitat that includes characterisation of wetland condition and HGM 11
units, was not available for the purpose of determining threat status of wetlands based on HGM 12
type. The conservative approach that was adopted in based on the threat status derived for the 13
broader-scale wetland vegetation groups. 14
Species-level data and conservation assessments is limited for certain taxanomic groups, notably 15
aquatic invertebrates. Thus, in the case of invertebrates (excluding Family: Odonata), only family-16
level data was used. 17
This study does not make use of any ground-truthing and verification as a means to validate 18
system importance and sensitivity, and therefore assumes that the data obtained is accurate and 19
representative of the on-the-ground situation. The precautionary approach is to ensure that 20
ground-truthing and infield assessments will be required once the gas pipeline alignments have 21
been established (including alternatives), especially in the more sensitive areas. This will be 22
particularly important to ensure that the extent/boundary of freshwater habitats (including the 23
adjacent buffer zones), as well as the presence of conservation important species, is confirmed 24
firstly, then avoided and/or appropriately managed. 25
As with any large-scale project the likelihood for cumulative impacts developing are potentially 26
great, especially when considering the knock-ons effects that gas development could have on 27
other developments that in-turn also may impact on freshwater systems. This study obviously does 28
not account for full extent of cumulative impacts linked both directly gas development (e.g. gas-to-29
power and storage facilities) and indirectly (through other developments that respond to the 30
distribution of gas as a source of power. 31
32
33
11 CONCLUSIONS AND FURTHER RECOMMENDATIONS 34
Biodiversity impacts, unfortunately, are unavoidable when developing large-scale projects such as a 35
national-scale network of gas pipelines. This is particularly the case when considering that these linear 36
developments need to avoid human settlement (and other areas with anthropogenic significance, e.g. 37
large/viable agricultural areas) as much as possible to prevent socio-economic impacts. Despite this, 38
impacts to local and regional biodiversity assets can be substantially reduced through careful strategic level 39
planning and design which consider areas of concern. 40
41
The sensitivity maps presented herein are based on specifically developed methods that enabled spatial 42
integration of a broad suite of data depicting freshwater ecosystems and associated fauna and flora. 43
Outputs include a series of four-tiered sensitivity maps that are intended to be used proactively in terms of 44
planning gas pipeline development footprints, including servitude negotiations and potential land 45
acquisitions, such that environmental impacts to freshwater ecosystems are minimised. The maps also 46
indicate those areas where development is likely to be able to proceed with minimal risk and needs for EA. 47
48
The sensitivity maps and desktop analyses can also be used for any other planned development within the 49
corridors that may impact freshwater ecosystems. Potential impacts and associated mitigation measures 50
identified in this SEA are related specifically to gas pipeline development and are not generally applicable 51
to other types of development. 52
53
ST RAT EGIC ENVIRONMENT AL ASSESS MENT F OR GA S P I PE L INE DEVELOP MENT IN SOU T H AFRICA
WET LANDS AND R IVER S S PECIAL IST REPORT
Page 10 1
Pipeline routing will need to include an integration of all specialist studies and GIS layers to develop 1
something akin to a Marxan cost surface. It is assumed that a measure of slope will be factored in the 2
routing optimisation, as it is applicable across a number of specialist fields. Specialist input will still be 3
required to aid in the identification of the preferred option and refine the final pipeline route through the 4
identified corridor/s based on more detailed desktop and infield assessments. Ultimately, pipeline 5
alignment and development should avoid areas of very high sensitivity, and as far as possible avoid areas a 6
high sensitivity. Where this is not possible, more site-specific specialist studies will need to be conducted to 7
include further desktop verification with ground-truthing. Specific considerations for additional specialist 8
studies include: 9
Details for more sensitive areas, and 10
Catchment-scale evaluation and oversight; 11
Confirmation of occurrence of species conservation concern through range/habitat modelling and 12
field surveys; 13
Identify primary receivers, major impacts and most effective site-specific mitigation measures 14
along with sensitivity specific mitigation measure; and 15
Undertake pre-construction walk throughs. 16
17
18
ST RAT EGIC ENVIRONMENT AL ASSESS MENT F OR GA S P I PE L INE DEVELOP MENT IN SOU T H AFRICA
WET LANDS AND R IVER S S PECIAL IST REPORT
Page 10 2
12 REFERENCES 1
ADU, (2017). Animal Demography Unit: FrogMAP Virtual Museum. [online] Available at: 2
http://vmus.adu.org.za/?vm=FrogMAP [Accessed Feb. 2018]. 3
4
Bates, M.F., Branch, W.R., Bauer, A.M., Burger, M., Marais, J., Alexander, G.J. and de Villiers, M. (eds.) (2014). Atlas and 5
Red List of the Reptiles of South Africa, Lesotho and Swaziland. South African National Biodiversity Institute, 6
Pretoria: Suricata 1, p. 485. 7
8
Breen, C.M., Quinn, N.W. and Mander, J.J., (1997). Wetlands conservation and management in southern Africa: 9
Summary of the SADC wetlands conservation survey reports. IUCN ROSA. Harare. 10
11
CapeNature. (2017). The Western Cape Biodiversity Spatial Plan Handbook. Authored by Pool-Stanvliet, R., Duffell-12
Canham, A., Pence, G. & Smart, R. Stellenbosch: CapeNature. 13
14
Child, M.F., Roxburgh, L., Do Linh San, E., Raimondo, D., Davies-Mostert, H.T., (eds) (2016). The 2016 Red List of 15
Mammals of South Africa, Swaziland and Lesotho. South African National Biodiversity Institute and 16
Endangered Wildlife Trust, South Africa. 17
18
Coetzer W., (2017). Occurrence records of southern African aquatic biodiversity. Version 1.10. The South African 19
Institute for Aquatic Biodiversity. Occurrence dataset https://doi.org/10.15468/pv7vds accessed via GBIF.org 20
on 2018-09-05. 21
22
Collins, N., (2017). National Biodiversity Assessment (NBA) 2018. Wetland Probability Map. [online] Available at: 23
https://csir.maps.arcgis.com/apps/MapJournal/ 24
index.html?appid=8832bd2cbc0d4a5486a52c843daebcba# [Accessed Feb. 2018]. 25
26
Compaan, P., (2011). Technical report: Gauteng conservation plan version 3.3 (C-Plan 3.3), report prepared for the 27
Gauteng Department of Agriculture and Rural Development, Johannesburg, South Africa. [online] Available at: 28
https://www.researchgate.net/publication/315771900_Gauteng_Conservation_Plan_Version_3.3_C-29
Plan_3.3. 30
31
Cowan, G.I., (1995). Wetlands of South Africa. Department of Environmental Affairs and Tourism. Pretoria. 32
Driver, A., J. L. Nel, K. Snaddon, K. Murray, D. J. Roux, L. Hill, E. R. Swartz, J. Manuel, and N. Funke, (2011). 33
Implementation manual for freshwater ecosystem priority areas. Water Research Commission, WRC Report 34
No. K5/1801/1/11. 35
36
DWS (2009) Working copies of sub-quaternary catchments for delineation of management areas for the National 37
Freshwater Ecosystem Priority Areas (NFEPA) in South Africa project - 2009 draft version. [online] Department 38
of Water and Sanitation RQIS-RDM, Pretoria. Available at: http://www.dwa.gov.za/iwqs/gis_data/ [Accessed 39
Feb. 2018]. 40
41
DWS, (2014). A Desktop Assessment of the Present Ecological State, Ecological Importance and Ecological Sensitivity 42
per Sub Quaternary Reaches for Secondary Catchments in South Africa. [online] Department of Water and 43
Sanitation RQIS-RDM, Pretoria. Available at: 44
https://www.dwa.gov.za/iwqs/rhp/eco/peseismodel.aspx [Accessed Feb. 2018]. 45
46
DWS, (2015) Invertebrate Distribution Records. [online] Department of Water and Sanitation RQIS-RDM, Pretoria. 47
Available at: http://www.dwa.gov.za/iwqs/biomon /inverts/invertmaps.htm/ and 48
http://www.dwa.gov.za/iwqs/biomon/inverts/ invertmaps_other.htm/ [Accessed Feb. 2018]. 49
50
ECBCP, (2017). Eastern Cape Biodiversity Conservation Plan Handbook. Department of Economic Development and 51
Environmental Affairs (King Williams Town). Compiled by G. Hawley, P. Desmet and D. Berliner. 52
53
EKZNW, (2007). Archived KZN SCP: Freshwater Systematic Conservation Plan. Available at: 54
http://bgis.sanbi.org/SpatialDataset/Detail/333 55
56
IUCN, (2012). Guidelines for application of IUCN Red List Criteria at Regional and National Levels: Version 4.0. IUCN: 57
Gland, Switzerland, and Cambridge, UK, p.41. 58
59
ST RAT EGIC ENVIRONMENT AL ASSESS MENT F OR GA S P I PE L INE DEVELOP MENT IN SOU T H AFRICA
WET LANDS AND R IVER S S PECIAL IST REPORT
Page 10 3
IUCN, (2017). The IUCN Red List of Threatened Species, 2017.3. [online] Available at: http://www.iucnredlist.org/ 1
[Accessed Feb. and Mar. 2018]. 2
3
James, C.S and King, J.M., (2010). Ecohydraulics for South African Rivers: A Review and Guide. Water Research 4
Commission, WRC Report No. TT 453/10. The publication of this report emanates from a project entitled: 5
South African Handbook on Environmental River Hydraulics (WRC Project No. K5/1767). 6
Kleynhans, C. J., (2000). Desktop estimates of the ecological importance and sensitivity categories (EISC), default 7
ecological management classes (DEMC), present ecological status categories (PESC), present attainable 8
ecological management classes (present AEMC), and best attainable ecological management class (best 9
AEMC) for quaternary catchments in South Africa. Institute for Water Quality Studies, Department of Water 10
Affairs and Forestry, Pretoria, South Africa. 11
12
Kleynhans, C. J., Thirion, C., & Moolman, J., (2005). A level I river ecoregion classification system for South Africa, 13
Lesotho and Swaziland. Pretoria: Department of Water Affaris and Forestry. 14
15
Kotze, D.C. and Breen, C.M., (1994). Agricultural land-use impacts on wetland functional values. Water Research 16
Commission, Pretoria, WRC Report no. 501/3/94. 17
18
Kotze, D.C., Breen, C.M. and Quinn, N.W., (1995). Wetland losses in South Africa. In: COWAN GI (ed.) Wetlands of South 19
Africa. Department of Environmental Affairs and Tourism. Pretoria. 20
21
Mecenero, S., Ball, J.B., Edge, D.A., Hamer, M.L., Hening, G.A., Krüger, M., Pringle, E.L., Terblanche, R.F. and Williams, 22
M.C. (eds), (2013). Conservation Assessment of Butterflies of South Africa, Lesotho and Swaziland: Red List 23
and Atlas. Johannesburg: Saftronics (Pty) Ltd., and Cape Town: Animal Demography Unit, p. 676. 24
25
Minter, L.R., Burger, M., Harrison, J.A., Braack, H.H., Bishop, P.J. and Kloefder, D. (eds), (2004). Atlas and Red Data 26
Book of the Frogs of South Africa, Lesotho and Swaziland. Washington, U.S.A: Smithsonian Institute, Volume 27
9 of the Monitoring and Assessment of Biodiversity Series, p. 360. 28
29
Mitchell, F., (2002). Shoreland buffers: Protecting water quality and biological diversty (New Hampshire). Lewis 30
Publishers. Boca Raton. 31
32
MTPA, CSIR, SANBI, (2011). Mpumalanga Biodiversity Sector Plan (MBSP) Freshwater Assessment. [online] Available 33
at: http://bgis.sanbi.org/SpatialDataset/Detail/588 34
35
Nel, J.L. and Driver, A., (2012). South African National Biodiversity Assessment 2011: Technical Report. Volume 2: 36
Freshwater Component. Stellenbosch: Council for Scientific and Industrial Research. CSIR Report Number: 37
CSIR/NRE/ECO/IR/2012/0022/A. 38
Nel, J.L., Murray, K.M., Maherry, A.M., Petersen, C.P., Roux, D.J., Driver, A., Hill, L., Van Deventer, H., Funke, N., Swartz, 39
E.R., Smith-Adao, L.B., Mbona, N., Downsborough, L. and Nienaber, S., (2011). Technical Report for the 40
National Freshwater Ecosystem Priority Areas project. Pretoria: Water Research Commission, WRC Report No. 41
K5/1801. 42
43
North West Department of Rural, Environment and Agricultural Development (READ), (2015) North West Biodiversity 44
Sector Plan. North West Provincial Government, Mahikeng. December 2015 45
46
Raimondo, D., von Staden, L., Foden, W., Victor, J.E., Helme, N.A., Turner, R.C., Kamundi, D.A. and Manyama, P.A., 47
(2009). Red List of South African Plants. Pretoria: South African National Biodiversity Institute, Strelitzia 25, p. 48
668. 49
50
Rudman, J., Gauché, P. and Esler, K.J., (2017). Direct environmental impacts of solar power in two arid biomes: An 51
initial investigation. South African Journal of Science, 113, pp. 1-13. 52
53
Samways, M.J. and Simaika, J.P., (2016). Manual of Freshwater Assessment for South Africa: Dragonfly Biotic Index. 54
South African National Biodiversity Institute, Pretoria: Suricata 2, p. 224. 55
56
SANBI, (2017). Red List of South African Plants: An online checklist. Version 2017.1. [online] Available at: 57
redlist.sanbi.org [Accessed Feb. and Mar. 2018]. 58
59
SANBI, (2018). Threatened Species Programme. [online] Available at: http://redlist.sanbi.org/ [Accessed Feb. and Mar. 60
2018]- Data requested from SANBI. 61
ST RAT EGIC ENVIRONMENT AL ASSESS MENT F OR GA S P I PE L INE DEVELOP MENT IN SOU T H AFRICA
WET LANDS AND R IVER S S PECIAL IST REPORT
Page 10 4
Scott-Shaw, C.R. and Escott, B.J. (eds.), (2011). KwaZulu-Natal Provincial Pre-Transformation Vegetation Type Map – 1
2011. Pietermaritzburg: Ezemvelo KZN Wildlife Biodiversity Conservation Planning Division, 2
kznveg05v2_1_11_wll.zip (unpublished GIS coverage). 3
4
Todd, S., Kirkwood, D., Snaddon, K. and Ewart-Smith, J., (2016). Terrestrial and Aquatic Biodiversity Scoping 5
Assessment Specialist Report. In: Strategic Environmental Assessment for Electricity Grid Infrastructure in 6
South Africa. Report prepared by the CSIR, DEA, Eskom and SANBI, Appendix C.3, pp. 1-169. 7
8
Turner, A.A. and de Villiers, A.L., (2017). Amphibians. In: Turner, A.A. (ed.). Western Cape Province State of Biodiversity 9
2017. CapeNature Scientific Services, Stellenbosch. 10
11
Turner, R.K., van den Bergh, J.C.J.M. and Brouwer, R., (2003). Managing wetlands: An ecological economics approach. 12
Edward Elgar, Cheltenham, UK. 13
14
Van der Linde, M., (2006). Compendium of South African Environmental Legislation. Pretoria University, Pretoria, South 15
Africa: Pretoria University Law Press (PULP), p. 573. 16
17
Veldtman, A., Dippenaar-Schoeman, A.S., Samways, M.J., Veldtman, R., and du Plessis, D., (2017). Arthropods. In: 18
Turner, A.A. (ed.). Western Cape Province State of Biodiversity 2017. CapeNature Scientific Services, 19
Stellenbosch. 20
21
22
23

ST RAT EGIC ENVIRONMENT AL ASSESS MENT F OR GA S P I PE L INE DEVELOP MENT IN SOU T H AFRICA
WET LANDS AND R IVER S S PECIAL IST REPORT
Page 10 5
APPENDICES 1
2
Appendix 1: Selected flora used in the assessment of freshwater biota 3
4
Family Species Conservation status
Rutaceae Agathosma sedifolia EN
Fabaceae Albizia suluensis EN
Apiaceae Alepidea attenuata NT
Asphodelaceae Aloe simii CR
Aponogetonaceae Aponogeton angustifolius NT
Aponogetonaceae Aponogeton fugax EN
Asteraceae Arctotheca forbesiana VU
Apocynaceae Asclepias gordon-grayae EN
Apocynaceae Aspidonepsis cognata NT
Asteraceae Athanasia capitata EN
Salviniaceae Azolla pinnata subsp. africana NT
Plantaginaceae Bacopa monnieri NT
Plantaginaceae Callitriche bolusii DD
Cyperaceae Carex subinflata VU
Rhizophoraceae Cassipourea gummiflua var. verticillata VU
Cyperaceae Catabrosa drakensbergense VU
Rosaceae Cliffortia ericifolia EN
Rhamnaceae Colubrina nicholsonii VU
Asteraceae Cotula eckloniana VU
Asteraceae Cotula filifolia NT
Asteraceae Cotula myriophylloides CR
Asteraceae Cotula paludosa VU
Asteraceae Cotula pusilla VU
Crassulaceae Crassula tuberella NT
Amaryllidaceae Crinum campanulatum NT
Amaryllidaceae Crinum moorei VU
Tecophilaeaceae Cyanella aquatica EN
Cyperaceae Cyathocoma bachmannii VU
Cyperaceae Cyperus sensilis NT
Amaryllidaceae Cyrtanthus eucallus VU
Acanthaceae Dicliptera magaliesbergensis VU
Orchidaceae Disa cernua VU
Orchidaceae Disa extinctoria NT
Orchidaceae Disa flexuosa NT
Orchidaceae Disa scullyi EN
Orchidaceae Disa zuluensis EN
Aizoaceae Disphyma dunsdonii VU
Asteraceae Dymondia margaretae EN
Apocynaceae Ectadium virgatum NT
Restionaceae Elegia verreauxii VU
Cyperaceae Eleocharis schlechteri DD
Aizoaceae Erepsia brevipetala EN
Ericaceae Erica alexandri subsp. alexandri CR
Ericaceae Erica bakeri CR
Ericaceae Erica chrysocodon CR
Ericaceae Erica hansfordii CR
Ericaceae Erica heleogena CR
Ericaceae Erica margaritacea CR
Ericaceae Erica melanacme EN
Ericaceae Erica purgatoriensis VU
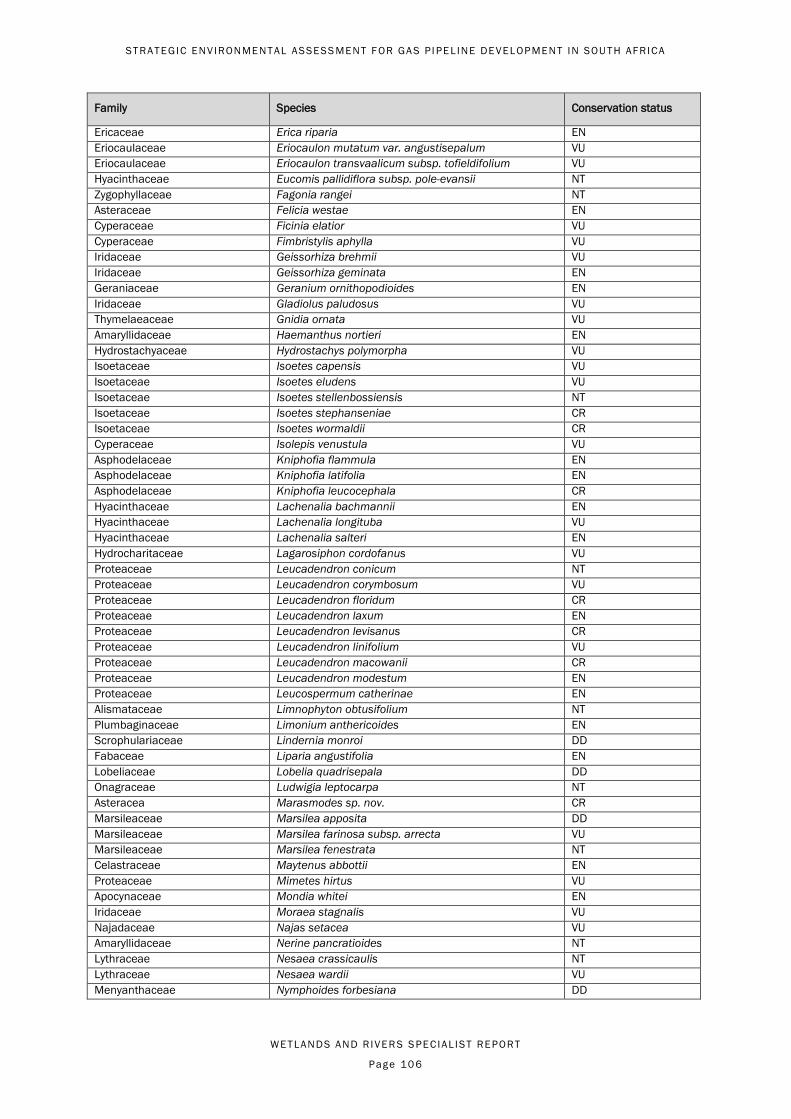
ST RAT EGIC ENVIRONMENT AL ASSESS MENT F OR GA S P I PE L INE DEVELOP MENT IN SOU T H AFRICA
WET LANDS AND R IVER S S PECIAL IST REPORT
Page 10 6
Family Species Conservation status
Ericaceae Erica riparia EN
Eriocaulaceae Eriocaulon mutatum var. angustisepalum VU
Eriocaulaceae Eriocaulon transvaalicum subsp. tofieldifolium VU
Hyacinthaceae Eucomis pallidiflora subsp. pole-evansii NT
Zygophyllaceae Fagonia rangei NT
Asteraceae Felicia westae EN
Cyperaceae Ficinia elatior VU
Cyperaceae Fimbristylis aphylla VU
Iridaceae Geissorhiza brehmii VU
Iridaceae Geissorhiza geminata EN
Geraniaceae Geranium ornithopodioides EN
Iridaceae Gladiolus paludosus VU
Thymelaeaceae Gnidia ornata VU
Amaryllidaceae Haemanthus nortieri EN
Hydrostachyaceae Hydrostachys polymorpha VU
Isoetaceae Isoetes capensis VU
Isoetaceae Isoetes eludens VU
Isoetaceae Isoetes stellenbossiensis NT
Isoetaceae Isoetes stephanseniae CR
Isoetaceae Isoetes wormaldii CR
Cyperaceae Isolepis venustula VU
Asphodelaceae Kniphofia flammula EN
Asphodelaceae Kniphofia latifolia EN
Asphodelaceae Kniphofia leucocephala CR
Hyacinthaceae Lachenalia bachmannii EN
Hyacinthaceae Lachenalia longituba VU
Hyacinthaceae Lachenalia salteri EN
Hydrocharitaceae Lagarosiphon cordofanus VU
Proteaceae Leucadendron conicum NT
Proteaceae Leucadendron corymbosum VU
Proteaceae Leucadendron floridum CR
Proteaceae Leucadendron laxum EN
Proteaceae Leucadendron levisanus CR
Proteaceae Leucadendron linifolium VU
Proteaceae Leucadendron macowanii CR
Proteaceae Leucadendron modestum EN
Proteaceae Leucospermum catherinae EN
Alismataceae Limnophyton obtusifolium NT
Plumbaginaceae Limonium anthericoides EN
Scrophulariaceae Lindernia monroi DD
Fabaceae Liparia angustifolia EN
Lobeliaceae Lobelia quadrisepala DD
Onagraceae Ludwigia leptocarpa NT
Asteracea Marasmodes sp. nov. CR
Marsileaceae Marsilea apposita DD
Marsileaceae Marsilea farinosa subsp. arrecta VU
Marsileaceae Marsilea fenestrata NT
Celastraceae Maytenus abbottii EN
Proteaceae Mimetes hirtus VU
Apocynaceae Mondia whitei EN
Iridaceae Moraea stagnalis VU
Najadaceae Najas setacea VU
Amaryllidaceae Nerine pancratioides NT
Lythraceae Nesaea crassicaulis NT
Lythraceae Nesaea wardii VU
Menyanthaceae Nymphoides forbesiana DD
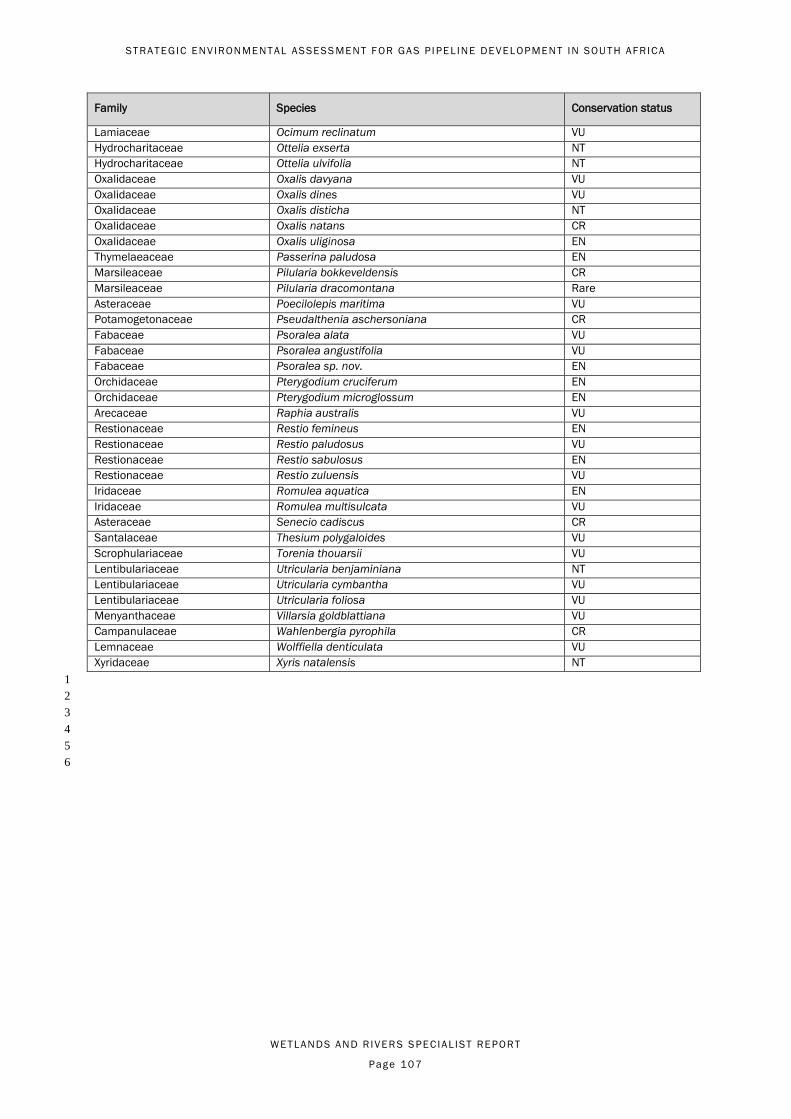
ST RAT EGIC ENVIRONMENT AL ASSESS MENT F OR GA S P I PE L INE DEVELOP MENT IN SOU T H AFRICA
WET LANDS AND R IVER S S PECIAL IST REPORT
Page 10 7
Family Species Conservation status
Lamiaceae Ocimum reclinatum VU
Hydrocharitaceae Ottelia exserta NT
Hydrocharitaceae Ottelia ulvifolia NT
Oxalidaceae Oxalis davyana VU
Oxalidaceae Oxalis dines VU
Oxalidaceae Oxalis disticha NT
Oxalidaceae Oxalis natans CR
Oxalidaceae Oxalis uliginosa EN
Thymelaeaceae Passerina paludosa EN
Marsileaceae Pilularia bokkeveldensis CR
Marsileaceae Pilularia dracomontana Rare
Asteraceae Poecilolepis maritima VU
Potamogetonaceae Pseudalthenia aschersoniana CR
Fabaceae Psoralea alata VU
Fabaceae Psoralea angustifolia VU
Fabaceae Psoralea sp. nov. EN
Orchidaceae Pterygodium cruciferum EN
Orchidaceae Pterygodium microglossum EN
Arecaceae Raphia australis VU
Restionaceae Restio femineus EN
Restionaceae Restio paludosus VU
Restionaceae Restio sabulosus EN
Restionaceae Restio zuluensis VU
Iridaceae Romulea aquatica EN
Iridaceae Romulea multisulcata VU
Asteraceae Senecio cadiscus CR
Santalaceae Thesium polygaloides VU
Scrophulariaceae Torenia thouarsii VU
Lentibulariaceae Utricularia benjaminiana NT
Lentibulariaceae Utricularia cymbantha VU
Lentibulariaceae Utricularia foliosa VU
Menyanthaceae Villarsia goldblattiana VU
Campanulaceae Wahlenbergia pyrophila CR
Lemnaceae Wolffiella denticulata VU
Xyridaceae Xyris natalensis NT
1
2
3
4
5
6
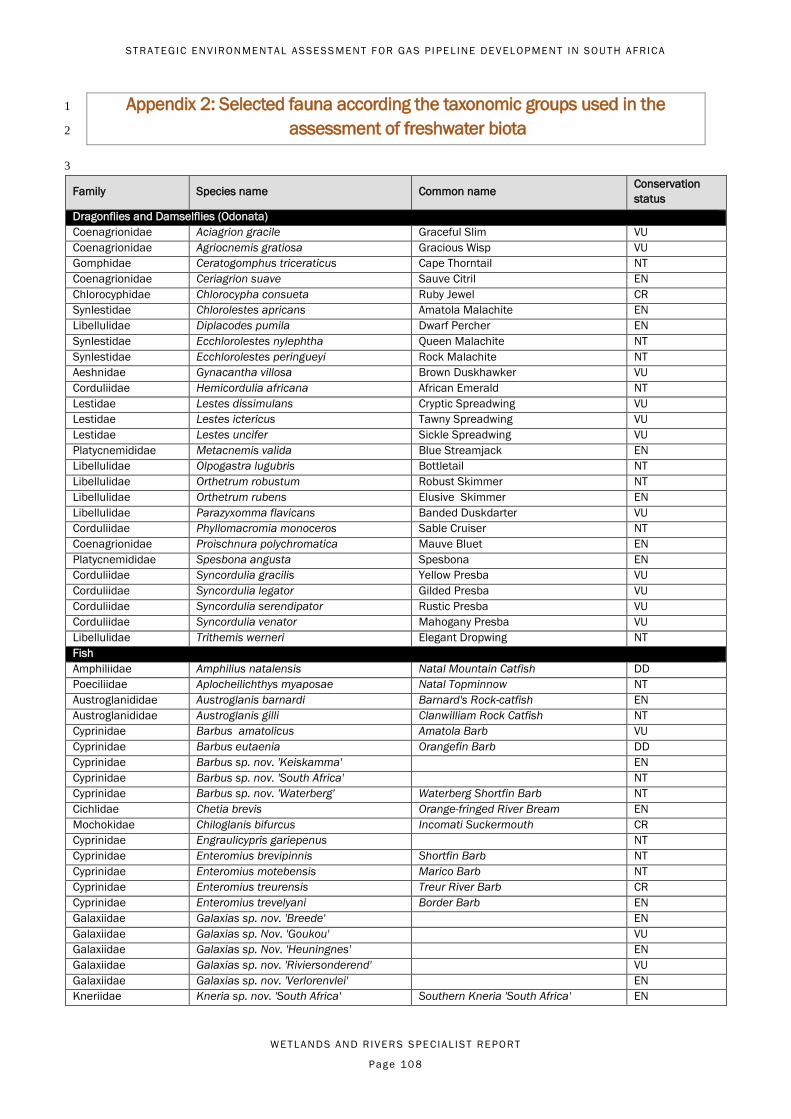
ST RAT EGIC ENVIRONMENT AL ASSESS MENT F OR GA S P I PE L INE DEVELOP MENT IN SOU T H AFRICA
WET LANDS AND R IVER S S PECIAL IST REPORT
Page 10 8
Appendix 2: Selected fauna according the taxonomic groups used in the 1
assessment of freshwater biota 2
3
Family Species name Common name Conservation
status
Dragonflies and Damselflies (Odonata)
Coenagrionidae Aciagrion gracile Graceful Slim VU
Coenagrionidae Agriocnemis gratiosa Gracious Wisp VU
Gomphidae Ceratogomphus triceraticus Cape Thorntail NT
Coenagrionidae Ceriagrion suave Sauve Citril EN
Chlorocyphidae Chlorocypha consueta Ruby Jewel CR
Synlestidae Chlorolestes apricans Amatola Malachite EN
Libellulidae Diplacodes pumila Dwarf Percher EN
Synlestidae Ecchlorolestes nylephtha Queen Malachite NT
Synlestidae Ecchlorolestes peringueyi Rock Malachite NT
Aeshnidae Gynacantha villosa Brown Duskhawker VU
Corduliidae Hemicordulia africana African Emerald NT
Lestidae Lestes dissimulans Cryptic Spreadwing VU
Lestidae Lestes ictericus Tawny Spreadwing VU
Lestidae Lestes uncifer Sickle Spreadwing VU
Platycnemididae Metacnemis valida Blue Streamjack EN
Libellulidae Olpogastra lugubris Bottletail NT
Libellulidae Orthetrum robustum Robust Skimmer NT
Libellulidae Orthetrum rubens Elusive Skimmer EN
Libellulidae Parazyxomma flavicans Banded Duskdarter VU
Corduliidae Phyllomacromia monoceros Sable Cruiser NT
Coenagrionidae Proischnura polychromatica Mauve Bluet EN
Platycnemididae Spesbona angusta Spesbona EN
Corduliidae Syncordulia gracilis Yellow Presba VU
Corduliidae Syncordulia legator Gilded Presba VU
Corduliidae Syncordulia serendipator Rustic Presba VU
Corduliidae Syncordulia venator Mahogany Presba VU
Libellulidae Trithemis werneri Elegant Dropwing NT
Fish
Amphiliidae Amphilius natalensis Natal Mountain Catfish DD
Poeciliidae Aplocheilichthys myaposae Natal Topminnow NT
Austroglanididae Austroglanis barnardi Barnard's Rock-catfish EN
Austroglanididae Austroglanis gilli Clanwilliam Rock Catfish NT
Cyprinidae Barbus amatolicus Amatola Barb VU
Cyprinidae Barbus eutaenia Orangefin Barb DD
Cyprinidae Barbus sp. nov. 'Keiskamma' EN
Cyprinidae Barbus sp. nov. 'South Africa' NT
Cyprinidae Barbus sp. nov. 'Waterberg' Waterberg Shortfin Barb NT
Cichlidae Chetia brevis Orange-fringed River Bream EN
Mochokidae Chiloglanis bifurcus Incomati Suckermouth CR
Cyprinidae Engraulicypris gariepenus NT
Cyprinidae Enteromius brevipinnis Shortfin Barb NT
Cyprinidae Enteromius motebensis Marico Barb NT
Cyprinidae Enteromius treurensis Treur River Barb CR
Cyprinidae Enteromius trevelyani Border Barb EN
Galaxiidae Galaxias sp. nov. 'Breede' EN
Galaxiidae Galaxias sp. Nov. 'Goukou' VU
Galaxiidae Galaxias sp. Nov. 'Heuningnes' EN
Galaxiidae Galaxias sp. nov. 'Riviersonderend' VU
Galaxiidae Galaxias sp. nov. 'Verlorenvlei' EN
Kneriidae Kneria sp. nov. 'South Africa' Southern Kneria 'South Africa' EN
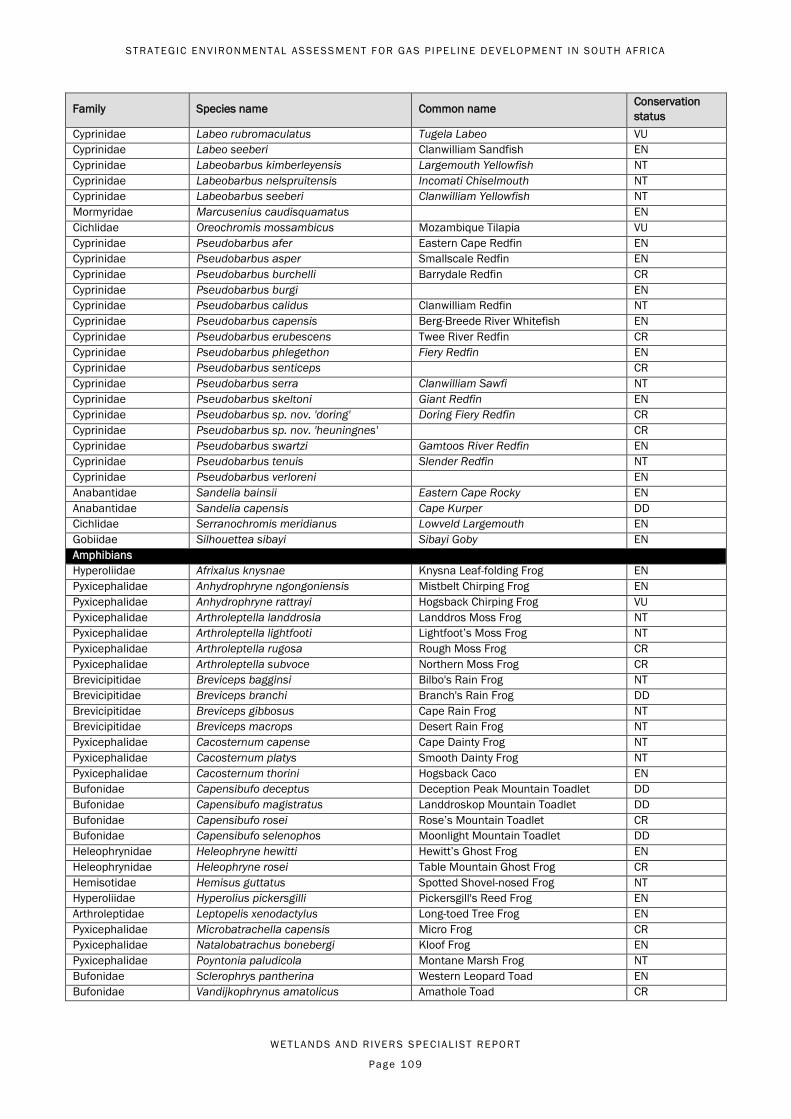
ST RAT EGIC ENVIRONMENT AL ASSESS MENT F OR GA S P I PE L INE DEVELOP MENT IN SOU T H AFRICA
WET LANDS AND R IVER S S PECIAL IST REPORT
Page 10 9
Family Species name Common name Conservation
status
Cyprinidae Labeo rubromaculatus Tugela Labeo VU
Cyprinidae Labeo seeberi Clanwilliam Sandfish EN
Cyprinidae Labeobarbus kimberleyensis Largemouth Yellowfish NT
Cyprinidae Labeobarbus nelspruitensis Incomati Chiselmouth NT
Cyprinidae Labeobarbus seeberi Clanwilliam Yellowfish NT
Mormyridae Marcusenius caudisquamatus EN
Cichlidae Oreochromis mossambicus Mozambique Tilapia VU
Cyprinidae Pseudobarbus afer Eastern Cape Redfin EN
Cyprinidae Pseudobarbus asper Smallscale Redfin EN
Cyprinidae Pseudobarbus burchelli Barrydale Redfin CR
Cyprinidae Pseudobarbus burgi EN
Cyprinidae Pseudobarbus calidus Clanwilliam Redfin NT
Cyprinidae Pseudobarbus capensis Berg-Breede River Whitefish EN
Cyprinidae Pseudobarbus erubescens Twee River Redfin CR
Cyprinidae Pseudobarbus phlegethon Fiery Redfin EN
Cyprinidae Pseudobarbus senticeps CR
Cyprinidae Pseudobarbus serra Clanwilliam Sawfi NT
Cyprinidae Pseudobarbus skeltoni Giant Redfin EN
Cyprinidae Pseudobarbus sp. nov. 'doring' Doring Fiery Redfin CR
Cyprinidae Pseudobarbus sp. nov. 'heuningnes' CR
Cyprinidae Pseudobarbus swartzi Gamtoos River Redfin EN
Cyprinidae Pseudobarbus tenuis Slender Redfin NT
Cyprinidae Pseudobarbus verloreni EN
Anabantidae Sandelia bainsii Eastern Cape Rocky EN
Anabantidae Sandelia capensis Cape Kurper DD
Cichlidae Serranochromis meridianus Lowveld Largemouth EN
Gobiidae Silhouettea sibayi Sibayi Goby EN
Amphibians
Hyperoliidae Afrixalus knysnae Knysna Leaf-folding Frog EN
Pyxicephalidae Anhydrophryne ngongoniensis Mistbelt Chirping Frog EN
Pyxicephalidae Anhydrophryne rattrayi Hogsback Chirping Frog VU
Pyxicephalidae Arthroleptella landdrosia Landdros Moss Frog NT
Pyxicephalidae Arthroleptella lightfooti Lightfoot’s Moss Frog NT
Pyxicephalidae Arthroleptella rugosa Rough Moss Frog CR
Pyxicephalidae Arthroleptella subvoce Northern Moss Frog CR
Brevicipitidae Breviceps bagginsi Bilbo's Rain Frog NT
Brevicipitidae Breviceps branchi Branch's Rain Frog DD
Brevicipitidae Breviceps gibbosus Cape Rain Frog NT
Brevicipitidae Breviceps macrops Desert Rain Frog NT
Pyxicephalidae Cacosternum capense Cape Dainty Frog NT
Pyxicephalidae Cacosternum platys Smooth Dainty Frog NT
Pyxicephalidae Cacosternum thorini Hogsback Caco EN
Bufonidae Capensibufo deceptus Deception Peak Mountain Toadlet DD
Bufonidae Capensibufo magistratus Landdroskop Mountain Toadlet DD
Bufonidae Capensibufo rosei Rose’s Mountain Toadlet CR
Bufonidae Capensibufo selenophos Moonlight Mountain Toadlet DD
Heleophrynidae Heleophryne hewitti Hewitt’s Ghost Frog EN
Heleophrynidae Heleophryne rosei Table Mountain Ghost Frog CR
Hemisotidae Hemisus guttatus Spotted Shovel-nosed Frog NT
Hyperoliidae Hyperolius pickersgilli Pickersgill's Reed Frog EN
Arthroleptidae Leptopelis xenodactylus Long-toed Tree Frog EN
Pyxicephalidae Microbatrachella capensis Micro Frog CR
Pyxicephalidae Natalobatrachus bonebergi Kloof Frog EN
Pyxicephalidae Poyntonia paludicola Montane Marsh Frog NT
Bufonidae Sclerophrys pantherina Western Leopard Toad EN
Bufonidae Vandijkophrynus amatolicus Amathole Toad CR
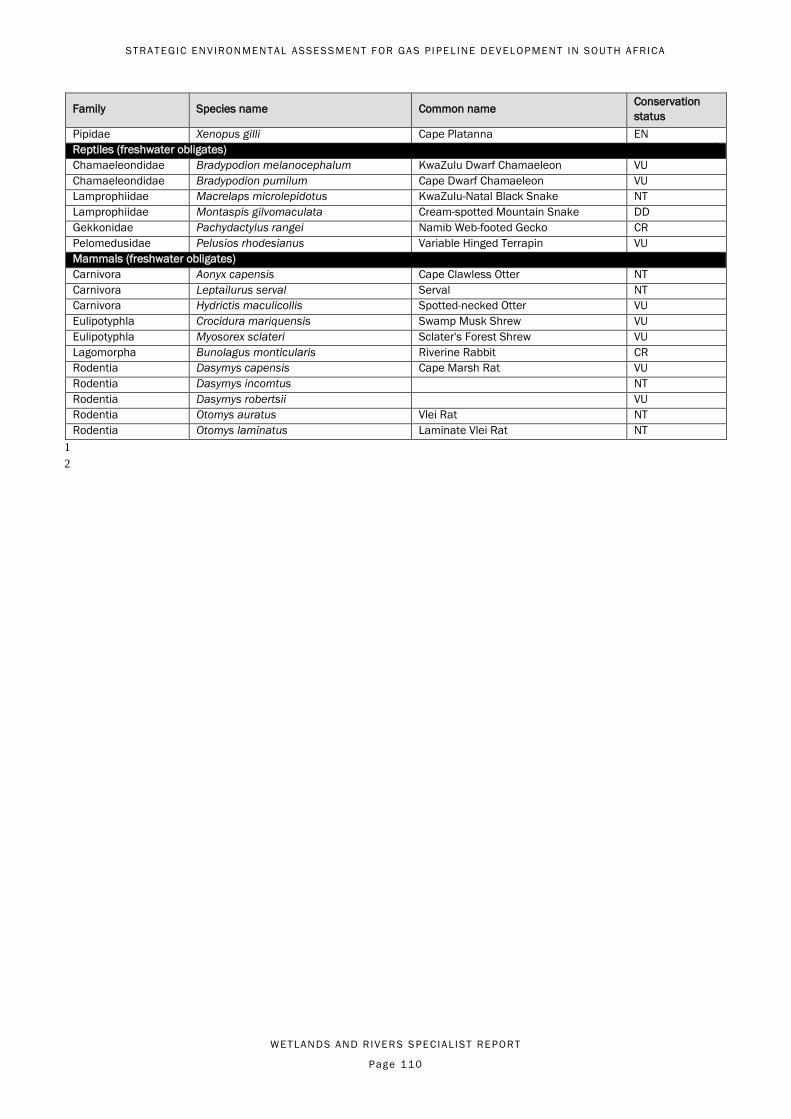
ST RAT EGIC ENVIRONMENT AL ASSESS MENT F OR GA S P I PE L INE DEVELOP MENT IN SOU T H AFRICA
WET LANDS AND R IVER S S PECIAL IST REPORT
Page 11 0
Family Species name Common name Conservation
status
Pipidae Xenopus gilli Cape Platanna EN
Reptiles (freshwater obligates)
Chamaeleondidae Bradypodion melanocephalum KwaZulu Dwarf Chamaeleon VU
Chamaeleondidae Bradypodion pumilum Cape Dwarf Chamaeleon VU
Lamprophiidae Macrelaps microlepidotus KwaZulu-Natal Black Snake NT
Lamprophiidae Montaspis gilvomaculata Cream-spotted Mountain Snake DD
Gekkonidae Pachydactylus rangei Namib Web-footed Gecko CR
Pelomedusidae Pelusios rhodesianus Variable Hinged Terrapin VU
Mammals (freshwater obligates)
Carnivora Aonyx capensis Cape Clawless Otter NT
Carnivora Leptailurus serval Serval NT
Carnivora Hydrictis maculicollis Spotted-necked Otter VU
Eulipotyphla Crocidura mariquensis Swamp Musk Shrew VU
Eulipotyphla Myosorex sclateri Sclater's Forest Shrew VU
Lagomorpha Bunolagus monticularis Riverine Rabbit CR
Rodentia Dasymys capensis Cape Marsh Rat VU
Rodentia Dasymys incomtus NT
Rodentia Dasymys robertsii VU
Rodentia Otomys auratus Vlei Rat NT
Rodentia Otomys laminatus Laminate Vlei Rat NT
1
2