freshwater discharge to young sund - zackenberg research station
TRANSCRIPT
Freshwater Discharge to Young Sund Measurements from Three Rivers
Project no.: B15-02-008
Asiaq Report 2012-17 December 2012

Freshwater Discharge to Young Sund, Measurements from Three Rivers 1
Asiaq Report 2012-17 December 2012
Introduction This report presents hydrological investigations of the freshwater input to Young Sund in North East Greenland carried out by Asiaq, Greenland Survey in summer 2012. The aim of the hydrological investigations has been to estimate the flow of water entering Young Sund at different locations. The main use of these results is for glacier mass balance studies and marine studies in Young Sund carried out by GlacioBasis and MarineBasis, respectively. The hydrological fieldwork and measurements were carried out in July and August 2012. During the first field trip (July 27 to August 6) suitable measuring sites were identified during reconnaissance trips, measuring stations were established and manual discharge measurements were carried out. During the second field trip (August 13 to 19) additional manual discharge measurements were carried out and equipment was collected. The data are compared with the discharge at Zackenbergelven. The data from Zackenbergelven that are used in this report will be reported in the ZERO 18th Annual Report 2012, which will be published in 2013. The work is funded by the Dancea funding programme administered by the Danish Energy Agency as a part of the Greenland Ecosystem Monitoring programme (GEM). Prepared by:
Morten Larsen Per Hangaard Dorthe Petersen Kisser Thorsøe
Init./date: Init./date: Init./date: Init./date:
Checked by: Henrik Fenger Jeppesen Init./date:

Freshwater Discharge to Young Sund, Measurements from Three Rivers 2
Asiaq Report 2012-17 December 2012
Content Introduction ........................................................................................................................... 1 Content .................................................................................................................................. 2 1 Freshwater Discharge to Young Sund ............................................................................ 3
1.1 The Young Sund Area ........................................................................................... 3 1.2 Earlier Investigations ............................................................................................. 5 1.3 Selection of Catchments ........................................................................................ 5
2 Lerbugten - Catchment 3 .............................................................................................. 11 2.1 Description of the Catchment .............................................................................. 11 2.2 Measuring Site ..................................................................................................... 12 2.3 Stage-Discharge Relation .................................................................................... 13 2.4 Results ................................................................................................................. 14
3 Catchment 8 .................................................................................................................. 16 3.1 Description of the Catchment .............................................................................. 16 3.2 Measuring Site ..................................................................................................... 17 3.3 Stage-Discharge Relation .................................................................................... 18 3.4 Results ................................................................................................................. 19
4 Rudi Bugt - Catchment 9 .............................................................................................. 21 4.1 Description of the Catchment .............................................................................. 21 4.2 Measuring Site ..................................................................................................... 22 4.3 Stage-Discharge Relation .................................................................................... 23 4.4 Results ................................................................................................................. 24
5 Comparison of Results - Discussion ............................................................................ 26 6 Conclusion .................................................................................................................... 29 7 References .................................................................................................................... 30 Appendix Appendix A: Stage-Discharge Relation
Freshwater Discharge to Young Sund, Measurements from Three Rivers 3
Asiaq Report 2012-17 December 2012
1 Freshwater Discharge to Young Sund
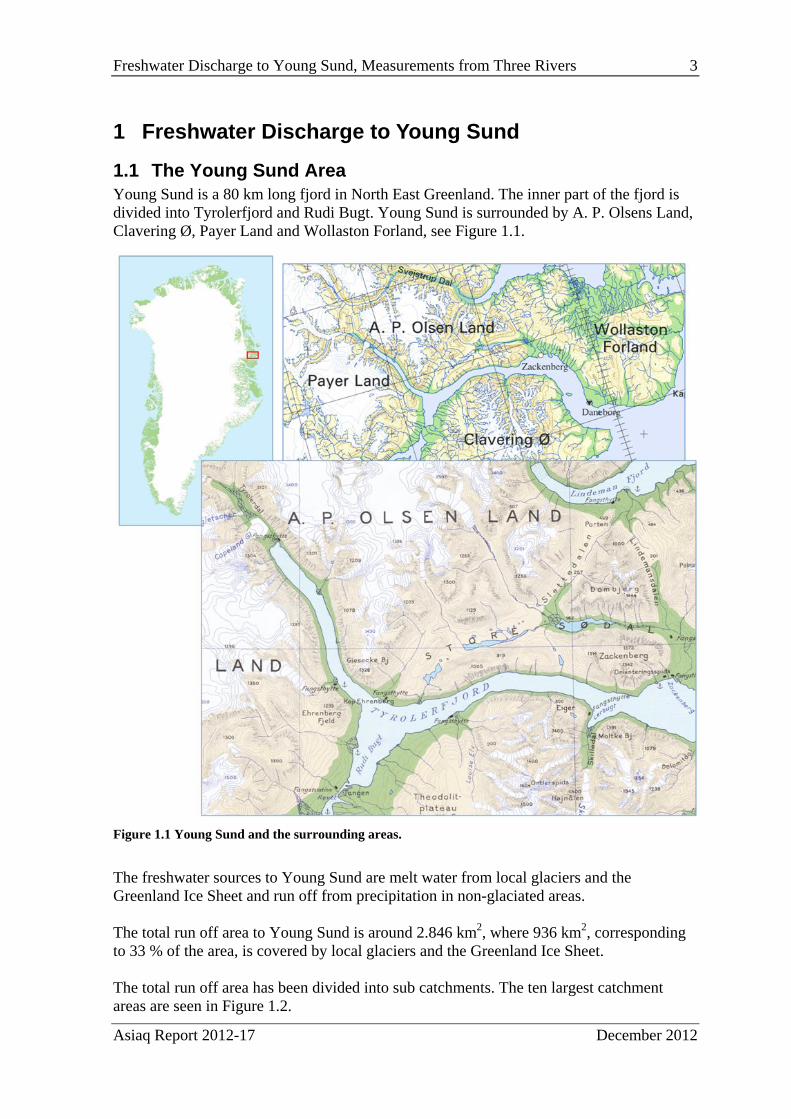
1.1 The Young Sund Area Young Sund is a 80 km long fjord in North East Greenland. The inner part of the fjord is divided into Tyrolerfjord and Rudi Bugt. Young Sund is surrounded by A. P. Olsens Land, Clavering Ø, Payer Land and Wollaston Forland, see Figure 1.1.
Figure 1.1 Young Sund and the surrounding areas.
The freshwater sources to Young Sund are melt water from local glaciers and the Greenland Ice Sheet and run off from precipitation in non-glaciated areas. The total run off area to Young Sund is around 2.846 km2, where 936 km2, corresponding to 33 % of the area, is covered by local glaciers and the Greenland Ice Sheet. The total run off area has been divided into sub catchments. The ten largest catchment areas are seen in Figure 1.2.

Freshwater Discharge to Young Sund, Measurements from Three Rivers 4
Asiaq Report 2012-17 December 2012
Figure 1.2 The ten largest catchment areas delivering freshwater to Young Sund.
The sub catchments in Figure 1.2 are sorted in descending order by size, where area 1 is the sub catchment with the largest area. The size distribution of the 10 largest sub catchments is seen in Figure 1.3.
Figure 1.3 The size distribution of the 10 largest sub catchments with run off to Young Sund.
The 10 largest catchments covers 74 % of the total run off area to Young Sund and 95 % of the ice covered areas. Characteristics of the ice cover in the sub catchment areas are seen in Table 1.1.
0
5
10
15
20
25
0
140
280
420
560
700
1 2 3 4 5 6 7 8 9 10
Part of total run
off area [%
]
Area [km
2 ]
Catchment

Freshwater Discharge to Young Sund, Measurements from Three Rivers 5
Asiaq Report 2012-17 December 2012
Table 1.1 Ice cover characteristics in the sub catchments. The blue color indicates whether the catchment has been reconnoitred for possible measuring sites.
Catchment Ice Cover
ID Area [km2]
Area [km2]
Part [%]
Min. level [m.a.s.l.]
Max. level [m.a.s.l.]
Mean level [m.a.s.l.]
Mean slope [deg.]
Mean aspect [deg.]
1 654 472 72 42 2,263 1,491 6 99 (E)
2 513 92 18 467 1,547 1,134 9 99 (E)
3 218 102 47 82 1,581 962 11 5 (N)
4 139 21 15 771 1,555 1,174 9 232 (SW)
5 130 85 66 372 1,684 1,358 5 88 (E)
6 125 11 9 714 1,344 1,022 13 324 (NW)
7 123 32 26 572 1,504 1,106 13 277 (W)
8 80 54 68 342 1,555 1,203 7 188 (S)
9 73 13 18 997 1,677 1,466 8 112 (ESE)
10 49 6 13 938 1,407 1,281 10 94 (E)
1.2 Earlier Investigations The freshwater discharge from Zackenbergelven (sub catchment 2) has continuously been measured since 1995 as a part of the ClimateBasis programme under the Greenland Ecosystem Monitoring programme (GEM). The freshwater discharge from the river in Lerbugten (sub catchment 3), the river at the end of Tyrolerfjord (sub catchment 1) and the river Djævlekløften at Clavering Ø (approximately 10 km north from the outlet of catchment 6) was measured in 2005. The discharges were estimated by measuring the water level (h) in the rivers every 15th minute during the summer thaw by use of automatic diver systems. At each location the discharge (Q) was measured on several occasions during the summer to ensure that the absolute amount of freshwater from the terrestrial to the marine environment could be quantified from stage-discharge relations (Q/h-relations) for each of the rivers (Bendtsen et al., 2007). The discharge from each of the rivers relative to Zackenbergelven was in 2005: Lerbugten 100 %, the river in the end of Tyrolerfjord 310 % and Djævlekløften 100 % (Bendtsen et al., 2007).
1.3 Selection of Catchments The objective for the 2012 field work was to measure discharge during the summer from three of the sub catchments to Young Sund. The following criteria were taken into account when the sub catchments were selected for measurements:
1. The fresh water discharge from the sub catchment should constitute a significant part of the total freshwater discharge to Young Sund, as the results among other things will be used to evaluate the freshwater discharge to Young Sund.
2. It should be possible to find a measuring site where measurements of an acceptable accuracy could be carried out.
3. It should be possible to carry out the measurements without compromising the safety of the field personal.

Freshwater Discharge to Young Sund, Measurements from Three Rivers 6
Asiaq Report 2012-17 December 2012
The accuracy of the resultant discharge time series depends on conditions at the measuring site. A discharge time series is calculated based on a time series of measured water level and a stage-discharge relation. The water level in the river is measured every 15th minute by an automatic pressure transducer device (a diver) placed on the river bottom. A number of manual discharge measurements are carried out at different water levels in order to establish the stage-discharge relation. The discharge is measured by the velocity-area method by use of a propeller type current meter or by an ADCP (acoustic doppler current meter). Reasonable conditions for water level measurements are sites where the equipment can be deployed in the river, a pond or lake where there is no or minor turbulence/waves. Further it is essential that the relation between the water level at the measuring site and the total discharge in the river is unique and stable during the measuring period. Thus it is preferable that the discharge only runs in one channel and that the river banks and bottom is reasonable stable. For the discharge measurements well defined cross sections with no or only minor turbulence is optimal. For indentifying possible measuring sites reconnaissance has been carried out in seven of the 10 largest sub catchments to Young Sund, see Table 1.1.
Catchment 1 The reconnaissance in catchment 1 was carried out July 31, 2012 and August 1, 2012. During the reconnaissance the water level changed dramatically during the day with the temperature and the incoming solar radiation. In the late night and in the morning, where the water level was low, the discharge in the delta was divided into one main channel and two minor channels. In the afternoon where the water level was at the highest most of the delta was flooded, see Figure 1.4
Figure 1.4 High water level and flooded delta in catchment 1 in the afternoon August 1, 2012.
Several attempts were made to set up equipment to carry out discharge measurement in the main river in the delta. Due to high and a constantly changing water level the attempts did not succeed, as it was impossible to cross the main river due to strong current and large water depth.

Freshwater Discharge to Young Sund, Measurements from Three Rivers 7
Asiaq Report 2012-17 December 2012
In front of the Copeland Glacier the discharge was only running in one river, see Figure 1.1 for a map with Copeland Glacier and Figure 1.5 for pictures of the river. The steep left side of the river and the steep moraine at right side of the river made it impossible to reach the river. Large blocks of ice were standing here and there in the river and furthermore large pieces of ice were observed being transported in the river. It was assessed that these floating ice blocks could pose a danger to persons trying to cross the river. There was not observed any calving from the glacier during the reconnaissance.
Figure 1.5 The river in front of Copeland Glacier in catchment 1.
Catchment 2 The discharge from catchment 2 discharges in Zackenbergelven. As described in chapter 1.2 the discharge in Zackenbergelven has been measured continuously since 1995. More information about the hydrology at Zackenbergelven can be found in the yearly reports, see www.zackenberg.dk.
Catchment 3 A suitable measuring site in catchment 3 was identified after some reconnaissance July 28, 2012. Discharge measurements were carried out July 29 and 30 and again August 13, 15 and 16, 2012. The water level was continuously measured every 15th minute in the period from July 28 to August 16, 2012. Detailed descriptions of the measurement site and the measurements are found in chapter 2.
Catchment 5 The reconnaissance in catchment 5 was carried out July 31, 2012. The discharge from catchments 5 runs in one river. The river banks are very steep and the river is eroded about 30 m down below the plateau, see Figure 1.6.

Freshwater Discharge to Young Sund, Measurements from Three Rivers 8
Asiaq Report 2012-17 December 2012
Figure 1.6 The river in catchment 5.
The river was reconnoitered from the outlet to Tyrolerfjord and almost up to the glacier front. The river contains several waterfalls and due to the steep banks it is impossible to reach the river. The best site for measurements was near the outlet, but even here the turbulence was too high for discharge and water level measurements, see Figure 1.7. In the delta the river was divided into several small channels with water depths too low for discharge measurements, see Figure 1.7.
Figure 1.7 The river near the delta and the delta in catchment 5.
Catchment 7 The discharge from catchment 7 runs in Louise Elv, see Figure 1.8. The reconnaissance in catchment 7 was carried out July 31, 2012. The river section from the outlet to Tyrolerfjord and upstream to the point where Louise Elv is divided into two rivers were reconnoitred. In the reconnoitered part of Louise Elv the turbulence was too high for measurements of both the discharge and the water level; see Figure 1.9

Freshwater Discharge to Young Sund, Measurements from Three Rivers 9
Asiaq Report 2012-17 December 2012
Figure 1.8 Louise Elv in catchment 7.
Figure 1.9 Louise Elv in catchment 7.
Catchment 8 A suitable measuring site in catchment 8 was identified after some reconnaissance August 2, 2012. Discharge measurements were carried out August 3 and 4, and again August 17 and 18. The water level was continuously measured every 15th minute in the period from August 2 to 18, 2012. Detailed descriptions of the measurement site and the measurements are found in chapter 3.
Catchment 9 After some reconnaissance August 4, 2012 a suitable measuring site was identified in catchment 9. Discharge measurements were carried out August 5 and 6 and again August

Freshwater Discharge to Young Sund, Measurements from Three Rivers 10
Asiaq Report 2012-17 December 2012
18 and 19. The water level was continuously measured every 15th minute in the period from August 5 to 19, 2012. Detailed descriptions of the measurement site and the measurements are found in chapter 4.
Freshwater Discharge to Young Sund, Measurements from Three Rivers 11
Asiaq Report 2012-17 December 2012
2 Lerbugten - Catchment 3
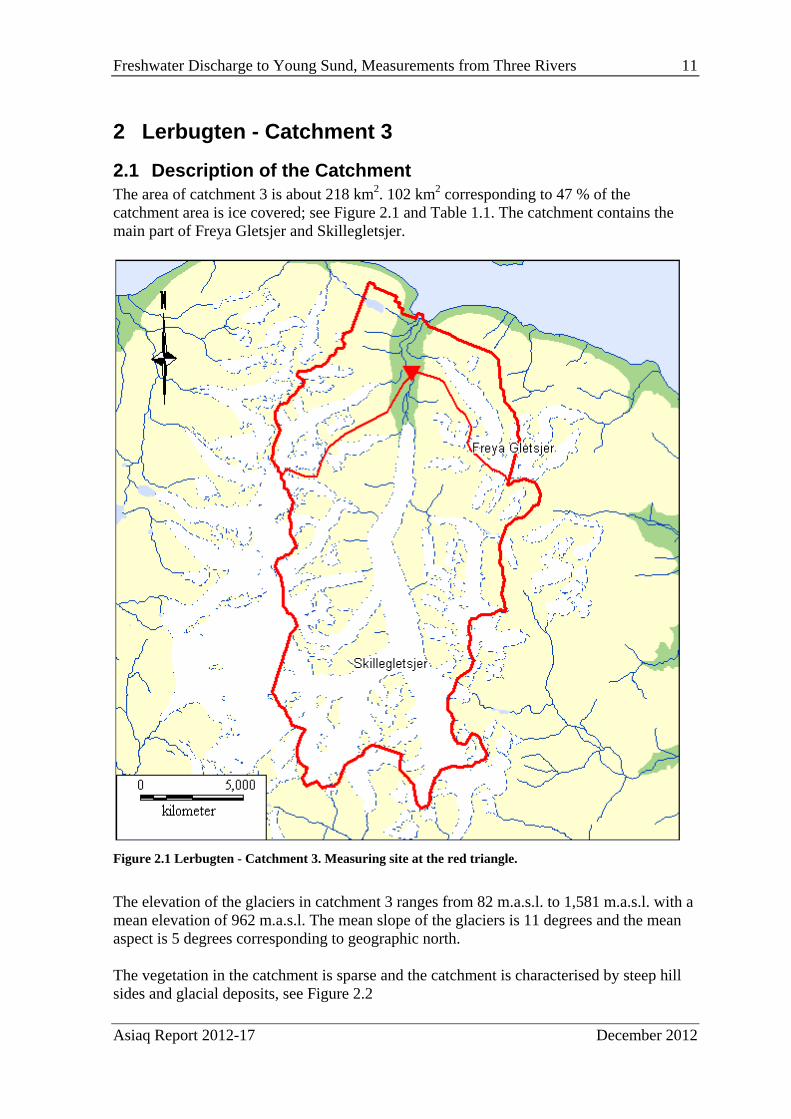
2.1 Description of the Catchment The area of catchment 3 is about 218 km2. 102 km2 corresponding to 47 % of the catchment area is ice covered; see Figure 2.1 and Table 1.1. The catchment contains the main part of Freya Gletsjer and Skillegletsjer.
Figure 2.1 Lerbugten - Catchment 3. Measuring site at the red triangle.
The elevation of the glaciers in catchment 3 ranges from 82 m.a.s.l. to 1,581 m.a.s.l. with a mean elevation of 962 m.a.s.l. The mean slope of the glaciers is 11 degrees and the mean aspect is 5 degrees corresponding to geographic north. The vegetation in the catchment is sparse and the catchment is characterised by steep hill sides and glacial deposits, see Figure 2.2

Freshwater Discharge to Young Sund, Measurements from Three Rivers 12
Asiaq Report 2012-17 December 2012
Figure 2.2 Catchment 3.
In the delta the discharge runs in several channels. Upstream the delta the discharge runs in one channel. Further upstream, near the front of the Skillegletsjer, the discharge runs through glacial deposits in several channels.
2.2 Measuring Site The measuring site is located about 3 km upstream the outlet from catchment 3 – Lerbugten; see Figure 2.1. By placing the measuring site upstream the outlet, the catchment area for the measurements is reduced. Thus the discharge time series (see chapter 2.4) represents a catchment area which is 167 km2 instead of 218 km2, and the ice cover is reduced to 85 km2 corresponding to 51% of the catchment area. The elevation of the ice cover in the reduced area ranges from 83 m.a.s.l. to 1,524 m.a.s.l. with a mean elevation of about 952 m.a.s.l. The mean slope of the ice cover is 10 degrees and the mean aspect is 6 degrees corresponding to geographic north. At the discharge cross section the water runs in one channel. The main part of the discharge runs in the right side of the cross section. The right side is the deepest part and at high water levels the turbulence is quite high, see Figure 2.3 a.
(a) (b)
Figure 2.3 Discharge measurement with OTT Qliner. (a) - at high water level, (b) - at low water level. The divers are placed downstream the big boulder.

Freshwater Discharge to Young Sund, Measurements from Three Rivers 13
Asiaq Report 2012-17 December 2012
The material of the river bed and the banks are boulders and smaller stones. As there are no solid rocks, the river bed and the banks will probably change over time, especially during floods/high discharges in the beginning of the melt season. The water level was measured at a big rock on the right side of the river bank. Behind the rock the water was relative calm. Three divers were deployed near the rock; two divers logging every hour deployed July 28 and one logging every 15th minute deployed July 29. A barodiver logging every hour was deployed July 28. The divers and barodiver was collected August 16, so in total 19 days of measurements exists.
2.3 Stage-Discharge Relation The stage-discharge relation (Q/h-relation) for Lerbugten has been determined from sets of measured discharge and water level. For information about the method see Appendix A. Discharge measurements were carried out when the divers were deployed and when the divers were collected. During the first visit to the station on July 28 and 29 four discharge measurements were carried out. Under the second field trip from August 13 to August 16 another four discharge measurements were carried out. The stage, relative to a datum, was determined at each measurement by levelling. All discharge measurements were carried out by use of the ADCP. The results of the discharge measurements are given in Table 2.1. Table 2.1 Discharge measurements carried out in Lerbugten.
Date Water Level m
Discharge m3/s
Method Comment
29-07-2012 18:29 98.945 41.33 ADCP 29-07-2012 22:35 98.867 32.69 ADCP 30-07-2012 14:02 98.964 40.98 ADCP 30-07-2012 17:10 98.984 41.59 ADCP 13-08-2012 22:03 98.428 16.62 ADCP 15-08-2012 20:49 98.467 18.57 ADCP 15-08-2012 21:32 98.428 16.66 ADCP 16-08-2012 10:24 98.258 9.82 ADCP All eight discharge measurements have been used to establish the Q/h-relation, Equation 1. The Q/h-relation is shown with the manual measured discharges in Figure 2.4.
Equation 1 ( ) 61757.17194.974685.28 −= hQ

Freshwater Discharge to Young Sund, Measurements from Three Rivers 14
Asiaq Report 2012-17 December 2012
Figure 2.4 Stage-discharge relation for Lerbugten.
2.4 Results In the measuring period a clear diurnal variation in the water level is observed; see Figure 2.5. The daily minimum water level was in the morning around 6:00 to 9:00 UTC, but changed to around 9:00 to 11:00 during the last five days of the measuring period. The daily maximum water level was around 17:00 to 18:00 most days, but was a bit earlier on August 5 and 6 after a period with high mean air temperatures. As expected the water level was significant lower at the end of the period. The water temperature varied between 0.3 and 1.3 °C with water depths varying between 0.1 and 0.8 m. Based on the water level data the discharge from Lerbugten is calculated by use of the Q/h-relation found in Equation 1. The discharge time series and the manual discharge measurements are shown in Figure 2.6. The manual discharge measurements were carried out at water levels between 98.26 and 98.98 m, which covers the entire range of water levels measured at the site (98.22 to 98.99 m). The amplitude of the daily variation in the discharge varied between 6.7 and 14.0 m3/s, with a mean amplitude of 11.0 m3/s. Beside the measurements at the main site, three measurements of discharge in the river from Freya Gletsjer (Figure 2.1) were carried out. The discharge was measured by the salt dilution method. The results are given in Table 2.2.
Table 2.2 Discharge measured at Freya Gletsjer and calculated discharge at the main measuring site.
Date Discharge from Freya Gletsjer, m3/s Discharge Lerbugten (main site), m3/s 28-07-2012 21:05 1.32 36.32 14-08-2012 00:30 1.63 13.88 14-08-2012 01:40 1.29 13.11
97.6
97.8
98.0
98.2
98.4
98.6
98.8
99.0
0 5 10 15 20 25 30 35 40 45
Sta
ge, h
, m re
lativ
e
Discharge, m3/s

Freshwater Discharge to Young Sund, Measurements from Three Rivers 15
Asiaq Report 2012-17 December 2012
Figure 2.5 Water level and air temperature in Lerbugten.
Figure 2.6 The calculated discharge and the manual discharge measurements carried out at Lerbugten.
Time t28-07-2012 31-07-2012 03-08-2012 06-08-2012 09-08-2012 12-08-2012 15-08-2012
W [m
]
98.2
98.4
98.6
98.8
99.0
AT
[°C
]
4
6
8
10
12
14
Lerbugten - Water level
Lerbugten - Air temperature
Time t28-07-2012 31-07-2012 03-08-2012 06-08-2012 09-08-2012 12-08-2012 15-08-2012
Q [m
3/s]
10
20
30
40
Lerbugten - Manual discharge measurements
Lerbugten - Calculated discharge

Freshwater Discharge to Young Sund, Measurements from Three Rivers 16
Asiaq Report 2012-17 December 2012
3 Catchment 8
3.1 Description of the Catchment The area of Catchment 8 is about 80 km2. 54 km2 corresponding to 68 % of the catchment area is ice covered; see Figure 3.1 and Table 1.1.
Figure 3.1 Catchment 8. Measuring site at the red triangle.
The elevation of the glaciers in Catchment 8 ranges from 342 m.a.s.l. to 1,555 m.a.s.l. with a mean elevation of 1,203 m.a.s.l. The mean slope of the glaciers is 7 degrees and the mean aspect is 188 degrees corresponding to geographic south. Part of the huge A.P. Olsen Gletsjer, which also drains to Zackenbergelven, drains to Catchment 8. The vegetation in the catchment is sparse and the catchment is characterised by steep hill sides and glacial deposits, see Figure 3.2.

Freshwater Discharge to Young Sund, Measurements from Three Rivers 17
Asiaq Report 2012-17 December 2012
Figure 3.2 Catchment 8.
3.2 Measuring Site From a perfect half-moon shaped delta the outlet from Catchment 8 runs into Tyrolerfjord; see Figure 3.1. The delta consists of boulders, smaller stones and sand without any vegetation. Upstream the delta the river runs through solid rock. The river banks are steep and the river is eroded 5 to 20 meters down below the plateau. The measurement site is located at the delta about 100 meters upstream the outlet from Catchment 8. At the discharge cross section the water runs in one channel at low water level; at medium water level a small parallel channel are activated and at high water level there are two small parallel channels. The main part of the water runs in the right side of the cross section, but there are some turbulence in the entire cross section, see Figure 3.3a.
(a) (b)
Figure 3.3 (a) - cross section for discharge measurements, (b) - location of the divers.
The material of the river bed and the banks are boulders and smaller stones. As there are no solid rocks, the river bed and the banks will probably change over time, especially during floods/high discharges in the beginning of the melt season. The sound of stones/boulders rolling down the river bottom is often heard, which also indicate big changes in the riverbed.

Freshwater Discharge to Young Sund, Measurements from Three Rivers 18
Asiaq Report 2012-17 December 2012
Two divers were deployed about 100 meters upstream the discharge cross section where the river runs in solid rock. The divers were lowered down into a small pool about 7 meters below the plateau on August 2. Leveling of the water level was not possible at the diver location due to the steep banks. A barodiver was also deployed at the site August 2. Both the divers and the barodiver was logging every 15th minutes. The sensors were collected August 16, so in total 14 days of measurements exists.
3.3 Stage-Discharge Relation The stage-discharge relation (Q/h-relation) for Catchment 8 has been determined from sets of measured discharge and water level from the diver. For information about the method see Appendix A. Discharge measurements were carried out when the divers were deployed and when the divers were collected. During the first visit to the station on August 3 and 4 five discharge measurements were carried out. Under the second field trip from August 16 to August 18 three additional discharge measurements were carried out. As noted in section 3.2 it was not possible to measure the stage by leveling at the diver position, therefore the stage has been determined from the diver readings. The discharge measurements carried out during the first trip was made by a combination of the ADCP and a current meter, while only the ADCP was used during the second trip. The result of the manual discharge measurements are given in Table 3.1. Table 3.1 Discharge measurements carried out in Catchment 8.
Date Water Level m
Discharge m/s
Method Comment
03-08-2012 11:03 1.022 13.60 ADCP + Current meter 2 channels 03-08-2012 14:11 1.401 19.53 ADCP + Current meter 3 channels 03-08-2012 19:15 1.356 23.16 ADCP + Current meter 3 channels 03-08-2012 23:13 1.101 19.90 ADCP + Current meter 3 channels 04-08-2012 10:44 0.814 12.31 ADCP + Current meter 1 channel 17-08-2012 01:04 0.624 7.37 ADCP 1 channel 17-08-2012 14:10 0.767 12.20 ADCP 1 channel 18-08-2012 10:06 0.441 6.36 ADCP 1 channel All eight discharge measurements have been used to establish the Q/h-relation, Equation 2. The Q/h-relation is shown with the manual measured discharges in Figure 3.4.
Equation 2 ( ) 95239.1627301.070101.5 += hQ

Freshwater Discharge to Young Sund, Measurements from Three Rivers 19
Asiaq Report 2012-17 December 2012
Figure 3.4 Stage-discharge relation for Catchment 8.
3.4 Results In the measuring period a clear diurnal variation in the water level is observed; see Figure 3.5. The daily minimum water level was in the morning around 6:00 to 9:00 UTC, but changed to around 9:00 to11:00 during the end of the measuring period. The daily maximum water level was around 17:00 to 18:00 most days, but was a bit earlier on August 5 and 6 after a period with high mean air temperatures. As expected the water level was significant lower at the end of the period. The water temperature varied between 1.1 and 1.9 °C with water depths varying between 0.2 and 1.5 m. Based on the water level data the discharge from Catchment 8 is calculated by use of the Q/h-relation found in Equation 2. The discharge time series and the manual discharge measurements are shown in Figure 3.6. The manual discharge measurements were carried out at water levels between 0.44 m and 1.40 m, which almost covers the entire range of water levels measured at the site (0.20 to 1.61 m). The amplitude of the daily variation in the discharge varied between 5.4 and 17.4 m3/s, with a mean amplitude of 11.9 m3/s.
-0.4
0.0
0.4
0.8
1.2
1.6
2.0
0 5 10 15 20 25 30 35
Sta
ge, h
, m re
lativ
e
Discharge, m3/s

Freshwater Discharge to Young Sund, Measurements from Three Rivers 20
Asiaq Report 2012-17 December 2012
Figure 3.5 Water level and air temperature in Catchment 8.
Figure 3.6 The calculated discharge and the manual discharge measurements carried out at Catchment 8.
Time t02-08-2012 05-08-2012 08-08-2012 11-08-2012 14-08-2012 17-08-2012
W [m
]
0.0
0.5
1.0
1.5
AT
[°C
]
5
10
15
20Catchment 8 - Water level
Catchment 8 - Air temperature
Time t02-08-2012 05-08-2012 08-08-2012 11-08-2012 14-08-2012 17-08-2012
Q [m
3/s]
5
10
15
20
25
Catchment 8 - Manual measured discharge
Catchment 8 - Calculated discharge

Freshwater Discharge to Young Sund, Measurements from Three Rivers 21
Asiaq Report 2012-17 December 2012
4 Rudi Bugt - Catchment 9
4.1 Description of the Catchment The area of catchment 9 is about 73 km2. 13 km2 corresponding to 18 % of the catchment area is ice covered; see Figure 4.1 and Table 1.1.
Figure 4.1 Rudi Bugt - Catchment 9. Measuring site at the red triangle.
The elevation of the glaciers in catchment 9 ranges from 997 m.a.s.l. to 1,677 m.a.s.l. with a mean elevation of 1,466 m.a.s.l. The mean slope of the glaciers is 8 degrees and the mean aspect is 112 degrees corresponding to geographic east-southeast. The vegetation in the catchment is sparse and the catchment is characterised by steep hill sides and glacial deposits, see Figure 4.2.

Freshwater Discharge to Young Sund, Measurements from Three Rivers 22
Asiaq Report 2012-17 December 2012
Figure 4.2 Catchment 9.
4.2 Measuring Site The measurement site is located about 2 km upstream the outlet from catchment 9 – Rudi Bugt; see Figure 4.1. By placing the measuring site upstream the outlet, the catchment area for the measurements is reduced. Thus the discharge time series (see chapter 4.4) represents a catchment area which is reduced from 73 km2 to 71 km2.The ice cover is still 13 km2 and still corresponding to 18 % of the new catchment area. At the discharge cross section the water runs in one channel, but there is a small bar at the right side of the river bank. The main part of the water runs in the left side of the cross section, but the water is quite turbulent in the whole cross section; see Figure 4.3.
(a) (b)
Figure 4.3 Discharge measurement with OTT Qliner (a). The divers are placed downstream the big rock (b)
The material of the river bed and the banks are boulders and smaller stones. As there are no solid rocks, the river bed and the banks will probably change over time, especially during floods/high discharges in the beginning of the melt season.

Freshwater Discharge to Young Sund, Measurements from Three Rivers 23
Asiaq Report 2012-17 December 2012
On August 5 two divers were deployed 10 meters upstream the discharge cross section in a small pool behind a big rock and a barodiver was deployed on the slope next to the river. The divers and barodiver was logging every 15th minute. The divers were collected August 18, so in total 13 days of measurements exists.
4.3 Stage-Discharge Relation The stage-discharge relation (Q/h-relation) for Rudi Bugt has been determined from sets of measured discharge and water level. For information about the method see Appendix A. Discharge measurements were carried out when the divers were deployed and when the divers were collected. During the first visit to the station on August 5 and 6 five discharge measurements were carried out. Under the second field trip from August 18 to August 19 two more discharge measurements were carried out. The stage relative to a datum was determined at each measurement by leveling. For all discharge measurements the ADCP was used in the main river and a current meter in the small stream between the left bank and the bar. The result of the manual discharge measurements are given in Table 4.1. Table 4.1 Discharge measurements carried out in Rudi Bugt.
Date Water Level m
Discharge m/s
Method Comment
05-08-2012 14:33 98.286 6.95 ADCP + Current meter 05-08-2012 21:29 98.326 8.02 ADCP + Current meter 06-08-2012 11:09 98.248 6.10 ADCP + Current meter 06-08-2012 13:24 98.264 6.47 ADCP + Current meter 06-08-2012 19:00 98.317 8.36 ADCP + Current meter 18-08-2012 21:31 98.254 6.18 ADCP + Current meter 19-08-2012 11:10 98.179 3.89 ADCP + Current meter All seven discharge measurements have been used to establish the Q/h-relation, Equation 3. The Q/h-relation is shown with the manual measured discharges in Figure 4.4.
Equation 3 ( ) 09832.10263.98213.31 −= hQ

Freshwater Discharge to Young Sund, Measurements from Three Rivers 24
Asiaq Report 2012-17 December 2012
Figure 4.4 Stage-discharge relation for Rudi Bugt.
4.4 Results In the measuring period a diurnal variation in the water level is observed, but with smaller amplitudes than for Lerbugten and Catchment 8; see Figure 4.5. The daily minimum water level was in the first part of the measuring period in the morning varying between 7:00 and 9:00. In the middle of the period the minimum water level was around 10:00 to 14:00 and in the last part of the period the minimum water level was around 14:00 to 17:00. The typical daily maximum water level also changed during the measuring period. In the beginning of the period it was around 19:00 to 22:00 and then it changed to be around midnight for the rest of the period. The water level was lower at the end of the period, but the difference is not as large as for the two other sites. The water temperature varied between 4.0 and 8.6 °C with water depths varying between 0.1 and 0.4 m. Based on the water level data the discharge from Rudi Bugt is calculated by use of the Q/h-relation found in Equation 3. The discharge time series and the manual discharge measurements are shown in Figure 4.6. The manual discharge measurements were carried out at water levels between 98.18 m and 98.33 m. As the range of water level measured at the site is 98.10 to 98.37 m, the Q/h-relation is extrapolated beyond the measurements used to establish the relation in the lower part. This means that the discharge time series are less accurate determined at low water levels. The amplitude of the daily variation in the discharge varied between 1.0 and 3.6 m3/s, with a mean amplitude of 2.1 m3/s.
98.00
98.05
98.10
98.15
98.20
98.25
98.30
98.35
98.40
0 1 2 3 4 5 6 7 8 9 10
Sta
ge, h
, m re
lativ
e
Discharge, m3/s

Freshwater Discharge to Young Sund, Measurements from Three Rivers 25
Asiaq Report 2012-17 December 2012
Figure 4.5 Water level and air temperature for Rudi Bugt.
Figure 4.6 The calculated discharge and the manual discharge measurements carried out at Rudi Bugt.
Time t05-08-2012 07-08-2012 09-08-2012 11-08-2012 13-08-2012 15-08-2012 17-08-2012
W [m
]
98.10
98.15
98.20
98.25
98.30
98.35
AT
[°C
]
7.0
9.5
12.0
14.5
17.0
19.5
Rudi Bugt - Water level
Rudi Bugt - Air temperature
Time t05-08-2012 07-08-2012 09-08-2012 11-08-2012 13-08-2012 15-08-2012 17-08-2012
Q [m
3/s]
2
4
6
8
Rudi Bugt - Manual measured discharge
Rudi Bugt - Calculated discharge

Freshwater Discharge to Young Sund, Measurements from Three Rivers 26
Asiaq Report 2012-17 December 2012
5 Comparison of Results - Discussion The discharge time series from the three measured rivers are compared with the discharge from Zackenbergelven in Figure 5.1. A glacial outburst flood (jökulhlaup) occurred in Zackenbergelven on August 6. During the jökulhlaup the water level in Zackenbergelven increased by more than 2 meters and the hydrological monitoring station was destroyed. Therefore data from Zackenbergelven does unfortunately only exist for the first eight days of the 21 day measuring campaign.
Figure 5.1 Comparison of the discharge time series from four monitored rivers discharging into Young Sund.
Diurnal variations of the discharge are observed in all four rivers although the pattern is most pronounced in Lerbugten and Catchment 8. These two rivers have around 50% of their catchment covered by ice and a short length of river (around 3 km) from the glacier fronts to the measuring sites at the fjord. Zackenbergelven and Rudi Bugt on the other hand have only around 18% of their catchments covered by ice. Further the stretch of river from the glacier to the fjord/measuring station is considerably longer; 34 km for Zackenbergelven and 15 km for Rudi Bugt. The variation in discharge from the glacier to Zackenbergelven is further dampened by a big lake in the valley, Store Sødal; see Figure 1.1. The relative magnitude of the discharge in the four rivers has been evaluated by comparing daily mean discharges. The ratio of discharges has been calculated for the three combinations of rivers that has the longest overlap of their time series, Figure 5.2. None of the ratios are constant for the entire measuring period. Especially Rudi Bugt seems to shift to a lower level of discharge compared to Catchment 8 in the end of the period. In the period where the discharge was measured there was no precipitation in the area. Therefore the discharge in the rivers consisted of melt water from the glaciers and from melting snow at high altitude, Figure 5.3.
Time t28-07-2012 04-08-2012 11-08-2012 18-08-2012
Q [m
3/s]
0
10
20
30
40Rudi Bugt (ID 9)Catchment 8 (ID 8)Lerbugten (ID 3)Zackenbergelven (ID 2)

Freshwater Discharge to Young Sund, Measurements from Three Rivers 27
Asiaq Report 2012-17 December 2012
Figure 5.2 Ratios of daily discharges for the three combinations of rivers that have the longest overlap of their time series are shown.
Figure 5.3 MODIS/AQUA satellite photo from August 2 (left) and August 18 (right). From http://ocean.dmi.dk/arctic/daneborg.php.
The magnitude of the daily discharge at Lerbugten is 60-100% of the discharge in Zackenbergelven. The glaciated area in Lerbugten catchment (upstream of the measuring site) is 85 km2 compared to the 92 km2 in the catchment of Zackenbergelven. The magnitude of the daily discharge at Catchment 8 is 50-70% of the discharge in Lerbugten. The glaciated area in Catchment 8 is 54 km2 compared to the 85 km2 in the catchment of Lerbugten. Thus the ratio of ice covered areas between the two catchments is 64%, which corresponds well with the ratio of discharges. The magnitude of the daily discharge at Rudi Bugt is 30-60% of the discharge in Catchment 8. The ice covered area in the Rudi Bugt catchment is only 13 km2 compared to
0.00
0.20
0.40
0.60
0.80
1.00
1.20
29‐07‐20
12
30‐07‐20
12
31‐07‐20
12
01‐08‐20
12
02‐08‐20
12
03‐08‐20
12
04‐08‐20
12
05‐08‐20
12
06‐08‐20
12
07‐08‐20
12
08‐08‐20
12
09‐08‐20
12
10‐08‐20
12
11‐08‐20
12
12‐08‐20
12
13‐08‐20
12
14‐08‐20
12
15‐08‐20
12
16‐08‐20
12
Lerbugten/Zackenbergelven
Catchment 8/Lerbugten
Rudi Bugt/Catchment 8

Freshwater Discharge to Young Sund, Measurements from Three Rivers 28
Asiaq Report 2012-17 December 2012
the 54 km2 in Catchment 8. The relatively high discharge at Rudi Bugt in the beginning of the measuring period could indicate that water from snow melt earlier in the season have been delayed in the catchment either in soil layers or in ponds/small lakes. This could also explain the small amplitude in the diurnal variation in discharge. A number of small lakes are shown in a valley within the catchment area on the KMS Greenland 1:500.000 map, but these lakes are not shown on the more detailed map KMS Greenland 1:250.000. By considering the median of the ratios, the discharge from each of the rivers relative to Zackenbergelven have been estimated, Table 5.1. For comparison the result from the 2005 measuring campaign is also shown in Table 5.1. Only Lerbugten catchment was monitored in both campaigns. However, the measurements in 2005 were carried out close to the fjord (Personal communication with Charlotte Sigsgaard) whereas the measurements in 2012 were carried out 3 km upstream (chapter 2.2). Thus the 2012 results represent a smaller catchment area than the 2005 results. Table 5.1 Discharge ratios relative to Zackenbergelven. Comparison of results from the 2005 and 2012 measuring campaigns.
Catchment Discharge relative to Zackenbergelven ID Name In 2005 In 2012 1 Tyrolerfjord 300% N.A. 3 Lerbugten (catchment: 167 km2) N.A. 70% 3 Lerbugten (catchment: 218 km2) 100% N.A. 8 Catchment 8 N.A. 40% 9 Rudi Bugt N.A. 20%

Freshwater Discharge to Young Sund, Measurements from Three Rivers 29
Asiaq Report 2012-17 December 2012
6 Conclusion The freshwater discharge to Young Sund from three rivers has been measured during a field campaign from July 28 to August 19. During the reconnaissance part of the field work seven of the 10 largest sub catchments to Young Sund have been reconnoitred and short descriptions of the sites are given. The average discharge ratios for Lerbugten, Catchment 8 and Rudi Bugt relative to Zackenbergelven have been found to 70 %, 40 % and 20 %, respectively.
Freshwater Discharge to Young Sund, Measurements from Three Rivers 30
Asiaq Report 2012-17 December 2012
7 References Bendtsen, J., Gustafsson, K. E., Rysgaard, S. & Vang, T., 2007. Physical conditions, dynamics and model simulations during the ice-free period of the Young Sound/Tyrolerfjord system. In: Rysgaard, S. & Glud, R. N. (Eds.), Carbon cycling in Arctic marine ecosystems: Case study Young Sound. Meddr. Grønland, Bioscience 58: 46-59. Personal communication with Charlotte Sigsgaard
Freshwater Discharge to Young Sund, Measurements from Three Rivers 31
Asiaq Report 2012-17 December 2012
Appendix A: Stage-discharge Relation A stage-discharge relation (Q/h-relation) is determined from sets of measured discharge and stage by fitting the stage discharge relation, Equation 4, to the measured datasets of Q and h.
Equation 4 ( )bHhAQ 0−=
- Q is discharge [m3/s] - h is stage relative to the reference point at the station [m] - H0 is the stage at which the flow is zero - A,b are empirical constants.
As can be seen, the values of three parameters are to be determined by fitting: A, b and H0. In cases where three or more sets of Q and h are available, all three parameters are fitted. In cases where only two sets of Q and h are available, H0 is estimated from measurements of the cross section profile and only A and b are determined by fitting. The use of a Q/h-relation to calculate the discharge from automatically gathered stages for a period of time, presumes that the relationship is valid throughout the period. This is only likely to be true if the hydraulic control stays the same, i.e. same channel resistance or unaltered cross section in a structural control.