freshwater biology (2002) 47, 129-141 invertebrate food webs along a...
TRANSCRIPT

Freshwater Biology (2002) 47, 129-141
Invertebrate food webs along a stream resource gradient
EMMA J. ROSI-MARSHALL and J. BRUCE WALLACEDepartment of Entomology, University of Georgia, Athens, GA, U.S.A.
SUMMARY
1. The flow of energy through food webs with similar species can vary with both spaceand time. The river continuum concept (RCC) provides a useful framework for predictingvariability in the biota and food availability along streams. We estimated the flow oforganic matter (g m~2 year"1) through food webs, arrayed along a stream, that haddifferent resource inputs. Four sites were sampled along the Little Tennessee River, NorthCarolina, U.S.A.: two fifth order sites, one sixth and one seventh order site. The dominantresource is leaf detritus in the upstream reach (the upstream fifth order site), algae in themid-reaches (the downstream fifth and sixth order sites), and suspended materialdownstream (seventh order site).2. Eleven genera, contributing from 50 to 66% of the total macroinvertebrate secondaryproduction of each site, were studied. We estimated organic matter flow from resource toconsumer by combining previously measured rates of invertebrate secondary productionwith gut content analyses and assimilation efficiencies.3. Organic matter flow through food webs increased in a downstream direction, while thestructure of the food webs remained constant. The total food consumed by the taxaanalysed increased from 34 g m~2 year"1 at the upstream site to 730 g m~2 year"1 at themost downstream site. We estimate that the organic matter consumed by the entiremacroinvertebrate community ranged from 66 to 1164 g m~2 year"1. These results indicatethat there is variation in the magnitude of organic matter flow through the food webs alongthis river continuum.4. The dominant food resource consumed also changed along the gradient. Leaf detritusconsumption decreased from 58% of the total consumption upstream to 6% downstream,whereas consumption of amorphous detritus increased from 18 to 64%. The proportion ofanimal material consumed also increased from 3 to 27%. The total consumption ofautochthonous resources (diatoms and filamentous algae) increased along the continuum(from 6.41 to 34.05 g m~2 year"1). We conclude that these results are related to variation inresource availability, dietary shifts and invertebrate secondary production. These resultslink resource availability to energy flow, a relationship originally suggested by the RCC.
Keywords: aquatic macroinvertebrates, food webs, organic matter flow, river continuum,spatial variability, trophic basis of production
Introduction
Food webs can be useful tools for examining trophicinteractions in communities (Polis & Strong, 1996 and
Correspondence: Emma J. Rosi-Marshall, Institute of Ecology, references therein). Natural heterogeneity in trophicUniversity of Georgia, Athens, GA 30602, U.S.A. interactions, however, may be difficult to represent inE-mail: [email protected] linkage food webs alone (Polis & Strong, 1996). ForPresent address: Emma J. Rosi-Marshall, Institute of Ecology, example, physical variability along resource gradientsUniversity of Georgia, Athens, GA 30602, U.S.A. in communities that contain similar species can cause
' 2002 Blackwell Science Ltd 129

130 E.J. Rosi-Marshall and J.B. Wallace
heterogeneity in the properties of food webs (Polis &Hurd, 1996; Winemiller, 1996). Various methods havebeen employed to estimate food web properties,such as rates of consumption and interaction strength(De Ruiter, Neutel & Moore, 1995; Benke & Wallace,1997; Monaco & Ulanowicz, 1997). Food web proper-ties, such as carbon flow rates, can vary greatly inneighbouring areas (Monaco & Ulanowicz, 1997) andcan provide additional information about the commu-nity in question. Food webs that contain estimates ofconsumption rate and interaction strength can be usedto estimate functional variability in neighbouring eco-systems (Holt, 1996; Hall, WaUace & Eggert, 2000).
The river continuum concept (RCC) suggests thatthe community composition of a stream should shiftin predictable patterns that correlate with physicalchanges along stream gradients (Vannote et al., 1980).For example, the RCC suggests that temperatestreams in upland deciduous forests are primarilyheterotrophic (detrital based), shifting to autotrophic(algal based) in the mid-orders and back to hetero-trophic in large rivers. While the validity of the RCChas been refuted for numerous stream systems(Winterbourn, Rounick & Cowie, 1981), streamsdraining eastern temperate deciduous forests of theU.S.A. have been shown generally to fit within theRCC predictions (MinshaU et al, 1983; Webster,Wallace & Benfield, 1995). Thus, leaf detritus is mostabundant in small streams (see review by Websteret al., 1995), instream algal production increases inmidreaches (Lamberti & Steinman, 1997) and, finally,fine particulate matter increases downstream(Minshall et al., 1983; Cummins, Gushing & Minshall,1995; Webster & Meyer, 1997).
Spatial shifts in input and availability of resources inriver ecosystems should influence the flow of organicmatter through the food web (Power, 1992). The RCCpredicts that macroinvertebrate communities shiftalong river continua (Vannote et al., 1980). Grubaugh,Wallace & Houston (1997) found that the rates ofmacroinvertebrate secondary production increasedwith increasing stream order, although the taxainvolved were similar. Changes in the secondaryproduction led us to hypothesise that the totalconsumption rates (g m~2 year"1) of the macroinverte-brate community would increase downstream. Inaddition, we hypothesised that the changing resourceinputs, from allochthonous upstream to autochthonousin mid-reaches back to allochthonous downstream,
would lead to changes in frequency of consumption ofvarious resources by the macroinvertebrate commu-nity. For example, we predicted that leaves would beconsumed at a greater frequency upstream thandownstream, because of a decreasing availability ofleaves downstream.
The objective of this study was to combine analysesof gut contents, previous measurements of secondaryproduction (Grubaugh et al., 1997), and assimilationefficiencies to estimate the pathways of organic matterflow (gm~2year-1) (Benke & WaUace, 1980, 1997;Wallace et al., 1987) in stream food webs along alongitudinal resource gradient. We attempt to linkchanges in organic matter inputs predicted to occuralong river continua (Vannote et al., 1980) to resourceuse and organic matter flow in aquatic invertebratefood webs.
Methods
Study sites
This study was conducted in the Little Tennessee Riverdrainage (LTR), Macon county, NC (35°03'N, 83°25'W),U.S.A. The LTR is in the Blue Ridge province and flowsnorth from Georgia into North Carolina before enteringFontana Reservoir. The LTR drains an area of crystal-line rock, resulting in low streamwater ion concentra-tions (Swank & Waide, 1988; Swank & Bolstad, 1994).We analysed four sites (Table 1) along the LTR that hadpreviously been studied by Grubaugh, Wallace &Houston (1996). These sites range from mid to high(5-7) stream order as (1) previous work has demon-strated that there are no large changes in secondaryproduction of individual functional groups from orders1 to 5 (see Grubaugh et al, 1997) and (2) Hall et al. (2000)have estimated the trophic basis of production for a firstorder stream in the LTR. In addition, low order streamsin the LTR basin are forested and shaded throughoutthe year and the dominant allochthonous resource base(leaf litter) would be similar, in quantity and quality, toa fifth order forested site. The LTR is a typical easternriver of the U.S.A. that appears to follow many of theRCC predictions of carbon dynamics (Webster et al,1995). As such, it was an ideal gradient along which toconduct this research.
The first two sites, Coweeta Creek and Conley,are located in the Coweeta Creek Basin, which isdominated by deciduous forests (over 90%) (Swank &
© 2002 Blackwell Science Ltd, freshwater Biology, 47, 129-141

Invertebrate food webs along a river continuum 131
Table 1 Study site characteristics along the Coweeta Creek - Little Tennessee River, Macon Co., North Carolina, U.S.A.(modified from Grubaugh et al., 1996)
Site
Stream systemStream orderCatchment area (ha)Altitude (m a.s.l.)Water surface slope (%)Mean annual discharge (m3 s"1)Mean width* (m)Mean depth* (cm)Annual degree days
Coweeta Creek
Coweeta Creek515486712.90.587.2254078
Conley Road
Coweeta Creek541636330.531.3515254389
Prentiss
Little Tennessee River6362606200.0510.8525504763
lotla
Little Tennessee River7836605970.1422.1860504922
*Bankfull measurements.
Bolstad, 1994). Both sites are fifth order, but CoweetaCreek is upstream of Conley and has greater canopyclosure because of riparian rhododendron (Rhododen-dron maxima, L.). The two lower sites, Prentiss (sixthorder) and lotla (seventh order) are on the LTRmainstem. The LTR at Prentiss meanders through analluvial flood plain dominated by agriculture, but has anarrow riparian buffer zone (Grubaugh, 1995). Down-stream of the town of Franklin, the floodplain decreasesin size. The riparian zones are forested but there is littleshading because the river is wide (c. 60 m). While theupper two sites retain leafpacks throughout the year,high velocity and few retention devices reduce organicmatter storage at the lower sites. In addition, an aquaticmacrophyte, Podostemum ceratophyllum (Michaux), isfound growing on large cobbles and bedrock outcropsat all sites except Coweeta Creek. Podostemum cerato-phyllumm provides the most productive (in terms ofmacroinvertebrate secondary production) habitat atthese sites (Grubaugh et al., 1997).
Taxa studied
Gut contents were analysed from about 1000 individ-uals in 11 macroinvertebrate genera. We chose toconduct gut analyses on the two dominant (in termsof production) genera from each functional feedinggroup (FFG) that are found at each site (Grubaughet al., 1997). Functional feeding groups are typicallyassigned to genera (Merritt & Cummins, 1996). Thesetaxa included: Baetis, Stenonema (scrapers), Pteronarcys,Tipula (shredders), Ephemerella, Serratella (collec-tors), Brachycentrus, Hydropsyche (filterers), Isoperla,Acroneuria and Corydalus (predators). These 11 taxacomprise 50, 66, 51 and 66% of the annual macro-invertebrate secondary production at Coweeta Creek,
Conley, Prentiss and lotla, respectively. Because therewere not two engulfing predators of the same taxonalong the whole length of the gradient, we usedAcroneuria (Plecoptera) at Coweeta Creek and Conleyand Corydalus (Megaloptera) at Prentiss and lotla.These 11 taxa have different life cycles and were notpresent throughout the year, but the trophic basis ofproduction was determined on an annual basis so thatseasonal patterns would not affect calculations.
Guts were analysed from four to 15 individualsfrom each taxon at each site on each date. Becausepredator diets can be highly variable, a larger samplesize was used (8-10 individuals for each date) toassess the prey taxa for predators. Specimens werecollected with a kick-net and immediately preservedin Kahle's solution in the field to preserve gutcontents. Samples were collected in January, April,July and October 1996.
Diet analysis
Foreguts were dissected from each individual andcontents were identified and quantified as outlined inBenke & Wallace (1980) using a computer digitizingpad as modified by Wallace et al. (1987). Gut contents ofBaetis, Stenonema, Pteronarcys, Tipula, Ephemerella, Serr-atella and Brachycentrus were filtered onto 0.45 |xmgridded metricel filters (Gelman Sciences, Ann Arbor,MI, USA) and affixed to slides for preservation andmeasurement (Cummins, 1973). The proportion ofeach food resource consumed was estimated using therelative area of the particles found in the gut. Particleswere identified and classified into six major foodresources: amorphous detritus, animal, diatoms, fila-mentous algae, fungi and leaf tissue. Pair-wise com-parisons were conducted, using x2 tests of similarity,
© 2002 Blackwell Science Ltd, Freshwater Biology, 47, 129-141

132 E.J. Rosi-Marshall and J.B. Wallace
to determine differences in gut contents among sitesfor each taxon, not including predators.
Predators were dissected and gut contents werepreserved in lactophenol on slides. Prey items wereidentified to the lowest taxonomic level possible. Thesample size collected was too low to estimate flowfrom specific prey items to predators, so resolutionwas limited to animal material. A subsample ofpredator guts was also analysed, as described above,to measure per cent area of particles not of animalorigin (such as leaf detritus and algae) to detectconsumption of both animal and non-animal material.This analysis did not indicate high consumption ofnon-animal particles, so 100% animal material wasused in calculating the trophic basis of production andin constructing food webs.
Hydropsyche spp. were analysed differently fromother taxa for two reasons: they are generalists(Cummins, 1973; Wallace et al, 1987; Benke & Wallace,1997) and they are highly productive (e.g. 57% of totalproduction at lotla, the large river site) (Grubaughet al., 1997). Therefore we analysed 10-15 individualsper site each season. They were dissected in the samemanner as predators, to identify prey, and digitised inthe same way as non-predatory taxa, to measure thecontribution of other particle types to their diet.
Trophic basis of production
To estimate the contribution of each food type tosecondary production, the trophic basis of productionmethod described in Benke & Wallace (1980) wasused. This method calculates the trophic basis ofproduction as follows:1. Determine the fraction of production attributed to
food type i (B,-),
B,- = (G,-x AE,-)/2:G,=i,...,n.
2. Estimate the flow of organic matter via food type ito consumer ; (F,y),
Fij = (Bi x P,)/(AE,- x NPE)
where G, is the per cent of each food type, AE, =assimilation efficiency (the fraction of the organicmatter the consumer is able to assimilate) of foodtype i. Pj is the secondary production of consumer jin g m"2 year"1, data from Grubaugh et al. (1997).Although the secondary production data werecollected in a previous year, we assume similar
production values across years. The 10-fold differen-ces in secondary production among sites indicatesthat, even if there were large year-to-year changes, thesite differences would probably be maintained. Netproduction efficiency (NPE), the proportion of assim-ilated organic matter used to produce tissues, wasassumed to be 0.5 (Benke & Wallace, 1980). Assimil-ation efficiencies for each food type were taken fromWallace et al. (1987) and were as follows: diatoms 30%,filamentous algae 30%, fungi 50%, leaf tissue 10%,amorphous detritus 10% and animal 70%.
These calculations result in an estimate of theamount of food consumed (g m~2 year"1) necessaryto support the observed secondary production of eachconsumer examined. The trophic basis of productionwas estimated for each taxon at each site annually. Toestimate consumption by the entire macroinvertebratecommunity, we calculated the sum of the food typeconsumed by the portion of the community analysedand then divided this by the proportion of secondaryproduction they comprised.
Food web construction
We constructed flow food webs to illustrate patterns inorganic matter flow (in g m~2 year"1). Arrows weredrawn from each resource to each consumer based onrespective consumption rates. These food webs repre-sent the amount of food that each taxon needed toconsume to achieve the measured rates of secondaryproduction. We visually compared the dominant flowsand patterns in each flow web to detect major differ-ences in resource use along the gradient. To deter-mine the distribution of consumption rates amongeach food web, we calculated the total consumptionrates for each taxon at each site. This illustrates how thetotal consumption at a site is divided among the taxastudied and determines if there are dominant con-sumers within the food webs. Then we compared thedistribution of the consumption rates within eachcommunity using %2 tests of similarity.
Results
Trophic basis of production
In 1996, the total food consumed by the taxa analysedranged from 34 g m~2 year"1 at Coweeta Creek to730 g m"2 year"1 at lotla (Table 2). We estimate that
© 2002 Blackwell Science Ltd, Freshwater Biology, 47, 129-141

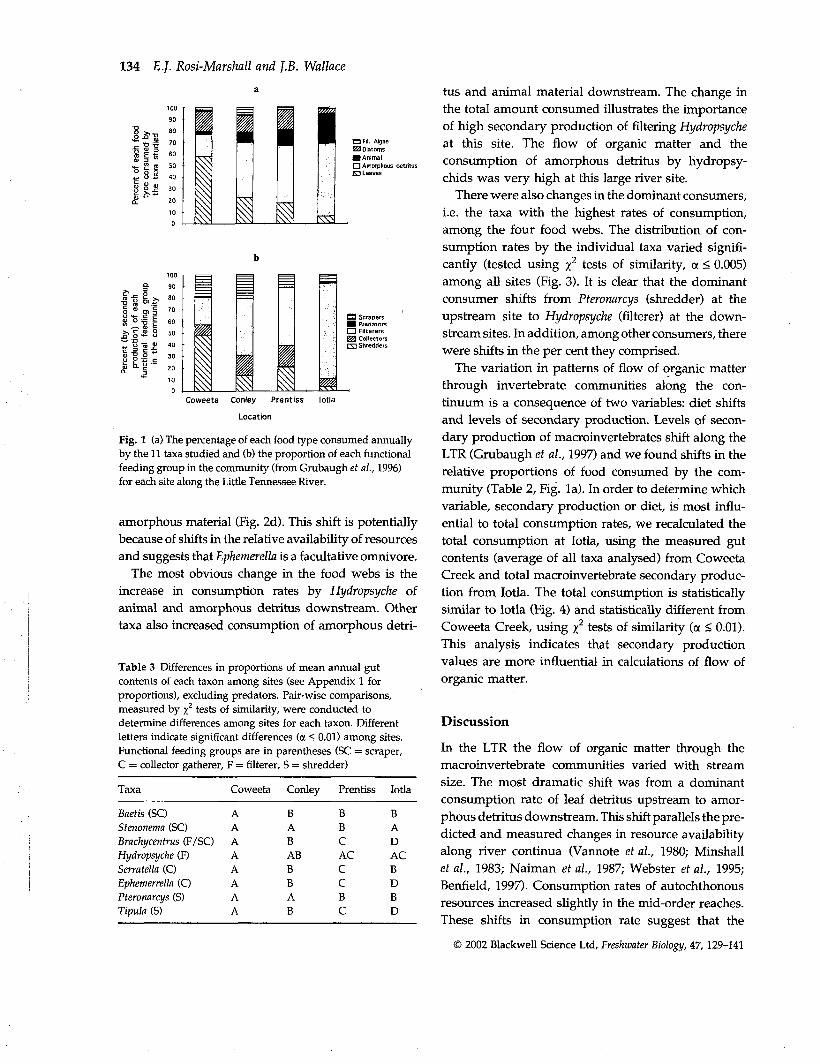
consumption by the entire macroinvertebrate com-munity ranged from 66 to 1164 g m~2 year"1 acrossthe four sites (Table 2). Consumption rates of all foodtypes increased downstream. The proportion of foodtypes consumed by the assemblage varied (Fig. la).Leaf detritus decreased from 58% of the total com-munity consumption at Coweeta Creek to 6% at lotla.In contrast, consumption of amorphous detritusincreased from 18% of the total community consump-tion at Coweeta Creek to 64% at lotla. The proportionof animal material consumed also increased from 3%at the most upstream site to 27% downstream. Thetotal rate of autochthonous resources (diatoms andfilamentous algae) consumed increased along thecontinuum (Table 2).
The food resources (i.e. leaves, diatoms, animaland amorphous detritus) found in the guts of alltaxa were similar at all sites. However, there weresignificant differences in the proportions found in thegut contents of all taxa among sites (Table 3 andAppendix 1). Some taxa had significant differencesamong all sites (e.g. Brachycentrus, Ephemerella andTipula), while others had differences among onlysome sites (e.g. Baetis, Stenonema, Pteronarcys andHydropsyche). The differences in gut contents may bebecause of increases in autochthonous resources andshifts from mainly leaves in the guts of the upstreaminsects to amorphous detritus in downstream insects(Appendix 1). In addition the magnitude of organicmatter flow (g m~2 year"1) was different among sites,mainly because of changes in secondary productionand changes in the proportion of various food types inthe guts.
Invertebrate food webs along a river continuum 133
The flow rate of organic matter from specific preytaxa to predators was not calculated because of thelimited sample size and high prey diversity in pred-ator gut contents. Although we did not calculateorganic matter flow rates of specific prey taxa, chiron-omids and simuliids were frequently found in theguts of Hydropsyche, Isoperla and Acroneuria (Table 4).Although Corydalus consumed some chironomids,they consumed mainly hydropsychid caddisflies.Predators, for food web construction, were listed asconsuming 100% animal material.
Food web construction
Annual flow food webs were constructed for each site(Fig. 2a-d). Note that there is no clear differentiation byFFG and resource consumption in the four food webs.In general most taxa, excluding predators, consumedmost of the food resources available. There are largedifferences among sites in the rate of organic matterflow of the resources to consumers. The dominant basalresource shifts from mainly leaf detritus upstream(Fig. 2a), to an even distribution of food resources (e.g.leaves, diatoms and amorphous detritus) in the middlesites (Fig. 2b,c), to mainly amorphous detritus andanimal material at the large river site (Fig. 2d).
There are also shifts in the total rates of consumptionwithin a taxon among sites. For example, Ephemerellaconsumed diatoms, amorphous detritus and leaves atmost sites, however, the rate of consumption varied.Upstream (Fig. 2a) Ephemerella consumed more leavesthan diatoms and amorphous material, whereas atthe downstream sites Ephemerella consumed more
Table 2 The sum of annual consumption rates (in g m 2 year a) by the 11 taxa analysed for each food type at each site (measured)and the estimated total consumption rate (total) for the entire macroinvertebrate community along the Little Tennessee Rivercontinuum. Total annual consumption rate was estimated by multiplying the measured consumption by the proportion of thecommunity studied. This assumes similar consumption rates for taxa whose diets were not analysed
Coweeta Creek
Food type
Amorphousdetritus
AnimalDiatomsFungiLeavesFilamentousalgae
Total
Measured
6.05
0.945.570.07
19.410.84
33.34
Total
12.1
1.8811.140.14
38.821.68
66.68
Conley
Measured
65.65
11.5819.190.00
30.478.07
134.96
Total
99.45
17.5429.07
0.0046.1612.23
204.48
Prentiss
Measured
51.96
13.9716.590.00
18.092.32
102.93
Total
101.88
27.3932.53
0.0035.47
4.54
201.8
lotla
Measured
484.62
197.9027.900
48.676.15
768.24
Total
734.27
299.8542.27
073.749.32
1164
© 2002 Blackwell Science Ltd, Freshwater Biology, 47, 129-141
134 £./. Rosi-Marshall and J.B. Wallace
70090
o § | 5°„ 8 S 40|S.5 30S." 20
100
10090
issa
a Fit. Algaett DiatomsM Animall~l Amorphous detritusro Leaves
o * rau 'S ~'S S I 608 50« 40e 30
20100
==
;%%
1
==
1
•—- ;
1
w^m
i
D Scrapers• Predatorsm FilterersQ3 CollectorsEJ Shredders
Coweeta Conley Prentiss lotlaLocation
Fig. 1 (a) The percentage of each food type consumed annuallyby the 11 taxa studied and (b) the proportion of each functionalfeeding group in the community (from Grubaugh et al., 1996)for each site along the Little Tennessee River.
amorphous material (Fig. 2d). This shift is potentiallybecause of shifts in the relative availability of resourcesand suggests that Ephemerella is a facultative omnivore.
The most obvious change in the food webs is theincrease in consumption rates by Hydropsyche ofanimal and amorphous detritus downstream. Othertaxa also increased consumption of amorphous detri-
Table 3 Differences in proportions of mean annual gutcontents of each taxon among sites (see Appendix 1 forproportions), excluding predators. Pair-wise comparisons,measured by x2 tests of similarity, were conducted todetermine differences among sites for each taxon. Differentletters indicate significant differences (a < 0.01) among sites.Functional feeding groups are in parentheses (SC = scraper,C = collector gatherer, F = filterer, S = shredder)
Taxa
Baetis (SC)Stenonema (SC)Bmchycentrus (F/SC)Hydropsyche (F)Serratella (C)Ephememlla (C)Pteronarcys (S)Tipula (S)
Coweeta
AAAAAAAA
Conley
BABABBBAB
Prentiss
BBCACCCBC
lotla
BADACBDBD
tus and animal material downstream. The change inthe total amount consumed illustrates the importanceof high secondary production of filtering Hydropsycheat this site. The flow of organic matter and theconsumption of amorphous detritus by hydropsy-chids was very high at this large river site.
There were also changes in the dominant consumers,i.e. the taxa with the highest rates of consumption,among the four food webs. The distribution of con-sumption rates by the individual taxa varied signifi-cantly (tested using #2 tests of similarity, ex < 0.005)among all sites (Fig. 3). It is clear that the dominantconsumer shifts from Pteronarcys (shredder) at theupstream site to Hydropsyche (filterer) at the down-stream sites. In addition, among other consumers, therewere shifts in the per cent they comprised.
The variation in patterns of flow of organic matterthrough invertebrate communities along the con-tinuum is a consequence of two variables: diet shiftsand levels of secondary production. Levels of secon-dary production of macroinvertebrates shift along theLTR (Grubaugh et al., 1997) and we found shifts in therelative proportions of food consumed by the com-munity (Table 2, Fig. la). In order to determine whichvariable, secondary production or diet, is most influ-ential to total consumption rates, we recalculated thetotal consumption at lotla, using the measured gutcontents (average of all taxa analysed) from CoweetaCreek and total macroinvertebrate secondary produc-tion from lotla. The total consumption is statisticallysimilar to lotla (Fig. 4) and statistically different fromCoweeta Creek, using %2 tests of similarity (a < 0.01).This analysis indicates that secondary productionvalues are more influential in calculations of flow oforganic matter.
Discussion
In the LTR the flow of organic matter through themacroinvertebrate communities varied with streamsize. The most dramatic shift was from a dominantconsumption rate of leaf detritus upstream to amor-phous detritus downstream. This shift parallels the pre-dicted and measured changes in resource availabilityalong river continua (Vannote et al., 1980; Minshallet al, 1983; Naiman et al, 1987; Webster et al, 1995;Benfield, 1997). Consumption rates of autochthonousresources increased slightly in the mid-order reaches.These shifts in consumption rate suggest that the
© 2002 Blackwell Science Ltd, Freshwater Biology, 47, 129-141

Invertebrate food webs along a river continuum 135
Table 4 Prey taxa consumed by thepredators Acroneuria, Corydalus andIsoperla along the Little Tennessee River.Prey taxa are listed from highest tolowest frequency found in predatorguts
Predator
Acroneuria
Corydalus
Isoperla
Coweeta Creek
ChironomidaeSimuliidaeStenonemaEphemerellaHydropsychePerlidaeElmidaemisc. Trichoptera
ChironomidaeSimuliidaeBaetisTrichopteraPlecoptera
Conley
ChironomidaeSimuliidaeSerratellaHydropsycheElmidaeOligochaete
ChironomidaeSimuliidaeBlephariceraPlecopteraTrichoptera
Prentiss lotla
Hydropsyche HydropsycheCorydalus ChironomidaeBrachycentrus Simuliidae
CheumatopsycheBrachycentrusPerlidae
Chironomidae ChironomidaeSimuliidae Ephemeroptera
dominant form of organic matter available to theinvertebrate community varies along the LittleTennessee River. Stored detrital matter (leaves) isthe dominant carbon resource in headwaters andorganic matter in transport (amorphous detritus) inthe water column is dominant downstream. In addi-tion, instream primary production eventually entersthe detrital pool and our methodology does notdetermine the proportion of amorphous detritus thatis allochthonous versus autochthonous. These foodwebs illustrate the importance of detrital resources inmacroinvertebrate stream food webs as emphasisedby experimental studies (Wallace et al, 1997, 1999).The main shift observed corresponds to the dominantforms of organic matter available (i.e. leaf detritus orseston). Our results suggest that the flow of organicmatter in the macroinvertebrate community may beinfluenced by shifts in resource availability along rivercontinua (Vannote et al, 1980).
Previous RCC studies have examined shifts in bio-mass (Allan, 1975; Hawkins & Sedell, 1981; Minshallet al., 1983; Grubaugh et al, 1996) and secondaryproduction (Grubaugh et al, 1997) of FFG. Aquaticinvertebrates are divided into FFGs according to theirmorphology and behavioural adaptations for foodacquisition (i.e. shredder, filterer, collector, predator,etc.) (Cummins, 1973; Merritt & Cummins, 1996).Grubaugh et al (1997) studied the secondary produc-tion of macroinvertebrates along the LTR and found a
shift in the relative proportion, in terms of secondaryproduction, of different FFGs along the continuum.Shifts in the composition of macroinvertebrate com-munities have been used to illustrate changes inresource use along river continua. For example, a highproportion of shredders suggests that leaves areimportant (Vannote et al, 1980; Minshall et al, 1983).If this were valid, the food resources consumedshould appear similar to FFG composition, which isnot supported by our data (Fig. Ib). For example,there was proportionally more leaf tissue consumed atCoweeta Creek than the proportion of shredders. Thisindicates that taxa not classified as shredders consumeleaf tissue at this site. Conversely, at Prentiss theproportion of leaf tissue consumed is less than theproportion of shredders. This suggests that taxaclassified as shredders consumed resources otherthan leaf tissue at this site (see also Plague, Wallace &Grubaugh, 1998). Discrepancies occurred for each FFG,with the exception of predators, and food resource. Inaddition, hydropsychid caddisflies consumed a largeramount of animal material at lotla than the predatorscombined, although Hydropsyche is classified as afilterer. This has been found elsewhere (Benke &Wallace, 1997; Benke et al, 2001) and demonstratesthe importance of gut content analysis in determiningtrophic status and resource use. In addition, theproportion of food types in the gut contents weresignificantly different among sites for taxa in each FFG.
© 2002 Blackwell Science Ltd, Freshwater Biology, 47,129-141

136 E.J. Rosi-Marshall and J.B. Wallace
a
dr psyche
Sera;
Isoperla
>rellaBrachycentrus
[tenonema
Amorphous Animaldetritus ^mm ijatoms Fungi Leaves Fil. algae
Amount of food consumed- < 0.1 g m-2 year1 **mmam .5-10 g m"2 year1
- 0.1 -0.5 g rrf2 year"1 ̂ ^M10-20 g m"2 year"1
- 0.5-1 g m"2 year1 ^^^ >20 g m-2 year-i
Acroneuria\Pteronai
Ephemerlla Brachycentrus
tenonema
AmorpTlBus Animaldetritus ^™ "
Amount of food consumed•<0.1girT2year"1
•O.I-O.Sgm^year'l' 0.5-1 gm"2 year1
' 1-5 gm-2 year1
«5-1 Ogrrf2 year1
• 10-20 gm"2 year1
>20 grrf2 year"1
\Pteronarcys_Serratella V ^~
Isoperla
Ephemerella;̂ Brachycentrus
Stenonema
Amorphous Animal Diatoms Fungi Leaves Fit'algaedetritus •̂" ^^ ^™ """"
Amount of food consumed-<0.1 grrf2 year"1 ^̂ ™ 5-1 Ogm"2 year1
- 0.1-0.5 g rrr2 year'MHBH 10-20 g m"2 year"1
- 0.5-1 gnf2 year"1 ^^B >20 g rrf2 year1
- 1.5 g nf2 year"1
Hydropsyche IsoperlaTripula,
EphemerellaBrachycentrus
Stenonema
Amorphous Animal Diatoms Fungi Leaves FiLajgae
Amount of food consumed- <0.1gm"2year"' ^- 0.1-0.5gm"2year"1B- 0.5-1 gm"2 year"1 g' LSgm^year1
5-1 Ogm"2 year1
H 0-20 gm"2 year1
|>20gnf2year~1
Fig. 2 Annual flow food web for (a) Coweeta Creek (fifth order stream), (b) Conley (fifth), (c) Prentiss (sixth), (d) lotla (seventh).The webs illustrate the rates of consumption (g m~2 year"1) of each trophic interaction. The width of the arrows indicate the rate offlow, i.e. a thicker arrow is a higher flow rate, and the pattern of the arrow indicates the food resource, i.e. lightly shaded isamorphous detritus.
Coweeta Conley Prentiss lotla
E3 AcroeuriaQ Brachycentrus• Baetis
D CorydalusB Ephemerella03 Hydropsyche• IsoperlaH Pteronarcys
ID SerratellaE3 Stenonema0 Tipula
Fig. 3 The per cent of consumption by each taxa in the fourfood webs. Distributions for each site were significantlydifferent from other sites as tested with jf tests of similarity(a < 0.005).
CZ1 LeavesDID Diatoms• Fil. algaeO Animal• Amorphous
detritus
Coweeta lotla consumption lotla(5th) using Coweeta gut (7th)
contents
Fig. 4 The relative importance of the level of secondary pro-duction to total annual consumption by macroinvertebrateswhen Coweeta Creek (fifth order) diets and lotla (seventh order)secondary production are used to calculate trophic basis ofproduction (middle column). Coweeta and lotla estimatesof consumption are shown for comparison (left and rightcolumns).
© 2002 Blackwell Science Ltd, Freshwater Biology, 47, 129-141

These differences suggest that dietary shifts occurredamong sites with some non-predator taxa. Predatorsmaintained similar diets composed mainly of chiron-omids and hydropsychids, similar to previous findings(Stewart, Friday & Rhame, 1973; Merritt & Cummins,1996).
Implications for future food web analysis
The application of the trophic basis of productionmethodology is useful for estimating organic matterflow in stream ecosystems and for constructingquantitative food webs (Benke & Wallace, 1997).Other methods to construct quantitative food websrequires similar information on rates of secondary pro-duction, diets and assimilation efficiencies (De Ruiteret al, 1995; Monaco & Ulanowicz, 1997). When exam-ining variability in food web dynamics, quantitativefood webs are more useful than link webs (Polis &Strong, 1996; Hall et al., 2000).
The downstream increase in secondary productionand organic matter flow rates may be attributed to anincrease in resource availability and favourable hab-itat (Grubaugh et al., 1997). Podostemum ceratophyllumis an aquatic macrophyte that occurs at Conley,Prentiss and lotla and increases the space for netconstruction by filtering organisms, e.g. Hydropsyche.This macrophyte increases both the access to suspen-ded organic matter (the dominant food resource) andhabitat for other macroinvertebrates. Analysis of theimportance of diet versus secondary productionsuggests that the large increase in organic matter flowfrom small stream to large river is strongly driven byshifts in secondary production.
The food webs constructed illustrate the extent ofheterogeneity in the neighbouring communities alongthe LTR continuum. These food webs are functionallyvery different, yet structurally similar. This is becauseof the fact that the sites have similar taxa andresources, although the rates of secondary productionof the taxa and the form of the dominant resource arevery different. Overall, the food webs were funda-mentally different along the gradient, in terms of whatwas consumed, the rates at which food resources wereconsumed and which taxa dominated the consump-tion of resources. Food webs which contain informa-tion on the rates of consumption can add to ourunderstanding of the variability in communitydynamics.
© 2002 Blackwell Science Ltd, Freshwater Biology, 47,129-141
Invertebrate food webs along a river continuum 137
Importance of diet shifts and secondary production
Aquatic invertebrates have flexible diets that canadapt to changing resource availability (see alsoPlague et al., 1998). The ability of organisms toswitch diet to exploit changing resources maypotentially buffer a system against natural fluctua-tions, thereby increasing community stability (Polis& Strong, 1996). Omnivory by aquatic invertebratesmay also facilitate univoltine life cycles in anenvironment of changing resources (Polis & Strong,1996 and references therein). Some of the organismsexamined had significantly different gut contentsalong the gradient. A large change in resource inputin this system would influence individual taxa differ-ently. Some taxa may be more capable of switchingtheir diet to exploit a shift in resources. Although theability to shift diet may enhance stability of theecosystem, the species (generic) diversity may not bemaintained if food resources shift towards a singlefood resource.
Food availability and community structure
Food limitation may control aquatic invertebrate pop-ulation dynamics in some small headwater streams(Richardson, 1991; Dobson & Hildrew, 1992; Wallaceet al., 1997, 1999). The consumption rate of the macr-oinvertebrate community at lotla was approximatelyan order of magnitude higher than the other three sites(Table 2) yet macroinvertebrate consumption at thissite does not appear to be limited by food resources. Atlotla the annual average fine particulate organic matter(FPOM) concentration is 4 mg AFDM L"1 at base flow(Rosi, 1997). [Note that FPOM (seston) concentrationcan increase during storms (Webster et al., 1995) so thisis a conservative estimate]. Using estimates of themean annual discharge we estimate that the amount ofFPOM passing over a linear metre at lotla is approxi-mately 37 000 kg year"1. This is five orders of magni-tude greater than the consumption rate of amorphousdetritus (analogous to FPOM) by Hydropsyche whichdominates secondary production (57% of total macr-oinvertebrate secondary production).
The low consumption rates of FPOM by Hydro-psyche in relation to availability in the Little TennesseeRiver are consistent with similar estimates of con-sumption by filtering insects (Benke & Wallace, 1980,1997; Georgian & Thorp, 1992). Previous estimates of

138 E./. Rosi-Marshall and J.B. Wallace
the efficiency of filtering insects to remove sestonparticles range from 0.00015% in the Tallulah River(Benke & Wallace, 1980) to 18.2% in the Mianus River(Georgian & Thorp, 1992); our estimate of 0.001%removal falls within this range. In headwater streams,coarse allochthonous detritus may be removed duringspates and become limiting to invertebrate popula-tions (Richardson, 1991; Dobson & Hildrew, 1992).In contrast, large south-eastern rivers of the U.S.A.have a continuous input of suspended FPOM which iscarried in the water column. The continuous input ofthis resource provides a large amount of energy to thefood web, which is only partially exploited by theconsumers. Polis & Hurd (1996) suggest that largeallochthonous inputs of high quality resources mayinfluence trophic dynamics, such as trophic cascades.Inputs of fine particulate matter in large rivers may bevery different from other allochthonous subsidiesfrom across spatial boundaries (Polis & Hurd, 1996)in that they are supplied constantly by flow and thatthey are the dominant basal resource supporting thefood web.
This resource is unlikely to be limiting given theconsumption rates (Benke & Wallace, 1980; Wallaceet al., 1987; Georgian & Thorp, 1992). While preda-tion has been documented as limiting macroinverte-brate communities, in the case of the LTR, the highrates secondary production suggest that predationmay not be limiting populations. Furthermore, thethick mats of P. ceratophyllum, which harbour highdensities of invertebrates, may provide refugia frompredators. Macroinvertebrate populations in largerivers may be more limited by the availability ofsuitable habitat (Benke & Wallace, 1997). Competi-tion for high quality habitat, in this case locations fornet construction in areas of optimal particle delivery,has been shown to occur in field experiments(Georgian & Thorp, 1992) and may be a limitingfactor.
Trophic basis of production calculations and thedesign of this study have limitations. First, genus wasthe lowest possible taxonomic division identifiable inthis study. Many genera along the LTR continuumcontain more than one species (Grubaugh et al., 1996;Plague et al., 1998) and the diet shifts which weobserved may be because of shifts in species compo-sition (Plague et al., 1998). However, this does notalter the calculations of organic matter flow. Secondly,the quality (assimilation efficiencies) of food resources
may vary, although assimilation efficiencies for agiven food type for aquatic macroinvertebrates arerelatively similar (Pandian & Marian, 1986). If assim-ilation efficiencies vary the flow of organic matterto consumers will change accordingly. Amorphousdetritus is the most likely resource affected byanthropogenic or microbial enrichment (Wotton,1996). Its quality may be enriched at the large riversite, lotla, because of treated wastewater dischargefrom the town of Franklin (nutrient levels released are2800 g PO4-P day"1 and 8400 g N day'1) or increasedmicrobial activity (A. Z. Worden, personal communi-cation). Given the importance of productivity in ourcalculations, changes in the assimilation efficiencies ofamorphous detritus do not alter our findings drastic-ally; with an increase from 10 to 20% assimilationefficiency, the consumption rate of Hydropsyche (thetaxon dominating production and a large consumer ofamorphous detritus) would decrease from 425 to342 g m"2 year"1 at lotla.
The value of using trophic basis of production as amethod for estimating organic matter flow outweighsthe problems discussed. Using this method, inconcert with production measured by Grubaughet al. (1997), we were able to estimate a large portionof the flow of organic matter through macroinverte-brate consumers along a river continuum. The RCCoriginally linked physical characteristics of streamsto community composition (Vannote et al., 1980).Physical and biological patterns along river continuainfluence the flow of organic matter in these com-munities as well. Various physical changes cancontribute to differences in calculated flow ratesincluding temperature, substrate and food quality. Inaddition temporal, both seasonal and diurnal, shiftsin diet composition can influence the flow rateswithin food webs. This study of the flow of organicmatter along the LTR suggests that physical andbiological attributes along river continua alter river-ine food web dynamics.
Acknowledgments
This work was supported by National Science Foun-dation grant DEB-9632854. Thanks to Sue Eggert forassistance in field sampling and Robert Hall forassistance in gut content analysis. Thanks to JudyMeyer, Ken Ross, Robert Hall and John Hutchins fortheir helpful comments on the manuscript.
© 2002 Blackwell Science Ltd, Freshwater Biology, 47, 129-141

References
Allan J.D. (1975) The distributional ecology and diversityof benthic insects in cement creek, Colorado. Ecology,56, 1040-1053.
Benfield E.F. (1997) Comparisons of litterfall input tostreams. In: Stream Organic Matter Budgets (Eds J.R.Webster & J.L. Meyer, 1997), pp. 95-103. Journal of theNorth American Benthological Society, 16, 3-161.
Benke A.C. & Wallace J.B. (1980) Trophic basis ofproduction among net-spinning caddisflies in aSouthern Appalachian stream. Ecology, 61, 108-118.
Benke A.C. & Wallace J.B. (1997) Trophic basis ofproduction among riverine caddisflies: implicationsfor food web analysis. Ecology, 78,1132-1145.
Benke A.C., Wallace J.B., Harrison W. & Koebal J.W.(2001) Food web quantification using secondary pro-duction analysis: predaceous invertebrates of the snaghabitat in a subtropical river. Freshwater Biology, 46,329-346.
Cummins K.W. (1973) Trophic relations of aquaticinsects. Annual Review of Entomology, 18,183-206.
Cummins K.W., Gushing C.E. & Minshall G.W. (1995)Introduction: an overview of stream ecosystems.In: River and Stream Ecosystems (Eds C.E. Gushing,K.W. Cummins & G.W. Minshall), pp. 1-8. Eslevier,New York, NY, USA.
De Ruiter P.C., Neutel A. & Moore J.C. (1995) Energetics,patterns of interaction strengths, and stability in realecosystems. Science, 269, 1257-1260.
Dobson M. & Hildrew A.G. (1992) A test of resourcelimitation among shredding detritivores in low orderstreams in southern England. Journal of Animal Ecology,61, 69-77.
Georgian T.J. & Thorp J.H. (1992) Effect of microhabitatselection on feeding rates of net-spinning caddisflylarvae. Ecology, 73, 229-240.
Grubaugh J.W. (1995) Influence of elevation, stream size, andland use on structure function, and production of benthicmacroinvertebrates. PhD Dissertation, University ofGeorgia, Athens, GA.
Grubaugh J.W., Wallace J.B. & Houston E.S. (1996)Longitudinal changes of macroninvertebrate commu-nities along an Appalachian stream continuum.Canadian Journal of Fisheries and Aquatic Sciences, 53,869-909.
Grubaugh J.W., Wallace J.B. & Houston E.S. (1997)Secondary production along a Southern Appalachianriver continuum. Freshwater Biology, 37, 581-596.
Hall R.O., Wallace J.B. & Eggert S.L. (2000) Organicmatter flow in stream food webs with reduced detritalresource base. Ecology, 81, 3445-3463.
Invertebrate food webs along a river continuum 139
Hawkins C.P. & Sedell J. (1981) Longitudinal andseasonal changes in functional organization of macro-invertebrate communities in four Oregon streams.Ecology, 62, 387-397.
Holt R.D. (1996) Temporal and spatial aspects of foodweb structure and dynamics. In: Food Webs: Integrationof Patterns and Dynamics (Eds G.A. Polis & K.O.Winemiller, 1995), pp. 255-257. Chapman & Hall,New York, NY.
Lamberti G.A. & Steinman A.D. (1997) A comparison ofprimary production in stream ecosystems. In: StreamOrganic Matter Budgets (Eds J.R. Webster & J.L. Meyer,1997), pp. 95-103. Journal of the North American Bentho-logical Society, 16, 3-161.
Merritt R.W. & Cummins K.W. (1996) An Introductionto Aquatic Insects of North America. Kendall-Hunt,Dubuque, LA.
Minshall G.W., Peterson R.C., Cummins K.W., Bott T.L.,Sedell J.R., Gushing C.E. & Vannote R.L. (1983)Interbiome comparison of stream ecosystem dynamics.Ecological Monographs, 53,1-25.
Monaco M.E. & Ulanowicz R.E. (1997) Comparativeecosystem trophic structure of three U.S. mid-Atlantic estuaries. Marine Ecology Progress Series,161, 239-254.
Naiman R., Melillo J.M., Lock M.A., Ford T.E. & ReiceS.R. (1987) Longitudinal patterns of ecosystem pro-cesses and community structure in a subarctic rivercontinuum. Ecology, 68, 1139-1156.
Pandian T.J. & Marian M.P. (1986) An indirect procedurefor the estimation of assimilation efficiency of aquaticinsects. Freshwater Biology, 16, 93-98.
Plague G.R., WaUace J.B. & Grubaugh J.W. (1998)Linkages between trophic variability and distributionof Pteronarcys spp. (Plecoptera: Pteronarcyidae) along astream continuum. American Midland Naturalist, 139,224-234.
Polis G.A. & Hurd S.D. (1996) Allochthonous inputacross habitats, subsidized consumers, and apparenttrophic cascades: examples from an ocean-land sur-face. In: Food Webs: Integration of Patterns and Dynamics(Eds G.A. Polis & K.O. Winemiller, 1995), pp. 275-285.Chapman & Hall, New York, NY.
Polis G.A. & Strong D.R. (1996) Food web complexityand community dynamics. American Naturalist, 147,813-46.
Power M.E. (1992) Top-down and bottom-up forcesin food webs: do plants have primacy? Ecology, 73,733-746.
Richardson J.S. (1991) Seasonal food limitation of detri-tivores in a montane stream: an experimental test.Ecology, 72, 873-887.
© 2002 Blackwell Science Ltd, Freshwater Biology, 47,129-141

140 E.J. Rosi-Marshall and J.B. Wallace
Rosi E.J. (1997) The trophic basis of production of aquaticmacroinvertebrate communities along a river continuum.MS Thesis, University of Georgia, Athens, GA.
Stewart K.W., Friday G.P. & Rhame R.E. (1973) Foodhabits of hellgrammite larvae, Corydalus cornutus(Megaloptera: Corydalidae), in the Brazos River,Texas. Annals of the Entomological Society of America,66, 959-963.
Swank W.T. & Bolstad P.V. (1994) Cumulative effectsof land use practices on water quality. In: Hydrolo-gical, Chemical and Biological Processes of Transforma-tion and Transport of Contaminants in AquaticEnvironments; Hydrochemistry 1993 Symposium, Rostov-on-Don, Russia, 24-29 May 1993 (Eds N.E. Peters,R.J. Allan & V.V. Tsirkunov), IAHS Publication, 219,x + 458 pp., pp. 409^121. International Association ofHydrological Sciences, Wallingford, England, UK;Washington, DC.
Swank W.T. & Waide J.B. (1988) Characterization ofbaseline precipitation and stream chemistry andnutrient budgets for control watersheds. EcologicalStudies Analysis and Synthesis, 60, 57-80.
Vannote R.L., Minshall G.W., Cummins K.W., Sedell J.R.& Gushing C.E. (1980) The river continuum concept.Canadian Journal of Fisheries and Aquatic Sciences, 37,130-137.
Wallace J.B., Benke A.C., Lingle A.H. & Parsons K. (1987)Trophic pathways of macroinvertebrate primaryconsumers in subtropical blackwater streams. Archivfur Hydrobiologie, 74, 423-451.
Wallace J.B., Eggert S.L., Meyer J.L. & Webster J.R. (1997)Multiple trophic levels of a forest stream linked toterrestrial litter inputs. Science, 277,102-104.
Wallace J.B., Eggert S.L., Meyer J.L. & Webster J.R. (1999)Effects of resource limitation on a detrital-basedecosystem. Ecological Monographs, 69, 409-442.
Webster J.R. & Meyer J.L. (1997) Stream organic matterbudgets. Journal of the North American BenthologicalSociety, 16, 3-161.
Webster J.R., Wallace J.B. & Benfield E.F. (1995) Organicprocesses in streams of the Eastern United States.In: River and Stream Ecosystems (Eds C.E. Gushing,K.W. Cummins & G.W. Minshall), pp. 117-188.Elsevier, New York, NY, USA.
Winemiller K.O. (1996) Factors driving temporal andspatial variation in aquatic floodplain food webs.In: Food Webs: Integration of Patterns and Dynamics(Eds G.A. Polis & K.O. Winemiller, 1995), pp. 298-312.Chapman & Hall, New York, NY, USA.
Winterbourn M.J., Rounick J.S. & Cowie B. (1981) AreNew Zealand stream ecosystems really different? NewZealand Journal of Marine and Freshwater Research, 15,321-328.
Wotton R.S. (1996) Colloids, bubbles, and aggregates -a perspective on their role in suspension feeding.Journal of the North American Benthological Society, 15,127-135.
(Manuscript accepted 24 April 2001)
) 2002 Blackwell Science Ltd, Freshwater Biology, 47, 129-141

Invertebrate food webs along a river continuum 141
Appendix 1 Average annual gut contents or proportion of total digitised particles data for all sites for each taxon excludingpredators
Taxa
Brachycentrus
Baetis
Ephemerella
Hydropsyche
Pteronarcys
Serratella
Stenonema
Tipula
Food type
Amorphous detritusAnimalDiatomsFilamentous algaeFungiLeaves
Amorphous detritusAnimalDiatomsFilamentous algaeFungiLeaves
Amorphous detritusAnimalDiatomsFilamentous algaeFungiLeaves
Amorphous detritusAnimalDiatomsFilamentous algaeFungiLeaves
Amorphous detritusAnimalDiatomsFilamentous algaeFungiLeaves
Amorphous detritusAnimalDiatomsFilamentous algaeFungiLeaves
Amorphous detritusAnimalDiatomsFilamentous algaeFungiLeaves
Amorphous detritusAnimalDiatomsFilamentous algaeFungiLeaves
Coweeta Creek
0.2400.0000.2190.0340.0010.505
0.2540.0000.3380.0710.0810.253
0.1760.0000.0620.1100.0000.653
0.6440.2420.0040.0290.0000.079
0.0420.0000.0920.0000.0050.861
0.2340.0000.6240.0210.0000.142
0.4610.0120.2850.0140.0010.227
0.0110.0000.0070.0200.0000.962
Conley
0.1990.0000.2900.0800.0100.421
0.4470.0000.3420.0830.0000.149
0.4060.0000.2190.1930.0000.182
0.7240.2070.0120.0020.0000.035
0.1010.0000.0520.0450.0000.802
0.5150.0000.3980.0000.0000.088
0.5550.0040.1330.0430.0010.264
0.0620.0000.0310.0000.0000.906
Prentiss
0.3360.0000.2210.1440.0040.295
0.4270.0000.3030.0440.0000.227
0.4260.0000.3580.0000.0000.215
0.6940.2680.0030.0170.0000.012
0.2050.0000.2860.0460.0090.454
0.2640.0000.7200.0000.0000.016
0.7600.0000.1660.0000.0000.069
0.0750.0000.1210.0190.0020.784
lotla
0.1510.0000.2380.1030.0000.507
0.4810.0000.3660.0000.0000.153
0.5670.0010.0860.0000.0000.351
0.7400.3250.0000.0080.0000.010
0.4180.0000.2780.0660.0000.507
0.4580.0000.4650.0060.0000.077
0.6310.0000.1880.0000.0000.181
0.2710.0000.1660.0480.0000.515
© 2002 Blackwell Science Ltd, Freshwater Biology, 47, 129-141