frequency domain analysis on acoustic emission signal in bone
TRANSCRIPT
FREQUENCY DOMAIN ANALYSIS ON ACOUSTIC EMISSION
SIGNAL IN BONE TISSUES
MUHAMMAD HAFIZ BIN RAMLI
Thesis submitted in fulfillment of the requirements
for the award of the degree of
Bachelor of Mechanical Engineering
Faculty of Mechanical Engineering
UNIVERSITI MALAYSIA PAHANG
22 JUNE 2012
vi
ABSTRACT
The purpose of this study is to study acoustic emission signal in bone tissues. The
objectives of this research are to determine acoustic emission (AE) signal in different
types of bone tissue; hard and soft bone’s tissue and to observe the trend of acoustic
emission signal for penetration during pedicle screw fixation procedure. It also to
propose a method to help medical practitioner in penetration process during pedicle
screw fixation procedure using acoustic emission technique. Generally, the medical
practitioner had a hard time while doing the pedicle screw fixation procedure when it
involved with cervical spine. The cervical spine is the most complicated articular
system in the body because the anatomy of the region which are close to spinal cord.
This study would help to monitor the penetration process. For this study, goat vertebras
were use as specimen. During pedicle screw fixation procedure, pedicle probe is used to
penetrate the specimen and sensor captured the AE signal and recorded data with help of
AEWin Software. Using FFT analysis the result show dominant frequency in compact
bone is high compare to spongy bone. AE signal also can be measure when pedicle
probe penetrated through the interface of the bone tissues during the pedicle screw
fixation procedure. In conclusion, AE technique can use for monitoring acoustic
emission signal produced by specimen in pedicle screw fixation procedure.
vii
ABSTRAK
Tujuan kajian ini adalah untuk mengkaji isyarat pancaran akustik dalam tisu tulang.
Objektif kajian ini adalah untuk menentukan isyarat pancaran akustik (AE) dalam tisu
tulang yang lembut dan keras dan untuk melihat pola isyarat pancaran akustik untuk
penembusan semasa prosedur pemasangan skru. Tujuan kajian ini juga adalah untuk
mencadangkan satu kaedah untuk membantu pengamal perubatan dalam proses
penetrasi semasa prosedur pemasangan skru menggunakan teknik pelepasan akustik.
Kebiasaannya, pengamal perubatan mengalami kesukaran ketika melakukan prosedur
pemasangan skru apabila melibatkan dengan tulang servikal. Tulang servikal
merupakan sistem artikular yang paling rumit di dalam badan kerana berhampiran
dengan saraf tunjang. Kajian ini akan membantu untuk memantau proses penetrasi.
Untuk kajian ini, tulang belakang kambing telah digunakan sebagai spesimen. Semasa
prosedur pemasangan skru, prob pedikel digunakan untuk menembusi spesimen dan
sensor akan menangkap isyarat AE dan merekodkan data dengan bantuan perisian
AEWin. Dengan menggunakan FFT analisis, frekuensi dominan dalam tulang padat
adalah lebih tinggi berbanding tulang berongga. Isyarat AE juga boleh diukur apabila
prob pedikel menembusi tisu tulang semasa prosedur pemasangan skru. Kesimpulannya
AE teknik boleh digunakan untuk memantau isyarat pancaran akustik yang dihasilkan
oleh spesimen dalam prosedur pemasangan skru.
viii
TABLE OF CONTENTS
TITLE PAGE
TITLE PAGE i
DECLARATION iii
DEDICATION iv
ACKNOWLEDGEMENT v
ABSTACT vi
ABSTRAK vii
TABLE OF CONTENTS viii
LIST OF TABLES x
LIST OF FIGURES xi
LIST OF ABBREVIATIONS xii
LIST OF APPENDICES xiii
CHAPTER 1: INTRODUCTION 1
1.1 Introduction 1
1.2 Objectives 2
1.3 Scope of study 2
1.4 Project background 3
CHAPTER 2: LITERATURE REVIEW 4
2.1 Basic bone anatomy 4
2.1.1 Function of bone tissue 4
2.1.2 Compact bone 5
2.1.3 Spongy bone 5
2.1.4 Vertebral column 6
2.1.5 Region of vertebral column 7
2.1.6 Cervical region 8
2.1.7 Pedicle screw 8
2.2 Acoustic emission 10
2.2.1 Detection of AE signals 11
2.2.2 Processing of AE signals 11
2.2.3 Displaying AE signals 12
2.2.4 Locating AE signal technique 12
2.3 Signal analysis 13
2.3.1 Frequency domain 13
2.3.2 Frequency domain convolution and correlation 14
2.3.3 Fast Fourier Transform 15
2.3.4 Representing signals 15
2.3.5 Post FFT processing 15
ix
2.3.6 FFT output analysis 16
CHAPTER 3: METHODOLOGY 17
3.1 Introduction 17
3.2 Research flow 17
3.2.1 General research flow 18
3.2.2 Gantt chart for PSM 1 19
3.2.3 Gantt chart for PSM 2 20
3.3 Pedicle screw method 20
3.3.1 Specimen preparation 20
3.3.2 Pedicle screw fixation equipment 21
3.3.3 Test procedure 22
3.4 Acoustic emission data acquisition system 24
3.5 Signal processing 26
CHAPTER 4: RESULTS AND DISCUSSION 30
4.1 Introduction 30
4.2 Summary of experiment 30
4.3 Fast Fourier Transform 32
4.4 Trend comparison of bone structure 50
4.5 Discussion 52
CHAPTER 5: CONCLUSION AND RECOMMENDATION 54
5.1 Conclusion 54
5.2 Recommendation 55
REFERENCES 56
APPENDIX A 58

x
LIST OF TABLES
TABLE NO. TITLE PAGE
4.1 Summary of experiment process 30
4.2 Summary of dominant frequency 31
xi
LIST OF FIGURES
FIGURE NO. TITLE PAGE
2.1 Compact and spongy bone 6
2.2 Anterior and lateral view 7
2.3 Posterior view of cervical vertebra 8
2.4 X-ray of pedicle screw 9
2.5 Acoustic emission equipment 10
2.6 Acoustic emission detection 11
2.7 Acoustic emission signal 12
2.8 Locating AE signal 13
2.9 Waveform 14
2.10 Signal process 14
2.11 FFT output 16
3.1 Flow chart PSM 1 18
3.2 Goat vertebra 21
3.3 Pedicle probe equipment 22
3.4 Sensor location 22
3.5 Penetration process 23
3.6 Experimental flow chart 24
3.7 Pre-amplifier 25
3.8 Typical of AE apparatus 25
3.9 Acoustic emission sensor 26
3.10 Data form menu 27
3.11 Import data command box 27
3.12 Import wizard command box 28
3.13 Workspace command window 28
3.14 Figure command box 29
3.15 Frequency domain graph 29
4.1 Dominant frequency for FFT analysis of Run 1 33
4.2 Dominant frequency for FFT analysis of Run 2 34
4.3 Dominant frequency for FFT analysis of Run 3 36
4.4 Dominant frequency for FFT analysis of Run 4 37
4.5 Dominant frequency for FFT analysis of Run 5 39
4.6 Dominant frequency for FFT analysis of Run 6 40
4.7 Dominant frequency for FFT analysis of Run 7 42
4.8 Dominant frequency for FFT analysis of Run 8 43
4.9 Dominant frequency for FFT analysis of Run 9 45
4.10 Dominant frequency for FFT analysis of Run 10 46
4.11 Dominant frequency for FFT analysis of Run 11 48
4.12 Dominant frequency for FFT analysis of Run 12 50
4.13 Trend of penetration for Run 4,5 and 6 51
4.14 Trend of penetration for Run 1,2 and 3 52

xii
LIST OF ABBREVIATIONS
AE Acoustic emission
FDA Frequency domain analysis
FFT Fast Fourier Transform

xiii
LIST OF APPENDICES
APPENDIX NO. TITLE PAGE
A Matlab coding 58

CHAPTER 1
INTRODUCTION
1.1 INTRODUCTION
In medical practices, bone penetration is one of the processes that need to be
master by physicians especially by orthopaedic surgeon. In orthopaedic surgery always
involved the musculoskeletal system and surgeon need to use both surgical and non-
surgical means to treat musculoskeletal trauma, sports injuries, degenerative diseases,
infections, tumours and congenital conditions. Before this, bone penetrations used in
surgery totally depend on surgeon’s manual skills to stop the penetration when
completing a hole. Human bones consist of cancellous and cortical bones that are very
different in density and thickness. This soft and hard bone tissue could be estimated in
order to assist the surgeon while penetration process. During the procedure, the surgeon
has to insure uniform penetration through the bone. The problem in bone penetration
can sometimes be the occurrence of bone necrosis, which means the irreversible death
of bone cell near the hole.
The need of pedicle screw fixation is important in treating the bone fracture,
causes many researcher and organizations are trying to build any devices or ways in
order to improve penetration technique, which is relatively low cost and time saving.
During the penetration process, a hole to fix screw needed and it is totally depending on
the surgeon manual skill to complete a hole. The surgeon has to put enough pressure
according to the bone tissue either hard or soft. Sometimes, it is hard for surgeon to
complete a hole in cervical or thoracic region because the anatomy of the region itself
are closed to spinal cord and major vein that could lead to other side effect to the patient
if the process goes wrong. Realizing the shortage that could risk the patient, this study
2
would enhance the process with the knowledge of acoustic emissions (AE) to ensure the
safety of the patients and give courage and confident to the surgeon while doing this
procedure.
In this project, the acoustic emission (AE) technique was use to monitor the
penetration process. This technique was developed base on the theory of transient
elastic waves that emitted from rapid strain energy release inside a material that
subjected to stress. Acoustic Emission signal events will give different results when
across these layers and to study the trend and it characteristics the results was
investigate. During penetration procedure, pedicle probe used by surgeon when
perforating a hole produced elastic wave. The AE sensors that attached at the vertebra
sensed the transient elastic wave known as AE signal events. The AE signal events was
further analysed to indicate the component’s condition into the time and frequency
domain. Time and frequency domain will justify some parameter such as peak
amplitude and frequency.
1.2 OBJECTIVES
For this project, two main objectives are list as below:
i. To determine Acoustic Emission (AE) signal in different types of bone tissue;
hard and soft bone’s tissue.
ii. To observe the trend of Acoustic Emission signal for penetration during pedicle
screw fixation procedure.
1.3 SCOPE OF STUDY
For this case study, the acoustic emission technique used to monitor penetration
in the bone. An animal bone penetrated into the tissue; for the real situation, human
bones will be use, usually at spinal cord. During the process, the acoustic emission
signal acquired. Data from the acoustic emission signal were then analysed using
frequency domain analysis in order to get acoustic characteristic whenever the tissues
hit in term of time domain. Acoustic emission is a suitable method for recognizing the

3
crossing of interfaces between the hard and soft tissues to discriminate among layers of
different tissues.
1.4 PROJECT BACKGROUND
The problem of bone fracture in medicine has existed from the times when humans
started to treat other people and animals. In case of fracture, it is most important to
return the fractured parts into their initial position and to fixate them in the best possible
way. In modern medicine, there are two basic approaches to fracture; a conventional
approach and a direct one. In the conventional approach, the immobilisation of the
fractured parts done from the outside. The surgeons treat the fracture by setting it and
placing the immobilisation aids from outside. A great disadvantages of this approach
lies in the fact that the fractured parts cannot be optimally aligned, and in case of some
types of bone fractures the alignment from outside is not possible. Besides, long patient
recovery is an additional disadvantage of this approach. The direct approach, on the
other hand, is a more recent method in which the surgeon penetrated the bone around
the fracture site in order to set the immobilisation screws and plates and perform bone
fixation. Pedicle probe was use by surgeons while pedicle screws fixation process. This
research is important to surgeon in order to monitor the penetrations procedure that vital
in orthopaedic surgery. It can assist the surgeon in the perforation process to be more
precisely and accurately. This research also can help the surgeon from doing careless
mistake in order to save life. The interests in monitoring penetration or perforation
processes, frequency domain become very essential since it is relatively low cost and
the result could be save more life and pain.
CHAPTER 2
LITERATURE REVIEW
2.1 BASIC BONE ANATOMY
Bone is the basic unit of the human skeletal system and provides the framework
for and bears the weight of the body, protects the vital organs, supports mechanical
movement, hosts hematopoietic cells, and maintains iron homeostasis. A bone is made-
up of several different tissues working together (Yang, 2010). Bone tissue is a
specialized form of connective tissue and is the main element of the skeletal tissues. It is
composed of cells and an extracellular matrix in which fibres are embedding. Bone is a
hard, but brittle, tissue and is relatively light per unit volume. Bone is a dynamic tissue,
which throughout life bone tissue is continually being forms and resorbed.
2.1.1 Function Of Bone Tissue
Skeletal system is the biological system providing support in living organism,
which is build from bone tissue. Bone provides the internal support of the body and
sites of attachment of tendons and muscles that is essential for locomotion. It also
provides protection for the vital organs of the body where the skull protects the brain
and the ribs protect the heart and lungs and is need to assist in movement along with
skeletal muscles. The skeleton functions not only as the support for the body but also in
haematopoiesis. The hematopoietic bone marrow is protects by the surrounding bony
tissue. The main store of calcium and phosphate is in bone. Bone has several metabolic
functions especially in calcium homeostasis.
5
Bone tissue can be classified in several ways, including texture, matrix
arrangement, maturity, and developmental origin. Bone in human and other mammal
bodies are generally classifies into two main categories of tissues that is cortical bone
also known as compact bone and trabecular bone also known as cancellous or spongy
bone (Yang, 2010). These two types are classifies based on texture of cross sections.
Cortical bone is founds to be primary in the shaft of long bones and form the outer shell
around spongy bone at the end of joints and vertebrae. Spongy bone is sponge like with
numerous cavities. It is located within the medullary cavity and consists of extensively
connected bony trabeculae that are oriented along the lines of stress. It is founds to be in
the end of long bones in vertebrae and in flat bones like the pelvis (Yang, 2010).
2.1.2 Compact Bone
In compact bone, tissue contains few spaces and is the strongest form of bone
tissue. Compact bone is ivory like and dense in texture without cavities. It is the shell of
many bones and surrounds the trabecular bone in the centre. Compact bone consists
mainly of haversian systems or secondary osteons tissue that arranged into repeating
units (Yang, 2010). Bones are characterized anatomically as long bones (humerus,
femur), flat bones (membrane bones) and irregular bones (such as the vertebrae).
Usually, compact bone tissue is found beneath the periosteum of all bones and it form
as diaphyses of long bones. Furthermore, the used of compact bone tissue is to provides
protection and support and resists the stresses produced by weight and movement.
These osteons are aligns in the same direction along lines of stress (Yang, 2010).
2.1.3 Spongy Bone
In contrast to compact bone, complete osteons are usually absent in sponge bone
due to the thinness of the trabeculae; lamellae arranged in an irregular lattice of thin
columns or network of branching bone spicules. The macroscopic spaces between the
trabeculae help make bone lighter and sometimes it can be fills by red bone marrow
(Yang, 2010). Spongy bone tissue forms most of the bone tissue of short, flat and
irregularly shaped bones. The trabeculae of spongy bone tissue also are precisely
oriented along lines of stress that it is very important to help bones resist stresses and

6
transfer force without breaking. Usually, spongy bone tends to be located where bones
are not heavily stresses or where stresses are applies from many directions. Spongy
bone tissue is light, which reduces the overall weight of a bone and as a result it move
more readily when pulled by a skeletal muscle. Sponge bone is also more metabolically
active than compact bone because of its much larger surface area for remodelling
(Yang, 2010). All these bone types, regardless of their anatomical form, are composed
of both spongy and compact bone.
Figure 2.1: Compact and Spongy Bone
Source: Rose (2007)
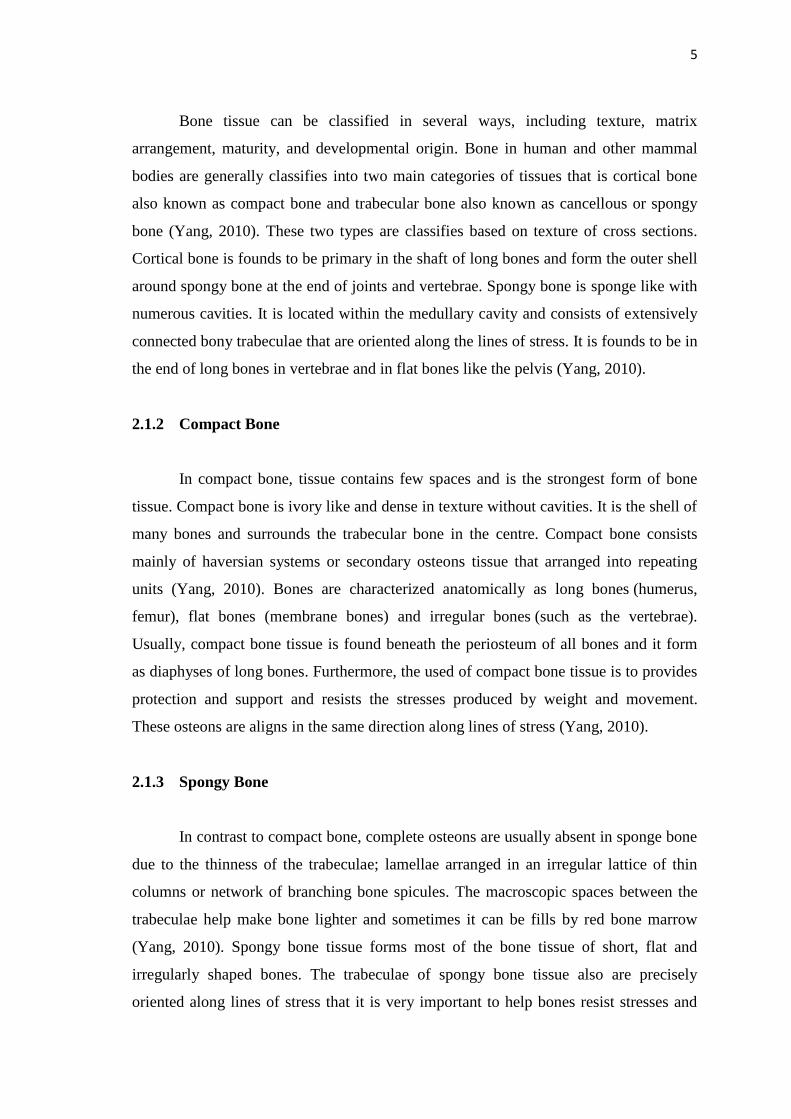
2.1.4 Vertebral Column
The vertebral column (Figure 2.2) also called spine or backbone formed about
two-fifths of human total height and consists of a series of bones called vertebrae. The
vertebral column consists of bone and connective tissue; the spinal cord that is
surrounds and protects consists of nervous and connective tissues (Cumming, 2007).
Besides, the vertebral column functions as a strong, flexible rod with elements that can
move forward, backward and sideways either rotate. In addition to protecting and
enclosing the spinal cord, it supports the head and serves as a point of attachment for the
7
ribs, pelvic girdle and muscles of the back. The vertebral column can be show as in
figure below.
Figure 2.2: Anterior view and right lateral view
Source: Cumming (2007)
2.1.5 Region of Vertebral Column
The vertebral columns consist of five regions that vertebrae in each region
numbered in sequence, from superior to inferior. The regions known as cervical region,
thoracic region, lumbar region, sacrum and lastly is coccyx. According to the physician,
the most risky part during the process is the cervical region because it is smalls
compared to other region and close to bloodline and spinal cord itself.
8
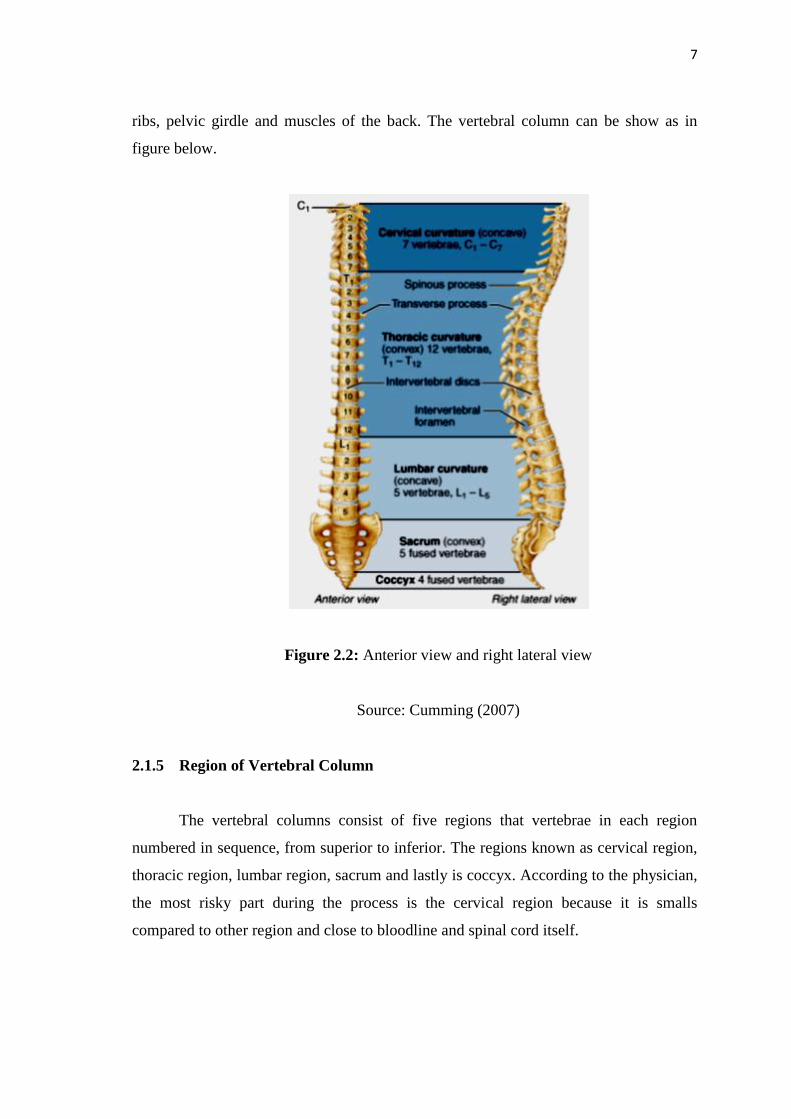
2.1.6 Cervical Region
The cervical region is the upper part of the spine that begins directly below the
skull and ends at the top of the thoracic spine. Seven vertebrae and the discs that
separate them constitute the cervical region (Jenkins, 2009). These vertebrae, designated
C1 through C7, shaped like a backward C, forming a lordotic curve. The lumbar section
of the spine forms a similar curve, while the thoracic and the sacral regions of the spine
form kyphotic curves. This configuration of opposing curves helps distribute the
mechanical stress that continually bombards the spine.
Figure 2.3: Posterior view of cervical vertebrae
Source: Tortora et al. (2006)
2.1.7 Pedicle Screw
Bone screws had been use in spinal instrumentation since the 1960s. A pedicle
screw is a particular type of bone screw designed for implantation into a vertebral
pedicle (Susan, 2010).The pedicle screw, which is sometimes use as an adjunct to spinal
9
fusion surgery, provides a means of gripping a spinal segment. The screws themselves
do not fixate the spinal segment, but act as firm anchor points that can be connect with a
rod (Peter et al., 2009).
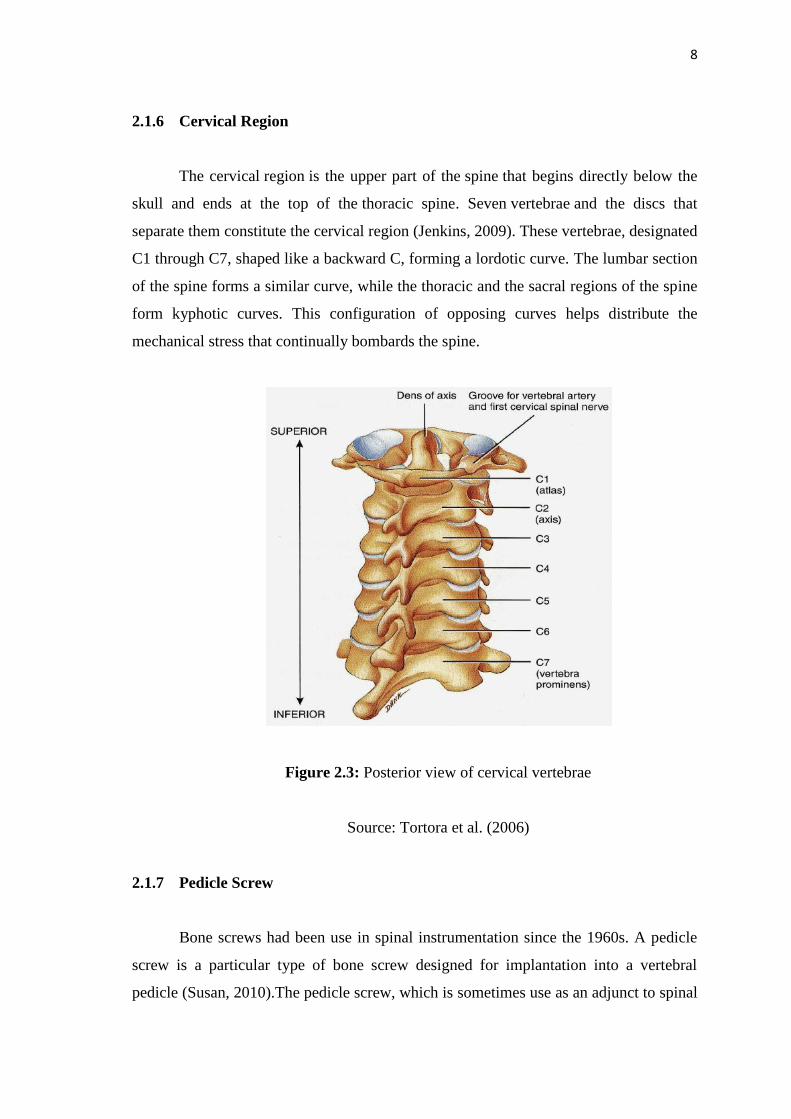
The screws were place at two or three consecutive spine segments (lumbar
segment 4 and 5) and then a short rod was use to connect the screws. This construct
prevents motion at the segments that fused.
Figure 2.4: MRI of Pedicle Screws in Place (lateral view)
Source: Peter et al. (2009)
Nowadays, polyaxial pedicle screw made of Titanium, which is highly resistant
to corrosion and fatigue, and is MRI compatible. The screw was thread and the head is
mobile; it swivels helping to defray vertebral stress. Polyaxial pedicle screw length
ranges from 30mm to 60mm (up to 2-1/2 inches). The diameter ranges from 5.0mm to
8.5mm (up to 1/4 inch) (Susan, 2010).These screws are use to correct deformity, and/or
treat trauma. Similar to other bone screws, pedicle screws may be use in instrumentation
procedures to affix rods and plates to the spine. The screws may also be use to
immobilize part of the spine to assist fusion by holding bony structures together.
Initially, the safety and effectiveness of pedicle screws was call into question.
However, the initial controversy has been favourably resolved and pedicle screws are

10
now approve by the FDA for use in the lower (lumbar) spine for specific conditions.
There is, however, a steep learning curve in the technique for placing the pedicle
screws, and only surgeons comfortable and experienced with the technique should use
those (Peter et al., 2009).
2.2 ACOUSTIC EMMISION (AE)
Acoustic emission is the elastic energy that is spontaneously release by materials
when they undergo deformation. In the early 1960s, a new non-destructive testing
technology was born when it was recognize that growing cracks and discontinuities in
pressure vessels could be detect by monitoring their acoustic emission signals.
Formally, defined, acoustic emission is "the class of phenomena where transient elastic
waves are generated by the rapid release of energy from localized sources within a
material, or the transient elastic waves so generated" (McIntire, 2011). A wide variety
of structures and can be monitored by acoustic emission techniques during the
application of an external stress (load). The primary acoustic emission mechanism
varies with different materials and should be characterize before applying acoustic
emission techniques to a new type of material (Miller, 2011). Once the characteristic
acoustic emission response has been define, acoustic emission tests can be use to
evaluate the structural integrity of a component.
Figure 2.5: Acoustic Emission equipment
Source: Acoustic Emission journal

11
2.2.1 Detection of AE Signals
Sources of AE include many different mechanisms of deformations and fracture
whilst the detection process remains the same. As a crack grows, a number of emissions
are releases. When the AE wave front arrives at the surface of a test specimens minute
movements of the surface molecules occur. The function of AE sensors is to detect this
mechanical movement and convert it into a useable electric signal. This process can be
describes as signal detection (Holford, 2005).
Figure 2.6: AE Detection
Source: http://www.acousticemission.net
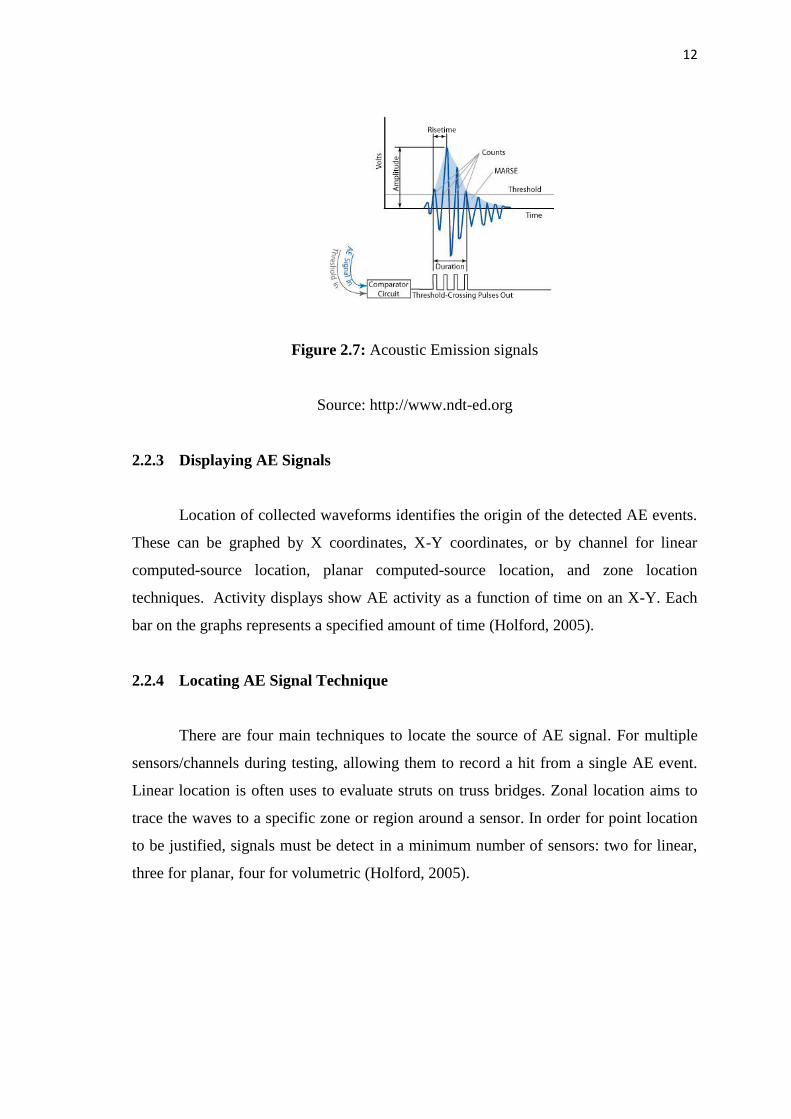
2.2.2 Processing of AE Signals
The sensor is attach to the test surface and held in place with tape or adhesive.
An operator then monitors the signals, which are excite by the induced stresses in the
object. When a useful transient, or burst signal is correctly obtained, parameters like
amplitude, counts, measured area under the rectified signal envelope (MARSE),
duration, and rise time can be gathered (Holford, 2005).
Crack
Wavefront
Acoustic sensor
12
Figure 2.7: Acoustic Emission signals
Source: http://www.ndt-ed.org
2.2.3 Displaying AE Signals
Location of collected waveforms identifies the origin of the detected AE events.
These can be graphed by X coordinates, X-Y coordinates, or by channel for linear
computed-source location, planar computed-source location, and zone location
techniques. Activity displays show AE activity as a function of time on an X-Y. Each
bar on the graphs represents a specified amount of time (Holford, 2005).
2.2.4 Locating AE Signal Technique
There are four main techniques to locate the source of AE signal. For multiple
sensors/channels during testing, allowing them to record a hit from a single AE event.
Linear location is often uses to evaluate struts on truss bridges. Zonal location aims to
trace the waves to a specific zone or region around a sensor. In order for point location
to be justified, signals must be detect in a minimum number of sensors: two for linear,
three for planar, four for volumetric (Holford, 2005).

13
Figure 2.8: Locating AE Signal
Source: http://www.acousticemission.net
2.3 SIGNAL ANALYSIS
2.3.1 Frequency Domain
Frequency-domain analysis (FDA) is a way of processing interferograms to
obtain surface profiles. Analysing data in the frequency domain means that we are
thinking about the different phases and optical frequencies that contribute to a fringe
pattern created by an interferometer (Edward, 2008). For example, in the old days,
interferograms of optical surfaces were often pain staking analyzed by hand, using a
photograph of the fringes. It is now much more common to perform some form of phase
shifting interferometry (PSI), which allows us to transform the interference pattern
electronically into a matrix of phase values.
These phase values can be directly relates to relative height values, if the
wavelength or optical frequency of the source light known. The transformation from
fringes to phases accomplished with an algorithm such as the familiar five buckets
method. All signals have a frequencydomain representation and in 1822, Baron Jean
Baptiste Fourier detailed the theory that any real world waveform can be generates by
the addition of sinusoidal waves. This was arguably developed first by Gauss in 1805
(Edward, 2008). The following diagram shows an example of this process:
Crack
Wavefron
Acoustic sensor
14
= +
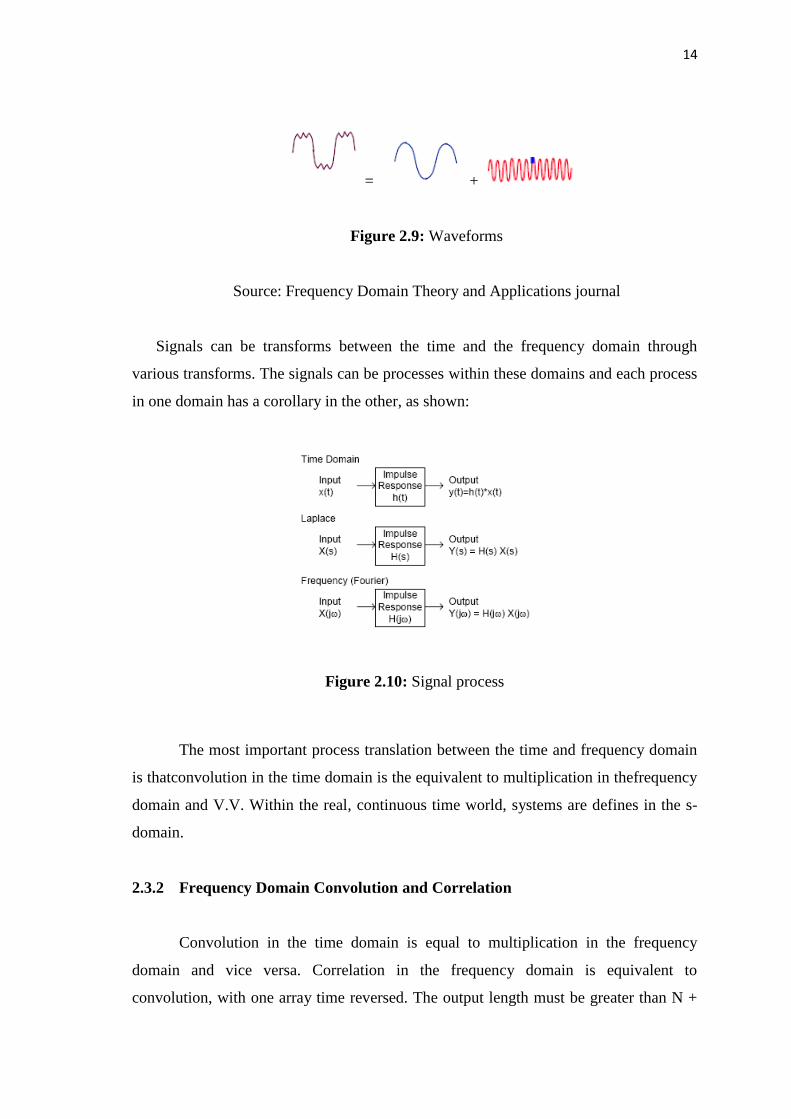
Figure 2.9: Waveforms
Source: Frequency Domain Theory and Applications journal
Signals can be transforms between the time and the frequency domain through
various transforms. The signals can be processes within these domains and each process
in one domain has a corollary in the other, as shown:
Figure 2.10: Signal process
The most important process translation between the time and frequency domain
is thatconvolution in the time domain is the equivalent to multiplication in thefrequency
domain and V.V. Within the real, continuous time world, systems are defines in the s-
domain.
2.3.2 Frequency Domain Convolution and Correlation
Convolution in the time domain is equal to multiplication in the frequency
domain and vice versa. Correlation in the frequency domain is equivalent to
convolution, with one array time reversed. The output length must be greater than N +

15
M – 1, where N and M are the lengths of the input vectors. It is important that the FFT
length is also therefore greater than N + M – 1. The first thing that is required is that the
inputs require zero-padding, otherwise the result is circular convolution or correlation.
The benefits of this are the potential large computational savings. For many
applications, it is possible to pre-compute the convolution or correlation kernel FFT for
more efficiency (Edward, 2008).
2.3.3 The Fast Fourier Transform (FFT)
The Fourier transform can be consider a bank of band-pass filters that takes in a
signal and the magnitude of the output of each filter is proportional to the total input
energy into that filter. Each of these filters is convolving the input with a set of filter
coefficients that are sinusoidal in nature, with the frequency of oscillation equal to the
centre frequency of the filter. When performing the convolution over all the banks,
many of the multiplications of data and coefficient values are repeated and therefore
redundant (Edward, 2008).
2.3.4 Representing Signals
Signals can be represents in many different ways. From Fourier’s theory, we
know that we can represent any real world signal by the combination of two or more
sinusoids. Therefore, we need to be able to understand how sinusoids work, in order that
we can understand how the complex signals operate.
2.3.5 Post FFT Processing
FFT processing is not useful in itself, but the post FFT processing that is usually
the important issue, and it defines what information can be extract from the information.
Power Spectrum Estimation is one of the common post FFT calculations and is
calculate by averaging the outputs from successive FFTs. The following equations show
how to calculate the magnitude and phase of the signals (Edward, 2008).