french open-end investment fund (sicav) norden
TRANSCRIPT

French open-end investment fund
(SICAV)
NORDEN
ANNUAL REPORT
as at March 31st, 2020
Management company: Lazard Frères Gestion SAS
Custodian: Lazard Frères Banque
Statutory auditor: PriceWaterhouseCoopers Audit
Lazard Frères Gestion SAS - 25 rue de Courcelles - 75008 - Paris - France

2
CONTENTS
1. Characteristics of the UCI 3
2. Changes affecting the UCI 8
3. Management report 11
4. Regulatory information 18
5. Certification by the Statutory Auditor 25
6. Annual financial statements 30
3
1. CHARACTERISTICS OF THE UCI
• LEGAL FORM French open-end investment company (Société d'Investissement à Capital Variable - SICAV) with a board
of directors • CLASSIFICATION International equities.
• ALLOCATION OF DISTRIBUTABLE INCOME Distributable income consists of: 1) net income plus retained earnings, plus or minus the balance of the revenue adjustment account. Net income for the financial year is equal to the amount of interest, arrears, dividends, bonuses and
prizes, directors’ fees and all income generated by the securities that make up the Fund’s portfolio, plus income generated by temporary cash holdings, minus management fees and borrowing costs. 2) realised capital gains, net of charges, minus realised capital losses, net of charges, recognised for the financial year, plus any net capital gains of the same kind recognised over previous years that have
not been distributed or accumulated, plus or minus the balance of the capital gains adjustment account. The amounts referred to in 1) and 2) may be accumulated and/or distributed and/or retained independently of each other, in whole or in part. Distributable income shall be fully accumulated, with the exception of those amounts subject to
compulsory distribution by law.
• INVESTMENT OBJECTIVE The investment objective is to outperform, net of charges, over the recommended investment period of three years, the following benchmark index: MSCI Nordic Countries. The benchmark index is expressed in EUR. Net dividends or coupons are reinvested.
• BENCHMARK The MSCI Nordic Countries index represents the equity market performance of the Nordic countries (Sweden, Denmark, Norway and Finland). Data are available at: www.indices.theice.com
• INVESTMENT STRATEGY
1. Strategies used A company’s rate of return on invested capital above the cost of capital reflects its economic performance,
as shown in its long-term stock market performance. Accordingly, the strategy applied within the SICAV is based on the following: - Identifying companies with the best economic performance profiles. - Verifying that performance through financial analysis and examination of underlying strategies. - Selecting these companies' stocks according to the market's undervaluation of this performance at a
given point in time. - Building a portfolio focused on 35-60 stocks with good liquidity from large and mid-sized
Scandinavian companies without restrictions on sectors.
The focus on achieving the optimum ratio between the company's economic performance and valuation
may result in wide divergences between the SICAV's performance and its sector and/or country mix and those of the underlying asset class, i.e. the large and mid caps of the four Nordic countries of the zone.
2. Assets (excluding embedded derivatives)
Equities:

4
A minimum of 75% of net assets in shares issued by companies listed in or domiciled in the four Nordic
countries (Sweden, Norway, Denmark and Finland) across all market capitalisations (including up to 20% of net assets in small cap shares either directly or via specialised UCIs). Debt securities and money market instruments: - A maximum of 10% in bonds issued by companies across all market capitalisations from the four Nordic countries (Sweden, Norway, Denmark and Finland).
- A maximum of 10% in debt securities and money market instruments, mainly French and
Scandinavian treasury bonds and BTAN medium-term treasury notes. UCIs: - A minimum of 10% of net assets in French money-market and short-term money market UCITS, French or foreign UCITS or AIFs that meet the four criteria of Article R. 214-13 of the French Monetary and Financial Code (Code monétaire et financier). - Investment solely in UCIs that invest no more than 10% of their assets in other UCIs.
These UCIs may be managed by the management company.
3. Derivatives
• Types of markets: regulated organised OTC
• Risks that the manager intends to seek exposure to: shares interest rates foreign exchange credit other
• Transaction types - all transactions must be limited to achieving the investment objective:
hedging exposure arbitrage
• Types of instruments used:
futures: equity and equity index interest rate: interest rate risk exchange rates: currency hedging
options: equities and equity indices interest rate
currency
swaps: equity swaps interest rate swaps currency swaps currency forwards: hedging of currency risk
credit derivatives
5
• Derivatives strategy to achieve the investment objective: partial or general portfolio hedging creating synthetic exposure to assets and risks increasing exposure to the market without leverage maximum permitted and sought other strategy
4. Securities with embedded derivatives The acquisition of these securities is not part of the SICAV's management strategy. Nevertheless, the manager may invest in any securities with embedded derivatives permitted under the management
company's business plan, notably warrants, certificates or rights acquired following transactions involving the portfolio securities.
5. Deposits: Up to 10% of the SICAV's assets may be held in deposits.
6. Cash borrowings: The SICAV may borrow cash within the limit of 10% of its assets to meet specific cash requirements related to its operating needs.
7. Temporary purchases and sales of securities: None.
8. Information on financial guarantees: In connection with over-the-counter derivative transactions, and in accordance with Position paper 2013-
06 issued by the French financial markets regulator (Autorité des Marchés Financiers– AMF), the SICAV may receive collateral in the form of securities (such as bonds or other securities issued or guaranteed by a State or issued by international financing agencies and bonds or securities issued by high quality
corporate issuers), or cash. Any cash collateral received is reinvested in accordance with the applicable rules. All such assets must be from high-quality issuers that are not an entity of the counterparty or its group, and must be liquid and diversified with low volatility. Haircuts may be applied to the collateral received; they take into account the securities' creditworthiness and price volatility.
• RISK PROFILE
Your money will be mainly invested in financial instruments selected by the management company. These instruments will be exposed to market trends and fluctuations.
The SICAV is classified as an "International Equities" fund. Its main risks are those associated with investments in the "Equities" markets of the Nordic countries (Sweden, Denmark, Norway and Finland).
Capital risk: The SICAV does not benefit from any guarantee or protection. It is therefore possible that you may not recover the full amount of your initial investment.
Equity market risk: Fluctuations in equity markets may result in significant changes in net asset value, which may have a significant negative impact on performance for an undefined period of time.
Accordingly, the SICAV's net asset value may decrease in the event of a downturn in equity markets.
In addition, the volume of small- and mid-cap stocks listed on the stock exchange is relatively small and
downward market movements tend to be faster than for large caps. The SICAV’s net asset value may therefore decline rapidly and significantly.

6
Foreign exchange risk: Investing in the Nordic equity market involves exposure to foreign exchange risk
in relation to the portfolio's accounting currency and may have a negative impact on the SICAV's net asset value. Accordingly, the SICAV's net asset value may decrease in the event of a fall in the euro exchange rate.
Counterparty risk: This is the risk associated with the SICAV's use of over-the-counter forward financial instruments. These transactions, entered into with one or more eligible counterparties, potentially expose the SICAV
to a risk of failure of any such counterparty, which may lead to a payment default.
Interest rate risk: Interest rate risk is the risk of a change in interest rates, which has an impact on the
bond markets, For example, the price of a bond tends to move in the opposite direction to interest rates. The SICAV is mainly invested in equities; interest rate risk is therefore insignificant. However, investors should note that share prices may be indirectly impacted by interest rate movements.
Guarantee or protection: None.
• ELIGIBLE SUBSCRIBERS AND TYPICAL INVESTOR PROFILE All subscribers, and more particularly institutional investors seeking equity risk exposure. Subscribers are strongly advised to diversify their investments sufficiently to avoid exposure solely to the risks of this SICAV.
Information relating to US investors:
The SICAV is not registered as an investment vehicle in the United States and its shares are not and will
not be registered under the Securities Act of 1933 and, therefore, they may not be offered or sold in the United States to Restricted Persons, as defined hereafter. A Restricted Person is (i) any person or entity located in the United States (including US residents), (ii) any corporation or any other entity subject to the laws of the United States or any state thereof, (iii) any US
military personnel or any employee of a US government department or agency located outside the United States, or (iv) any other person that would be considered a US Person under Regulation S of the Securities Act of 1933, as amended.
FATCA:
Pursuant to the provisions of the Foreign Account Tax Compliance Act ("FATCA") applicable as of July 1st, 2014, if the SICAV invests directly or indirectly in US assets, the capital and income arising from such
investments may be subject to withholding tax of 30%. To avoid paying the 30% withholding tax, France and the United States have entered into an intergovernmental agreement under which non-US financial institutions (“foreign financial institutions”) agree to institute procedures for identifying direct or indirect investors who qualify as US taxpayers and
to provide certain information about these investors to the French tax authorities, which will disclose said information to the US tax authority, the Internal Revenue Service. As a foreign financial institution, the SICAV undertakes to comply with the FATCA and to take all appropriate measures pursuant to the
aforementioned intergovernmental agreement.
The amount that it is reasonable to invest in this SICAV depends on each investor's personal circumstances. To determine this, investors should take account of their personal financial situation,
current needs and the recommended investment period, and should also consider their ability to assume risk or whether they prefer instead to opt for a more cautious investment.

7
Recommended investment period: minimum five years.

8
2. CHANGES AFFECTING THE UCI
None.

9
Corporate governance (CSR) section
I. List of appointments
Directors’ names Number of
offices held List of offices and functions
François-Marc Durand
Chairman of Lazard Frères Gestion SAS
4
Chairman and Chief Executive Officer of the Norden SICAV
Member of the Boards of Directors of the SICAVs:
o Lazard Small Caps Euro o Lazard Credit Opportunities o Lazard Alpha Allocation
François Voss 2
Chairman of the Board of Directors of the Lazard Patrimoine Croissance SICAV
Director of the Norden SICAV
Monica Nescaut
Managing Director of Lazard Frères Gestion SAS
4
Member of the Boards of Directors of the SICAVs:
o Norden o o Lazard Small Caps Euro o Lazard Credit Opportunities o Lazard Equity SRI
II. Agreements covered by Article L225-37-4 para.2 of the French Commercial Code The SICAV was not informed of the conclusion of any agreements covered by Article L.225-37-4 para.2 of the French Commercial Code during the financial year ended March 31st, 2020.
III. Table of currently-valid delegations of powers granted by the shareholders' meeting, as stipulated
in Article L225-37-4 para.3 of the French Commercial Code No delegations of power covered by Article L.225-37-4 para.3 of the French Commercial Code were granted or were ongoing during the financial year ended March 31st, 2020.
IV. Method of operation of executive management The Board of Directors has opted not to separate the functions of Chairman of the Board of Directors and Chief Executive Officer.

10
Directors' fees proposed to the members of the Board of Directors by the NORDEN Sicav for the financial year ending 31 March 2020
Members of the Board of Directors
Directors’ fees
paid by the
SICAV
François-Marc Durand Chairman of Lazard Frères Gestion SAS
0
Fonds de Garantie des assurances obligatoires de dommages (*) Represented by Fabrice Zamboni
0
Lazard Frères Gestion SAS Represented by Mr Jean-Jacques de Gournay Managing Director of Lazard Frères Gestion SAS
0
François Voss 0
OCIRP Represented by Julien Le Louët
€ 1 800
SOFIPROTEOL (*) Represented by Aymeric Mongeaud
0
IRP AUTO Prévoyance Santé Represented by Agnès Canarelli
€ 1 800
Valorey Finance Represented by Henry Masdevall
€ 1 800
Monica Nescaut Managing Director of Lazard Frères Gestion SAS
0
IRC Alliance Professionnelle Retraite ARRCO Represented by Frédéric Alexan
€ 1 800
CAMACTE represented by Mr Marc Wendling € 1 800
(*) Resignation
11
3. MANAGEMENT REPORT
"At the date of preparation of the management report and in the context of uncertainty linked to the COVID-19 health crisis, with the exception of the use of swing pricing for certain bond funds, the events listed
below, which would call into question the continuity of operations, have not occurred:
• significant events occurring during the financial year such as changes in the methods of applying accounting methods (implementation of model valuation, activation of gates, suspension of NAV).
• other elements such as information relating to possible situations of suspension of
subscriptions/redemptions, liquidation of funds or creation of a ring-fencing fund.
PERFORMANCE
The UCI’s performance over the period was as follows: -15,39%.
Performances vary over time and past performance is no guarantee of the UCI's future results.
The benchmark's performance over the period was: -7,84%.
ECONOMIC ENVIRONMENT
Economy
2019 was marked by a synchronised slowdown in the global economy, particularly in the manufacturing
sector. Several factors weighed on the markets, in particular trade tensions between China and the United States, political uncertainties in Europe, problems specific to the automotive sector and factors specific to some large emerging countries. Given the slowing growth and growing risks, the world's major
central banks chose to ease their monetary policy. The Fed cut its interest rates on several occasions, the ECB announced a package of accommodating measures, including a cut in the deposit facility rate and a resumption of asset purchases, and the Chinese central bank lowered the reserve requirement ratio for
banks. Against this backdrop, equity markets had a bumpy ride and bond yields fell around the world.
While the decline in international uncertainties had enabled the global economy to begin a recovery towards the end of 2019, this movement was abruptly halted by the outbreak of the coronavirus epidemic in the first quarter of 2020. The epidemic, which was initially limited to China, then turned into a pandemic.
To contain it, many countries adopted lockdown measures, shut down their economies and closed their borders, resulting in an extremely severe economic and financial shock. The IMF expects a 3% contraction in GDP in 2020 followed by a 5,8% rebound in 2021. Public authorities and central banks announced far-
reaching support measures in response to this crisis.
In the United States, the lockdown measures broke the strong growth momentum that prevailed in 2019.
From mid-March, several million people registered for unemployment in just a few weeks. Industrial production and retail sales collapsed in March. Homebuilder confidence fell to an all-time low in April. The Federal Reserve announced a raft of measures: cut in its key rate by a cumulative 150 basis points to 0%-
0,25%, an unlimited purchasing programme for Treasuries and mortgage-backed securities, a programme of loans to businesses and local authorities, etc. US Congress adopted an unprecedented
fiscal stimulus plan exceeding $2,000 billion.
In Europe, growth was flagging already in 2019 and the largest countries shut down their economies in
March. PMI surveys recorded historic falls over the month and companies made full use of short-time working schemes, particularly in France and Germany. The ECB announced a €120 billion increase in its asset purchase programme, the creation of a new €750 billion asset purchase programme and an
increase in its TLTRO lending with more attractive terms for banks. The Bank of England inter alia cut its policy interest rate by 65 basis points to 0,10%, announced a £200 billion asset purchase programme and

12
paved the way for direct financing of the fiscal deficit. The main countries presented fiscal stimulus plans
as well as a strengthening of the public guarantee schemes for bank loans.
In China, growth was in a phase of economic acceleration before the country adopted drastic measures to control the epidemic from the end of January. Hubei province, the cradle of the epidemic, was quarantined on January 23rd, the New Year holidays were extended and some factories closed. As a result, activity
statistics and PMI surveys collapsed in January/February. But the epidemic was quickly contained, allowing for an easing of lockdown measures and leading to a rebound in activity in March. China's central bank cut interest rates and the reserve requirement ratio for banks. The government announced support
measures of around 2,5% of GDP. In Japan, the VAT hike in October led to a sharp contraction in GDP in the fourth quarter of 2019. In March, the composite PMI recorded its sharpest fall since the 2011 earthquake. The Japanese Prime Minister declared a state of emergency. The Tokyo 2020 Olympic Games were postponed. The government
announced a fiscal stimulus plan of around 3% of GDP and the central bank announced an increase in its asset purchases.
Markets
Equity markets fluctuated through the ups and downs of the trade tensions between China and the US in
2019. In late January 2020, the implementation of lockdown measures in China triggered an initial decline, but this was only short-lived. The markets rapidly made up their losses and hit new highs in mid-February. The spread of the epidemic outside China then triggered an extremely drastic decline.
European equities fell by nearly 40% in just one month and implied volatility soared. A low point was reached in mid-March, thanks to support measures from public authorities and central bank actions.
Over the last twelve months, the MSCI World index in dollars has fallen by 13,0%. Equities in developed countries fell by 12,1% and those in emerging countries by 19,8%. In their respective currencies, the S&P
500 fell by 8,8%, the Eurostoxx by 17,4% and the Topix by 11,8%.
In the bond markets, government bond yields fell, especially in the United States where the 10-year
Treasury yield fell from 2,41% in March 2019 to 0,67% in March 2020, with an historic low of 0,54% on March 10th. The German 10-year government bond yield fell from -0,07% to -0,47% over the same period. Despite a widening in the first quarter of 2020, the credit spreads of peripheral countries against Germany
tightened or widened very slightly year-on-year: -250 basis points in Greece, -56 basis points in Italy, -2 basis points in Spain and +2 basis points in Portugal for the 10-year maturity.
In the European credit segment, credit spreads widened sharply from 121 to 227 basis points for investment-grade issuers and from 392 to 754 basis points for high-yield issuers, according to Bank of
America Merrill Lynch ICE indices. Most of the movement took place in March 2020.
In the foreign exchange market, the euro depreciated by 1,7% against the dollar, from 1,12 to 1,10 over one
year. However, this variation masks a high degree of volatility, particularly in the first quarter of 2020 when the euro moved within a range of 1,07 to 1,14. Year-on-year, the euro depreciated by 4,6% against the yen and by 5,0% against the Swiss franc. It strengthened by 3,2% against the pound sterling. Emerging
currencies fell by around 15% year-on-year on average against the dollar, according to the JPMorgan index.
The price of Brent fell from $67 to $22 per barrel, a drop of 68% over one year. In mid-September 2019, the attack on two oil facilities in Saudi Arabia caused the price of oil to rise by about $12 per barrel in a single
day, but the movement was brief. From the end of January, fears of a decline in global demand triggered a downward movement. Oil prices subsequently fell in March after Russia refused to support OPEC in a coordinated reduction in oil production.
MANAGEMENT POLICY

13
Norden delivered a performance of -15,39% over full-year 2020 against -7,84% for its benchmark index,
the MSCI Nordic with net dividends reinvested, i.e. an underperformance of 755bp.
After a strong rally in the first quarter of 2019 (+14,5% for the MSCI World net dividends reinvested expressed in euros), the global markets came to a halt in May but ended the second quarter with a gain. While the trend seen in the first quarter continued in April, renewed tensions around a trade war and a
slowdown in global growth combined with the continuous fall in sovereign interest rates sparked a sharp fall in the markets in May. They picked up in June, helped by the increasingly accommodative stance of central banks, prepared to act if necessary, and by hopes of a resolution of the trade dispute between
China and the United States at the end of the G20 summit. With regard to the United Kingdom, the postponement of the Brexit deadline to October 31st made it possible to rule out the risk of a no-deal Brexit in the short term, while also prolonging the period of uncertainty. Against this backdrop, Norden ended
the quarter on a sharp increase of +1,52% compared with +1,44% for its benchmark index. It was negatively affected mainly by poor stock picks in industrial goods, agri-food, chemicals and retail and suffered from an adverse allocation effect in utilities. In terms of stocks, Ambu (Medical Equipment, Denmark; -39,6%), Swedish Match (Smokeless Tobacco, Sweden; -16,5%), Leroy Seafood (Fishing Industry, Norway; -7,1%) and the absence of DSV (Logistics, Denmark; +17,1%) and Orsted (Energy Production and Supply, Denmark; +12,6%) were among the largest negative contributors to relative performance this quarter. Conversely,
the fund was mainly driven by healthcare, technology and banks. Specifically, the portfolio benefited from gains in Elekta (Radiotherapy machines, Sweden; +15%) and Securitas (Security services, Sweden; +9,9%)
but also stood out from its benchmark thanks to the strong underweights in Nokia (Fixed and mobile networks, Finland; -13%) and Novo-Nordisk (Pharmaceuticals, Denmark; -4%). Eschewing oil stocks, Norden benefited from the stagnation of the Brent barrel price during the quarter (+0,1%), which
fluctuated in line with OPEC's restrictions and US-Chinese and US-Iranian tensions.
The third quarter of 2019 was also quite turbulent. The markets fluctuated in line with trade tensions, signs
of a slowdown in global growth, accommodative messages from central banks, tensions in Hong Kong and the Middle East, uncertainties about the future of Brexit and the investigation into Donald Trump’s impeachment. The global markets represented by the MSCI World (net dividends reinvested expressed in
euros) nevertheless rose by 5,0% over these three months. July saw further signs of a slowdown in the global economy. The central banks responded by adopting a more accommodative stance. As expected, the Fed cut its key rate by 25bp while the ECB announced further easing measures for the end of the
quarter. August saw a further escalation of tensions and tariff increases between China and the United States despite a compromise having been negotiated at the end of June during the G20 summit. Amid all of that, the UK's new Prime Minister, Boris Johnson, caused market jitters due to concerns about a
possible exit without an agreement. In September, the market bounced back following signs of an easing of tension between China and the US. This rebound was also triggered by increasingly accommodative
statements by central bankers. The Fed decided to reduce its key rate by another 25bp to a band of 1,75%-2,00% while specifying that it would act again if necessary. In Europe, the ECB cut its deposit facility rate by 10bp, improved long-term lending conditions for banks and finally planned to relaunch its quantitative
easing programme to the tune of €20 billion a month the following quarter. In the United Kingdom, the Prime Minister remained determined to leave the European Union on October 31 st, with or without an agreement. Against this backdrop, Norden ended the third quarter of 2019 down 4,31% compared with an
increase of 1,23% for the MSCI Nordic net dividends reinvested. It was negatively affected mainly by industrial goods, consumer products and services, healthcare and food and beverages. More specifically, the portfolio was held back inter alia by the poor performances of Valmet (industrial equipment, Finland; -18,8%), ISS (Business services, Denmark; -14,5%), Thule (Consumer goods, Sweden; -20%) and Husqvarna (Consumer goods, Sweden; -15,1%). By contrast, the retail, automotive and chemical sectors were the best contributors thanks to a positive stock-picking effect. Norden once again benefited from its
lack of exposure to the energy sector. The main gains of note came from Kesko (Retail, Finland; +18,5%), Autoliv (Automotive equipment, Sweden; +16,2%) and Astrazeneca (Pharmaceuticals, Sweden/UK; +14,9%). The portfolio also benefited from the good performances of Tele2 (Telecom operator, Sweden; +11,2%) in telecoms and the absence of Vestas Wind Systems (Wind power, Denmark; -6,2%), AP Moller Maersk (Maritime transport, Denmark; -6,2%) and Yara International (Chemicals, Norway; -4,9%) in
energy, industrial goods and chemicals, respectively.

14
The main stock market indices ended 2019 with performances never seen since 2009, even hitting new all-
time in the United States. During this quarter, most of the geopolitical risks faded away, contributing to a sharp market acceleration after a summer soft patch. The hope of a so-called phase 1 partial agreement between Beijing and Washington contributed greatly to renewed investor appetite for risky assets. And it
was at the last session of the year that Donald Trump announced that he would sign a first agreement with China on January 15th, 2020. After a series of twists and turns and long months of dithering, Brexit should soon be ratified. Following numerous setbacks and postponements, Boris Johnson won a large victory in
the early general elections, allowing him to negotiate freely with Europe during the transition period following a Brexit that must take place no later than January 31st, 2020. In addition, markets were once again able to benefit from central banks' accommodative policies. The Fed cut its rates a third time,
bringing its target range to 1,50%-1,75%. As for the ECB, its QE was officially relaunched in early November and Mario Draghi was replaced by Christine Lagarde who held a promising speech. Against this backdrop, Norden ended the last quarter of 2019 on an increase of 7,77% compared with an increase of 7,61% for the
MSCI Nordic net dividends reinvested. The portfolio suffered mainly from adverse stock-picking in industrial goods and banks. It was also hurt by a negative allocation effect in commodities and financial services as well as by its lack of exposure to the energy sector. More specifically, the main negative
contributors were the poor performances by Konecranes (Lifting and handling equipment, Finland; -6,9%) and Elekta (Radiotherapy machines, Sweden; -2,5%), which are not represented in the index. In addition, the absence of Vestas Wind Systems (Wind power, Denmark; +26,5%), Sandvik (Tooling, Sweden; +22,1%)
and DSV (Logistics, Denmark; +17,7%) also had a marked negative impact on the fund. In contrast, Norden's outperformance over the quarter was due in part to good stock-picking in technology, consumer products
and services and chemicals. In terms of stocks, we find Valmet (Industrial equipment, Finland; +19,9%), Swedish Match (Smokeless tobacco, Sweden; +21,6%), Alfa Laval (Industry, Sweden; +24,5%) and Simcorp (Asset management software, Denmark; +25,9%).
The first three months of 2020 were explosive. We need to go back to the 2008 crisis to find disruptions and volatility levels of the same magnitude. However, the start of the year was marked by general
optimism. Good news in the previous quarter, such as the lull in the trade war, the fading fears of a hard Brexit and central banks' accommodative monetary policy, continued to boost investor sentiment. Investors really panicked from mid-February onwards. Global markets then fell drastically and volatility
spiked. Everything changed when COVID-19, initially announced as a flu-like disease involving only one region of China, became a global pandemic. In an attempt to contain it, the affected countries declared a lockdown of the population, bringing the global economy to a sudden halt. Political and monetary
authorities took drastic and unprecedented measures (fiscal, tax and monetary), enabling the financial markets to bounce back at the end of the quarter without regaining what had been lost. Against this
backdrop, Norden ended the first quarter of 2020 with a sharp fall of 19,19% versus -16,59% for the MSCI Nordic net dividends reinvested. The industrial goods, healthcare and automotive sectors were the main negative contributors to relative performance. The fund was hurt by its underweighting of Novo-Nordisk (Pharmaceuticals, Denmark; +7,4%) and the poor performances of Konecranes (Lifting and handling equipment, Finland; -43%), Elekta (Radiotherapy machines, Sweden; -35,8%) and Autoliv (Automotive equipment, Sweden; -42,1%). With large question marks hanging over global growth and fears of a decline
in demand, oil prices fell sharply at the start of the year, hitting $22 for a barrel of Brent at the end of the quarter. The fund therefore benefited from its lack of exposure to the energy sector and the commodities sector. The portfolio also benefited from a positive allocation effect in banks and consumer products and
services and a positive stock-picking effect in food and beverages. From a more global perspective, Norden benefited from the rises of Swedish Match (Smokeless tobacco, Sweden; +12,4%), Ambu (Medical equipment, Denmark; +48%), Coloplast (Medical devices, Denmark; +19,5%) and the absence of Equinor (Integrated oil, Norway; -34,9%) and Nordea Bank (Bank, Finland; -29,2%).
The Norden SICAV remained 3,0% invested in the Norden Small fund (-12,95%) and 0,3% in the Norden Family fund (-12,03%).
Past performance is no guarantee of future results.
15
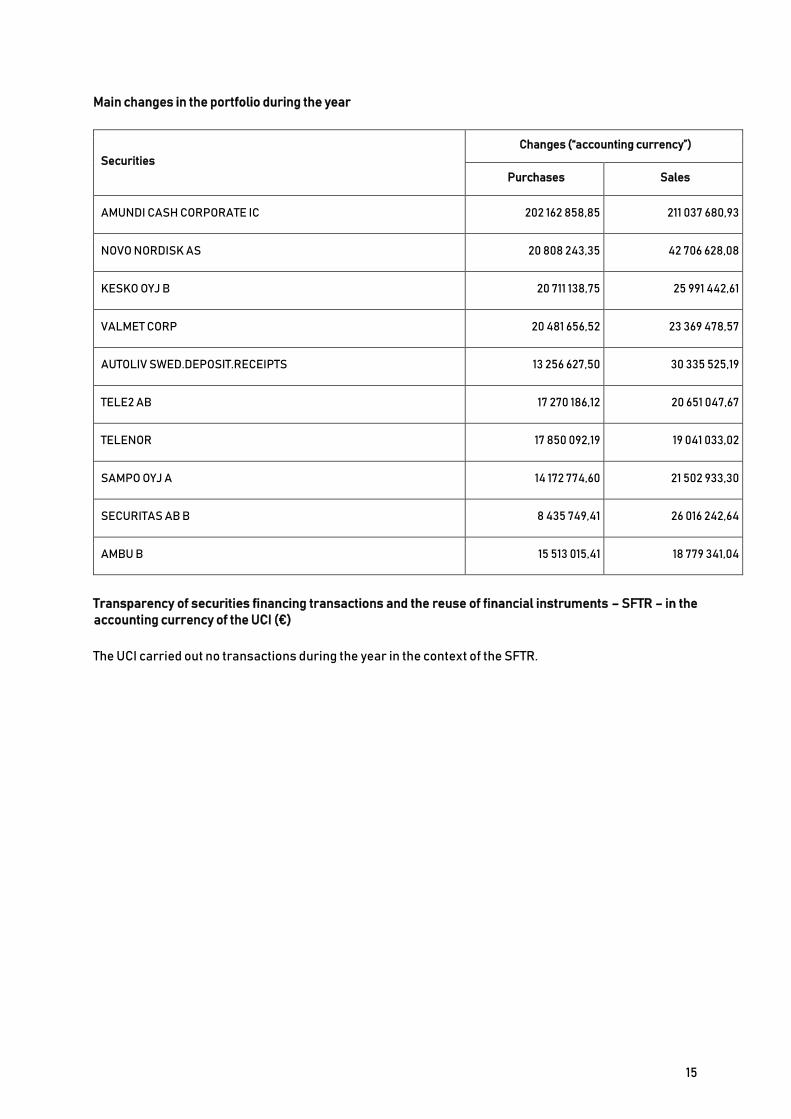
Main changes in the portfolio during the year
Securities Changes (“accounting currency”)
Purchases Sales
AMUNDI CASH CORPORATE IC 202 162 858,85 211 037 680,93
NOVO NORDISK AS 20 808 243,35 42 706 628,08
KESKO OYJ B 20 711 138,75 25 991 442,61
VALMET CORP 20 481 656,52 23 369 478,57
AUTOLIV SWED.DEPOSIT.RECEIPTS 13 256 627,50 30 335 525,19
TELE2 AB 17 270 186,12 20 651 047,67
TELENOR 17 850 092,19 19 041 033,02
SAMPO OYJ A 14 172 774,60 21 502 933,30
SECURITAS AB B 8 435 749,41 26 016 242,64
AMBU B 15 513 015,41 18 779 341,04
Transparency of securities financing transactions and the reuse of financial instruments – SFTR – in the accounting currency of the UCI (€)
The UCI carried out no transactions during the year in the context of the SFTR.
16
ESMA
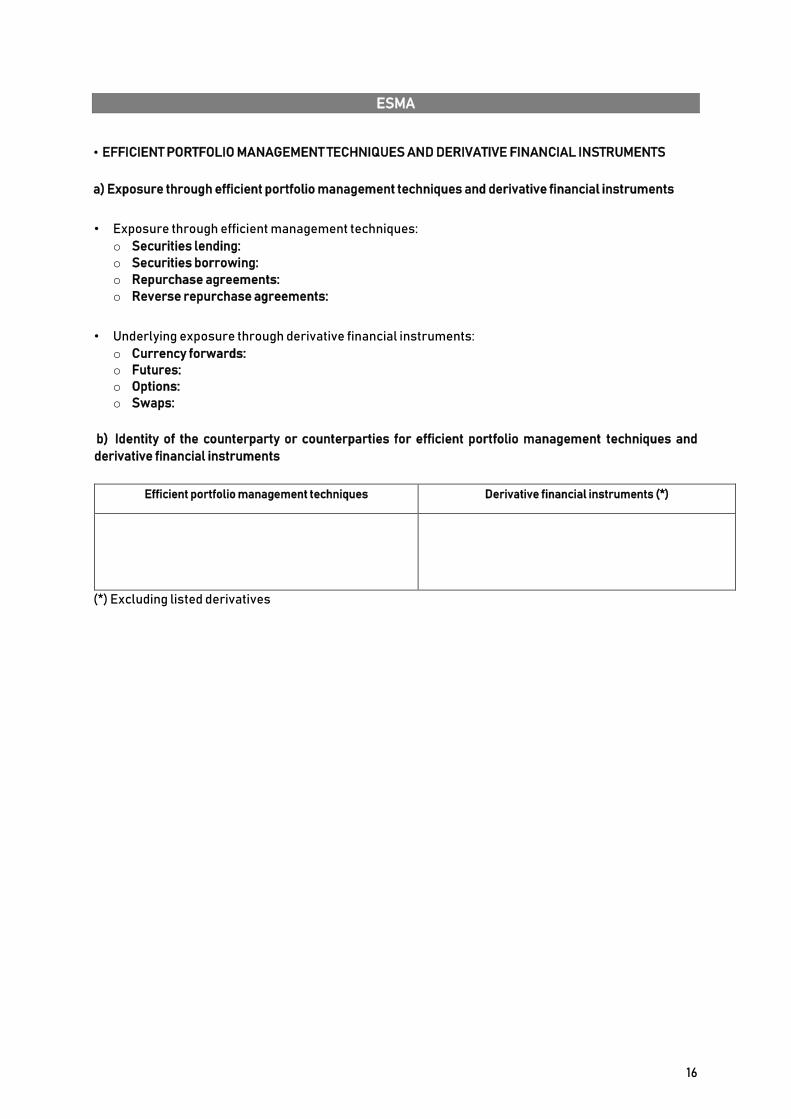
• EFFICIENT PORTFOLIO MANAGEMENT TECHNIQUES AND DERIVATIVE FINANCIAL INSTRUMENTS
a) Exposure through efficient portfolio management techniques and derivative financial instruments
• Exposure through efficient management techniques: o Securities lending: o Securities borrowing: o Repurchase agreements: o Reverse repurchase agreements:
• Underlying exposure through derivative financial instruments: o Currency forwards: o Futures: o Options: o Swaps:
b) Identity of the counterparty or counterparties for efficient portfolio management techniques and
derivative financial instruments
Efficient portfolio management techniques Derivative financial instruments (*)
(*) Excluding listed derivatives
17
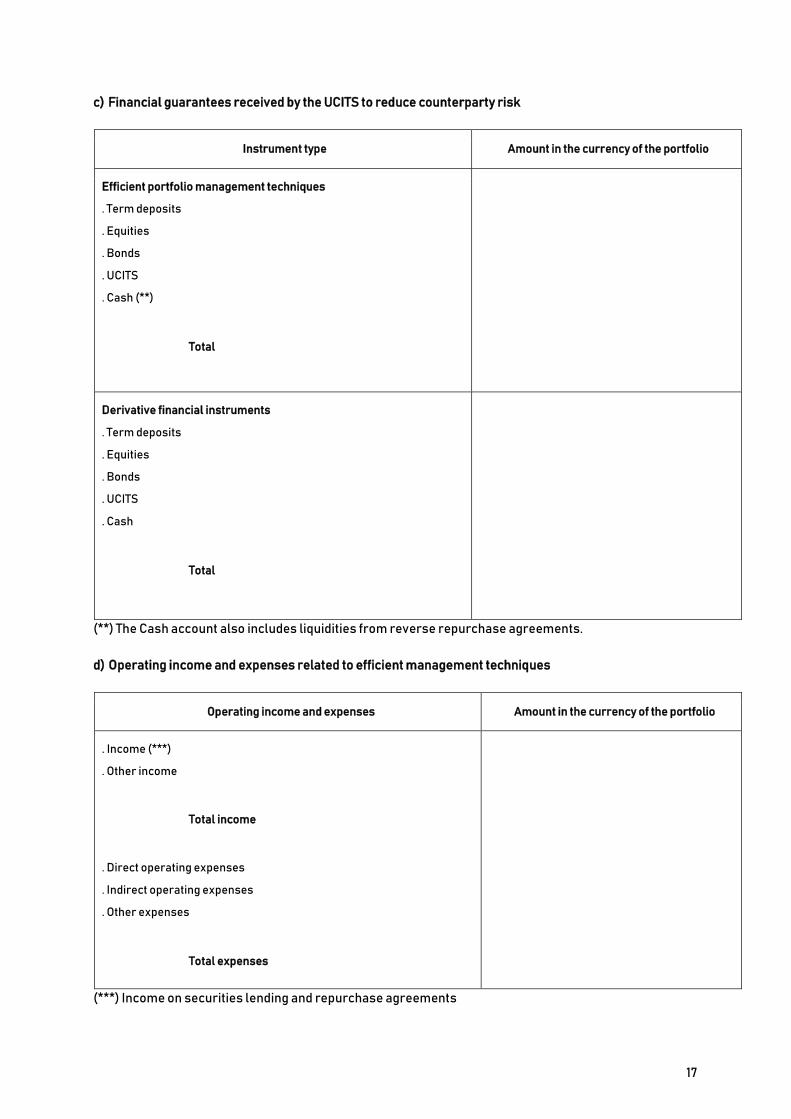
c) Financial guarantees received by the UCITS to reduce counterparty risk
Instrument type Amount in the currency of the portfolio
Efficient portfolio management techniques
. Term deposits
. Equities
. Bonds
. UCITS
. Cash (**)
Total
Derivative financial instruments
. Term deposits
. Equities
. Bonds
. UCITS
. Cash
Total
(**) The Cash account also includes liquidities from reverse repurchase agreements.
d) Operating income and expenses related to efficient management techniques
Operating income and expenses Amount in the currency of the portfolio
. Income (***)
. Other income
Total income
. Direct operating expenses
. Indirect operating expenses
. Other expenses
Total expenses
(***) Income on securities lending and repurchase agreements
18
4. REGULATORY INFORMATION
• PROCEDURE FOR SELECTING AND ASSESSING INTERMEDIARIES AND COUNTERPARTIES The brokers used by the management company are selected on the basis of various evaluation criteria, covering research, quality of order execution and processing and the range of services offered. The management company’s “Broker Committee” validates any updates to the list of authorised brokers. Each
investment division (fixed income and equities) reports to the Broker Committee at least twice a year on the evaluation of the services provided by the various brokers and the breakdown of the volume of transactions handled. The information can be consulted on the management company's website:
www.lazardfreresgestion.fr.
• BROKERAGE FEES Information about brokerage fees is available on the website: www.lazardfreresgestion.fr.
• EXERCISING VOTING RIGHTS The scope and procedures for Lazard Frères Gestion SAS’ exercise of the voting rights attached to the
securities held in the UCIs managed by it are set out in the guidelines it has drawn up on its voting policy. This document can be consulted on the management company's website: www.lazardfreresgestion.fr.
• COMMUNICATION OF ENVIRONMENTAL, SOCIAL AND GOVERNANCE CRITERIA General procedure for incorporating ESG criteria
Lazard Frères Gestion firmly believes that the integration of environmental, social and governance (ESG)
criteria by issuers is vital to their sustained economic performance.
In fact, the long-term performance of investments is not limited solely to adherence to the financial
strategy, but must also take the company's interactions with its social, economic and financial environment into account.
The incorporation of ESG criteria therefore is a natural component of our investment process.
Our overall approach can be summarised as follows:
Rigorous financial analysis of the company covering the quality of assets, financial soundness,
projected cash flows and their reinvestment by the company, the strength of economic profits, profit durability, and quality of management.
This durability is strengthened by incorporating extra-financial criteria: - Social criteria: through the development of human capital. - Environmental criteria: through the prevention of all environmental risks. - Governance criteria: by respecting the balance between the managerial and shareholder
structures so as to prevent potential conflicts of interest and safeguard the interests of minority shareholders.
ESG criteria incorporated by the NORDEN SICAV
Analysis of governance The quality of governance has always been a decisive element in our investment policy. Satisfactory governance guarantees transparency and a balance of power, with a right to input by the
shareholders. Lazard Frères Gestion believes that best practices in terms of corporate governance are a risk control factor that favour the creation of value and contribute to a broad alignment of the interests of all
stakeholders.
19
Social criteria Social criteria include the prevention of accidents, staff training, respect for employee rights, human
rights, ethics in the supply chain, and social dialogue. Human capital is one of the two drivers of a company alongside financial capital, which if neglected could give rise to risks around the loss of operational profitability or an increase in costs linked to payroll volatility.
Environmental criteria Environmental criteria take into account the direct or indirect impact of the company's activity on the environment (waste management, energy consumption and emission of pollutants) and are assessed by
looking at the relevant activity sector. We seek to understand how the company appraises environmental risks and any negligence on its part could potentially lead to liabilities that impact its economic profitability. If environmental risks (pollution, biodiversity, resources and local communities) are not adequately appraised, this can lead to a loss of profitability, reputational risk and financial risk.
Information used to analyse ESG criteria
Lazard Frères Gestion draws on several sources of information when assessing ESG criteria for each company:
Public sources: CSR reports, NGOs, press Direct communication with the companies External research: Extra-financial ratings agencies, brokers
Each analyst/director may include data deemed relevant in their extra-financial analysis. These analyses are an integral part of our management process.
Our proprietary analysis tools show financial and extra-financial data for each company under consideration.
Data is entered directly in these tools by the analysts/directors.
ESG analysis methodology and results
ESG analysis methods
We attach particular importance to developing proprietary models built on our expertise with a constant concern to provide tangible added value in the selection of securities in the portfolio.
At the end of 2019, Lazard Frères Gestion therefore wanted to implement a proprietary ESG analysis and rating model that complies with this principle.
Based on the various data provided by our ESG partners (Vigeo Eiris, Ethix, Trucost, Carbon Delta), Bloomberg, the CSR reports of each company, the Vigeo controversy monitoring tool and the comments
of our analysts-managers, the analysts responsible for each security draw up an internal ESG rating based on a quantitative and qualitative approach: for each E, S and G pillar, around fifteen key indicators are monitored and then aggregated in a summary rating (from 1 for the least good issuers to 5 for the best).
Climatic risk criteria are analysed by factoring energy costs, regulatory risks and potential technological
shocks into the investment assumptions of the analysts/managers, regardless of whether this data is linked to climate change.
20
Lazard Frères Gestion assesses the financial impact by looking at changes in energy prices (electricity,
oil, gas, etc.), as well as other external factors, when determining the company's level of activity or margins.
How ESG criteria are taken into account in the investment decision-making process
The use of ESG analysis has an impact on investment decisions.
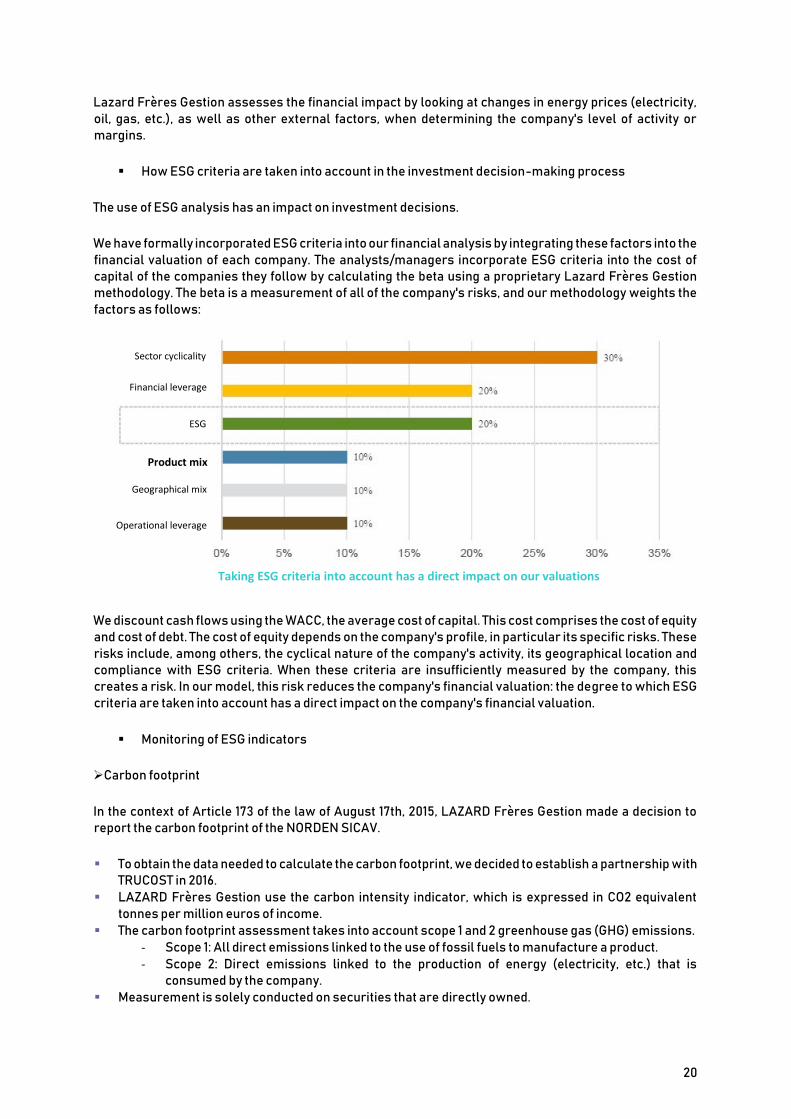
We have formally incorporated ESG criteria into our financial analysis by integrating these factors into the
financial valuation of each company. The analysts/managers incorporate ESG criteria into the cost of capital of the companies they follow by calculating the beta using a proprietary Lazard Frères Gestion methodology. The beta is a measurement of all of the company's risks, and our methodology weights the
factors as follows:
We discount cash flows using the WACC, the average cost of capital. This cost comprises the cost of equity and cost of debt. The cost of equity depends on the company's profile, in particular its specific risks. These
risks include, among others, the cyclical nature of the company's activity, its geographical location and compliance with ESG criteria. When these criteria are insufficiently measured by the company, this creates a risk. In our model, this risk reduces the company's financial valuation: the degree to which ESG
criteria are taken into account has a direct impact on the company's financial valuation.
Monitoring of ESG indicators
Carbon footprint
In the context of Article 173 of the law of August 17th, 2015, LAZARD Frères Gestion made a decision to report the carbon footprint of the NORDEN SICAV.
To obtain the data needed to calculate the carbon footprint, we decided to establish a partnership with TRUCOST in 2016.
LAZARD Frères Gestion use the carbon intensity indicator, which is expressed in CO2 equivalent
tonnes per million euros of income. The carbon footprint assessment takes into account scope 1 and 2 greenhouse gas (GHG) emissions.
- Scope 1: All direct emissions linked to the use of fossil fuels to manufacture a product. - Scope 2: Direct emissions linked to the production of energy (electricity, etc.) that is
consumed by the company. Measurement is solely conducted on securities that are directly owned.
Sector cyclicality
Financial leverage
ESG
Product mix
Geographical mix
Operational leverage
Taking ESG criteria into account has a direct impact on our valuations
21
Listed companies on which we have no carbon data are weighted proportionally based on the weight
of other companies in the same sector, in order to maintain the initial sector weightings. The weight of each stock in the portfolio is re-based to obtain a total weighting equal to 100%. The method used to calculate the portfolio’s carbon intensity is the weighted average GHG emissions
divided by the income of each position. We thus get the following formula:
Carbon intensity of the portfolio
= ∑ [( Emissions (scope 1+2)
) of each security x weight of each security ] Income
A company's CO2 emission levels are highly dependent on its area of activity. Some sectors are
structurally higher “emitters” than others. Lazard Frères Gestion’s fundamental stock picking approach entails sector exposure gaps between
the funds and their benchmark indices. To make up for these sector biases, we defined a method that involves neutralising these gaps by re-
weighing the sectors of the benchmark index so that they correspond to those of the portfolio. The
weight of each stock is maintained within each sector of the benchmark index.
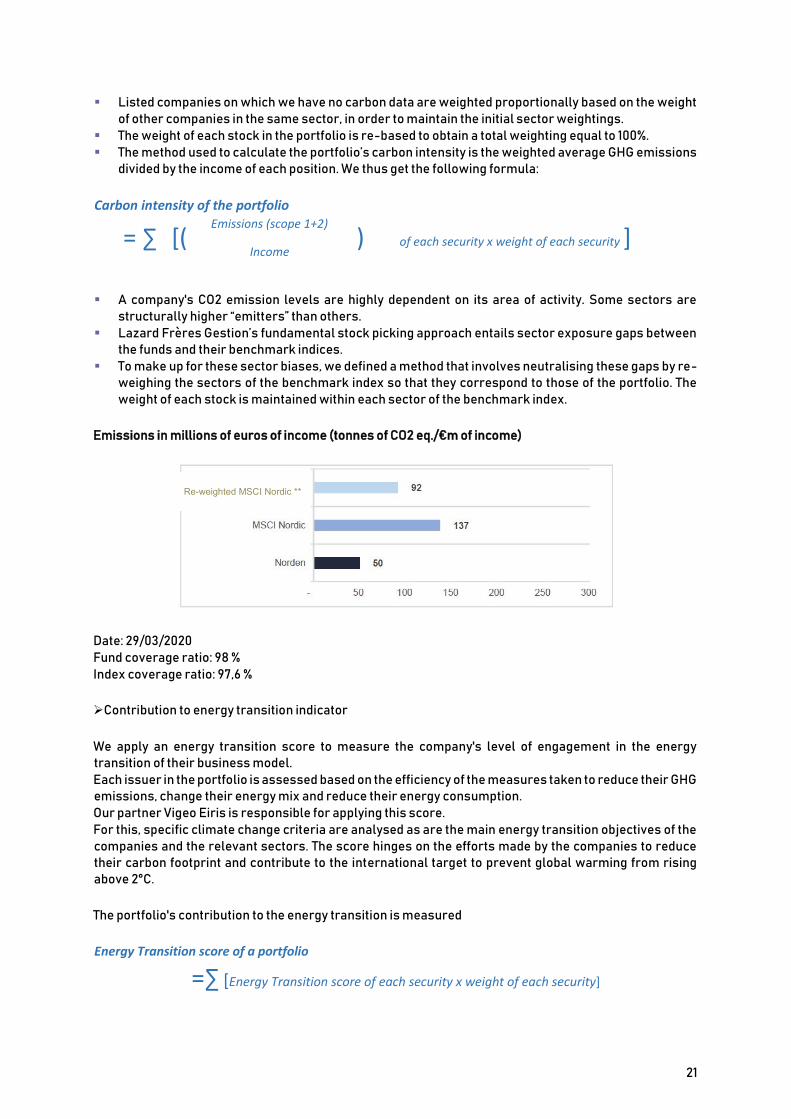
Emissions in millions of euros of income (tonnes of CO2 eq./€m of income)
Date: 29/03/2020 Fund coverage ratio: 98 % Index coverage ratio: 97,6 %
Contribution to energy transition indicator
We apply an energy transition score to measure the company's level of engagement in the energy transition of their business model. Each issuer in the portfolio is assessed based on the efficiency of the measures taken to reduce their GHG emissions, change their energy mix and reduce their energy consumption. Our partner Vigeo Eiris is responsible for applying this score. For this, specific climate change criteria are analysed as are the main energy transition objectives of the
companies and the relevant sectors. The score hinges on the efforts made by the companies to reduce their carbon footprint and contribute to the international target to prevent global warming from rising above 2°C.
The portfolio's contribution to the energy transition is measured
Energy Transition score of a portfolio
=∑ [Energy Transition score of each security x weight of each security]
Re-weighted MSCI Nordic **
22
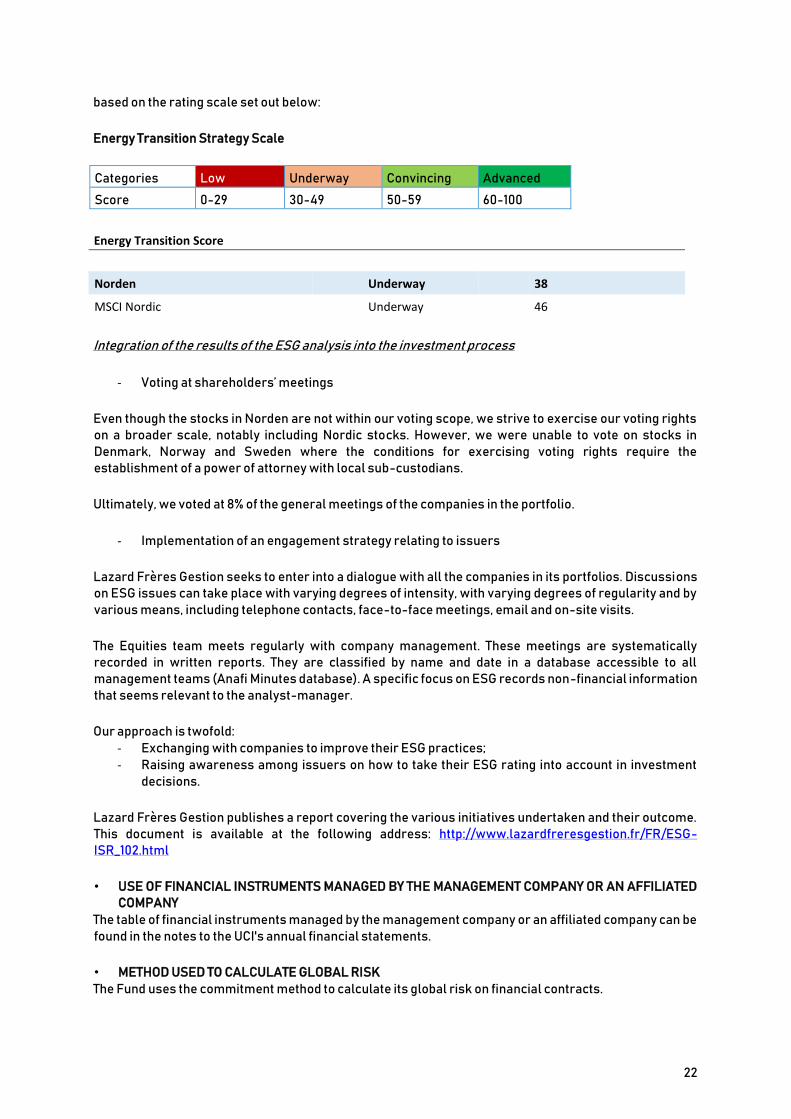
based on the rating scale set out below:
Energy Transition Strategy Scale
Categories Low Underway Convincing Advanced
Score 0-29 30-49 50-59 60-100
Energy Transition Score
Norden Underway 38
MSCI Nordic Underway 46
Integration of the results of the ESG analysis into the investment process
- Voting at shareholders’ meetings
Even though the stocks in Norden are not within our voting scope, we strive to exercise our voting rights on a broader scale, notably including Nordic stocks. However, we were unable to vote on stocks in
Denmark, Norway and Sweden where the conditions for exercising voting rights require the establishment of a power of attorney with local sub-custodians.
Ultimately, we voted at 8% of the general meetings of the companies in the portfolio.
- Implementation of an engagement strategy relating to issuers
Lazard Frères Gestion seeks to enter into a dialogue with all the companies in its portfolios. Discussions on ESG issues can take place with varying degrees of intensity, with varying degrees of regularity and by
various means, including telephone contacts, face-to-face meetings, email and on-site visits.
The Equities team meets regularly with company management. These meetings are systematically recorded in written reports. They are classified by name and date in a database accessible to all management teams (Anafi Minutes database). A specific focus on ESG records non-financial information
that seems relevant to the analyst-manager.
Our approach is twofold: - Exchanging with companies to improve their ESG practices; - Raising awareness among issuers on how to take their ESG rating into account in investment
decisions.
Lazard Frères Gestion publishes a report covering the various initiatives undertaken and their outcome. This document is available at the following address: http://www.lazardfreresgestion.fr/FR/ESG-ISR_102.html
• USE OF FINANCIAL INSTRUMENTS MANAGED BY THE MANAGEMENT COMPANY OR AN AFFILIATED COMPANY
The table of financial instruments managed by the management company or an affiliated company can be
found in the notes to the UCI's annual financial statements.
• METHOD USED TO CALCULATE GLOBAL RISK The Fund uses the commitment method to calculate its global risk on financial contracts.
23
• PEA employee savings fund Pursuant to the provisions of Article 91, quater L Appendix 2 of the French General Tax Code, a minimum
of 75% of the SICAV is permanently invested in the securities and rights mentioned in points a, b and c, section 1°, I of Article L. 221-31 of the French Monetary and Financial Code. Proportion actually invested during the financial year: 94,23%.
• TAX CLAWBACKS European Union countries may apply different taxation methods for dividends paid by companies to domestic entities and foreign entities. Foreign entities that receive dividends are frequently subject to
withholding tax, causing a difference in tax treatment that is in breach of the free circulation of capital, and therefore contrary to European Union law. Since there are several decisions by the Court of Justice of the European Union and the Council of State in favour of foreign residents, the management company intends
to request refund of withholding tax paid on dividends received by foreign companies for funds domiciled in France, when the prospects for refund of the withholding tax are deemed favourable to the funds in question. As these are complaints procedures with the relevant tax authorities, the time involved and the
final outcome of these procedures are uncertain. As at 31/03/2020, the amount of withholding tax recovered was €1 191 257,65.
• REMUNERATION The fixed and variable remuneration paid during the financial year ended on December 31st, 2019 by the management company to its personnel, pro rata their investment in the management of the AIFs,
excluding the management of the UCITS and discretionary mandates, can be obtained on request by post from the UCI legal department of Lazard Frères Gestion, and are indicated in the company's annual report. The total variable remuneration is set by the Lazard Group based on different criteria, including
the Lazard Group's financial performance over the past year, taking its earnings into account. The executive management decides on the total remuneration amount that will be split between the fixed and variable components, complying with the policy to maintain a complete separation between the
fixed and variable components. All risks are incorporated into the calculation of the variable remuneration. It is then individualised and determined partly based on the performance of each identified member of staff.
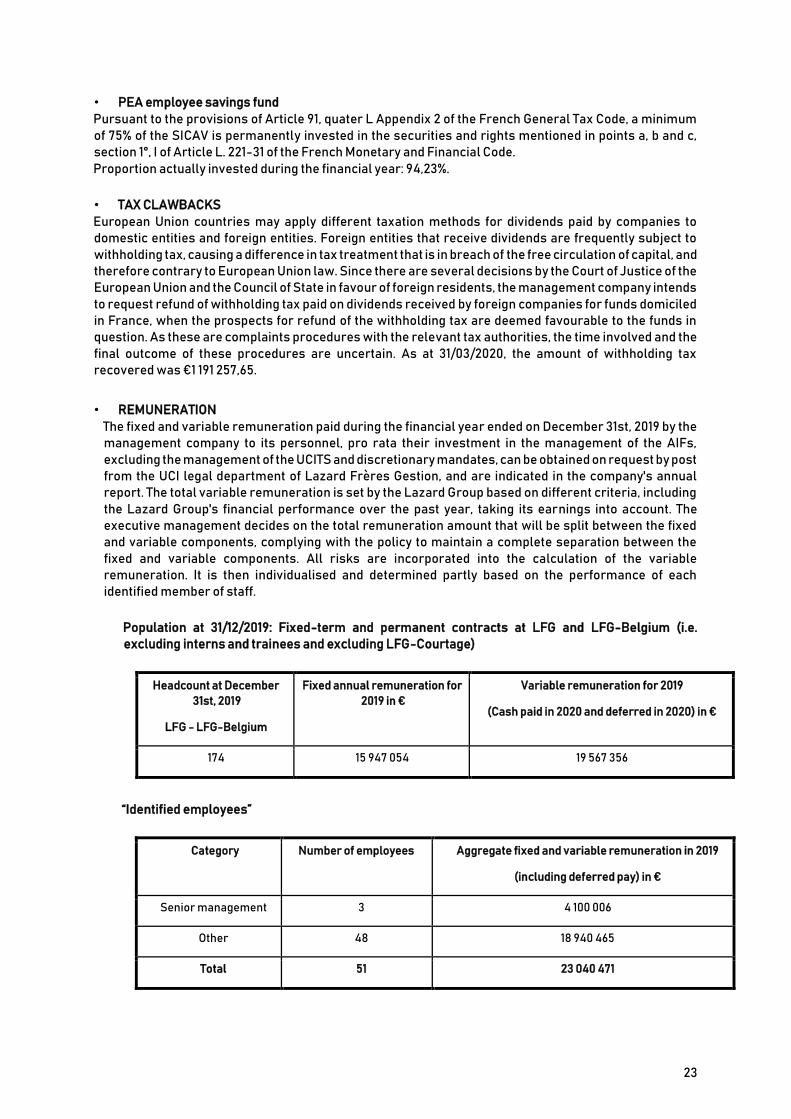
Population at 31/12/2019: Fixed-term and permanent contracts at LFG and LFG-Belgium (i.e. excluding interns and trainees and excluding LFG-Courtage)
Headcount at December
31st, 2019
LFG - LFG-Belgium
Fixed annual remuneration for
2019 in € Variable remuneration for 2019
(Cash paid in 2020 and deferred in 2020) in €
174 15 947 054 19 567 356
“Identified employees”
Category Number of employees Aggregate fixed and variable remuneration in 2019
(including deferred pay) in €
Senior management 3 4 100 006
Other 48 18 940 465
Total 51 23 040 471

24
Note: the amounts are unloaded
• OTHER INFORMATION The UCI's complete prospectus and the most recent annual and interim reports will be sent out within one
week of request in writing by unitholders to:
Lazard Frères Gestion SAS 25, Rue de Courcelles – 75008 Paris, France
www.lazardfreresgestion.fr.

25
5. CERTIFICATION BY THE STATUTORY AUDITOR

PricewaterhouseCoopers Audit, 63, rue de Villiers, 92208 Neuilly-sur-Seine Cedex T: +33 (0) 1 56 57 58 59, F: +33 (0) 1 56 57 58 60, www.pwc.fr Accounting firm registered with the Order of Chartered Accountants of the Paris Ile-de-France region. Member firm of the regional institute of statutory
auditors of Versailles (Compagnie régionale de Versailles). French simplified joint stock company (Société par Actions Simplifiée) with capital of €2
510 460. Registered office: 63, Rue de Villiers 92200 Neuilly-sur-Seine, France. Nanterre Trade and Companies Register: 672 006 483 VAT No. FR
76 672 006 483. Siret 672 006 483 00362. APE code 6920 Z. Offices: Bordeaux, Grenoble, Lille, Lyon, Marseilles, Metz, Nantes, Nice, Paris, Poitiers,
Rennes, Rouen, Strasbourg, Toulouse.
STATUTORY AUDITOR'S REPORT ON THE ANNUAL FINANCIAL STATEMENTS Financial year ended March 31st, 2020 NORDEN
UCITS ORGANISED AS A FRENCH OPEN-END INVESTMENT COMPANY (SOCIÉTÉ D'INVESTISSEMENT À CAPITAL VARIABLE) Governed by the French Monetary and Financial Code (Code monétaire et financier) Management company
Lazard Frères Gestion SAS 25, Rue de Courcelles 75008 Paris, France To the shareholders, Opinion
In accordance with the terms of our appointment by the general meeting, we conducted our audit of the accompanying annual financial statements of the NORDEN UCITS, as a French open-end investment fund, for the financial year ended March 31st, 2020. These financial statements have been approved by management on the basis of the information available in the evolving context of the COVID-19 crisis. We certify that the annual financial statements give a true and fair view of the results of the operations for the financial year under review and of the financial position and assets and liabilities of the UCITS at the end of said financial year, in accordance with the accounting rules and principles generally accepted in France. Basis of our opinion
Audit standards
We conducted our audit in accordance with the professional standards applicable in France. We believe that our audit has provided us with sufficient relevant information on which to base our opinion. Our responsibilities under these standards are set out in the section entitled "Statutory auditor's responsibilities concerning the audit of the financial statements" in this report. Independence
We conducted our audit in accordance with the rules of independence applicable to us on the period from April 2nd, 2019 to the date of issue of our report, and in particular we have not provided any services prohibited by the French code of ethics for statutory auditors.

NORDEN
PricewaterhouseCoopers Audit, 63, rue de Villiers, 92208 Neuilly-sur-Seine Cedex T: +33 (0) 1 56 57 58 59, F: +33 (0) 1 56 57 58 60, www.pwc.fr Accounting firm registered with the Order of Chartered Accountants of the Paris Ile-de-France region. Member firm of the regional institute of statutory
auditors of Versailles (Compagnie régionale de Versailles). French simplified joint stock company (Société par Actions Simplifiée) with capital of €2
510 460. Registered office: 63, Rue de Villiers 92200 Neuilly-sur-Seine, France. Nanterre Trade and Companies Register: 672 006 483 VAT No. FR
76 672 006 483. Siret 672 006 483 00362. APE code 6920 Z. Offices: Bordeaux, Grenoble, Lille, Lyon, Marseilles, Metz, Nantes, Nice, Paris, Poitiers,
Rennes, Rouen, Strasbourg, Toulouse.
Basis of our opinions
In accordance with the provisions of Articles L. 823-9 and R. 823-7 of the French Commercial Code relating to the justification of our assessments, we inform you that the most important assessments we carried out, in our professional judgement, focused on the appropriateness of the accounting principles applied, the reasonableness of significant estimates used, and the presentation of all of the financial statements. The assessments we have made are part of our audit of the annual financial statements as a whole, prepared under the conditions described above, and the opinion expressed above. We express no opinion on the elements of the annual financial statements taken in isolation. Specific verifications
We have also performed, in accordance with applicable professional standards in France, the specific verifications required by the laws and regulations. Information provided in the management report, other financial reports and the annual financial statements addressed to the shareholders
We have no matters to report regarding the true and fair presentation of the information provided in the management report and in the other documents sent to shareholders on the company’s financial position and annual financial statements. Corporate governance report
We certify that the information required under Article L.225-37-4 of the French Commercial Code is provided in the report on corporate governance.

NORDEN
PricewaterhouseCoopers Audit, 63, rue de Villiers, 92208 Neuilly-sur-Seine Cedex T: +33 (0) 1 56 57 58 59, F: +33 (0) 1 56 57 58 60, www.pwc.fr Accounting firm registered with the Order of Chartered Accountants of the Paris Ile-de-France region. Member firm of the regional institute of statutory
auditors of Versailles (Compagnie régionale de Versailles). French simplified joint stock company (Société par Actions Simplifiée) with capital of €2
510 460. Registered office: 63, Rue de Villiers 92200 Neuilly-sur-Seine, France. Nanterre Trade and Companies Register: 672 006 483 VAT No. FR
76 672 006 483. Siret 672 006 483 00362. APE code 6920 Z. Offices: Bordeaux, Grenoble, Lille, Lyon, Marseilles, Metz, Nantes, Nice, Paris, Poitiers,
Rennes, Rouen, Strasbourg, Toulouse.
Responsibilities of the management and persons charged with governance for the annual financial statements
It is the management company's role to draw up annual financial statements that give a fair and true picture in accordance with French accounting rules and principles and to implement the necessary internal control to be able to provide reasonable assurance that they are free from material misstatement, whether due to fraud or error. As part of the preparation of the annual financial statements, the management is responsible for assessing the UCI's capacity to continue operating as a going concern, to present in its financial statements, where necessary, information concerning business continuity, and to apply the accounting conventions of a going concern, unless it is planned to liquidate the UCI or terminate its activity. The annual financial statements have been approved by the management. Statutory auditor's responsibilities concerning the audit of the annual financial statements
Audit purpose and process
Our role is to prepare a report on the annual financial statements and to obtain reasonable assurance that the annual financial statements as a whole are free of material misstatements. Reasonable assurance means a high but not absolute level of assurance that an audit performed in accordance with professional standards is free of material misstatement. Anomalies may stem from fraud or errors and are considered material when it can reasonably be expected that, taken individually or together, they could influence the economic decisions of users of the financial statements. As stipulated in Article L.823-10-1 of the French Commercial Code, our audit assignment does not consist in guaranteeing the viability or quality of the management of the UCI. In the context of an audit performed in accordance with professional standards applicable in France, the statutory auditor must exercise its judgement throughout the course of the audit. Moreover: • it identifies and assess the risks that the annual financial statements may contain material misstatements, whether from fraud or error, defines and implements audit procedures to resolve these risks, and collects all elements deemed necessary and appropriate in order to give its opinion. The risk of failure to detect a material misstatement resulting from fraud is higher than that resulting from an error because fraud may involve collusion, falsification, deliberate omissions, false statements or by-passing of internal controls;
• it takes due note of the internal control relevant to the audit in order to define audit procedures that are appropriate to the circumstances, and not with a view to expressing an opinion on the efficiency of the internal control;
• it assesses the appropriateness of the accounting methods used and the reasonable nature of the accounting estimates made by the management, and the related information provided in the annual financial statements;
• it assesses the appropriateness of management's application of the accounting policy for a going concern and, based on the information collected, whether there is a significant uncertainty linked to events or circumstances that is likely to call into question the UCI's capacity to continue operating as a going concern. This assessment is based on the information collected up to the date of the report, bearing in mind nevertheless that subsequent circumstances or events could jeopardise the continuity of operation. If the statutory auditor observes the existence of a material uncertainty, it shall draw the attention of the readers of its report to the information provided in the annual financial statements on the subject of this uncertainty, or if this information has not been provided or is not relevant, it shall attach reservations to its certification or shall refuse to certify the accounts;
• it assesses the overall presentation of the annual financial statements and whether they provide a true picture of the underlying operations and events.
Given the time required to obtain certain additional information needed to complete our work, this report is issued on the date of its electronic signature.
Neuilly-sur-Seine, date of electronic signature
Document authenticated by electronic signature
The statutory auditor
PricewaterhouseCoopers Audit Frédéric Sellam
NORDEN STATUTORY AUDITOR'S SPECIAL REPORT ON REGULATED AGREEMENTS Shareholders' meeting to approve the financial statements for the financial year ended March 31st, 2020

STATUTORY AUDITOR'S SPECIAL REPORT ON REGULATED AGREEMENTS Shareholders' meeting to approve the financial statements for the financial year ended March 31st, 2020 NORDEN UCITS ORGANISED AS A FRENCH OPEN-END INVESTMENT COMPANY (SOCIÉTÉ D'INVESTISSEMENT À CAPITAL VARIABLE) Governed by the French Monetary and Financial Code (Code monétaire et financier) Management company LAZARD FRERES BANQUE 25, Rue de Courcelles 75008 Paris, France To the Shareholders, In our capacity as statutory auditors of your company, we hereby present to you our report on related party agreements. We are required to report to you, based on the information with which we have been provided, on the main characteristics and terms, as well as details of the related benefits for the SICAV, of any agreements disclosed to us or that we may have identified during our audit, without being required to comment on their relevance or substance, or to identify any other agreements. It is your responsibility, pursuant to the terms of Article R.225-31 of the French Commercial Code (Code de commerce), to assess the benefits of entering into these agreements, prior to approving them. We are also required, where applicable, to report to you as provided for in Article R.225-31 of the French Commercial Code on the performance over the past year of any agreements already approved by the shareholders' meeting. We have performed those checks that we considered necessary in accordance with the professional guidance issued by the national auditing body (Compagnie nationale des commissaires aux comptes) relating to this operation.
AGREEMENTS SUBMITTED FOR THE APPROVAL OF THE SHAREHOLDERS'
MEETING
We hereby inform you that we have not been advised of any agreement authorised during the past financial year to be submitted to the approval of the shareholders' meeting pursuant to Article L.225-38 of the French Commercial Code.
AGREEMENTS ALREADY APPROVED BY THE SHAREHOLDERS' MEETING
We hereby inform you that we have not been advised of any agreement already approved by the shareholders' meeting that remained effective during the past financial year. Neuilly-sur-Seine, date of electronic signature
Document authenticated by electronic signature The statutory auditor
PricewaterhouseCoopers Audit Frédéric Sellam
PricewaterhouseCoopers Audit, 63, Rue de Villiers, 92208 Neuilly-sur-Seine Cedex, France T: +33 (0) 1 56 57 58 59, F: +33 (0) 1 56 57 58 60, www.pwc.fr Accounting firm registered with the Order of Chartered Accountants of the Paris Ile-de-France region. Member firm of the regional institute of statutory auditors of Versailles
(Compagnie régionale de Versailles). French simplified joint stock company (Société par Actions Simplifiée) with capital of €2 510 460. Registered office: 63, Rue de Villiers
92200 Neuilly-sur-Seine, France. Nanterre Trade and Companies Register: 672 006 483 VAT No. FR 76 672 006 483. Siret 672 006 483 00362. APE code 6920 Z. Offices:
Bordeaux, Grenoble, Lille, Lyon, Marseille, Metz, Nantes, Nice, Paris, Poitiers, Rennes, Rouen, Strasbourg, Toulouse.
32 32
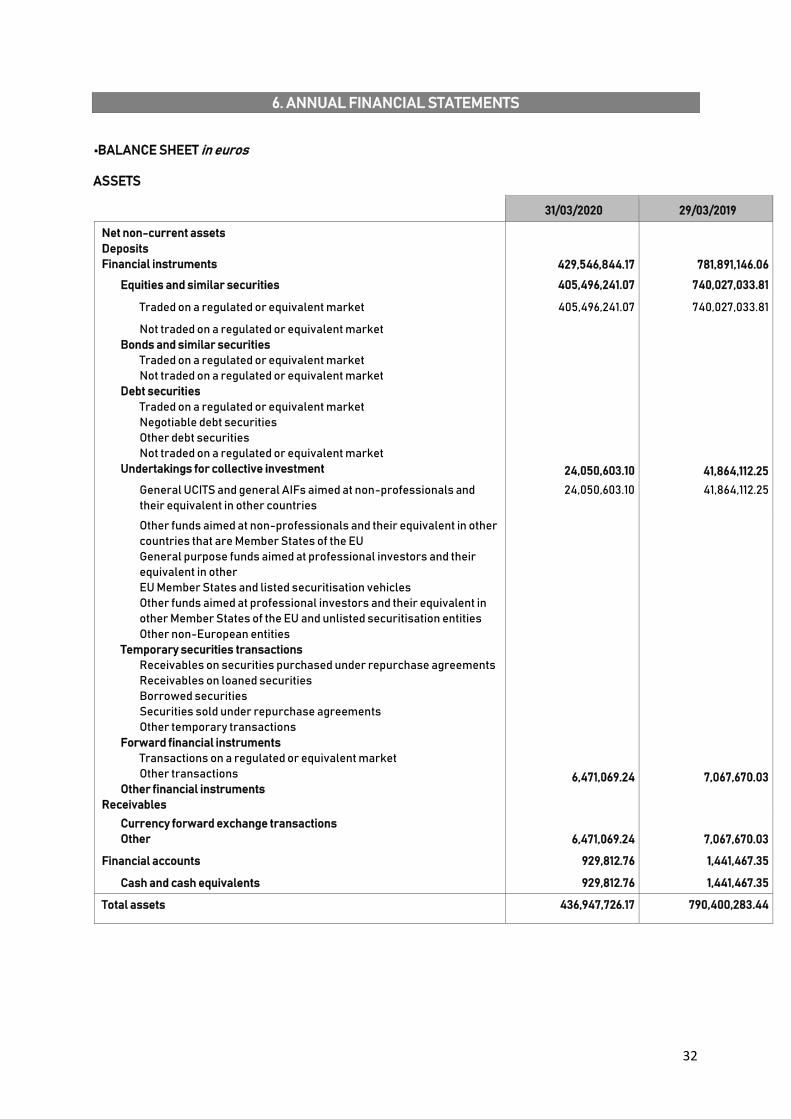
6. ANNUAL FINANCIAL STATEMENTS
•BALANCE SHEET in euros
ASSETS
31/03/2020 29/03/2019
Net non-current assets
Deposits
Financial instruments
429,546,844.17
781,891,146.06
Equities and similar securities 405,496,241.07 740,027,033.81
Traded on a regulated or equivalent market 405,496,241.07 740,027,033.81
Not traded on a regulated or equivalent market
Bonds and similar securities
Traded on a regulated or equivalent market
Not traded on a regulated or equivalent market
Debt securities
Traded on a regulated or equivalent market
Negotiable debt securities
Other debt securities
Not traded on a regulated or equivalent market
Undertakings for collective investment
24,050,603.10
41,864,112.25
General UCITS and general AIFs aimed at non-professionals and
their equivalent in other countries
24,050,603.10 41,864,112.25
Other funds aimed at non-professionals and their equivalent in other
countries that are Member States of the EU
General purpose funds aimed at professional investors and their
equivalent in other
EU Member States and listed securitisation vehicles
Other funds aimed at professional investors and their equivalent in
other Member States of the EU and unlisted securitisation entities
Other non-European entities
Temporary securities transactions
Receivables on securities purchased under repurchase agreements
Receivables on loaned securities
Borrowed securities
Securities sold under repurchase agreements
Other temporary transactions
Forward financial instruments
Transactions on a regulated or equivalent market
Other transactions
Other financial instruments
Receivables
6,471,069.24
7,067,670.03
Currency forward exchange transactions
Other
6,471,069.24
7,067,670.03
Financial accounts 929,812.76 1,441,467.35
Cash and cash equivalents 929,812.76 1,441,467.35
Total assets 436,947,726.17 790,400,283.44
33 33
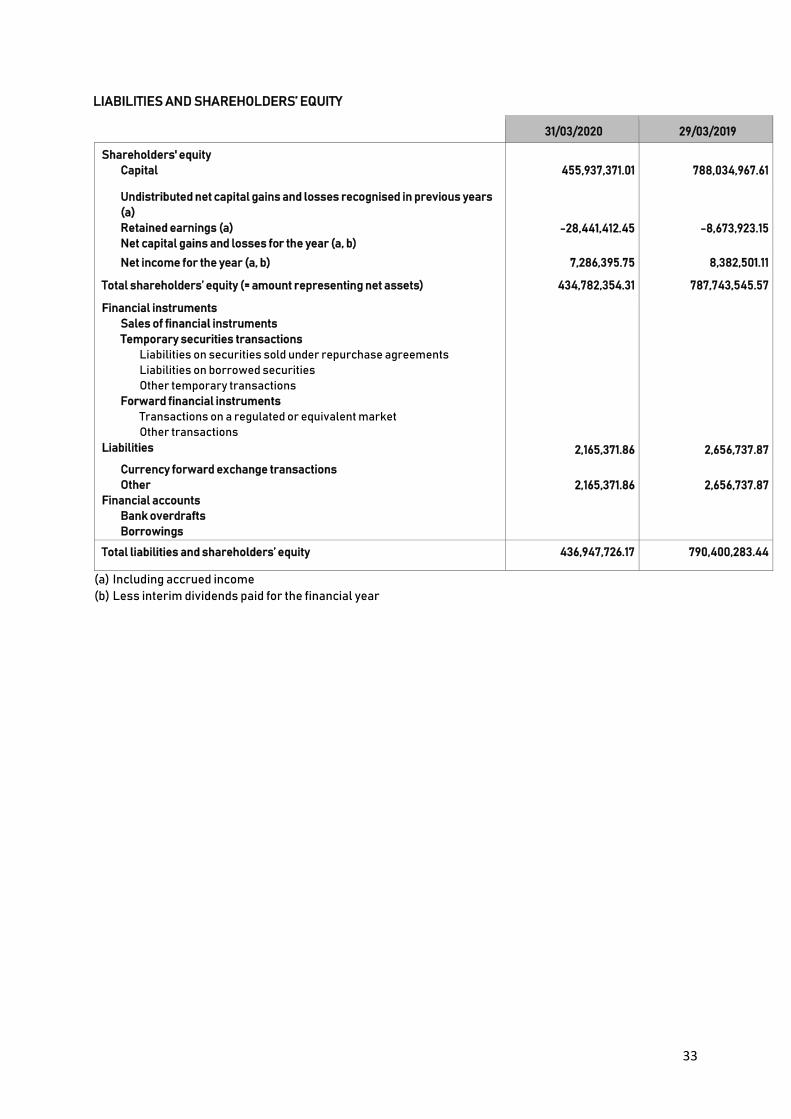
LIABILITIES AND SHAREHOLDERS’ EQUITY
31/03/2020 29/03/2019
Shareholders' equity
Capital
455,937,371.01
788,034,967.61
Undistributed net capital gains and losses recognised in previous years
(a)
Retained earnings (a)
Net capital gains and losses for the year (a, b)
-28,441,412.45
-8,673,923.15
Net income for the year (a, b) 7,286,395.75 8,382,501.11
Total shareholders’ equity (= amount representing net assets) 434,782,354.31 787,743,545.57
Financial instruments
Sales of financial instruments
Temporary securities transactions
Liabilities on securities sold under repurchase agreements
Liabilities on borrowed securities
Other temporary transactions
Forward financial instruments
Transactions on a regulated or equivalent market
Other transactions
Liabilities
2,165,371.86
2,656,737.87
Currency forward exchange transactions
Other
Financial accounts
Bank overdrafts
Borrowings
2,165,371.86
2,656,737.87
Total liabilities and shareholders’ equity 436,947,726.17 790,400,283.44
(a) Including accrued income (b) Less interim dividends paid for the financial year
34 34
• OFF-BALANCE SHEET ITEMS in euros
3 01/03/2020 29/03/2019
Hedging transactions Commitments on regulated or similar markets Commitments on OTC markets Other commitments
Other transactions Commitments on regulated or similar markets Commitments on OTC markets Other commitments
35 35
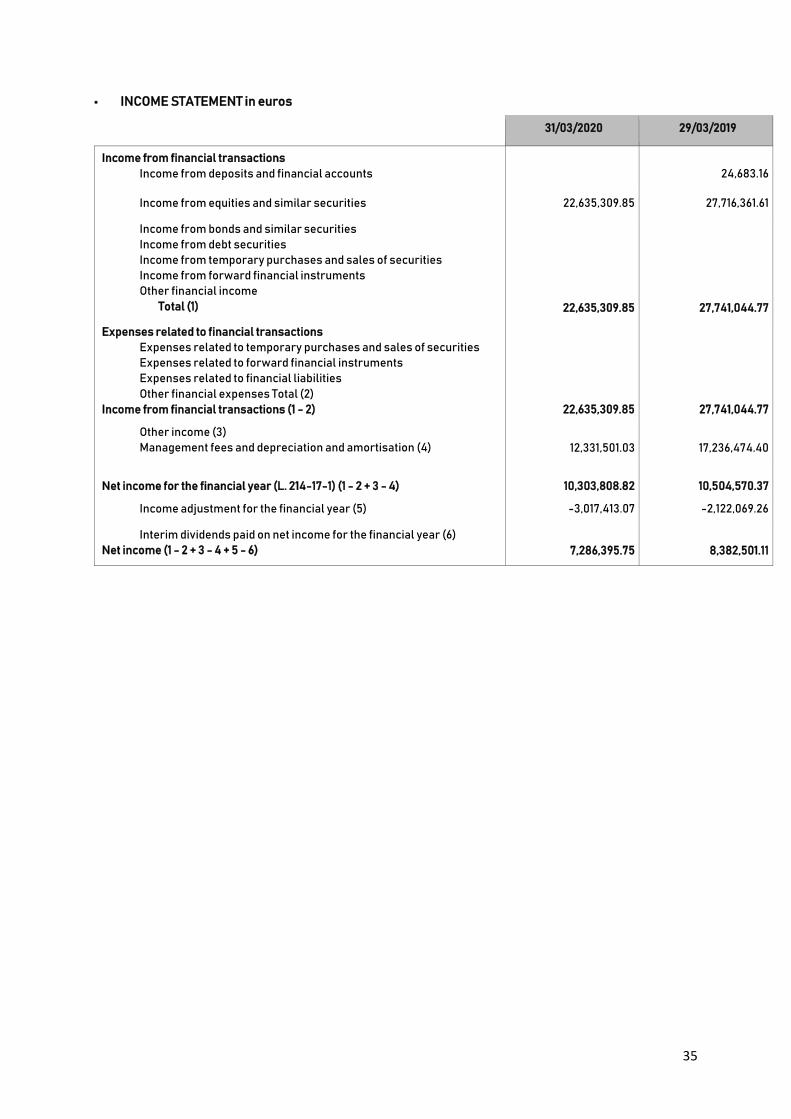
• INCOME STATEMENT in euros
31/03/2020 29/03/2019
Income from financial transactions
Income from deposits and financial accounts
24,683.16
Income from equities and similar securities 22,635,309.85 27,716,361.61
Income from bonds and similar securities
Income from debt securities
Income from temporary purchases and sales of securities
Income from forward financial instruments
Other financial income
Total (1)
22,635,309.85
27,741,044.77
Expenses related to financial transactions
Expenses related to temporary purchases and sales of securities
Expenses related to forward financial instruments
Expenses related to financial liabilities
Other financial expenses Total (2)
Income from financial transactions (1 - 2)
22,635,309.85
27,741,044.77
Other income (3)
Management fees and depreciation and amortisation (4)
12,331,501.03
17,236,474.40
Net income for the financial year (L. 214-17-1) (1 - 2 + 3 - 4)
10,303,808.82
10,504,570.37
Income adjustment for the financial year (5) -3,017,413.07 -2,122,069.26
Interim dividends paid on net income for the financial year (6)
Net income (1 - 2 + 3 - 4 + 5 - 6)
7,286,395.75
8,382,501.11

36
NOTES TO THE FINANCIAL STATEMENTS
ACCOUNTING RULES AND PRINCIPLES
The annual financial statements are presented in accordance with regulation 2014-01, as amended, of the
French accounting standards body (Autorité des Normes Comptables - ANC).
The general accounting principles apply:
- true and fair view, comparability, business continuity, - regularity, sincerity, - prudence, - permanence of the accounting methods used each year.
Income from fixed-income securities is recorded on the basis of accrued interest.
Purchases and sales of securities are recorded excluding expenses. The accounting currency of the portfolio is the euro.
The financial year comprises 12 months.
INFORMATION ON THE IMPACT OF THE COVID-19 CRISIS The financial statements were approved by the Board of Directors on the basis of available information in the context of the evolving COVID-19 crisis.
Asset valuation rules
Financial instruments and securities traded on a regulated market are valued at their market price.
o Shares and similar securities are valued on the basis of the last known price on their main market. If applicable, prices are translated into euros using the exchange rate prevailing in Paris on the valuation
day (as published by WM Closing).
o Fixed-income securities: Fixed-income securities are for the most part marked to market based on either Bloomberg prices
(BGN)® derived from averages of contributed prices, or on those of direct contributors.
There may be a discrepancy between the carrying amounts, valued as indicated above, and the actual
disposal prices that would be obtained if a portion of these portfolio assets were to be sold.
o Bonds and similar instruments are valued on the basis of the average of the closing prices gathered
from several contributors.
Financial instruments whose prices have not been determined on the valuation day or whose prices have been adjusted are valued at their probable trading price under the responsibility of the management company of the Fund. These estimates and their supporting documentation will be provided to the statutory auditor during
audits.
However, the following instruments are valued using the following specific methods:
o Negotiable debt securities:

37
- Negotiable debt securities with a residual maturity of more than three months: Negotiable debt securities traded in large volumes are valued at market price.
In the absence of significant trading volumes, these securities are valued using an actuarial method, with a benchmark rate plus, where applicable, a margin representative of the issuer’s intrinsic features.
Benchmark rate
Negotiable debt securities in euros Negotiable debt securities in other
currencies
Euribor, OISs and BTFs - 3 - 6 - 9 - 12 months
BTANs - 18 months, 2 – 3 – 4 – 5 years Official key rates in the relevant countries
- Negotiable debt securities with a residual maturity of three months or less: Negotiable debt securities with a residual maturity of three months or less are valued using the straight-line method. However, this method would not be applied if any of these securities were particularly
sensitive to market movements.
o UCIs: Units or shares of UCIs are valued at the last known net asset value. Units or shares of UCIs for which net asset values are published monthly may be valued on the basis of interim net asset values calculated from estimated prices.
o Temporary purchases and sales of securities: Securities purchased under repurchase agreements are valued at their contract price using an actuarial method with a benchmark rate (overnight EONIA, one- or two-week interbank rates, one- to 12-month EURIBOR) corresponding to the term of the contract.
Securities sold under repurchase agreements continue to be valued at their market price. Liabilities on securities sold under repurchase agreements are calculated using the same method as that used for
securities purchased under repurchase agreements.
o Futures and options: Futures and options are valued on the basis of intraday trading prices the timing of which is based on that of the valuation of the underlying assets.
Positions taken on the futures or options markets and over the counter are valued at their market price or at the value of the equivalent underlying asset.
Financial instruments and securities not traded on a regulated market All of the UCI’s financial instruments are traded on regulated markets.
Valuation methods for off-balance sheet commitments Off-balance sheet transactions are valued at the commitment value. The commitment value for futures contracts is equal to the price (in the SICAV’s currency) multiplied by the number of contracts multiplied by the face value.
The commitment value for options is equal to the price of the underlying security (in the SICAV’s currency) multiplied by the number of contracts multiplied by the delta multiplied by the face value of the underlying security. The commitment value for swaps is equal to the face value of the contract (in the SICAV's currency).
Management fees

38
Management fees are calculated on each valuation day. The annual management fee rate is applied to gross assets (equal to net assets before deduction of the
day's management fees) using the following formula:
Gross assets x operating and management fees rate x number of days between the NAV calculation date
and the previous NAV calculation date
365 (or 366 in a leap year)
This amount is then recorded in the SICAV's income statement and paid in full to the management company. The SICAV pays the operating fees, which include: . financial management; . administrative and accounting management; . custody services; . other operating costs:
. statutory auditors’ fees;
. legal notices (Balo, Petites Affiches, etc.) if applicable.
These fees do not include transaction charges. The fees break down as follows, as set out in the regulations:
Expenses charged to the SICAV Basis Rate
Financial management fees Net assets
Maximum 1,980% incl. taxes
Administrative fees external to the management company
Net assets Maximum 0,02% incl. taxes
Turnover commission (incl. taxes) (0% to 100% received by the
management company and 0% to 100% received by the custodian)
Maximum charge on each
transaction
French equities Up to €100 000 1,20%
From €100 001 to €200 000 0,78% From €100 001 to €200 000 0,60%
More than €300 000 0,42% Eurozone equities excluding France
Up to €100 000 0,72% From €100 001 to €200 000 0,47% From €100 001 to €200 000 0,36%
More than €300 000 0,25% Foreign equities outside the Eurozone, foreign exchange
Up to €100 000 0,90% From €100 001 to €200 000 0,61% From €100 001 to €200 000 0,47%
More than €300 000 0,32% Futures and other transactions ranging
from €0 to €450 incl. taxes per contract
Performance fee n/a None
(*) The fund paid exceptional charges amounting to €28 609,20 on debt collection in relation to withholding
tax on dividends received from foreign companies.
The method used to calculate retrocession amounts is set out in the sales and marketing agreements. - If the amount is significant, a provision is recognised in account 617. - The final amount is recognised upon settlement of invoices after reversal of any provisions.
Allocation of distributable income
Definition of distributable income:

39
Distributable income consists of:
Net income:
Net income for the financial year is equal to the amount of interest, arrears, bonuses and prizes, dividends, directors' fees and all other income generated by the securities that make up the portfolio, plus income generated by temporary cash holdings, minus the amount of management fees and borrowing costs. Retained earnings are added, plus or minus the balance of the revenue adjustment account.
Capital gains and losses:
Realised capital gains, net of expenses, less realised capital losses, net of expenses, recognised for the financial year, plus any net capital gains of the same kind recognised over previous years that have not
been distributed or accumulated, plus or minus the balance of the capital gains adjustment account.
Allocation of distributable income:
Distributable income FR0000299356
SHARES
Allocation of net income Accumulation
Allocation of net realised capital gains or losses Accumulation
40
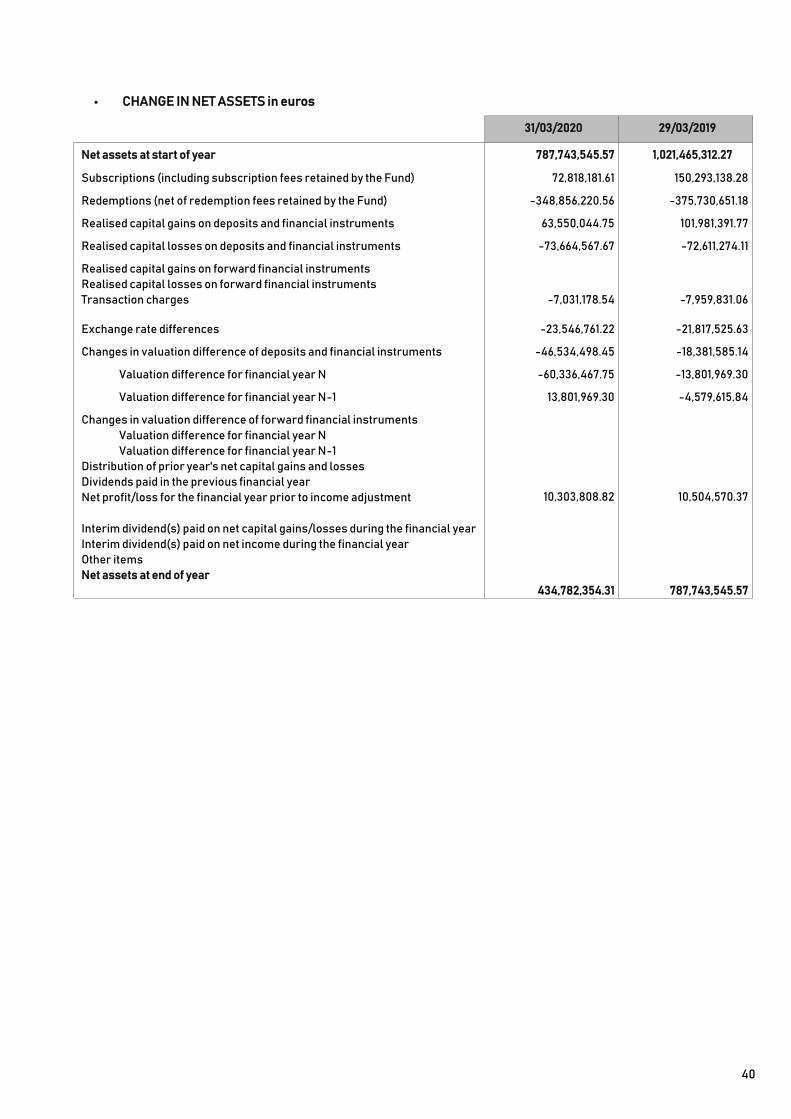
• CHANGE IN NET ASSETS in euros
31/03/2020 29/03/2019
Net assets at start of year 787,743,545.57 1,021,465,312.27
Subscriptions (including subscription fees retained by the Fund) 72,818,181.61 150,293,138.28
Redemptions (net of redemption fees retained by the Fund) -348,856,220.56 -375,730,651.18
Realised capital gains on deposits and financial instruments 63,550,044.75 101,981,391.77
Realised capital losses on deposits and financial instruments -73,664,567.67 -72,611,274.11
Realised capital gains on forward financial instruments Realised capital losses on forward financial instruments Transaction charges
-7,031,178.54
-7,959,831.06
Exchange rate differences -23,546,761.22 -21,817,525.63
Changes in valuation difference of deposits and financial instruments -46,534,498.45 -18,381,585.14
Valuation difference for financial year N -60,336,467.75 -13,801,969.30
Valuation difference for financial year N-1 13,801,969.30 -4,579,615.84
Changes in valuation difference of forward financial instruments Valuation difference for financial year N Valuation difference for financial year N-1
Distribution of prior year's net capital gains and losses Dividends paid in the previous financial year Net profit/loss for the financial year prior to income adjustment
10,303,808.82
10,504,570.37
Interim dividend(s) paid on net capital gains/losses during the financial year Interim dividend(s) paid on net income during the financial year Other items Net assets at end of year
434,782,354.31
787,743,545.57
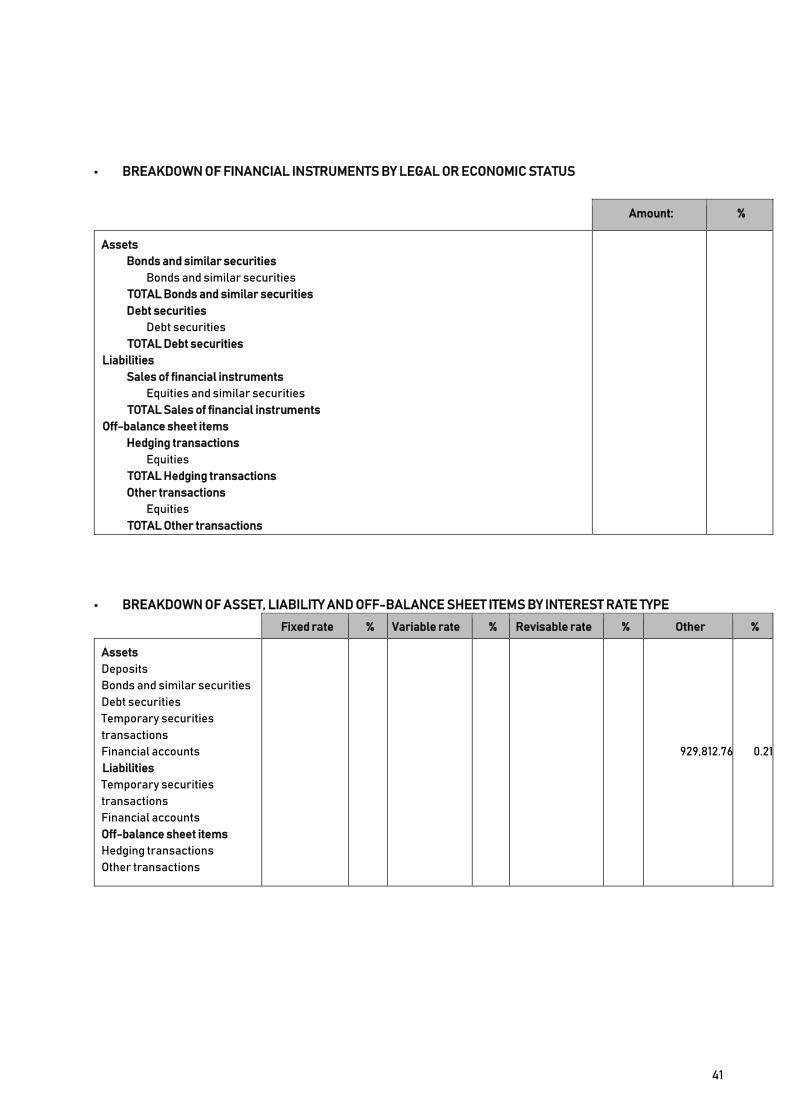
41
• BREAKDOWN OF FINANCIAL INSTRUMENTS BY LEGAL OR ECONOMIC STATUS
Amount: %
Assets Bonds and similar securities
Bonds and similar securities TOTAL Bonds and similar securities Debt securities
Debt securities TOTAL Debt securities
Liabilities Sales of financial instruments
Equities and similar securities TOTAL Sales of financial instruments
Off-balance sheet items Hedging transactions
Equities TOTAL Hedging transactions Other transactions
Equities TOTAL Other transactions
• BREAKDOWN OF ASSET, LIABILITY AND OFF-BALANCE SHEET ITEMS BY INTEREST RATE TYPE
Fixed rate % Variable rate % Revisable rate % Other %
Assets Deposits Bonds and similar securities Debt securities Temporary securities
transactions Financial accounts Liabilities Temporary securities
transactions Financial accounts Off-balance sheet items Hedging transactions Other transactions
929,812.76
0.21
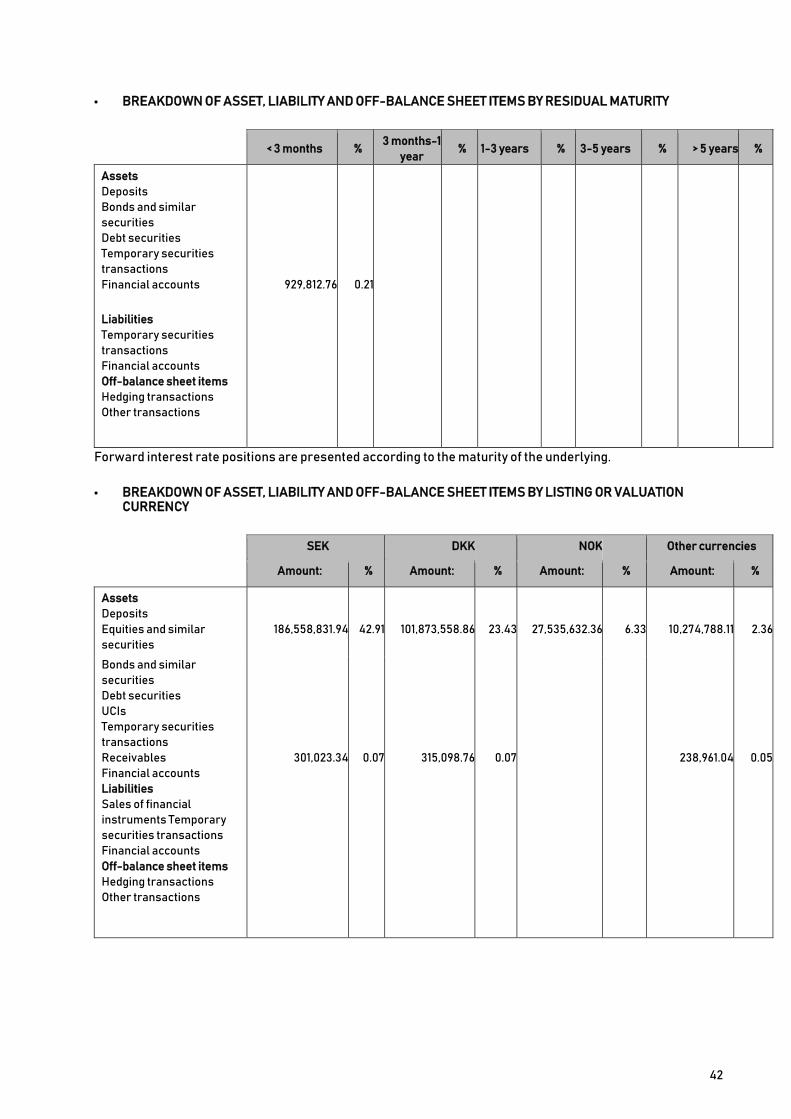
42
• BREAKDOWN OF ASSET, LIABILITY AND OFF-BALANCE SHEET ITEMS BY RESIDUAL MATURITY
< 3 months % 3 months-1
year % 1-3 years % 3-5 years % > 5 years %
Assets Deposits Bonds and similar
securities Debt securities Temporary securities
transactions Financial accounts Liabilities Temporary securities
transactions Financial accounts Off-balance sheet items Hedging transactions Other transactions
929,812.76
0.21
Forward interest rate positions are presented according to the maturity of the underlying. • BREAKDOWN OF ASSET, LIABILITY AND OFF-BALANCE SHEET ITEMS BY LISTING OR VALUATION
CURRENCY
SEK DKK NOK Other currencies
Amount: % Amount: % Amount: % Amount: %
Assets Deposits Equities and similar
securities
186,558,831.94
42.91
101,873,558.86
23.43
27,535,632.36
6.33
10,274,788.11
2.36
Bonds and similar
securities Debt securities UCIs Temporary securities
transactions Receivables Financial accounts Liabilities Sales of financial
instruments Temporary
securities transactions Financial accounts Off-balance sheet items Hedging transactions Other transactions
301,023.34
0.07
315,098.76
0.07
238,961.04
0.05

43
RECEIVABLES AND PAYABLES: BREAKDOWN BY TYPE
Debit/credit item 31/03/2020
Receivables Deferred settlement sale 4,432,926.71
Subscription receivables 176,164.84
Retrocessions of management fees 160,559.55
Coupons and dividends in cash 1,701,418.14
Total receivables 6,471,069.24
Liabilities Deferred settlement purchase 1,250,071.48
Redemptions payable 118,033.79
Management fees 797,266.59
Total liabilities 2,165,371.86
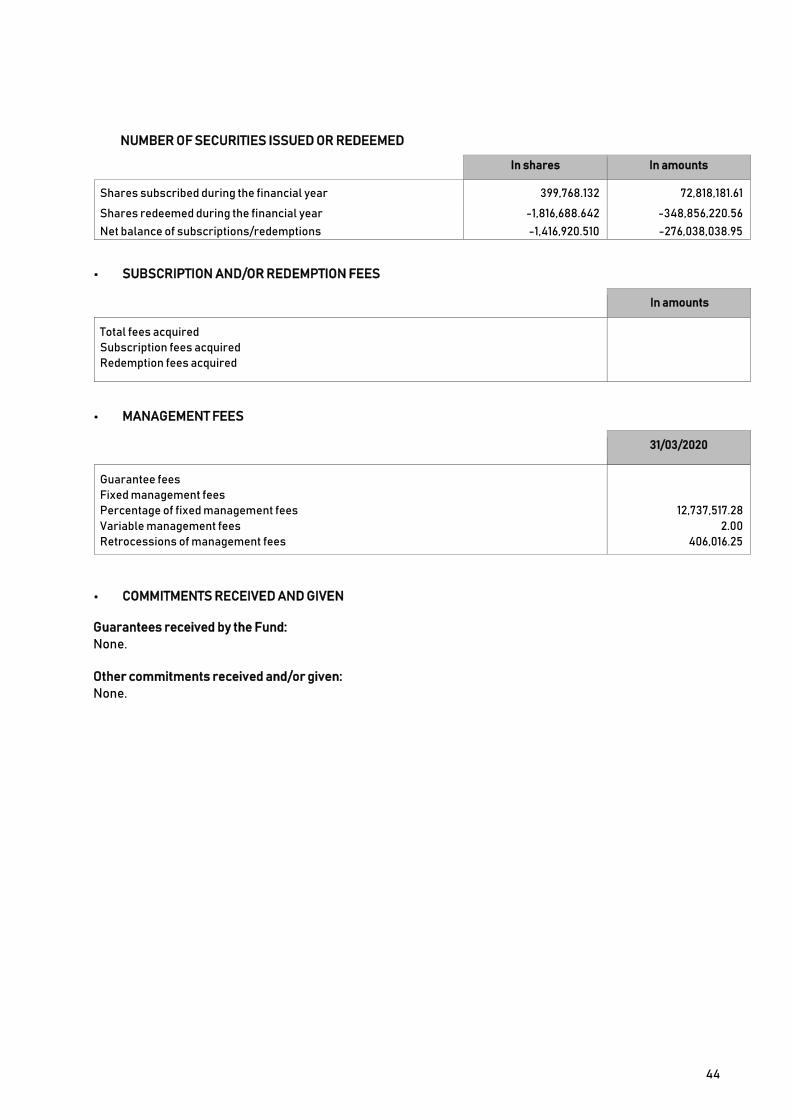
44
NUMBER OF SECURITIES ISSUED OR REDEEMED
In shares In amounts
Shares subscribed during the financial year 399,768.132 72,818,181.61
Shares redeemed during the financial year -1,816,688.642 -348,856,220.56 Net balance of subscriptions/redemptions -1,416,920.510 -276,038,038.95
• SUBSCRIPTION AND/OR REDEMPTION FEES
In amounts
Total fees acquired Subscription fees acquired Redemption fees acquired
• MANAGEMENT FEES
31/03/2020
Guarantee fees Fixed management fees Percentage of fixed management fees Variable management fees Retrocessions of management fees
12,737,517.28 2.00
406,016.25
• COMMITMENTS RECEIVED AND GIVEN
Guarantees received by the Fund:
None.
Other commitments received and/or given:
None.
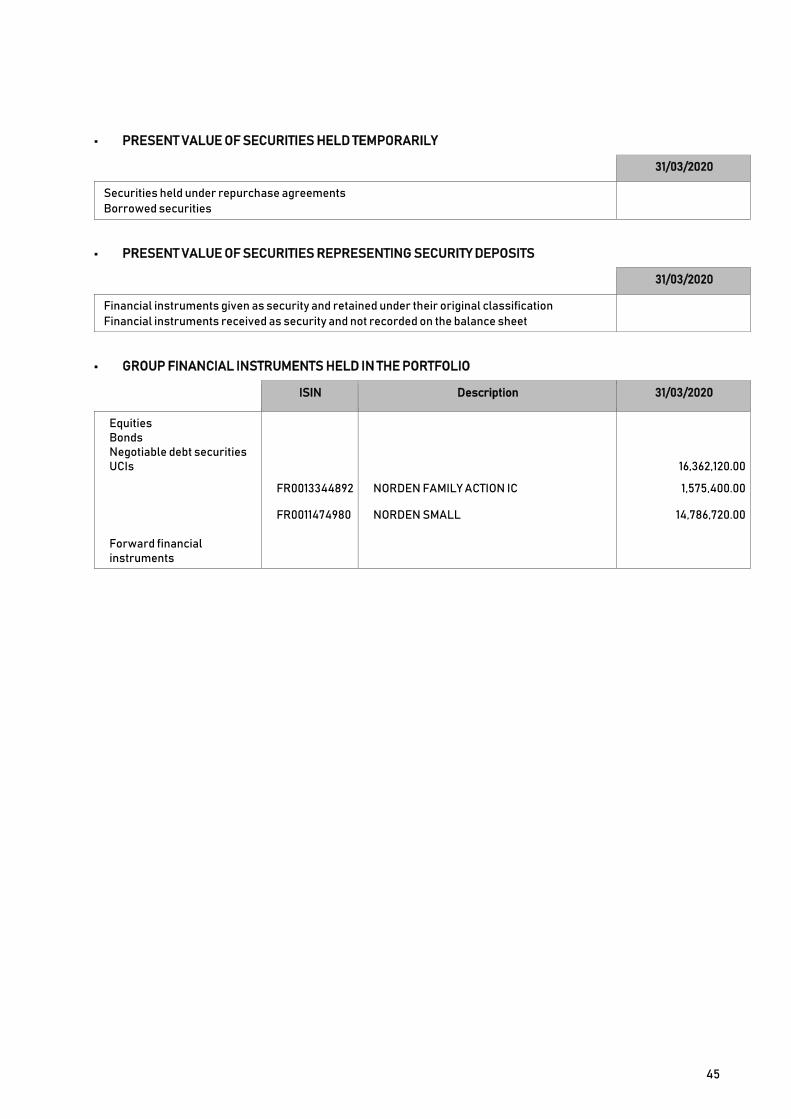
45
• PRESENT VALUE OF SECURITIES HELD TEMPORARILY
31/03/2020
Securities held under repurchase agreements Borrowed securities
• PRESENT VALUE OF SECURITIES REPRESENTING SECURITY DEPOSITS
31/03/2020
Financial instruments given as security and retained under their original classification Financial instruments received as security and not recorded on the balance sheet
• GROUP FINANCIAL INSTRUMENTS HELD IN THE PORTFOLIO
ISIN Description 31/03/2020
Equities Bonds Negotiable debt securities UCIs
16,362,120.00
FR0013344892 NORDEN FAMILY ACTION IC 1,575,400.00
Forward financial instruments
FR0011474980 NORDEN SMALL 14,786,720.00

46
• TABLE OF ALLOCATION OF DISTRIBUTABLE INCOME PERTAINING TO NET INCOME
31/03/2020 29/03/2019
Remaining amounts to be allocated Retained earnings Net income
7,286,395.75
8,382,501.11
Total 7,286,395.75 8,382,501.11
Appropriation Distribution Balance brought forward for the financial year Accumulation
7,286,395.75
8,382,501.11
Total 7,286,395.75 8,382,501.11
• TABLE OF ALLOCATION OF DISTRIBUTABLE AMOUNTS PERTAINING TO NET CAPITAL GAINS AND
LOSSES
31/03/2020 29/03/2019
Remaining amounts to be allocated Undistributed net capital gains and losses recognised in previous years Net capital gains and losses for the year Interim dividends paid on net capital gains/losses for the financial year
Total
Appropriation Distribution Undistributed net capital gains and losses
Accumulation Total
-28,441,412.45
-28,441,412.45
-28,441,412.45 -28,441,412.45
-8,673,923.15
-8,673,923.15
-8,673,923.15
-8,673,923.15
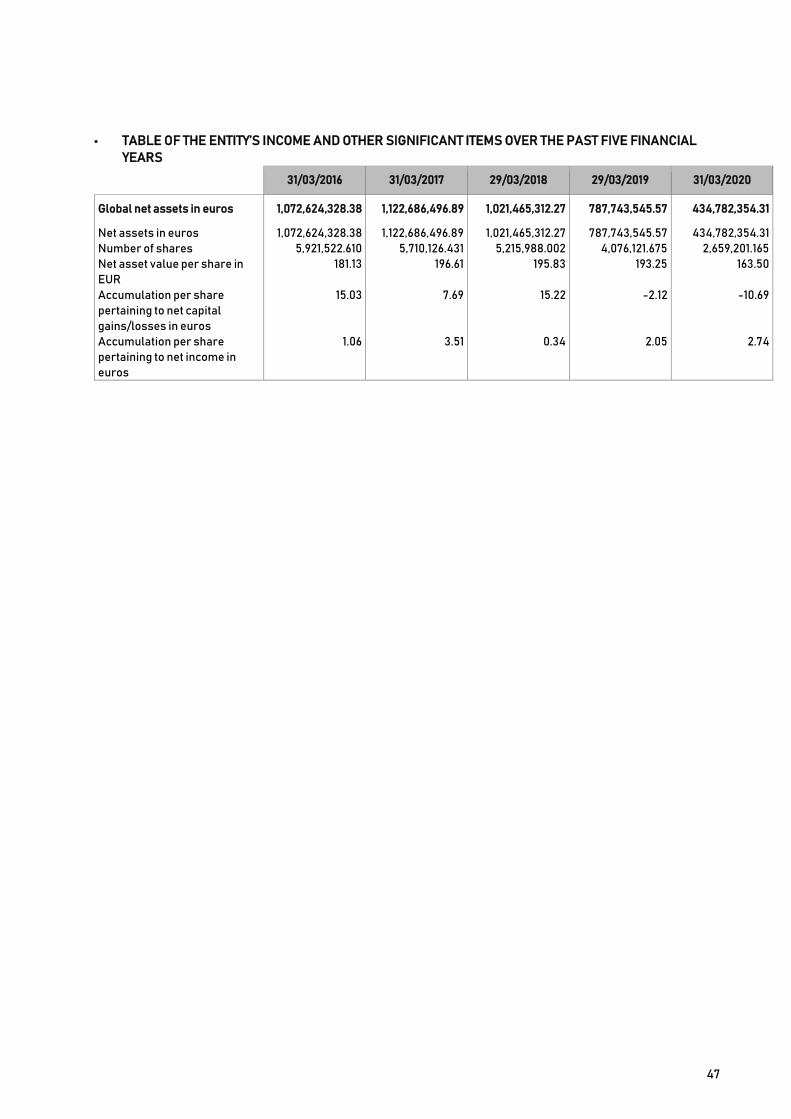
47
• TABLE OF THE ENTITY’S INCOME AND OTHER SIGNIFICANT ITEMS OVER THE PAST FIVE FINANCIAL
YEARS
31/03/2016 31/03/2017 29/03/2018 29/03/2019 31/03/2020
Global net assets in euros 1,072,624,328.38 1,122,686,496.89 1,021,465,312.27 787,743,545.57 434,782,354.31
Net assets in euros Number of shares Net asset value per share in
EUR Accumulation per share
pertaining to net capital
gains/losses in euros Accumulation per share
pertaining to net income in
euros
1,072,624,328.38 5,921,522.610
181.13
15.03
1.06
1,122,686,496.89 5,710,126.431
196.61
7.69
3.51
1,021,465,312.27 5,215,988.002
195.83
15.22
0.34
787,743,545.57 4,076,121.675
193.25
-2.12
2.05
434,782,354.31 2,659,201.165
163.50
-10.69
2.74
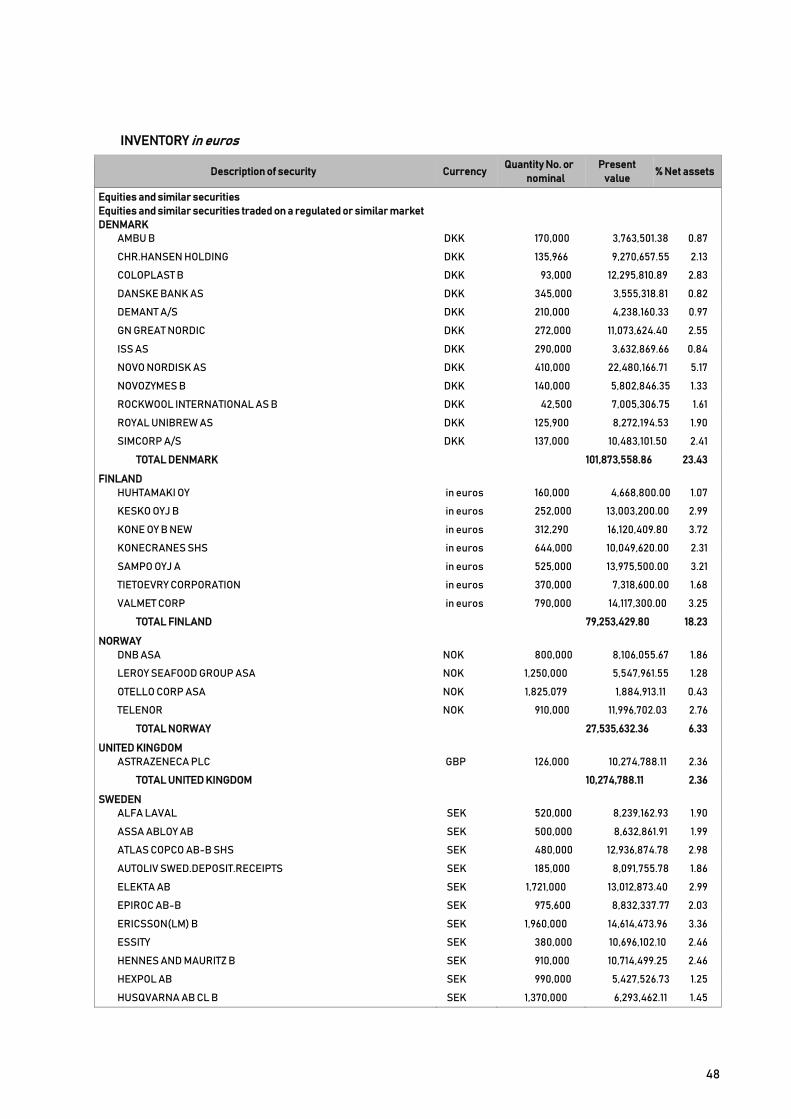
48
INVENTORY in euros
Description of security Currency Quantity No. or
nominal
Present
value % Net assets
Equities and similar securities
Equities and similar securities traded on a regulated or similar market
DENMARK
AMBU B DKK 170,000 3,763,501.38 0.87
CHR.HANSEN HOLDING DKK 135,966 9,270,657.55 2.13
COLOPLAST B DKK 93,000 12,295,810.89 2.83
DANSKE BANK AS DKK 345,000 3,555,318.81 0.82
DEMANT A/S DKK 210,000 4,238,160.33 0.97
GN GREAT NORDIC DKK 272,000 11,073,624.40 2.55
ISS AS DKK 290,000 3,632,869.66 0.84
NOVO NORDISK AS DKK 410,000 22,480,166.71 5.17
NOVOZYMES B DKK 140,000 5,802,846.35 1.33
ROCKWOOL INTERNATIONAL AS B DKK 42,500 7,005,306.75 1.61
ROYAL UNIBREW AS DKK 125,900 8,272,194.53 1.90
SIMCORP A/S DKK 137,000 10,483,101.50 2.41
TOTAL DENMARK 101,873,558.86 23.43
FINLAND
HUHTAMAKI OY in euros 160,000 4,668,800.00 1.07
KESKO OYJ B in euros 252,000 13,003,200.00 2.99
KONE OY B NEW in euros 312,290 16,120,409.80 3.72
KONECRANES SHS in euros 644,000 10,049,620.00 2.31
SAMPO OYJ A in euros 525,000 13,975,500.00 3.21
TIETOEVRY CORPORATION in euros 370,000 7,318,600.00 1.68
VALMET CORP in euros 790,000 14,117,300.00 3.25
TOTAL FINLAND 79,253,429.80 18.23
NORWAY
DNB ASA NOK 800,000 8,106,055.67 1.86
LEROY SEAFOOD GROUP ASA NOK 1,250,000 5,547,961.55 1.28
OTELLO CORP ASA NOK 1,825,079 1,884,913.11 0.43
TELENOR NOK 910,000 11,996,702.03 2.76
TOTAL NORWAY 27,535,632.36 6.33
UNITED KINGDOM
ASTRAZENECA PLC GBP 126,000 10,274,788.11 2.36
TOTAL UNITED KINGDOM 10,274,788.11 2.36
SWEDEN
ALFA LAVAL SEK 520,000 8,239,162.93 1.90
ASSA ABLOY AB SEK 500,000 8,632,861.91 1.99
ATLAS COPCO AB-B SHS SEK 480,000 12,936,874.78 2.98
AUTOLIV SWED.DEPOSIT.RECEIPTS SEK 185,000 8,091,755.78 1.86
ELEKTA AB SEK 1,721,000 13,012,873.40 2.99
EPIROC AB-B SEK 975,600 8,832,337.77 2.03
ERICSSON(LM) B SEK 1,960,000 14,614,473.96 3.36
ESSITY SEK 380,000 10,696,102.10 2.46
HENNES AND MAURITZ B SEK 910,000 10,714,499.25 2.46
HEXPOL AB SEK 990,000 5,427,526.73 1.25
HUSQVARNA AB CL B SEK 1,370,000 6,293,462.11 1.45

49
Description of security Currency Quantity No. or
nominal Present value % Net assets
SAAB AB SEK 570,000 10,011,866.16 2.30
SECURITAS AB B SEK 1,025,000 10,130,964.70 2.33
SKANDINAVISKA ENSKILDA BANKEN SEK 860,000 5,314,457.86 1.22
SVENSKA HANDELSBANKEN AB SEK 700,000 5,353,386.23 1.23
SWEDBANK AB SEK 350,000 3,568,816.83 0.82
SWEDISH MATCH SEK 319,000 16,667,080.60 3.84
TELE2 AB SEK 920,000 11,289,226.17 2.60
THULE GROUP AB SEK 610,000 9,696,033.11 2.23
VOLVO AB-B- SEK 640,000 7,035,069.56 1.62
TOTAL SWEDEN
TOTAL equities and similar securities traded on a regulated or
equivalent market
TOTAL Equities and similar securities
186,558,831.94 42.92
405,496,241.07 93.27
405,496,241.07 93.27
Undertakings for collective investment
General UCITS and general AIFs aimed at non-professionals and their
equivalent in other countries
FRANCE
AMUNDI CASH CORPORATE IC in euros 33 7,688,483.10 1.77
NORDEN FAMILY ACTION IC in euros 20,000 1,575,400.00 0.36
NORDEN SMALL in euros 104,000 14,786,720.00 3.40
TOTAL FRANCE
TOTAL general UCITS and general AIFs aimed at non-professionals
and their equivalent in other countries
TOTAL Undertakings for collective investment
24,050,603.10 5.53
24,050,603.10 5.53
24,050,603.10 5.53
Receivables 6,471,069.24 1.49
Liabilities -2,165,371.86 -0.50
Financial accounts 929,812.76 0.21
Net assets 434,782,354.31 100.00
NORDEN in euros 2,659,201.165 163.50

50 50
NORDEN French open-end investment company (Société d'Investissement à Capital Variable)
Registered office: 121, Boulevard Haussmann, 75008 Paris, France
Paris Trade and Companies Register no. 399 380 997
RESOLUTION CONCERNING THE ALLOCATION OF DISTRIBUTABLE INCOME PROPOSED TO THE SHAREHOLDERS' MEETING
FINANCIAL YEAR ENDED MARCH 31ST, 2020
Second resolution
The Shareholders’ Meeting approves the distributable income for the financial year, which amounts to:
€7 286 395,75 distributable amount pertaining to net income -€28 441 412,45 distributable amount pertaining to net capital gains and losses
and allocates these amounts to the share capital pursuant to Article 28 of the articles of association
No dividends will therefore be paid for this financial year. Reminder: distributable income for the past three financial years has been accumulated.