fremantle housing market analysis
TRANSCRIPT

Fremantle Housing Market Analysis
1
Fremantle housing market analysis
Under the Affordable Housing Strategy; Opening Doors 2010 -
2020 the Department of Housing has a mandate to lead vital
changes in our housing system and, through new partnerships, start
opening more doors for more people more quickly.
The Department of Housing works with markets to be able to
maximise overall economic and social outcomes and this document
looks at the local housing market and guide a suitable development
approach.
This document should also be read in conjunction with City of
Fremantle strategies and State planning strategies to understand
how Government is planning for the growth of the Perth
Metropolitan region, to consider how your project can maximise its
contribution.
Housing market outcomes
The State Government seeks to support housing markets to
respond to people’s needs needs and grow communities in ways
that allow people to belong, participate and prosper. The ability for
people to choose viable places to live, from amongst a range of
locations and lifestyle alternatives underpins the labour market and
is key to building the State’s prosperity. State Government works
with industry so that the market can provide improve housing supply
to enable more Western Australians to have a place to call home.
Major principles are sought to achieve these outcomes:
Affordability - this means the market can supply housing
that is appropriate and accessible for households to have
viable choices to live and work and join the community.
Affordable housing is more accessible and supports people
to choose where they want to live and the prosperity of the
local community.
Diversity – is important so that parts of the city can benefit
from a wider range of skills, abilities and lifestyle
preferences and so that a full range of household types
more choices to live closer to access the benefits of key
locations. Diversity helps build economic and social capital
by supporting people to connect and to do business.
Accessibility – is improved where people can conveniently
get about the city to access the services and benefits it
offers and access to a range of viable transport options is
critical to increasing the efficiency of moving people about.
Innovation – means finding new ways to deliver housing
options that achieve the above three principles in forms and
products that consumers value. Government is seeking
innovation that can transferred and applied across the
housing industry, to increase the market’s capacity to deliver
affordable housing so that more housing can be produced at
lower price points that still offer a marketable standard of
what people demand from their housing.
Fremantle Housing Market Analysis
2
Strategic marketing - setting the project direction
A vision of your completed project will lead its design in the right
direction towards the above development principles. A project vision
encapsulates the value and lifestyle opportunities it offers to
residents and the Fremantle community and sums up the identity
and marketable points of difference that distinguish the project from
any competitors.
In creating a project vision, consider:
Who is the project being marketed to?
What are the characteristics of the specific target demand
groups?
How will it cater to and support their lifestyles and
preferences?
How will residents connect and belong to the community?
How will the dwelling specifications meet their needs?
How much can they pay and is the price right?
How can I design the project to maximise affordability?
What innovative methods and materials will it benefit from
and what will the benefits be (such as construction
processes, materials, financing arrangements, business
models or tenancy management models)?
The above is aligned with the project objectives of the Competition
design brief.
The rest of this document is designed to help answer these
questions.
Housing affordability
Affordable Housing refers to dwellings that households on low-to-
moderate incomes can afford to rent or buy, while meeting other
essential living costs such as food, healthcare, education and
transport. Considering this in the context of the broader housing
market, affordability can be calculated according to the amount that
is:
a) Affordable for the household based on its income (i.e.
Income Based), or
b) Affordable in comparison to the current local housing market
(i.e. Market Relative).
Income based affordability
Efforts to define affordable housing generally reference household
incomes and the ability for households to meet housing expenses.
This is an important measure that should be considered in
conjunction with Market Relative Affordability when setting a range
of affordable housing price points.
Housing is generally considered affordable when expenditure on
housing costs is less than 30% of the gross household income. An
accepted measure of affordable housing expenditure is 30% of

Fremantle Housing Market Analysis
3
income for households in the bottom 40% of income distribution.1
Income based affordable price points should provide housing
opportunities that are affordable for households based on either the
Perth or locational median income or a portion thereof, depending
on the income band of the target client group. To ensure that a
range of price points are delivered to cater for the various income
bands, the calculation should be repeated for 50%, 80%, 100% and
120% of median income for the LGA.2 This will enable an
assessment of the likely affordable housing outcomes than can be
delivered. Income bands are defined as:
Table 1: Income Band Definitions
Income Band Refers to Households with incomes:
Very Low Less than 50% of the median income.
Low Between 50% and 80% of the median income
Moderate Between 80% and 120% of the median income.
High Above 120% of the median income.
Market relative affordability
Market Relative affordable price points enable new housing stock to
be delivered at rates which are more affordable than the current
market prices for the location. Calculating the Market Relative
1 Generally known as the 30/40 rule.
2 The median income of the LGA rather than the suburb will allow for a
greater catchment area and diversity. This can be accessed from ABS 2011 Census.
Affordability of a location will assist in determining whether a project
can deliver affordable housing beyond meeting affordability
guidelines for specific income cohorts.
Market relative affordability is calculated by halving the difference
between the suburb and the Perth Metro lower quartile prices for
the relevant housing type, house or multi-unit. The market relative
price is set as the half-way point between the suburb lower quartile
price and the Perth lower quartile price.
The creation of market relative affordable housing opportunities
seeks to add new affordable housing supply that complements the
existing housing market. Increasing housing supply at lower price
points will place downward pressure on median house prices in the
area without affecting the value of existing housing stock.
Housing affordability targets
To deliver affordable outcomes your project should demonstrate
how it delivers housing opportunities that meet housing affordability
targets. The following targets set relevant goals for the local market
and are used to focus project design and innovation to achieving
value around these price points.
Fremantle Housing Market Analysis
4
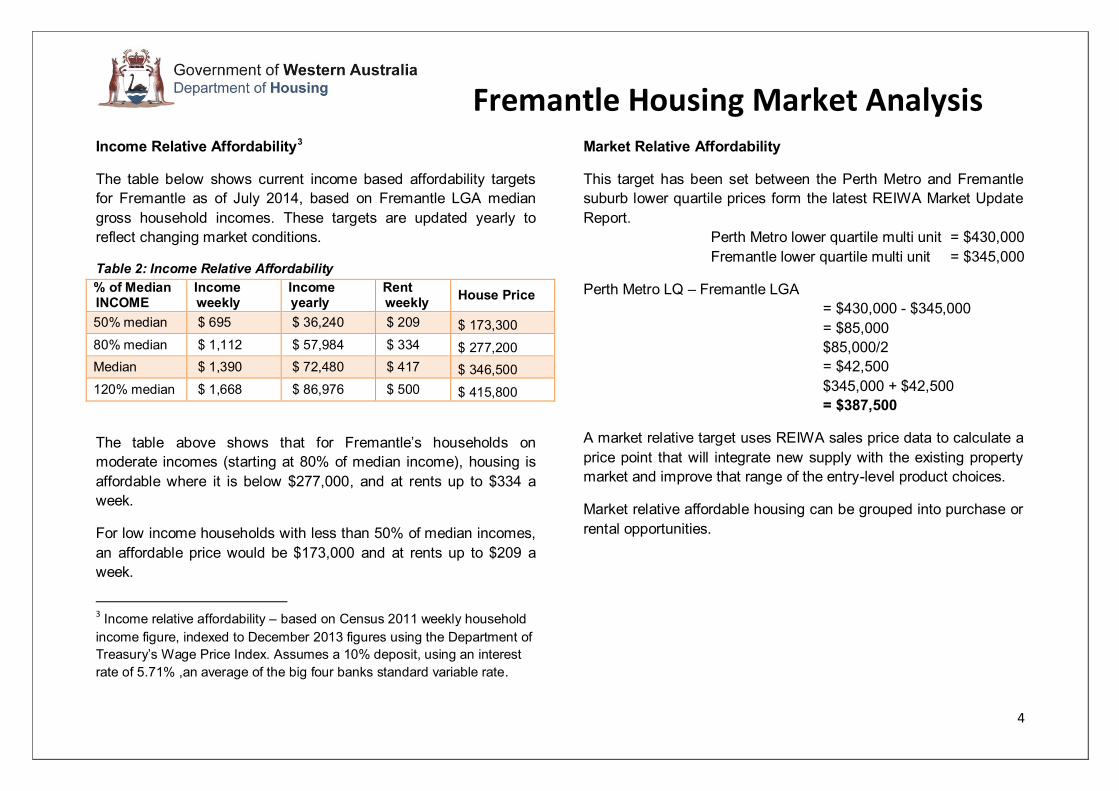
Income Relative Affordability3
The table below shows current income based affordability targets
for Fremantle as of July 2014, based on Fremantle LGA median
gross household incomes. These targets are updated yearly to
reflect changing market conditions.
Table 2: Income Relative Affordability
% of Median INCOME
Income weekly
Income yearly
Rent weekly
House Price
50% median $ 695 $ 36,240 $ 209 $ 173,300
80% median $ 1,112 $ 57,984 $ 334 $ 277,200
Median $ 1,390 $ 72,480 $ 417 $ 346,500
120% median $ 1,668 $ 86,976 $ 500 $ 415,800
The table above shows that for Fremantle’s households on
moderate incomes (starting at 80% of median income), housing is
affordable where it is below $277,000, and at rents up to $334 a
week.
For low income households with less than 50% of median incomes,
an affordable price would be $173,000 and at rents up to $209 a
week.
3 Income relative affordability – based on Census 2011 weekly household
income figure, indexed to December 2013 figures using the Department of
Treasury’s Wage Price Index. Assumes a 10% deposit, using an interest
rate of 5.71% ,an average of the big four banks standard variable rate.
Market Relative Affordability
This target has been set between the Perth Metro and Fremantle
suburb lower quartile prices form the latest REIWA Market Update
Report.
Perth Metro lower quartile multi unit = $430,000
Fremantle lower quartile multi unit = $345,000
Perth Metro LQ – Fremantle LGA
= $430,000 - $345,000
= $85,000
$85,000/2
= $42,500
$345,000 + $42,500
= $387,500
A market relative target uses REIWA sales price data to calculate a
price point that will integrate new supply with the existing property
market and improve that range of the entry-level product choices.
Market relative affordable housing can be grouped into purchase or
rental opportunities.

Fremantle Housing Market Analysis
5
Demographic analysis
This section describes the kinds of households that live in the City
of Fremantle area. The Local Government Authority is used as a
demand catchment for potential buyers and households to target,
and to analyse the community to understand trends in its evolution
and its unique diversity issues.
An understanding of community informs the vision, development
outcomes and target demand segments to achieve the desired
outcomes for the Fremantle community.
The City of Fremantle compared to Perth Metro average
This section identifies the unique characteristics of the Fremantle
LGA community by contrasting it to the whole of Perth.
Couples without children have been the largest growth type at
around half of all growth.

Fremantle Housing Market Analysis
6
Fremantle has higher concentrations of smaller households and
significantly fewer larger households.
However, growth has been concentrated in 2 person households
and larger households.
Renting has seen the largest rate of growth across Fremantle from
an existing high rate compared to wider Perth. Social housing rates
are above the Metro average and mortgage ownership rates are
lower than average.
Fremantle Housing Market Analysis
7
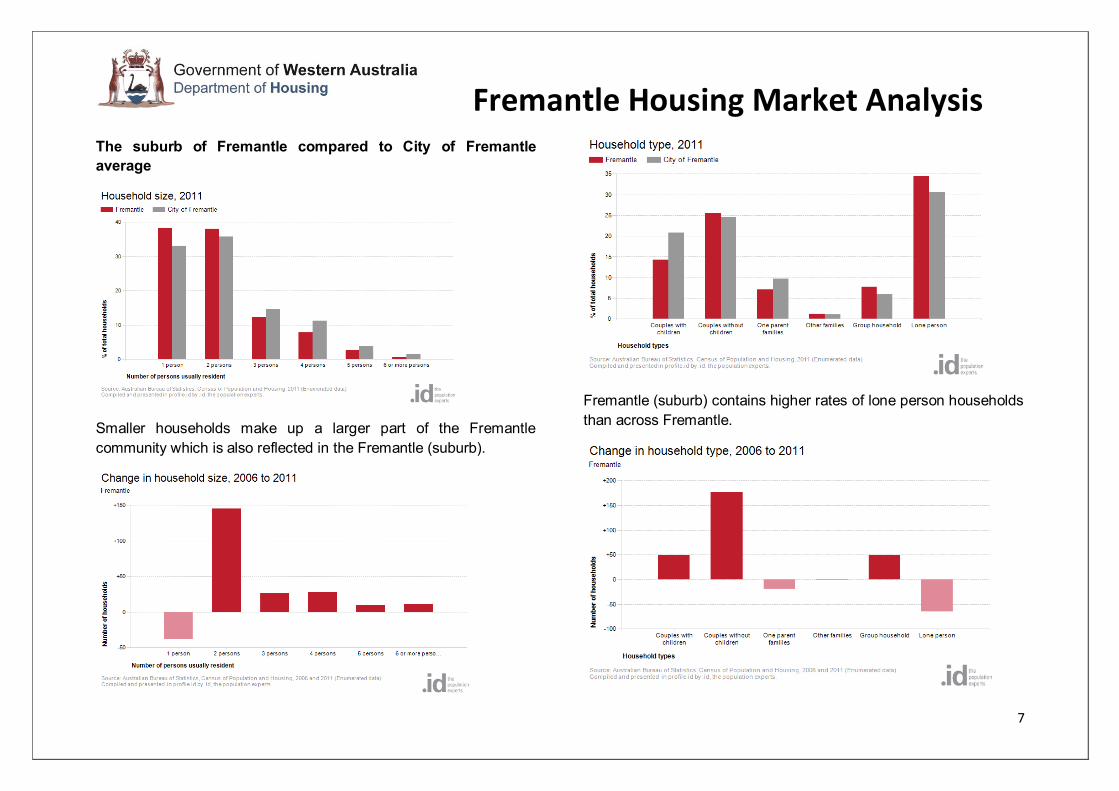
The suburb of Fremantle compared to City of Fremantle
average
Smaller households make up a larger part of the Fremantle
community which is also reflected in the Fremantle (suburb).
Fremantle (suburb) contains higher rates of lone person households
than across Fremantle.

Fremantle Housing Market Analysis
8
The most significant change to households in Fremantle (suburb) is
the increase of Couples with children entering into the area.
Market dwelling stock characteristics
This section describes the kinds of housing options that exist in the
City of Fremantle area. The Local Government Authority is used as
a catchment area to describe the range of local housing choices as
alternatives, competition and potential market gaps available to
Fremantle.
An understanding of range of housing available will suggest
potential market opportunities for this site where wider choices can
be offered to attract more diverse households.
The City of Fremantle compared to Perth Metro average
(Above) The City of Fremantle contains almost 30% smaller
dwellings and very low rates of larger dwellings.
The City of Fremantle has been adding mostly 3 and 4 bedroom
stock
.
Fremantle Housing Market Analysis
9
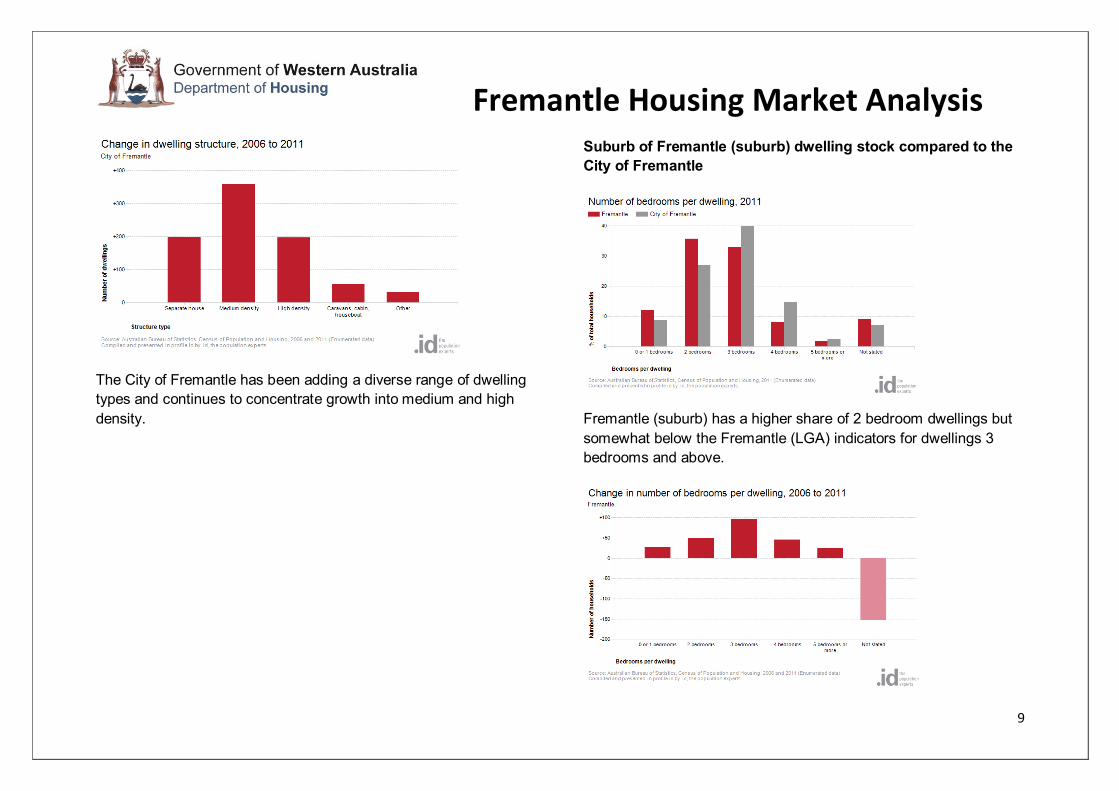
The City of Fremantle has been adding a diverse range of dwelling
types and continues to concentrate growth into medium and high
density.
Suburb of Fremantle (suburb) dwelling stock compared to the
City of Fremantle
Fremantle (suburb) has a higher share of 2 bedroom dwellings but
somewhat below the Fremantle (LGA) indicators for dwellings 3
bedrooms and above.

Fremantle Housing Market Analysis
10
Family accommodation continues to grow strongly with 3 bedroom
dwellings leading the way in new housing stock in Fremantle
(suburb).
Dwelling structure is predominantly separate houses matched by
medium density in Fremantle (suburb) compared to the City of
Fremantle.
Fremantle has shifted to concentrate new supply in medium density
housing; often these can be flats, villas and low rise apartments.
Affordable Housing Target Price Range
One of the key project objectives of the Competition is the
achievement of affordable housing outcomes. This is determined by
the ability to construct and sell houses within an affordable housing
target price range.
The table below outlines the target price range based on the
different intervals of the Fremantle LGA median gross household
income. Each segment serves as a guide to different price points
teams can try and achieve. While it is preferable to have low entry
price points, it is just as important to achieve a mix reflecting the
diversity of housing options.
Table 3: Preferred Affordable Market Price Points
Scenario based on Household median income At Market Price
Maximum Affordable Housing Price $387,500
Maximum Affordable Housing Price on Fremantle LGA median gross household incomes
$346,500
Maximum Affordable Housing Price on 80% of Fremantle LGA median gross household incomes
$277,200
Maximum Affordable Housing Price on 50% of Fremantle LGA median gross household incomes
$173,300

Fremantle Housing Market Analysis
11
However, these price points can also be achieved through the
Department’s ‘SharedStart’ program if the ‘market price’ exceeds
Under ‘SharedStart’ the State Government holds a percentage of
equity in a property with the potential homebuyer purchasing the
remaining amount.
A common equity share composition is:
1) 80% of ‘at market’ value of property by homebuyer
2) 20% of ‘at market’ value of property held by State
Government
The table outlines the achievability of the affordable housing target
price range it the 80/20 SharedStart scheme is used.
Table 4: Preferred Affordable Market Price Points Using SharedStart
Scenario based on Household median income
SharedStart Price 80/20
Maximum Market Price Point
Maximum Affordable Housing Price $387,500 $484,375
Maximum Affordable Housing on Fremantle LGA median gross household
income
$346,500 $433,125
Maximum Affordable Housing Price for households on 80% of Fremantle LGA
median gross household income
$277,200 $346,500
Maximum Affordable Housing Price for households on 50% of Fremantle LGA
median gross household incomes
$173,300 $216,625
This provides tremendous flexibility if construction costs necessitate
the use of a shared equity mechanism to achieve affordable entry
price points.
Alternatively, if target ‘at market’ price range is achievable an 80/20
SharedStart scheme can still be used to create even more
affordable price points.
Table 5: Application of SharedStart on Preferred Affordable Market
Price Points
Scenario based on Household median income
SharedStart Price 80/20
At Market
Maximum Affordable Housing Price $310,000 $387,500
Maximum Affordable Housing on Fremantle LGA median gross household
income
$277,200 $346,500
Maximum Affordable Housing Price for households on 80% of Fremantle LGA
median gross household income
$221,760 $277,200
Maximum Affordable Housing Price for households on 50% of Fremantle LGA
median gross household incomes
$138,400 $173,300
Please note the target price ranges do not specify:
a) Development type. Ie. Grouped dwelling or multiple
dwellings
b) Configuration (no. of bedrooms)
c) Size of lots (if applicable)

Fremantle Housing Market Analysis
12
This is up to teams to outline the product mix at their respective
price points and what they consider to be attractive to the market
based on the data presented in this document.