freescale kinetis k series: cortex™-m4 training using … arm processors running linux, android...
TRANSCRIPT

Copyright © 2012 ARM Ltd. All rights reserved
Freescale Cortex-M0+ Lab with ARM® Keil™ MDK toolkit www.keil.com
1
Freescale Kinetis K Series: Cortex™-M4 Training
Using the Freedom K20D50M featuring CMSIS-DAP
and ARM® Keil™ MDK Toolkit Summer 2013 Version 0.95 by Robert Boys, [email protected]
Introduction:
The purpose of this lab is to introduce you to the Freescale Kinetis Cortex™-M4 processor using the ARM® Keil™ MDK toolkit featuring the IDE μVision®. We will demonstrate all debugging features available on this processer. At the end of this tutorial, you will be able to confidently work with these processors and Keil MDK. For more labs, appnotes and information including MQX support in MDK see www.keil.com/www.keil.com/Freescale.
For general information see forums.arm.com and www.arm.com/cmsis.
Keil MDK supports and has examples for most Freescale ARM processors. Check the Keil Device Database® on www.keil.com/dd for the complete list which is also included in MDK: In μVision, select Project/Select Device for target…
Linux: ARM processors running Linux, Android and bare metal are supported by ARM DS-5™. www.arm.com/ds5.
Keil MDK-Lite™ is a free evaluation version that limits code size to 32 Kbytes. Nearly all Keil examples will compile within this 32K limit. The addition of a valid license number will turn it into a commercial version. MDK-Freescale is a one year renewable license for Kinetis processors and costs US$ 745 including technical support.
Middleware: MDK Professional contains middleware libraries including TCP/IP stack, CAN drivers, a Flash file system and USB drivers. Contact Keil sales for information regarding middleware for your processor: www.keil.com/arm/mdk.asp.
RTX RTOS: All variants of MDK contain the full version of RTX with Source Code. See www.keil.com/rl-arm/kernel.asp.
Why Use Keil MDK ? MDK provides these features particularly suited for Cortex-M users:
1. µVision IDE with Integrated Debugger, Flash programmer and the ARM® Compiler and assembler toolkit. MDK is a complete turn-key tool solution that runs out-of-the-box.
2. A full feature Keil RTOS called RTX is included with MDK. RTX comes with a BSD type license. Source code is provided. See www.arm.com/cmsis.
3. All applicable ARM debugging technology is supported.
4. RTX Kernel Awareness window. It is updated in real-time.
5. MQX: An MQX port for MDK is available including Kernel Awareness windows. See www.keil.com/freescale.
6. Available Debug Adapters: ULINK™2, ULINK-ME, ULINKpro, OpenSDA (CMSIS-DAP) and P&E.
7. Kernel Awareness is available for Keil RTX and Freescale MQX. Many other RTOSs are compatible with MDK.
8. Keil Technical Support is included for one year and is easily renewable. Your project will get completed faster.
9. MDK includes board support for Kinetis Cortex-M0+ and Cortex-M4 processors on Tower and Freedom boards.
This document includes details on these features plus more:
1. Real-time Read and Write to memory locations for Watch, Memory. These are non-intrusive to your program. No CPU cycles are stolen. No instrumentation code is added to your source files.
2. Two Hardware Breakpoints (can be set/unset on-the-fly) and two Watchpoints (also known as Access Breaks).
3. RTX and RTX Tasks window: a kernel awareness program for RTX that updates while your program is running.
4. A DSP example program using ARM CMSIS-DSP libraries
5. Serial Wire Viewer (SWV). To use SWV you will need a debug adapter such as any Keil ULINK or a J-Link.
ETM Instruction Trace: A ULINKpro is needed to capture ETM trace. See the Kinetis K60 lab: www.keil.com/freescale
Open SDA: (CMSIS-DAP): OpenSDA currently supports all CoreSight features except Serial Wire Viewer data trace and ETM instruction trace. The first part of this lab uses OpenSDA. The second part uses a ULINK2 and provides Serial Wire Viewer. For ETM Instruction Trace using ULINKpro, see the Tower K60 lab: www.keil.com/appnotes/docs/apnt_243.asp.
The latest version of this document is here: www.keil.com/appnotes/docs/apnt_243.asp

Copyright © 2012 ARM Ltd. All rights reserved
Freescale Cortex-M0+ Lab with ARM® Keil™ MDK toolkit www.keil.com
2
Index:
1. Freescale Evaluation Boards & Keil Evaluation Software: 3
2. Keil Software Installation: 3
3. CoreSight Definitions: 4
4. CMSIS: Cortex Microcontroller Software Interface Standard 4
5. Debug Adapter Summary for Keil MDK with µVision IDE: 4
Example Projects using the OpenSDA CMSIS-DAP Debug Adapter:
6. Configuring OpenSDA for µVision: 5
7. Blinky example using the Freedom K20D50M and OpenSDA: 6
8. Hardware Breakpoints: 6
9. Call Stack & Locals window: 7
10. Watch and Memory windows and how to use them: 8
11. How to view Local Variables in Watch and Memory windows: 9
12. Watchpoints: Conditional Breakpoints: 10
13. RTX_Blinky: Keil RTX RTOS example: 11
14. RTX Tasks and System Kernel Aware Window: 12
15. DSP Sine Example using ARM CMSIS-DSP Libraries 13
Example Projects using Serial Wire Viewer (SWV) ULINK2, ULINK-ME or ULINKpro:
16. Serial Wire Viewer (SWV) Data Trace and Hardware Modifications: 14
17. Display the Variable counter using SWV: 15
18. Exception (including Interrupt) Display using SWV: 16
19. PC Samples and Data Write Addresses using SWV: 17
20. ITM printf using SWV: 18
21. RTX Kernel Awareness using SWV: 19
22. Logic Analyzer (LA) to View Variables Graphically in real-time: 20
23. DSP Example using SWV: 21
24. Signal Timings Techniques in LA: 22
25. RTX Event Viewer using SWV: 23
26. RTX Event Viewer Timing Techniques using SWV: 24
27. Trace Configuration Field Descriptions: 25
28. Creating Your Own µVision Project from Scratch: 27
29. Creating a New Target Options Configuration: 29
Using Keil ULINK Debug Adapters:
30. Configure µVision for OpenSDA (CMSIS-DAP compliant) Debug Adapter: 30
31. Configure µVision for a Keil ULINK2 or ULINK-ME: 31
32. Configure µVision for a Keil ULINKpro: 32
33. Kinetis data and Instruction Trace Summary: 33
34. Useful Documents: 33
35. Keil Products and Contact information: 34

Copyright © 2012 ARM Ltd. All rights reserved
Freescale Cortex-M0+ Lab with ARM® Keil™ MDK toolkit www.keil.com
3
Using this document: 1. The latest version of this document and the necessary example source files are available here:
www.keil.com/appnotes/docs/apnt_243.asp
2. You do not need any debug adapters: just the Freedom board, a USB cable and MDK installed on your PC. Configuring OpenSDA starts on page 5. If using OpenSDA, you must complete Step 1 on page 5 to program the OpenSDA processor U6 with the file CMSIS-DAP.S19.
3. OpenSDA (CMSIS-DAP) is used by default in this document. A ULINK2, ULINK-ME or a ULINKpro are used for the Serial Wire Viewer exercises. Most examples are preconfigured for these adapters.
1) Freescale Evaluation Boards & Keil Evaluation Software: Keil provides board support for Kinetis Cortex-M0+ and Cortex-M4 processors. They include KwikStik, Tower K20, K40, K53, K60, K70 and KL25Z (both Tower and Freedom boards). For Vybrid and i.MX series see ARM DS-5. Example Programs: Keil provides example programs. See C:\Keil\ARM\Boards\Freescale\ for the board support files.
\RL consists of Flash File examples. Such middleware is a component of MDK Professional. To run these examples a full license is needed. Please contact Keil sales for a temporary license if you want to evaluate Keil middleware.
MDK supports Freescale MQX and includes awareness windows. See www.keil.com/freescale for an informative video.
SWD Connector J6: The production version of the Freedom board might not include all hardware features such as various connectors. To use a ULINK adapter you will need to obtain a Samtec 2x5 connector FTSH-105-01-F-D (add –K for shroud). It is easily soldered on J6. Any ULINK will now connect and operate. Otherwise use OpenSDA with only a USB cable. SWD (Serial Wire Debug) is a two wire alternative to the standard JTAG connection.
2) Keil Software Installation: This document was written using Keil MDK 4.72 which contains µVision 4. The evaluation copy of MDK (MDK-Lite) is available free on the Keil website. Do not confuse µVision 4 with MDK 4.0. The number “4” is a coincidence.
MDK 4.72 is the current official Keil release. July 2013
To obtain a copy of MDK go to www.keil.com/freescale and select the “Download” icon located on the right side.
1. Install MDK into the default directory C:. You can install MDK into any directory, but this lab references C:\.
2. Obtain the example programs from www.keil.com/appnotes/docs/apnt_243.asp and extract them into C:\Keil\ARM\Boards\Freescale\. A directory FRDM-K20D50M will be created containing the example files in sub-directories Blinky, RTX_Blinky, OpenSDA and DSP. A later version of MDK 4.72 will contain updated example files except for the DSP example and CMSIS-DAP.S19.
You can use the evaluation version of MDK-Lite and OpenSDA (CMSIS-DAP) or a ULINK2, ULINK-ME, ULINKpro for this lab. Keil supports P&E OSJTAG but this was not tested at this time. OpenSDA is a good choice to use. A Keil ULINK or Segger J-Link provides Serial Wire Viewer (SWV) support. This is documented in this lab starting on page 14.
OpenSDA: OpenSDA is Freescale’s name for ARM’s CMSIS-DAP. Essentially this is an ARM standard that specifies an on-board debug adapter. The Freedom boards incorporate CMSIS-DAP.
The Freescale Vybrid board (Cortex-A5 + Cortex-M4) also has CMSIS-DAP to use with ARM DS-5 toolchain. Vybrid and i.MX (including i.MX6) support is available today. See www.arm.com/ds5
Keil ULINK2 connected to the optional SWD J6 connector. A ULINK2 provides Serial Wire Viewer.
A ULINKpro adds ETM Instruction Trace.

Copyright © 2012 ARM Ltd. All rights reserved
Freescale Cortex-M0+ Lab with ARM® Keil™ MDK toolkit www.keil.com
4
3) CoreSight Definitions: It is useful to have a basic understanding of these terms:
Kinetis Cortex-M4 processors have all these features except MTB. Only the Cortex-M0+ has MTB instruction trace.
JTAG: Provides access to the CoreSight debugging module located on the Cortex processor. It uses 4 to 5 pins.
SWD: Serial Wire Debug is a two pin alternative to JTAG and has about the same capabilities except for no Boundary Scan. SWD is referenced as SW in the µVision Cortex-M Target Driver Setup. See page 6, 2nd screen. The SWJ box must be selected. The Freedom boards use SWD exclusively. The KL25 does not have JTAG.
SWV: Serial Wire Viewer: A trace capability providing display of reads, writes, exceptions, PC Samples and printf. SWV must use SWD because of the TDIO conflict described in SWO below.
DAP: Debug Access Port. A component of the ARM CoreSight debugging module that is accessed via the JTAG or SWD port. One of the features of the DAP are the memory read and write accesses which provide on-the-fly memory accesses without the need for processor core intervention. µVision uses the DAP to update memory, watch and RTOS kernel awareness windows in real-time while the processor is running. You can also modify variable values on the fly. No CPU cycles are used, the program can be running and no code stubs are needed in your sources. The Freedom boards normally do not have JTAG. They operate nicely with SWD. You do not need to configure or activate DAP. µVision does this automatically when you select the function.
SWO: Serial Wire Output: SWV frames usually come out this one pin output. It shares the JTAG signal TDIO.
Trace Port: A 4 bit port that ULINKpro uses to collect ETM frames and optionally SWV (rather than SWO).
ETM: Embedded Trace Macrocell: Provides all the program counter values. Only ULINKpro provides ETM. See the Kinetis K60 lab at www.keil.com/appnotes/docs/apnt_239.asp for information about ETM.
MTB: Micro Trace Buffer. A portion of the device internal RAM is used for an instruction trace buffer. Only on KL25 Cortex-M0+ processors. Kinetis Cortex-M4 processors provide ETM trace.
4) CMSIS: Cortex Microcontroller Software Interface Standard ARM CMSIS-DSP libraries are currently offered for all Cortex-M0, Cortex-M3 and Cortex-M4 processors.
CMSIS-RTOS provides standard APIs for RTOSs. RTX is a free RTOS available from ARM as part of CMSIS Version 3.0.
CMSIS-DAP is a new ARM standard for on-board debugging adapters. An external adapter such as a ULINK2 is not needed for most debugging applications. The Freescale Kinetis KL25Z and K20D50M Freedom boards support CMSIS-DAP. The ARM/Keil component of Freescale OpenSDA is CMSIS-DAP compliant. SDA is an acronym for “Serial Debug Adapter”.
See www.arm.com/cmsis and www.onarm.com/cmsis/download/ for more information on these standards.
5) Debug Adapter Summary for Keil MDK with µVision IDE: CMSIS-DAP: Freescale’s implementation is called OpenSDA. The debug adapter is a K20 ARM Cortex-M4 processor incorporated on the Freedom and Tower KL25Z boards. It connects to your PC with a standard USB cable. No external hardware is needed. A hex file needs to be programmed into the K20 Flash. This file is CMSIS-DAP.S19 or DAP32.SDA. Instructions are provided on the next page.
Provides run control debugging, Flash and RAM programming, Watchpoints, hardware breakpoints, and DAP reads and writes in Watch and memory windows updated in real-time as well as MTB trace. RTX System kernel awareness for the ARM RTX RTOS is provided. All ULINK devices provide these features plus more depending on the processor involved.
ULINK2: Pictured on page 3. This is a hardware JTAG/SWD debugger. It connects to various connectors found on boards populated with ARM processors. Provides all the features of CMSIS-DAP. With Kinetis Cortex-M4 processors, ULINK2 adds Serial Wire Viewer (SWV). See the Kinetis lab on www.keil.com/freescale for examples using SWV and ETM.
ULINK-ME: Pictured on page 23. ULINK-ME is provided only combined with a board package from Keil or an OEM. Electrically and functionally it is very similar to a ULINK2. With Keil µVision, they are used as equivalents.
ULINKpro: Pictured on Page 24. ULINKpro is Keil’s most advanced debug adapter. With Freescale Kinetis Cortex-M4 processors, ULINKpro provides Serial Wire Viewer (SWV) and adds ETM instruction trace. Code Coverage, Performance Analysis and Execution Profiling are then provided using ETM. ULINKpro provides the fastest Flash programming speeds.
P&E Micro: Keil µVision supports P&E OpenSDA. OSJTAG drivers V1.06 or later need to be installed in µVision. See www.keil.com/download/docs/408.asp for the file FslKinetisDriversV106.exe. P&E was not tested for this document but will be done in a later version. The current P&E SDA file for the K20 Flash is DEBUG-APP-V004.SDA.

Copyright © 2012 ARM Ltd. All rights reserved
Freescale Cortex-M0+ Lab with ARM® Keil™ MDK toolkit www.keil.com
5
6) Using the CMSIS-DAP Debug adapter: Configuring OpenSDA for µVision: It is easy to select a debug adapter in µVision. You must configure the connection to both the target and to Flash programming in two separate windows as described below. They are selected using the Debug and Utilities tabs.
The SWD connector J6 is used to program and control U9 K20 with an external debug adapter. The other SWD connector J8 labelled SDA (Serial Debug Adapter) is used to program the on-board K20 U6. You will not need J8 for this lab.
When using OpenSDA, the target connection by µVision will be via a standard USB cable connected SDA. The on-board Kinetis K20 U6 acts as the debug adapter. J6 SWD is used only with an external debug adapter. See page 14.
You can also use a ULINK2, ULINK-ME or ULINKpro with suitable adjustments. See the Page 30-32 for instructions.
Step 1 MUST be done ! at least once… These instructions tell how to connect µVision to the K20 OpenSDA processor CoreSight debugging port via USB. The on-board K20 U6 will now be programmed to act as a debug adapter for SWD:
Step 1: Program the K20 with the CMSIS-DAP app CMSIS-DAP.S19:
1. Hold RESET button SW1 down and connect a USB cable to SDA as shown here:
2. When you hear the USB dual-tone, release RESET.
3. The green led D4 will blink about once per second. The K20 is now ready to be programmed with the CMSIS-DAP application file CMSIS-DAP.S19.
4. The K20 will act as a USB mass storage device connected to your PC called
BOOTLOADER. It already contains some files.
5. Locate the file CMSIS-DAP.S19 using Windows Explorer. It is part of the example software that came with this document. It should have been extracted to C:\Keil\ARM\Boards\Freescale\FRDM-K20D50M\OpenSDA\.
6. This must be copied into the K20 Flash with the next step.
7. Copy and paste or drag and drop CMSIS-DAP.S19 into the K20 device directory and visible as shown:
8. Cycle the power to the Freedom board. The green led will blink once and then stay off if the programming is successful. The K20 is waiting for µVision to connect to it with CMSIS-DAP.
Green LED Status:
Blinks once every second or so: K20 is in programming mode to receive the CMSIS-DAP.S19.
Blinks once when power is applied: CMIS-DAP.S19 is programmed into the K20 CMSIS-DAP controller. The K20 is waiting connection to µVision.
On: Successful CMSIS-DAP connection to µVision by entering Debug mode. µVision is in Debug mode and connected to the KL25 debug port SWD. Remember, JTAG is not used with this board.
TIP: This application will remain in the K20 Flash each time the board power is cycled with RESET off. The next time board is powered with RESET held on, it will be erased. CMSIS-DAP.S19 is the CMSIS application in Motorola S record format that loads and runs on the K20 U6 OpenSDA compliant debug adapter.
Step 2: Testing the CMSIS-DAP Connection:
1. Start µVision by clicking on its icon. 2. The Freedom board will still be connected to your PC with a USB cable a shown above. 3. The green LED D4 must blink once when USB is connected and then be off indicating it is ready to be connected.
4. Select Target Options and select the Debug tab as shown here: 5. Select CMSIS-DAP Debugger as shown. Select the Settings: box. 6. In the SW Device area, a valid IDCODE must be displayed. A
Device Name such as ARM CoreSight SW-DP must be displayed. 7. If these are not displayed, µVision does not see the ARM core. 8. Check all cables or repeat the programming instructions above.
TIP: If you need to configure these settings for any other debug adapter or a different board or processor, see directions starting on page 31.

Copyright © 2012 ARM Ltd. All rights reserved
Freescale Cortex-M0+ Lab with ARM® Keil™ MDK toolkit www.keil.com
6
7) Blinky example program using the Freedom K20D50M and OpenSDA: 1. Now we will connect a Keil MDK development system using the Freedom board and OpenSDA as the debug
adapter. OpenSDA is Freescale’s implementation of CMSIS-DAP. Your board must have the application CMSIS-DAP.S19 programmed into the OpenSDA processor before you can continue. See Step 1 on page 5.
2. Connect a USB cable between your PC and Freedom USB J7 as shown here: The green LED should briefly blink once.
3. Start µVision by clicking on its desktop icon if it is not already running.
4. Select Project/Open Project.
5. Open the µVision project file: C:\Keil\ARM\Boards\Freescale\FRDM-K20D50M\Blinky\Blinky.uvproj.
6. Select “CMSIS-DAP - Flash” in the Select Target menu. This is where you create and select different target configurations such as to execute a program in RAM or Flash. This Target selection is pre-configured to use OpenSDA (CMSIS-DAP) which includes a Flash programmer.
7. Compile the source files by clicking on the Rebuild icon. . You can also use the Build icon beside it.
8. Program the K20 Flash by clicking on the Load icon: Progress will be indicated in the Output Window.
TIP: If you get an error this probably means the Freedom board is not programmed with CMSIS-DAP.S19. Refer to page 5 Step 1) for instructions.
9. Enter Debug mode by clicking on the Debug icon. Select OK if the Evaluation Mode box appears. Note: You only need to use the Load icon to download to FLASH and not for RAM operation if it is chosen.
10. Click on the RUN icon. Note: you stop the program with the STOP icon.
The green and red LED D3 will blink on the Freedom board. The blue LED stays on.
Now you know how to compile a program, program it into the K20 processor Flash, run it and stop it ! Note: The board will start Blinky stand-alone. Blinky is now permanently programmed in the Flash until reprogrammed.
8) Hardware Breakpoints: The K20D has six hardware breakpoints that can be set or unset on the fly while the program is running.
1. With Blinky running, in the Blinky.c window, click on a darker block in the left margin in either the disassembly or an appropriate source window. Inside the while loop inside the main() function is best near lines 89 to 95.
2. A red circle will appear and the program will presently stop.
3. Note the breakpoint is displayed in both the Disassembly and source windows as shown here:
4. Every time you click on the RUN icon the program will run until the breakpoint is again encountered.
5. Remove the breakpoint by clicking on it or selecting Ctrl-B, Kill All and then Close.
6. Clicking in the source window will indicate the appropriate code line is the Disassembly window and vice versa. This is relationship indicated by the cyan arrow as shown at Line 90:
7. Your line numbers might be slightly different depending on compiler optimization levels.
TIP: A hardware breakpoint does not execute the instruction it is lands on. ARM CoreSight hardware breakpoints are no-skid. This is a rather important feature.

Copyright © 2012 ARM Ltd. All rights reserved
Freescale Cortex-M0+ Lab with ARM® Keil™ MDK toolkit www.keil.com
7
9) Call Stack + Locals Window: Local Variables: The Call Stack and Locals windows are incorporated into one integrated window. Whenever the program is stopped, the Call Stack + Locals window will display call stack contents as well as any local variables belonging to the active function.
If possible, the values of the local variables will be displayed and if not the message <not in scope> will be displayed. The Call + Stack window presence or visibility can be toggled by selecting View/Call Stack Window in the main µVision window when in Debug mode.
1. Set a breakpoint in the while loop in main(). Run Blinky. It will soon stop on this breakpoint.
2. Click on the Call Stack + Locals tab if necessary to open it. This window is shown here:
3. The contents of the local variables are displayed as well as function names.
4. In this example, two local variables num and dir are displayed in the window here with their values:
5. Click on the Step In icon or F11: until the program enters the Delay function. The Call Stack + Locals window will now show Delay:
6. Click on the StepOut icon or CTRL-F11 to exit all function(s) to return to main().
7. When you ready to continue, remove the hardware breakpoint by clicking on its red circle ! You can also type Ctrl-B and select Kill All and then Close.
TIP: You can modify a variable value in the Call Stack & Locals window when the program is stopped.
TIP: This is standard “Stop and Go” debugging. ARM CoreSight debugging technology can do much better than this. You can display global and static variables or structures updated in real-time in the Watch or Memory windows while the program is running. No additions or changes to your code are required. Local variable update while the program is running is not possible with local variables because this type of variable is usually stored in a CPU register.
Call Stack: The list of stacked functions is displayed when the program is stopped as you have seen. This is useful when you need to know which functions have been called and are stored on the stack. A breakpoint was set in the SysTick_Handler function near line 26 in Blinky.c and this event is clearly shown at the top of this window:
As you click on the StepOut icon each function will be removed as it comes off the stack until you are left with only main().
Do not forget to remove the hardware breakpoints before continuing.
TIP: You can access the Hardware Breakpoint table by clicking on Debug/Breakpoints or Ctrl-B. This is also where Watchpoints (also called Access Points) are configured. You can temporarily disable entries in this table by unchecking them.

Copyright © 2012 ARM Ltd. All rights reserved
Freescale Cortex-M0+ Lab with ARM® Keil™ MDK toolkit www.keil.com
8
10) Watch and Memory Windows and how to use them: The Watch and Memory windows will display updated variable values in real-time. It does this using the ARM CoreSight debugging technology that is part of Cortex-M processors. It is also possible to “put” or insert values into the Memory window in real-time. You enter a variable with a right click on a variable and select Add varname to.. and select the appropriate window. You can also “drag and drop” variable names into windows or enter them manually.
Watch window: Add a global variable: Recall the Watch and Memory windows can’t see local variables unless stopped in their function.
1. Stop the processor and exit debug mode.
2. Declare a global variable (I called it counter) near line 18 in Blinky.c like this: unsigned int counter = 0;
3. Add the statements near Line 95 just after the second Delay(500);
counter++;
if (counter > 0xF) counter = 0;
4. Click on Rebuild and program the Flash with Load .
5. Enter Debug mode. Click on RUN . You can configure a Watch window while the program is running. You can also do this with a Memory window.
6. Select View and select Periodic Window Update if necessary:
7. Right click on the variable counter and select Add ‘counter’ to … and select Watch 1. The Watch 1 window will open if not already open.
8. counter will be displayed as shown here:
9. counter will update in real time.
TIP: You can also enter a variable manually by double-clicking <Enter expression> or press F2 and use copy and paste or typing the variable name.
TIP: To Drag ‘n Drop into a tab that is not active, pick up the variable and hold it over the tab you want to open; when it opens, move your mouse into the window and release the variable.
Memory window: 1. Right click on counter and select Add counter to … and select Memory 1 . Memory 1 will open if necessary.
2. Note the value of counter is displaying its address in Memory 1 as if it is a pointer. This is useful to see what address a pointer is pointing to but this not what we want to see at this time.
3. Add an ampersand “&” in front of the variable name and press Enter. The physical address is shown (0x1FFF_E004). This address can change depending on compiler optimization settings.
4. Right click in the memory window and select Unsigned/Int.
5. The data contents of counter is displayed as shown here:
6. Both the Watch and Memory windows are updated in real-time.
7. Right-click with the mouse cursor over the desired data field and select Modify Memory. You can change a memory or variable on-the-fly while the program is still running.
TIP: No CPU cycles are used to perform these operations. See the next page for an explanation how this works.
TIP: To view variables and their location use the Symbols window. Select View/Symbols Window while in Debug mode.
These Read and Write accesses are handled by the Serial Wire Debug (SWD) connection via the CoreSight Debug Access Port (DAP), which provides on-the-fly memory accesses.

Copyright © 2012 ARM Ltd. All rights reserved
Freescale Cortex-M0+ Lab with ARM® Keil™ MDK toolkit www.keil.com
9
11) How to view Local Variables in the Watch or Memory windows: 1. Make sure Blinky.c is running. We will use the local variable num
2. Locate where the local variable num is declared in Blinky.c near line 76, at the start of the main() function.
3. Enter num into Watch 1 window by right clicking on it and selecting Add num to.... Note it says “cannot evaluate” because µVision cannot access the CPU registers while running which is where counter is located.
4. Set a breakpoint in the while loop in main(). The program will stop and a valid value for num will now be displayed. The only time a value will be displayed is if the program happens to stop in the while loop in main() where num is in scope. Most of the time the program is executing the Delay function.
TIP: Remember: you can set and unset hardware breakpoints on-the-fly in the Cortex-M while the program is running !
5. µVision is unable to determine the value of num when the program is running because it exists only when main is running. It disappears in functions and handlers outside of main. num is a local or automatic variable and this means it is probably stored in a CPU register which µVision is unable to access during run time.
6. Remove the breakpoint and make sure the program is not running . Exit Debug mode.
How to view local variables updated in real-time: All you need to do is to make num static where it is declared in Blinky.c !
1. In the declaration for num add the static keyword like this: int main (void) {
static int num = -1;
int dir = 1;
TIP: You can edit files in edit or debug mode. However, you can compile them only in edit mode.
2. Compile the source files by clicking on the Rebuild icon . They will compile with no errors or warnings.
3. To program the Flash, click on the Load icon. . A progress bar will be displayed at the bottom left.
TIP: To program the Flash automatically when you enter Debug mode select Target Options , select the Utilities tab and select the “Update Target before Debugging” box.
4. Enter Debug mode.
5. Click on RUN.
6. num is now updated in real-time. This is ARM CoreSight technology working.
TIP: You can modify num in the Memory window while the program is running.
7. Stop the processor for the next step.
TIP: View/Periodic Window Update must be selected. Otherwise variables update only when the program is stopped.
How It Works: µVision uses ARM CoreSight technology to read or write memory locations without stealing any CPU cycles. This is nearly always non-intrusive and does not impact the program execution timings. Remember the Cortex-M3 is a Harvard architecture. This means it has separate instruction and data buses. While the CPU is fetching instructions at full speed, there is plenty of time for the CoreSight debug module to read or write values without stealing any CPU cycles.
This can be slightly intrusive in the unlikely event the CPU and µVision reads or writes to the same memory location at exactly the same time. Then the CPU will be stalled for one clock cycle. In practice, this cycle stealing never happens.

Copyright © 2012 ARM Ltd. All rights reserved
Freescale Cortex-M0+ Lab with ARM® Keil™ MDK toolkit www.keil.com
10
12) Watchpoints: Conditional Breakpoints The K20 has two Watchpoints. Watchpoints can be thought of as conditional breakpoints. Watchpoints are also referred to as Access Breaks in Keil literature.
1. Use the same Blinky configuration as the previous page. Stop the program if necessary. Stay in debug mode.
2. We will use the global variable counter you created in Blinky.c to explore Watchpoints.
3. Select Debug in the main µVision window and select Breakpoints or press Ctrl-B.
4. Select both the Read and Write Access. Leave the other boxes at default.
5. In the Expression box enter: “counter == 0x5” without the quotes. Click on Define and it will be accepted as shown below:
6. Click on Close.
7. Enter the variable counter to the Watch 1 window by dragging and dropping it if it is not already there.
8. Click on RUN. .
9. You will see counter change in the Watch window.
10. When value equals 0x5, the Watchpoint will stop the program.
11. There are other types of expressions you can enter and are detailed in the Help button in the Breakpoints window.
12. To repeat this exercise, click on RUN a few times to get past the trigger or change counter to something other than 0x05 in the Watch window and click on RUN.
13. Leave the Watchpoint defined.
14. Exit Debug mode .
TIP: You cannot set Watchpoints on-the-fly while the program is running like you can with hardware breakpoints.
TIP: To edit a Watchpoint, double-click on it in the Breakpoints window and its information will be dropped down into the configuration area. Clicking on Define will create another Watchpoint. You should delete the old one by highlighting it and click on Kill Selected or try the next TIP:
TIP: The checkbox beside the expression allows you to temporarily unselect or disable a Watchpoint without deleting it.
TIP: Raw addresses can also be entered into the Watchpoint. An example is: *((unsigned long *)0x20000004)

Copyright © 2012 ARM Ltd. All rights reserved
Freescale Cortex-M0+ Lab with ARM® Keil™ MDK toolkit www.keil.com
11
13) RTX_Blinky Example Program with Keil RTX RTOS: Keil provides RTX, a full feature RTOS. RTX comes with a BSD type license. RTX is included as part of Keil MDK including source. It can have up to 255 tasks and no royalty payments are required. This example explores the RTX RTOS project. MDK will work with any RTOS. An RTOS is just a set of C functions that gets compiled with your project. .
1. With µVision in Edit mode (not in debug mode): Select Project/Open Project.
2. Open the file C:\Keil\ARM\Boards\Freescale\FRDM-K20D50M\RTX_Blinky\Blinky.uvproj.
3. Select the debug adapter you are using. This exercise uses CMSIS-DAP - Flash.
4. Compile the source files by clicking on the Rebuild icon. . They will compile with no errors or warnings.
5. To program the Flash manually, click on the Load icon. . A progress bar will be at the bottom left.
6. Enter the Debug mode by clicking on the debug icon and click on the RUN icon.
7. The red LED will blink when each of the four tasks starts running. This example represents a stepper motor driver.
8. Click on STOP .
The Configuration Wizard for RTX:
1. Click on the RTX_Conf_CM.c source file tab as shown below on the left. You can open it with File/Open if needed.
2. Click on the Configuration Wizard tab at the bottom and your view will change to the Configuration Wizard.
3. Open up the individual directories to show the various configuration items available.
4. See how easy it is to modify these settings here as opposed to finding and changing entries in the source code.
5. Changing an attribute in one tab changes it in the other automatically. You should save a modified window.
6. You can create Configuration Wizards in any source file with the scripting language as used in the Text Editor.
7. See www.keil.com/support/docs/2735.htm for instructions on how to add this feature to your own source code.
8. This scripting language is shown below in the Text Editor as comments starting such as a </h> or <i>.
9. The µVision System Viewer windows are created in a similar fashion. Select View/System Viewer.
Text Editor: Source Code Configuration Wizard

Copyright © 2012 ARM Ltd. All rights reserved
Freescale Cortex-M0+ Lab with ARM® Keil™ MDK toolkit www.keil.com
12
14) RTX Kernel Awareness using RTX Viewer Users often want to know the number of the current operating task and the status of the other tasks. This information is usually stored in a structure or memory area by the RTOS. Keil provides two task aware windows for RTX. You can view only one with OpenSDA as the Event Viewer needs SWV. Other RTOS companies also provide awareness plug-ins for µVision. µVision has an extensive kernel awareness windows for MQX. See www.keil.com/freescale/ for a video.
1. Run RTX_Blinky by clicking on the Run icon.
2. Open Debug/OS Support and select RTX Tasks and System and the window below opens up. You might have to grab the window and move it into the center of the screen. Note these values are updating in real-time using the same technology as used in the Watch and Memory windows.
3. Select View and select Periodic Window Update if these values do not change:
You will not have to stop the program to view this data. No CPU cycles are used. Your program runs at full speed. No instrumentation code needs to be inserted into your source.
Demonstrating States:
Blinky.c contains four tasks. Task 1 (phaseA) is shown below:
1. The gray areas opposite the line numbers indicate there is valid assembly code located here.
2. Set a breakpoint on one of these in Task 1as shown: (but not on the for (;;;) line)
3. Set a breakpoint in each of the other three tasks at a similar location.
4. Click on RUN .
5. When the program stops, this information will be updated in the RTX Tasks window. The Task running when the program stopped will be indicated with a “Running” state. Most of the time the CPU is executing the os_idle_demon.
6. Remove the breakpoints and close the RTX Tasks window. You can use Ctrl-B, Kill All and then Close.
7. Exit Debug mode.
TIP: The other RTX window, Event Viewer needs Serial Wire Viewer (SWV) to operate. CMSIS-DAP does not support SWV. You need any Keil ULINK or a Segger J-link (black case V 6 or later) to see SWV working.

Copyright © 2012 ARM Ltd. All rights reserved
Freescale Cortex-M0+ Lab with ARM® Keil™ MDK toolkit www.keil.com
13
15) DSP SINE example using ARM CMSIS-DSP Libraries: ARM CMSIS-DSP libraries are offered for Cortex-M0, Cortex-M3 and Cortex-M4 processors. DSP libraries are provided in MDK in C:\Keil\ARM\CMSIS. README.txt describes the location of various CMSIS components. For more information see www.arm.com/cmsis and www.onarm.com/cmsis/download/ . CMSIS is an acronym for Cortex Microcontroller Software Interface Standard.
This example creates a sine wave with noise added, and then the noise is filtered out.
This example incorporates Keil RTX RTOS. RTX is available free with a BSD type license. Source code is provided.
To obtain this example file, go to www.keil.com/appnotes/docs/apnt_243.asp and copy it into C:\Keil\ARM\Boards\Freescale\FRDM-K20D50M. A \DSP directory will be created.
1. Stop the program and exit Debug mode if necessary.
2. Open the project file sine: C:\Keil\ARM\Boards\Freescale\FRDM-K20D50M\DSP\sine.uvproj.
3. Select CMSIS-DAP or CMSIS-DAP Flash:
4. Build the files. There will be no errors or warnings.
5. Program the K20 flash by clicking on the Load icon: Progress will be indicated in the Output Window.
6. Enter Debug mode by clicking on the Debug icon. Select OK if the Evaluation Mode box appears.
7. Click on the RUN icon.
8. Open Watch 1 by selecting View/Watch/Watch 1 if necessary.
9. Four global variables will be displayed in Watch 1 as shown here: They will update in real time indicating the DSP example is running.
10. The Kinetis Cortex-M4 processors have Serial Wire Viewer (SWV). The four waveforms will be displayed in the Logic Analyzer as shown below. CMSIS-DAP does not yet have SWV so this screen is shown for reference only. You can see the four global variables graphed: If you have any ULINK you can see this waveform. See pages 22 through 25 to see Serial Wire Viewer working with a ULINK2 or ULINKpro and this DSP example.
TIP: Raw addresses can also be entered into the Logic Analyzer. An example is: *((unsigned long *)0x20000004)
This is the end of the exercises using OpenSDA. You can use a ULINK2, ULINK-ME or a ULINKpro for these exercises, but you must select it in the Target selector box. Two simple hardware modifications must be made as described on the next page to connect an external debug adapter.
If you have any ULINK or a Segger J-Link (black box) you can do the Serial Wire Viewer (SWV) exercises that follow.
Global DSP Variables Displayed with Serial Wire Viewer and ULINK2 or ULINKpro.
Copyright © 2012 ARM Ltd. All rights reserved
Freescale Cortex-M0+ Lab with ARM® Keil™ MDK toolkit www.keil.com
14
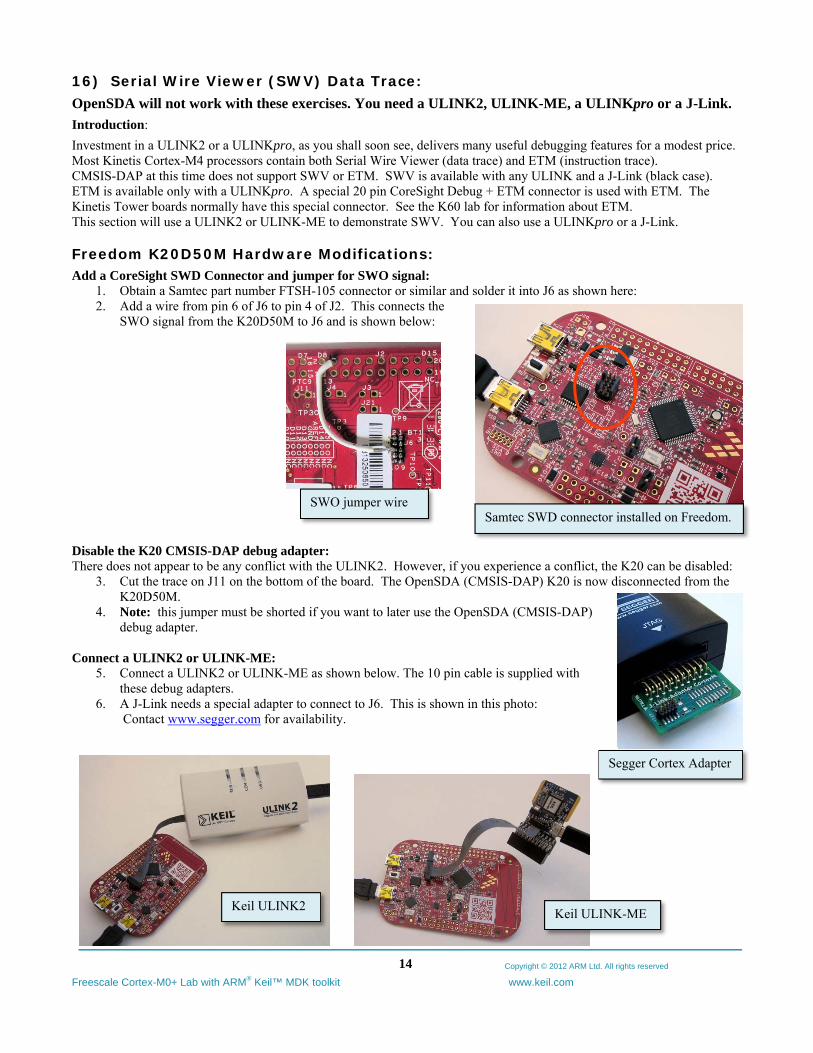
Segger Cortex Adapter
SWO jumper wire Samtec SWD connector installed on Freedom.
16) Serial Wire Viewer (SWV) Data Trace: OpenSDA will not work with these exercises. You need a ULINK2, ULINK-ME, a ULINKpro or a J-Link.
Introduction:
Investment in a ULINK2 or a ULINKpro, as you shall soon see, delivers many useful debugging features for a modest price. Most Kinetis Cortex-M4 processors contain both Serial Wire Viewer (data trace) and ETM (instruction trace). CMSIS-DAP at this time does not support SWV or ETM. SWV is available with any ULINK and a J-Link (black case). ETM is available only with a ULINKpro. A special 20 pin CoreSight Debug + ETM connector is used with ETM. The Kinetis Tower boards normally have this special connector. See the K60 lab for information about ETM. This section will use a ULINK2 or ULINK-ME to demonstrate SWV. You can also use a ULINKpro or a J-Link. Freedom K20D50M Hardware Modifications: Add a CoreSight SWD Connector and jumper for SWO signal:
1. Obtain a Samtec part number FTSH-105 connector or similar and solder it into J6 as shown here: 2. Add a wire from pin 6 of J6 to pin 4 of J2. This connects the
SWO signal from the K20D50M to J6 and is shown below: Disable the K20 CMSIS-DAP debug adapter: There does not appear to be any conflict with the ULINK2. However, if you experience a conflict, the K20 can be disabled:
3. Cut the trace on J11 on the bottom of the board. The OpenSDA (CMSIS-DAP) K20 is now disconnected from the K20D50M.
4. Note: this jumper must be shorted if you want to later use the OpenSDA (CMSIS-DAP) debug adapter.
Connect a ULINK2 or ULINK-ME:
5. Connect a ULINK2 or ULINK-ME as shown below. The 10 pin cable is supplied with these debug adapters.
6. A J-Link needs a special adapter to connect to J6. This is shown in this photo: Contact www.segger.com for availability.
Keil ULINK2 Keil ULINK-ME

Copyright © 2012 ARM Ltd. All rights reserved
Freescale Cortex-M0+ Lab with ARM® Keil™ MDK toolkit www.keil.com
15
17) Displaying the Global Variable counter using Serial Wire Viewer (SWV): In the Blinky example on page 6, you created a variable counter that was displayed in the Watch and Memory windows. This was also used to demonstrate the Watchpoints. It is possible to display a variable in the Logic Analyzer (LA) using SWV. You need to use any ULINLK or a Segger J-Link for SWV. CMSIS-DAP is scheduled to display SWV in late 2013.
1. Prepare the Freedom board as described on the previous page. Connect a ULINK2 or ULINK-ME as shown.
2. Open the µVision project file: C:\Keil\ARM\Boards\Freescale\FRDM-K20D50M\Blinky\Blinky.uvproj.
3. Select ULINK - Flash: If you are using a ULINKpro, select ULINKpro – Flash. If using a Segger J-Link (black case, V6 or later), you must create a new Target.
4. Click on the Target Options icon . Select the Dug tab. Select the Settings: box. Select the Trace tab.
5. Select Trace Enable.
6. Confirm Core Clock: is 41.943040 MHz.
7. Click OK twice to return to the main menu.
8. SWV is now configured.
9. Rebuild the project.
Program the Flash .
10. Enter debug mode .
11. Click on RUN:
12. The variable counter will be updating in the Watch 1 window. If not, add it to Watch 1.
13. Right-click on counter in Blinky.c and select: Add ‘counter’ to… and select Logic Analyzer. The LA will open.
14. In the LA, select Setup.. and highlight counter. Change Display Range Max: to 0xF:
15. Click on Close. The LA window will display counter as shown here:
16. Use All, In and Out in the Zoom box to get Grid of 1 second or so.
17. Select Signal Info, Show Cycles, Amplitude and Cursor.
18. Stop the LA data collection and not the program by selecting Stop in the Update Screen in the LA.
19. Click on the LA to set the cursor and hover your mouse to see the
timings obtained:
20. Select Start in the Update Screen in the LA window.
21. Leave the program running for the next page.
Copyright © 2012 ARM Ltd. All rights reserved
Freescale Cortex-M0+ Lab with ARM® Keil™ MDK toolkit www.keil.com
16
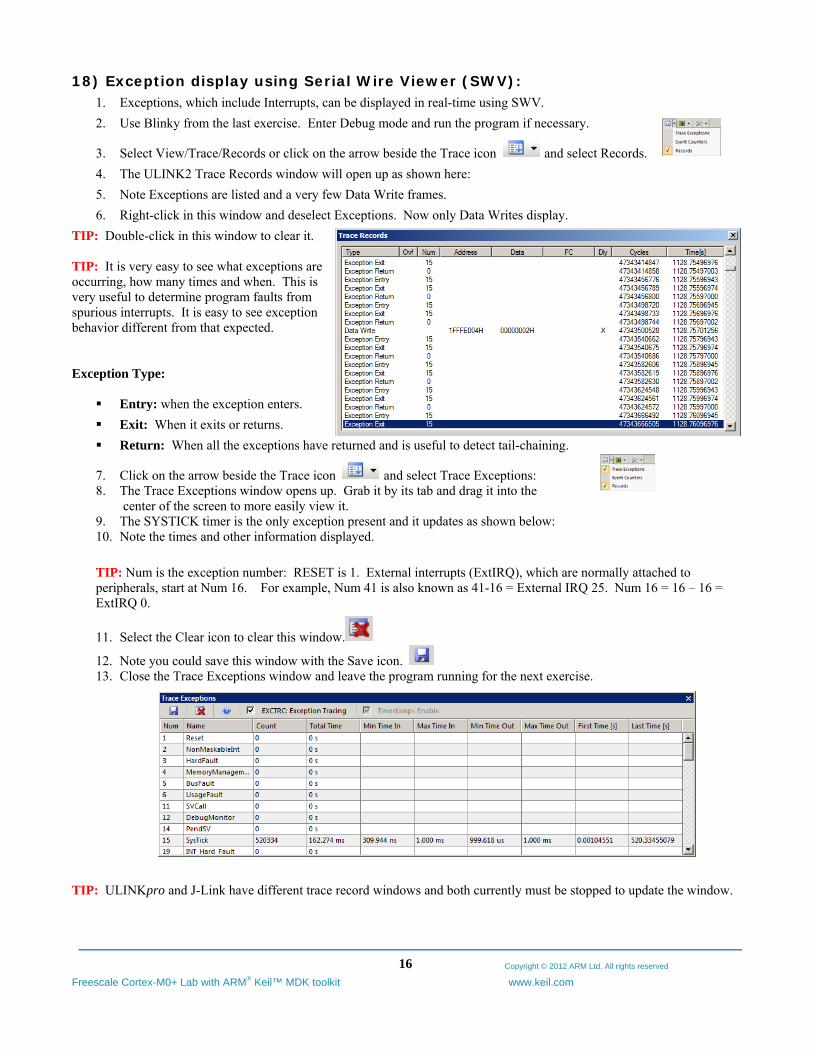
18) Exception display using Serial Wire Viewer (SWV): 1. Exceptions, which include Interrupts, can be displayed in real-time using SWV.
2. Use Blinky from the last exercise. Enter Debug mode and run the program if necessary.
3. Select View/Trace/Records or click on the arrow beside the Trace icon and select Records.
4. The ULINK2 Trace Records window will open up as shown here:
5. Note Exceptions are listed and a very few Data Write frames.
6. Right-click in this window and deselect Exceptions. Now only Data Writes display.
TIP: Double-click in this window to clear it. TIP: It is very easy to see what exceptions are occurring, how many times and when. This is very useful to determine program faults from spurious interrupts. It is easy to see exception behavior different from that expected. Exception Type:
Entry: when the exception enters.
Exit: When it exits or returns.
Return: When all the exceptions have returned and is useful to detect tail-chaining.
7. Click on the arrow beside the Trace icon and select Trace Exceptions: 8. The Trace Exceptions window opens up. Grab it by its tab and drag it into the
center of the screen to more easily view it. 9. The SYSTICK timer is the only exception present and it updates as shown below: 10. Note the times and other information displayed.
TIP: Num is the exception number: RESET is 1. External interrupts (ExtIRQ), which are normally attached to peripherals, start at Num 16. For example, Num 41 is also known as 41-16 = External IRQ 25. Num 16 = 16 – 16 = ExtIRQ 0.
11. Select the Clear icon to clear this window.
12. Note you could save this window with the Save icon. 13. Close the Trace Exceptions window and leave the program running for the next exercise.
TIP: ULINKpro and J-Link have different trace record windows and both currently must be stopped to update the window.

Copyright © 2012 ARM Ltd. All rights reserved
Freescale Cortex-M0+ Lab with ARM® Keil™ MDK toolkit www.keil.com
17
19) PC Samples and Write Addresses using Serial Wire Viewer (SWV): Serial Wire Viewer can display a sampling of the program counter. If you need to see all the PC values, use the ETM trace with a Keil ULINKpro. ETM trace also provides Code Coverage, Execution Profiling and Performance Analysis.
1. Close the Trace Exception window. Leave Trace Records open. 1. Open Debug/Debug Settings and select the Trace tab.
2. Unselect EXCTRC. Select Periodic and On Data R/W Sample in the PC Sampling area.
3. Click on OK twice to return to the main screen.
4. Double-click to clear Trace Records..
5. Click on RUN and this window opens:
6. Most of the PC Samples are near 0x075A which are part of the function Delay().
7. Stop the program and the Disassembly window will show the code in this function:
8. Not all the PCs will be captured. Still, PC Samples can give you some idea of where your program is. ETM trace with a ULINKpro will provide a record of all the executed instructions.
9. Note: you can get different PC values displayed here depending on the optimization level set in µVision.
10. Right-click on the Trace Records window and unselect PC Samples.
11. Now only Data Write frames are displayed.
Address: The address the data was written to.
Data: The data value written.
PC: The address of the instruction that caused the data write. This was enabled when you selected On Data R/W Sample in step 2 above.
Cycles: When data written in CPU cycles.
Time(s): When data written in seconds.
The Data Write frames are put here when a variable is entered in the Logic Analyzer. You can have up to four such variables. Currently, µVision does not support Data Reads but will in the future.
SWV Overloads: The SWO pin is a single wire trace output and is easily overloaded. This is indicated by an “x” in the Ovf (frames lost) and/or Dly (timestamps internally delayed and hence not accurate) columns. Logic Analyzer and Event Viewer display accuracy might suffer from such overloads. µVision recovers gracefully from such overloads.
The best way to ensure accurate SWV operation is to select only those elements you really need. A ULINKpro uses Manchester encoding or the 4 bit Trace Port and processes SWV information at a faster rate.
Watchpoint Example: If you run the watchpoint example on page you will see the Data Write in the Trace Records window. This is shown here after the watchpoint triggered on counter = 0x05 and stopped the program:
12. Stop the program . 13. If you ran the Watchpoint
again to see the Data Write as shown here, delete the Watchpoint for the next exercise.

Copyright © 2012 ARM Ltd. All rights reserved
Freescale Cortex-M0+ Lab with ARM® Keil™ MDK toolkit www.keil.com
18
20) ITM (Instrumentation Trace Macrocell) printf without using a UART: Recall that we showed how you can display information about the RTOS in real-time using the RTX Viewer. This is done through ITM Stimulus Port 31. ITM Port 0 is available for a printf type of instrumentation that requires minimal user code. After the write to the ITM port, zero CPU cycles are required to get the data out of the processor and into µVision for display in the Debug (printf) Viewer window.
1. Open the project Blinky.uvproj (not RTX Blinky). (you probably have this open already)
2. Add this code to Blinky.c. A good place is near line 16. unsigned int count = 0;
#define ITM_Port8(n) (*((volatile unsigned char *)(0xE0000000+4*n)))
3. In the main function in Blinky.c right after the second Delay(250) near Line 95, enter these lines: count++;
if (count >9) count=0;
while (ITM_Port8(0) == 0);
ITM_Port8(0) = count + 0x30; /* displays count value: +0x30 converts to ASCII */
while (ITM_Port8(0) == 0);
ITM_Port8(0) = 0x0D;
while (ITM_Port8(0) == 0);
ITM_Port8(0) = 0x0A;
4. Rebuild the source files , program the Flash memory and enter Debug mode .
5. Open Debug/Debug Settings and select the Trace tab.
6. Unselect On Data R/W Sample, PC Sample and EXCTRC. (this is to help not overload the SWO port)
7. Select ITM Port 0. ITM Stimulus Port “0” enables the Debug (prinftf) Viewer.
8. Click OK twice.
9. Click on View/Serial Windows and select Debug (printf) Viewer and click on RUN .
10. In the Debug (printf) Viewer you will see the ASCII value of count appear.
11. Right click on the Debug window and select Mixed Hex ASCII mode. Note the other settings.
Trace Records 1. Open the Trace Records if not already open. Double click to clear it.
2. You will see a window such as the one below displaying ITM frames.
What Is This ? 1. ITM 0 frames (Num column) are our ASCII characters from count
with carriage return (0D) and line feed (0A) as displayed the Data column.
2. All these are timestamped in both CPU cycles and time in seconds.
3. Note the “X” in the Dly column. This means the timestamps might not be correct due to SWO pin overload.
4. Stop the CPU and exit Debug mode. .
TIP: It is important to select as few options in the Trace configuration as possible to avoid overloading the SWO pin. Enter only those features that you need.
Super TIP: ITM_SendChar is a useful function you can use to send characters out ITM. It is found in core.CM3.h.
Printf: The DSP example contains printf statements using ITM. See the function fputc in Retarget.c to see how this is done.
Copyright © 2012 ARM Ltd. All rights reserved
Freescale Cortex-M0+ Lab with ARM® Keil™ MDK toolkit www.keil.com
19
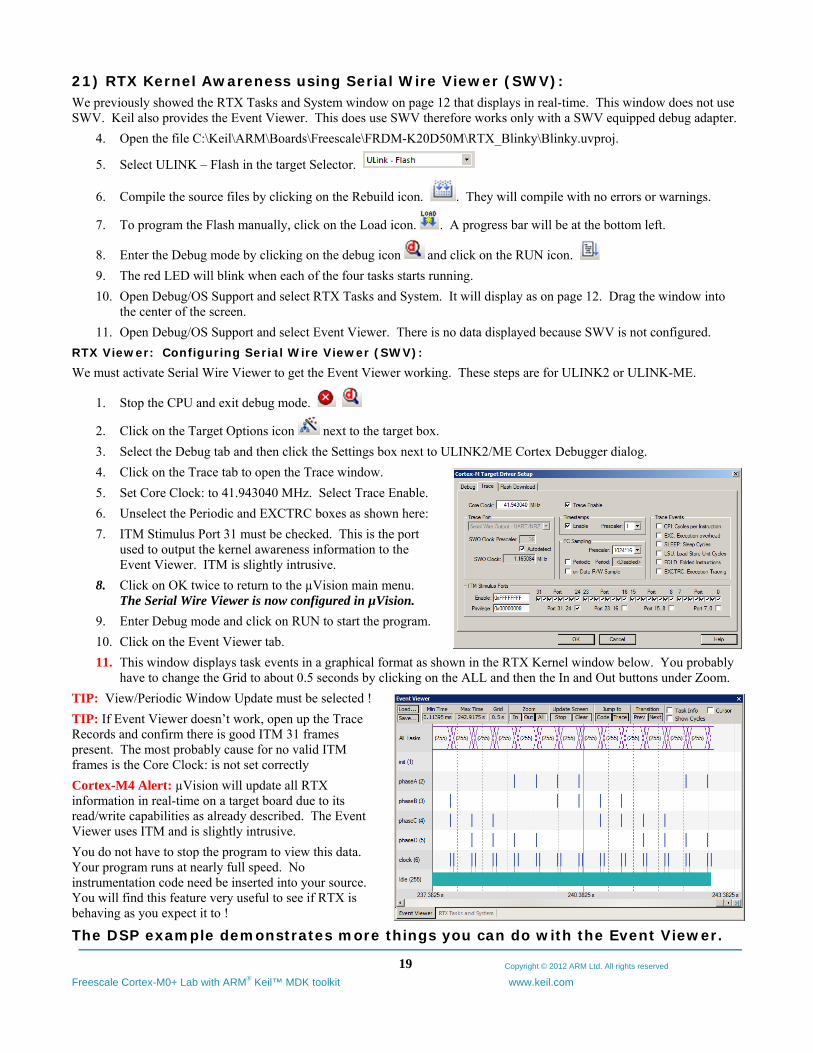
21) RTX Kernel Awareness using Serial Wire Viewer (SWV): We previously showed the RTX Tasks and System window on page 12 that displays in real-time. This window does not use SWV. Keil also provides the Event Viewer. This does use SWV therefore works only with a SWV equipped debug adapter.
4. Open the file C:\Keil\ARM\Boards\Freescale\FRDM-K20D50M\RTX_Blinky\Blinky.uvproj.
5. Select ULINK – Flash in the target Selector.
6. Compile the source files by clicking on the Rebuild icon. . They will compile with no errors or warnings.
7. To program the Flash manually, click on the Load icon. . A progress bar will be at the bottom left.
8. Enter the Debug mode by clicking on the debug icon and click on the RUN icon.
9. The red LED will blink when each of the four tasks starts running.
10. Open Debug/OS Support and select RTX Tasks and System. It will display as on page 12. Drag the window into the center of the screen.
11. Open Debug/OS Support and select Event Viewer. There is no data displayed because SWV is not configured.
RTX Viewer: Configuring Serial Wire Viewer (SWV): We must activate Serial Wire Viewer to get the Event Viewer working. These steps are for ULINK2 or ULINK-ME.
1. Stop the CPU and exit debug mode.
2. Click on the Target Options icon next to the target box.
3. Select the Debug tab and then click the Settings box next to ULINK2/ME Cortex Debugger dialog.
4. Click on the Trace tab to open the Trace window.
5. Set Core Clock: to 41.943040 MHz. Select Trace Enable.
6. Unselect the Periodic and EXCTRC boxes as shown here:
7. ITM Stimulus Port 31 must be checked. This is the port used to output the kernel awareness information to the Event Viewer. ITM is slightly intrusive.
8. Click on OK twice to return to the µVision main menu. The Serial Wire Viewer is now configured in µVision.
9. Enter Debug mode and click on RUN to start the program.
10. Click on the Event Viewer tab.
11. This window displays task events in a graphical format as shown in the RTX Kernel window below. You probably have to change the Grid to about 0.5 seconds by clicking on the ALL and then the In and Out buttons under Zoom.
TIP: View/Periodic Window Update must be selected !
TIP: If Event Viewer doesn’t work, open up the Trace Records and confirm there is good ITM 31 frames present. The most probably cause for no valid ITM frames is the Core Clock: is not set correctly
Cortex-M4 Alert: µVision will update all RTX information in real-time on a target board due to its read/write capabilities as already described. The Event Viewer uses ITM and is slightly intrusive.
You do not have to stop the program to view this data. Your program runs at nearly full speed. No instrumentation code need be inserted into your source. You will find this feature very useful to see if RTX is behaving as you expect it to !
The DSP example demonstrates more things you can do with the Event Viewer.

Copyright © 2012 ARM Ltd. All rights reserved
Freescale Cortex-M0+ Lab with ARM® Keil™ MDK toolkit www.keil.com
20
22) Logic Analyzer Window: View variables real-time in a graphical format: µVision has a graphical Logic Analyzer window. Up to four variables can be displayed in real-time using the Serial Wire Viewer in the Kinetis. RTX_Blinky uses four tasks to create the waveforms. We will graph these four waveforms.
12. Close the RTX Viewer windows. Stop the program and exit Debug mode.
1. Declare 4 global variables unsigned int phasea through unsigned int phased to Blinky.c as shown here:
2. Add 2 lines to each of the four tasks Task1 through Task4 in Blinky.c as shown below: phasea=1; and phasea=0; :the first two lines are shown added at lines 096 and 099 (just after the LED_On and LED_Off function calls). For each of the four tasks, add the corresponding variable assignment statements phasea, phaseb, phasec and phased.
3. We do this because in this simple program there are not enough suitable variables to connect to the Logic Analyzer.
TIP: The Logic Analyzer can display static and global variables, structures and arrays. It can’t see locals: just make them static. To see peripheral registers merely read or write to them and enter them into the Logic Analyzer.
4. Rebuild the project. Program the Flash .
5. Enter debug mode .
6. You can run the program at this point.
Enter the Variables into the Logic Analyzer: 7. Right-click on the variable phasea and select Add phasea to…
and then select Logic Analyzer. The LA window will open.
8. Repeat for phaseb, phasec and phased. These variables will be listed on the left side of the LA window as shown. You might have to adjust the LA margins. Now we have to adjust the scaling.
9. Click on the Setup icon and click on each of the four variables and set Max. in the Display Range: to 0x3.
10. Click on Close to go back to the LA window.
11. Using the OUT and In buttons set the range to 1 or 2 seconds. Move the scrolling bar to the far right if needed.
12. You will see the following waveforms appear. Click on STOP in the Update Screen box. The program will keep running. Select Signal Info, Show Cycles and Cursor.
13. Click to mark a place See 45 s below. Place the cursor on one of the waveforms and get timing and other information as shown in the inserted box labeled phaseb: Note each LED is on for about 1.5 seconds and the period of a task is about 4 seconds.
14. Stop the program and exit Debug mode when you are finished.
TIP: You can also enter these variables into the Watch and Memory windows to display and modify them in real-time.
Copyright © 2012 ARM Ltd. All rights reserved
Freescale Cortex-M0+ Lab with ARM® Keil™ MDK toolkit www.keil.com
21
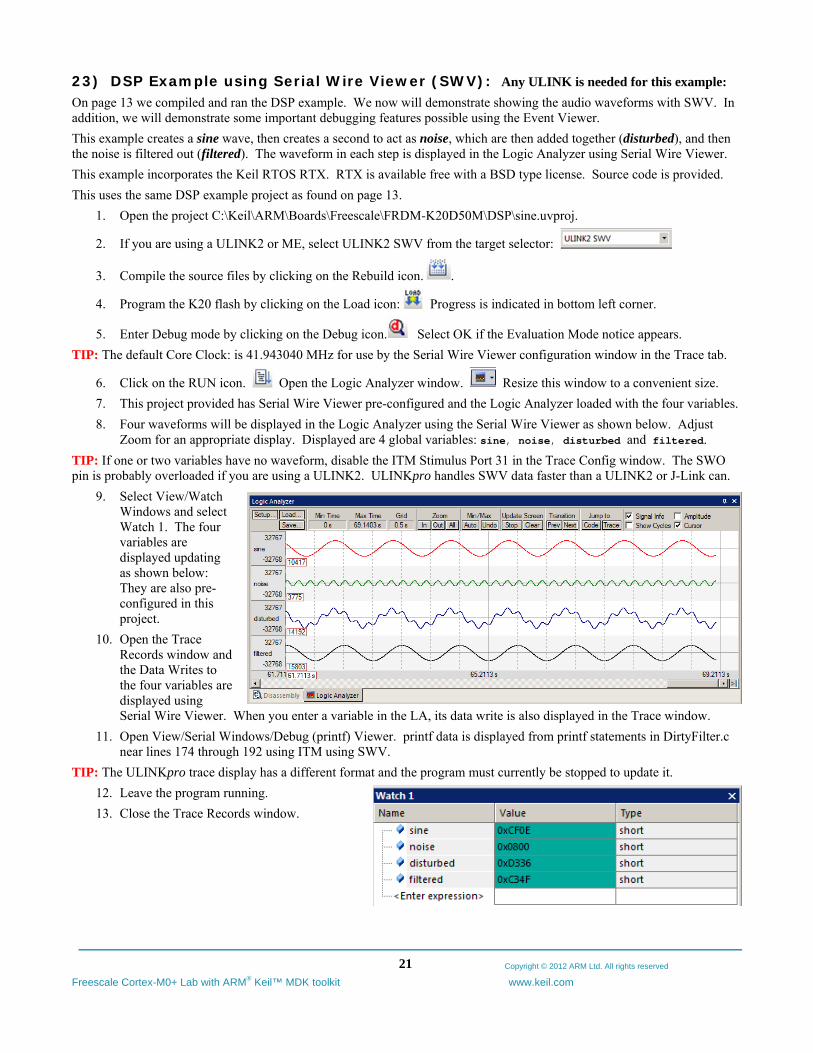
23) DSP Example using Serial Wire Viewer (SWV): Any ULINK is needed for this example: On page 13 we compiled and ran the DSP example. We now will demonstrate showing the audio waveforms with SWV. In addition, we will demonstrate some important debugging features possible using the Event Viewer.
This example creates a sine wave, then creates a second to act as noise, which are then added together (disturbed), and then the noise is filtered out (filtered). The waveform in each step is displayed in the Logic Analyzer using Serial Wire Viewer.
This example incorporates the Keil RTOS RTX. RTX is available free with a BSD type license. Source code is provided.
This uses the same DSP example project as found on page 13.
1. Open the project C:\Keil\ARM\Boards\Freescale\FRDM-K20D50M\DSP\sine.uvproj.
2. If you are using a ULINK2 or ME, select ULINK2 SWV from the target selector:
3. Compile the source files by clicking on the Rebuild icon. .
4. Program the K20 flash by clicking on the Load icon: Progress is indicated in bottom left corner.
5. Enter Debug mode by clicking on the Debug icon. Select OK if the Evaluation Mode notice appears.
TIP: The default Core Clock: is 41.943040 MHz for use by the Serial Wire Viewer configuration window in the Trace tab.
6. Click on the RUN icon. Open the Logic Analyzer window. Resize this window to a convenient size.
7. This project provided has Serial Wire Viewer pre-configured and the Logic Analyzer loaded with the four variables.
8. Four waveforms will be displayed in the Logic Analyzer using the Serial Wire Viewer as shown below. Adjust Zoom for an appropriate display. Displayed are 4 global variables: sine, noise, disturbed and filtered.
TIP: If one or two variables have no waveform, disable the ITM Stimulus Port 31 in the Trace Config window. The SWO pin is probably overloaded if you are using a ULINK2. ULINKpro handles SWV data faster than a ULINK2 or J-Link can.
9. Select View/Watch Windows and select Watch 1. The four variables are displayed updating as shown below: They are also pre-configured in this project.
10. Open the Trace Records window and the Data Writes to the four variables are displayed using Serial Wire Viewer. When you enter a variable in the LA, its data write is also displayed in the Trace window.
11. Open View/Serial Windows/Debug (printf) Viewer. printf data is displayed from printf statements in DirtyFilter.c near lines 174 through 192 using ITM using SWV.
TIP: The ULINKpro trace display has a different format and the program must currently be stopped to update it.
12. Leave the program running.
13. Close the Trace Records window.
Copyright © 2012 ARM Ltd. All rights reserved
Freescale Cortex-M0+ Lab with ARM® Keil™ MDK toolkit www.keil.com
22
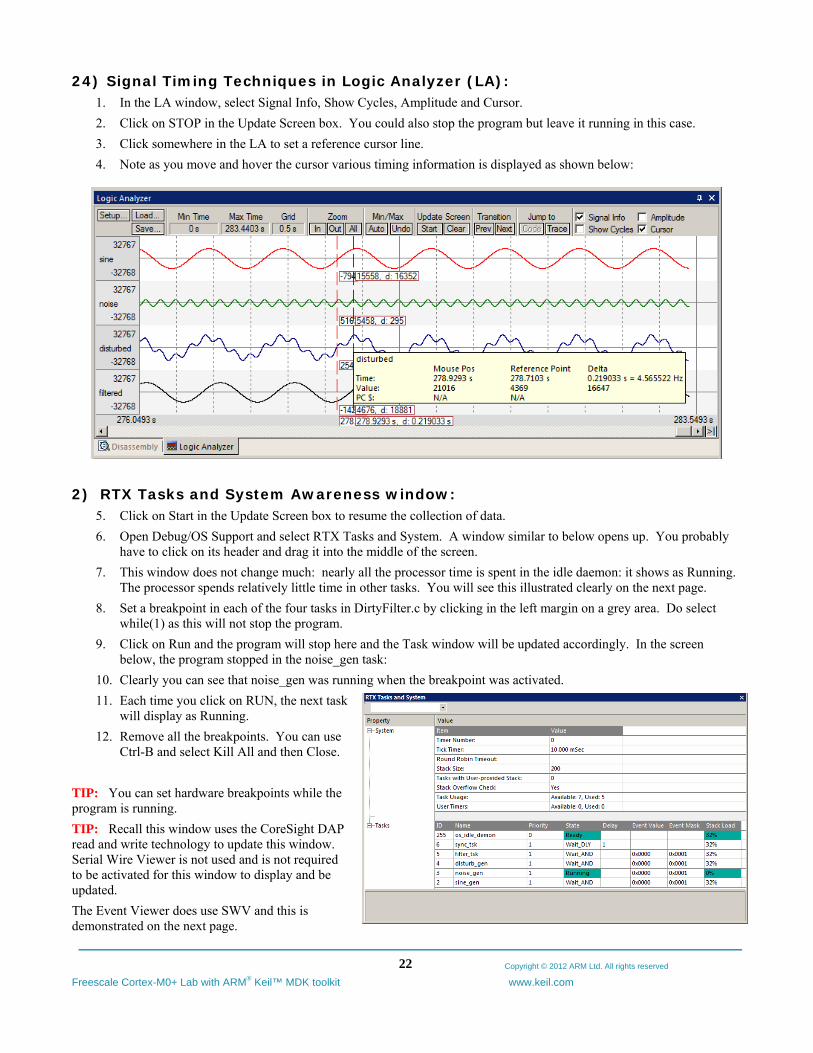
24) Signal Timing Techniques in Logic Analyzer (LA):
1. In the LA window, select Signal Info, Show Cycles, Amplitude and Cursor.
2. Click on STOP in the Update Screen box. You could also stop the program but leave it running in this case.
3. Click somewhere in the LA to set a reference cursor line.
4. Note as you move and hover the cursor various timing information is displayed as shown below:
2) RTX Tasks and System Awareness window:
5. Click on Start in the Update Screen box to resume the collection of data.
6. Open Debug/OS Support and select RTX Tasks and System. A window similar to below opens up. You probably have to click on its header and drag it into the middle of the screen.
7. This window does not change much: nearly all the processor time is spent in the idle daemon: it shows as Running. The processor spends relatively little time in other tasks. You will see this illustrated clearly on the next page.
8. Set a breakpoint in each of the four tasks in DirtyFilter.c by clicking in the left margin on a grey area. Do select while(1) as this will not stop the program.
9. Click on Run and the program will stop here and the Task window will be updated accordingly. In the screen below, the program stopped in the noise_gen task:
10. Clearly you can see that noise_gen was running when the breakpoint was activated.
11. Each time you click on RUN, the next task will display as Running.
12. Remove all the breakpoints. You can use Ctrl-B and select Kill All and then Close.
TIP: You can set hardware breakpoints while the program is running.
TIP: Recall this window uses the CoreSight DAP read and write technology to update this window. Serial Wire Viewer is not used and is not required to be activated for this window to display and be updated.
The Event Viewer does use SWV and this is demonstrated on the next page.

Copyright © 2012 ARM Ltd. All rights reserved
Freescale Cortex-M0+ Lab with ARM® Keil™ MDK toolkit www.keil.com
23
25) RTX Event Viewer: 1. If you are using a ULINKpro, skip this step: Stop the program. Click on Setup... in the Logic Analyzer. Select
Kill All to remove all variables and select Close. This is necessary because the SWO pin will likely be overloaded when the Event Viewer is opened up. Inaccuracies might occur. You can also leave the LA loaded with the four variables to see what the Event Viewer will look like. Or you can remove just one or two. Later, delete them to see the effect on the Event Viewer.
2. Select Debug/Debug Settings.
3. Click on the Trace tab.
4. Enable ITM Stimulus Port 31. Event Viewer uses this to collect its information.
5. Click OK twice.
6. Exit and re-enter Debug mode
to refresh the Trace Configuration.
7. Click on RUN.
8. Open Debug/OS Support and select Event Viewer. The window above opens up:
9. Note there is no Task 1 listed. Task 1 is main_tsk and is found in DirtyFilter.c near line 169. It runs some RTX initialization code at the beginning and then deletes itself with os_tsk_delete_self(); found near line 195.
TIP: If Event Viewer is blank or erratic, or the LA variables are not displaying or blank: this is likely because the Serial Wire Output pin is overloaded and dropping trace frames. Solutions are to delete some or all of the variables in the Logic Analyzer to free up some SWO or Trace Port bandwidth. It depends on how much data is sent to the ports.
ULINKpro is much better with SWO bandwidth issues. These have been able to display both the Event and LA windows. ULINKpro uses the faster Manchester format than the slower UART mode that ULINK2 and J-Link uses.
ULINKpro can also use the 4 bit Trace Port for even faster operation for SWV. Trace Port use is mandatory for ETM trace.
10. Note on the Y axis each of the 5 running tasks plus the idle daemon. Each bar is an active task and shows you what task is running, when and for how long.
11. Click Stop in the Update Screen box.
12. Click on Zoom In so three or four tasks are displayed as shown below:
13. Select Cursor. Position the cursor over one set of bars and click once. A red line is set here:
14. Move your cursor to the right over the next set and total time and difference are displayed.
15. Note, since you enabled Show Cycles, the total cycles and difference is also shown.
The 10 msec shown is the SysTick timer value. This value is set in RTX_Conf_CM.c. The next page describes how to change this.
TIP: ITM Port 31enables sending the Event Viewer frames out the SWO port. Disabling this can save bandwidth on the SWO port when RTX is running if you are not using the Event Viewer. This is normally a good idea if you are running RTX with high SWO data rates.
Even if the Event Viewer is closed, the data is still being sent out the SWO pin or the Trace Port by RTX. This can contribute to SWV overloading.
It is important to lessen the chance of SWV overloading by minimizing the selections enabled. A ULINKpro is a good investment for high SWV data rates.

Copyright © 2012 ARM Ltd. All rights reserved
Freescale Cortex-M0+ Lab with ARM® Keil™ MDK toolkit www.keil.com
24
26) Event Viewer Timing Techniques:
1. Click on In under Zoom until only one set of tasks is visible as shown below:
2. Enable Task Info (as well as Cursor and Show Cycles from the previous exercise).
3. Note one entire sequence is shown. This screen was taken with a ULINK2 with LA cleared of all variables.
4. Click on a task to set the cursor and move it to its end. The time difference is noted. The Task Info box will appear.
TIP: If the Event Viewer does not display correctly, the display of the variables in the Logic Analyzer window might be overloading the SWO pin. In this case, stop the program and delete all LA variables (Kill All) and click on Run.
The Event Viewer can give you a good idea if your RTOS is configured correctly and running in the right sequence.
TIP: In this example, the filter_task time was 18 us with a ULINKpro and about 35 us with the ULINK2. The other tasks were about the same time. This is why it is important to make sure waveforms are not distorted by SWV overloads.
Even with such caveats, SWV is still an important debugging tool.
Changing the SysTick Timer:
1. Stop the processor and exit debug mode.
2. Open the file RTX_Conf_CM.c from the Project window. You can also select File/Open and select it in C:\Keil\ARM\Boards\Freescale\FRDM-K20D50M\DSP.
1. Select the Configuration Wizard tab at the bottom of the window. This scripting language is shown in the Text Editor as comments starting such as a </h> or <i>. See www.keil.com/support/docs/2735.htm for instructions.
3. This window opens up. Expand the SysTick Timer Configuration as shown here:
4. Note the Timer tick value is 10,000 µs or 10 ms.
5. Change this value to 20,000.
TIP: The 41943040 is the CPU speed and is correct for this DSP example.
Rebuild the source files and program the Flash.
6. Enter debug mode and click on RUN .
7. When you check the timing of the tasks in the Event Viewer window as you did on the previous page, they will now be spaced at 20 msec.
TIP: The SysTick is a dedicated timer on Cortex-M processors that is used to switch tasks in an RTOS. It does this by generating an Exception 15 periodically every 10 µs or to what you set it to. You can view these exceptions in the Trace Records window by enabling EXCTRC in the Trace Configuration window. You can use SysTick for other purposes.
8. Set the SysTick timer back to 10,000. You will need to recompile the source files and reprogram the Flash.
9. Click on File/Save All.
10. You must stop the processor and exit Debug mode to compile the source files.

Copyright © 2012 ARM Ltd. All rights reserved
Freescale Cortex-M0+ Lab with ARM® Keil™ MDK toolkit www.keil.com
25
27) Trace Configuration Fields: For reference…for ULINK2/ME and mostly for ULINKpro. TIP: ULINKpro is similar but with a few features (ETM) added. You can use these instructions for ULINKpro.
Trace Configuration window Fields 1) through 5).
1) Core Clock: The CPU clock speed for SWV. SWO Clock signal is derived from and is a ratio of the Core Clock. CPU frequency is set by the systemxxx.c file. It is 41.943040 MHz for the Freedom K20D50M examples.
2) Trace Enable: Enables SWV and ITM which is essentially everything on this window except Trace Port and ETM. This does not affect the DAP Watch and Memory window display updates.
3) Trace Port: Selects the SWO trace output UART or Manchester protocol.
a. Serial Wire Output – UART/NRZ: This is set by default with ULINK2, ULINLK-ME and J-Link.
b. Serial Wire Output – Manchester: Use Manchester encoding. ULINKpro only. UART/NRZ encoding is not supported by ULINKpro. An error will result when you enter debug mode with ULINKpro.
4) Timestamps: Enables timestamps and selects a Prescaler. 1 is the default. Selecting a higher value can, but not always lessen SWO overloads. Completely disabling the timestamps can lessen data overruns but can disable other SWV features. It is worth a try if you are having overload problems.
5) PC Sampling: Samples the program counter and displays them in the Trace Records window.
a. Prescaler 1024*16 (the default) means every 16,384th PC is displayed. The rest are lost.
b. Periodic: Enables PC Sampling.
c. Period: Automatically derived from Prescaler and Core Clock settings.
d. On Data R/W Sample: Displays the address of the instruction that made a data read or write of a variable entered in the Logic Analyzer in the Trace Records window. This is not connected with PC Sampling.
Note: This window is slightly different for ULINKpro and J-link. The resulting trace windows are also different. Currently, the program must be stopped to display the trace records with ULINKpr or J-link.
TIP: It is important to ensure the Serial Wire Output (SWO) pin is not overloaded. µVision will alert you when an overflow occurs with a “X” in the Trace Records window or with a “D” or a “O” in the ULINKpro Instruction Trace window. µVision easily recovers from these overflows and immediately continues displaying the next available trace frame. Dropped frames are somewhat the normal situation especially with many data reads and/or writes.
TIP: ULINKpro can process SWV information much faster than the ULINK2 or ULINK-ME can. This results in fewer dropped frames especially with higher data transfer rates out the SWO pin. ULINKpro has the option of collecting information from the 4 bit Trace Port instead of the 1 bit SWO pin. Data overruns are often associated with a fast stream of data reads and writes which are set in the Logic Analyzer. Minimize these issues by displaying only the information you really need.

Copyright © 2012 ARM Ltd. All rights reserved
Freescale Cortex-M0+ Lab with ARM® Keil™ MDK toolkit www.keil.com
26
Trace Configuration window Fields 6) through 8)
6) Trace Events: Enables various CPU counters. All except EXCTRC are 8 bit counters. Each counter is cumulative and an event is created when this counter overflows every 256 cycles. These values are displayed in the Counter window. The event created when a counter wraps around is displayed in the Trace Records window or the Instruction Trace window (ULINKpro). Event Counters are updated using the DAP and not SWV. These events are memory mapped and can be read by your program or the µVision Memory window.
a. CPI: Cycles per Instruction: The cumulative number of extra cycles used by each instruction beyond the first one plus any instruction fetch stalls.
b. Fold: Cumulative number of folded instructions. This will result from a predicted branch instruction removed and flushed from the pipeline giving a zero cycle execution time.
c. Sleep: Cumulative number of cycles the CPU is in sleep mode. Uses FCLK for timing.
d. EXC: Cumulative cycles CPU spent in exception overhead not including total time spent processing the exception code. Includes stack operations and returns.
e. LSU: Cumulative number of cycles spent in load/store operations beyond the first cycle.
f. EXCTRC: Exception Trace. This is different than the other items in this section. This enables the display of exceptions in the Instruction Trace and Exception windows. It is not a counter. This is a very useful feature and is often used in debugging.
7) ITM Stimulus Ports: Enables the thirty two 32 bit registers used to output data in a printf type statement to µVision. Port 0 is used for the Debug (printf) Viewer and Port 31 is used for the Keil RTX real-time kernel awareness window. Only Ports 0 and 31 are currently implemented in µVision and should normally be checked. Ports 1 through 30 are not currently implemented and are Don’t Care.
a. Port 31: Enables the ITM port used for the RTX Viewer.
b. Port 0: Enables the ITM port used for the Debug (printf) Viewer. A small amount of instrumentation code is needed in your project. See Debug (printf) Viewer: page 18 for information on using this feature.

Copyright © 2012 ARM Ltd. All rights reserved
Freescale Cortex-M0+ Lab with ARM® Keil™ MDK toolkit www.keil.com
27
28) Creating your own project from scratch: Using the Blinky source files: All examples provided by Keil are pre-configured. All you have to do is compile them. You can use them as a starting point for your own projects. However, we will start this example project from the beginning to illustrate how easy this process is. We will use the existing source code files so you will not have to type them in. Once you have the new project configured; you can build, load and run a bare Blinky example. It has an empty main() function so it does not do much. However, the processor startup sequences are present and you can easily add your own source code and/or files. You can use this process to create any new project, including one using an RTOS.
Create a new project called Mytest: (this uses the KL25Z Freedom. You can adapt it for K20D)
1. With µVision running and not in debug mode, select Project/New µVision Project… 2. In the window Create New Project that opens, go to the folder C:\Keil\ARM\Boards\Freescale\FRDM-KL25Z\.
Create a new folder and name your project: 3. Right click inside this window and create a new folder by selecting New/Folder. I named this new folder FAE. 4. Double-click on the newly created folder “FAE” to enter this folder. It will be empty. 5. Name your project in the File name: box. I called mine Mytest. You can choose your own name but you will have
to keep track of it. This window is shown here: 6. Click on Save.
Select your processor: 7. “Select a CPU Data Base File” shown below opens up. 8. Click on OK and the Select Device for “Target 1” opens
up as shown below. 9. This is the Keil Device Database® which lists all the
devices Keil supports. You can create your own if desired for processors not released yet.
10. Locate the Freescale directory, open it and select MKL25Z128xxx4 (or the device you are using). Note the device features are displayed.
11. Select OK. µVision will configure itself to this device.
Select the startup file: 12. A window opens up asking if you want to insert the
default MKL25Z startup file to your project. Click on “Yes”. This will save you some time. 13. In the Project Workspace in the upper left hand of µVision, open up the folders Target 1 and Source Group 1 by
clicking on the “+” beside each folder. 14. We have now created a project called Mytest with the target hardware called
Target 1 with one source assembly file startup_MKL25Z4.s and using the MKL25Z processor.
TIP: You can create more target hardware configurations and easily select them. This can include multiple Target settings, simulation and RAM operations. See Projects/Manage/Components Rename the Project names for convenience:
15. Click once on the name “Target 1” (or twice if not already highlighted) in the Project Workspace and rename Target 1 to something else. I chose KL25Z Flash. Press Enter to accept this change. Note the Target selector in the main µVision window also changes to KL25Z Flash.
16. Similarly, change Source Group 1 to Startup. This will add some consistency to your project with the Keil examples. You can name these or organize them differently to suit yourself.
17. Select File/Save All.

Copyright © 2012 ARM Ltd. All rights reserved
Freescale Cortex-M0+ Lab with ARM® Keil™ MDK toolkit www.keil.com
28
Select the source files and debug adapter: 1. Using MS Explore (right click on Windows Start icon), copy blinky.c and system_MKL25Z4.c from
C:\Keil\ARM\Boards\Freescale\FRDM-KL25Z\Blinky to the ..\ FRDM-KL25Z \FAE folder you created. Source Files:
2. In the Project Workspace in the upper left hand of µVision, right-click on “SAM3X Flash” and select “Add Group”. Name this new group “Source Files” and press Enter. You can name it anything. There are no restrictions from Keil.
3. Right-click on “Source Files” and select Add files to Group “Source Files”. 4. Select the file Blinky.c and click on Add (once!) and then Close.
System File: 5. Right-click on “Startup” and select Add files to Group “Source Files”. 6. Select the file system_MKL25Z4.c and click on Add (once!) and then Close. 7. Your Project window will look similar to the one shown here:
Select your Debug Adapter: 8. By default the simulator is selected when you create a new µVision project.
You probably need to change this to a USB adapter such as a ULINK2.
9. Select Target Options or ALT-F7 and select the Debug tab. Select ULINK/ME Cortex Debugger as shown below: If you are using another adapter such as CMSIS-DAP or ULINKpro, select the appropriate adapter from the pull-down list.
10. Select JTAG/SWD debugging (as opposed to selecting the Simulator) by checking the circle just to the left of the word “Use:” as shown in the window to the right:
11. Select the Utilities tab and select the appropriate debug adapter and the proper Flash algorithm for your processor. Refer to Using Various USB adapters: starting on pages 4 and 23 for more information.
12. Click on the Target tab and select MicroLIB for smaller programs. See www.keil.com/appnotes/files/apnt202.pdf for details.
Modify Blinky.c 13. Double-click the file Blinky.c in the Project window to open it in the editing window or click on its tab if it is
already open. 14. Delete everything in Blinky.c except the main () function to provide a basic platform to start with:
#include <MKL25Z4.H>
/*---------------------------------------------------------------------------- MAIN function *----------------------------------------------------------------------------*/ int main (void) { while(1) {
} }
15. Select File/Save All Compile and run the program:
16. Compile the source files by clicking on the Rebuild icon. . You can also use the Build icon beside it.
17. Program the KL25 Flash by clicking on the Load icon: Progress will be indicated in the Output Window.
18. Enter Debug mode by clicking on the Debug icon.
19. Click on the RUN icon. Note: you stop the program with the STOP icon.
20. The program will run but since while(1) is empty – it does not do much. You can set a breakpoint. 21. You should be able to add your own source code to create a meaningful project.
This completes the exercise of creating your own project from scratch.
You can also configure a new RTX project from scratch using RTX_Blinky project.

Copyright © 2012 ARM Ltd. All rights reserved
Freescale Cortex-M0+ Lab with ARM® Keil™ MDK toolkit www.keil.com
29
29) Create a new Target configuration: You have noticed there are Target Options already configured in the Keil examples provided. This is for reference should you desire to create new target options for your own custom projects.
Selecting Target Options opens up a set of extensive configuration items for µVision. It is possible to have multiple copies of Target Options with different settings. Each is selected with the Target Options pulldown menu. For instance, each, as in this example, can point to different debug adapter selections.
To setup a new debug adapter, you can modify an existing Target or create a new one:
1. Select a Target Option you want to be the template for your new entry.
2. Select Projects/Manage/Components… The Target Option you selected will be highlighted in Project Targets.
3. In the Project Targets box, select Insert . Enter the name of the target you want to create and press Enter and OK.
4. Select the Target Option you just created in the drop down window.
5. Select Target Options and modify the contents as desired as described on the next pages.
6. These will be saved in your Target Options configuration.
7. When completed, select File/Save All.
Other Freescale labs: Freedom KL25A Cortex-M0+: www.keil.com/appnotes/docs/apnt_232.asp
Kinetis K60 Tower: www.keil.com/appnotes/docs/apnt_239.asp

Copyright © 2012 ARM Ltd. All rights reserved
Freescale Cortex-M0+ Lab with ARM® Keil™ MDK toolkit www.keil.com
30
30) Configure µVision for OpenSDA (this is CMSIS-DAP compliant): 1. Most of the examples are pre-configured to use various debug adapters including OpenSDA (CMSIS-DAP). These
are accessible in the Target Options menu shown below in Step 3. These steps show you how to manage these.
2. Start µVision if not already running. Select the project you want to use for your board.
3. Select Target Options or ALT-F7 and select the Debug tab. In the drop-down menu box select CMSIS-DAP
Debugger as shown here:
9. Select Settings and the next window below opens up. This is the control panel for debug control.
10. In Port: select SW. Select the SWJ box. Note: The Freedom K20D50M board does not have JTAG: only SWD (aka SW).
11. In the SW Device area: ARM CoreSight SW-DP MUST be displayed. This confirms you are connected to the target processor. If there is an error displayed or it is blank: this must be fixed before you can continue. Check the target power supply. Reprogram the K20 with CMSIS-DAP.S19. No number in the Serial No: box means µVision is unable to connect to the K20. This is dreadful news and you must fix it before you can continue.
TIP: To refresh this screen, change the option in Port: to JTAG and then back to SW or click OK once to leave this screen and then re-enter it.
Step 4) Configure the Keil Flash Programmer:
1. Click on OK once and then select the Utilities tab.
2. Select CMSIS-DAP Debugger as shown here:
3. Click Settings to select the programming algorithm.
4. Select Add and select the appropriate Kinetis Flash if necessary as shown below:
5. MKXX 50 MHz 128kB Prog Flash and MKXX 50 MHz 128kB Prog Flash are the correct ones to use with the Freedom K20D50M board.
6. Click on OK once.
TIP: To program the Flash every time you enter Debug mode, check Update Target before Debugging.
7. Click on OK once more to return to the µVision main screen.
To use a ULINK2. ULINK-ME or ULINKpro, please see pages 33 and 24.
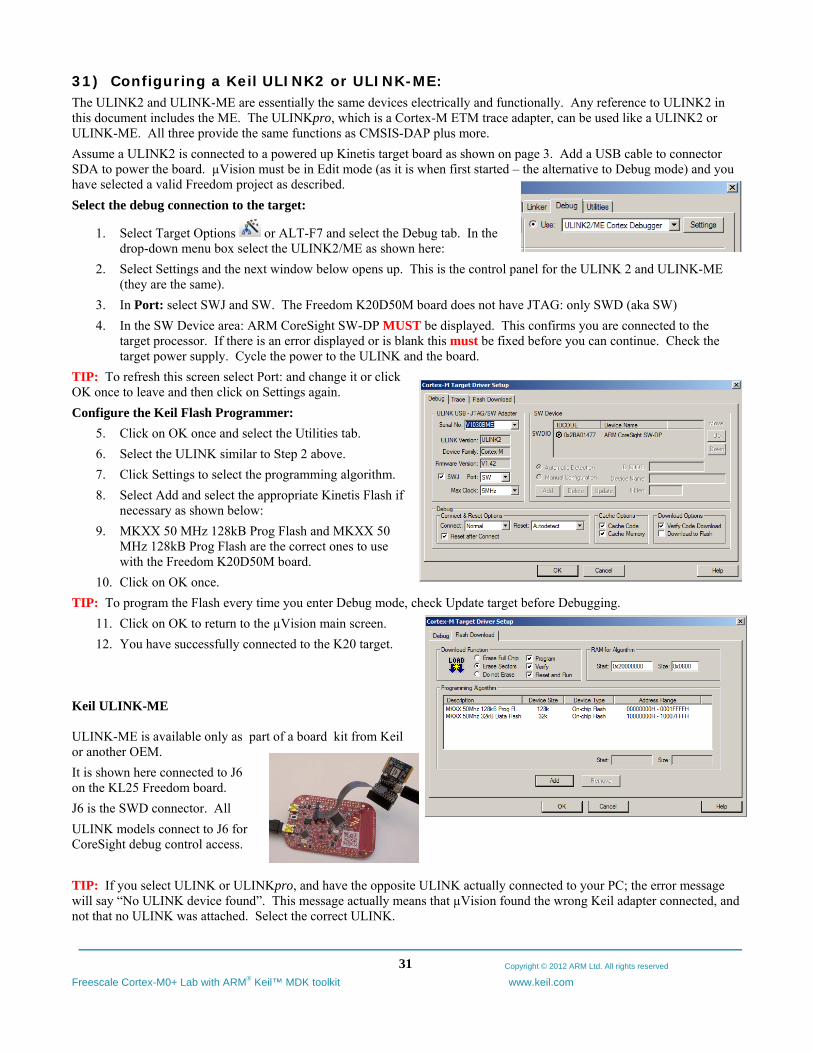
Copyright © 2012 ARM Ltd. All rights reserved
Freescale Cortex-M0+ Lab with ARM® Keil™ MDK toolkit www.keil.com
31
31) Configuring a Keil ULINK2 or ULINK-ME: The ULINK2 and ULINK-ME are essentially the same devices electrically and functionally. Any reference to ULINK2 in this document includes the ME. The ULINKpro, which is a Cortex-M ETM trace adapter, can be used like a ULINK2 or ULINK-ME. All three provide the same functions as CMSIS-DAP plus more.
Assume a ULINK2 is connected to a powered up Kinetis target board as shown on page 3. Add a USB cable to connector SDA to power the board. µVision must be in Edit mode (as it is when first started – the alternative to Debug mode) and you have selected a valid Freedom project as described.
Select the debug connection to the target:
1. Select Target Options or ALT-F7 and select the Debug tab. In the drop-down menu box select the ULINK2/ME as shown here:
2. Select Settings and the next window below opens up. This is the control panel for the ULINK 2 and ULINK-ME (they are the same).
3. In Port: select SWJ and SW. The Freedom K20D50M board does not have JTAG: only SWD (aka SW)
4. In the SW Device area: ARM CoreSight SW-DP MUST be displayed. This confirms you are connected to the target processor. If there is an error displayed or is blank this must be fixed before you can continue. Check the target power supply. Cycle the power to the ULINK and the board.
TIP: To refresh this screen select Port: and change it or click OK once to leave and then click on Settings again.
Configure the Keil Flash Programmer:
5. Click on OK once and select the Utilities tab.
6. Select the ULINK similar to Step 2 above.
7. Click Settings to select the programming algorithm.
8. Select Add and select the appropriate Kinetis Flash if necessary as shown below:
9. MKXX 50 MHz 128kB Prog Flash and MKXX 50 MHz 128kB Prog Flash are the correct ones to use with the Freedom K20D50M board.
10. Click on OK once.
TIP: To program the Flash every time you enter Debug mode, check Update target before Debugging.
11. Click on OK to return to the µVision main screen.
12. You have successfully connected to the K20 target.
Keil ULINK-ME ULINK-ME is available only as part of a board kit from Keil or another OEM.
It is shown here connected to J6 on the KL25 Freedom board.
J6 is the SWD connector. All
ULINK models connect to J6 for CoreSight debug control access.
TIP: If you select ULINK or ULINKpro, and have the opposite ULINK actually connected to your PC; the error message will say “No ULINK device found”. This message actually means that µVision found the wrong Keil adapter connected, and not that no ULINK was attached. Select the correct ULINK.

Copyright © 2012 ARM Ltd. All rights reserved
Freescale Cortex-M0+ Lab with ARM® Keil™ MDK toolkit www.keil.com
32
32) Configuring a Keil ULINKpro: This is configured the same way as a ULINK2 except for the two selection entries. One is in the Debug tab (shown below) and the other in the Utilities tab for Flash programming.
1. The first photo shows how the ULINK CoreSight 10 pin cable is connected to J6 (JTAG) on the Freedom board. Make sure Pin 1 (red wire) is orientated correctly and that all pins are connected if the connector is offset. Some cables might have a blank in Pin 7 which you will have to remove.
2. In the Debug tab in Options for target window, select ULINK Pro Cortex Debugger as shown below.
3. Select Settings and the next window below opens up. This is the control panel for the ULINKpro.
4. In Port: select SWJ and SW. The KL25 processor does not have JTAG.
5. In the SW Device area: ARM CoreSight SW-DP MUST be displayed. This confirms you are connected to the target processor. If there is an error displayed or is blank this must be fixed before you can continue. Check the target power supply. Cycle the power to the ULINKpro and the board.
6. Select the Utilities tab and select the ULINKpro and select the programming algorithm as done with the ULINK2. Refer to the previous page for instructions.
Configure the Keil Flash Programmer:
1. Click on OK once and select the Utilities tab.
2. Select the ULINK Pro similar to Step 2 above.
3. Click Settings to select the programming algorithm.
4. Select Add and select the appropriate Kinetis Flash if necessary as shown on the previous page.
5. MKXX 50 MHz 128kB Prog Flash and MKXX 50 MHz 128kB Prog Flash are the correct ones to use with the Freedom K20D50M board.
6. Click on OK twice.
TIP: With a ULINK2 and ULINKpro, the case must be removed to change the cable. Make sure you do not disturb the battery in the ULINKpro. If the RAM is erased the ULINKpro must be sent back to Keil for reprogramming. ULINK2 has no such battery.
TIP: If you select ULINK or ULINKpro, and have the opposite ULINK actually connected; the error message will say “No ULINK device found”. This message actually means that µVision found the wrong Keil adapter connected.
Keil ULINKpro information: ULINKpro is an ETM trace adapter that can be used as a ULINK2. ULINKpro has very fast Flash programming and an enhanced Instruction Trace window that connects the trace frames to your source code.
Instruction trace on Kinetis Cortex-M4 processors requires ETM. A Samtec 20 pin CoreSight connector is needed.
ULINKpro features are best exploited with Kinetis Cortex-M4 processors. ULINK2 provides SWV but not ETM on Kinetis Cortex-M4 processors. See the lab on www.keil.com/freescale.
ULINKpro supports Serial Wire Viewer (SWV) and ETM trace with all Cortex-M3 and Cortex-M4 devices.
The KL25 Cortex-M0+ processors support MTB trace and DAP read/write memory cycles. These are described in this document. They do not support SWV or ETM trace.

Copyright © 2012 ARM Ltd. All rights reserved
Freescale Cortex-M0+ Lab with ARM® Keil™ MDK toolkit www.keil.com
33
33) Kinetis Data and Instruction Trace Summary:
Watch and Memory windows can see: Global variables.
Static variables.
Structures.
Peripheral registers – just read or write to them.
Can’t see local variables. (just make them global or static).
Can’t see DMA transfers – DMA bypasses CPU and CoreSight and CPU by definition.
Serial Wire Viewer displays in various ways: : (Cortex-M0+ does not have SWV. Kinetis Cortex-M4 does)
PC Samples.
Data reads and writes.
Exception and interrupt events.
CPU counters.
Timestamps for these.
Instruction Trace (MTB and ETM) is good for: Trace adds significant power to debugging efforts. Tells where the program has been.
A recorded history of the program execution in the order it happened.
Trace can often find nasty problems very quickly.
Weeks or months can be replaced by minutes.
Especially where the bug occurs a long time before the consequences are seen.
Or where the state of the system disappears with a change in scope(s).
These are the types of problems that can be found with a quality trace: Pointer problems.
Illegal instructions and data aborts (such as misaligned writes).
Code overwrites – writes to Flash, unexpected writes to peripheral registers (SFRs), a corrupted stack. How did I get here ?
Out of bounds data. Uninitialized variables and arrays.
Stack overflows. What causes the stack to grow bigger than it should ?
Runaway programs: your program has gone off into the weeds and you need to know what instruction caused this. Is very tough to find these problems without a trace. ETM trace is best for this. See K60 lab for more information.
Communication protocol and timing issues. System timing problems.
34) Useful Documents: See www.keil.com/freescale 1. The Definitive Guide to the ARM Cortex-M3 by Joseph Yiu. (he also has one for the Cortex-M0).
2. MDK-ARM Compiler Optimizations: Appnote 202: www.keil.com/appnotes/files/apnt202.pdf
3. Kinetis FlexMemory: http://www.keil.com/appnotes/docs/apnt_220.asp
4. A list of resources is located at: http://www.arm.com/products/processors/cortex-m/index.php Click on the Resources tab. Or search for “Cortex-M3” on www.arm.com and click on the Resources tab.
5. forums.arm.com and www.keil.com/freescale and www.arm.com/cmsis

Copyright © 2012 ARM Ltd. All rights reserved
Freescale Cortex-M0+ Lab with ARM® Keil™ MDK toolkit www.keil.com
34
35) Keil Products and contact information: See www.keil.com/freescale Keil Microcontroller Development Kit (MDK-ARM™) for Kinetis processors:
MDK-Lite™ (Evaluation version) 32K Code and Data Limit - $0 MDK-Freescale™ For all Kinetis Cortex-M4, 1 year term license. RTX included. - $745
NEW !! MDK-ARM-CM™ (for Cortex-M series processors only – unlimited code limit) - $3,200 MDK-Standard™ (with included RTX RTOS with source code) - $4,895 MDK-Professional™ (Includes Flash File, TCP/IP, CAN and USB driver libraries) $9,500
USB-JTAG adapter (for Flash programming too) ULINK2 - $395 (ULINK2 and ME - SWV only – no ETM) ULINK-ME – sold only with a board by Keil or OEM. ULINKpro - $1,250 – Cortex-Mx SWV & ETM trace
A Keil ULINK must be purchased or you can use the OS-JTAG on the Kinetis Tower board. For Serial Wire Viewer (SWV), a ULINK2, ULINK-ME or a J-Link is needed. For ETM, a ULINKpro is needed. OS-JTAG does not support either SWV or ETM debug technology.
Note: USA prices. Contact [email protected] for pricing in other countries.
Call Keil Sales for more details on current pricing. All products are available.
For the ARM University program: go to www.arm.com and search for university. Email: [email protected]
All products include Technical Support for 1 year. This can be renewed.
Keil RTX™ Real Time Operating System
RTX is provided free as part of Keil MDK. It is the full version of RTX – it is not restricted or crippled. No royalties are required and is very easy to use. It has a BSD license. RTX source code is included with all versions of MDK. Kernel Awareness visibility integral to µVision.
MQX: See www.keil.com/freescale for a descriptive movie.
Prices are for reference only and are subject to change without notice.
For the entire Keil catalog see www.keil.com or contact Keil or your local distributor.
For Linux, Android, bare metal (no OS) and other OS support on Freescale i.MX and Vybrid series processors please see DS-5 at www.arm.com/ds5/.
For more information: Keil Sales In North and South America: [email protected] or 800-348-8051. Outside the US: [email protected]
Keil Technical Support in USA: [email protected] or 800-348-8051. Outside the US: [email protected].
For comments or corrections please email [email protected].
For the latest version of this document, contact the author, Keil Technical support or www.keil.com/freescale.
For more information: www.arm.com/cmsis and forums.arm.com