freeport-mcmoran sensor data and gis approach for...
TRANSCRIPT

Freeport-McMoRan
Sensor Data and GIS
Approach for
Visualization
July 23, 2015

Sensor Data
Sensor Data plays an important role in exposing the problems in the mine cycle
Sensors help determine severity of issue and thus prioritize the need for attention
Data for various sensors are available for example:
- Tire Pressure, Suspension Cylinder, Fuel Level, Flow Meters, Payload Status, Weather Stations, Ground Speed, Engine Load, Avg. Flow etc.
This presentation covers how Freeport-McMoRan is using GIS to visualize the suspension sensor data and then making the application available to site users for daily implementation and follow up.

Road Quality Overview
Project Goals
Objective: Use of Sensor and GPS data to measure road quality and identify adverse conditions for roads
Approach:
- Conduct onsite field observations to locate bad road conditions and observe truck behavior at those locations
- Analyze sensor data to identify key indicators of road condition using
- Suspension cylinder pressure
- GPS
- Visualize findings using geospatial technologies

Road Quality – Manual Observations
We used field observations to identify bad points in the road
Process
• Traveled to mines to take field observations
• Observed trucks hitting rough sections of road and logged data (see example)
• Used Garmin GPS to pinpoint location of observed road conditions
Big HoleLat:32.7933Long: -108.0835Time: 12:54Truck: 713
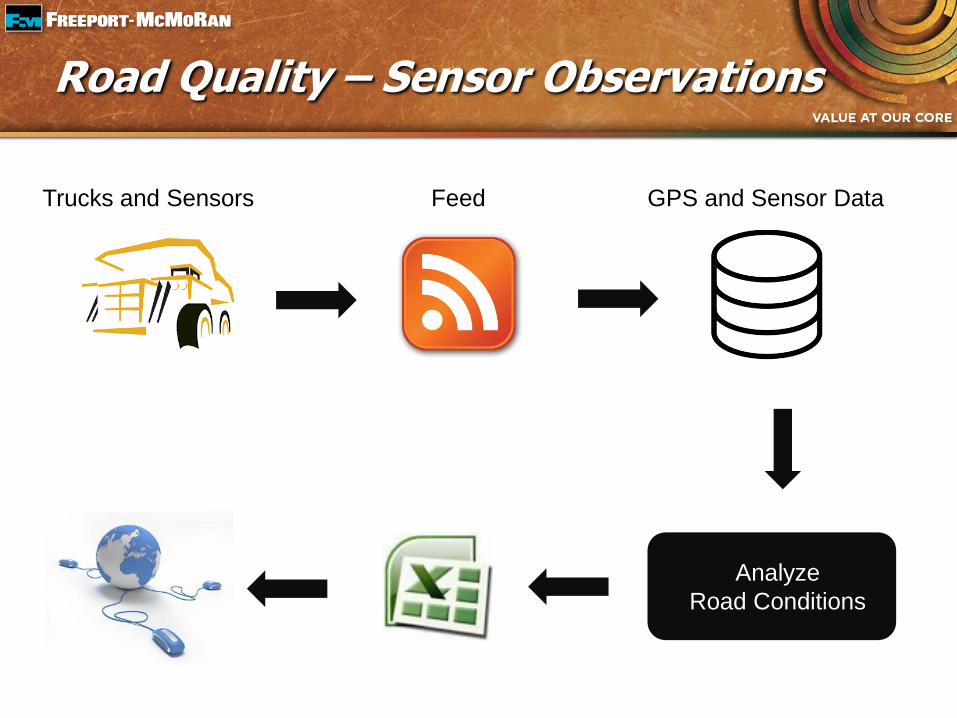
GPS and Sensor DataFeedTrucks and Sensors
Analyze
Road Conditions
Road Quality – Sensor Observations

GIS Methodology and Automation

Road Quality Visualized
Haul truck routes with Road Observations Heat Map™
Key
• Field Observation
• ‘Good’ Strut Pressure
• ‘Bad’ Strut Pressure
Chino - 1/15/2015

Road Quality Deployment Across Portfolio

Road Quality Summary
Objective
- Used sensor and GPS data to measure road quality and identify adverse road conditions
Operationalize
- Using ArcGIS platform, create road quality heat-map
- Create daily refresh of report
Opportunities
- Engage site operations to integrate into processes
- Capture opportunity – differences in speed between when segment is ‘good’ vs ‘bad’
- Build geospatial visualization that prioritizes bad segments based on impact-to-efficiency
- Create road health scorecard

10
Thank You
Questions and comments most welcome…
Road Quality & GIS Wrap Up