fred.olsen production asa - finansanalytiker · 24 months share price development of the fpso...
TRANSCRIPT

Fred.Olsen Production ASA
NFF conference 30th September 2010

THE COMPANY
“Who we are”
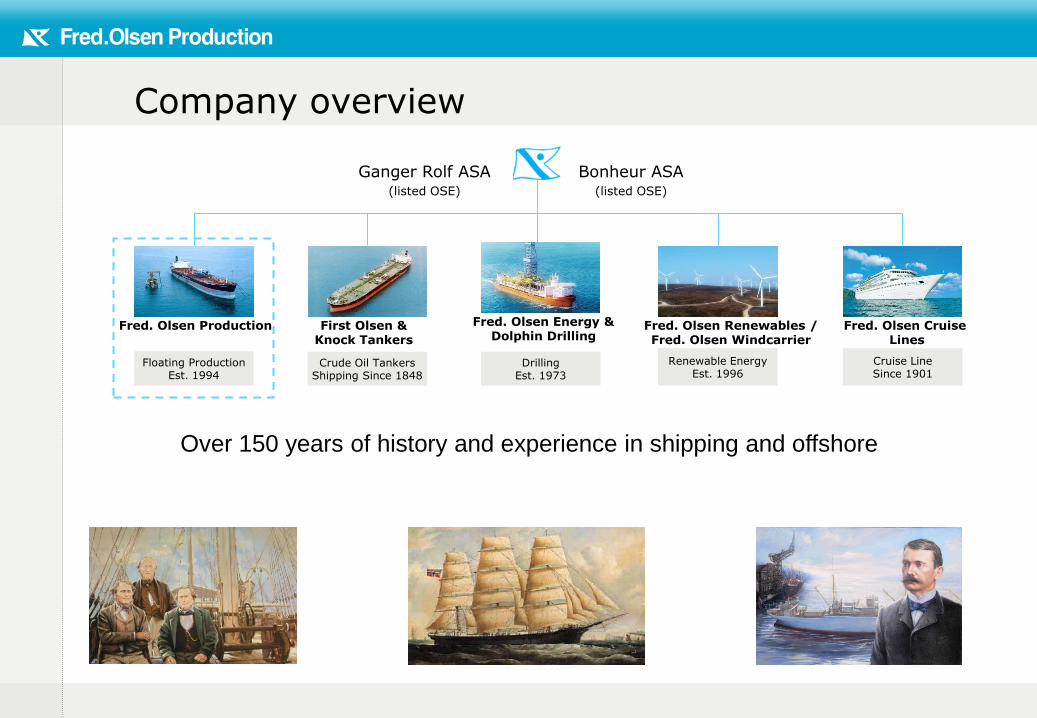
Company overview
Floating ProductionEst. 1994
Ganger Rolf ASA(listed OSE)
Bonheur ASA(listed OSE)
Cruise LineSince 1901
Renewable EnergyEst. 1996
Crude Oil TankersShipping Since 1848
DrillingEst. 1973
Fred. Olsen Production First Olsen &Knock Tankers
Fred. Olsen Energy &Dolphin Drilling
Fred. Olsen Renewables / Fred. Olsen Windcarrier
Fred. Olsen CruiseLines
Over 150 years of history and experience in shipping and offshore

Fred. Olsen Production – in brief
• Established FPS contractor since 1994
• Strong track record – 10 projects delivered
• Fleet of 4 production units:
– 3 FPSO’s
– 1 MOPU operation
• Top tier uptime performance
• Strong HSE performance
• FOP/FOM: ISO 9001, 14001 and 18001
• Approx. 450 personnel
• Core business in West Africa; worldwide presence

Track record
FSO ConversionKnock Taggart
Abacam - Nigeria
FSO ConversionKnock Nevis
Maersk - Qatar
FSO ConversionKnock Dee Soekor - SA
FPSO ConversionKnock TaggartAddax - Nigeria
FPSO UpgradePetróleo NautipaVaalco - Gabon
2009200820072006200520042003200220012000199919981997199619951994 2010
Jack-Up UpgradeBorgen Dolphin/Marc LorenceauAddax - Nigeria
Jack-Up ConversionBorgen Dolphin MOPU
Mobil Oil - Nigeria
FPSO ConversionPetróleo Nautipa
Ranger Oil - Angola
FPSO ConversionKnock Allan
CNR – Gabon
FPSO ConversionKnock Adoon
Addax - Nigeria

OPERATION
“What we do”

Current fleet & offices
Houston
Nigeria
Gabon
Oslo
Singapore
OfficeUnit
Port Harcourt
Port Gentil
Knock AllanFPSO Oil: 25,000 BOPDGas: 80 MMCFDPower 2 x 27MW
Knock AdoonFPSOOil: 60’000 BOPDGas: 10 MMCFDWI: 100’000 BWPD
Knock MuirAframax 93 builtTrading tanker in The Far East/India range
Petróleo NautipaFPSO (50% owned)Oil: 30,000 BOPDGas: 10 MMCFD
Marc LorenceauMOPU (management)Oil: 40,000 BOPDGas: 70 MMCFD

2007 2008 2009 2010 2011 2012 2013 2014 2015 2016 2017 2018 2019
Petroléo Nautipa
Knock Adoon
Knock Allan
Knock Muir
Marc Lorenceau
Long term contracted cashflow
Addax Petroleum - Nigeria 8y option
Addax (operations)
Vaalco - Gabon 2y option
Upgrade / Conversion
Option
Call-off option
Canadian Natural Resources – Gabon – 10 yrs (10y option)
Operations
Short term tanker T/C / Spot market

Upside potential for existing contracts
Etame Marine block; Gabon – FPSO Petróleo Nautipa
Field production horizon now extends past 2017; 2021 is likely
OML 123 block; Nigeria – FPSO Knock Adoon
Sinopec acquired Addax Petroleum August 2009
Additional reserves sanctioned to be developed through Knock Adoon
Further potential reserves being evaluated for tie-back
Field production horizon is beyond 2018
Olowi block; Gabon – FPSO Knock Allan
Platform B and C on stream; B is in line with expectations and promising
Drilling program for platform A and D expected to finish by 1Q 2011
Recoverable reserves stands at 50 million, to be reassessed when drilling program completed and results evaluated

Operational performance summary
Robust HSE performance
Excellent uptime record
Advantages from combination of maritime and offshore cultures
Vessel management and operation by Fred. Olsen Marine Services (FOM)
Full & effective integration of local staff in onshore and offshore organisation (up to 90% local staff on some units)

FINANCIALS

Financial snapshot
1H 2010 2009 2008
Turnover/revenue 57,9 115,0 80,9
EBITDA 26,4 50,7 30,7
Total assets 491,9 554,7 523,5
Book equity 249,3 264,6 263,3
Market capitalization 157,2 130,2 65,1
Enterprise value 296,3 257,1 191,1
USD million
EBITDA-margin 45,6 % 44,1 % 37,9 %
EV/EBITDA *) 5,6 5,1 6,2
*) EBITDA annualized 2010

24 months share price development of the FPSO companies listed in Oslo and the Oslo stock exchange benchmark. Indexed to 100 %

Financial multiples – listed FPSO operators
FPSO companies Market cap EV EBITDA
Ticker (USDm) (USDm) 2012E 2010E 2011E 2012E
SBM Offshore 2 829 4 525 771 2,7 2,7 2,6
BWO/PROD merged 1 166 2 630 537 3,6 2,8 2,2
Modec 703 1 091
BWO (consensus pre APL sale and merger) 757 1 223 315 2,8 2,2 1,5
Sevan 571 1 840 300 11,9 7,2 4,7
Prod (pre merger) 616 1 498 228 3,7 2,9 2,3
FOP 161 268 46 2,2 1,5 0,7
AKFP 16 756 102 7,8 6,8 6,1
Source: First Securities, Factset
NIBD/EBITDA (x)

THE FPSO MARKET
“..and where do we fit?”

Market Demand
Looking back (last 12 months):
Second half 2009: contract awards pick-up but mainly delayed projects – not a trend
First half 2010 contract activity (9 awards total):
Turn-key deliveries (EPC) – 2
Leases – 2
Redeployment – 5
Opportunities in mid-range (FOP) segment are presently limited –expected to pick up later in 2010; FOP is not in EPC market
General outlook:
External forecasts are back to 2007 levels (16-20+ per year)
Mix of projects is split 50%/20%/30% lease/redeploy/turnkey
Recovery from 2008 financial crisis is evident, including access to financing
Africa, now finally picking up (FOP “backyard”)

Market Supply
Vessel supply:
Speculative FPSO owners now out of the market. If not already on contract, likely to remain unused
Increased scrapping trend of older units (FOP, SBM, Modec, Oceaneering)
Redeployment has picked up but almost entirely on shorter contracts (5y or less)
9 vessels with contract ending in 2010, unless extended; of these 4 are 1970’s and all are 25 years old or older; further scrapping is likely
Competitive Picture:
Competitive field is reduced due to bankruptcies and retrenchment due to refinancing
Increased openings for raising capital, refinancing ongoing
No firm evidence of increased pricing discipline
Market is also segregating…… (see following slides)

Market segregation
The FPSO market is segregating into three main categories:
Top-end mega-projects (e.g. sub-salt in Brazil):
Capital intensive (CAPEX > $750 mill)
Highly complex vessels, high project execution risk
Resource intensive – large in-house teams
Mid range:
(Less) capital intensive ($250-700 mill)
Clients with balance sheet to match commitments
Complex but more flexible project execution model
Low end :
Short contract commitment
Increased residual value risk
Client credit risk

Segregation impacts – top-end
Strong growth in mega-projects (CAPEX > $750mill)
Only top-tier contractors can compete : SBM, Modec; BWO-PROD;
Driving consolidation at top end
Need for strong financial partners
Unique commercial challenges for these projects:
Longer contracts
Vessels likely to operate on single contract only
Reduced extension upside
New accounting model for leases (Exposure Draft 17. august 2010 by
IASB/FASB) – imply financial lease on the balance sheet for clients
Local content requirements increasingly onerous
EPC deliveries more and more common
Limited number of contractors, but major oil company clients maintain tight control of margins and commercial terms
Hypothesis 1– top-end: high value, high volume, lower margin, medium risk (if good project control in place – otherwise high), capital intensive projects. The major players need them and have to grow & adapt accordingly.

Segregation impacts – low-end
At the other end of the scale:
Low-end projects have been absent from the market:
Small fields with limited reserves, significant oil-price sensitivity
Clients without sufficient financing/balance sheet –counterparty risk
Shorter commitment (client financiers restriction) conflicts with financing needs/residual value risk of contractor
Result is either limited development in this segment or higher risk contracts (financier, contractor and client risk).
This niche used to be the “breeding ground” of FPSO start-ups, but is now the preserve of private equity or single vessel companies.
Hypothesis 2 – low-end: High risk contracts with comparatively higher margins but tempered by high residual value risk wiping out all value

Segregation impacts – mid range
Mid-range:
Capital requirement and complexity are a hurdle to entry for new contractors
Track record and financial standing are important
Balanced risk profile – opportunity to utilize effective risk sharing between contractor and client.
Lease model adds value - contractor is a key element to facilitating project sanction
Medium duration fixed term contracts, more emphasize on option years with contractor upside in reserve development, new tie-ins and/or oil price and production bonuses
Limited competitive field unless the top-tier companies “drop down” due to lack of top-end work
Hypothesis 3 – mid range: Balanced risk provided project control is in place. Robust margins if bidding is selective. Greater potential for growth/contract extension. The place to be?

Source: Fearnley Offshore
FPSO Operators

Outlook
Good prospects for new projects in 2011 as Africa also recovers
FOP has actively pursued Asian projects and remains well positioned
FOP positioned in mid range segment
Existing contracts have strong potential to add value

Fred. Olsen Production ASA:
Long term cash flow
Excellent operational track record
Cost efficient operation, tight cost control
Asset portfolio tidied-up in 2009/10
Trading Aframax tanker as FPSO/FSO conversion candidate
Attractive long term financing in place
Low balance sheet gearing
Strategic and financial partner in place
Well positioned to expand portfolio in mid range segment
Market value 60% of book value
Favorable financial multiples compared to other FPSO operators
A partner in a consolidation case?