frbsf_let_19850329.pdf
TRANSCRIPT
7/21/2019 frbsf_let_19850329.pdf
http://slidepdf.com/reader/full/frbsflet19850329pdf 1/4
R S
March 29, 1985
W KLY
L TT R
Leading
conomic
dicators
Movements in the Index
of
Leading Economic
Indicators
Ill),
compiled by the Department
of
Commerce,
typically
garner front-page attention.
Every wiggle
is
analyzed by government and
business economists for signals about the future
health
of
the economy with good reason.
Each
post-war business cycle peak and trough
has
been preceded
by
a significant decline and rise
in
the ILl. The current recovery
is
no exception:
eight months prior to the beginning
of
the
upswing in December 1982, the index
of
leading
economic
indicators began to rise.
oise nd ws
There are, however, at least two difficulties
with
using the index
as
a forecasting aid. The first
is
that, except
with
the benefit
of
sufficiently long
hindsight,
it is
often
difficult
to judge at the t ime i t
occurs whether
an
upturn
or
downturn in the
index will
be sustained. The index often exhibits
short-term swings that are soon reversed. Since
May
1984, for example, the II I has changed
direction
six times.
To
filter
out
this
noise
in the
numbers, analysts often apply rules-of-thumb. A
common rule is that a change in the direction of
the index lasting at least three consecutive
months constitutes a signal of recession or
recovery to come. On this basis, initial estimates
of the index in 1984 signalled a recession
th y
declined in June, July and August. But just
released revisions of the index now show that i t
rose in August. Thus, there were
only two
con
secutive months of decline rather than three.
The second difficulty in interpreting the II I
is
that
the future it may help to predict
is
somewhat
indefinitely far ahead. Major downturns in the Ill,
for example, have occurred anywhere from three
to twenty-three months ahead
of
actual down
turns. Upturns in the index have started from one
to eight months before the economy bottomed
out. The problems
of
judging sustained changes
in the index and
of
the relatively short average
leadtime
between turns in the index and turns in
the economy particularly for troughs have led
some analysts to argue that the principal value
of
the ILI lies in its ability to identify the current state
of
the economy. Since much economic data are
available only
after the fact and since they often
are subject to substantial revisions, even being
able to predict the present
is
valuable.
onstru tion
Despite these reservations, the
II I
has the advan
tage
of
diversification:
it is
a composite index
made up
of
many different series. Movements in
economic activity originate from different
sources at different times and the response
of
the
economy to any given stimulus may itself vary
over time.
By including
a
wide
range
of
series
covering many different activities, the composite
index
is
more likely to detect important changes
in the level
of
aggregate
economic
activity,
regardless
of
the source
of
those movements.
From time to time, the series used to construct the
II I
have changed. The last
major
revision
took
place in 1975 when a number
of
series were
specified in real,
or
constant dollar, terms rather
than in current
dollar
terms. Since then,
new
weights have been assigned to the
individual
series in light
of
past experience, and the
defini
tions
of
some
of
the series have changed. The
twelve series currently used to construct the
composite index were selected on the basis
of
six
criteria:
1)
economic significance, 2) statistical
adequacy, 3) consistency of timing at busil }ess
cycle peaks and troughs,
4)
conformity to the
business cycle generally,
5)
smoothness, and 6
prompt availability of data.
The significance criterion emphasizes series that
represent what are thought to be important
sources of business cycle movements. Statistical
adequacy requires that the available data series
faithfully measure movements in those sources.
The requirement of consistency focuses attention
on series that have reliably turned upward and
downward prior to troughs and peaks in overall
economic activity. Conformity refers to
how
con
sistently a series moves
with
the overall pattern
of
activity, not just at business cycle
turning
points.
The smoothness criterion gives emphasis to series
whose changes in direction are likely to be
maintained. And the availability criterion ensures
that the data for the series are available soon after
the fact.
7/21/2019 frbsf_let_19850329.pdf
http://slidepdf.com/reader/full/frbsflet19850329pdf 2/4
R S
The different series reflect developments in many
areas
of
the
economy:
in labor markets new
unemployment insurance claims, average weekly
hours in manufacturing); in financial markets
(common
stock prices, real money supply, percent
change in private credit); in residential construc
tion
(new
building permits); in business activity
net business formation, real value
of
contracts
and
orders
for
plant and equipment, change in real
inventories on hand and on order, real value of
new orders for consumer goods, percent of com
panies receiving slower deliveries); and in prices
percent change in sensitive materials prices).
The recent surge in U S imports provides a vivid
example of why a broadly based III generally
provides
better signals than anyone
of
its compo
nent
series.
Import
penetration has been concen
trated in goods rather than services. It s not
difficult for Americans to buy French autos; it is
more
difficult to buy French taxi rides, unless one
goes to France.) This has been especially true in
the business equipment industry. About one
quarterof total expenditures by domestic business
fo r durables recently
has
been for foreign items.
Thus,
looking
at orders alone would suggest
weakness in the U S economy.
This, however,
is not
the case. The strength of
demand
from other sources has overwhelmed the
depressing effects on the economy of the import
surge. Because the
III
includes non-orders series
as
well as
orders series, it accurately reflects this
strength in the economy. In fact, through its
effects on interest rates and the
dollar
exchange
rate, the strength of demand in these other sectors
has
contributed to
the surge in imports.)
nfl tion n supply shocks
The Il l s component series were selected pri
marily
on
the basis of their records over the
1947-70 period. Peacetime business cycles in that
period took place in
an
environment of low
inflation, and were driven primarily by shocks
to aggregate domestic spending as government
and private sector behavior shifted. Since 1970,
the American economy has also been buffeted by
disturbances in aggregate supply and by shocks
originating
externally. Moreover, since the late
1960s, the underlying and observed rates of
inflation have been through three cycles: the late
1 96 0s rise t ha t cul mi na te d in a fall w he n p rice
controls were imposed in 1971; the mid-1970s
rise
brought on
by OPEC, and the subsequent fall;
and the rise in the late 1970s, again associated
with
OPEC, and the dramatic decline since 1980.
These alternating periods of relatively high and
low inflation make interpretation of the index
as
currently
constructed problematic.
The level of common stock prices, percent
changes in sensitive materials prices, and percent
changes in private credit are three series included
in th e in de x t ha t can d isto rt the i nd ex as an
indicator of real activity because they are not
adjusted for changes in the overall level of prices.
When
variations in the inflation rate are relatively
small, these distortions are relatively unimportant.
But suppose there were a sudden large drop
in
inflation from an average rate often percentto five
percent. After the adjustments to this new situa
tion, materials prices and credit growth rates each
wou Id
be
five percent lower than before. Although
these lower growth rates would not indicate
weaker real growth in the demand
for
or
supply of
materials
orcredit,
their inclusion in the III would
tend to depress the level of the index.
Similarly, the Standard and Poor s
500
stock
price
index enters the III in units unadjusted
for
the
higher level of aggregate prices. If stock prices
generally rise one-for-one with the aggregate
price level, the unadjusted stock price index
would
rise, other things being equal, at the rate of
inflaton. This will tend unduly to elevate the III
even
ifthe
real value of equities is unchanged. In
the post-1980 period, when inflation slowed
dramatically but the price level continued to rise,
the effects of these forces would presumably have
tended to offset each other to
an
unknown extent.
Even adjusting materials price inflation
for
general
inf lation may not convert it into a reliable signal
when there are shocks to aggregate supply as well
astoaggregatedemand.lftherewereonlydemand
shocks, the inflation-adjusted,
or
relative, price of
materials may bear a consistent relation to aggre
gate economic activity. For example, if such prices
rose
quickly and generally in advance
of
increases
in aggregate demand and output, they would
put
upwar d pressure on the IL However, if there were
a disturbance that reduced the supply of raw
materials, the relative price
of
this supply
would
also rise, but tend to be associated
with lower
economic activity. In this case, the III again would
show
an
increase even though economic activity
would have weakened. This is what happened
both in the
middle
and late 1970s
when
the world
7/21/2019 frbsf_let_19850329.pdf
http://slidepdf.com/reader/full/frbsflet19850329pdf 3/4
price of oil skyrocketed. The possibility of simul-
taneous supply and demand shocks makes
it
difficult to interpret what movements in this
component imply about the future state of the
economy without supplementary information on
the source of such movements.
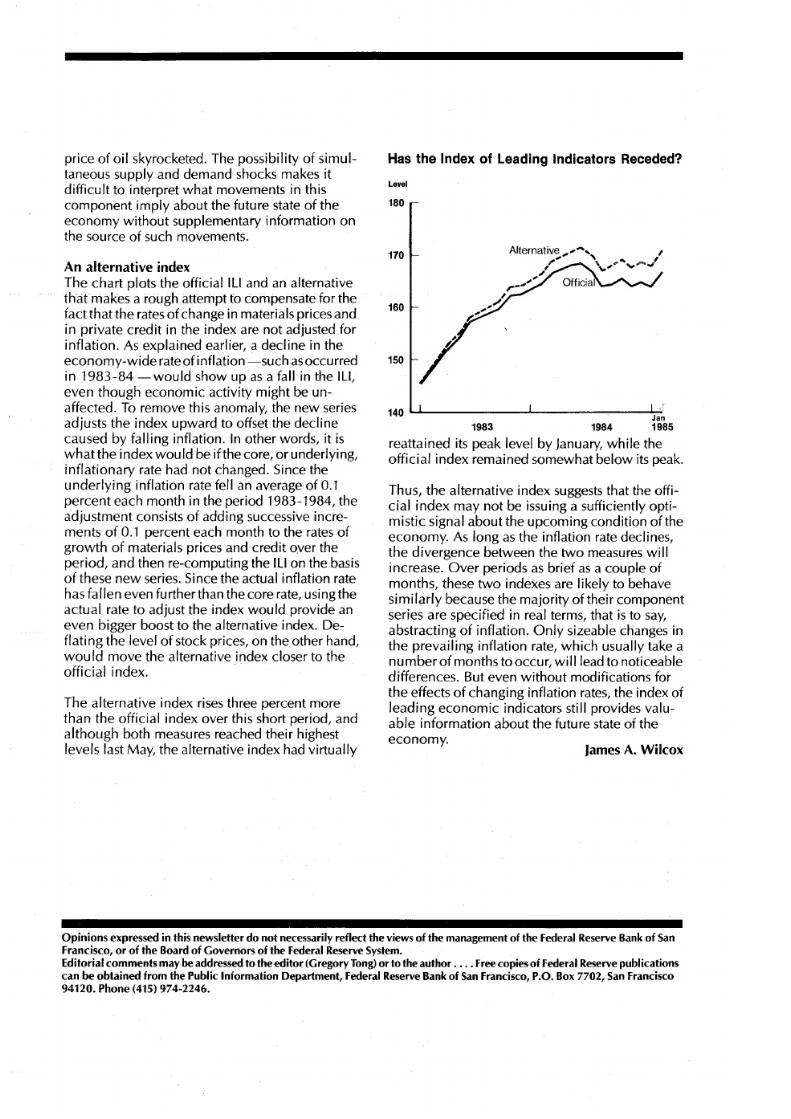
as the Index of Leading Indicators Receded
Level
180
James A. Wilcox
Thus the alternative index suggests that the offi-
cial index may not be issuing a sufficiently opti-
mistic signal about the upcoming condition of the
economy.
As
long
as
the inflation rate declines
the divergence between the two measures will
increase. Over periods as brief as a couple of
months these
two
indexes are likely to behave
similarly because the majority of their component
series are specified in real terms that
is
to
say
abstracting of inflation. Only sizeable changes in
the prevail ing inflation rate which usually take a
nu mber
of
months to occur wi
II
lead to noticeable
differences. But even
without
modifications for
the effects
of
changing inflation rates the index of
leading economic indicators still provides valu-
able
information about the future state
of
the
economy.
160
170
150
hn
1983 1984
1985
reattained its peak level by January while the
official index remained somewhat below its peak.
The alternative index
rises
three percent more
than the official index over this short period and
although both measures reached their highest
levels last May the alternative index had virtually
An
alternative index
The chart plots the official II I and an alternative
that
makes a rough attempt to compensate for the
fact that the rates of change in materials prices and
in private credi t in the index are not adjusted for
inflation. As explained earlier a decline in the
economy wide
rate
of
inflation
such
asoccurred
in
1983 84
woul show up as a fall in the
Il l
even though economic activity might be un-
affected.
To
remove this anomaly the new series
adjusts the index upward to offset the decline
caused by falling inflation.
In
other words
it is
whatthe
index would be if the core or underlying
inflationary rate had not changed. Since the
underlying inflation rate fell
an
average of 0 1
percent each month in the period 1983 1984 the
adjustment consists
of
adding successive incre-
ments
of 0 1
percent each month to the rates
of
growth
of
materials prices and credit over the
period and then re computing the II I on the basis
of
these
new
series. Since the actual inflation rate
has fallen even further than the core rate using the
actual rate to adjust the index would provide
an
even bigger boost to the alternative index. De-
flating
the level
of
stock prices on the other hand
would
move the alternative index closer to the
official
index.
pinions
expressed in this newsletter
do not
necessarily reflect
the
views
of
the management of the Federal Reserve Bank of San
Francisco, or
of
the Board of Governors
of the
Federal Reserve System. . . .
Editorial
comments
may be addressed
to
the editor GregoryTong
or
to
the
author Free copies
of
Federal Reserve p u h c ~ l o n s
can be
obtained
from
the
Public Information Department, Federal Reserve Bankof San FranCISco P.O. Box 7702, San FranCISco
94120.
hone
415 974-2246.
7/21/2019 frbsf_let_19850329.pdf
http://slidepdf.com/reader/full/frbsflet19850329pdf 4/4
u o ~ 6 U l j s o m l o ~ n U060JO 0POi\0U
Ol.j0PI omoH O UJoJ l0 ouozP8 o} jsol8
O SI UOJ f
UOS
JO ~ U
a a S a ~
OJapa l
~ u a w ~ J o d a a
l pJoasa8
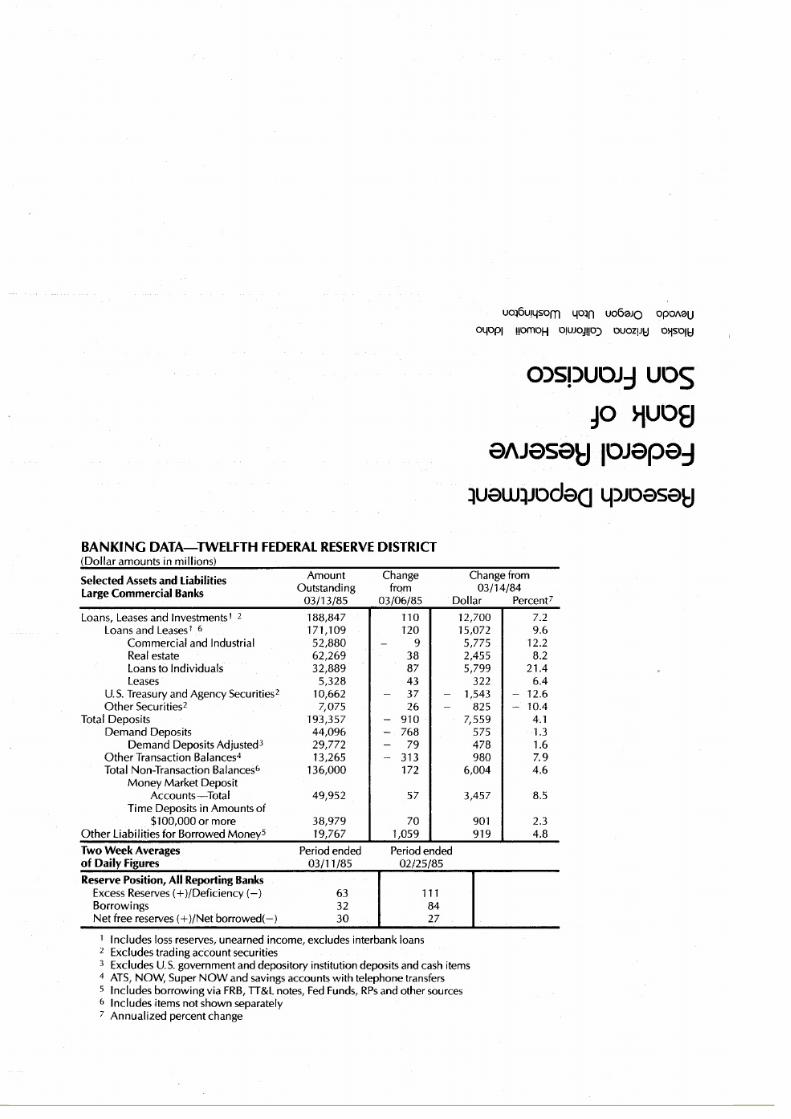
B NKING
D T TWELFTH FEDERAL RESERVE
DISTRICT
Dollar amounts in millions)
Selected
Assets and Liabilities
large Commercial
Banks
Amount
Outstanding
03/13/85
Change
from
03/06/85
Change from
03/14/84
Dollar Percentl
Loans, Leases and Investments1 2 188 847 110 12 700 7.2
Loans and Leases 1 6
171 109 120 15 072 9.6
Commercial and Industrial
52,880
-
9
5 775 12.2
Real
estate 62,269 38 2 455 8.2
Loans
to
Individuals 32,889
87
5 799
21.4
Leases 5,328 43 322 6.4
U.S. Treasury and Agency Securities
2
10 662
-
37
-
1 543
-
12.6
Other
Securities
2
7 075
26
-
825
-
10.4
Total Deposits
193 357
-
910
7 559 4.1
Demand Deposits 44,096
-
768 575
1.3
Demand Deposits Adjusted
3
29 772
-
79
478 1.6
Other Transaction Balances
4
13 265
-
313 980 7.9
Total Non-Transaction Balances
6
136 000 172 6 004
4.6
Money
Market Deposit
Accounts-Total 49 952 57 3 457 8.5
Time Deposits in Amounts
of
100 000
or
more 38,979 70
901 2.3
Other Liabilities for Borrowed MoneyS 19 767 1 059 919 4.8
Two
Week
Averages
of Daily
Figures
Reserve Position All Reporting Banks
Excess Reserves )/Deficiency -
Borrowings
Net
free reserves )/Net borrowed(-
Period ended
03/11/85
63
32
30
Period ended
02/25/85
111
84
27
1 Includes loss reserves, unearned income, excludes interbank loans
2 Excludes trading acc:ount securities
3
Excludes U.S. government and depository institution deposits and cash items
4
ATS, NOW
Super
NOW
and savings accounts
with
telephone transfers
S Includes borrowing via
FRB,
TT L notes, Fed Funds, RPs and other sources
6 Includes items not shown separately
7 Annualized percent change