frbclev_econtrends_200701.pdf
TRANSCRIPT

In Th is IssueEconomy in Perspective
Economic Trends in Perspective Infl ation and Prices
Infl ation ExpectationsTrimmed Mean CPI Infl ation November Price Statistics
Money, Financial Markets, and Monetary PolicyMarket Expectations of Policy Rates Interest Rates, Yields, Outstanding Debt, and Consumer Attitudes Th e Yield Curve’s Predictive Power
International Current Account Sustainability
Economic Activity Labor Market Conditions ISM Report on Business ActivityHousingLabor Turnover Durable Goods Revised GDP
Regional Economic ActivityEmployment ConditionsState Per Capita Personal Income Th e Akron MSA
Banking and Financial Institutions Banking Conditions
Economic TrendsFederal Reserve Bank of Cleveland
January 2007(Covering December 21, 2006 - January 10, 2007)

Economic Trends is published by the Research Department of the Federal Reserve Bank of Cleveland.
Views stated in Economic Trends are those of individuals in the Research Department and not necessarily those of the Fed-eral Reserve Bank of Cleveland or of the Board of Governors of the Federal Reserve System. Materials may be reprinted provided that the source is credited.
If you’d like to subscribe to a free e-mail service that tells you when Trends is updated, please send an empty email mes-sage to [email protected]. No commands in either the subject header or message body are required.
ISSN 0748-2922

1
Th e Economy in Perspective 01.10.07by Mark S. Sniderman
Economic Trends in Perspective…Th e Federal Reserve Bank of Cleveland has been publishing Economic Trends since 1981, and for the past 25 years it has looked more or less the same: Trends has consisted of 20 to 24 pages of ma-terial that briefl y analyzed a variety of regional, national, and international economic topics and presented a few graphic images on each page. With this issue, we are breaking new ground—Economic Trends is going fully electronic and will be updated regularly on our Web site. Instead of waiting until the second Th ursday of each month for the entire issue to be posted, you can now read our analysis as soon as it is written. We are confi dent that Trends readers will benefi t by receiving this information with the swiftness that Internet posting allows. At the same time, we still intend to cover some longer-term issues that merit attention.
But Trends had another incarnation even before the initial print publication. For as long as anyone can recall, the Bank’s Research Department has presented a monthly analysis of economic conditions and monetary policy—com-plete with visual aids—to the Board of Directors. (Does anyone remember overhead projectors and fi lm transparen-cies?) In the late 1970s, we began producing hard copy of the transparencies, putting a sentence or two of text on each page, spiral binding the whole set together, and handing them out at Board meetings.
Th e Bank had always been strongly committed to giving the public reliable, free access to our research and analysis. We soon realized that because our monthly analysis did not contain any confi dential information, economists could distribute it to their audiences when they gave speeches to outside organizations. We discovered that people really liked having these booklets and wanted to obtain them regularly. From, there, it was a short hop to recognizing an opportunity for sharing information with the general public through subscription to what you now know as Eco-nomic Trends.
Even though we have not altered the design of Trends much over the years, the technology for producing it has changed a great deal, with ever-more-sophisticated software packages enabling us to move information from da-tabases to charts and tables more quickly and accurately. And now, Web-posting our Trends pages on a fl ow basis, rather than once a month, will enable us to provide the data you want in an even more timely way. Th e Web format provides other advantages as well. Previously, each Trends page had a fi xed number of text lines and square inches of graphics. In the Web format, we can tailor the length of text and number of graphics to the topic at hand. Moreover, readers who are interested in particular topics can simply select the pages they want to view and disregard the rest.
With the introduction of the Web-based Trends, we are discontinuing our hard-copy production and mailing. Read-ers can always print out the pages they want to have in paper form, and visitors to the site will be able to print an entire “issue” (30 days of Trends postings, in which all the regular Trends topics are covered) with a single click at any time. Th is will give you our most recent set of analysis and graphics whenever you want it, not just on the monthly cycle we followed in past issues.
I will continue writing the “Economy in Perspective” feature and posting it in the fi rst half of each month, around the time of our monthly Board meetings. Th e exact posting dates will be listed on our Web site. If you subscribe to our electronic mailing list, you are already being periodically informed about our new postings. If you are not cur-rently a subscriber, you can become one by going to our Econpubs page. Should you have comments or questions about our new online-only Trends, we’d love to hear from you. Check your mail for a survey you can send back to us or send us an email.

2
Infl ation and Prices Infl ation Expectations
01.10.07by Michael Bryan and Linsey Molloy
Keeping infl ation expectations “contained” seems to be an important preoccupation for central bank-ers. Th is is because the expectation of higher infl a-tion induces changes in economic behavior that impose costs on the economy, which, over time, are detrimental to long-term prosperity. For example, when people anticipate an increase in infl ation—and the corresponding decline in the purchasing power of their money—they are more likely to invest their wealth in real assets, such as land or commodities. Th is reallocation is a less effi cient use of resources than what may have occured if people didn’t have to seek this infl ation-protected form of saving. Rising infl ation expectations may also help to perpetuate an otherwise temporary rise in prices, making the job of maintaining price stability more diffi cult to achieve.
To gauge infl ation expectations, economists turn to a number of sources, including surveys of consum-ers, fi nancial market data, and economists’ predic-tions. A recent look at each of these sources shows infl ation expectations are running anywhere from 1 to 3-1/2 percent, depending on the source and the period over which infl ation expectations are pro-jected (1 to 10 years).
Consumers’ year-ahead infl ation expectations were elevated in the wake of Hurricane Katrina and geopolitical issues that drove up the price of oil through last summer but have since tumbled down-ward. Consumers now anticipate that prices will rise about 3-1/2 percent over the next year. Long-term infl ation expectations—which have been slightly higher, on average, over the past couple of years—indicate that consumers anticipate that prices will rise about 3-1/2 percent over the next 5 to 10 years as well.
-3.0-2.5-2.0-1.5-1.0-0.50.00.51.01.52.02.53.03.54.04.55.05.56.0
1995 1997 1999 2001 2003 2005 2007 2009
Annualized quarterly percent change
Top 10 average
Bottom 10 average
Consensus
CPI Inflation and CPI Inflation Forecasts*
*Blue Chip panel of economists.Source: Blue Chip Economic Indicators, January 10, 2007.
0.75
1.00
1.25
1.50
1.75
2.00
2.25
2.50
2.75
3.00
3.25
3.50
1997 1999 2001 2003 2005 2007
Percent, monthly
10-year TIPS-derived expected inflation
Adjusted 10-year TIPS -derived expected inflation a
Market-Based Inflation Expectations*
*Derived from the yield spread between the 10-year Treasury note and Treasury inflation-protected securities. a. Ten-year TIPS-derived expected inflation, adjusted for the liquidity premium on the market for the 10-year Treasury note.Sources: Federal Reserve Bank of Cleveland; and Bloomberg Financial Information Services.

3
One source of data from fi nancial markets that can be used to guage infl ation expectations is a compar-ison of the returns on Treasury infl ation-protected securities (TIPS) and regular (nominal) Treasury securities (click here for data and an overview and here for more detail). TIPS-derived infl ation ex-pectations have come down a bit in recent months: Investors now expect prices to rise between 2 and 2 ¼ percent over the next 10 years.
Meanwhile, the Blue Chip panel of economists anticipates that quarterly infl ation will fall dramati-cally in the fourth quarter of 2006 and average about 2-1/2 percent over the next two years. In light of the relatively sanguine infl ation report for November, the distribution of 2007 forecasts has shifted downward a bit. In December, the consen-sus forecast was for a 2.1 percent annual growth rate in the CPI in 2007, with a majority of forecast-ers predicting a 2 to 2-1/2 percent rise in the CPI. In January, the consensus forecast ticked down to 2 percent, with a majority of forecasters predicting a 1-1/2 to 2 percent rise in the CPI in 2007.
0
5
10
15
20
25
30
35
40
45
50
1.0 to 1.5 1.5 to 2.0 2.0 to 2.5 2.5 to 3.0 3.0 to 3.5 3.5 orgreater
Percent of forecasts
Annual percent change, 2006 to 2007
December 10, 2006January 10, 2007
Distribution of 2007 CPI Forecasts*
*Blue Chip panel of economists.Sources: Blue Chip Economic Indicators, December 10, 2006 and January 10, 2007.
1.0
1.5
2.0
2.5
3.0
3.5
4.0
4.5
5.0
5.5
6.0
1995 1997 1999 2001 2003 2005 2007
12-month percent change
Five to 10 years ahead
One year ahead
Household Inflation Expectations*
*Mean expected change as measured by the University of Michigan’s Survey of Consumers.Source: University of Michigan.

4
Infl ation and Prices Trimmed Mean CPI Infl ation
01.10.07 by Michael Bryan and Linsey Molloy
In a recent speech Governor Kohn of the Federal Reserve System noted that
“[c]ertainly, the recent data on consumer pric-es have been encouragingly consistent with the downward tilt to infl ation that the FOMC has been expecting. However, we need to be cau-tious about extrapolating trends from a couple of months of data. Th e data themselves are noisy—subject to month-to-month variations that are unrelated to more-persistent develop-ments. And we need to recognize that some of the very recent disinfl ation may represent one-time infl uences.”
Separating transitory “noise” from the price data to reveal the more persistent infl ation trend that the central bank hopes to control is diffi cult—and controversial. It is diffi cult because it is often un-clear when a price change is transitory and when it signals a change in the infl ation trend. It’s contro-versial because ignoring certain price signals may be interpreted as a selective and perhaps biased inter-pretation of the data.
Th e most common approach to reducing the “noise” in the price data is the so-called Core CPI measure, which excludes the prices of food and energy items. Th is measure certainly eliminates two of the most volatile, or “noisy” components in the U.S. retail price data. But this approach does not address transitory price fl uctuations in other com-ponents of the retail market basket. And because it systematically eliminates two components from the retail market basket, it may also bias the infl ation measure—if there are long-term movements in the prices of food and energy relative to other goods and services.
An alternative approach uses “trimmed-mean esti-mators,” which eliminate any price change above or below a certain threshold, regardless of what the component is. In the CPI, for example, one com-monly sees a signifi cant portion of the items in the
0
5
10
15
20
25
30
35
40
45
50
<0 0 to 1 1 to 2 2 to 3 3 to 4 4 to 5 >5
Weighted frequency
Average annualized monthly percent change
Average inflation ratesCPI: 2.6%Core CPI: 2.2%Median CPI: 2.9%16% trimmed-mean CPI: 2.3%
CPI Component Price-Change Distribution, January 1998 to November 2006
Source: U.S. Department of Labor, Bureau of Labor Statistics.
1.00
1.50
2.00
2.50
3.00
3.50
4.00
4.50
5.00
5.50
6.00
6.50
1990 1992 1994 1996 1998 2000 2002 2004 2006
12-month percent change
CPI
Median CPI
20% trimmed-mean CPI
40% trimmed-mean CPI
60% trimmed-mean CPI
80% trimmed-mean CPI
Trimmed-Mean CPI
Sources: Department of Labor, Bureau of Labor Statistics; and Federal Reserve Bank of Cleveland.

5
market basket with price increases well above or be-low what the infl ation trend ultimately is revealed to be.
Where the appropriate threshold lies is unclear, as is the question of which items get excluded from consideration are unclear. We can exclude the most extreme, say 5 percent, from each tail of the price-change distribution, resulting in a “10 percent trimmed-mean” infl ation estimate. Or we could calculate a more substantial trim—say 49-1/2 per-cent from each tail to produce the median CPI.
In December, the 12-month change in the CPI was 2 percent. But the trimmed-mean CPI estimates showed considerably higher trends, ranging from about 2-1/2 percent for the 20 percent trimmed mean, to around 3-1/2 percent for the median CPI. Each trimmed-mean estimate can give a dif-ferent read on the underlying infl ation trend, so which one comes closest to measuring the infl a-tion trend that we ultimately see in the data? We fi nd that once we trim about 8 percent off each tail of the CPI monthly price-change distribution (a 16 percent trimmed mean), we have reduced a substantial amount of the volatility in the monthly data. More extreme trims of the CPI distribution result in nearly the same stability, which means it is hard to distinguish between the relative accuracy of any trimmed-mean CPI estimator from the 16 percent trimmed-mean to the median CPI. And all of these trimmed-mean estimates appear to give a better reading of the infl ation trend than the more traditional “core” approach.
How do we know that these trimmed-mean esti-mators don’t eliminate some of the infl ation “sig-nal?” Well, we don’t, and this is always a risk when appealing to any “core” infl ation measures when trying to gauge underlying price pressure. Still, repeated tests in the United States and for other nations (for example, Australia) indicate that these trimmed-mean estimators seem to track the future behavior of the CPI better than either the CPI or the more traditional Core CPI.
In other words, whatever is being excluded, or trimmed, from these measures doesn’t seem to be very helpful in telling us where the infl ation trend is headed.
0.000
0.005
0.010
0.015
0.020
0.025
0.030
0.035
0.040
0.045
0.050
0.055
Time-series variance
CPI
1 5 10 15 20 25 30 35 40 45 50
Core CPI
a
Volatility of One-Month Percent Changes in the Trimmed-Mean CPI Inflation Measures, January 1990 to November 2006
a. The 50 percent trimmed-mean CPI is equivalent to the Median CPI.Sources: Department of Labor, Bureau of Labor Statistics; and Federal Reserve Bank of Cleveland.
1.01.11.21.31.41.51.61.71.81.92.02.12.22.32.42.52.6
CPI
1 5 10 15 20 25 30 35 40 45 50
Core CPI
Root mean-squared error
a
Forecast Accuracy of the One-Month Annualized Percent Change in the Trimmed-Mean CPI Inflation Measures in Predicting CPI Inflation over the Next 12 Months
a. The 50 percent trimmed-mean CPI is equivalent to the Median CPISource: U.S. Department of Labor, Bureau of Labor Statistics; and Federal Reserve Bank of Cleveland.

6
Infl ation and Prices November Price Statistics
12.21.06by Michael Bryan and Linsey Molloy
Th e Consumer Price Index (CPI) was unchanged in November following two months of substan-tial declines. Monthly growth in the core infl a-tion measures showed a marked deceleration from longer-term trends in November. Like the CPI, the CPI excluding food and energy was also largely unchanged (rose at a 0.6 percent annualized rate) during the month. Th e 16 percent trimmed-mean CPI, which eliminates 8 percent of weighted com-ponents with both the largest and smallest monthly price changes, rose a modest 1.0 percent (annual-ized rate), while monthly growth in the median CPI has come down a bit to 3.0 percent (annual-ized rate).
Longer-term infl ation trends were still relatively high in November yet appear to be decelerating some from their recent peaks. Both the 12-month growth rate in the CPI excluding food and energy, as well as the 16 percent trimmed-mean CPI, are down over 1/4 percentage point since 2006Q2, yet remain elevated at rates between 2-1/2 and 2-3/4 percent. Th e longer-term trend of the median CPI, however, continued to accelerate during the month to its highest rate since mid-2002.
While the shorter-term trends in the retail price measures seem to suggest on the surface that infl a-tion rates slowed during the month, the curious component price distribution makes it diffi cult to identify any underlying trend among retail prices. Indeed, a mere 10 percent of the CPI registered price increases in the 0 percent to 3 percent range—the range which most economists consider to be consistent with the current infl ation trend. Th e monthly price declines off set the sizeable monthly price increases: Either prices were falling (34 percent of the CPI), or rising in excess of 3 percent (about 55 percent).
November Price Statistics Percent change, last
1mo.a 3mo.a 6mo.a 12mo. 5yr.a 2005 avg.
Consumer prices
All items 0.0 -3.9 -0.2 2.0 2.6 3.6 Less food and energy 0.6 1.6 2.3 2.6 2.0 2.2 Medianb 3.0 3.4 3.8 3.7 2.7 2.5 16 percent trimmed
meanb1.0 1.5 2.2 2.5 2.2 2.6
Producer prices
Finished goods 26.4 -3.9 -0.6 0.9 2.9 5.7 Less food and energy 16.3 3.9 1.1 1.8 1.2 1.5
a. Annualized.b. Calculated by the Federal Reserve Bank of Cleveland.Sources: U.S. Department of Labor, Bureau of Labor Statistics; and Federal Reserve Bank of Cleveland.
1.001.251.501.752.002.252.502.753.003.253.503.754.004.254.504.75
1995 1997 1999 2001 2003 2005 2007
12-month percent change
Core CPI
CPI
CPI and CPI Excluding Food and Energy
Source: U.S. Department of Labor, Bureau of Labor Statistics.

7
1.001.251.501.752.002.252.502.753.003.253.503.754.004.25
1995 1997 1999 2001 2003 2005 2007
12-month percent change
Core CPI
Median CPI
16% trimmed-mean CPI
CPI and Trimmed-Mean CPI Measures*
*The Median CPI and the 16% trimmed mean CPI are alculated by the Federal Reserve Bank of Cleveland.Sources: U.S. Department of Labor, Bureau of Labor Statistics; and Federal Reserve Bank of Cleveland.
0
5
10
15
20
25
30
35
40
45
50
<0 0 to 1 1 to 2 2 to 3 3 to 4 4 to 5 >5
Weighted frequency
Annualized monthly percent change
Owner’s equivalent rent of primary residence
Motor fuel, fuel oil, and other fuels
Gas (piped) and
electricity
CPI Component Price Change Distribution
Source: U.S. Department of Labor, Bureau of Labor Statistics.
0
1
2
3
4
5
6
7
8
2000 2001 2002 2003 2004 2005 2006
Percent
Effective federal funds rate
Intended federal funds rate
Primary credit rate
Discount rate
a
b
bb
Reserve Market Rates
a. Weekly average of daily figures.b. Daily observations.Source: Board of Governors of the Federal Reserve System, “Selected Interest Rates,” Federal Reserve Statistical Releases, H.15.
Money, Financial Markets, and Monetary PolicyMarket Expectations of Policy Rates
01.04.07by Bruce Champ and Bethany Tinlin
On December 12, the Federal Open Market Committee (FOMC) decided to leave the federal funds rate unchanged at 5.25 percent. In its state-ment, the FOMC noted that economic growth had slowed, primarily because of a weak housing market. However, the committee also remarked that “the economy seems likely to expand at a mod-erate pace on balance over coming quarters.” Th e FOMC expressed some concern about recent data on core infl ation but felt that “infl ation pressures seem likely to moderate over time.” It left open the possibility of additional policy tightening in order to curb potential “infl ation risks.” Richmond Fed President Jeff rey M. Lacker dissented from the committee’s decision, preferring a rate hike of 25 basis points.
Looking ahead, participants in the federal funds options market currently expect the FOMC to keep the funds rate at 5.25 percent over the next

8
two meetings. Th ese expectations were moderately reinforced by the December 12 decision. Key data releases, such as revisions in third-quarter GDP and data on home sales, had only minor impact on expectations regarding the future course of mone-tary policy. Th e minutes of the December meeting, released on January 3, seemed to jar recent investor optimism. Market participants focused on the ex-tent of the FOMC’s concern regarding the housing market slowdown, and the minutes’ release prompt-ed a sharp decline in the stock market. However, the release of the minutes had little impact on expectations regarding future monetary policy.
Currently, participants place more than a 95 percent probability on the committee keeping the funds rate at 5.25 percent at the January meeting. Looking further ahead toward the FOMC’s March meeting, participants overwhelmingly expect no change in policy, although a 13 percent probability is placed on a cut of 25 basis points in the funds rate at that meeting. Participants in the federal funds futures markets also see the possibility
Eurodollar futures, which provide a longer-run perspective on the expected course of monetary policy, similarly point policy change over the com-ing months. Participants in this market expect the FOMC to lower rates throughout 2007; however, they also expect a fairly quick round of policy eas-ing, with rate hikes in 2008.
During the last round of policy tightening, from June 2004 to June 2006, the real federal funds rate, defi ned as the eff ective nominal federal funds rate less core PCE infl ation, rose more than 370 basis points. Currently, the nominal funds rate stands near the upper end of the range suggested by the Taylor rule, with a target infl ation rate of between one and three percent. Th e Taylor rule views the federal funds rate as a reaction to a weighted aver-age of infl ation, target infl ation, and economic growth.
0.0
0.1
0.2
0.3
0.4
0.5
0.6
0.7
0.8
0.9
1.0
09/22 10/02 10/12 10/22 11/01 11/11 11/21 12/01 12/11 12/21 12/31
Implied probability
5.00%
5.25%
5.50%
GDP releaseNew home sales
Existing home sales
FOMC meeting
Implied Probabilities of Alternative Target Federal Funds Rates, January Meeting Outcome*
*Probabilities are calculated using trading-day closing prices from options on January 2007 federal funds futures that trade on the Chicago Board of Trade.Sources: Chicago Board of Trade; and Bloomberg Financial Services.
0.0
0.1
0.2
0.3
0.4
0.5
0.6
0.7
0.8
0.9
1.0
11/01 11/07 11/13 11/19 11/25 12/01 12/07 12/13 12/19 12/25 12/31
Implied probability
5.00%
5.25%
5.50%
4.75%
GDP release
New home sales
Existing home sales
FOMC meeting
Implied Probabilities of Alternative Target Federal Funds Rates, March Meeting Outcome*
*Probabilities are calculated using trading-day closing prices from options on March 2007 federal funds futures that trade on the Chicago Board of Trade.Sources: Chicago Board of Trade; and Bloomberg Financial Services.

9
5.00
5.05
5.10
5.15
5.20
5.25
5.30
Sep Oct Nov Dec Jan Feb Mar Apr May Jun Jul
Percent
Sep 22, 2006 Oct 26, 2006
Dec 14, 2006
Dec 29, 2006
a
a
a
2006 2007
Implied Yields on Federal Funds Futures*
*All yields are from constant-maturity series.a. One day after FOMC meeting.Source: Bloomberg Financial Information Services.
-2.0
-1.0
0.0
1.0
2.0
3.0
4.0
5.0
6.0
1987 1989 1991 1993 1995 1997 1999 2001 2003 2005
Percent
Real Federal Funds Rate*
*Defined as the effective federal funds rate deflated by the core PCE. Shaded bars represent periods of recession.Sources: U.S. Department of Commerce, Bureau of Economic Analysis; Board of Governors of the Federal Reserve System, “Selected Interest Rates,” Federal
Reserve Statistical Releases, H.15; Federal Reserve Bank of Philadelphia; and Bloomberg Financial Information Services.
-1.0
0.0
1.0
2.0
3.0
4.0
5.0
6.0
7.0
8.0
1999 2000 2001 2002 2003 2004 2005 2006
Percent
Inflation target: 3%
Inflation target: 1%
Effective federal funds rate
a
b
Taylor Rule*
*The formula for the implied funds rate is taken from the Federal Reserve Bank of St. Louis, Monetary Trends, January 2002, which is adapted from John B. Taylor, “Discretion versus Policy Rules in Practice,” Carnegie–Rochester Conference Series on Public Policy, vol. 39 (1993), pp. 195–214.a. This line assumes an interest rate of 2.5 percent and an inflation target of 1 percent.b. This line assumes an interest rate of 1.5 percent and an inflation target of 3 percent.Sources: U.S. Department of Commerce, Bureau of Economic Analysis; Board of Governors of the Federal Reserve System, “Selected Interest Rates,” Federal Reserve
Statistical Releases, H.15; Federal Reserve Bank of Philadelphia; and Bloomberg Financial Information Services.
4.4
4.6
4.8
5.0
5.2
5.4
5.6
5.8
2005 2007 2009 2011 2013 2015
Percent
Sept 22, 2006
Oct 26, 2006
Dec 14, 2006Dec 29, 2006
a
a
a
Implied Yields on Eurodollar Futures
a. One day after FOMC meeting.Source: Bloomberg Financial Information Services.

10
Money, Financial Markets, and Monetary PolicyInterest Rates, Yields, Outstanding Debt, and Consumer Attitudes
01.02.07by Bruce Champ and Bethany Tinlin
Th e yield curve remained inverted in December, with the yield on 10-year Treasury securities nearly 40 basis points below that on the 1-year Treasury bill. An inverted yield curve has been a feature of the data throughout the summer and fall months of 2006. Historically, inverted yield curves have often preceded recessions. However, an inverted yield curve can also be consistent with the Federal Reserve’s ability to contain long-run infl ationary ex-pectations. For an analysis of the predictive power of the yield curve, see “Th e Yield Curve’s Predictive Power.”
Short-term interest rates increased step in step with the federal funds rate during the last round of tight-ening by the Federal Open Market Committee. Over the two-year round of policy tightening, the 90-day Treasury bill rate increased more than 350 basis points.
Nominal yields on long-term Treasury securities have trended downward since policy tightening ended in late June. Since that point in time, the yield on 10-year Treasury notes has fallen nearly 70 basis points, resulting in the strongly inverted yield curve we observe today. Th e decline in long-term Treasury rates has been mimicked by a nearly identical fall in conventional mortgage rates over the same period.
Due to strong and liquid corporate balance sheets, risk premiums on corporate debt remain at histori-cally low levels. Since January 2004, the spread between yields on AA-rated debt and the 10-year Treasury rate have varied little, averaging slightly over one basis point. However, risk premiums on lower-rated corporate debt have been higher and more volatile over that period.
Home mortgage debt continued to rise at double-digit rates in the third quarter of 2006, albeit at
4.4
4.5
4.6
4.7
4.8
4.9
5.0
5.1
5.2
5.3
0 5 10 15 20
Percent, weekly average
Aug 11, 2006
Sept 22, 2006
Oct 27, 2006
Dec 15, 2006
a
a
a
a
Years to maturity
Dec 22, 2006
Yield Curve
a. Friday after the FOMC meeting.Sources: Board of Governors of the Federal Reserve System, “Selected Interest Rates,” Federal Reserve Statistical Releases, H.15; and Bloomberg Financial Information Services.
0
1
2
3
4
5
6
7
1997 1999 2001 2003 2005
Percent, weekly
Three-month Treasury bill
Six-month Treasury bill
Target federal funds rate
a a
a
One-yearTreasury bill
Short-term Interest Rates
a. Yields from constant-maturity series.Sources: Board of Governors of the Federal Reserve System, “Selected Interest Rates,” Federal Reserve Statistical Releases, H.15; and Bloomberg Financial Information Services.

11
more modest rates than those observed earlier in the year. Nonrevolving consumer credit growth continued to slow. Much of this slowdown is at-tributed to a decline in vehicle sales. Monthly data demonstrate a marked slowdown in consumer credit outstanding during October. Nonetheless, levels of consumer debt remain at historically high levels. However, despite high levels of consumer debt, delinquency rates on consumer loans remain subdued.
Th e Conference Board’s Index of Consumer Con-fi dence rose markedly in December, after falling modestly in October and November. December’s increase placed the index at its highest level since April. Both the present conditions and expecta-tions component of the index registered increases. Consumer perceptions of conditions in the labor market improved, according to the survey.
In contrast, the University of Michigan Consumer Sentiment Index fell slightly in December. After reaching its highest level since July 2005 in the October survey, the index has fallen modestly dur-ing the last two months. Th e expectations compo-nent of the index fell two points from November to December. However, the current conditions component of the index actually rose in December. Lower gasoline prices appear to be an important factor improving consumers’ views about their cur-rent conditions. According to the Michigan survey, household infl ation expectations fell slightly in De-cember, with the one-year ahead infl ation expecta-tion at 2.9 percent.
0
1
2
3
4
5
6
7
8
9
10
1997 1999 2001 2003 2005
Percent, weekly
Conventional mortgage
10-year Treasury note
20-year Treasury bonda
a
Long-term Interest Rates
a. Yields from constant-maturity series.Sources: Board of Governors of the Federal Reserve System, “Selected Interest Rates,” Federal Reserve Statistical Releases, H.15; and Bloomberg Financial Information Services.
0
2
4
6
8
10
12
1998 2000 2002 2004 2006
Percent, weekly
High yield
BBB
AA
Yield Spreads: Corporate Bonds Minus the Ten-Year Treasury Note*
*Merrill Lynch AA, BBB, and High Yield Master II indexes, each minus the yield on the 10-year Treasury note.Sources: Board of Governors of the Federal Reserve System, “Selected Interest Rates,” Federal Reserve Statistical Releases, H.15; and Bloomberg Financial Information Services.

12
50
60
70
80
90
100
110
120
130
140
150
2000 2001 2002 2003 2004 2005 2006
60
66
72
78
84
90
96
102
108
114
120Ratio
Consumer confidence, Conference Board
Consumer sentiment, University of Michigan
Percent of income
a
Consumer Attitudes
a. Data are not seasonally adjusted.Sources: University of Michigan; and the Conference Board.
-10
-5
0
5
10
15
20
25
1991 1993 1995 1997 1999 2001 2003 2005
Four-quarter percent change
Home mortgages
Revolving consumer credit
Nonrevolving consumer credit
Outstanding Debt
Source: Board of Governors of the Federal Reserve System.
Money, Financial Markets, and Monetary Policy Th e Yield Curve’s Predictive Power
12.21.06 by Joseph G. Haubrich and Brent Meyer
Th e slope of the yield curve has achieved some no-toriety as a simple forecaster of economic growth. Th e rule of thumb is that an inverted yield curve (short rates above long rates) indicates a recession in about a year, and yield curve inversions have preceded each of the last six recessions (as defi ned by the NBER). Very fl at yield curves preceded the previous two, and there have been two notable false positives: an inversion in late 1966 and a very fl at curve in late 1998. More generally, though, a fl at curve indicates weak growth, and conversely, a steep curve indicates strong growth. One measure of slope, the spread between 10-year bonds and 3-month T-bills, bears out this relation, particularly when real GDP growth is lagged a year to line up growth with the spread that predicts it.
Lately, the yield curve has some forecasters worried. One reason for concern is that the spread is cur-rently negative: with 10-year rate at 4.56 percent
-4
-2
0
2
4
6
8
10
12
1953 1957 1961 1965 1969 1973 1977 1981 1985 1989 1993 1997 2001 2005
Real GDP growth(year-over-year)
Yield spread: 10-year Treasury - 3-month Treasury
Percent
Yield Spread and Real GDP Growth*
*Shaded areas represent recessions.Sources: Department of Commerce, Bureau of Economic Analysis; Board of Governors of the Federal Reserve System.

13
-4
-2
0
2
4
6
8
10
12
1953 1958 1962 1967 1972 1977 1981 1986 1991 1996 2001 2005
Percent
Real GDP growth (year-over-year) lagged one year
Yield spread: 10-year Treasury bonds - 3-month Treasury notes
Yield Spread and Lagged GDP Growth
Sources: Department of Commerce, Bureau of Economic Analysis; Board of Governors of the Federal Reserve System.
and the 3-month rate at 4.93 percent (both for the week ending December 15), the spread stands at a negative 37 basis points, and indeed has been in the negative range since August. Projecting forward using past values of the spread and GDP growth suggests that real GDP will grow at about a 1.4 percent rate over the next year.
While such an approach predicts when growth is above or below average, it does not do so well in predicting the actual number, especially in the case of recessions. Th us, it is sometimes preferable to focus on using the yield curve to predict a discrete event: whether or not the economy is in recession. Looking at that relationship, the expected chance of a recession in the next year is 44 percent.
For an extended discussion of using the yield curve to predict output and recessions, see the Commen-tary, “Does the Yield Curve Signal Recession?”
-1
0
1
2
3
4
5
6
3/01 8/02 7/03 7/04 6/05 5/06 5/07
Percent
Predicted real GDP growth (year-over-year)
Yield spread: 10-year Treasury - 3-month Treasury
Forecast
Yield Spread and Predicted GDP Growth
Sources: Department of Commerce, Bureau of Economic Analysis; Board of Governors of the Federal Reserve System.
0
10
20
30
40
50
60
70
80
90
100
60 62 64 66 68 70 72 74 76 78 80 82 84 86 88 90 92 94 96 98 00 02 04 06
Probability
Probability of a recession
Forecast
Probability of Recession Based on the Yield Spread*
*Estimated using probit model.Sources: Department of Commerce, Bureau of Economic Analysis; Board of Governors of the Federal Reserve System.

14
International MarketsCurrent Account Sustainability
01.03.07 by Owen F. Humpage and Michael Shenk
Th e dollar has softened a bit since early October, largely because of changing beliefs about the prob-able course of monetary policies here and abroad. Market participants seem to believe that the Federal Reserve will move to lower the federal funds target sometime this year and that the European Central Bank and the Bank of Japan are likely to raise their target rates.
Leveraging the impact of changing beliefs about monetary policy, however, is the longer-held ex-pectation that the dollar must depreciate to cor-rect what has become an unsustainable U.S. bal-ance-of-payments pattern. Th e United States has fi nanced a nearly unbroken twenty-year string of current account defi cits by issuing fi nancial claims in unprecedented amounts. Many observers fear that the market is becoming saturated with dollar-denominated assets. Th ey warn of portfolio diversi-fi cation accompanied by sharp dollar depreciation and higher U.S. interest rates. Projections of a hard landing have been around for a number of years now, but so far the landing has been nothing if not soft. Current account defi cits are likely to persist for the foreseeable future, and their fi nancial burden will set the general tone for the dollar.
Th e United States has run a current account defi -cit every year save one since 1982; this is likely to continue for the foreseeable future. Although the current account incorporates more than trade in goods and services, our propensity to import more goods than we export largely explains the current account defi cit.
Th e United States pays for its surfeit of imports by issuing fi nancial claims (for example, stocks, bonds, Treasury securities, and bank accounts) to the rest of the world. Private individuals and organizations hold most of these claims, but foreign governments, their central banks, and international agencies own a signifi cant share. Governments such as China, Japan, and the oil-producing nations often add a
20
40
60
80
100
120
140
160
1973 1978 1983 1988 1993 1998 2003
Index
Major Currency Index
Broad Dollar Index
Foreign Exchange Indexes*
*The Major Currency Index includes large industrialized countries; the Broad Dollar Index includes these plus the important developing countries.Source: Board of Governors of the Federal Reserve System, “Foreign Ex-change Rates,” Federal Reserve Statistical Releases, H.10.
84
86
88
90
92
94
96
98
100
102
104
Jan Feb Mar Apr May Jun Jul Aug Sep Oct Nov Dec
Index, 1/2/2006 =100
British pound
Japanese yen
Euro
Foreign Exchange Rates*
*Foreign currency units per dollar.Source: Bloomberg Financial Information Services.

15
-1000
-900
-800
-700
-600
-500
-400
-300
-200
-100
0
100
1980 1985 1990 1995 2000 2005-10
-9
-8
-7
-6
-5
-4
-3
-2
-1
0
1
Percent of GDPBillions of dollars
Current Account Balance*
*Data for 2006 are quarterly data shown at an annual rate.Source: U.S. Department of Commerce, Bureau of Economic Analysis.
-1000
-800
-600
-400
-200
0
200
1980 1985 1990 1995 2000 2005
Billions of dollars
Goods trade
Services trade
Current account
Income
Unilateral transfers
Components of Current Account*
*Data for 2006 are authors' estimates.Source: U.S. Department of Commerce, Bureau of Economic Analysis.
substantial portion of these claims to their offi cial foreign exchange reserves.
Since 1986, foreigners have held more fi nancial claims against the United States than U.S. residents have held against them, giving us a negative net international investment position. In 2005, the last year for which we have complete information, foreigners’ net claims against the United States equaled approximately $2.7 trillion, mostly held by the private sector in a relatively liquid form. Of-fi cial reserves, for example, amount to 17 percent of foreign fi nancial claims on the United States, and direct investments, which presumably are relatively illiquid, amount to 15 percent of these claims.
Because these ultimately are claims on future U.S. output, we typically gauge their size relative to GDP. In 2005, the net stock of outstanding foreign claims against the United States amounted to 22 percent of GDP. Given projections for this year’s current account defi cit, our negative net interna-tional investment position could reach $3.5 trillion (approximately 27 percent of GDP) this year.
Th e ratio has increased sharply since 1999, but it cannot rise indefi nitely. As foreign portfolios become saturated with dollar-denominated assets, global investors will become increasingly reluctant to hold additional dollar-denominated assets with-out compensation for the risk of doing so. Th ey may eventually begin to diversify their portfolios out of dollars. Should we reach this point, the dol-lar will depreciate and U.S. interest rates will rise. Th e dollar depreciation will help reduce the current account defi cit by raising the dollar price of foreign goods, lowering the foreign-currency price of U.S. goods, and shifting worldwide demand towards U.S. markets. Th e rise in interest rates will reduce investment in the United States and encourage sav-ing.
Economists are fairly certain about the nature of these adjustments. Nevertheless, no one knows when they might commence, how long they might take, or how disruptive they may be.

16
Other
Direct
Official
Composition of Foreign Claims
Source: U.S. Department of Commerce, Bureau of Economic Analysis.
-4
-3.5
-3
-2.5
-2
-1.5
-1
-0.5
0
0.5
1
1980 1985 1990 1995 2000 2005-35
-30
-25
-20
-15
-10
-5
0
5
10
15
Percent of GDPTrillions of dollars
Net International Investment Position*
*Data for 2006 are authors' estimates.Source: U.S. Department of Commerce, Bureau of Economic Analysis.
-100
0
100
200
300
400
500
600
700
800
900
1980 1985 1990 1995 2000 2005
Billions of dollars
OfficialAll other
Net Financial Flows*
*Data for 2006 are authors' estimates.Source: U.S. Department of Commerce, Bureau of Economic Analysis.
A change in investment and savings patterns is a necessary, but often forgotten, aspect of the adjust-ment pattern. A country’s savings and investment pattern corresponds to its current account position. A nation, like the United States, that maintains a current account defi cit also invests more than it saves. Foreign savings, channeled into the country when foreigners buy U.S. fi nancial instruments, makes up the diff erence between domestic invest-ment and savings.
Th e pattern of investment and savings in a defi cit country often has implications for the sustainability of its negative net international investment posi-tion. Th roughout most of the 1990s, for example, foreign savings went to support an investment boom in the United States. Both investment and savings rose as a share of GDP. Th e added capital seemed to boost the pace of our long-term econom-ic growth, making it easier—in terms of foregone domestic consumption—to service and repay foreign fi nancial claims on the United States. Since 2000, however, investment has fallen along with domestic savings. Infl ows of foreign savings have fi nanced consumption spending—notably govern-ment spending—in the United States. Th is pattern is not likely to foster the economic growth neces-sary to repay our foreign obligations without a drop in private domestic consumption.

17
0
2
4
6
8
10
12
1980 1985 1990 1995 2000 2005
Percent of GDP
Savings
Investment
Net Savings and Investment
Source: U.S. Department of Commerce, Bureau of Economic Analysis.
-6
-4
-2
0
2
4
6
8
10
12
14
1980 1985 1990 1995 2000 2005
Percent of GDP
Government savings
Private savings
Total savings
Net Savings: Private and Government
Source: U.S. Department of Commerce, Bureau of Economic Analysis.
Economic Activity and Labor MarketsRevisions to Real GDP
12.22.06by David E. Altig and Brent Meyer
Th ere will be another revision in July 2007—as there is every year— but until then the fi nal word from the Bureau of Economic Analysis is that real Gross Domestic Product grew at an annualized rate of just under 2 percent in the third quarter. Th is is slightly below the preliminary estimate issued in November, but still above the growth rate estimate in October’s advance report.
Th ere is both unpleasant and (maybe) not-so-un-pleasant news buried in the details of the latest revi-sion. Th e single largest reason for the decline in the growth estimate from the preliminary report was a downgrading of private investment spending.
Th e unpleasantness came by way of the fact that part of the decline in the investment estimate was a refl ection of the ongoing weakness in residential investment. But the largest factor was a revision in the estimated pace at which businesses accumulated inventories over the quarter.
-3
-2
-1
0
1
2
3
4
5Annualized percent change
GDP PCE
Gross private investment
Government consumption
Net exports
AdvancePreliminaryFinal
Revisions to Real GDP: 2006:IIIQ
Sources: U.S. Department of Commerce, Bureau of Economic Analysis.

18
-0.3
-0.2
-0.1
0.0
0.1
0.2Annualized percent change
GDP
PCE
Gross private investment
Government consumption
Net exports
Change from preliminary to final
Sources: U.S. Department of Commerce, Bureau of Economic Analysis.
Contributions to Revisions in Contributions to Real GDP, 2006:IIIQ
Th at’s the maybe not-so-unpleasant news. To the extent that an accumulation of inventories is either unwanted or intended to build desired ratios rela-tive to sales, a slower pace of inventory build-up would be consistent with one less potential drag on production going forward, small though it may be.
Economic Activity and Labor MarketsDurable Goods Orders and Personal Income and Consumption Reports
12.27.06by Ed Nosal and Michael Shenk
Durable goods orders rose 1.9 percent in Novem-ber, reversing October’s decline of 8.2 percent. However, if transportation is excluded, total du-rable goods orders fell 1.1 percent. Analysts often exclude transportation to discern the underlying trend in orders. Aircraft, which are part of trans-portation, are very expensive. If large numbers are ordered, as sometimes happens, the industry can dominate the series. For example, the October number was big and negative, primarily because of hefty aircraft orders in September. Th e fi gure below illustrates aircraft’s eff ect on total durables.
It shows durable goods excluding transportation orders (the dark blue line) as a smoothed version of total durable goods orders. Th e red line represents transportation orders alone.
0
20
40
60
80
100
120
140
160
1996 1998 2000 2002 2004 20060
50
100
150
200
250
Billions of dollars
Durable goods ex transportation
Durable goods
Transportation (secondary axis)
Billions of dollars
Durable Goods Orders
Source: U.S. Department of Commerce, Bureau of the Census.

19
80
81
82
83
84
85
86
87
88
1996 1997 1998 1999 2000 2001 2002 2003 2004 2005 2006
Percent of GDP
Personal income
Growth in GDP and Personal Income
Source: U.S. Department of Commerce, Bureau of Economic Analysis.
0
2
4
6
8
10
12
14
16
1996 1997 1998 1999 2000 2001 2002 2003 2004 2005 2006
Annualized percent change, quarterly
GDP
Personal income
Personal Income as a Share of GDP
Source: U.S. Department of Commerce, Bureau of Economic Analysis.
Personal income, which rose 0.3 percent in Novem-ber, and consumption, which increased 0.5 percent, are used as inputs in constructing the GDP series.
Over the past fi ve years, personal income as a frac-tion of GDP has fallen fairly steadily from a high of nearly 87 percent to slightly over 82 percent.
Th is decline is consistent with observed increases in corporate profi ts as a share of GDP. Although per-sonal income accounts for a huge fraction of GDP, the quarterly growth rates for personal income and the GDP series behave quite diff erently.
Th e personal income series seems more volatile than the GDP series. Th e chart above suggests the need for caution when using monthly personal income data to estimate quarterly GDP growth.

20
Economic Activity and Labor MarketsLabor Turnover
12.29.06by Murat Tasci and Laura Kleinhenz
One of the more useful recent additions to the menu of government statistics available to eco-nomic analysts is the Bureau of Labor Statistics’ Job Openings and Turnover Survey, commonly referred to as JOLTS. Th e survey, begun in 2001, provides data on employment, job openings, hires, quits, layoff s, discharges, and other separations from employment.
Th e net hires rate—the diff erence between the hires rate and the rate of job separations of all sorts—has been positive since September 2005, consistent with the employment growth evident from the usual payroll and household surveys released on the fi rst Friday of every month. Th e detail available from JOLTS makes it clear that a big part of the story behind the employment picture this year has been the recent decline in separations rate. At 3.2 percent, this is the lowest separations rate since Jan-uary 2004. Furthermore, the job openings rate—a measure of job availability—has been increasing steadily, implying a growing demand for labor.
Most of the employment growth in the past two years was driven by professional and business ser-vices, with an average net hire rate of 0.57 percent. Although the rate of net hires in the information sector has been negative since 2004, there is clear evidence of unmet demand for labor in this area, as indicated by the sector’s higher-than-average rate of job openings.
Since 2004, most of the monthly growth in net hires occurred in the South, accounting for 48 per-cent of U.S. employment growth. Th e other three regions of the country shared the remaining 52 percent of growth almost equally. As for job open-ings, the South accounted for 39 percent of the total since 2004, followed by the West at 23 per-cent, the Midwest at 20 percent, and the Northeast at 18 percent.
1.5
2
2.5
3
3.5
4
4.5
Dec-00
Jun-01
Dec-01
Jun-02
Dec-02
Jun-03
Dec-03
Jun-04
Dec-04
Jun-05
Dec-05
Jun-06
Percent
Openings rate
Separations rate
Hires rate
Labor Turnover
Source: U.S. Department of Labor, Bureau of Labor Statistics, Job Openings and Labor Turnover Survey, November 2006.
Average Net Hires Rate by Industry, 2004 – October 2006
Percent
Hires Separa-
tionsNet
hires Job
openingsTotal private 4.0 3.8 0.24 2.8Mining 3.4 2.9 0.46 1.8Construction 5.5 5.3 0.19 1.8Manufacturing 2.5 2.6 -0.07 1.9TPUa 4.0 3.8 0.13 2.3Information 2.4 2.5 -0.08 3.1FIREb 2.4 2.3 0.11 2.8PBSc 5.2 4.6 0.57 3.7Education and health services
2.7 2.4 0.31 3.4
a. Transportation and public utilities.b. Finance, insurance, and real estate.c. Professional and business services. Source: U.S. Department of Labor, Bureau of Labor Statistics, Job Openings and Labor Turnover Survey, November 2006.

21
Regional Shares in Job Openings and Labor Turnover, 2004 – October 2006
Percent Hires Separations Job openings Net hires
Northeast 0.17 0.17 0.18 0.18
South 0.38 0.38 0.39 0.48
Midwest 0 .22 0.22 0.20 0.16
West 0.23 0.23 0.23 0.18
Source: U.S. Department of Labor, Bureau of Labor Statistics, Job Openings and Labor Turnover Survey, November 2006.
Economic Activity and Labor MarketsHousing
01.02.07 by David E. Altig and Brent Meyer
It is never a good idea to read too much into a few months worth of data, but some signs that we may have seen the worst of the downturn in the resi-dential housing market are providing a few straws for the optimistic to grasp. Both new and existing home sales for November exceeded expectations, and year-over-year growth rates are, arguably, show-ing signs of having bottomed out.
Furthermore, inventories of unsold homes, though still on the high side, appear to be retreating.
If you are operating on the theory that the real problem resides in falling housing values (and what that might mean for consumers’ balance sheets and spending behavior), it is clear that rapid ap-preciation of the previous four years is done. But the actual amount of price depreciation has been relatively modest compared to the 25 percent to 30 percent appreciation enjoyed from 2002 through 2005.
-30
-20
-10
0
10
20
30
40
50
2002 2003 2004 2005 2006
Year-over-year percent change
New
Existing
Single-Family Home Sales
Sources: U.S. Department of Commerce, Bureau of the Census; National Association of Realtors.

22
Th ose bits of light notwithstanding, there is still of plenty to keep the pessimists in bad humor. Hous-ing starts and permits—the latter being a compo-nent of the Conference Board’s index of leading indicators—are still signaling weakness, despite the recent uptick in starts:
You may keep your brow furrowed, if you wish.
3
4
5
6
7
8
9
1995 1997 1999 2001 2003 2005
Ratio
Existing
New
Month’s Supply of Single-Family Homes
Sources: U.S. Department of Commerce, Bureau of the Census; National Association of Realtors.
Year-to-date percent change
New = 2.70%Existing = –2.28%New = –5.9322%
Existing = –4.69%New = 5.33%
Existing = 2.17%
New = –4.30%Existing = –2.03%
Total U.S. new = –4.64%Total U.S. existing = –1.99%
Sources: U.S. Department of Commerce, Bureau of the Census; National Association of Realtors.
Median Prices: Single-Family New and Existing Homes
-50
-40
-30
-20
-10
0
10
20
30
40
1995 1997 1999 2001 2003 2005
Year-over-year percent change
Starts
Permits
Sources: U.S. Department of Commerce, Bureau of the Census.
Housing Starts and Permits

23
Economic Activity and Labor Markets ISM Report on Business Activity
01.04.07By Tim Dunne and Bethany Tinlin
According to the latest release of the Institute for Supply Management (ISM) surveys, both the man-ufacturing and nonmanufacturing sectors expanded as they closed out 2006. Th e ISM composite index for manufacturing registered a rebound in Decem-ber, fi nishing out the year at a level of 51.4. Th e ISM uses a diff usion index, and a level above 50 indicates that the sector is expanding, while a value below 50 indicates contraction. Th e manufacturing index has trended downward over 2006, showing a general slowing in growth in manufacturing. As has been the case all year, the nonmanufacturing index has showed considerably more strength than manu-facturing, closing out the year at 57.1—slightly down from November’s reading of 58.9.
Looking at the details of the reports, the new orders and production components in manufacturing showed improvement in December compared to Novembe, with both indexes moving from below 50 to above 50. For nonmanufacturing industries, new orders also continued to grow but at a slower rate than in November. Th e growth in new export orders slowed in manufacturing but accelerated for nonmanufacturers.
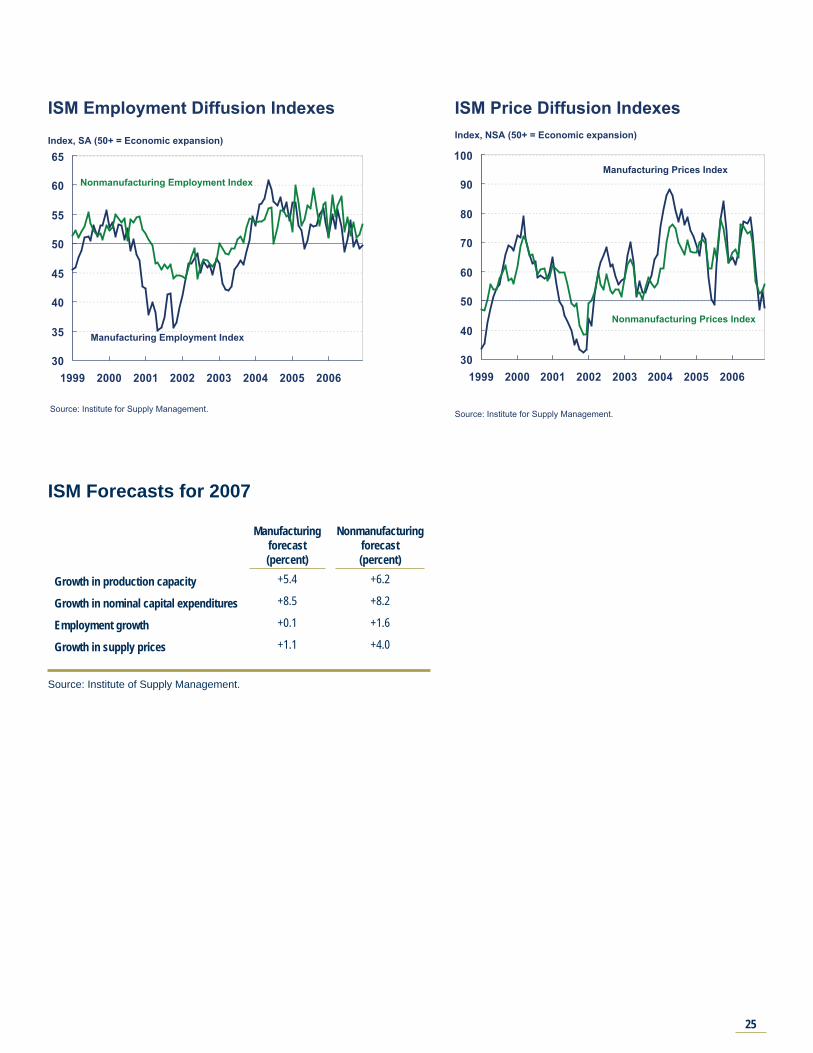
Th e employment picture diff ered across the two sectors as 2006 fi nished up. Th e manufacturing employment index remained slightly below 50 in December, indicating little change in employment in manufacturing. Th is index has hovered around 50 since September. Alternatively, the employment index for nonmanufacturing industries increased moderately in December to 53.3, suggesting con-tinued expansion in nonmanufacturing payrolls.
Th e ISM also surveys producers on the prices they pay for supplies and services. For 2006, both manufacturers and nonmanufacturers reported a general slowing in the growth in prices over the year. However, the December surveys paint a mixed picture on the growth in prices at the end of the year. Th e manufacturing price index fell sharply to
35
40
45
50
55
60
65
70
75
1999 2000 2001 2002 2003 2004 2005 2006
Index, SA (50+ = Economic expansion)
Manufacturing New Orders Index
Nonmanufacturing New Orders Index
New Orders Index
Source: Institute for Supply Management.
35
40
45
50
55
60
65
70
1999 2000 2001 2002 2003 2004 2005 2006
Index, SA (50+ = Economic expansion)
Manufacturing PMI Index
Nonmanufacturing Business Activity Index
ISM Manufactures and Services Diffusion Indexes
Source: Institute for Supply Management.

24
below 50, indicating decreasing supply prices. Th e manufacturing price index is now well below the average values observed earlier in 2006. In the non-manufacturer sector, the index rebounded from the November reading to 59.1, showing some strength-ening in supply prices in the last month of the year. Even with this increase, the nonmanufacturing index ended the year signifi cantly less than its peak level in 2006 of 77.5 and well below the average index values in 2004 and 2005.
Overall, the ISM surveys off er a picture of an economy that at the end of 2006 continues to grow moderately, with some evidence of a reduction in the price pressures observed earlier in the year.
What’s in store for 2007? Producers are relatively optimistic looking forward to 2007. Th e December ISM Semiannual Economic Forecast indicates that supply executives expect, on average, to increase production capacity by 5 percent to 6 percent in 2007. If this expected growth is achieved, it would represent an acceleration in capacity growth com-pared to 2006, when survey respondents reported increases in capacity of about 3 percent. Both sectors expect capital expenditures to increase in nominal terms by roughly 8 percent next year, and this is in line with the growth in capital expendi-tures observed in 2006. On the employment front, manufacturers see little expansion in payrolls while nonmanufactures forecast an increase of 1.6 per-cent.
Th e supply executives diff er in their forecasts of supply price growth in 2007. Manufacturing supply executives think the price growth they saw in 2006 will abate and forecast supply prices to increase, on average, by only 1.1 percent in the upcoming year. Alternatively, nonmanufacturers see continued price pressures expecting supply price increases of 4 percent in 2007—a roughly 1.5 percentage point rise in expected supply price infl ation compared to 2006.
35
40
45
50
55
60
65
70
75
1999 2000 2001 2002 2003 2004 2005 2006
Index, SA (50+ = Economic expansion)
Manufacturing Production Index
Production Index
Source: Institute for Supply Management.
40
45
50
55
60
65
70
1999 2000 2001 2002 2003 2004 2005 2006
Index (50+ = Economic expansion)
Manufacturing New Export Orders Index
Nonmanufacturing New Export Orders Indexa
b
a. Not seasonally adjusted.b. Seasonally adjusted.Source: Institute for Supply Management.
ISM Export Diffusion Indexes
25
30
35
40
45
50
55
60
65
1999 2000 2001 2002 2003 2004 2005 2006
Index, SA (50+ = Economic expansion)
Manufacturing Employment Index
Nonmanufacturing Employment Index
ISM Employment Diffusion Indexes
Source: Institute for Supply Management.
30
40
50
60
70
80
90
100
1999 2000 2001 2002 2003 2004 2005 2006
Index, NSA (50+ = Economic expansion)
Manufacturing Prices Index
Nonmanufacturing Prices Index
Source: Institute for Supply Management.
ISM Price Diffusion Indexes
ISM Forecasts for 2007
Manufacturing forecast (percent)
Nonmanufacturing forecast (percent)
Growth in production capacity +5.4 +6.2
Growth in nominal capital expenditures +8.5 +8.2
Employment growth +0.1 +1.6
Growth in supply prices +1.1 +4.0
Source: Institute of Supply Management.

26
Economic Activity and Labor MarketsLabor Market Conditions
01.10.07by Peter Rupert and Cara Stepanczuk
Th e December employment data showed far more job growth than most had predicted. Th e Bureau of Labor Statistics (BLS) reported that nonfarm pay-roll employment increased by 167,000 that month (preliminary estimate), building on November’s unexpectedly strong upward revision of +154,000 jobs.
Service-sector jobs continued to increase at a relatively strong pace (up 178,000), whereas manu-facturing jobs were still declining (off 12,000). For 2006, the service sector added a net monthly aver-age of 151,000 jobs; manufacturing employment, on the other hand, fell by 6,000 jobs monthly. Professional and business services drove the service sector’s jobs growth in December (as it did over most of the year), with a net gain of 50,000 in December and 420,000 jobs total during 2006. Health care followed closely, adding 31,000 new jobs for the month and 324,000 for the year as a whole. December’s loss of construction jobs was small (–3,000) and, in light of the sector’s 53,000 net job loss during October and November, sug-gests that construction activity may have begun to level off at year’s end.
Th e strength in the December jobs report was espe-cially surprising, given that earlier in the week, the ADP Employer Services’ survey of 307,000 busi-nesses (covering about 18 million payroll workers) showed a decline of 40,000 jobs during the month. Th e survey results may have led some analysts to re-duce their estimates of labor market strength—two major investment houses reportedly cut their De-cember jobs growth projections by roughly 40,000 to 50,000 jobs after the ADP survey was released.
Predicting job growth is no easy task, not even for the BLS, which adjusts its estimates on the basis of incoming payroll data as they are reported by businesses. Th e BLS has made substantial revisions to their preliminary estimates over the past few months: Th e fi rst published estimate for September
0
25
50
75
100
125
150
175
200
225
250
IQ IIQ IIIQ IVQ Aug Sep Oct Nov Dec
Change, thousands of workers
2006
Average Monthly Nonfarm Employment Change
Source: Department of Labor, Bureau of Labor Statistics.
-20
0
20
40
60
80
100
120
AUG SEP OCT NOV DEC
Thousands of jobs
First revisionSecond revision
Long-Term Manufacturing and Service Industry Changes
Source: Department of Labor, Bureau of Labor Statistics, January 2006.

27
showed a 51,000 job increase; the second prelimi-nary estimate showed an increase of 148,000 jobs; and the fi nal estimate for the month reported an increase of 203,000—four times the original esti-mate. Th e point here is a cautionary one: Take care when examining monthly changes in the employ-ment data. Recent revisions have revealed that the U.S. labor market was considerably stronger than the preliminary jobs report led us to believe. Th e BLS acknowledges that recent revisions have been somewhat high, but notes that “the overall mag-nitude of revisions has held steady in recent years” and further, that “the revisions have not been either predominantly upward or predominantly down-ward.”
-200-160-120-80-40
04080
120160200240280320360400
2000 2001 2002 2003 2004 2005 2006
Job growth, in thousands
Service industries
Manufacturing
*November received the first revision only, and December has not yet been revised.Source: Department of Labor, Bureau of Labor Statistics.
Revisions on Monthly Payroll
Labor Market Conditions
Average monthly change (thousands of employees, NAICS) 2003 2004 2005 Jan.-Nov. 2006 Dec 2006
Payroll employment 9 175 165 152 167
Goods-producing –42 28 22 3 –11 Construction 10 26 25 4 –3 Manufacturing –51 0 –6 –5 –12 Durable goods –32 9 1 0 –6 Nondurable goods –19 –9 –7 –5 –6 Service-providing 51 147 143 149 178 Retail Trade –4 17 13 –4 –9 Financial activities* 7 8 12 13 9 PBS** 23 40 41 34 50 Temporary help svcs. 12 13 14 –3 15 Education & health
svcs.30 33 31 37 43
Leisure and hospitality 19 26 21 29 31
Government -4 13 14 21 17 Average for period (percent)
Civilian unemployment rate 6.0 5.5 5.1 4.6 4.5
a. Financial activities include the fi nance, insurance, and real estate sector and the rental and leasing sector.b. PBS is Professional Business Services (professional, scientifi c, and technical services, management of companies and enterprises, administrative and support, and waste management and remediation services.Source: Department of Labor, Bureau of Labor Statistics.

28
90
100
110
120
130
140
150
1970 1980 1990 2000
Index, 1970 = 100
U.S.
Akron MSA
Ohio
Population
Source: U.S. Department of Commerce, Bureau of the Census.
0 0.5 1 1.5
GovernmentOther services
Leisure, hospitality
Education,health services
Professional,business services
Financial activitiesInformation
Trade, transportation,utilities
Manufacturing
Natural resources,mining, construction
Note: The location quotient is the simple ratio between a given industry’s employment sharein two locations.Source: U.S. Department of Labor, Bureau of Labor Statistics.
Location Quotients, Akron MSA / U.S.,2005
Regional ActivityTh e Akron Metropolitan Statistical Area
12.21.06by Bob Sadowsky and Brian Rudick
Th e Akron metropolitan area—home to 702,000 residents—stretches across Summit and Portage Counties. Th e region is typical of many metro areas in the Fourth District in that it has seen limited population growth over the past three decades. In fact, since 1970 Akron’s population grew by only 3.5 percent compared to 46 percent for the United States.
Although Akron enjoys a relatively diverse econ-omy, the manufacturing sector still claims the highest employment concentration relative to the United States, followed by professional and busi-ness services.
Nevertheless, manufacturing employment in the Akron region has experienced a dramatic decline since the last business cycle peak in March 2001—17.4 percent compared to a 16.3 percent decrease for the United States. In contrast, Akron outpaced the country as a whole in non-manufacturing job growth during the same time period—8.4 percent locally versus 5.3 percent nationally.
Looking more closely at total annual employment growth, we see that the United States did slightly better than the Akron metro area in 2001 and 2002. Th is was due primarily to a larger decline in local manufacturing jobs. However, beginning in 2003 and continuing through 2005 the trend was reversed. During this latter period Akron showed annual employment gains of 1.5 to 2.0 percent. Further, manufacturing job losses became negligible and increases were seen in two broad sectors—fi -nance, information and business services and education, health, leisure, government and other services.

29
Local employment trends seen during 2003 through 2005 continued into 2006. For the 12-month period ending in October, fi nancial activi-ties, information, and professional and business ser-vices led all other industry sectors in employment growth with increases ranging from 2.3 to 4 per-cent. Manufacturing continued to show a negligible employment change on a year-over-year basis.
During the 1990s, the Akron metro area enjoyed a consistently lower unemployment rate than the United States. In fact, during the mid 1990s, local unemployment was about one percentage point less than was reported nationally. Only during the past three years has this trend been reversed. For the 12-month period ending in October 2006, Akron’s average unemployment rate was 0.5 percentage point higher than in the United States.
Over time, average per capita personal income across all U.S. metro areas has been somewhat higher than in Akron with a gap of about 6.4 per-cent. However, when comparing per capita income growth, we fi nd that the growth rates in Akron and the United States are almost the same. Between 1980 and 2004, local income increased by 219 percent compared to 226 percent nationally.
Th e similarity in growth may be partially due to the educational attainment of Akron residents. In 2005, over 28 percent of these residents held a bachelor’s degree or higher. Th is compares to 23.3 percent in Ohio and 27.2 percent nationally.
-4
-2
0
2
4
2001 2002 2003 2004 2005
Retail, wholesale trade
Manufacturing
Transportation, warehousing, utilities
Natural resources, mining, constructionFinancial, information, business services
Education, health, leisure, government, other services
U.S. growth.
Percent change
Note: The white bars represent total annual growth for the Akron MSA.Source: U.S. Department of Labor, Bureau of Labor Statistics.
Components of Employment Growth,Akron MSA
-2 -1 0 1 2 3 4 5
Government Other services
Leisure, hospitalityEducation, health services
business services
Financial activities Information
Trade, transportation, Service-providing
Natural resources, mining, construction
ManufacturingGoods-producing
Total nonfarm
U.S.Akron MSA Year-over-year percent change
Source: U.S. Department of Labor, Bureau of Labor Statistics.
Payroll Employment Growth, October 2006
Professional,
utilities

30
80
90
100
110
2001 2002 2003 2004 2005 2006
Index, March 2001 = 100
U.S.Akron MSA
Manufacturing
Nonmanufacturing
Source: U.S. Department of Labor, Bureau of Labor Statistics.
Payroll Employment since March 2001 Selected Demographics
Akron MSA Ohio U.S.
Total population (millions)
0.7 11.2 288.4
Percent by race White 86.1 85.7 76.3 Black 12.2 12.3 12.8 Other 1.7 2.0 10.9 Percent by age 0 to 19 26.0 27.0 27.8 20 to 34 19.3 19.3 20.1 35 to 64 41.6 40.8 40.0 65 or older 13.0 12.8 12.1Percent with a bachelor’s degree or higher
28.1 23.3 27.2
Median age 38.3 37.6 36.4
Source: U.S. Department of Commerce, Bureau of the Census.
10
20
30
40
1980 1990 2000
Dollars, thousands
U.S.
Akron MSA
U.S. metropolitan areas
Ohio
Source: U.S. Department of Commerce, Bureau of Economic Analysis.
Per Capita Personal IncomePercent
U.S.
Akron MSA3
4
5
6
7
8
1990 1992 1994 1996 1998 2000 2002 2004 2006
Source: U.S. Department of Labor, Bureau of Labor Statistics.
Unemployment Rate

31
Regional ActivityState Per Capita Personal Income
01.04.07by Yoonsoo Lee, Brian Rudick, and Bethany Tinlin
Of the fi fty U.S. states, the one with the high-est per capita income in 2005 was Connecticut, where residents’ median income hit $42,620 (all fi gures are in real 2000 dollars). As for the states within the Fourth District, per capita incomes grew in Kentucky and West Virginia, to $25,398 and $23,345, respectively. Compared with the me-dian state per capita income, Kentucky’s is about 13 percent lower, and West Virginia’s is about 20 percent lower. While Ohio’s per capita income was 2 percent lower than the median, Pennsylvania was 7 percent higher.
With respect to rankings of median per capita in-comes among the fi fty states, the ranking of each of the four states in the district has fallen since 1929. Overall, the gap between the richest state and poorest state has narrowed since 1929, as economic growth theory predicts (See our 2005 Annual Re-port essay for a more detailed analysis of per capita income growth across U.S. states).
In 1929, New York had the highest per capita per-sonal income of all the states at $9,837. Th e dispar-ity across states was greater then than in 2005, with the standard deviation of state incomes in 1929 more than twice the 2005 level. While Ohio and Pennsylvania’s income levels were about 30 percent higher than the median in 1929, Kentucky’s and West Virginia’s, at $3,316 and $3,923 respectively, were 35 percent and 23 percent lower than the median.
Since 1929, incomes have grown in real terms for every state. Th e U.S. average, which was $5,969 in 1929 and $30,939 in 2005, grew 418 percent. Growth in Pennsylvania (373 percent) and Ohio (334 percent) trailed the national mark, but growth in Kentucky (666 percent) and West Virginia (495 percent) exceeded it.
LAMS
WVAR
UTNMSCKYIDMT
ALOKAZMETNNC
INGANDMO
IAOHOR
TXSDVTMIKSNE
WIFL
PARIWANVIL
CADEWYMNCOVANH
NYMD
MANJ
CT
–80 –30 20 70Percent above or below state average
Relative Per Capita Personal Incomein 2005
Source: U.S. Department of Commerce, Bureau of Economic Analysis.
SCAR
ALNC
GATNND
KYNM
LASD
VAOKWV
TXID
FLKS
UTIANEMTMNAZ
INMO
COVT
ORWYWI
NHWA
MDOHPA
MINVRI
MANJ
ILCA
CTDE
NY
ME
MS
–80 –60 –40 –20 0 20 40 60 80 100
Percent above or below state average
Relative Per Capita Personal Income in 1929
Source: U.S. Department of Commerce, Bureau of Economic Analysis.

32
More recently, Ohio’s per capita income growth has started to slow. Since the beginning of 2000, it has grown by 3.1 percent, compared to 6.9 percent for the U.S. as a whole. Meanwhile, growth in per capita incomes in Pennsylvania (8.4 percent), Kentucky (5.8 percent), and West Virginia (10.6 percent) all outpaced Ohio’s over this time period.
Looking at the industrial components of earnings growth reveals that no one specifi c sector is respon-sible for Ohio’s relatively slower growth. In fact, in terms of the contributions that diff erent indus-try sectors make to earnings growth, every major industry in Ohio lagged with respect to the contri-bution it made to U.S. growth from 2000 to 2005. For example, while the natural resources, mining, and construction industry added 2.5 percent to overall U.S. earnings growth in this time period, it added only 0.8 percent to Ohio earnings growth.
0
5
10
15
20
25
30
35
1930 1940 1950 1960 1970 1980 1990 2000
Thousands of real (2000) dollars
OH
PA
U.S. WVKY
Per Capita Personal Income Growth
Source: U.S. Department of Commerce, Bureau of Economic Analysis.
90
100
110
120
130
140
1990 1993 1996 1999 2002 2005
Index, Q1:1990 = 100
OH
PA
U.S.
WV
KY
Per Capita Personal Income Growth
Source: U.S. Department of Commerce, Bureau of Economic Analysis.
0
5
10
15
20
25
OH PA KY WV U.S.
Percent change
Other servicesLeisure and hospitalityEducation and health servicesProfessional and business servicesFinance, insurance, and real estateInformationManufacturingTrade, transportation, and utilitiesNatural resources, mining and construction
Components of Earnings Growth, 2000–2005
Source: U.S. Department of Commerce, Bureau of Economic Analysis.

33
Regional ActivityFourth District Employment Conditions
01.10.07by Christian Miller and Paul Bauer
Th e Fourth District’s unemployment rate rose from 5.0 percent in October to 5.2 percent in Novem-ber. Th e main causes were a 4.8 percent monthly increase in the number of unemployed and slight reductions in employment (–0.3 percent) and the labor force (–0.1 percent). Over the same period, the U.S. unemployment rate rose from 4.4 percent to 4.5 percent.
In November, 12 of the District’s counties posted unemployment rates below the national average, another 12 counties were close to average, and the remaining 145 exceeded the U.S. rate; these levels were slightly higher than October’s. Th e vast major-ity of counties (151) reported rising unemployment rates. However, rates remained low in the Colum-bus, Pittsburgh, and Lexington metropolitan areas.
As for employment growth, Lexington was the only metro area in the District that has kept pace with the U.S. since November. Th e District’s goods-pro-ducing industries continued to lose jobs, whereas its service-providing industries were the main engines of growth. Only Dayton lost service-sector jobs over the past year. Lexington is the fastest-growing metro area in the District, but Cincinnati’s employ-ment has also grown 1.0 percent, with a 1.4 percent increase in service-sector jobs.
3
4
5
6
7
8
1990 1992 1994 1996 1998 2000 2002 2004 2006
Percent
Fourth District
United States
a
Sources: U.S. Department of Labor, Bureau of Labor Statistics; Kentucky Office of Employment and Training, Workforce Kentucky; Ohio Department of Job and Family Services, Bureau of Labor Market Information; Pennsylvania Department of Labor and Industry, Center for Workforce Information and Analysis; and West Virginia Bureau of Employment Programs, Workforce West Virginia.
Unemployment Rates*
U.S. average = 4.5%
Lower than U.S. averageAbout the same as U.S. average (4.4% to 4.6%)Above U.S. averageMore than double U.S.average
Sources: U.S. Department of Labor, Bureau of Labor Statistics; Kentucky Office of Employment and Training, Workforce Kentucky; Ohio Department of Job and Family Services, Bureau of Labor Market Information; Pennsylvania Department of Labor and Industry, Center for Workforce Information and Analysis; and West Virginia Bureau of Employment Programs, Workforce West Virginia.
Unemployment Rates, November 2006*
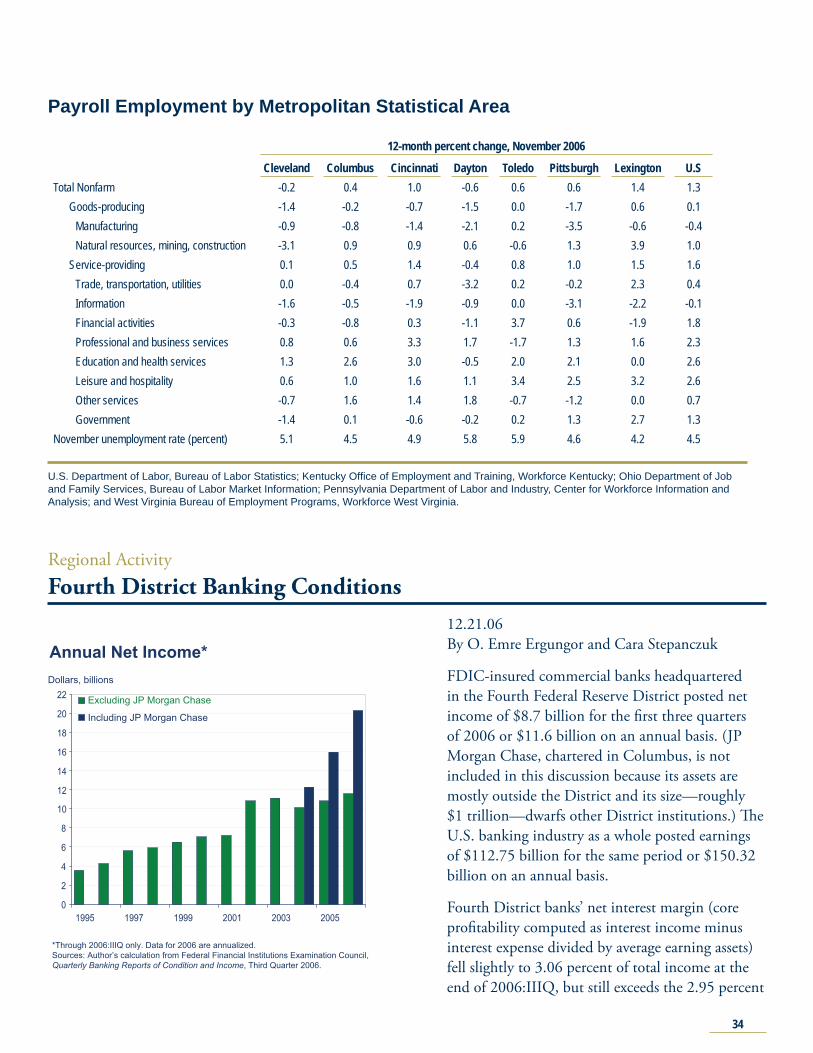
34
Regional ActivityFourth District Banking Conditions
12.21.06By O. Emre Ergungor and Cara Stepanczuk
FDIC-insured commercial banks headquartered in the Fourth Federal Reserve District posted net income of $8.7 billion for the fi rst three quarters of 2006 or $11.6 billion on an annual basis. (JP Morgan Chase, chartered in Columbus, is not included in this discussion because its assets are mostly outside the District and its size—roughly $1 trillion—dwarfs other District institutions.) Th e U.S. banking industry as a whole posted earnings of $112.75 billion for the same period or $150.32 billion on an annual basis.
Fourth District banks’ net interest margin (core profi tability computed as interest income minus interest expense divided by average earning assets) fell slightly to 3.06 percent of total income at the end of 2006:IIIQ, but still exceeds the 2.95 percent
Payroll Employment by Metropolitan Statistical Area
12-month percent change, November 2006
Cleveland Columbus Cincinnati Dayton Toledo Pittsburgh Lexington U.STotal Nonfarm -0.2 0.4 1.0 -0.6 0.6 0.6 1.4 1.3
Goods-producing -1.4 -0.2 -0.7 -1.5 0.0 -1.7 0.6 0.1Manufacturing -0.9 -0.8 -1.4 -2.1 0.2 -3.5 -0.6 -0.4Natural resources, mining, construction -3.1 0.9 0.9 0.6 -0.6 1.3 3.9 1.0
Service-providing 0.1 0.5 1.4 -0.4 0.8 1.0 1.5 1.6Trade, transportation, utilities 0.0 -0.4 0.7 -3.2 0.2 -0.2 2.3 0.4Information -1.6 -0.5 -1.9 -0.9 0.0 -3.1 -2.2 -0.1Financial activities -0.3 -0.8 0.3 -1.1 3.7 0.6 -1.9 1.8Professional and business services 0.8 0.6 3.3 1.7 -1.7 1.3 1.6 2.3Education and health services 1.3 2.6 3.0 -0.5 2.0 2.1 0.0 2.6Leisure and hospitality 0.6 1.0 1.6 1.1 3.4 2.5 3.2 2.6Other services -0.7 1.6 1.4 1.8 -0.7 -1.2 0.0 0.7Government -1.4 0.1 -0.6 -0.2 0.2 1.3 2.7 1.3
November unemployment rate (percent) 5.1 4.5 4.9 5.8 5.9 4.6 4.2 4.5
U.S. Department of Labor, Bureau of Labor Statistics; Kentucky Offi ce of Employment and Training, Workforce Kentucky; Ohio Department of Job and Family Services, Bureau of Labor Market Information; Pennsylvania Department of Labor and Industry, Center for Workforce Information and Analysis; and West Virginia Bureau of Employment Programs, Workforce West Virginia.
0
2
4
6
8
10
12
14
16
18
20
22
1995 1997 1999 2001 2003 2005
Dollars, billions
Excluding JP Morgan Chase
Including JP Morgan Chase
Annual Net Income*
*Through 2006:IIIQ only. Data for 2006 are annualized.Sources: Author’s calculation from Federal Financial Institutions Examination Council, Quarterly Banking Reports of Condition and Income, Third Quarter 2006.

35
U.S. average. Fourth District banks’ non-inter-est income edged up to 30.48 percent, while the national average slipped down to 30.52 percent of total income.
Fourth District banks’ effi ciency (operating ex-penses as a percent of total income) continued to worsen in 2006:IIIQ, deteriorating to 56.21 percent from the 52.64 percent record set in 2002. (Lower numbers correspond to greater effi ciency.) Banks outside the Fourth District fared better, with the national average continuing to improve to 54.46 percent (from 56.40 percent at the end of 2005).
At the end of 2006:IIIQ, District banks posted a 1.39 percent return on assets (down from 1.43 per-cent at the end of 2005) and a 14.45 percent return on equity (down from 15.32 percent at the end of 2005). Th e District’s decline contrasted with an upward trend nationwide: At the end of 2006:IIIQ, the U.S. banking industry reported that return on assets rose to 1.19 percent (from 1.08 percent at the end of 2005); and return on equity rose to 12.63 percent (from 11.55 percent at the end of 2005).
Overall, Fourth District banks’ fi nancial indicators point to stable balance sheets. Asset quality, as mea-sured by net charge-off s (losses realized on loans and leases currently in default minus recoveries on previously charged-off loans and leases) continued to improve in 2006:IIIQ. Net charge-off s dropped from 0.38 percent at the end of 2005 to 0.3 per-cent of total loans, the lowest level in over a decade. Problem assets (nonperforming loans and repos-sessed real estate) as a share of total assets, however, rose to 0.68 percent, from 0.59 percent at the end of 2005. Th e increase in problem assets may trans-late into higher charge-off s in the future if borrow-ers cannot catch up with their late payments. At the national level, both asset quality ratios are still improving. Net charge-off s and nonperforming loans fell to a historically low 0.32 percent of loans (down from 0.46 percent at the end of 2005) and 0.42 percent of assets (down from 0.45 percent at the end of 2005), respectively.
2.00
2.25
2.50
2.75
3.00
3.25
3.50
3.75
4.00
4.25
4.50
4.75
5.00
1995 1997 1999 2001 2003 200520
22
24
26
28
30
32
34
36
38
40
42
44Percent Percent
Net interest margin excluding JP Morgan Chase Non-interest
income/income including JP Morgan Chase
Non-interest income/income excluding JP Morgan Chase
Net interest margin including JP Morgan Chase
*Through 2006:IIIQ only. Data for 2006 are annualized.Sources: Author’s calculation from Federal Financial Institutions Examination Council, Quarterly Banking Reports of Condition and Income, Third Quarter 2006.
Income Ratios*
50
52
54
56
58
60
62
64
66
68
70
1994 1996 1998 2000 2002 2004 2006
Percent
Excluding JP Morgan ChaseIncluding JPMorgan Chase
* Through 2006:IIIQ only. Data for 2006 are annualized.** Efficiency is operating expenses as a percent of net interest income plus non-interest income.Sources: Author’s calculation from Federal Financial Institutions Examination Council, Quarterly Banking Reports of Condition and Income, Third Quarter 2006.
Efficiency*,**

36
Fourth District banks held $17.62 in equity capital and loan loss reserves for every dollar of problem loans, well above the recent coverage ratio low of 10.75 at the end of 2002 but below the record high of 24.97 at the end of 2004.
Equity capital as a percent of Fourth District banks’ assets (the leverage ratio) rose to 9.65 percent (from 9.36 percent at the end of 2005).
Th e percent of unprofi table institutions in the Fourth District fell to 5.17 percent for the third quarter of 2006 (from 5.43 percent at the end of 2005). Unprofi table banks’ asset size also dropped because the share of District banks’ assets ac-counted for by unprofi table banks fell from 0.56 percent to 0.14 percent. Industrywide, the share of unprofi table institutions rose from 6.28 percent to 6.82 percent at the end of 2006:IIIQ. However, unprofi table banks’ asset size dropped from 1.13 percent at the end of 2005 to 0.43 percent at the end of 2006:IIIQ. Th us, the industrywide increase in the number of unprofi table banks comes from the smaller fi nancial institutions.
0.7
0.8
0.9
1.0
1.1
1.2
1.3
1.4
1.5
1.6
1.7
1995 1997 1999 2001 2003 20050
2
4
6
8
10
12
14
16
18
20Percent Percent
Return on equity excluding JP Morgan
Return on assets excluding JP Morgan Return on
equity including JP Morgan
Return on assets including JP Morgan
*Through 2006:IIIQ only. Data for 2006 are annualized.**Efficiency is operating expenses as a percent of net interest income plus non-interest income.Sources: Author’s calculation from Federal Financial Institutions Examination Council, Quarterly Banking Reports of Condition and Income, Third Quarter 2006.
Earnings*
0.2
0.3
0.4
0.5
0.6
0.7
0.8
0.9
1.0
1.1
1.2
1994 1996 1998 2000 2002 2004 2006
Percent
Net charge-offs, excluding JP Morgan Chase
Problem assets,aexcluding JP Morgan Chase
Net charge-offs, including JP Morgan Chase
Problem assets,aincluding JP Morgan Chase
*Through 2006:IIIQ only. Data for 2006 are annualized.a. Problem assets are shown as a percent of total assets, net charge-offs as a percent of total loans. Sources: Author’s calculation from Federal Financial Institutions Examination Council, Quarterly Banking Reports of Condition and Income, 2006:IIIQ.
Asset Quality*

37
9
12
15
18
21
24
27
30
1994 1996 1998 2000 2002 2004 2006
Percent
Excluding JP Morgan Chase
Including JPMorgan Chase
*Through 2006:IIIQ only. Data for 2006 are annualized.Sources: Author’s calculation from Federal Financial Institutions Examination Council, Quarterly Banking Reports of Condition and Income, 2006:IIIQ.
Coverage Ratio*
4
5
6
7
8
9
10
11
1994 1996 1998 2000 2002 2004 2006
Percent
Capital ratio, excluding JP Morgan ChaseCapital ratio, including JP Morgan Chase
*Through 2006:IIIQ only. Data for 2006 are annualized.Sources: Author’s calculation from Federal Financial Institutions Examination Council, Quarterly Banking Reports of Condition and Income, 2006:IIIQ.
Core Capital (Leverage) Ratio*
-1
0
1
2
3
4
5
6
7
8
9
1994 1996 1998 2000 2002 2004 2006
Percent
Assets in unprofitable institutions excluding JP Morgan
Unprofitable institutions including JP Morgan
Assets in unprofitable institutions including JP Morgan
Unprofitable institutions excluding JP Morgan
Unprofitable Institutions*
*Through 2006:IIIQ only. Data for 2006 are annualized.Sources: Author’s calculation from Federal Financial Institutions Examination Council, Quarterly Banking Reports of Condition and Income, 2006:IIIQ.