fraud management and operations training sample only
Post on 19-Dec-2015
226 views
TRANSCRIPT

Fraud Management and Operations Training
SAMPLE ONLY

Day 1: • Executive Vision of a Fraud Prevention Unit
– Mission/Vision of the Fraud Department– Threats, vulnerabilities, exploits, and schemes
• Fraud Management Responsibilities – Key responsibilities: prevention; detection; analysis;
reaction; measurement, and executive reporting– Facilitating cooperation from other departments– Facilitating cooperation from other companies
Topics Discussed:
SAMPLE ONLY
Day 2: • Fraud Management Structure
– Fraud Control Department – Where on the Company Org Chart
does it belong?– Fraud Analysis Group – Structure and objectives of both Basic
and Advanced Fraud Analysis group (working by product type, fraud type or access type)
– Fraud IT Group – Advantages and Objectives of a dedicated IT group just for Fraud Control.
– Fraud Engineering Group – Using dedicated network engineers to help detect and control frauds including Ghosting Fraud.
– Fraud Legal Group – Ensuring legal and regulatory compliance, helping establish and enforce inter-carrier SLAs, and serving as interface for law enforcement issues.
Topics Discussed:
SAMPLE ONLY

Day 3: • Fraud Management Internal Processes
– Detection: An exploration of Information Sources that can used
to detect fraud such as FraudView, CRM, Collections, and other internal and external sources.
– Analysis: An in-depth discussion on different types of Analyses used to detect fraud along with their individual advantages.
– Reaction: A lesson in the different options on how to react to fraud.
– Prevention: A discussion in the importance of Prevention as part of the Fraud Control Internal Processes.
– Measurement: A very detailed discussion on how to measure both fraud losses and losses prevented, and how to measure efficiency of the FMS, the analysts, and the department.
Topics Discussed:
SAMPLE ONLY
Day 4: • Fraud Management External Processes
– A discussion on how the Fraud Control department should interface with other Telecom departments such as Marketing, Collections, Credit, Engineering and Operations, IT, Physical Security, and Finance.
• Fraud Risk Assessments (Products & Services)– An in-depth discussion on how to perform a Fraud
Risk Assessment for an existing or a new product.
Topics Discussed:
SAMPLE ONLY
Day 1 Executive Vision of a Fraud Prevention Unit
– Mission/Vision of the Fraud Department
– Threats, vulnerabilities, exploits, and schemes
SAMPLE ONLY
Mission of a Fraud Control Department
From Executive Point of View:To Minimize Losses in Revenue from Products and Services Due to Fraud When Desired.
Why “Minimize Losses”?
Question: Is it not possible to STOP ALL FRAUD and LOSSES from Fraud?
Answer: It is no more possible to stop ALL FRAUD than it is possible for a Politician or a Police Chief to stop ALL THEFT in a city. There will ALWAYS be Fraud! And therefore, there will ALWAYS be Fraud Losses. The best any person can do is MINIMIZE the losses.
SAMPLE ONLY

Mission of a Fraud Control Department
From Executive Point of View:To Minimize Losses in Revenue from Products and Services Due to Fraud When Desired.
Why “Revenue from Products and Services”?
Question: Why not include Financial Fraud or other types of Fraud as well?
Answer: Generally, the department(s) that audits employee’s actions and insures that there is no Internal Financial Fraud such as Embezzelment, Theft, and Robbery are separate from the Fraud department that oversees Fraud associated with the Products and Services.
SAMPLE ONLY
Mission of a Fraud Control Department
From Executive Point of View:To Minimize Losses in Revenue from Products and Services Due to Fraud When Desired.
Why “Due to Fraud”?
Question: Why not include losses from other problems such as programming errors, faulty processes, incomplete customer data, network outages, etc?
Answer: It is important to have a department dedicated to fraud primarily because of the focus on the customer. Losses due to these other factors are most often handled better by a Revenue Assurance department. (more on this later)
SAMPLE ONLY
Mission of a Fraud Control Department
From Executive Point of View:To Minimize Losses in Revenue from Products and Services Due to Fraud When Desired.
Why “When Desired”?
Question: Are there times when it would NOT be desirable to minimize losses due to fraud?
Answer: Yes. Here are some examples:• In order to Preserve Customer Satisfaction• In order to Preserve Customer Satisfaction• In order to Improve the Company Revenue Statistics • In order to Give Priority to Other Higher Priority Losses
SAMPLE ONLY
Mission of a Fraud Control Department
From Executive Point of View:To Minimize Losses in Revenue from Products and Services Due to Fraud When Desired.
Why “When Desired”?
• In order to Preserve Customer Satisfaction
In order to Prevent and Detect Fraud, processes must be put in place that will inherently...• Difficult the subscription process for the customer.• Bother him during the usage of the products and services.
Example: Validation process. Most all customers detest having their identity questioned.
Therefore, it is important to balance Customer Satisfaction with Fraud Control. (This will be discussed at greater length later in the course)
SAMPLE ONLY

Mission of a Fraud Control Department
From Executive Point of View:To Minimize Losses in Revenue from Products and Services Due to Fraud When Desired.
Why “When Desired”?
Question: Are there times when it would NOT be desirable to minimize losses due to fraud?
Answer: Yes. Here are some examples:
• In order to Improve the Company Revenue Statistics• In order to Preserve Customer Satisfaction• In order to Improve the Company Revenue Statistics • In order to Give Priority to Other Higher Priority Losses
SAMPLE ONLY
Mission of a Fraud Control Department
From Executive Point of View:To Minimize Losses in Revenue from Products and Services Due to Fraud When Desired.
Why “When Desired”?
• In order to Improve the Company Revenue Statistics
By reducing Fraud Controls, it is possible to:• Grow the customer base more quickly.• Artificially grow the revenue numbers.
Examples: Increase Share-holder confidence or perhaps to Prepare for the Sale of the Company.
Fraud CONTROL means to be able to reduce or increase the indicidence of fraud to serve the purposes of the company. However, please note that allowing fraud to increase by not monitoring it is NOT considered Fraud CONTROL! This would be Fraud “OUT OF CONTROL”!SAMPLE ONLY

Mission of a Fraud Control Department
From Executive Point of View:To Minimize Losses in Revenue from Products and Services Due to Fraud When Desired.
Why “When Desired”?
Question: Are there times when it would NOT be desirable to minimize losses due to fraud?
Answer: Yes. Here are some examples:
• In order to Give Priority to Other Higher Priority Losses
• In order to Preserve Customer Satisfaction• In order to Improve the Company Revenue Statistics • In order to Give Priority to Other Higher Priority Losses
SAMPLE ONLY
Mission of a Fraud Control Department
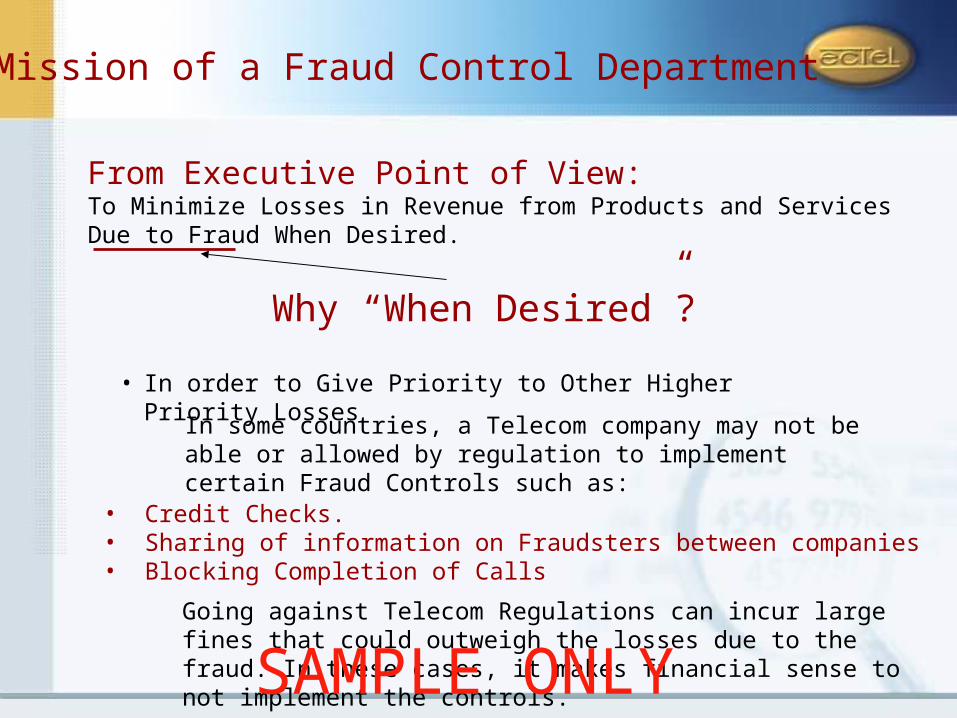
From Executive Point of View:To Minimize Losses in Revenue from Products and Services Due to Fraud When Desired.
Why “When Desired”?
• In order to Give Priority to Other Higher Priority Losses
In some countries, a Telecom company may not be able or allowed by regulation to implement certain Fraud Controls such as:• Credit Checks.• Sharing of information on Fraudsters between companies• Blocking Completion of Calls
Going against Telecom Regulations can incur large fines that could outweigh the losses due to the fraud. In these cases, it makes financial sense to not implement the controls. SAMPLE ONLY

Mission of a Fraud Control Department
From Executive Point of View:To Minimize Losses in Revenue from Products and Services Due to Fraud When Desired.
Question: If we cannot prevent or stop ALL fraud, what then is an “acceptable” amount of fraud for a Telecom to have?
Answer: An “acceptable” amount of fraud losses are those that are less than or equal to the cost of controlling them. The costs involved in controlling fraud are real monies spent on an FMS, validation processes, etc. But those costs also include the cost (or loss) of good customer churn due to excessive validations or lack of subscriptions because of the excessive amount of documentation required at subscription time. These negative factors resulting from Fraud Control must be put in the balance as well.
SAMPLE ONLY
Day 2Fraud Management Structure
– Fraud Control Department – Where on the Company Org Chart does it belong?
– Fraud Control Department Structure – Structure and objectives of each of the subgroups of a Fraud Control Department.
SAMPLE ONLY
Fraud Control Department Structure
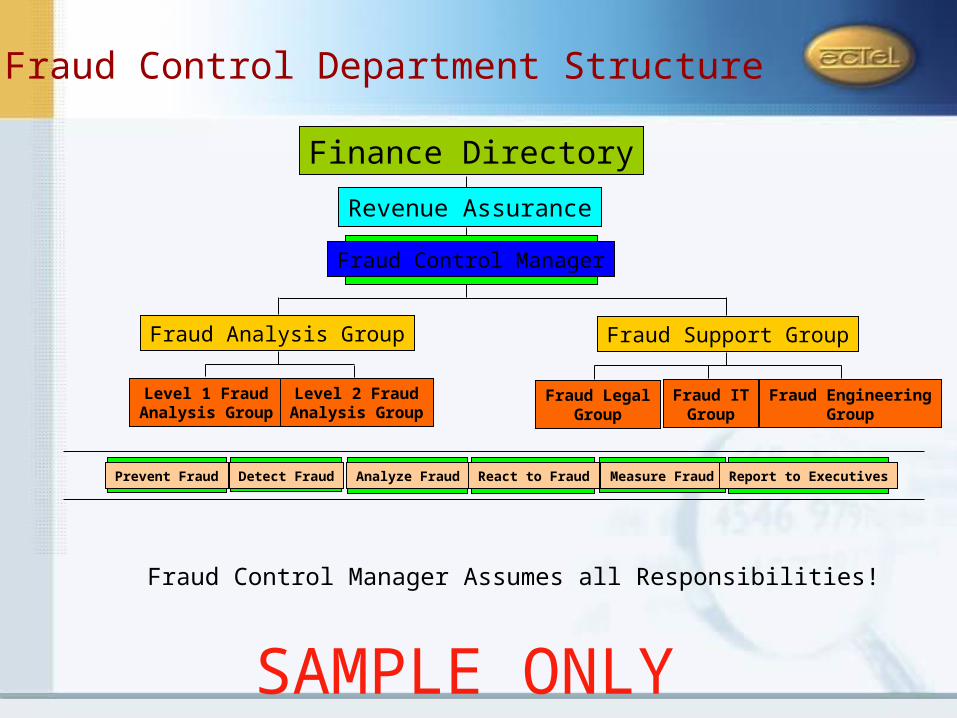
Finance Directory
Revenue Assurance
Fraud Control Manager
Fraud Analysis Group Fraud Support Group
Level 1 FraudAnalysis Group
Level 2 FraudAnalysis Group
Fraud LegalGroup
Fraud ITGroup
Fraud EngineeringGroup
Prevent Fraud Detect Fraud Analyze Fraud React to Fraud Measure Fraud Report to Executives
Fraud Control Manager Assumes all Responsibilities!
SAMPLE ONLY

Fraud Control Department Structure
Finance Directory
Revenue Assurance
Fraud Control Manager
Fraud Analysis Group Fraud Support Group
Level 1 FraudAnalysis Group
Level 2 FraudAnalysis Group
Fraud LegalGroup
Fraud ITGroup
Fraud EngineeringGroup
Prevent Fraud Detect Fraud Analyze Fraud React to Fraud Measure Fraud Report to Executives
Level 2 Fraud Analysis Group Responsibilities (continued):• More Datamining and Trend Analysis used for:
• Configuring the FMS and other systems to Detect frauds earlier• Detecting frauds not caught by fraud group found in the Bad Debt
• Working with Marketing to determine the best Fraud Prevention Procedures• Determining the best way to React to FraudsSAMPLE ONLY
Fraud Control Department Structure
Level 2 FraudAnalysis Group Discussion on Model Internal Structures of
Level 2 Fraud Analysis Group
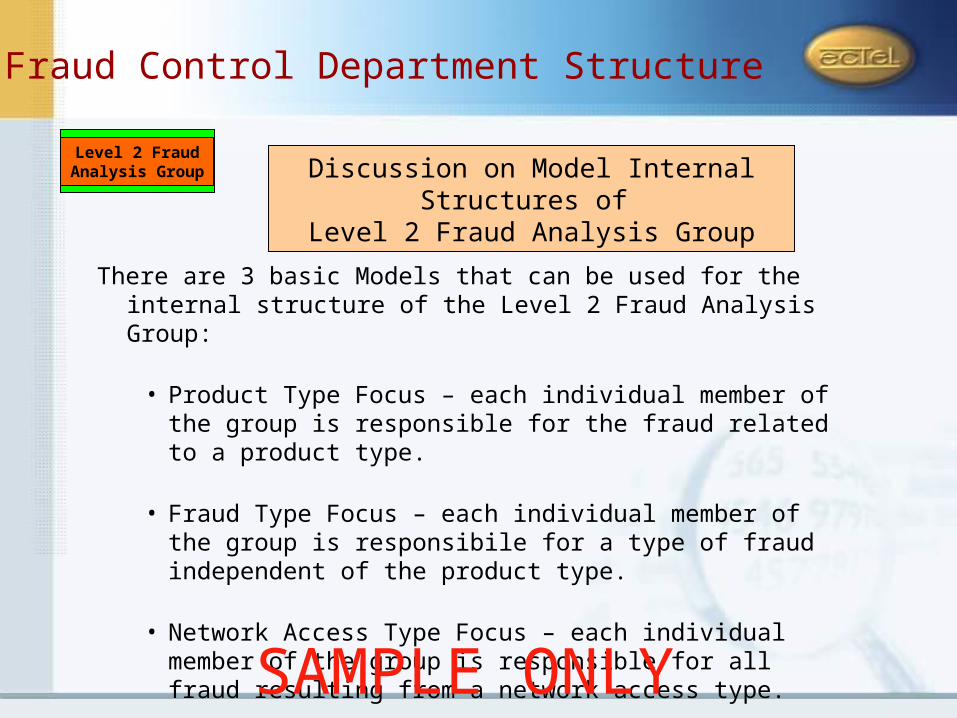
There are 3 basic Models that can be used for the internal structure of the Level 2 Fraud Analysis Group:
• Product Type Focus – each individual member of the group is responsible for the fraud related to a product type.
• Fraud Type Focus – each individual member of the group is responsibile for a type of fraud independent of the product type.
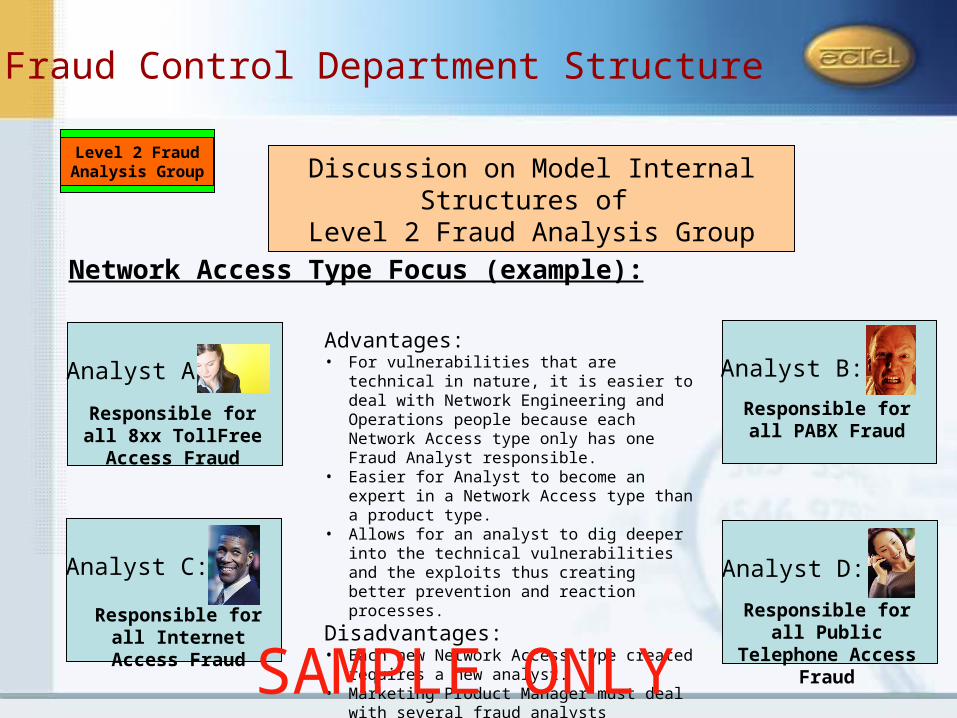
• Network Access Type Focus – each individual member of the group is responsible for all fraud resulting from a network access type.
SAMPLE ONLY

Fraud Control Department Structure
Level 2 FraudAnalysis Group Discussion on Model Internal Structures of
Level 2 Fraud Analysis Group
Product Type Focus (example):
Analyst A:
Responsible for all Prepaid Card Fraud
Analyst B:
Responsible for all Corp Long Distance
Fraud
Analyst C:
Responsible for all Local Access Fraud
Analyst D:
Responsible for all Internet Product Fraud
Advantages:• Marketing Product Manager deals with only
ONE representative from Fraud Control Department.
• Makes for easier implementation of prevention processes when the vulnerability is a Process Vulnerability because Marketing is actively involved.
• Makes it easy for product profitability evaluations. The fraud analyst has the fraud data specifically for the product.
Disadvantages:• More difficult when implementing preventive
measures against technical vulnerabilities. Network Engineering and Ops have to deal with multiple fraud analysts.
• Requires product identification at time of fraud detection, which can be difficult at times.SAMPLE ONLY

Fraud Control Department Structure
Level 2 FraudAnalysis Group Discussion on Model Internal Structures of
Level 2 Fraud Analysis Group
Fraud Type Focus (example):
Analyst A:
Responsible for all Subscription Fraud
Analyst B:
Responsible for all PABX Fraud
Analyst C:
Responsible for all Clip-on Fraud
Analyst D:
Responsible for all Internet Hacking
Fraud
Advantages:• Easier for Analyst to become an expert in a
fraud type than a product type. • Allows for an analyst to dig deeper into the
vulnerabilities and the exploits thus creating better prevention and reaction processes.
Disadvantages:• Each new fraud type discovered requires a new
analyst. Therefore growth of department is controlled by fraudsters.
• Marketing Product Manager must deal with several fraud analysts depending on the number of fraud vulnerabilities that exist for the product.
SAMPLE ONLY
Fraud Control Department Structure
Level 2 FraudAnalysis Group Discussion on Model Internal Structures of
Level 2 Fraud Analysis Group
Network Access Type Focus (example):
Analyst A:
Responsible for all 8xx TollFree Access
Fraud
Analyst B:
Responsible for all PABX Fraud
Analyst C:
Responsible for all Internet Access Fraud
Analyst D:
Responsible for all Public Telephone
Access Fraud
Advantages:• For vulnerabilities that are technical in nature, it
is easier to deal with Network Engineering and Operations people because each Network Access type only has one Fraud Analyst responsible.
• Easier for Analyst to become an expert in a Network Access type than a product type.
• Allows for an analyst to dig deeper into the technical vulnerabilities and the exploits thus creating better prevention and reaction processes.
Disadvantages:• Each new Network Access type created requires
a new analyst. • Marketing Product Manager must deal with
several fraud analysts depending on the number of different accesses a product may have. SAMPLE ONLY

Fraud Control Department Structure
Level 2 FraudAnalysis Group Discussion on Model Internal Structures of
Level 2 Fraud Analysis Group
NOTE: Fraud in Bad Debt Analysis could be divided up among the individual fraud analysts however, this can lead to a conflict of interest. The fraud analyst is responsible for early detection of all fraud for his focus (Product, Fraud Type, or Network Access). But having him report on fraud not found through early detection is like allowing the fox to guard the chickens.
An Alternative Approach:
YING-YANG APPROACH...
SAMPLE ONLY

Fraud Control Department Structure
Level 2 FraudAnalysis Group Discussion on Model Internal Structures of
Level 2 Fraud Analysis Group
YING-YANG APPROACH...
Analyst A:
Analyst B:
Analyst C:
Analyst D:
Analyst E:
Ea
ch a
na
lyst
’s p
erf
orm
an
ce is
m
ea
sure
d b
y th
e o
vera
ll d
ecr
rea
se in
fr
au
d f
or
the
ir a
rea
of
resp
on
sib
ility
.
Th
is an
alyst’s p
erfo
rma
nce
is m
ea
sure
d b
y the
am
ou
nt o
f frau
d
de
tecte
d in
the
ba
d d
eb
t tha
t the
oth
er
an
alyst’s m
issed
.
SAMPLE ONLY

Day 3Fraud Management Internal Processes
– Detection: An exploration of Information Sources that can used to detect fraud.
– Analysis: An in-depth discussion on different types of Analyses used to detect fraud along with their individual advantages.
– Reaction: A lesson in the different options on how to react to fraud.
– Prevention: A discussion in the importance of Prevention as part of the Fraud Control Internal Processes.
– Measurement: A very detailed discussion on how to measure both fraud losses and losses prevented, and how to measure efficiency of the FMS, the analysts, and the department.
SAMPLE ONLY
Prevention Detection Analysis Reaction Measurement Executive Reporting
Detection Datasources:
Generally, fraudsters do their best to hide the fraud they are committing. By hiding it, they can prolong the fraud and they can protect themselves from the legal consequences.
If the Telecom operator only looks for the fraud in the obvious places, the fraudster will hide in the not-so-obvious places.
The secret of keeping ahead of the fraud is to make available as many sources of relevant data as possible to the analysts and search it all looking for inconsistencies.
In the case, where the data is so great and the resources for performing the investigations is small, then the data needs to be prioritized to the likelihood of actually finding fraud.
Fraud Control Operational Processes
SAMPLE ONLY

Prevention Detection Analysis Reaction Measurement Executive Reporting
Detection Datasources:
Here is a listing of some datasources in a general order of priority:• FraudView System (FMS)• HLR System• CRM System• Collections System – Bad Debt• Revenue Assurance System• Billing System• Network Management System• Inter-Company Fraud Reports• Fraud Association Reports (CFCA, FIINA, TUFFS, etc.)• Anti-Fraud Hotlines• Marketing Trending Systems
Fraud Control Operational Processes
SAMPLE ONLY

Prevention Detection Analysis Reaction Measurement Executive Reporting
Detection Datasources:Using FraudView FMS as a Primary Source:
• Unlike all the other Telecom corporate systems in use, FraudView FMS is a system built specifically to detect fraud.
• The many different engines it has were all developed to look for fraud in each in a different way.
• Whenever possible, it is best to let the FMS perform the detection work feeding it data from as many relevant sources as possible. This is because of:
• The combination of data items from different sources can be a stronger indicator of fraud than any item alone.
• The other systems were not designed for fraud detection and using them for detection can have negative impacts.
• Prior to feeding more data to FraudView it will be important to perform an impact study to determine the performance impact the data will have.
Interface Manager
Data Management
CDRs/ XDRsCRM customer detailsPrepaid platformProbes (SS7, IP, VoIP)E/M CommerceOther data sources…
ExternalData
SourcesOSS/ BSSsystems
NetworkProbes
ProfilerAdditional
EnginesAdditional EnginesAdditionalEngines
Analysis Layer
Case/ Workflow, Reports, Link Analysis, Security Management
Web-Based User Environment
Proactive Prevention& Blocking
Actions
DB
Case Manager & Intelligent Scoring
I2-Based Link Analysis
Subscription Fraud
Package
Rule-Based Engine
Data Management Layer Interface Manager
Data Management
Interface Manager
Data Management
CDRs/ XDRsCRM customer detailsPrepaid platformProbes (SS7, IP, VoIP)E/M CommerceOther data sources…
ExternalData
SourcesOSS/ BSSsystems
NetworkProbes
ProfilerAdditional
EnginesAdditional
EnginesAdditional Engines
Additional EnginesAdditionalEngines
AdditionalEngines
Analysis LayerAnalysis Layer
Case/ Workflow, Reports, Link Analysis, Security Management
Web-Based User Environment
Proactive Prevention& Blocking
Actions
DBDB
Case Manager & Intelligent Scoring
I2-Based Link Analysis
Subscription Fraud
Package
Rule-Based Engine
Data Management Layer
Fraud Control Operational Processes
SAMPLE ONLY

Prevention Detection Analysis Reaction Measurement Executive Reporting
Detection Datasources:
FraudView FMS
Case 1
Case 2
Case 3
Case n
Probe CDRs
Switch CDRs
CRM Data
CollectionsData
HLR Data
Rev AssuranceData
Other Data
FraudViewCase Manager
AlertsRule-BasedEngine
Profiler
OtherEngine
FraudViewEngines
Frau
dV
iew In
terface Man
ager
Frau
dV
iew D
ata M
anag
em
ent
DataConsolidation
SubFraud
Package
“The more sand that you
put in your sandbox, the more bugs you will find hiding in the
sand.”
Fraud Control Operational Processes
SAMPLE ONLY
Prevention Detection Analysis Reaction Measurement Executive Reporting
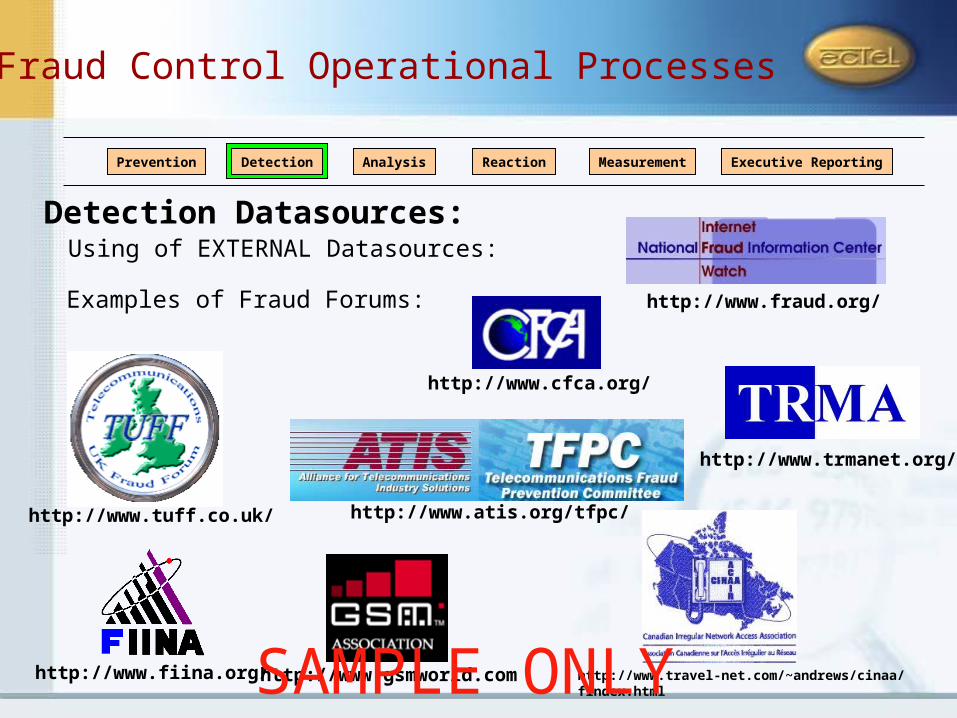
Detection Datasources:
Examples of Fraud Forums:
http://www.atis.org/tfpc/
http://www.gsmworld.com http://www.travel-net.com/~andrews/cinaa/findex.html
http://www.fraud.org/
http://www.fiina.org/
http://www.cfca.org/
http://www.trmanet.org/
http://www.tuff.co.uk/
Using of EXTERNAL Datasources:
Fraud Control Operational Processes
SAMPLE ONLY

Prevention Detection Analysis Reaction Measurement Executive Reporting
Detection Datasources:
Using Fraud Hotlines as a Source of Data:One option to help detect fraud is through the use of a Fraud Hotline. There should be at least one for company employees and another for outside customers.
• A hotline for outside customers will most often have a high percentage of false positives or will be used as a way to complain instead of reporting fraud. To solve this problem, an Fraud Forum can be used as an intermediary. For example, AT&T uses the National Fraud Information Center (www.fraud.org) as a fraud hotline.
• A hotline for internal employees should be communicated internally and made visible and available to all employees. The number of false positives from an internal hotline are much less.
Using of EXTERNAL Datasources:
Fraud Control Operational Processes
SAMPLE ONLY

Prevention Detection Analysis Reaction Measurement Executive Reporting
One of the primary goals of the Fraud Control Manager is to provide the means for his analysts to do their case analyses as accurately as possible and as quick as possible.
To help reach this goal, the fraud manager should try to automate as much of the analysis as possible via rules and thresholds. As much of this should be performed within the FMS (FraudView) as was discussed before.
If there are datasources that cannot be integrated with the FMS (FraudView) then an easy to use and fast interface should be created for quick access to those other datasources in order to speed up the analysis process as much as possible.
Analysis Tools and Options:Speed of Case Analysis:
Fraud Control Operational Processes
SAMPLE ONLY

Prevention Detection Analysis Reaction Measurement Executive Reporting
Analysis Tools and Options:Types of Analyses:
• In-depth Case Analysis:
1. CDR (Event) Analysis – analyze information in the CDRs
2. Client Data Analysis – analyze the HLR or Billing Data
3. Profile/Behavioural Analysis – analyze the profile or changes in the profile
4. Visualization Tool Analysisa. Link Analysis – find “Friends of the Fraudster”b. Pattern Analysis – find patterns that are indicative of fraud
5. Fraud Scheme Analysis – Determine the Fraud Threat, the Scheme Used, and the Vulnerability Exploited.
6. Historical Analysis: a. Past Payment Analysis – payment behaviors can indicate fraud or NOT fraud.b. Past Calling Behavior Analysis – past calling behavior helps confirm fraud and helps
determine type of fraud.
Fraud Control Operational Processes
SAMPLE ONLY

Prevention Detection Analysis Reaction Measurement Executive Reporting
Analysis Tools and Options:Types of Analyses (continued)
• Analysis through Interaction with Client
• Batch Analysis and Scoring
• Automated Analyses via Datamining Engines
• Trend Analysis
Fraud Control Operational Processes
SAMPLE ONLY

Prevention Detection Analysis Reaction Measurement Executive Reporting
Analysis Tools and Options:In-depth Case Analysis:
1. CDR (Event) Analysis CDRs (or Event Records) should be a primary source for Fraud Analysis. The following types of analyses can be performed with CDRs (or Event Records):
• Type of Calls (or Events) What are the types of calls made? (eg. Local, Cellular to Fixed Line, Long Distance, SMS
messaging, Internet usage, Purchases, etc.) Are these types typical for this type of customer?
• Destinations Called: What are the destinations called? Are the destinations the same as other fraud cases? Are the destinations called typical for this type of customer?
• Call Durations: What are the durations of the calls? Are these durations typical for this type of customer?
Fraud Control Operational Processes
SAMPLE ONLY
Prevention Detection Analysis Reaction Measurement Executive Reporting
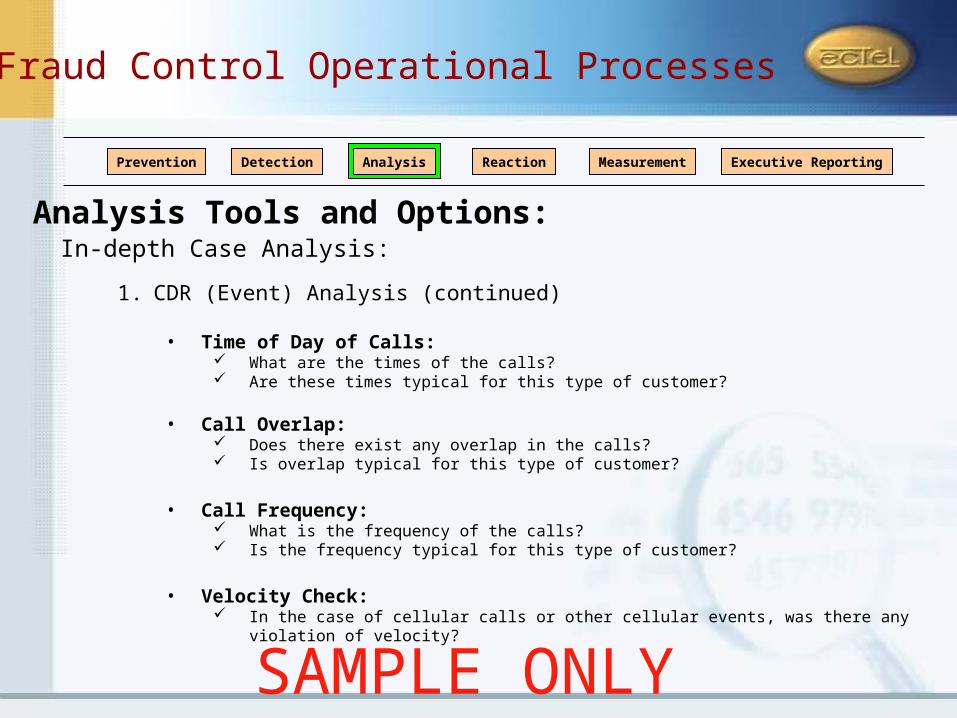
Analysis Tools and Options:In-depth Case Analysis:
1. CDR (Event) Analysis (continued)
• Time of Day of Calls: What are the times of the calls? Are these times typical for this type of customer?
• Call Overlap: Does there exist any overlap in the calls? Is overlap typical for this type of customer?
• Call Frequency: What is the frequency of the calls? Is the frequency typical for this type of customer?
• Velocity Check: In the case of cellular calls or other cellular events, was there any violation of velocity?
Fraud Control Operational Processes
SAMPLE ONLY
Prevention Detection Analysis Reaction Measurement Executive Reporting
Analysis Tools and Options:In-depth Case Analysis:
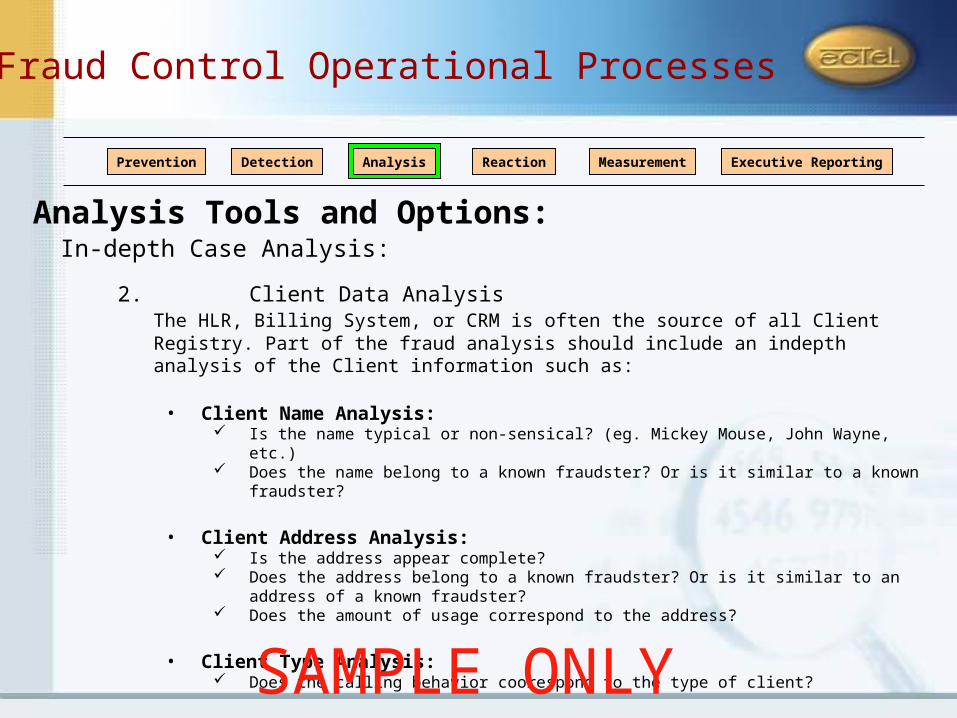
2. Client Data Analysis The HLR, Billing System, or CRM is often the source of all Client Registry. Part of the fraud analysis should include an indepth analysis of the Client information such as:
• Client Name Analysis: Is the name typical or non-sensical? (eg. Mickey Mouse, John Wayne, etc.) Does the name belong to a known fraudster? Or is it similar to a known fraudster?
• Client Address Analysis: Is the address appear complete? Does the address belong to a known fraudster? Or is it similar to an address of a known
fraudster? Does the amount of usage correspond to the address?
• Client Type Analysis: Does the calling behavior coorespond to the type of client?
Fraud Control Operational Processes
SAMPLE ONLY

Prevention Detection Analysis Reaction Measurement Executive Reporting
Analysis Tools and Options:In-depth Case Analysis:
2. Client Data Analysis (continued)
• Products/Services Ordered Analysis: Are the combination of the products and services ordered commonly ordered by fraudsters? Is the client using the products and services that were ordered? Are there better product and service options for the client? (this can come in handy when
talking with client on phone)
• Multiple Line Analysis: Are the number of phone lines owned by customer typical of this type of customer? Are they in the same location? Are they in radically different locations? Any known fraudulent locations or addresses?
Fraud Control Operational Processes
SAMPLE ONLY
Prevention Detection Analysis Reaction Measurement Executive Reporting
Analysis Tools and Options:In-depth Case Analysis:
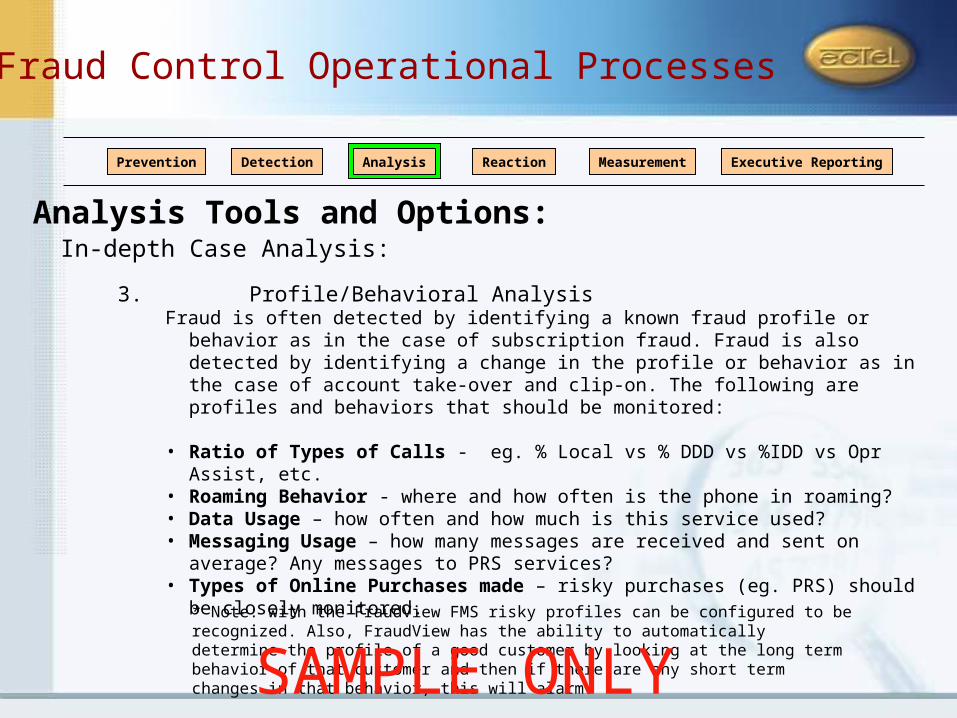
3. Profile/Behavioral Analysis Fraud is often detected by identifying a known fraud profile or behavior as in the case of
subscription fraud. Fraud is also detected by identifying a change in the profile or behavior as in the case of account take-over and clip-on. The following are profiles and behaviors that should be monitored:
• Ratio of Types of Calls - eg. % Local vs % DDD vs %IDD vs Opr Assist, etc.• Roaming Behavior - where and how often is the phone in roaming?• Data Usage – how often and how much is this service used?• Messaging Usage – how many messages are received and sent on average? Any
messages to PRS services?• Types of Online Purchases made – risky purchases (eg. PRS) should be closely
monitored.
* Note: with the FraudView FMS risky profiles can be configured to be recognized. Also, FraudView has the ability to automatically determine the profile of a good customer by looking at the long term behavior of that customer and then if there are any short term changes in that behavior, this will alarm.
Fraud Control Operational Processes
SAMPLE ONLY

Prevention Detection Analysis Reaction Measurement Executive Reporting
Analysis Tools and Options:In-depth Case Analysis:
4. Visualization Tool Analysis Professional fraud is often conducted by more than one person or telephone line. In fact
many times it is committed by a very organized and well structed group. In such cases, it is possible to find other fraudsters in the same organization by the use of visualization tools. Examples of Visualization tools are: I2 (ChoicePoint), Visualinks (Visual Analytics), GTAD (ID Analytics), Crimelink (PCI), Intelligence Analyst (Memex), OrionMagic (SRA). Through the use of a visualization tool the following types of analysis can be performed:
• Link Analysis - Link Analysis allows an analyst quickly identify patterns in the links between one fraudster and another. For example, oftentimes two or more fraudsters will communicate with each other through the phones that they are frauding. With the help of Link Analysis, the other fraudsters in the same organization or calling the same destinations can easily be identified.
• Pattern Analysis – through the use of visualization tools, calling patterns can be visually detected. For example, if cellphone fraudsters always call a certain phone numbers at certain times or for certain reasons, the patterns of these calls will be visible. When patterns are thus detected, filters to detect those patterns in realtime can be created.
* Note: FraudView FMS uses I2 software.
Fraud Control Operational Processes
SAMPLE ONLY

Prevention Detection Analysis Reaction Measurement Executive Reporting
Analysis Tools and Options:In-depth Case Analysis:
4. Visualization Tool Analysis:
* Note: FraudView FMS uses I2 software.
Eample of I2screenshot of a PABX
Intrusion
Fraud Control Operational Processes
SAMPLE ONLY

Prevention Detection Analysis Reaction Measurement Executive Reporting
Analysis Tools and Options:In-depth Case Analysis:
5. Fraud Scheme Analysis A very important part of the fraud case analysis is determining who the fraudster is (the
fraud threat), which fraud scheme he used, and which vulnerability was exploited. It is through this analysis, the fraud manager will be able to convince his executives of the prevention/detection/reaction options he feels he needs to implement to stop the fraud losses.
Not all fraud threats and fraud schemes can be accurately determined. However, vulnerabilities generally are easy to determine and must be determined for each fraud case that is analyzed.
Generally, filters that feed cases are fraud scheme specific, thus facilitating the fraud scheme determination.
Once the Fraud Threat, Fraud Scheme, and Vulnerability has been determined for each case, this needs to be recorded in the case database. By recording this information, we can do trend and fraud impact analysis on vulnerabilities, schemes, or even fraud threats. This is important when trying to justify a Prevention/Detection/Reaction option.
Fraud Control Operational Processes
SAMPLE ONLY
Prevention Detection Analysis Reaction Measurement Executive Reporting
Analysis Tools and Options:In-depth Case Analysis:
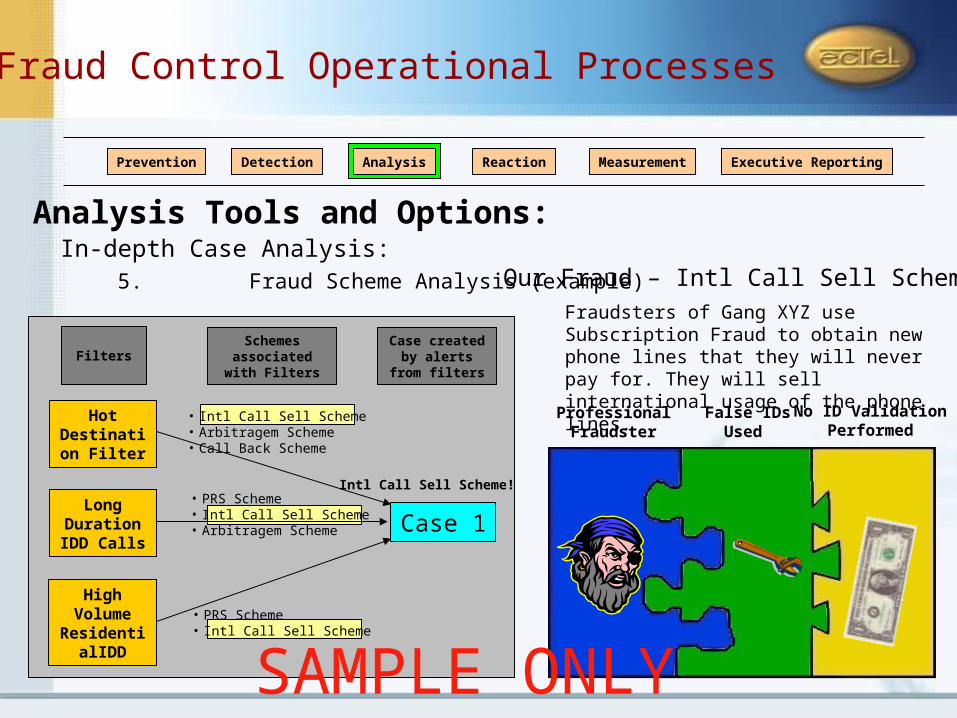
5. Fraud Scheme Analysis (example) Our Fraud – Intl Call Sell SchemeFraudsters of Gang XYZ use Subscription Fraud to obtain new phone lines that they will never pay for. They will sell international usage of the phone lines.
ProfessionalFraudster
False IDsUsed
No ID ValidationPerformed
Hot Destination
Filter
High Volume
ResidentialIDD
Long Duration IDD Calls
Case 1
• Intl Call Sell Scheme• Arbitragem Scheme• Call Back Scheme
• PRS Scheme• Intl Call Sell Scheme
• PRS Scheme• Intl Call Sell Scheme• Arbitragem Scheme
FiltersSchemes
associated with Filters
Case created by alerts from
filters
Intl Call Sell Scheme!
Fraud Control Operational Processes
SAMPLE ONLY

Prevention Detection Analysis Reaction Measurement Executive Reporting
Analysis Tools and Options:In-depth Case Analysis:
6. Historical Analysis Many times some of the best customers will have calling patterns and profiles very similar
to fraudsters. To avoid blocking these good customers, the case analysis should include an Historical Analysis. There are two major items that should analyzed:
a. Past Payments – If payments of equal or approximate amount of usage were made by the customer in the past, then it is reasonable to conclude that the customer can afford to pay for current usage and will do so.
b. Past Calling Behavior or Usage Behavior:• If the customer has had similar or equal usage behavior (same destinations, same amount,
etc) in the past AND has paid for it, then it is reasonable to assume that he is not a fraudster. Be careful of fraudsters that try to fool this analysis by making low volumes of similar calls and paying for those, but then later increase the volume dramitically.
• If the customer has a different usage behavior, then this can indicate account take-over or can indicate clip-on fraud.
Fraud Control Operational Processes
SAMPLE ONLY

Prevention Detection Analysis Reaction Measurement Executive Reporting
Analysis Tools and Options:Analysis through Interaction with Client:
There are many times when the case data is insufficient to make a decision as to whether the case is fraudulent or not. In such cases, one option is to converse with the customer and through the results of that conversation make a final decision.
Fraud Department Objectives of Interaction with the Customer:1. Validate that the customer is who is registered on the HLR and that the data is
correct.2. Determine if the suspicious activity on the account, phone calls, address
change, SMS messages, purchases, etc., originated from the customer.
Fraud Control Operational Processes
SAMPLE ONLY
Prevention Detection Analysis Reaction Measurement Executive Reporting
Analysis Tools and Options:Analysis through Interaction with Client:
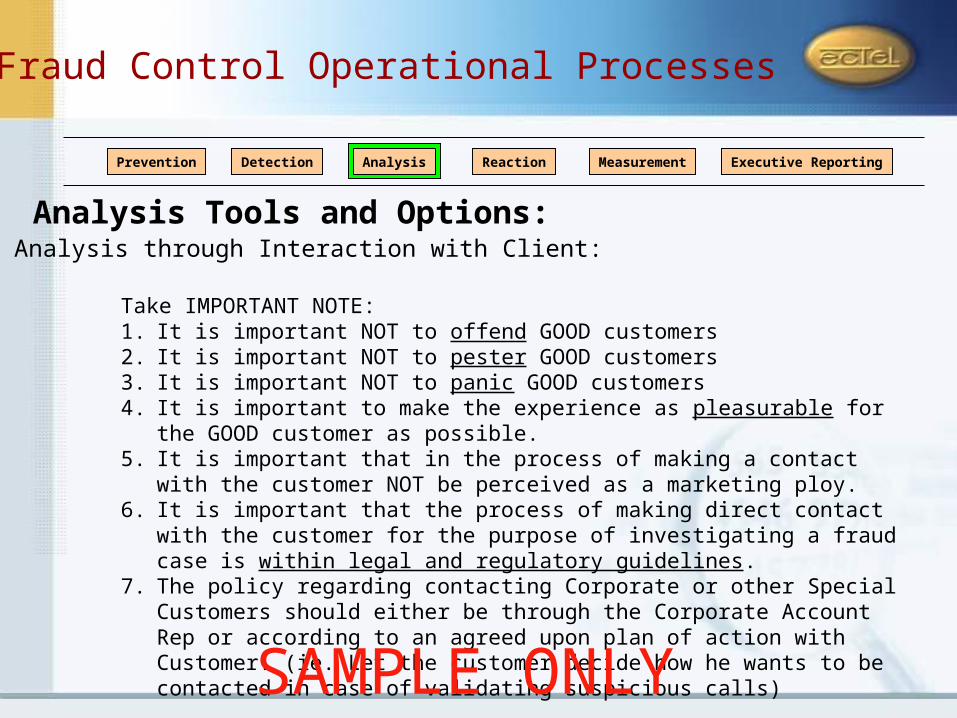
Take IMPORTANT NOTE:1. It is important NOT to offend GOOD customers2. It is important NOT to pester GOOD customers3. It is important NOT to panic GOOD customers4. It is important to make the experience as pleasurable for the GOOD customer
as possible.5. It is important that in the process of making a contact with the customer NOT be
perceived as a marketing ploy.6. It is important that the process of making direct contact with the customer for
the purpose of investigating a fraud case is within legal and regulatory guidelines.
7. The policy regarding contacting Corporate or other Special Customers should either be through the Corporate Account Rep or according to an agreed upon plan of action with Customer. (ie. Let the customer decide how he wants to be contacted in case of validating suspicious calls)
Fraud Control Operational Processes
SAMPLE ONLY

Prevention Detection Analysis Reaction Measurement Executive Reporting
Analysis Tools and Options:Analysis through Interaction with Client:
Methods of Connecting with Customer:1. Outbound call to either phoneline in analysis or other contact phone.
The difficulty in this approach is that the customer may not be available to talk at the time of the call.
2. Re-direction of next phone call made by customer to the fraud. The difficulties of this approach are:
• The customer maybe in a hurry to complete the call and may not want to cooperate at that time.
• If many customers are re-directed at the same time, this could cause a queue which will INFURIATE a good customer.
• This approach needs to have 24x7 support.3. Send SMS or Email to Customer asking to call Customer Service.
• If many customers are call at the same time, this could cause a queue which will INFURIATE a good customer.
Fraud Control Operational Processes
SAMPLE ONLY
Prevention Detection Analysis Reaction Measurement Executive Reporting
Analysis Tools and Options:Analysis through Interaction with Client:
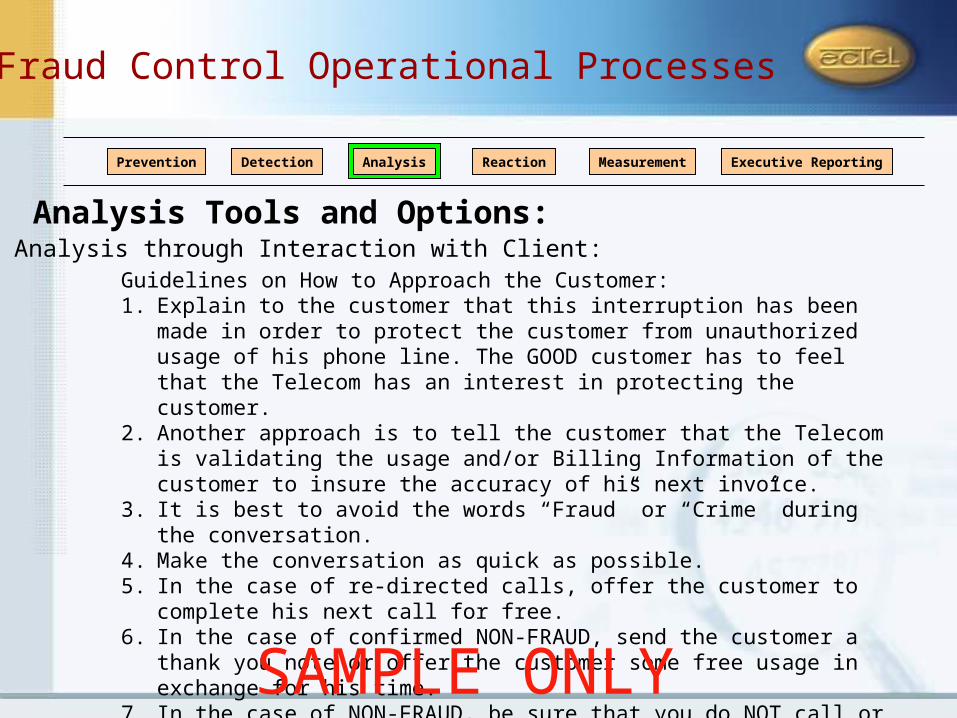
Guidelines on How to Approach the Customer:1. Explain to the customer that this interruption has been made in order to protect
the customer from unauthorized usage of his phone line. The GOOD customer has to feel that the Telecom has an interest in protecting the customer.
2. Another approach is to tell the customer that the Telecom is validating the usage and/or Billing Information of the customer to insure the accuracy of his next invoice.
3. It is best to avoid the words “Fraud” or “Crime” during the conversation. 4. Make the conversation as quick as possible.5. In the case of re-directed calls, offer the customer to complete his next call for
free.6. In the case of confirmed NON-FRAUD, send the customer a thank you note or
offer the customer some free usage in exchange for his time.7. In the case of NON-FRAUD, be sure that you do NOT call or interrupt the
customer again at least for a period of 6 months or more. Anyless time than this would be interpreted as pestering a GOOD customer.
Fraud Control Operational Processes
SAMPLE ONLY

Prevention Detection Analysis Reaction Measurement Executive Reporting
Analysis Tools and Options:Analysis through Interaction with Client:
How to Validate the Customer:1. When confirming the customer name and information, make it a partnership
validation. The customer may be in doubt as to whether the operator is really from the Telecom. So he may want to validate the operator as much as he is being validated. To accomplish this two-way validation here are some options:
• Only ask for part of the information (like the last 4 digits of the SSN)• The Operator can give part of the information and ask the customer to give the rest.
2. If a PIN number is associated with the service:• On Inbound calls, have the IVR prompt the customer for the PIN for a partial
validation. Note: It is also important to communicate via a message in the IVR that the customer should NEVER give the operator PIN number.
• On re-directed calls, prompting for the PIN number is perceived as rude and should NOT be done.
Fraud Control Operational Processes
SAMPLE ONLY

Prevention Detection Analysis Reaction Measurement Executive Reporting
Analysis Tools and Options:Analysis through Interaction with Client:
How to Validate the Customer (sample conversation):
Sample Conversation for a Re-directed Call:Fraud Operator: Good Afternoon, my name is John and I am a Customer Service Representative from ABC Telecom. Please do not
hang up. I need to quickly ask you a couple of questions regarding your account and then I will complete your call for free. Is that okay?
Customer: Okay.Fraud Operator: Sir, we have seen some activity on your account that we feel we should, for your protection, validate as being
originated from you. But first, I need to validate that you are the owner of the phone line. Sir, in my system, your first name is Carl. Is that right?
Customer: Yes, that is right.Fraud Operator: Carl, what is your last name?Customer: Smith. My last name is Smith.Fraud Operator: Thank you Carl. I am showing that your middle two digits of your Social Security Number are 56. Can you please tell
me what the last 4 digits of your Social Security Number are?Customer: 1-2-3-4Fraud Operator: Thank you Carl. Lastly, I am showing that you live on Edinburgh Way. Can you please tell me in what city you live
and your postal code?Customer: I live in Harlow. The postal code is: CM20 2BNFraud Operator: Thank you very much for you patience Carl. We have seen some calls originating from your telephone today to
destinations in Saudi Arabia and Kuwait. We just need to validate that you made these calls.Customer: Yes, I did. I work for a petroluem company and I need to do business with colleagues in those countries. Fraud Operator: Thank you very much for you patience, Carl. This is what I needed to confirm. I will now complete your
complementary call.
Fraud Control Operational Processes
SAMPLE ONLY
Prevention Detection Analysis Reaction Measurement Executive Reporting
Analysis Tools and Options:Analysis through Interaction with Client:
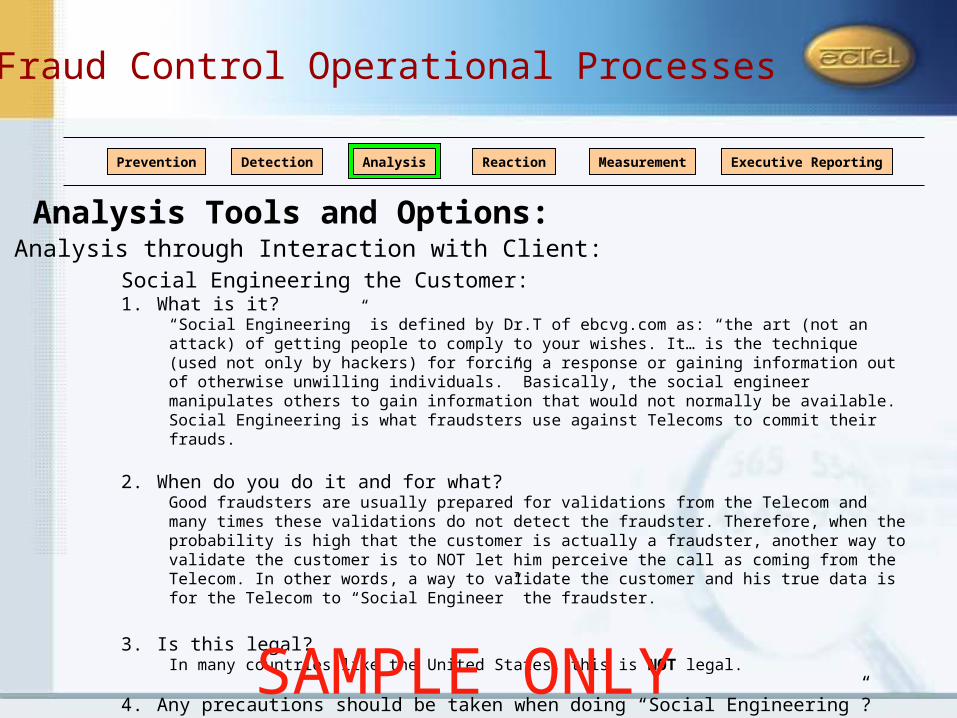
Social Engineering the Customer:1. What is it?
“Social Engineering” is defined by Dr.T of ebcvg.com as: “the art (not an attack) of getting people to comply to your wishes. It… is the technique (used not only by hackers) for forcing a response or gaining information out of otherwise unwilling individuals.” Basically, the social engineer manipulates others to gain information that would not normally be available. Social Engineering is what fraudsters use against Telecoms to commit their frauds.
2. When do you do it and for what?Good fraudsters are usually prepared for validations from the Telecom and many times these validations do not detect the fraudster. Therefore, when the probability is high that the customer is actually a fraudster, another way to validate the customer is to NOT let him perceive the call as coming from the Telecom. In other words, a way to validate the customer and his true data is for the Telecom to “Social Engineer” the fraudster.
3. Is this legal?In many countries like the United States, this is NOT legal.
4. Any precautions should be taken when doing “Social Engineering”?Make sure the Caller ID number is untracible. This can be accomplished by programming a bogus Caller ID number in a PABX and/or by blocking the Caller ID.
Fraud Control Operational Processes
SAMPLE ONLY
Prevention Detection Analysis Reaction Measurement Executive Reporting
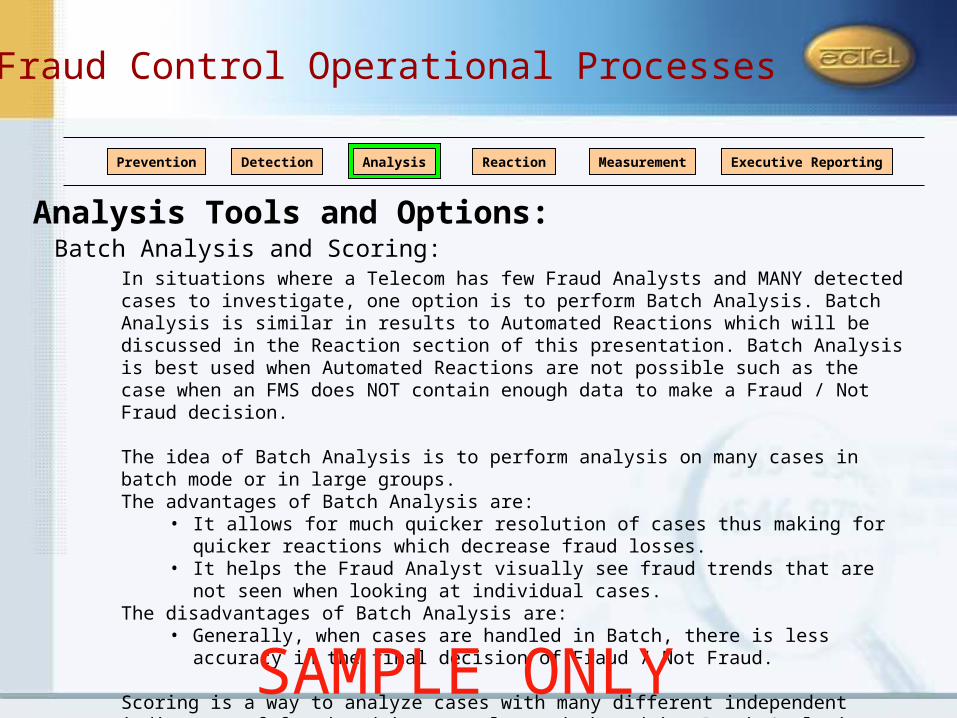
Analysis Tools and Options:Batch Analysis and Scoring:
In situations where a Telecom has few Fraud Analysts and MANY detected cases to investigate, one option is to perform Batch Analysis. Batch Analysis is similar in results to Automated Reactions which will be discussed in the Reaction section of this presentation. Batch Analysis is best used when Automated Reactions are not possible such as the case when an FMS does NOT contain enough data to make a Fraud / Not Fraud decision.
The idea of Batch Analysis is to perform analysis on many cases in batch mode or in large groups. The advantages of Batch Analysis are:
• It allows for much quicker resolution of cases thus making for quicker reactions which decrease fraud losses.
• It helps the Fraud Analyst visually see fraud trends that are not seen when looking at individual cases.
The disadvantages of Batch Analysis are:• Generally, when cases are handled in Batch, there is less accuracy in the final
decision of Fraud / Not Fraud.
Scoring is a way to analyze cases with many different independent indicators of fraud and is commonly used when doing Batch Analysis.
Fraud Control Operational Processes
SAMPLE ONLY
Prevention Detection Analysis Reaction Measurement Executive Reporting
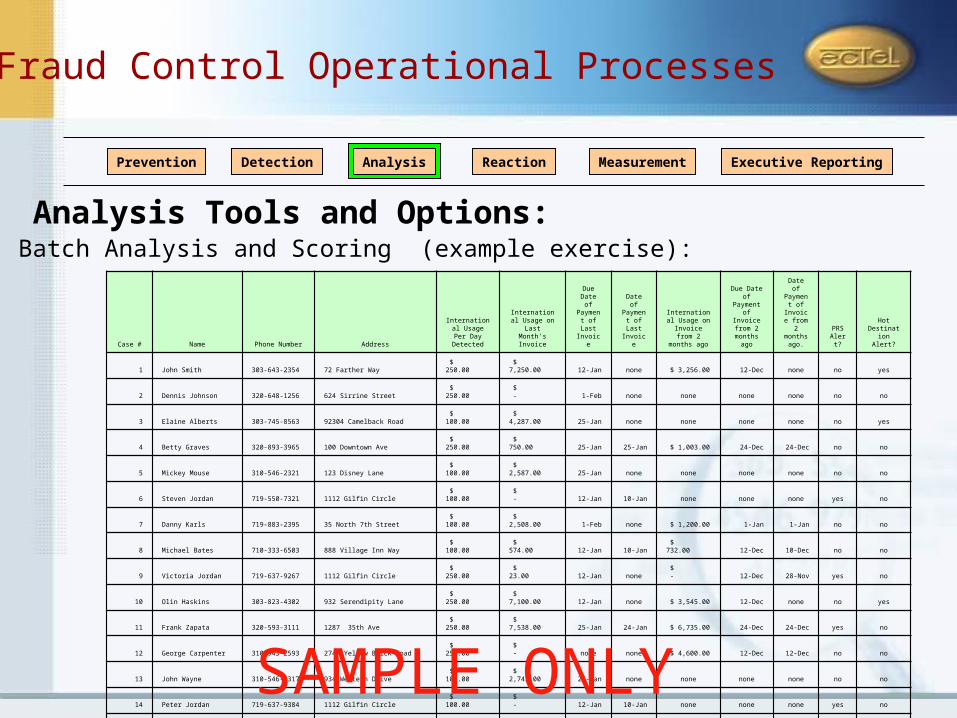
Analysis Tools and Options:Batch Analysis and Scoring (example exercise):
Case # Name Phone Number Address
International Usage Per
Day Detected
International Usage on Last Month's Invoice
Due Date of
Payment of Last Invoice
Date of Payment of Last Invoice
International Usage on
Invoice from 2 months ago
Due Date of Payment of Invoice
from 2 months
ago
Date of Payment
of Invoice from 2 months
ago.PRS
Alert?
Hot Destination
Alert?
1 John Smith 303-643-2354 72 Farther Way $ 250.00 $ 7,250.00 12-Jan none $ 3,256.00 12-Dec none no yes
2 Dennis Johnson 320-648-1256 624 Sirrine Street $ 250.00 $ - 1-Feb none none none none no no
3 Elaine Alberts 303-745-8563 92304 Camelback Road $ 100.00 $ 4,287.00 25-Jan none none none none no yes
4 Betty Graves 320-893-3965 100 Downtown Ave $ 250.00 $ 750.00 25-Jan 25-Jan $ 1,003.00 24-Dec 24-Dec no no
5 Mickey Mouse 310-546-2321 123 Disney Lane $ 100.00 $ 2,587.00 25-Jan none none none none no no
6 Steven Jordan 719-550-7321 1112 Gilfin Circle $ 100.00 $ - 12-Jan 10-Jan none none none yes no
7 Danny Karls 719-883-2395 35 North 7th Street $ 100.00 $ 2,508.00 1-Feb none $ 1,200.00 1-Jan 1-Jan no no
8 Michael Bates 710-333-6503 888 Village Inn Way $ 100.00 $ 574.00 12-Jan 10-Jan $ 732.00 12-Dec 10-Dec no no
9 Victoria Jordan 719-637-9267 1112 Gilfin Circle $ 250.00 $ 23.00 12-Jan none $ - 12-Dec 28-Nov yes no
10 Olin Haskins 303-823-4302 932 Serendipity Lane $ 250.00 $ 7,100.00 12-Jan none $ 3,545.00 12-Dec none no yes
11 Frank Zapata 320-593-3111 1287 35th Ave $ 250.00 $ 7,538.00 25-Jan 24-Jan $ 6,735.00 24-Dec 24-Dec yes no
12 George Carpenter 310-943-2593 2747 Yellow Brick Road $ 250.00 $ - none none $ 4,600.00 12-Dec 12-Dec no no
13 John Wayne 310-546-2317 934 Western Drive $ 100.00 $ 2,743.00 25-Jan none none none none no no
14 Peter Jordan 719-637-9384 1112 Gilfin Circle $ 100.00 $ - 12-Jan 10-Jan none none none yes no
15 D Thomas 303-678-7672 6365 Sleepy Cove Road $ 100.00 $ 3,765.00 25-Jan none none none none no yes
16 Billy Gates 710-839-2383 7733 Billy Bob Path $ 250.00 $21,642.00 1-Feb none $ 3,256.00 1-Jan 1-Jan no no
17 Tom Pines 719-883-5693 90 Barnes Ave $ 100.00 $ 275.00 12-Jan 12-Jan $ 7,326.00 12-Dec 12-Dec no no
18 Angela Thors 320-834-0932 63 Hilgstreet Street $ 100.00 $ 34.00 25-Jan 25-Jan $ 56.00 24-Dec 24-Dec no no
19 Elvis Presley 310-546-2320 567Elms Street $ 100.00 $ 2,387.00 25-Jan none none none none no no
20 Bob Waters 320-573-2934 9090 Beautiful Gold Road $ 100.00 $ 482.00 25-Jan none none none none no no
Fraud Control Operational Processes
SAMPLE ONLY

Prevention Detection Analysis Reaction Measurement Executive Reporting
Analysis Tools and Options:Batch Analysis and Scoring:
Perform Batch Analysis on small
sample to determine weights.
weig
hts
Perform Batch Analysis on large
group applying the “learned” weights. Fraud
Not Fraud
Investigate
Separate into Catagories
Perform Sanity Check (audit) on
samples from each catagory
Failed Sanity
Check?
yesPerform new
weight determination
no
Continue to use same weights
On-going Process
Fraud Control Operational Processes
SAMPLE ONLY

Prevention Detection Analysis Reaction Measurement Executive Reporting
Analysis Tools:
Regression Algorithms
Neural Networks
Cluster Analysis
Rule Induction
Automated Analysis via Datamining Engines:
Fraud Control Operational Processes
SAMPLE ONLY
Prevention Detection Analysis Reaction Measurement Executive Reporting
Analysis Tools and Options:Automated Analysis via Datamining Engines:
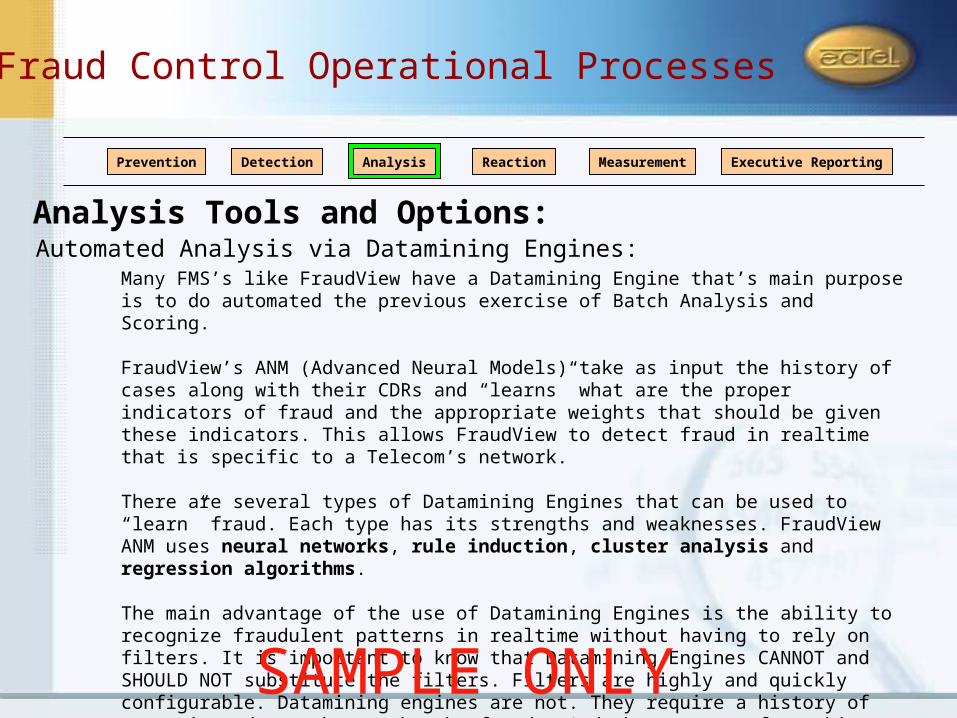
Many FMS’s like FraudView have a Datamining Engine that’s main purpose is to do automated the previous exercise of Batch Analysis and Scoring.
FraudView’s ANM (Advanced Neural Models) take as input the history of cases along with their CDRs and “learns” what are the proper indicators of fraud and the appropriate weights that should be given these indicators. This allows FraudView to detect fraud in realtime that is specific to a Telecom’s network.
There are several types of Datamining Engines that can be used to “learn” fraud. Each type has its strengths and weaknesses. FraudView ANM uses neural networks, rule induction, cluster analysis and regression algorithms.
The main advantage of the use of Datamining Engines is the ability to recognize fraudulent patterns in realtime without having to rely on filters. It is important to know that Datamining Engines CANNOT and SHOULD NOT substitute the filters. Filters are highly and quickly configurable. Datamining engines are not. They require a history of cases in order to be taught the frauds. And the process of teaching them can take weeks of work.
Fraud Control Operational Processes
SAMPLE ONLY
Prevention Detection Analysis Reaction Measurement Executive Reporting
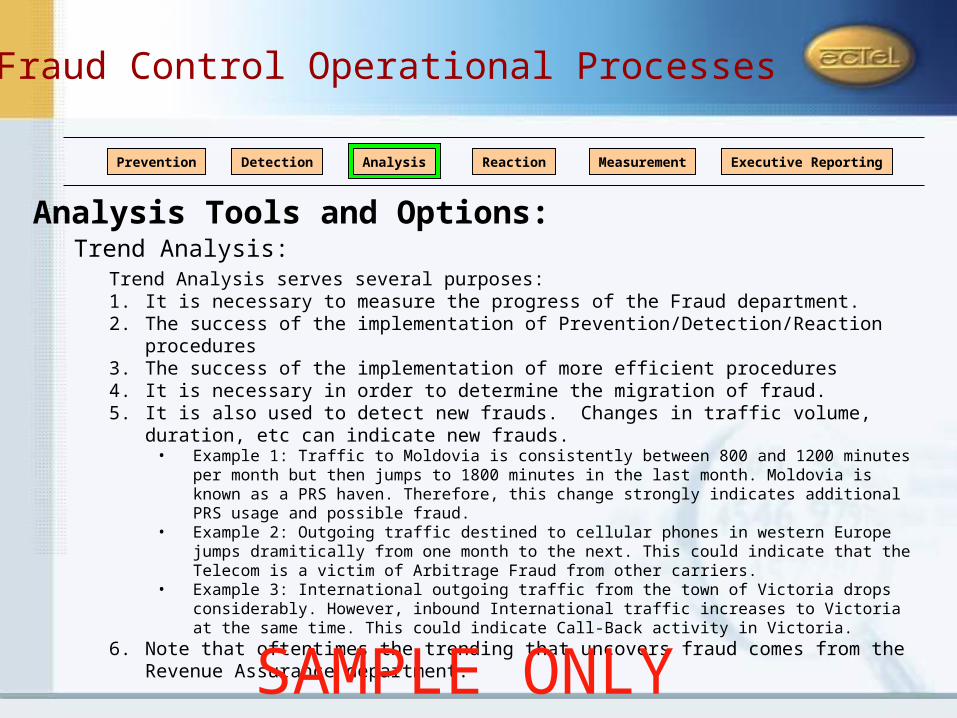
Analysis Tools and Options:Trend Analysis:Trend Analysis serves several purposes:1. It is necessary to measure the progress of the Fraud department.2. The success of the implementation of Prevention/Detection/Reaction procedures3. The success of the implementation of more efficient procedures4. It is necessary in order to determine the migration of fraud. 5. It is also used to detect new frauds. Changes in traffic volume, duration, etc can indicate
new frauds. • Example 1: Traffic to Moldovia is consistently between 800 and 1200 minutes per month but then
jumps to 1800 minutes in the last month. Moldovia is known as a PRS haven. Therefore, this change strongly indicates additional PRS usage and possible fraud.
• Example 2: Outgoing traffic destined to cellular phones in western Europe jumps dramitically from one month to the next. This could indicate that the Telecom is a victim of Arbitrage Fraud from other carriers.
• Example 3: International outgoing traffic from the town of Victoria drops considerably. However, inbound International traffic increases to Victoria at the same time. This could indicate Call-Back activity in Victoria.
6. Note that oftentimes the trending that uncovers fraud comes from the Revenue Assurance department.
Fraud Control Operational Processes
SAMPLE ONLY
Prevention Detection Analysis Reaction Measurement Executive Reporting
Prevention Tools and Options:
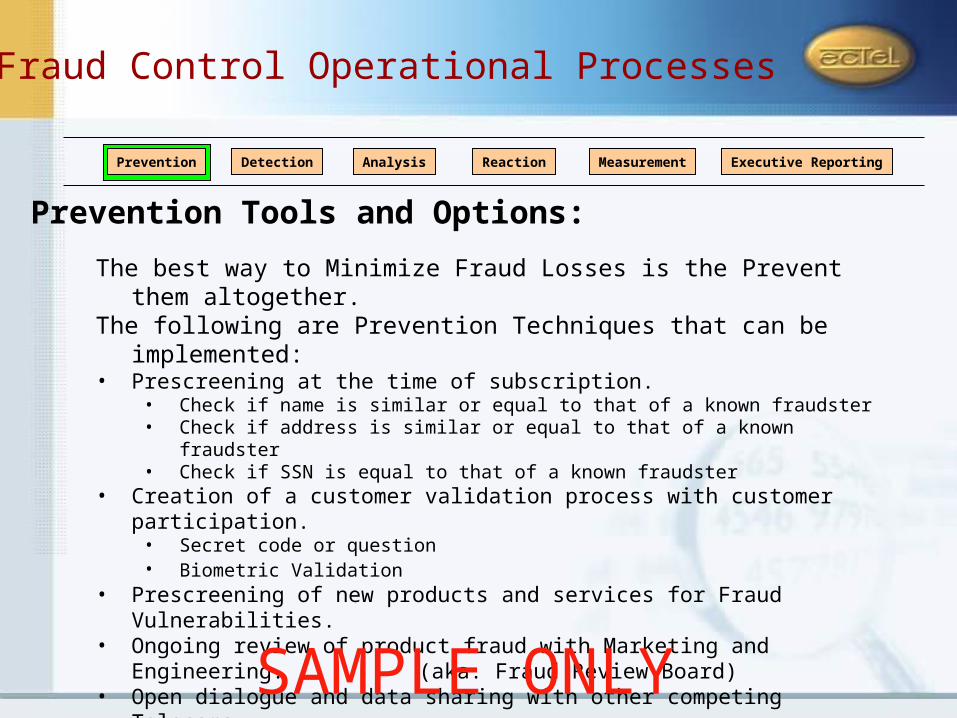
The best way to Minimize Fraud Losses is the Prevent them altogether.The following are Prevention Techniques that can be implemented:• Prescreening at the time of subscription.
• Check if name is similar or equal to that of a known fraudster• Check if address is similar or equal to that of a known fraudster• Check if SSN is equal to that of a known fraudster
• Creation of a customer validation process with customer participation.• Secret code or question• Biometric Validation
• Prescreening of new products and services for Fraud Vulnerabilities.• Ongoing review of product fraud with Marketing and Engineering.
(aka. Fraud Review Board)• Open dialogue and data sharing with other competing Telecoms.• Participation in Professional Fraud Organizations.
Fraud Control Operational Processes
SAMPLE ONLY

Prevention Detection Analysis Reaction Measurement Executive Reporting
Prevention Tools and Options:
Customer Risk Analysis:One way of preventing bad debt and fraud is to perform a customer risk
analysis throughout the lifetime of the customer. This risk analysis is similar to a credit score.
• New Subscibers:Each new subscriber should be immediately scored for for fraud or bad debt risk. This is done by comparing their subscription profile to the known fraud and bad debt risk profiles. The profiles would include:
• External Credit Score• External Telecom Fraud and Bad Debt Data• Address: what is the probability of this customer being a bad debt customer or
fraudster (risk score) based on their zip code, street name, city, etc?• Product Suite: what is the risk score based on the product suite of the
customer?• Age: what is the risk score based on the age of the customer?• Income: If available, what is the risk score based on the known income?
Fraud Control Operational Processes
SAMPLE ONLY
Prevention Detection Analysis Reaction Measurement Executive Reporting
Prevention Tools and Options:
Customer Risk Analysis:
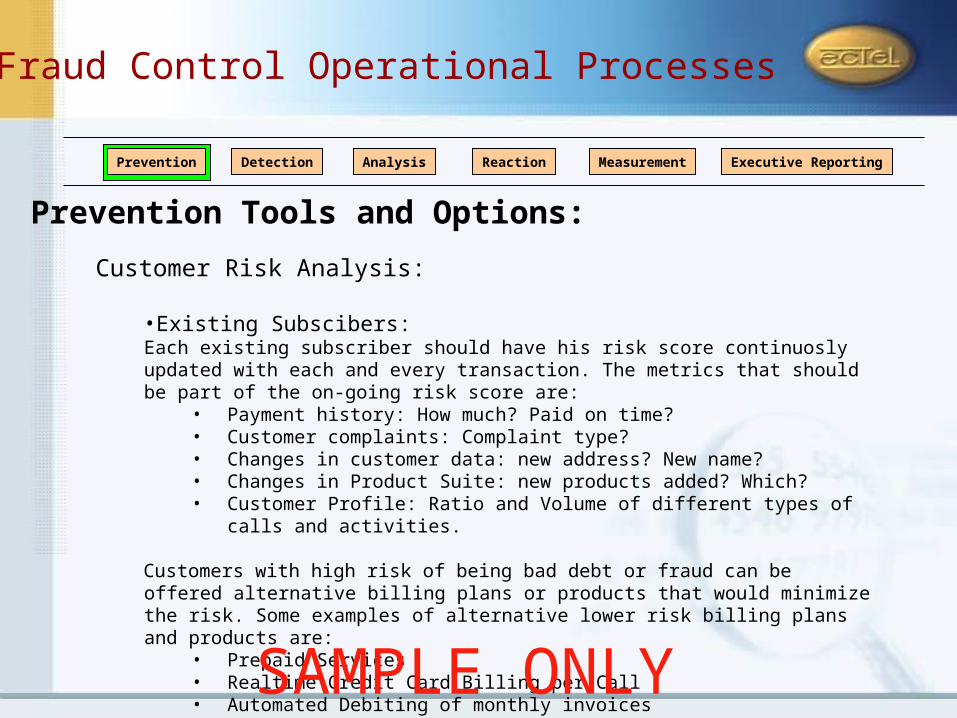
•Existing Subscibers:Each existing subscriber should have his risk score continuosly updated with each and every transaction. The metrics that should be part of the on-going risk score are:
• Payment history: How much? Paid on time?• Customer complaints: Complaint type? • Changes in customer data: new address? New name?• Changes in Product Suite: new products added? Which?• Customer Profile: Ratio and Volume of different types of calls and activities.
Customers with high risk of being bad debt or fraud can be offered alternative billing plans or products that would minimize the risk. Some examples of alternative lower risk billing plans and products are:
• Prepaid Services• Realtime Credit Card Billing per Call• Automated Debiting of monthly invoices• Imposed Limits on Usage
Fraud Control Operational Processes
SAMPLE ONLY

Prevention Detection Analysis Reaction Measurement Executive Reporting
Prevention Tools and Options:
Biometric Validation A solution to successfully validating customers is through Biometric processes.Photo of Customer: one option is at the time and place of subscription to snap a
digital photo of the customer and keep this as a part of the permanent record (HLR). Then, in difficult validation cases, if the customer goes to a remote office of the Telecom, he can be validated by the person atending the customer.
Another option that might be considered is to have the customer send a photo taken by his cell-phone camera and send that via MMS.
Another option is to have software evaluate all the client photos looking for similar or the same customers. This is a way to catch ID Thieves. Manufacturers of such software are: Verilook, Aurora Clockface, LogicaCMG.
Fraud Control Operational Processes
SAMPLE ONLY

Prevention Detection Analysis Reaction Measurement Executive Reporting
Prevention Tools and Options:
Biometric Validation: Example of Verilook Software for Face Recognition.
Recognition successfulwith .68 similarity!
Fraud Control Operational Processes
SAMPLE ONLY

Prevention Detection Analysis Reaction Measurement Executive Reporting
Prevention Tools and Options:
Biometric Validation: Other Biometrics:
Fingerprint Scans – one option for the future is to make cellphone touch screens that also serve as a fingerprint scanner. This way, before individual calls, purchases, messages, the caller could be validated via a Fingerprint. Also calls, files, etc. could be encrypted with the Fingerprint.
Voice Recognition – The technology already exists to recognize a person’s voice while on the telephone. This technology can be used to validate a customer while he is requesting the operator to complete a call, or update his account. Accuracies have been seen with a False Reject Rate of 1% with a False Accept Rate of 0.07%. Some of the companies with Voice Recognition products on the market are: Authentify, Persay Vocal Password, Nuance, Phonetic Systems.
Fraud Control Operational Processes
SAMPLE ONLY

Prevention Detection Analysis Reaction Measurement Executive Reporting
Measurement Tools and Metrics:
Measurement Tools:It is important to have the tools necessary to perform accurate fraud
measurements. The following are tools that facilitate measurements:
1. Relational Database that is linked with the FMS. It stores all cases alarmed, analyzed, and ruled as well as all the associated CDRs.
2. Links and APIs with all other Corporate Systems for relational data.3. Datamining Software for finding unseen patterns, nuances, and for
developing detection models.4. Report Creation Software
Fraud Control Operational Processes
SAMPLE ONLY

Prevention Detection Analysis Reaction Measurement Executive Reporting
Measuring Losses and Losses Prevented per Case:To measure fraud losses and losses prevented, the following informations are required per case:
• Fraud Start Date – the date the first fraudulent calls occurred.• The Tariffed CDRs – the calculated tariffs for all the fraudulent need to be
calculated. They can be the actual tariffs or estimated tariffs depending on the accuracy needed.
• Fraud Stop Date – generally when the telephone line was blocked.• The Invoice Due Date – this is for the invoice that will/would contain the details
of the fraudulent calls had they NOT been fraud.• The Bad Debt Block Date – this is the date the phone line would have been
blocked for bad debt had the fraud NOT been found and blocked prior.
tFraud Start Date Fraud Stop Date Invoice Due Date Bad Debt Block Date
Measurement Tools and Metrics:
Fraud Control Operational Processes
SAMPLE ONLY

Prevention Detection Analysis Reaction Measurement Executive Reporting
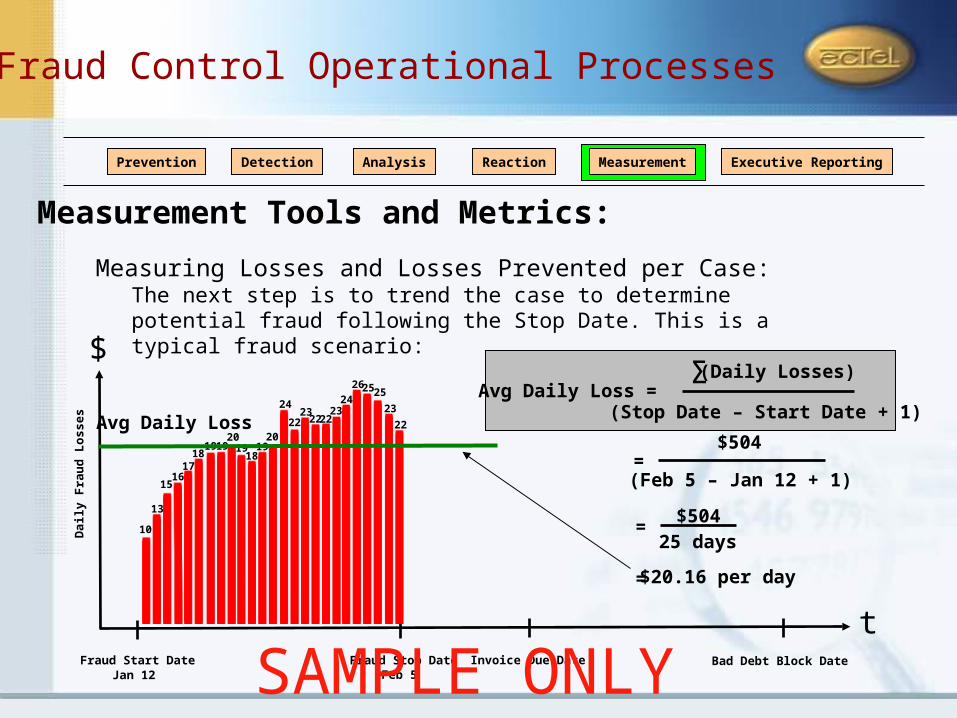
Measuring Losses and Losses Prevented per Case:The next step is to trend the case to determine potential fraud following the Stop Date. This is a typical fraud scenario:
tFraud Start Date Fraud Stop Date Invoice Due Date Bad Debt Block Date
How should this be trended?option 1
option 2option 1- trend over entire fraud lifetime?option 2- last few days trend?
option 3
option 3- nth degree polynomial trend?
None of the above!When estimating something that did not
happen, it is best to be conservative and simple!
Daily Fraud Losses
Dai
ly F
rau
d L
os
ses
$
Measurement Tools and Metrics:
Fraud Control Operational Processes
SAMPLE ONLY

Prevention Detection Analysis Reaction Measurement Executive Reporting
Measuring Losses and Losses Prevented per Case:The next step is to trend the case to determine potential fraud following the Stop Date. This is a typical fraud scenario:
tFraud Start Date Fraud Stop Date Invoice Due Date Bad Debt Block Date
How should this be trended?Best option – use average loss per day as trend
Sum up total losses and divide by number of days.
Daily Fraud Losses
Avg Daily Loss =(Daily Losses)Σ
(Stop Date – Start Date + 1)
Dai
ly F
rau
d L
os
ses
$
Avg Daily Loss
Measurement Tools and Metrics:
Fraud Control Operational Processes
SAMPLE ONLY
Prevention Detection Analysis Reaction Measurement Executive Reporting
Measuring Losses and Losses Prevented per Case:The next step is to trend the case to determine potential fraud following the Stop Date. This is a typical fraud scenario:
tFraud Start Date Fraud Stop Date Invoice Due Date Bad Debt Block Date
Avg Daily Loss =(Daily Losses)Σ
(Stop Date – Start Date + 1)
Dai
ly F
rau
d L
os
ses
$
10
20 20
15
1919 1918
1918
1716
13
24
26
2423
222223
22
2525
23
22
$504
(Feb 5 – Jan 12 + 1)=
$50425 days
=
= $20.16 per day
Avg Daily Loss
Jan 12 Feb 5
Measurement Tools and Metrics:
Fraud Control Operational Processes
SAMPLE ONLY

Prevention Detection Analysis Reaction Measurement Executive Reporting
Measuring Losses and Losses Prevented per Case:We know that had the case NOT been caught and blocked on Feb 5th, surely the customer would have been blocked eventually after non-payment. For this example, lets say that date is 24 days after the Due Date of the next invoice.
tFraud Start Date Fraud Stop Date Invoice Due Date Bad Debt Block Date
Dai
ly F
rau
d L
os
ses
$
10
20 20
15
1919 1918
1918
1716
13
24
26
2423
222223
22
2525
23
22Avg Daily Loss
Jan 12 Feb 5 Mar 13Feb 17 24 days
Invoice Due Date = Feb 17th
Bad Debt Block Date = Mar 13th
Next we assume that everyday would have had the same daily average.
+ 24 days =
Measurement Tools and Metrics:
Fraud Control Operational Processes
SAMPLE ONLY
Prevention Detection Analysis Reaction Measurement Executive Reporting
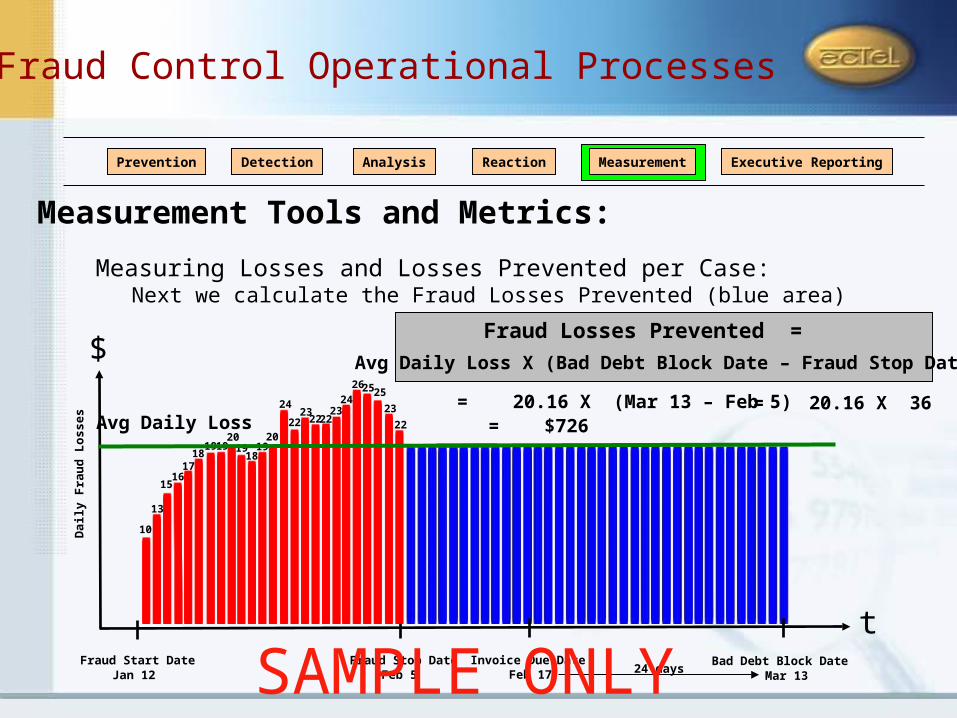
Measuring Losses and Losses Prevented per Case:Next we calculate the Fraud Losses Prevented (blue area)
tFraud Start Date Fraud Stop Date Invoice Due Date Bad Debt Block Date
Dai
ly F
rau
d L
os
ses
$
10
20 20
15
1919 1918
1918
1716
13
24
26
2423
222223
22
2525
23
22Avg Daily Loss
Jan 12 Feb 5 Mar 13Feb 17 24 days
Fraud Losses Prevented =
Avg Daily Loss X (Bad Debt Block Date – Fraud Stop Date)
= 20.16 X (Mar 13 – Feb 5) = 20.16 X 36= $726
Measurement Tools and Metrics:
Fraud Control Operational Processes
SAMPLE ONLY

Prevention Detection Analysis Reaction Measurement Executive Reporting
Measuring Losses and Losses Prevented per Case:Summary:
Avg Daily Loss =(Daily Losses)Σ
(Stop Date – Start Date + 1)
Total Fraud Loss = (Daily Losses)Σ
Fraud Losses Prevented =
Avg Daily Loss X (Bad Debt Block Date – Fraud Stop Date)
Measurement Tools and Metrics:
Fraud Control Operational Processes
SAMPLE ONLY

Prevention Detection Analysis Reaction Measurement Executive Reporting
Measuring Losses and Losses Prevented per Product:When measuring the Fraud Losses for a product or service, ALL sources of cases should be included.
FMS Cases InvestigatedFraud in
Bad Debt Cases
Customer Complaint
Cases**
** Cases resulting in calls not recognized and deleted from invoices
Ghosting Cases
All Fraud CDRs
All Fraud CDRs
All Fraud Case Estimated Avg Daily Losses
All Fraud CDRs
Daily Losses Report
Product XYZ
ADD
All Fraud CDRs
CompleteDaily Losses Report
Product XYZ
Measurement Tools and Metrics:
Fraud Control Operational Processes
SAMPLE ONLY

Prevention Detection Analysis Reaction Measurement Executive Reporting
Measuring Losses and Losses Prevented per Product:When measuring the Fraud Losses Prevented for a product or service, ALL sources of cases should be included.
FMS Cases Investigated
* From each case start date and stop date
Ghosting Cases
Estimated Daily
Losses
Prevented for all
Fraud Cases
All Fraud Case Estimated Avg Daily Losses Prevented
All Fraud Losses
Prevented Daily
Estimates*
Daily Losses Prevented Report
Product XYZ
ADD
CompleteDaily Losses
Prevented ReportProduct XYZ
Blocked Subscriptions
Cases Estimated Daily Losses Prevented for all Fraud Cases
Measurement Tools and Metrics:
Fraud Control Operational Processes
SAMPLE ONLY
Prevention Detection Analysis Reaction Measurement Executive Reporting
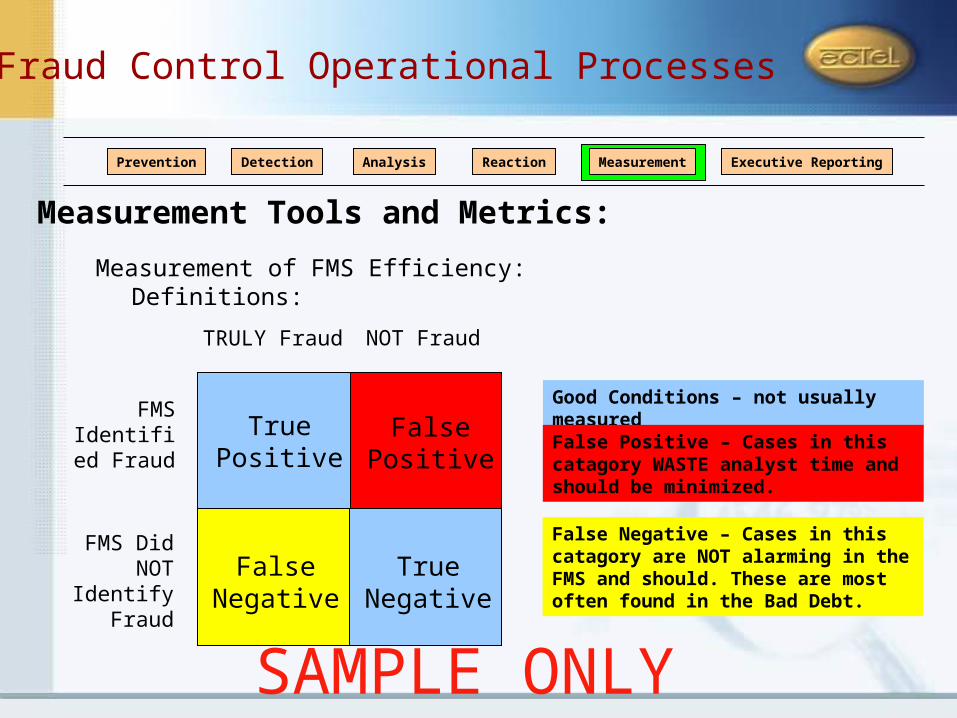
Measurement of FMS Efficiency:Definitions:
TRULY Fraud NOT Fraud
FMS Identified
Fraud
FMS Did NOT
Identify Fraud
True Positive
True Negative
Good Conditions – not usually measuredFalse
PositiveFalse Positive – Cases in this catagory WASTE analyst time and should be minimized.
False Negative
False Negative – Cases in this catagory are NOT alarming in the FMS and should. These are most often found in the Bad Debt.
Measurement Tools and Metrics:
Fraud Control Operational Processes
SAMPLE ONLY

Prevention Detection Analysis Reaction Measurement Executive Reporting
Measurement of FMS Efficiency:Measurments that should be taken:
TRULY Fraud NOT Fraud
FMS Identified
Fraud
FMS Did NOT
Identify Fraud
True Positive
True Negative
False Positive
False Negative
FMS False Postive Rate:% of False Positives per week or month. Percentage based on total number of cases created by FMS.
FMS False Negative Rate:% of False Negatives per week or month. Percentage based on total number of cases identified by FMS plus cases NOT identified by FMS.
Measurement Tools and Metrics:
Fraud Control Operational Processes
SAMPLE ONLY
Prevention Detection Analysis Reaction Measurement Executive Reporting
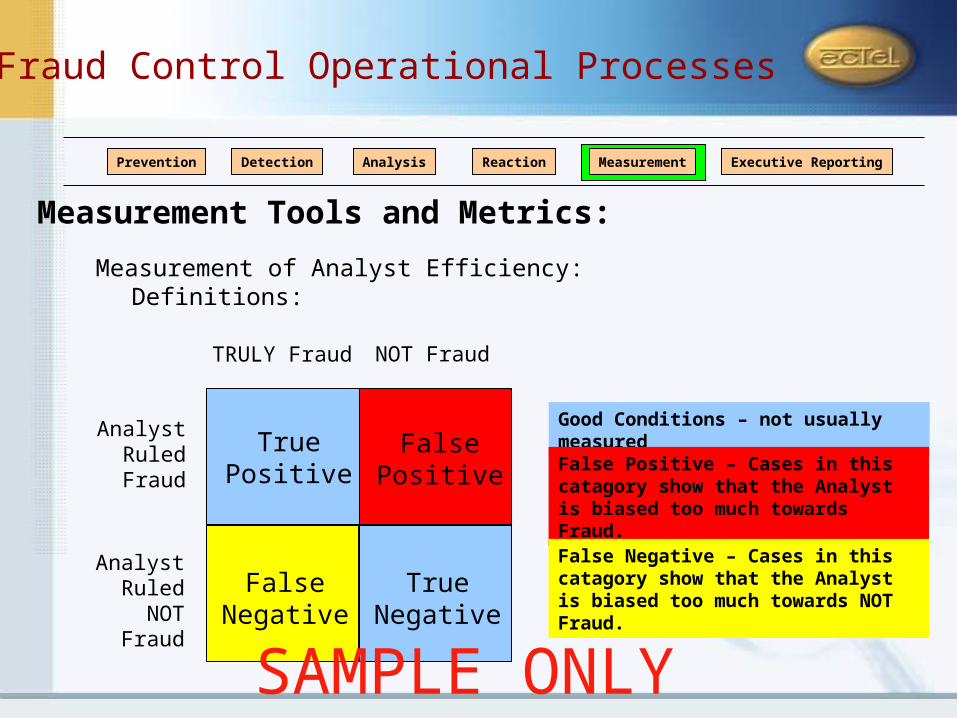
Measurement of Analyst Efficiency:Definitions:
TRULY Fraud NOT Fraud
Analyst Ruled Fraud
Analyst Ruled
NOT Fraud
True Positive
True Negative
False Positive
False Negative
Good Conditions – not usually measuredFalse Positive – Cases in this catagory show that the Analyst is biased too much towards Fraud.
False Negative – Cases in this catagory show that the Analyst is biased too much towards NOT Fraud.
Measurement Tools and Metrics:
Fraud Control Operational Processes
SAMPLE ONLY

Prevention Detection Analysis Reaction Measurement Executive Reporting
Measurement of Analyst Efficiency:Measurments that should be taken:
TRULY Fraud NOT Fraud
True Positive
True Negative
False Positive
False Negative
Analyst False Postive Rate:% of False Positives per week or month. Percentage based on total number of cases analized by Analyst.
Analyst False Negative Rate:% of False Negatives per week or month. Percentage based on total number of cases analized by Analyst.
Analyst Ruled Fraud
Analyst Ruled
NOT Fraud
Measurement Tools and Metrics:
Fraud Control Operational Processes
SAMPLE ONLY
Prevention Detection Analysis Reaction Measurement Executive Reporting
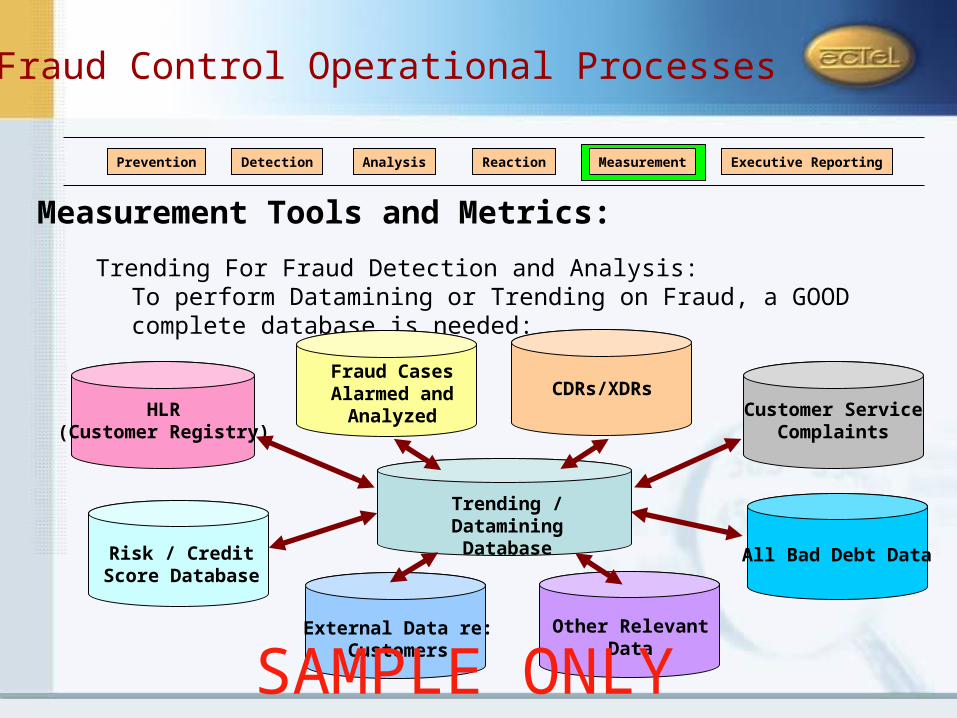
Trending For Fraud Detection and Analysis:To perform Datamining or Trending on Fraud, a GOOD complete database is needed:
HLR(Customer Registry)
Fraud Cases Alarmed and
Analyzed
CDRs/XDRsCustomer Service
Complaints
All Bad Debt DataRisk / Credit Score Database
Other RelevantData
External Data re:Customers
Trending / Datamining Database
Measurement Tools and Metrics:
Fraud Control Operational Processes
SAMPLE ONLY

Prevention Detection Analysis Reaction Measurement Executive Reporting
Executive Reporting:
What do Executives want to see in a Fraud Report?
CEO, CFO, CIO, CSO, Marketing Vice President:• Fraud per Product and Service• Fraud per Vulnerability• Prevention Actions Taken and their Impact on Fraud and Good Revenue• Recommended Prevention Actions and their Expected Costs and ROI• Fraud in Bad Debt• Top Corporate Customers Impacted by Fraud• Top Fraud Schemes Used
CFO Specific:• Fraud Losses and Fraud Losses Prevented• Departmental and FMS Efficiency• Cases Analyzed, Fraud vs Not Fraud Rulings
Fraud Control Operational Processes
SAMPLE ONLY

Starting from Ground Zero:Where does a Telecom Fraud Department Begin?
Fraud Department Priorities:1. First Priority Should be Detection and Analysis of the Fraud2. Second Priority Should be the Reaction to the Fraud3. Third Priority Should be the Measurement and Prevention of the Fraud4. Fourth Priority Should be the Executive Reporting
Note: This does NOT mean any of these priorities are not needed! They are all critical and essential, but when starting at zero with limited resources, it is necessary to give priorities to insure that “the cart does not go in front of the horse”.
Prevention Detection Analysis Reaction Measurement Executive Reporting
Fraud Control Operational Processes
OR
SAMPLE ONLY