frasers and neave, limited -...
TRANSCRIPT

Page | 1 | PHILLIP SECURITIES RESEARCH (SINGAPORE) MCI (P) 118/10/2015 Ref. No.: SG2016_0186
Fraser and Neave Lacking the pop factor SINGAPORE | CONSUMER | UPDATE
In a phase to fill in the gap due to loss of sales from its Beer business and Red Bull Lack of near term catalyst: new markets are still in nascent stage and no concrete
acquisition plan yet Actions taken to improve sales and margins, but will not return to FY2014-level Persistent macro headwinds dampen ASEAN consumer sentiment We expect cautious consumer spending in the region to continue weighing against topline, and growth should remain tepid following the divestment of MBL business. Meanwhile, Fraser and Neave, Limited (FNN) leverages on strategic partnerships to build presence in new markets.
Losing momentum after the sale of Myanmar Brewery Limited (MBL) To recap, its Beer segment accounts for c.38% of FNN’s FY2014 EBIT with c.33% EBIT margin.
(a) Dairies is the only bright spot now. Low commodity prices and favourable product mix buoyed margins. We expect Dairies’ high EBIT margin of 12% to sustain into FY17F. However, due to lack of new geographical markets, there is limited room for Dairies to grow its topline.
(b) Without a strong growth driver, the Group's focus is now on margin enhancement initiatives and strengthening of its distribution network. But overcapacity issues in soft drinks still lingers post Coca-Cola’s departure. On the other hand, with a low single-digit royalty fees, we do not think the cross-production distribution from its partnership with Thai Beverage Public Company Limited (ThaiBev) could contribute much to the bottom line during its brand building phase. On that note, we also think that higher marketing costs will erode their bottom line.
We do not expect growth and margins to return to FY2014 level. But, we noted potential re-rating catalyst, and the question remains as: When and How? Vietnam is on state divestment drive, with two deals on the street: Vinamilk and Saigon Alcohol Beer and Beverages Corporation (SABECO). However, the divestment process has been going very slowly. Vietnam government announced its intention in mid-2015 but has yet to detail plans for the divestment, stating that it will sell its stakes only when it has identified new investments that are more profitable. Market may be celebrating a little too early.
50% dividend payout policy attainable in FY16-17F. Proceeds from MBL-sale provides plenty of capital headroom for the Group to expand. While there is no concrete acquisition plan yet, we expect FNN’s net cash position to strengthen to S$1.05bn and S$1.11bn at end-FY16F and FY17F, respectively, from the current S$0.97bn (as at 30 June 2016).
Investment Risks (a) Adverse foreign exchange movement could erode margins
at least 80% of the cost of raw materials are denominated in USD c.77% of sales are derived from outside out Singapore
(b) Turnaround in prolonged low raw material prices would compress margins
Investment Actions In view of macro headwinds and cautious consumer sentiment, and lack of significant growth catalyst, we reset the FY17F EV/EBITDA multiple to peer average‘s 10.0x (from 12.8x). With the change of analyst, we downgraded our TP to S$1.93 (from S$2.40) and maintain “Reduce” rating.
22 August 2016
Reduce (Maintain)LAST CLOSE PRICE
FORECAST DIV
TARGET PRICE
TOTAL RETURN
COMPANY DATA
O/S SHARES (M N) : 1,446
M ARKET CAP (USD mn / SGD mn) : 2275 / 3065
52 - WK HI/LO (SGD) : 2.31 / 1.9
3M Average Daily T/O (mn) : 0.05
MAJOR SHAREHOLDERS (%)
59.35%
28.53%
PRICE PERFORMANCE (%)
1M T H 3 M T H 1Y R
COM PANY 2.4 6.3 2.3
STI RETURN (1.03) 5.45 (2.81)
PRICE VS. STI
Source: B loomberg, PSR
KEY FINANCIALS
Y / E Sep F Y 14 F Y 15 F Y 16 F F Y 17F
Revenue (SGD mn) 2,093 2,104 1,991 2,005
EBITDA (SGD mn) 330 209 220 223
NPAT (adj.) (SGD mn) 263 115 105 108
EPS adj. (SGD) 0.18 0.08 0.07 0.07
PER, adj. (x) 17.2 26.9 29.7 28.7
P/BV, (x) 2.8 1.4 1.3 1.3
DPS (SGD) 0.05 0.05 0.04 0.04
Div Yield (%) 1.6% 2.3% 1.7% 1.7%
ROE (%) 5.2% 6.0% 4.5% 4.5%
Source: Company Data, PSR est.
Valuation Method
EV/EBITDA Multiple (10x)
Soh Lin Sin (+65 6212 1847)
Investment Analyst
TCC ASSETS LTD
-7.1%
SGD 2.12
SGD 0.04
SGD 1.93
THAI BEVERAGE PCL
1.60
1.80
2.00
2.20
2.40
Aug-15 Nov-15 Feb-16 May-16
FNN SP EQUITY FSSTI index
Page | 2 | PHILLIP SECURITIES RESEARCH (SINGAPORE)
FRASER AND NEAVE UPDATE
A mixed picture in ASEAN
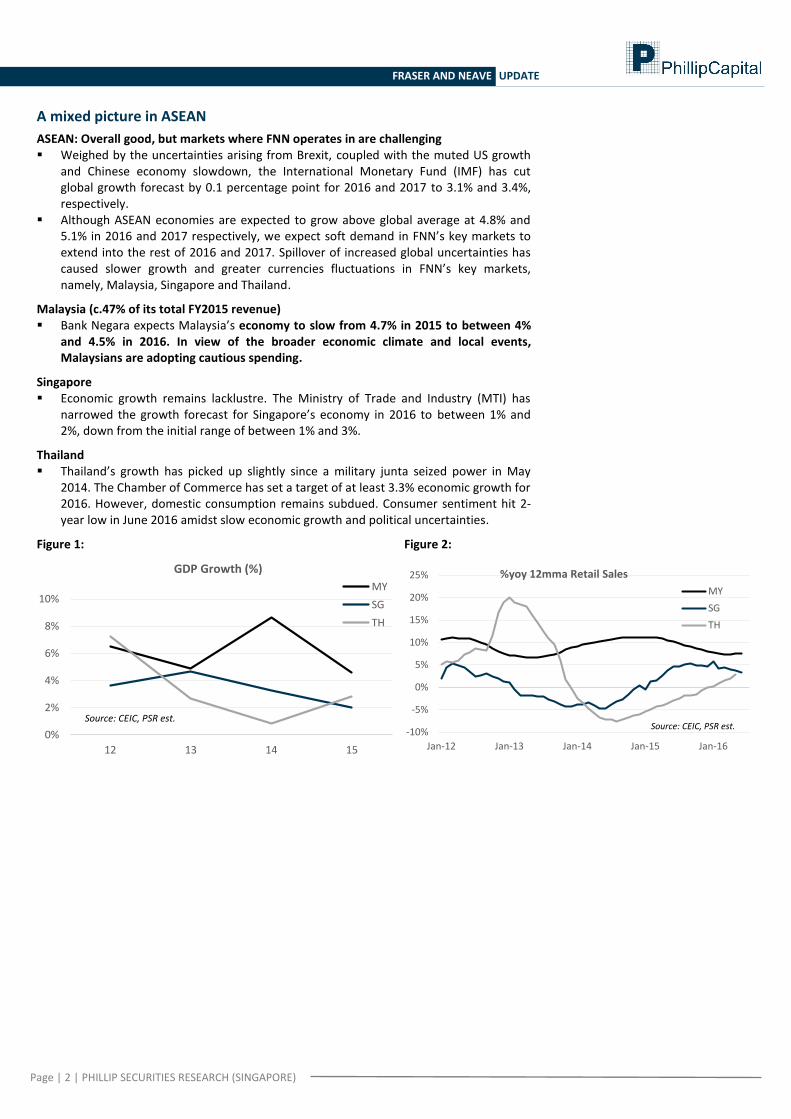
ASEAN: Overall good, but markets where FNN operates in are challenging Weighed by the uncertainties arising from Brexit, coupled with the muted US growth
and Chinese economy slowdown, the International Monetary Fund (IMF) has cut global growth forecast by 0.1 percentage point for 2016 and 2017 to 3.1% and 3.4%, respectively.
Although ASEAN economies are expected to grow above global average at 4.8% and 5.1% in 2016 and 2017 respectively, we expect soft demand in FNN’s key markets to extend into the rest of 2016 and 2017. Spillover of increased global uncertainties has caused slower growth and greater currencies fluctuations in FNN’s key markets, namely, Malaysia, Singapore and Thailand.
Malaysia (c.47% of its total FY2015 revenue) Bank Negara expects Malaysia’s economy to slow from 4.7% in 2015 to between 4%
and 4.5% in 2016. In view of the broader economic climate and local events, Malaysians are adopting cautious spending.
Singapore Economic growth remains lacklustre. The Ministry of Trade and Industry (MTI) has
narrowed the growth forecast for Singapore’s economy in 2016 to between 1% and 2%, down from the initial range of between 1% and 3%.
Thailand Thailand’s growth has picked up slightly since a military junta seized power in May
2014. The Chamber of Commerce has set a target of at least 3.3% economic growth for 2016. However, domestic consumption remains subdued. Consumer sentiment hit 2-year low in June 2016 amidst slow economic growth and political uncertainties.
Figure 1:
0%
2%
4%
6%
8%
10%
12 13 14 15
GDP Growth (%)
MY
SG
TH
Source: CEIC, PSR est.
Figure 2:
-10%
-5%
0%
5%
10%
15%
20%
25%
Jan-12 Jan-13 Jan-14 Jan-15 Jan-16
%yoy 12mma Retail Sales
MY
SG
TH
Source: CEIC, PSR est.
Page | 3 | PHILLIP SECURITIES RESEARCH (SINGAPORE)
FRASER AND NEAVE UPDATE
Business ex-MBL will never be the same
FY2015 was cruel to FNN. Not only was it forced to sell its key growth and margin driver, the Beer business, it also lost its distributorship rights on Red Bull and Milo UHT. To recap, its Beer segment accounts for c.38% of FNN’s FY2014 EBIT with c.33% EBIT margin. Beverages Malaysia segment took a hit from loss of sales from Red Bull. 9MFY2016 revenue fell 5% year-on-year (yoy) in constant currency term and volume increased 7% yoy. Stripping off Red Bull’s contribution, growth in 9MFY2016 topline and volume would have been 14% and 12%, respectively.
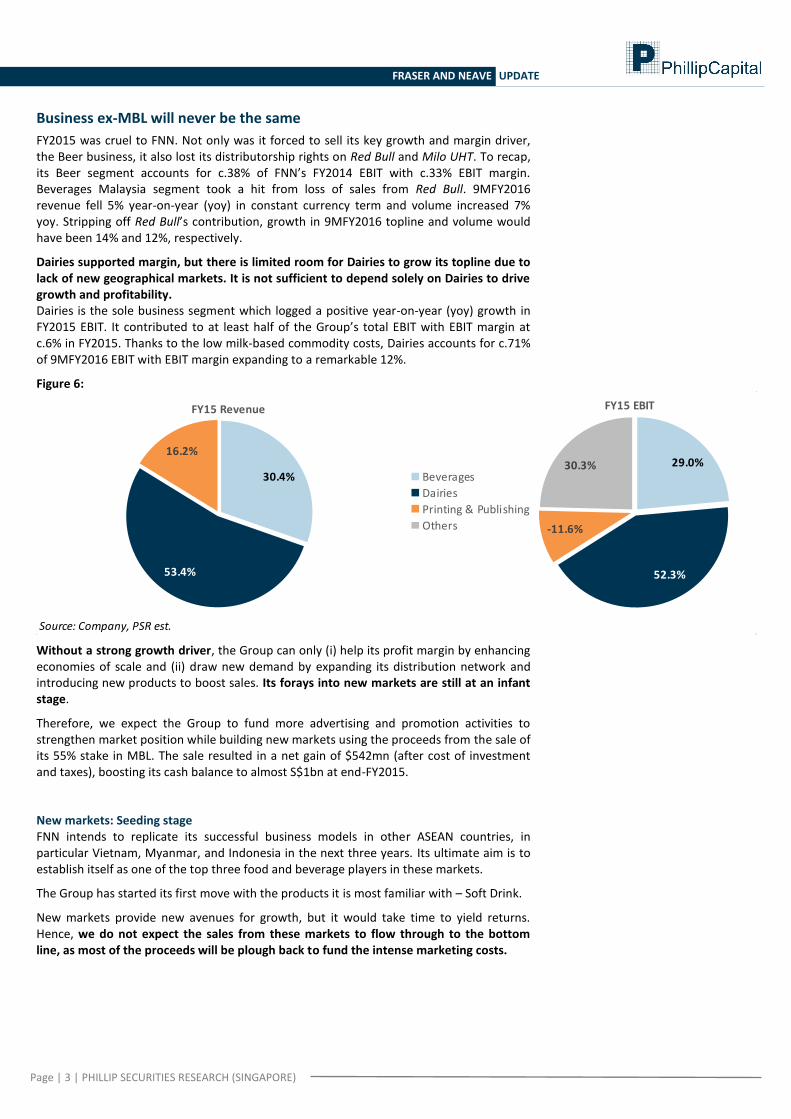
Dairies supported margin, but there is limited room for Dairies to grow its topline due to lack of new geographical markets. It is not sufficient to depend solely on Dairies to drive growth and profitability. Dairies is the sole business segment which logged a positive year-on-year (yoy) growth in FY2015 EBIT. It contributed to at least half of the Group’s total EBIT with EBIT margin at c.6% in FY2015. Thanks to the low milk-based commodity costs, Dairies accounts for c.71% of 9MFY2016 EBIT with EBIT margin expanding to a remarkable 12%.
Figure 6:
Source: Company, PSR est.
30.4%
53.4%
16.2%
FY15 Revenue
29.0%
52.3%
-11.6%
30.3%
FY15 EBIT
Beverages
Dairies
Printing & Publishing
Others
Without a strong growth driver, the Group can only (i) help its profit margin by enhancing economies of scale and (ii) draw new demand by expanding its distribution network and introducing new products to boost sales. Its forays into new markets are still at an infant stage.
Therefore, we expect the Group to fund more advertising and promotion activities to strengthen market position while building new markets using the proceeds from the sale of its 55% stake in MBL. The sale resulted in a net gain of $542mn (after cost of investment and taxes), boosting its cash balance to almost S$1bn at end-FY2015.
New markets: Seeding stage FNN intends to replicate its successful business models in other ASEAN countries, in particular Vietnam, Myanmar, and Indonesia in the next three years. Its ultimate aim is to establish itself as one of the top three food and beverage players in these markets.
The Group has started its first move with the products it is most familiar with – Soft Drink.
New markets provide new avenues for growth, but it would take time to yield returns. Hence, we do not expect the sales from these markets to flow through to the bottom line, as most of the proceeds will be plough back to fund the intense marketing costs.

Page | 4 | PHILLIP SECURITIES RESEARCH (SINGAPORE)
FRASER AND NEAVE UPDATE
New Market Remarks
Vietnam Set up a representative office in Ho Chi Minh City in June 2015 Launched 100Plus in 400 modern trade distribution points in Vietnam, in
particular convenience stores
Myanmar Established a branch office in Yangon in 2014 Introduced 100Plus in 2012 and ranked no. 1 in Isotonic Drinks market share Introduced F&N Seasons Ice Lemon Tea in 2015
M&A, a faster way to tap into new markets, but...
Given its established brand name and huge cash position, we think that acquisitions would be the Group’s preferred and more favourable route compared to organic approach.
In our view, a profitable business with a strong distribution network would be the Group’s potential acquisition target as it could tap into the existing distribution network and accelerate the expansion process in a foreign market.
Speed bump along the way, particularly in Vietnam
The Vietnamese government has been on privatisation drive in recent years. However, the divestment drive has slowed and even been delayed many times, with the government reportedly unwilling to sell its stake for fear of losing interest in such a profitable company.
Two well-known stake sales in the industry – Vinamilk, Vietnam’s largest dairy producer, and Saigon Alcohol Beer and Beverages Corporation (SABECO), the country’s beer and beverage giant.
Some background on these companies:
Vinamilk: Removing the 49% foreign ownership cap. State owns 45%, while FNN holds 11%. The company is valued at US$1.52bn by Forbes with FY2015 PATMI at US$320mn. It has consistently paid huge dividends over the years – dividend payout ratio of at least 50% since 2012 and 91.4% in 2015.
SABECO: Reducing stake from 89.59% to 36%. The company is valued at about US$247mn by Forbes. It controls more than half of Vietnam's beer market with its iconic Saigon brand.
Successful acquisition(s) would add accretive growth prospects to the Group, leading to potential re-rating of the stock. Especially, a stake in SABECO could regain some lost ground due to the absence of high margin brewery arm post MBL-sale.
Having said the above, the State Capital Investment Corporation (SCIC), Vietnam’s sovereign fund, only announced plans to sell its holdings but has no set official time frame on when and how the divestment process would be. The SCIC recently stated that it will sell its stakes only when it has identified new investments that are more profitable.
In addition, we expect that the firms’ shares will receive strong interest from foreign investors, pushing up prices. We remain cognizant of the possibility where FNN may overpay for the deals, diminishing the attractiveness of the deal.

Page | 5 | PHILLIP SECURITIES RESEARCH (SINGAPORE)
FRASER AND NEAVE UPDATE
Do not expect significant contributions from recent developments
Scaling up Dairies; but overcapacity in Soft Drinks We view the recent c.S$70mn CAPEX in Malaysia positively, as the new UHT lines would increase capacity for Dairies which is currently operating at full capacity. Meanwhile, the new packaging lines and additional storage capacity could generate cost efficiencies and improve margins.
On the other hand, we are less excited on the new soft drinks plant in Sabah, as the Group still has excess capacity for soft drinks production after Coca-Cola’s departure.
Additional Capacities in Malaysia Target to be
operational by Capital expenditure
committed
New UHT lines (Kuching) Produces 3.4mn cases per year
end-2016 c.S$70mn (RM210mn)
New aseptic cold-filling PET bottle line, housed within the new integrated four-storey warehouse (Selangor) Offers new formulations and packaging formats
and four-fold increase in storage capacity Produces 6.5mn cases per year Reduces PET resin packaging material by 40%
2017
New soft drinks plant (Sabah) Doubling capacity of its current plant in Kota
Kinabalu (2015 capacity at c.4mn cases per annum)
2021 c.S$30mn (RM100mn)
Expanding distribution network, but… Singapore’s contribution to bottom line is minimal (c.23% and c.-6% to its revenue and
EBIT in FY2015, respectively) Royalty fee from ThaiBev is a low single-digit on net sale revenue Weaker currencies eroded overall growth in Malaysia
Additional distribution network Remarks
Acquisition of Warburg Moves FNN from no. 3 to a strong no. 2 player, in terms of vending space in Singapore, following Coca-Cola. The Group’s total number of active vending machines is set to increase almost threefold.
Acquisition cost of c. S$29mn was funded internally and fully in cash.
Ramping up partnership with ThaiBev with cross-product distribution
100Plus, F&N Seasons and F&N Nutrisoy were launched in Thailand last year. In less than a year of its launch, 100Plus has captured 11% market share of the isotonic segment in Thailand.
Oishi green tea was launched in Singapore in March 2015, following Malaysia’s launch in 2013. Coco Life was launched in Singapore and Malaysia in 2015. It was well received particularly in
Malaysia, where it successfully captured 12% market share of the coconut juice category within a month. Partnering airline AirAsia in December 2015 provides access to inflight demand.
Filling in the gap, but yet to see results i. Ranger and EST Cola were introduced in Malaysia since June 2015 to replace its loss of
sales from energy drink (Red Bull) and cola segment (Coca-Cola), respectively
ii. CHANG beer has been distributed in Singapore since October 2015 to replace its loss of sales from beer
Page | 6 | PHILLIP SECURITIES RESEARCH (SINGAPORE)
FRASER AND NEAVE UPDATE
Assumptions and forecasts
We have adjusted our assumptions to reflect post MBL-sale, namely (i) changes in product mix, (ii) potential demand and capacity growth arising from new facilities and new markets; as well as (iii) margin improvements on the back of weaknesses in commodity prices and economies of scale.
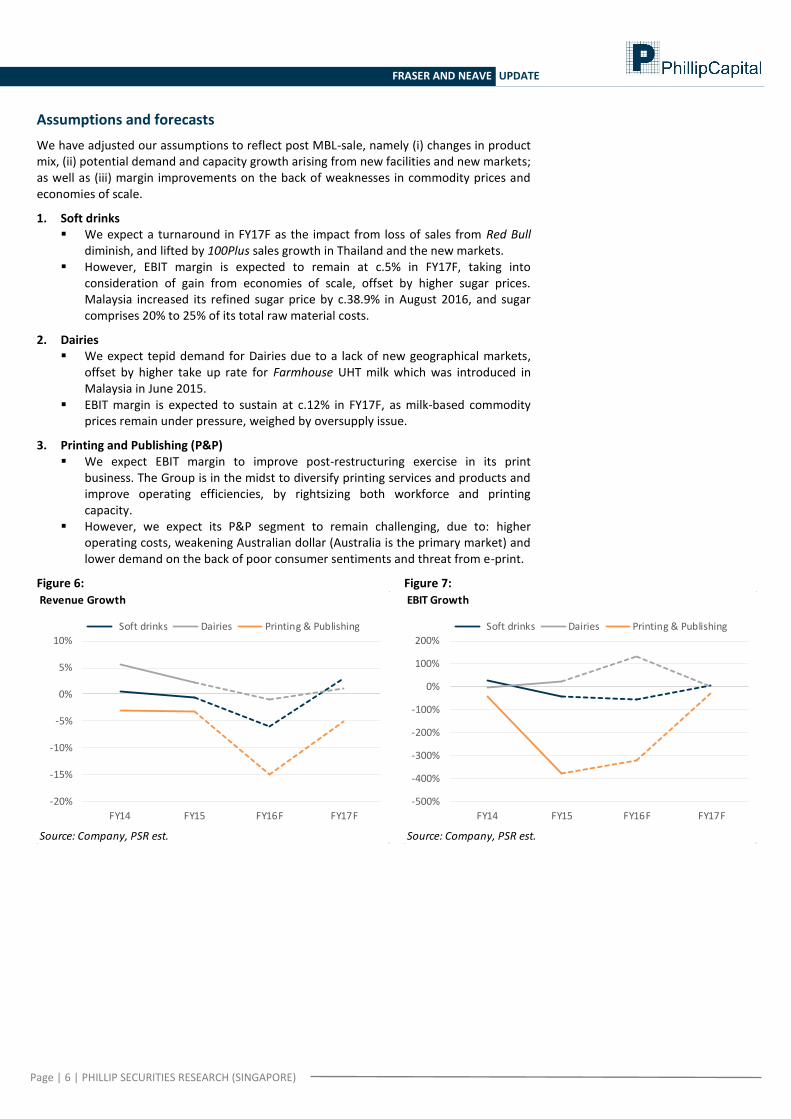
1. Soft drinks We expect a turnaround in FY17F as the impact from loss of sales from Red Bull
diminish, and lifted by 100Plus sales growth in Thailand and the new markets. However, EBIT margin is expected to remain at c.5% in FY17F, taking into
consideration of gain from economies of scale, offset by higher sugar prices. Malaysia increased its refined sugar price by c.38.9% in August 2016, and sugar comprises 20% to 25% of its total raw material costs.
2. Dairies We expect tepid demand for Dairies due to a lack of new geographical markets,
offset by higher take up rate for Farmhouse UHT milk which was introduced in Malaysia in June 2015.
EBIT margin is expected to sustain at c.12% in FY17F, as milk-based commodity prices remain under pressure, weighed by oversupply issue.
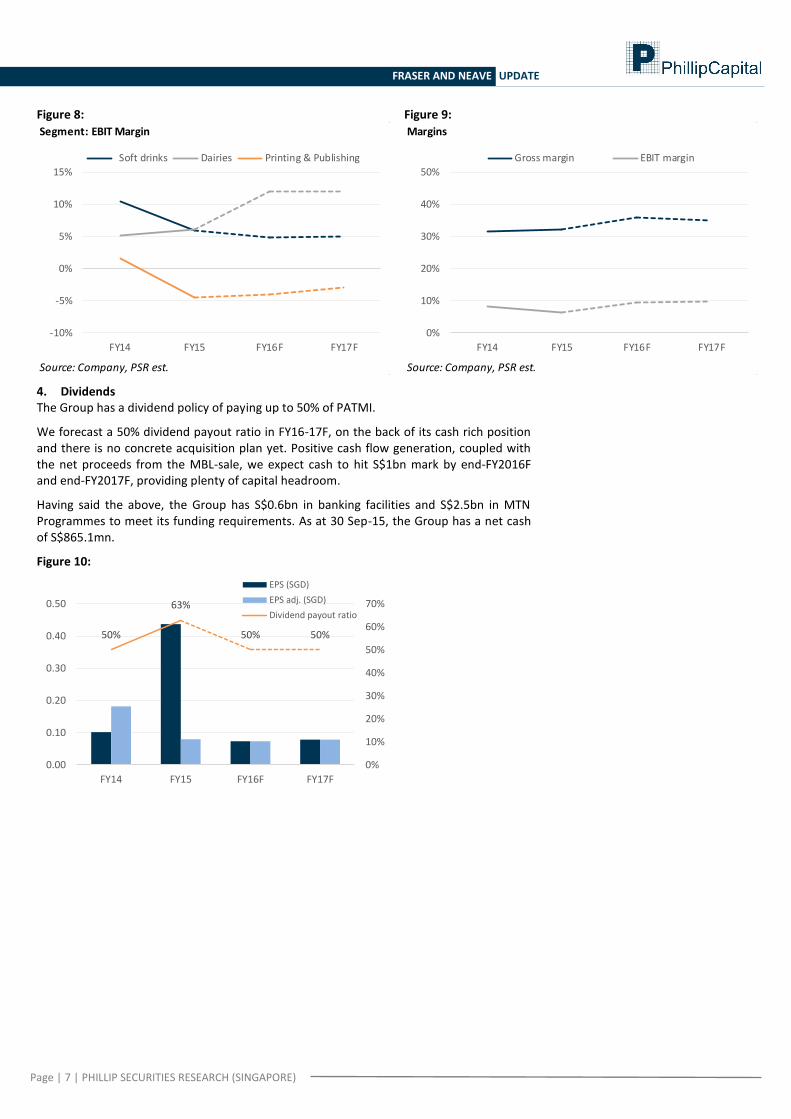
3. Printing and Publishing (P&P) We expect EBIT margin to improve post-restructuring exercise in its print
business. The Group is in the midst to diversify printing services and products and improve operating efficiencies, by rightsizing both workforce and printing capacity.
However, we expect its P&P segment to remain challenging, due to: higher operating costs, weakening Australian dollar (Australia is the primary market) and lower demand on the back of poor consumer sentiments and threat from e-print.
Figure 6: Revenue Growth
Source: Company, PSR est.
-20%
-15%
-10%
-5%
0%
5%
10%
FY14 FY15 FY16F FY17F
Soft drinks Dairies Printing & Publishing
Figure 7: EBIT Growth
Source: Company, PSR est.
-500%
-400%
-300%
-200%
-100%
0%
100%
200%
FY14 FY15 FY16F FY17F
Soft drinks Dairies Printing & Publishing
Page | 7 | PHILLIP SECURITIES RESEARCH (SINGAPORE)
FRASER AND NEAVE UPDATE
Figure 8:
Segment: EBIT Margin
Source: Company, PSR est.
-10%
-5%
0%
5%
10%
15%
FY14 FY15 FY16F FY17F
Soft drinks Dairies Printing & Publishing
Figure 9:
Margins
Source: Company, PSR est.
0%
10%
20%
30%
40%
50%
FY14 FY15 FY16F FY17F
Gross margin EBIT margin
4. Dividends The Group has a dividend policy of paying up to 50% of PATMI.
We forecast a 50% dividend payout ratio in FY16-17F, on the back of its cash rich position and there is no concrete acquisition plan yet. Positive cash flow generation, coupled with the net proceeds from the MBL-sale, we expect cash to hit S$1bn mark by end-FY2016F and end-FY2017F, providing plenty of capital headroom.
Having said the above, the Group has S$0.6bn in banking facilities and S$2.5bn in MTN Programmes to meet its funding requirements. As at 30 Sep-15, the Group has a net cash of S$865.1mn.
Figure 10:
50%
63%
50% 50%
0%
10%
20%
30%
40%
50%
60%
70%
0.00
0.10
0.20
0.30
0.40
0.50
FY14 FY15 FY16F FY17F
EPS (SGD)
EPS adj. (SGD)
Dividend payout ratio

Page | 8 | PHILLIP SECURITIES RESEARCH (SINGAPORE)
FRASER AND NEAVE UPDATE
Valuation
In view of macro headwinds and cautious consumer sentiment, and lack of significant growth catalyst, we reset the FY17F EV/EBITDA multiple to peer average‘s 10.0x (from 12.8x).
With the change of analyst, we downgraded our TP to S$1.93 (from S$2.40), based on estimated S$223mn FY17 EBITDA and maintained “Reduce” rating.
Peer Comparison
FNN currently trades at 29.7x FY16F PER, which is c.62% premium to its ASEAN peers’ 18.3x. We think that the premium valuation is not justifiable given the slower growth post MBL-sale.
It also has lower return-on-equity (ROE), as compared to its ASEAN peers.
These support our thesis of ‘Reduce’ rating.
Figure 11:
Company
Mkt Cap
(SGD mn)
EV
(SGD mn)
EV/EBITDA
TTM
EV/EBITDA
FY1
EV/EBITDA
FY2 P/E
P/E
FY1
P/E
FY2
Net D/E
(%) ROA (%) ROE (%) P/B
Fraser and Neave Ltd 3,065 2,535 78.1 11.5 11.4 26.9 29.7 28.7 Net Cash 4.0 6.0 1.4
ASEAN
Fraser & Neave Hldgs Bhd 3,010 2,992 17.3 15.0 14.0 22.9 21.2 19.4 Net Cash 12.7 21.3 4.7
Alliance Global Group Inc 4,781 9,173 9.0 8.8 8.4 11.9 11.2 11.1 47.3 3.2 9.9 1.1
Pepsi-Cola Products Philippines Inc 375 488 5.4 5.0 4.5 16.0 14.0 12.1 -5.8 3.8 9.2 1.5
Super Group Ltd 852 746 9.9 8.4 8.0 19.1 18.2 16.6 Net Cash 7.0 8.8 1.7
Ultrajaya Milk Ind & Trading 1,402 1,296 12.0 12.9 11.0 23.0 21.7 18.1 Net Cash 17.0 21.4 4.5
Vietnam Dairy Products JSC 12,524 11,935 14.1 16.4 15.1 25.4 23.8 21.3 Net Cash 31.6 37.1 9.1
Yeo Hiap Seng Ltd 737 648 17.0 N/A N/A 19.7 N/A N/A Net Cash 5.2 6.1 1.2
Simple Average (Excl. FNN) 12.1 11.1 10.2 19.7 18.3 16.5 20.8 11.5 16.3 3.4
Source: Bloomberg, Phillip Securities Research (Singapore) Estimates

Page | 9 | PHILLIP SECURITIES RESEARCH (SINGAPORE)
FRASER AND NEAVE UPDATE
Investment Risks
1. Adverse foreign exchange movement Stronger USD against SGD (at least 80% of the cost of raw materials are
denominated in USD) Stronger SGD against MYR and THB (c.77% of sales are derived from outside of
Singapore)
2. Turnaround in prolonged low raw material prices would compress margins
Figure 12-14: FX rate trend
0.55
0.60
0.65
0.70
0.75
0.80
0.85
FX: USD per SGD
Source: Bloomberg, PSR est.
Stronger SGD
Weaker SGD
2.00
2.20
2.40
2.60
2.80
3.00
3.20
FX: MYR per SGD
Source: Bloomberg, PSR est.
Stronger SGD
Weaker SGD
22.00
22.50
23.00
23.50
24.00
24.50
25.00
25.50
26.00
26.50
FX: THB per SGD
Source: Bloomberg, PSR est.
Stronger SGD
Weaker SGD

Page | 10 | PHILLIP SECURITIES RESEARCH (SINGAPORE)
FRASER AND NEAVE UPDATE
Financials
Income Statement Balance Sheet
Y/E Sep, SGD mn FY14 FY15 FY16F FY17F FY18F Y/E Sep, SGD mn FY14 FY15 FY16F FY17F FY18F
Revenue 2,093 2,104 1,991 2,005 2,039 ASSETS
Gross profi t 659 679 717 702 714 PPE 661 464 475 485 495
EBITDA 330 209 220 223 226 Intangibles 124 106 92 80 69
Depreciation & Amortisation (85) (92) (63) (62) (62) Investments in Assoc/JV 50 42 45 47 50
EBIT 170 132 187 194 200 Others 845 965 1,045 1,125 1,207
Net Finance Inc/(Exp) 9 0 9 9 10 Total non-current assets 1,680 1,577 1,657 1,738 1,822
Associates & JVs 2 3 3 3 3 Accounts receivables 360 332 355 357 363
Other i tems (78) 12 28 30 33 Cash 355 962 1,048 1,112 1,172
Profit Before Tax 178 132 197 202 210 Inventories 274 254 244 250 254
Taxation (27) (19) (33) (34) (36) Others 6 17 17 17 17
Profit After Tax (Con. Ops) 152 112 163 168 174 Total current assets 995 1,565 1,664 1,737 1,807
Profit After Tax (Discon. Ops) 205 637 - - - Total Assets 2,675 3,143 3,321 3,474 3,629
- Non-control l ing interest (109) (87) (59) (60) (61)
Net profit, reported 147 633 105 108 113 LIABILITIES
Net profit, adj. 263 115 105 108 113 Accounts payables 394 384 393 399 406
Short term loans 23 3 12 12 12
Others 47 50 50 50 50
Total current liabilities 494 446 446 455 462
Long term loans 119 98 129 129 129
Others 61 42 42 42 42
Per share data (SGD) Total non-current liabilities 180 140 171 171 171
Y/E Sep FY14 FY15 FY16F FY17F FY18F Total Liabilities 674 587 618 626 633
EPS, reported 0.10 0.44 0.07 0.07 0.08
EPS, adj. 0.18 0.08 0.07 0.07 0.08 EQUITY
DPS 0.05 0.05 0.04 0.04 0.04 Non-control l ing interests 396 288 347 406 467
BVPS 1.11 1.57 1.63 1.69 1.75 Shareholder Equity 1,605 2,268 2,357 2,442 2,529
Cash Flow Valuation Ratios
Y/E Sep, SGD mn FY14 FY15 FY16F FY17F FY18F Y/E Sep FY14 FY15 FY16F FY17F FY18F
CFO P/E (X), adj. 17.2 26.9 29.7 28.7 27.4
EBIT 170 132 187 194 200 P/B (X) 2.8 1.4 1.3 1.3 1.2
Depreciation & Amortisation 85 92 63 62 62 EV/EBITDA (X), adj. 14.3 12.1 11.4 11.2 11.0
WC changes (193) (18) (23) 1 (4) Dividend Yield (%) 1.6% 2.3% 1.7% 1.7% 1.8%
Tax paid (50) (34) (33) (34) (36) Growth & Margins (%)
Others 188 54 (30) (33) (35) Growth
Cashflow from ops 199 225 164 189 187 Revenue -8.8% 0.5% -5.4% 0.7% 1.7%
CFI EBITDA -28.0% -36.6% 5.2% 1.4% 1.6%
CAPEX, net (1,039) (68) (60) (60) (61) EBIT -20.7% -22.4% 42.4% 3.3% 3.4%
Others (536) 600 16 18 21 Net profi t, adj. -51.7% -56.1% -9.2% 3.4% 4.5%
Cashflow from investments (1,575) 532 (44) (42) (40) Margins
CFF Gross margin 31.5% 32.3% 36.0% 35.0% 35.0%
Share i ssuance, net 7 3 - - - EBITDA margin 15.7% 9.9% 11.0% 11.1% 11.1%
Loans , net of repayments 648 (17) 41 - - EBIT margin 8.1% 6.3% 9.4% 9.7% 9.8%
Dividends (257) (102) (74) (83) (86) Net profi t margin 12.6% 5.5% 5.3% 5.4% 5.6%
Others (607) (10) - - - Key Ratios
Cashflow from financing (209) (126) (33) (83) (86) ROE (%) 5.2% 6.0% 4.5% 4.5% 4.6%
Net change in cash (1,585) 632 87 64 61 ROA (%) 3.1% 4.0% 3.2% 3.2% 3.2%
Effects of exchange rates (3) (25) - - -
Asset reclass i fication - (0) - - - Net Debt/(Cash) (213) (861) (907) (971) (1,031)
CCE, end 355 962 1,048 1,112 1,172 Net Gearing (X) Net Cash Net Cash Net Cash Net Cash Net Cash
Source: Company, Phi l l ip Securi ties Research (Singapore) Estimates
*Forward multiples & yields based on current market price; his torica l multiples & yields based on his torica l market price.

Page | 11 | PHILLIP SECURITIES RESEARCH (SINGAPORE)
FRASER AND NEAVE UPDATE
Total Returns Recommendation Rating> +20% Buy 1+5% to +20% Accumulate 2-5% to +5% Neutra l 3-5% to -20% Reduce 4<-20% Sel l 5
We do not base our recommendations entirely on the above quanti tative
return bands . We cons ider qual i tative factors l ike (but not l imited to) a s tock's
ri sk reward profi le, market sentiment, recent rate of share price appreciation,
presence or absence of s tock price catalysts , and speculative undertones
surrounding the s tock, before making our fina l recommendation
Ratings History
PSR Rating System
Remarks
1 2 3 4 5
1.50
2.00
2.50
3.00
3.50
Jan-15
Ap
r-15
Jul-15
Oct-1
5
Jan-16
Ap
r-16
Jul-16
Oct-16
Source: Bloomberg, PSR
Market Price
Target Price

Page | 12 | PHILLIP SECURITIES RESEARCH (SINGAPORE)
FRASER AND NEAVE UPDATE
Contact Information (Singapore Research Team) Research Operations Officer Mohamed Amiruddin - [email protected]
Consumer | Healthcare Property | Infrastructure Macro Soh Lin Sin - [email protected] Peter Ng - [email protected] Pei Sai Teng - [email protected] Transport | REITs (Industrial) REITs (Commercial, Retail, Healthcare) | Property Technical Analysis
Richard Leow, CFTe, FRM - [email protected]
Dehong Tan - [email protected] Jeremy Ng - [email protected]
Banking and Finance US Equity Oil & Gas | Energy Jeremy Teong - [email protected] Ho Kang Wei - [email protected] Chen Guangzhi - [email protected]
Contact Information (Regional Member Companies) SINGAPORE
Phillip Securities Pte Ltd Raffles City Tower
250, North Bridge Road #06-00 Singapore 179101 Tel +65 6533 6001 Fax +65 6535 6631
Website: www.poems.com.sg
MALAYSIA Phillip Capital Management Sdn Bhd
B-3-6 Block B Level 3 Megan Avenue II, No. 12, Jalan Yap Kwan Seng, 50450
Kuala Lumpur Tel +603 2162 8841 Fax +603 2166 5099
Website: www.poems.com.my
HONG KONG Phillip Securities (HK) Ltd
11/F United Centre 95 Queensway Hong Kong
Tel +852 2277 6600 Fax +852 2868 5307
Websites: www.phillip.com.hk
JAPAN
Phillip Securities Japan, Ltd. 4-2 Nihonbashi Kabuto-cho Chuo-ku,
Tokyo 103-0026 Tel +81-3 3666 2101 Fax +81-3 3666 6090
Website: www.phillip.co.jp
INDONESIA PT Phillip Securities Indonesia
ANZ Tower Level 23B, Jl Jend Sudirman Kav 33A Jakarta 10220 – Indonesia
Tel +62-21 5790 0800 Fax +62-21 5790 0809
Website: www.phillip.co.id
CHINA Phillip Financial Advisory (Shanghai) Co Ltd
No 550 Yan An East Road, Ocean Tower Unit 2318,
Postal code 200001 Tel +86-21 5169 9200 Fax +86-21 6351 2940
Website: www.phillip.com.cn
THAILAND Phillip Securities (Thailand) Public Co. Ltd
15th Floor, Vorawat Building, 849 Silom Road, Silom, Bangrak,
Bangkok 10500 Thailand Tel +66-2 6351700 / 22680999
Fax +66-2 22680921 Website www.phillip.co.th
FRANCE King & Shaxson Capital Limited
3rd Floor, 35 Rue de la Bienfaisance 75008 Paris France
Tel +33-1 45633100 Fax +33-1 45636017
Website: www.kingandshaxson.com
UNITED KINGDOM King & Shaxson Capital Limited
6th Floor, Candlewick House, 120 Cannon Street, London, EC4N 6AS
Tel +44-20 7426 5950 Fax +44-20 7626 1757
Website: www.kingandshaxson.com
UNITED STATES Phillip Futures Inc
141 W Jackson Blvd Ste 3050 The Chicago Board of Trade Building
Chicago, IL 60604 USA Tel +1-312 356 9000 Fax +1-312 356 9005
Website: www.phillipusa.com
AUSTRALIA Phillip Capital Limited
Level 12, 15 William Street, Melbourne, Victoria 3000, Australia
Tel +61-03 9629 8288 Fax +61-03 9629 8882
Website: www.phillipcapital.com.au
SRI LANKA Asha Phillip Securities Limited 2nd Floor, Lakshmans Building,
No. 321, Galle Road, Colombo 03, Sri Lanka Tel: (94) 11 2429 100 Fax: (94) 11 2429 199
Website: www.ashaphillip.net
INDIA PhillipCapital (India) Private Limited
No.1, 18th Floor, Urmi Estate 95, Ganpatrao Kadam Marg
Lower Parel West, Mumbai 400-013 Maharashtra, India
Tel: +91-22-2300 2999 / Fax: +91-22-2300 2969 Website: www.phillipcapital.in
TURKEY PhillipCapital Menkul Degerler
Dr. Cemil Bengü Cad. Hak Is Merkezi No. 2 Kat. 6A Caglayan 34403 Istanbul, Turkey
Tel: 0212 296 84 84 Fax: 0212 233 69 29
Website: www.phillipcapital.com.tr
DUBAI Phillip Futures DMCC
Member of the Dubai Gold and Commodities Exchange (DGCX)
Unit No 601, Plot No 58, White Crown Bldg, Sheikh Zayed Road, P.O.Box 212291
Dubai-UAE Tel: +971-4-3325052 / Fax: + 971-4-3328895
CAMBODIA
Phillip Bank Plc Ground Floor of B-Office Centre,#61-64, Norodom Blvd Corner Street 306,Sangkat Boeung Keng Kang 1, Khan Chamkamorn,
Phnom Penh, Cambodia Tel: 855 (0) 7796 6151/855 (0) 1620 0769
Website: www.phillipbank.com.kh

Page | 13 | PHILLIP SECURITIES RESEARCH (SINGAPORE)
FRASER AND NEAVE UPDATE
Important Information
This report is prepared and/or distributed by Phillip Securities Research Pte Ltd ("Phillip Securities Research"), which is a holder of a financial adviser’s license under the Financial Advisers Act, Chapter 110 in Singapore.
By receiving or reading this report, you agree to be bound by the terms and limitations set out below. Any failure to comply with these terms and limitations may constitute a violation of law. This report has been provided to you for personal use only and shall not be reproduced, distributed or published by you in whole or in part, for any purpose. If you have received this report by mistake, please delete or destroy it, and notify the sender immediately.
The information and any analysis, forecasts, projections, expectations and opinions (collectively, the “Research”) contained in this report has been obtained from public sources which Phillip Securities Research believes to be reliable. However, Phillip Securities Research does not make any representation or warranty, express or implied that such information or Research is accurate, complete or appropriate or should be relied upon as such. Any such information or Research contained in this report is subject to change, and Phillip Securities Research shall not have any responsibility to maintain or update the information or Research made available or to supply any corrections, updates or releases in connection therewith.
Any opinions, forecasts, assumptions, estimates, valuations and prices contained in this report are as of the date indicated and are subject to change at any time without prior notice. Past performance of any product referred to in this report is not indicative of future results.
This report does not constitute, and should not be used as a substitute for, tax, legal or investment advice. This report should not be relied upon exclusively or as authoritative, without further being subject to the recipient’s own independent verification and exercise of judgment. The fact that this report has been made available constitutes neither a recommendation to enter into a particular transaction, nor a representation that any product described in this report is suitable or appropriate for the recipient. Recipients should be aware that many of the products, which may be described in this report involve significant risks and may not be suitable for all investors, and that any decision to enter into transactions involving such products should not be made, unless all such risks are understood and an independent determination has been made that such transactions would be appropriate. Any discussion of the risks contained herein with respect to any product should not be considered to be a disclosure of all risks or a complete discussion of such risks.
Nothing in this report shall be construed to be an offer or solicitation for the purchase or sale of any product. Any decision to purchase any product mentioned in this report should take into account existing public information, including any registered prospectus in respect of such product.
Phillip Securities Research, or persons associated with or connected to Phillip Securities Research, including but not limited to its officers, directors, employees or persons involved in the issuance of this report, may provide an array of financial services to a large number of corporations in Singapore and worldwide, including but not limited to commercial / investment banking activities (including sponsorship, financial advisory or underwriting activities), brokerage or securities trading activities. Phillip Securities Research, or persons associated with or connected to Phillip Securities Research, including but not limited to its officers, directors, employees or persons involved in the issuance of this report, may have participated in or invested in transactions with the issuer(s) of the securities mentioned in this report, and may have performed services for or solicited business from such issuers. Additionally, Phillip Securities Research, or persons associated with or connected to Phillip Securities Research, including but not limited to its officers, directors, employees or persons involved in the issuance of this report, may have provided advice or investment services to such companies and investments or related investments, as may be mentioned in this report.
Phillip Securities Research or persons associated with or connected to Phillip Securities Research, including but not limited to its officers, directors, employees or persons involved in the issuance of this report may, from time to time maintain a long or short position in securities referred to herein, or in related futures or options, purchase or sell, make a market in, or engage in any other transaction involving such securities, and earn brokerage or other compensation in respect of the foregoing. Investments will be denominated in various currencies including US dollars and Euro and thus will be subject to any fluctuation in exchange rates between US dollars and Euro or foreign currencies and the currency of your own jurisdiction. Such fluctuations may have an adverse effect on the value, price or income return of the investment.
To the extent permitted by law, Phillip Securities Research, or persons associated with or connected to Phillip Securities Research, including but not limited to its officers, directors, employees or persons involved in the issuance of this report, may at any time engage in any of the above activities as set out above or otherwise hold an interest, whether material or not, in respect of companies and investments or related investments, which may be mentioned in this report. Accordingly, information may be available to Phillip Securities Research, or persons associated with or connected to Phillip Securities Research, including but not limited to its officers, directors, employees or persons involved in the issuance of this report, which is not reflected in this report, and Phillip Securities Research, or persons associated with or connected to Phillip Securities Research, including but not limited to its officers, directors, employees or persons involved in the issuance of this report, may, to the extent permitted by law, have acted upon or used the information prior to or immediately following its publication. Phillip Securities Research, or persons associated with or connected to Phillip Securities Research, including but not limited its officers, directors, employees or persons involved in the issuance of this report, may have issued other material that is inconsistent with, or reach different conclusions from, the contents of this report.
The information, tools and material presented herein are not directed, intended for distribution to or use by, any person or entity in any jurisdiction or country where such distribution, publication, availability or use would be contrary to the applicable law or regulation or which would subject Phillip Securities Research to any registration or licensing or other requirement, or penalty for contravention of such requirements within such jurisdiction.
This report is intended for general circulation only and does not take into account the specific investment objectives, financial situation or particular needs of any particular person. The products mentioned in this report may not be suitable for all investors and a person receiving or reading this report should seek advice from a professional and financial adviser regarding the legal, business, financial, tax and other aspects including the suitability of such products, taking into account the specific investment objectives, financial situation or particular needs of that person, before making a commitment to invest in any of such products.
This report is not intended for distribution, publication to or use by any person in any jurisdiction outside of Singapore or any other jurisdiction as Phillip Securities Research may determine in its absolute discretion. IMPORTANT DISCLOSURES FOR INCLUDED RESEARCH ANALYSES OR REPORTS OF FOREIGN RESEARCH HOUSES Where the report contains research analyses or reports from a foreign research house, please note:
(i) recipients of the analyses or reports are to contact Phillip Securities Research (and not the relevant foreign research house) in Singapore at 250 North Bridge Road, #06-00 Raffles City Tower, Singapore 179101, telephone number +65 6533 6001, in respect of any matters arising from, or in connection with, the analyses or reports; and
(ii) to the extent that the analyses or reports are delivered to and intended to be received by any person in Singapore who is not an accredited investor, expert investor or institutional investor, Phillip Securities Research accepts legal responsibility for the contents of the analyses or reports.