fraser forum september/october 2013
DESCRIPTION
Fraser Forum is our bi-monthly magazine of critical thought offering analysis and perspectives from many researchers across the Fraser Institute on a wide range of issues.TRANSCRIPT

Canadian health care: Taxes, long waits, and lagging innovation
A Fraser Institute review of public policy in Canada
Fraser Forum September/October 2013$3.95
Cana
dian
Pub
licat
ion
Mai
l Sal
es P
rodu
ct A
gree
men
t Num
ber 4
0069
269.
ALSO IN THIS ISSUE:
Stronger intellectual property for pharmaceuticals would benefit Canadians
Taxing “unhealthy” foods won’t reduce obesity Waiting for health care is not a necessary evil

Tuesday, November 12th, 2013 Reception & dinner 5:30 - 9:30 p.m.
BMO Centre, Palomino Room 1410 Olympic Way SE, Calgary, AB
Contact: Rhogene Dadashzadeh 604.688.0221 ext. 511rhogene.dadashzadeh @fraserinstitute.org
Fraser Institute1770 Burrard Street, Vancouver, BC V6J 3G7
SILVER SPONSORS:
Thank you to our GOLD SPONSORS:
Special thanks to the Donner Canadian Foundation
COPPER SPONSORS: MEDIA PARTNER:
NANCY SOUTHERN
A tribute dinner honouring one of Canada’s most extraordinary business and civic leaders
Chair, President and CEO of ATCO Ltd. and Canadian Utilities Ltd. Overseeing a worldwide corporation of diverse companies, Ms. Southern’s visionary leadership, business acumen, and community engagement have earned her the admiration and accolades of the people of Alberta and Canada.
www.fraserinstitute.org Fraser Forum September/October 2013 1
Fraser Forum
The Fraser Institute’s vision is a free and prosperous world where individuals benefit from greater choice, competitive markets, and personal responsibility. Our mission is to measure, study, and communicate the im-pact of competitive markets and government interventions on the welfare of individuals. Founded in 1974, we are an independent Canadian research and educational organization. Our work is financed by tax-deductible con-tributions from thousands of individuals, organizations, and foundations. In order to protect its independence, the Institute does not accept grants from government or contracts for research.
For additional copies, or to become a supporter and receive Fraser Forum, write or call the Fraser Institute, 4th Floor, 1770 Burrard Street, Vancouver, BC V6J 3G7 Telephone: (604) 688-0221 or toll-free:1-800-665-3558 (ext.580–book orders; ext. 586–development)Fax: (604) 688-8539
Copyright © 2013 Fraser Institute ISSN 0827-7893 (print version) ISSN 1480-3690 (online version) Printed and bound in Canada.
Return undeliverable Canadian addresses to:Fraser Institute, 4th Floor, 1770 Burrard St., Vancouver, BC V6J 3G7
The contributors to this publication have worked independently and opinions expressed by them are, therefore, their own and do not necessarily reflect the opinions of the supporters, trustees, or other staff of the Fraser Institute. This publication in no way implies that the Fraser Institute, its trustees, or staff are in favour of, or oppose the passage of, any bill; or that they support or oppose any particular political party or candidate.
Fraser Institute Board of Trustees Peter Brown (Chairman), Brad Bennett (Vice Chairman), Mark W. Mitchell (Vice Chairman), Salem Ben Nasser Al Ismaily, Gordon Arnell, Kathy Assayag, Joni Avram, Ryan Beedie, Ed Belzberg, Joseph Canavan, Alex Chafuen, Derwood Chase, Jr., Tracie Crook, James Davidson, W. Robert Farquharson, David Filmon, Greg Fleck, Shaun Francis, Ned Goodman, John Hagg, Claudia Hepburn, Paul Hill, Stephen Hynes, Charles Jeannes, C. Kent Jespersen, Andrew Judson, Hassan Khosrowshahi, Robert Lee, Brandt Louie, David MacKenzie, James McGovern, George Melville, Gwyn Morgan, Eleanor Nicholls, John O’Neill, Herb Pinder, Kevin Reed, H. Sanford Riley, Rod Senft, Bill Siebens, Anna Stylianides, Arni Thorsteinson, Michael Walker, Jonathan Wener, Niels Veldhuis (President), Jason Clemens (Executive Vice President), Stuart MacInnis (Secretary-Treasurer)
Founder & Honorary Chairman for Life T. Patrick Boyle
Fraser Institute Lifetime Patrons Sonja Bata, Charles Barlow, Ev Berg, Jim Chaplin, Serge Darkazanli, John Dobson, Art Grunder, Raymond Heung, Bill Korol, Bill Mackness, Fred Mannix, Con Riley, Jack Pirie, Catherine Windels
Purpose, Funding, and IndependenceThe Fraser Institute provides a useful public service. We report objective information about the economic and social effects of current public policies, and we offer evidence-based research and education about policy options that can improve the quality of life. The Institute is a non-profit organization. Our activities are funded by charitable donations, unrestricted grants, ticket sales and sponsorships from events, the licensing of products for public distribution, and the sale of publications. All research is subject to rigorous review by external experts, and is conducted and published separately from the Institute’s Board of Trustees and its donors. The opinions expressed by staff or author(s) are those of the individuals themselves, and should not be interpreted to reflect those of the Institute, its Board of Trustees, or its donors and supporters. As a healthy part of public discussion among fellow citizens who desire to improve the lives of people through better public policy, the Institute welcomes evidence-focused scrutiny of the research we publish, including verification of data sources, replication of analytical methods, and intelligent debate about the practical effects of policy recommendations.
PublisherChief Editor
Managing EditorEditorial Advisor
Art Direction and Cover DesignCover Illustration
Production and LayoutMedia Relations
Advertising Sales
Fraser InstituteNiels VeldhuisEmma TarswellKristin McCahonBill C. RayVolffEmma TarswellDean PelkeyAdvertising In PrintTel: (604) 681-1811E-mail: info@advertising inprint.com
Canada’s health care system is often at the centre of heated public policy debates. Some people worry that any increase in private funding or activity will
result in a shift from universality, while others worry that too many restrictions are placed on the choices that the average Canadian has when in need of care.
In this issue of Fraser Forum, we look at a vast array of policies that affect the health of Canadians. Nadeem Es-mail, using examples from abroad, argues that wait times are not necessary in Canada and that universality can still be maintained while getting patients the care they need in a timely fashion (p. 14). He goes on to talk about “junk food,” which has been vilified over the past few years as one of the leading causes of obesity. In Taxing “unhealthy” foods won’t reduce obesity (p.16), Esmail explains why these taxes are misguided. Another of the focus articles, Stronger intellectual property for pharmaceuticals would benefit Canadians (p.18), makes the case for an IP pro-tection regime for pharmaceuticals that matches those of other nations.
You will also find an article on the current state of minimum wages in Ontario (p.12). The piece highlights the fact that raising minimum wages will actually hinder young workers who are searching for part-time positions in low-paying fields rather than help reduce poverty. Another piece,With the latest comments on Keystone XL, Obama favouring environment over economy (p.6), re-views President Barack Obama’s recent statements on the Keystone XL pipeline. Finally, a case for P3s is made in Referendum on wastewater plant an opportunity to clarify facts about P3s (p.10).
This issue also finds articles on teacher effectiveness in Canada (p.21), archeological designation in British Co-lumbia (p.23), and much more.
We hope you enjoy this issue.
—Emma Tarswell
From the editor

2 Fraser Forum September/October 2013 www.fraserinstitute.org
Fraser ForumContents
Waiting for health care in Canada
1 From the editor
4 Forum authors
6 With latest comments on Keystone XL, Obama favouring environment over economy
Kenneth P. Green
How will the US president’s comments on the Keystone XL pipeline affect Canada?
8 Debate over CPP expansion incomplete
Charles Lammam, Jason Clemens, Milagros Palacios
Compulsory expansion of the CPP may have benefits but they need to be assessed against other saving plans like RRSPs.
10 Referendum on wastewater plant an opportunity to clarify facts about P3s
Charles Lammam and Hugh MacIntyre
Fraser Forum authors clear up some misunderstandings about public-private partnerships.
12 Ontario government should steer clear of minimum wage hikes
Charles Lammam and Hugh MacIntyre
A higher minimum wage results in unemployment for young workers.
14
Taxing “junk food” won’t cure obesity16
Changes to IP protection needed
18

www.fraserinstitute.org Fraser Forum September/October 2013 3
14 Waiting for health care is not a necessary evil
Nadeem Esmail
Many other nations avoid long queues for medical treatments; why are Canadians waiting so long?
16 Taxing “unhealthy” foods won’t reduce obesity
Nadeem Esmail
“Junk food” is not the only link to obesity.
18 Stronger intellectual property for pharmaceuticals would benefit Canada Nadeem Esmail
Aligning IP protection with international standards would benefit Canadians.
20 Why investors aren’t biting on a BC oil refinery
Gerry Angevine
Economic considerations suggest that oil sands producers will avoid investing in refineries on Canada’s coasts.
21 Obtaining better public school teachers
Rodney A. Clifton and John C. Long
How are teachers assessed in Canada?
23 BC’s rogue and costly archaeological bureaucracy Mark Milke
Land designations continue to disrupt private development in BC.
FRASER FOCUSHealth care in Canada— starting on page 14

4 Fraser Forum September/October 2013 www.fraserinstitute.org
Forum authorsGerry Angevine ([email protected]) is senior economist in The Fraser Institute’s Centre for Energy Studies. He has M.A. and Ph.D. degrees in econom-ics from the University of Michigan, an M.A. economics degree from Dalhousie University and a B.Comm. from Mount Allison University.
Jason Clemens ([email protected]) is the Fraser Institute’s executive vice-president. He holds an Honours Bach-elors Degree of Commerce and a Masters’ in Business Administration. Clemens also has a post Baccalaureate Degree in economics from Simon Fraser University.
Nadeem Esmail ([email protected]) is the director of Health Policy Studies at the Fraser Institute. He holds an M.A. in economics from the University of British Columbia.
Kenneth P. Green ([email protected]) is the senior director of the Centre for Energy and Natural Resources. He has studied energy-related environmental policy for nearly 20 years, with recent studies in the efficacy of green-jobs programs, drivers of oil and gas prices, and resilient policies to address the risks of climate change.
Charles Lammam ([email protected]) is resident scholar in economic policy at the Fraser Institute. He holds an M.A. in public policy from Simon Fraser University.
Hugh MacIntyre ([email protected]) holds an M.Sc. in multi-level and regional politics from the University of Edinburgh. His opinions have been pub-lished by a range of media outlets includ-ing National Post Full Comment, Western Standard, and The Volunteer.
Milagros Palacios ([email protected]) is a senior economist with the Fraser Institute’s fiscal studies de-partment. She holds an M.Sc. in econom-ics from the University of Concepcion in Chile.
Rodney A. Clifton is a Senior Fellow at the Frontier Centre for Public Policy (www.fcpp.org) and a Professor Emeritus at the Univer-sity of Manitoba. He earned a Ph.D. from the University of Toronto. His most recent book, with John C. Long, and Michael Zwaagstra, What’s Wrong With Our Schools and How We Can Fix Them, was published in 2010.
John C. Long is a Senior Scholar at the University of Manitoba, and received his Ph.D. from the University of Alberta. His recent book, with Rodney A. Clifton and Michael Zwaagstra, What’s Wrong With Our Schools and How We Can Fix Them, was published in 2010.
Mark Milke ([email protected]) is a Fraser Institute senior fellow and director of the Alberta Prosperity Project. He has a Ph.D. in international relations and political philosophy from the Univer-sity of Calgary.

Leave a legacy of freedom and prosperity
Linda Ashton, Gift Planner Tel: 604.688.0221 ext. 571Email: [email protected] Visit our website: www.fraserlegacy.org
It was at a Fraser Institute Foundation donor stewardship event in the summer of 2012, while listening to an explanation of why the Planned Giving program is so important to the long-term future of the Institute, that a loyal donor, Jim, realized making a current-day planned gift was the answer to challenges he was going to have with his taxes that year. Having sold some land, he was looking for an offset.
During a subsequent visit with Linda Ashton, the Fraser Institute’s gift planner, it was suggested and agreed that Jim would establish an endowed fund with the Foundation to which he could add over time and ultimately, by a bequest in his Will. His next decision was to determine how he was going to “pay” for his gift and his financial advisor offered the solution—publicly-traded securities. Knowing that Jim owned stocks that had increased in value over the years, and recognizing the tax benefits to be had by donating them to a charity, he recommended this approach to his client.
A few months later, when year-end was fast approaching, the Foundation sent the advisor a Charitable Donation of Securities In-Kind form, the stock was transferred to the Foundation’s broker, evaluated on the date of receipt, and then sold. The donor and the Foundation ironed out the terms of the Endowment, a receipt was issued, giving Jim the tax relief he desired, and now he can enjoy seeing his gift provide annual
support for a student education program at the Fraser Institute.
Individuals donating publicly-traded shares, mutual funds, or government bonds to a charitable organization or private foundation receive a tax credit for the fair market value of the security on the date of the donation. Since May 1, 2006, there is no tax payable on the capital gains resulting from the disposition arising upon the donation of publicly-traded securities.
Similar rules apply to publicly-traded shares acquired through an employee stock option, with added benefits if donated within 30 days of acquisition. Timing can be crucial, so before proceeding with such a donation, contact your advisor. Doing so is especially important for donations of flow-through shares, since the tax rules relating to them changed substantially on March 21, 2011.
If you are considering any of these options as part of a planned gift to the Fraser Institute Foundation, please contact Linda Ashton.
A planned gift helps educate future generations

6 Fraser Forum September/October 2013 www.fraserinstitute.org
Keystone watchers are in something of a swivet over comments made by US President Barack Obama in a recent interview with the New York
Times (2013). President Obama once again rained on the Keystone XL parade, disparaging the pipeline on employment and environmental grounds.
Here are the key quotes by Mr. Obama:
“…Republicans have said that this would be a big jobs generator. There is no evidence that that’s true. And my hope would be that any reporter who is looking at the facts would take the time to confirm that the most realistic estimates are this might create maybe 2,000 jobs during the construction of the pipeline—which might take a year or two—and then after that we’re talking about somewhere between 50 and 100 jobs in a economy of 150 million working people.”
“So what we also know is that oil is going to be piped down to the Gulf to be sold on the world
Kenneth P. Green
oil markets, so it does not bring down gas prices here in the United States. In fact, it might actu-ally cause some gas prices in the Midwest to go up where currently they can’t ship some of that oil to world markets.”
“Now, having said that, there is a potential benefit for us integrating further with a reliable ally to the north our energy supplies [sic.]. But I meant what I said; I’m going to evaluate this based on whether or not this is going to significantly contribute to car-bon in our atmosphere. And there is no doubt that Canada at the source in those tar sands could po-tentially be doing more to mitigate carbon release.”
“But all of that will go into the mix in terms of John Kerry’s decision or recommendation on this issue.”
There’s some truth to President Obama’s thoughts. Jobs for the Keystone XL pipeline will be “temporary” jobs, just as
With latest comments on Keystone XL, Obama favouring environment over economy

www.fraserinstitute.org Fraser Forum September/October 2013 7
all infrastructure jobs are temporary. Once you build a road, the road-builders move on to other projects. Once you’ve built a bridge, the bridge-builders move on to other projects. All construction is, essentially, temporary work. What’s sur-prising is that the US president would disparage such work when it’s proposed by the private sector, when such “tem-porary” work has constituted the core of pretty much every economic stimulus program he has proposed over the last five years. Put up wind turbines? Temporary work. Put up solar panels? Temporary work. Insulate homes? Re-pave highways? Install “smart” meters? All temporary work.
And it’s true, to the extent that there’s a glut of oil in the Midwest keeping gas prices low, relieving the glut might lead to some higher prices. Of course, the economic reasoning isn’t exactly stellar here either: what the president is arguing is that it’s okay to keep gas prices artificially low in Oklahoma, while preventing people in the Gulf of Texas from receiving oil that would create jobs and profits in the Gulf. You’d think that if glut creation was President Obama’s ideal way of keep-ing gas prices down, he wouldn’t have slowed oil production on Federally-controlled lands (Colman, 2013).
What’s most interesting about Mr. Obama’s recent com-ments, however, is his re-affirmation of what could be seen as an insurmountable hurdle to Keystone XL approval.
Back in June, the President gave a speech on climate change, in which he proposed this test for Keystone XL (author’s emphasis):
Allowing the Keystone pipeline to be built requires a finding that doing so would be in our nation’s in-terest. And our national interest will be served only if this project does not significantly exacerbate the problem of carbon pollution. The net effects of the pipeline’s impact on our climate will be absolutely critical to determining whether this project is al-lowed to go forward (The White House, 2013).
At the time, some analysts thought the President’s statement left plenty of room for approval. Brad Plumer, at the Washington Post Wonkblog, felt that the President had left himself “wiggle room” to approve the pipeline (2013). And over at the Financial Post, Claudia Cattaneo also went for the “wiggle room” theory (2013). I was more pessi-mistic, actually agreeing (somewhat) with Joe Romm’s interpretation at Climate Progress (an exceedingly rare event) that the President’s language suggested an insur-mountable hurdle (2013). Even if Canada improved the efficiency of bitumen production so that its greenhouse gas intensity was identical to that of conventional oil, it is still the case that the simple act of developing the oil sands will add net carbon to the atmosphere: more carbon than Canada can capture in any offsetting way. To environ-mentalists like Romm, anything that helps get the bitu-men out of the ground will flunk Mr. Obama’s litmus test.
And his mention of “John Kerry’s decision or recom-mendation” is also reason for a pessimistic interpretation of the most recent comments. As I wrote in a Fraser Insti-tute Alert recently, John Kerry is a very strong believer in catastrophic climate change: “In August 2012, Kerry told the US Senate that he believed climate change to be ‘of as significant a level of importance’ as Syria’s or Iran’s nuclear ambition, as it ‘affects ecosystems on which the oceans and the land depend’” (Green, 2013).
By repeating what now seems to be the official litmus test for Keystone XL approval, and by emphasizing that the decision is in the hands of John Kerry, who has re-peatedly expressed alarmist sentiments regarding climate change, President Obama has cast further doubt on Key-stone XL approval (US Department of State, 2013).
References
New York Times (2013, July 27). Interview with Presi-dent Obama. New York Times. <http://www.nytimes.com/2013/07/28/us/politics/interview-with-president-obama.html?pagewanted=all&_r=0>, as of July 31, 2013.
Colman, Zack (2013, March 5). Report: US oil-and-gas pro-duction up despite drop on federal lands. The Hill. <http://thehill.com/blogs/e2-wire/e2-wire/286245-report-us-oil-and-gas-production-up-despite-drop-on-federal-lands>, as of July 31, 2013.
The White House (2013). Remarks by the President on Cli-mate Change. News Release. The White House. <http://www.whitehouse.gov/the-press-office/2013/06/25/remarks-president-climate-change>, as of July 31, 2013.
Plumer, Brad (2013, June 25). Obama may have left him-self wiggle room to approve Keystone XL. Washington Post. <http://www.washingtonpost.com/blogs/wonkblog/wp/2013/06/25/did-obama-leave-himself-some-wig-gle-room-to-approve-keystone-xl/>, as of July 31, 2013.
Cattaneo, Claudia (2013, June 25). Obama buys more wiggle room on Keystone decision. Financial Post. <http://busi-ness.financialpost.com/2013/06/25/obama-climate-change-keystone/?__lsa=75dd-57f1>, as of July 31, 2013.
Romm, Joe (2013). Memo to Obama: Canada Can’t Reduce the Cli-mate Impacts of Keystone Pipeline with Rip-offsets. Climate Progress. <http://thinkprogress.org/climate/2013/07/03/2240581/memo-to-obama-canada-cant-reduce-the-climate-impacts-of-keystone-pipeline-with-rip-offsets/>, as of July 31, 2013.
Green, Kenneth P., and Elizabeth DeMeo (2013). Obama’s Green Team 2.0: Implications for Canadian Energy and Environmental Pol-icy. Fraser Institute. <http://www.fraserinstitute.org/upload-edFiles/fraser-ca/Content/research-news/research/publica-tions/obamas-green-team-2.0.pdf>, as of July 31, 2013.
United States Department of State (2013). Remarks at the Ross Sea Conservation Reception. US Department of State. <http://www.state.gov/secretary/remarks/2013/03/206395.htm>, as of July 31, 2013.
iSto
ck

8 Fraser Forum September/October 2013 www.fraserinstitute.org
During a meeting in December 2012, the federal and provincial ministers discussed the idea of expanding the Canada Pension Plan (CPP) (Curry, 2012). No
decision was made and the ministers decided to revisit the issue at their next meeting in mid-2013. While that next meeting has yet to be scheduled at the time of writing, pro-posals for a mandatory expansion of the CPP continue to receive much attention. This would require working Cana-dians to contribute more of their income via payroll taxes with the promise of greater benefits in retirement.
Unfortunately, the debate thus far has largely ignored a critical economic insight that leads proponents of an ex-panded CPP to overestimate the increase in overall retire-ment savings and, therefore, the benefits of this policy re-form. Economic theory tells us that higher forced savings for retirement through the CPP will lead Canadians to re-duce their voluntary savings elsewhere.1 That means an ex-panded CPP would not increase overall retirement savings to the extent expected but it would change the mix with more going to CPP and less to other savings like RRSPs.
The reason is simple: People choose how much to spend and save based on their preferences and expectations of in-come over the course of their lifetime. If their preferences for spending vs. savings do not change, and if they do not expect
more income over their lifetime, they will simply offset in-creased government-mandated savings with less voluntary savings, leaving the overall amount saved largely unchanged.
Thankfully, Canadians do not have to rely solely on theory since we have a natural experiment with manda-tory increases to CPP contributions when the CPP payroll tax increased to 9.9 percent in 2003 from 5.0 percent in 1993. This gives us an opportunity to observe the actual response of Canadians who save voluntarily in RRSPs.
Our recent study, RRSPs and an Expanded Canada Pen-sion Plan: A Preliminary Analysis, looked at CPP and RRSP contributions for two age groups over that period: Cana-dians under 45 and those aged 45 to 65 (Lammam et al., 2013). It further separated each age group into two income groups: $10,000 to $50,000 and $50,000 to $100,000. We particularly focused on the 45 to 65 age group making be-tween $10,000 to $50,000 since this group is likely the most sensitive to changes in the CPP.
Using three different measures, our analysis consis-tently found that RRSP contributions declined as manda-tory contributions to the CPP increased.
For instance, the percentage of tax-filers aged 45 to 65 with income between $10,000 and $50,000 contributing to RRSPs declined between 1993 and 2003. Specifically, 40.2
Charles Lammam, Jason Clemens, and Milagros Palacios
DEBATE OVER CPP EXPANSION INCOMPLETE
Bigstock

www.fraserinstitute.org Fraser Forum September/October 2013 9
percent of tax-filers in this group contributed to RRSPs in 1993 and the proportion fell to 33.0 percent by 2003.
We found similar results when examining the share of in-come contributed to RRSPs (see figure 1): for Canadians aged 45 to 65 with income between $10,000 and $50,000, the share of income contributed to RRSPs declined to 3.5 percent in 2003 from 4.4 percent in 1993. Meanwhile, the share contributed to CPP doubled to 3.0 percent from 1.5 percent of income.
A third measure showed that the dollar value of RRSP contributions per tax-filer also decreased as mandatory CPP contributions increased. Taken together, our findings strongly suggest a substitution between CPP and RRSPs occurred in the past when mandatory CPP contributions increased, as basic economic theory would predict.
The debate about the benefits of increasing the CPP contribution rate for all workers should then, at a mini-mum, account for the costs of reduced RRSP savings.
With RRSPs, the assets accumulated over time can be fully transferred to a beneficiary upon death (the CPP only offers scaled back benefits to survivors). Moreover, if you’re young and interested in buying a house, RRSPs through the Home Buyers’ Plan can help by allowing penalty and tax-free with-drawals up to $25,000.2 Also, if you’re middle-aged and look-ing to transition to a new field of work, the Lifelong Learning Plan allows you to withdraw RRSP savings up to $10,000 per year, penalty and tax free..3 Finally, if you have a terminal ill-ness or need emergency funds, you can use RRSP savings.
These benefits are lost when Canadians are forced to save more in CPP and offset those increases with decreas-es in their RRSPs. Other aspects of this trade-off, such as the comparative benefits of the CPP (defined benefit in retirement) compared to the benefits of RRSPs (flexibility and choice), also need to be assessed and discussed.
The key to providing retirement income through sav-ings is a set of rules that allows for an optimal mix of sav-
ings for different people in different stages of life and with different preferences. There may be benefits to a compul-sory expansion of the CPP, but these benefits need to be weighed against the costs, which as our analysis shows could include a reduction in voluntary RRSP savings.
NOTES1 See Friedman (1957) and Modigliani (2005) for the original works regarding this theory. See Feldstein (1974) for more re-cent empirical evidence of the theory.
2 See http://www.cra-arc.gc.ca/tx/ndvdls/tpcs/rrsp-reer/hbp-rap/menu-eng.html for details on the Home Buyers’ Plan.
3 See http://www.cra-arc.gc.ca/tx/ndvdls/tpcs/rrsp-reer/llp-reep/menu-eng.html for details on the Lifelong Learning Plan.
REFERENCESCurry, Bill (2012, December 17). Finance ministers put CPP re-form back on the agenda. Globe and Mail. <http://www.theglo-beandmail.com/news/politics/finance-ministers-put-cpp-reform-back-on-the-agenda/article6488900/#dashboard/follows/>, as of July 24, 2013.
Feldstein, Martin (1974). Social Security, Induced Retirement, and Aggregate Capital Accumulation. Journal of Political Economy (82), 5: 905–926.
Friedman, Milton (1957). A Theory of the Consumption Function. Princeton University Press. <http://www.nber.org/books/frie57-1>, as of July 24, 2013.
Lammam, Charles, Milagros Palacios, and Jason Clemens (2013). RRSPs and an Expanded Canada Pension Plan: A Prelim-inary Analysis. Fraser Institute. <http://www.fraserinstitute.org/uploadedFiles/fraser-ca/Content/research-news/research/publications/RRSPs-and-an-expanded-canada-pension-plan.pdf>, as of July 24, 2013.
Modigliani, Franco (2005). The Collected Papers of Franco Modi-gliani: Volume 6. MIT Press. <https://mitpress.mit.edu/books/collected-papers-franco-modigliani-1>, as of July 24, 2013.
0
1
2
3
4
5
CPP
RRSP
2008200720062005200420032002200120001999199819971996199519941993
Figure 1: RRSP and CPP contributions as a share of income, 1993-2008 Canadians aged 45-65 with income
Cont
ribut
ions
(% o
f inc
ome)
Source: Canada Revenue Agency (CRA); calculations by authors.
10 Fraser Forum September/October 2013 www.fraserinstitute.org
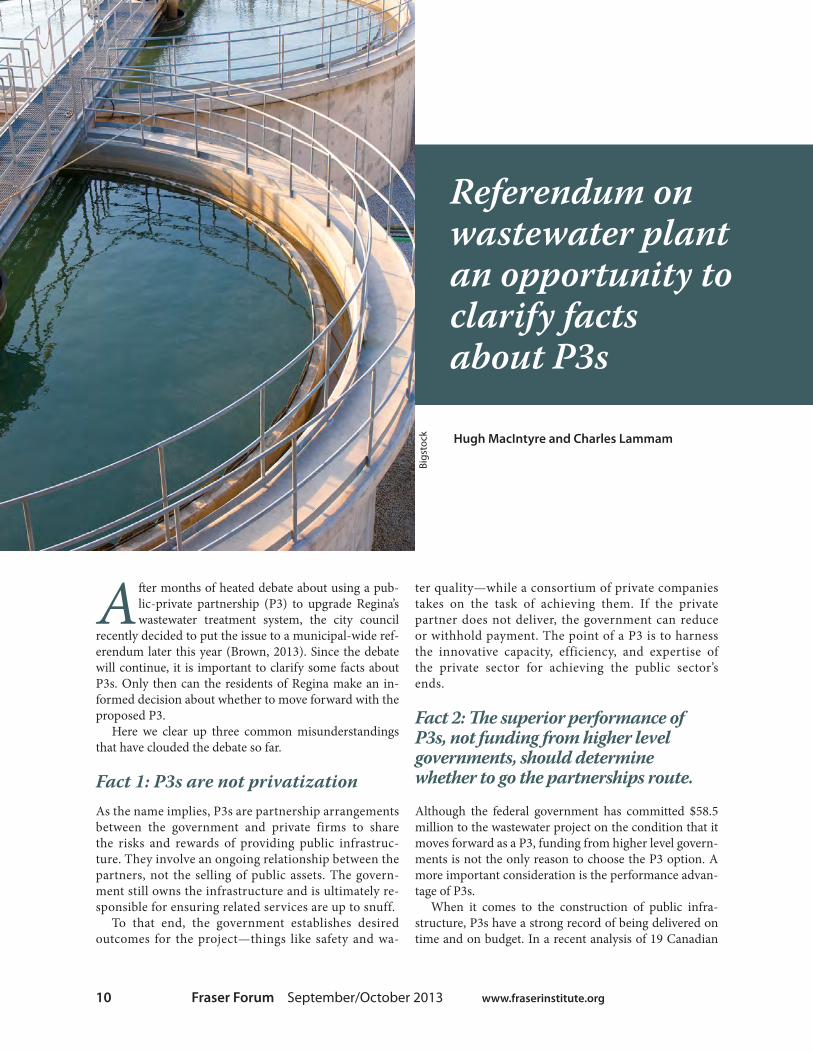
After months of heated debate about using a pub-lic-private partnership (P3) to upgrade Regina’s wastewater treatment system, the city council
recently decided to put the issue to a municipal-wide ref-erendum later this year (Brown, 2013). Since the debate will continue, it is important to clarify some facts about P3s. Only then can the residents of Regina make an in-formed decision about whether to move forward with the proposed P3.
Here we clear up three common misunderstandings that have clouded the debate so far.
Fact 1: P3s are not privatizationAs the name implies, P3s are partnership arrangements between the government and private firms to share the risks and rewards of providing public infrastruc-ture. They involve an ongoing relationship between the partners, not the selling of public assets. The govern-ment still owns the infrastructure and is ultimately re-sponsible for ensuring related services are up to snuff.
To that end, the government establishes desired outcomes for the project—things like safety and wa-
ter quality—while a consortium of private companies takes on the task of achieving them. If the private partner does not deliver, the government can reduce or withhold payment. The point of a P3 is to harness the innovative capacity, efficiency, and expertise of the private sector for achieving the public sector’s ends.
Fact 2: The superior performance of P3s, not funding from higher level governments, should determine whether to go the partnerships route.
Although the federal government has committed $58.5 million to the wastewater project on the condition that it moves forward as a P3, funding from higher level govern-ments is not the only reason to choose the P3 option. A more important consideration is the performance advan-tage of P3s.
When it comes to the construction of public infra-structure, P3s have a strong record of being delivered on time and on budget. In a recent analysis of 19 Canadian
Hugh MacIntyre and Charles Lammam
Referendum on wastewater plant an opportunity to clarify facts about P3s
Bigs
tock
www.fraserinstitute.org Fraser Forum September/October 2013 11
P3 projects from 2004 to 2009, an impressive 90 percent finished on time or early (Iacobacci, 2010).
International evidence shows that P3s substantial-ly outperform conventional government-led projects both in terms of cost and completion time. A study from the United Kingdom found that P3 projects typi-cally finished one percent earlier than scheduled and with virtually no cost overruns, while government-led projects finished 17 percent late with cost overruns of 47 percent (MacDonald, 2002). An Australian study found similar results with 3.4 percent of P3 projects completed ahead of schedule and 23.5 percent of government-led projects completed behind schedule (Duffield and Raisbeck, 2007).
Fact 3: The P3 option can be less costly when project risks are accounted for.
We often hear the P3 option is more costly than govern-ment-led projects because governments can raise capital in debt markets by borrowing at lower interest rates than private companies. This is an incomplete comparison because it fails to include project-related risk.
Government-led projects are not risk free. While a more attractive interest rate may make them ap-pear less costly, such projects have a history of being over budget and delivered late (Clemens et al., 2007). When this happens, taxpayers are responsible for the extra costs. In a P3, the risk of additional costs is borne by the private sector partner, which makes the government rate bargain a much less attractive deal when the full risk-adjusted cost of the project is taken into consideration.
In fact, an independent value-for-money assessment by the accounting firm Deloitte concluded that the risk-adjusted cost of Regina’s wastewater treatment plant would be lower if delivered as a P3 (Deloitte, 2013). Specifically, Deloitte ana-lysts peg the total construction, operation, and maintenance cost of the P3 option at $479.2 million, some seven percent less than the $514.5 million cost of government-led provi-sion. Importantly, the P3 cost estimate excludes the $58.5 million federal subsidy, which would further reduce the cost of the project from the city’s perspective.
Projects like the wastewater plant last many decades so calculating value-for-money depends on various assump-tions about the future. But to claim that lower borrowing costs make government-led delivery always a cheaper op-tion simply isn’t true.
The upcoming referendum is an opportunity for Regina taxpayers to genuinely debate the merits of using the P3 model. For that to happen, they will need facts rather than misleading arguments that muddy people’s understanding of P3s. And the facts point to a P3 as the better bet for Regina’s wastewater plant upgrade.
ReferencesBrown, Vanessa (2013, July 23). City of Regina to hold fall ref-erendums on waste water treatment plant project. Leader-post. <http://www.leaderpost.com/news/Regina+Mayor+Michael+Fougere+call+referendum+waste+water/8693545/story.html>, as of July 31, 2013.
Clemens, Jason, Charles Lammam, Milagros Palacios, and Niels Veldhuis (2007). Government Failure in Canada. 2007 Report: A Review of the Auditor General’s Report, 1992-2006. Fraser Institute. <http://www.fraserinstitute.org/publicationdisplay.aspx?id=13074&terms=auditor+general>, as of July 31, 2013.
Deloitte (2013). City of Regina Wastewater Treatment Plant Explan-sion & Upgrade Project: Summary of Delivery Model Assessment. Deloitte. <http://www.regina.ca/opencms/export/sites/re-gina.ca/residents/water-sewer/.media/pdf/appendix-a-de-loitte-summary-model.pdf>, as of July 31, 2013.
Duffield, Colin, and Peter Raisbeck (2007). PPPs and Traditional Procurement. Infrastructure Partnerships Australia. <http://www.infrastructure.org.au/Content/PPP.aspx>, as of July 31, 2013.
Iacobacci, Mario (2010). Dispelling the Myths: A Pan-Canadian Assessment of Public-Private Partnerships for Infrastructure Invest-ments. Conference Board of Canada. <http://www.conference-board.ca/e-library/abstract.aspx?did=3431>, as of July 31, 2013.
Mott MacDonald (2002). Review of Large Public Procurement in the UK. Government of Australia. <http://www.parliament.vic.gov.au/images/stories/committees/paec/2010-11_Budget_Estimates/Extra_bits/Mott_McDonald_Flyvberg_Blake_Dawson_Waldron_studies.pdf>, as of July 31, 2013.
International evidence shows that P3s substantially outperform conventional government-led projects both in terms of cost and completion time.

12 Fraser Forum September/October 2013 www.fraserinstitute.org
Charles Lammam and Hugh MacIntyre
Ontario government should steer clear of minimum wage hikes
“Youth unemployment is still unacceptably high,” noted the Ontario government as it identified priorities in its 2013 budget (Ontario, Ministry of Finance, 2013). Oddly, how-ever, the government is now contemplating a policy that would make it harder for young Ontarians to find jobs. With its newly minted advisory panel (Ontario, Ministry of Labour, 2013), the government is considering ways to au-tomatically increase the minimum wage by tying its future value to changes in inflation or perhaps economic growth.
The panel’s lofty goal is to “come up with a system that will ensure both job creation and income security for all Ontarians.” Achieving it is wishful thinking. Scores of economic studies have found that minimum wage in-creases result in fewer job opportunities, particularly for the young and low-skilled.
Before the panel gives its recommendations, it should ponder a new study published earlier this month by the National Bureau of Economic Research (Meer and West, 2013). Instead of the traditional approach of looking at employment levels, the authors looked at how minimum
wage increases impact net job creation (jobs created minus jobs destroyed). After examining data in the US from 1977 to 2011, they found that a 10% increase in the minimum wage led to about a one-quarter reduction in the rate of net job growth. Put another way: increasing the minimum wage reduced the rate of jobs being cre-ated, resulting in fewer employment opportunities than would have otherwise occurred.
Of course, one study alone is not convincing evidence of the destructive effect of minimum wage hikes. So con-sider a comprehensive review of the academic literature conducted in 2006 on minimum wages and employment (Neumark and Wascher, 2006). Led by Professor David Neumark, an expert in the area, the review looked at more than 100 studies covering 20 countries and found an over-whelming majority of studies reached the conclusion that minimum wage hikes negatively impact employment.
In Canada, more than a dozen studies have exam-ined the impact of provincial minimum wage increas-es. Based on those findings, a 10% minimum wage
iStock

www.fraserinstitute.org Fraser Forum September/October 2013 13
hike decreases employment for young workers (ages 15-24) by an average of 3 to 6% (Godin and Veldhuis, 2009).1 For young workers most affected—those earn-ing between the current minimum wage and the pro-posed higher wage—the impact is more acute, with job losses of up to 20% (Campolieti et al., 2005).
To understand why increasing the minimum wage has such negative effects, it is important to recognize how compensation is determined in competitive markets (Sherk, 2013). Compensation is based on the amount em-ployees produce—their labour productivity. For example, if a fast-food employee can produce a maximum $8 worth of output each hour, then her employer would be willing to pay up to $8 per hour in total compensation. In other words, the employer aims to match per unit labour costs with the value of what their employees produce.
If the government imposes a minimum wage rate that results in compensation exceeding an employee’s maxi-mum ability to produce, employers adjust their affairs accordingly. Employers not only respond by decreasing the number of jobs but also by reducing the hours em-ployees work, cutting non-wage benefits like on-the-job training, giving priority to the most productive employ-ees, and/or finding ways to operate with fewer workers and more automation (Neumark and Wascher, 2006; Couch and Wittenburg, 2001; Neumark and Wascher, 2001; Neumark and Wascher, 1995).
While the negative impact on employment is one thing, there is a growing body of evidence that shows minimum wage increases actually do little to help house-holds in need.
A 2012 study by prominent Canadian minimum wage experts analyzed provincial data from 1997 to 2007 and found that raising the minimum wage had no statistically discernible impact on measures of rel-ative poverty (including Statistics Canada’s Low In-come Cut-Off ) (Campolieti et al., 2012).
One important reason is the bulk of minimum wage workers do not actually belong to low-income households. In a 2009 study, researchers used Statis-tics Canada data to profile minimum wage earners in Ontario (Mascella et al., 2009). They found that “over 80 percent of low wage earners are not members of poor households” (they define poverty as earning in-come that is half the median wage). The researchers also found that “over 75% of poor households do not have a member who is a low wage earner.”
If the government is serious about tackling Ontar-io’s youth unemployment and fostering job creation, then it should steer clear of future minimum wage increases regardless of what formula the advisory panel recommends. The reality is that increasing the minimum wage will actually reduce job opportunities while doing nothing to alleviate poverty.
Note1 A recent study published in 2011 looked at minimum wage in-creases across Canadian provinces from 1981 to 2004 and found similar results (see Sen et al., 2011). Specifically, the authors found that increasing the minimum wage by 10% is “significantly correlat-ed with a 3% to 5% drop in teen employment.” They also found that raising the minimum wage was related to a 4% to 6% increase in the percentage of families living below the Low Income Cut-Off line.
ReferencesCampolieti, Michele, Morley Gunderson, and Byron Lee (2012). The (Non) Impact of Minimum Wages on Poverty: Regression and Simulation Evidence for Canada. Journal of Labor Research 33, 3 (September): 287-302.
Campolieti, Michele, Tony Fang, and Morley Gunderson (2005). Minimum Wage Impact on Youth Employment in Transition, 1993-1999. Canadian Journal of Economics 38, 1 (February): 81-104.
Couch, Kenneth, and David Wittenburg (2001). The Re-sponse of Hours of Work to Increase in the Minimum Wage. Southern Economic Journal 68, 1 (July): 171-177.
Godin, Keith, and Niels Veldhuis (2009). The Economic Effects of Increasing British Columbia’s Minimum Wage. Fraser Institute.
Mascella, Allison, Shahzia Teja, and Brennan S. Thompson (2009). Minimum Wage Increases as an Anti-Poverty Policy in Ontario. Canadian Public Policy 35, 3 (September): 373-379.
Meer, Jonathan, and Jeremy West (2013). Effects of the Mini-mum Wage on Employment Dynamics. NBER Working Pa-per No. 19262. National Bureau of Economic Research.
Neumark, David, and William Wascher (2006). Minimum Wage and Employment: A Review of the Evidence From the New Minimum Wage Research. NBER Working Paper No. 12663. National Bureau of Economic Research.
Neumark, David, and William Wascher (2001). Minimum Wage and Training Revisited. Journal of Labour Economics 19, 3 (July): 563-595.
Neumark, David, and William Wascher (1995). Minimum Wage Effects on Employment and School Enrollment. Jour-nal of Business and Economic Statistics 13, 2 (April): 199-206.
Ontario, Ministry of Finance (2013). 2013 Ontario Budget: A Prosperous and Fair Ontario. Government of Ontario. <http://www.fin.gov.on.ca/en/budget/ontariobud-gets/2013/papers_all.pdf>, as of August 22, 2013.
Ontario, Ministry of Labour (2013). New Advisory Panel to Examine Ontario’s Minimum Wage System. News Release (July 17th, 2013). Ministry of Labour. <http://news.ontario.ca/mol/en/2013/07/new-advisory-panel-to-examine-ontari-os-minimum-wage-system.html>, as of August 22, 2013.
Sen, Anindya, Kathleen Rybczynski, and Corey Van De Waal (2011). Teen Employment, Poverty, and the Minimum Wage. Labour Economics 18, 1 (January): 36-47.
Sherk, James (2013). Productivity and Compensation: Grow-ing Together. Heritage Foundation.

14 Fraser Forum September/October 2013 www.fraserinstitute.org
W aiting is a defining characteristic of Canadian health care. Canadians wait, often intermina-bly, for access to health care services. In 2012,
for example, the average Canadian could expect to wait more than four months for treatment by a spe-cialist after their general practitioner referred them. Despite substantial increases in taxpayer-funded health expenditures and numerous governmental ini-tiatives to reduce delays, wait times have improved little over the past decade (CIHI, 2012; Barua and Es-mail, 2012). These delays cost Canadians as much as $3 billion in lost time and lost productivity in 2012 (Esmail, 2013b).
Some, such as Professor John Hirdes of the Univer-sity of Waterloo’s School of Public Health and Health Systems, suggest the only alternative to waiting is more government spending and/or the abandonment
of universality (Weidner, 2013). But such claims en-tirely ignore reality: other nations avoid waiting with-out higher spending or depriving people of health care. If they can do it, so can we.
Canada’s wait times are among the longest in the developed world. For example, the Commonwealth Fund’s international health policy survey found that Canadians endure longer waits for access to emer-gency care, primary care, specialist care, and elective surgery than patients in Australia, France, Germany, the Netherlands, New Zealand, Norway, Sweden, Swit-zerland, the UK, and the US (Commonwealth Fund, 2010). Note that nine of those ten countries maintain universal approaches to health care insurance (the US, though moving in that direction, is still the exception).
And, contrary to popular belief, Canada’s terrible wait times are not the result of insufficient health care
WAITING FOR HEALTH CARE IS NOT A NECESSARY EVIL
Nadeem Esmail
iStock

www.fraserinstitute.org Fraser Forum September/October 2013 15
spending. In 2009 (the most recent year for which comparable statistics are available), Canada’s health care system ranked as the developed world’s most ex-pensive universal access system. After adjusting for the age distribution of different populations (older people require more care), Canada spent 12.5 percent of GDP on health care, compared to a universal-ac-cess-nation average of 9.9 percent and as little as 6.7 percent in Japan (Esmail, 2013a). Not only did Ca-nadians wait longer than their counterparts in other developed nations with universal access health insur-ance systems, they spent more for the dubious privi-lege of doing so.
Clearly the argument that Canada can only reduce waiting through increased health spending and/or abandoning universality is, at best, incorrect. The so-lution to Canada’s waiting time woes is sensible health policy reform based on the approaches pursued in the developed world’s highest performing universal ac-cess health insurance programs.
Belgium, France, Germany, Japan, Luxembourg, the Netherlands, and Switzerland all share Canada’s noble goal of ensuring access to care regardless of ability to pay. Critically, however, those countries de-liver that care without lengthy queues for treatment (Borowitz et al., 2013). Further, both Switzerland and Japan are recognized as providing some of the best health care outcomes in the developed world.
How do they do it? All these other nations employ private competition in the delivery of universally ac-cessible hospital and surgical services. All have pri-vate parallel health care sectors. All require those seeking universal care to share in its cost through co-payments or deductibles. Finally, all employ a social insurance model of funding where an independent authority (or private competitive insurer) oversees the daily operation and financing of the health insurance scheme (Esmail and Walker, 2008). Governments are still involved as they should be, in a regulatory and oversight role.
Don’t be misled by fear-mongers and their “priva-tization” and “profit” boogeymen: none of the nations listed above abandoned universality as a result of their more effective policy approaches. They all ensure ac-cess to care regardless of ability to pay. And they ac-tually deliver on the promise of timely access to high quality care regardless of medical history or ability to pay. They stand in stark contrast to Canada’s provin-cial governments who break that promise (most often to those in the lowest socio-economic classes) daily.
We do not need to spend more money nor abandon universality to fix Canada’s scandalously long wait times. Sensible policy reform, based on the approach-es employed in the world’s leading universal health
insurance systems can solve our wait time problem, helping Canadians to live healthier, more productive lives.
REFERENCESBarua, Bacchus and Nadeem Esmail (2012). Waiting Your Turn: Wait Times for Health Care in Canada: 2012 Report. Fraser Institute.
Borowitz, Michael, Valerie Moran, and Luigi Siciliani (2013). Waiting Times for Health Care: A Conceptual Framework. In Luigi Siciliani, Michael Borowitz, and Val-erie Moran (eds.) Waiting Time Policies in the Health Sector: What Works? (OECD Health Policy Studies): 19–32.
Canadian Institute for Health Information [CIHI] (2012). National Health Expenditure Trends, 1975 to 2012. CIHI.
Commonwealth Fund (2010). 2010 Commonwealth Fund In-ternational Health Policy Survey. Chartpack. <http://www.commonwealthfund.org/Surveys/2010/Nov/2010-In-ternational-Survey.aspx>, as of July 29, 2013.
Esmail, Nadeem (2013a). Health Care Lessons from Japan. Lessons from Abroad: A Series on Health Care Reform. Fraser Institute.
Esmail, Nadeem (2013b). The Private Cost of Public Queues for Medically Necessary Care: 2013 Edition. Fraser Institute.
Esmail, Nadeem and Michael Walker (2008). How Good is Canadian Health Care? 2008 Report. Fraser Institute.
Weidner, J. (2013, July 19). Medical wait times cost Canadi-ans $1B, but lowering waits would cost more, says UW pro-fessor. Waterloo Region Record. <http://www.therecord.com/news-story/3900586-medical-wait-times-cost-canadians-1b-but-lowering-waits-would-cost-more-says-uw-professor/?utm_content=buffer1bd12&utm_source=buffer&utm_medium=twitter&utm_campaign=Buffer>, as of July 29, 2013.
We do not need to spend more money nor abandon universality to fix Canada’s scandalously long wait times.

It seems health associations are once again calling for a “fat tax;” taxes on foods that some nutritionists and re-searchers don’t want us to eat or drink.
Unfortunately, the lack of sound thinking behind vilifying sugary drinks or less healthful snacks has not changed, nor has the blunt, imprecise, and unfair nature of a “junk food” or “sugary drink” tax.
No matter the good intentions, taxing certain foods to make us healthier remains bad public policy. There are several reasons why this is so, the most fundamental be-ing that such taxes affect everyone regardless of their girth or lifestyle choices.
Consider the case of a Canadian who runs three times a week, plays sports from time to time, eats a well-balanced diet, and is in excellent physical condition. If she likes to relax with a pop and watch a movie on the weekend, or enjoy a chocolate bar with lunch, why should she pay more to do so?
Notably, in 2012, 52.5 percent of Canadians aged 18 and older, and 21.8 percent of Canadian youth (aged 12 to 17) reported themselves to be overweight or obese (Sta-tistics Canada, 2013a). In other words, flip those statistics over, and a sizable portion of the adult population and the majority of the youth population are neither overweight nor obese by body mass index (the common metric of overweight and obesity) standards.
“Junk food” or sugary drink taxes not only fail to dis-tinguish between overweight/obese Canadians and those who are not, but they are also a regressive form of taxation. A number of studies have found that diets of less healthy food options are less expensive than diets of healthier food options (Drenowski and Darmon, 2005; Drenowski et al., 2004; BCPHO, 2006; and CIHI, 2006). Further, lower so-cioeconomic classes are typically more dependent on fast foods for their nourishment (Eisenberg et al., 2011). Both suggest that a tax on less healthful/fattier food options will have a disproportionate effect on lower-income Canadians.
“Junk food” taxes are also not guaranteed to reduce overall caloric intake, as some hope. Importantly, fast food consumption (a common target for a “fat tax”) may be relatively unresponsive to price changes because individu-als may simply switch to other non-taxed, but still energy-dense (lots of calories per serving size) foods (Eisenberg et al., 2011).
Taxing “unhealthy” foods won’t reduce obesityNadeem Esmail
Bigstock

Then there is the issue of defining which foods should be taxed and the difficulties therein (think fruit juices for example). That will no doubt re-quire increased bureaucracy: a new agency would need to be created to determine which foods or beverages qualify for the tax and which might be exempted. The proposal that such taxes be offset with subsidies or tax reductions for other more healthful foods or in other areas only com-pounds this problem.
Targeting only one food group, such as sugary beverages, does not necessarily resolve these issues or those outlined above.
Those who wish to vilify soft drinks must also contend with a problem-atic reality: According to Statistics Canada, soft drink consumption fell 35 percent in Canada between 1999 and 2012 (Statistics Canada, 2013b). Yet, obesity has risen over that time (Statistics Canada, 2013a).
Fundamentally, how much we eat (of all foods), how much we exercise, and how we live our lives gener-ally (plus genetic factors) determines the size of our waistlines. And even then, the relationship to ill health is not clear and obvious as many stud-ies show some extra weight may be protective (see for example Flegal et al., 2005; Gronniger, 2006; and Flegal and Graubard, 2009).
The consumption of less healthful and/or fattier foods when balanced with other foods and exercise will not lead to a person being overweight or obese, nor will it necessarily lead to poorer health. No single food or beverage can be held responsible for weight gain.
Overly simplistic solutions to obesi-ty that vilify an industry or food prod-uct are bad public policy. The reality is that “junk food” taxes or sugary drink taxes are ineffective, blunt instruments that fail to recognize the complex and manifold causes of obesity. It’s time we put the idea of such taxes in their right-ful place: the junk bin.
References
British Columbia Provincial Health Of-ficer [BCPHO] (2006). Food Health and Well-Being in British Columbia. Provin-cial Health Officer’s Annual Report 2005. British Columbia Ministry of Health.
Canadian Institute for Health Informa-tion [CIHI] (2006). Improving the Health of Canadians: Promoting Healthy Weights. CIHI.
Drewnowski, Adam, and Nicole Darmon (2005). Symposium: Modifying the Food Environment: Energy, Density, Food Costs, and Portion Size. Food Choices and Diet Costs: an Economic Analysis. Journal of Nutrition 135: 905–909.
Drewnowski, Adam, Nicole Darmon, and André Briend (2004). Replacing Fats and Sweets with Vegetables and Fruits—A Question of Cost. American Journal of Public Health 94: 1555–1559.
Eisenberg, Mark J., Renée Atallah, Sonia M. Grandi, Sarah B. Windle, and Elliot M. Berry (2011, May 2). Legislative Ap-proaches to Tackling the Obesity Epidem-ic. Canadian Medical Association Journal.
Flegal, Katherine M., and Barry I. Grau-bard (2009). Estimates of excess deaths as-sociated with body mass index and other anthropometric variables. American Jour-nal of Clinical Nutrition, 89(4): 1213-1219.
Flegal, Katherine M., Barry I. Graubard, David F. Williamson, and Mitchell H. Gail (2005). Excess deaths associated with underweight, overweight, and obe-sity. Journal of the American Medical As-sociation, 293(15): 1861-1867.
Gronniger, Jerome Timothy (2006). A Semi-parametric Analysis of the Relationship of Body Mass Index’s to Mortality. American Journal of Public Health, 96(1): 173-178.
Statistics Canada (2013a). Table 105-0501: Health indicator profile, annual estimates, by age group and sex, Canada, provinces, terri-tories, health regions (2012 boundaries) and peer groups. <http://www5.statcan.gc.ca/cansim/a05?lang=eng&id=1050501>, as of July 29, 2013.
Statistics Canada (2013b). Table 002-0011: Food available in Canada. <http://www5.statcan.gc.ca/cansim/a26?lang=eng&retrLang=eng&id=0020011&pattern=&csid>, as of July 29, 2013.
www.fraserinstitute.org Fraser Forum September/October 2013 17

Canada’s lagging intellectual property (IP) protections for pharmaceutical innovators are a key issue to be settled in the Comprehensive Economic and Trade
Agreement (CETA) negotiations with the European Union. They may also play a role in upcoming nego-tiations for the multi-country Trans-Pacific Partnership (TPP). Canadians would be far better off, in both eco-nomic and health terms, with an IP protection regime for pharmaceutical innovators more closely aligned with international standards (Lybecker, 2013; Dawson, 2013).
There are three key areas where Canada’s protec-tion of pharmaceutical innovator intellectual prop-erty falls short of protections offered in Europe, the US, and a number of other nations. The first is patent term restoration, or restoring patent time lost to man-datory regulatory delays. The second is on a right of appeal for patent holders (allowing patent holders in Canada the right to appeal court rulings that invali-date their patent). The third is extended data exclusiv-ity, the time during which generic manufacturers are not permitted to use innovator data for drug approv-als (Esmail, 2013: 6).
Critiques of stronger IP correctly point out that weaker IP protection allows for less spending on pharmaceuticals. Government estimates suggest the costs of aligning Canada’s protections with interna-tional standards could be between $367 million and $2 billion annually (Scoffield, 2012). These figures have been a strong motivator for those calling for Canada to defend relatively weaker IP protections in trade negotiations.
But let’s put those numbers in perspective. Ac-cording to the Canadian Institute for Health Informa-tion, total drug expenditures in Canada in 2012 were forecast to be a little more than $33 billion dollars,
roughly 16 percent of total health spending ($207 bil-lion) (2012; calculations by author). That means the estimated cost increase falls somewhere between 1.1 and 6.1 percent of drug spending, and between a 0.2 and 1.0 percent increase in total health spending.
The impact on provincial budgets is smaller. Public sources covered some 37 percent of Canadian drug expenditures in 2012. This equates to an increase in total government health spending (assuming the dis-tribution of the increase matches that of spending generally) of between 0.1 and 0.5 percent.
While these costs are not insignificant, they must be balanced against the many and multifaceted ben-efits of stronger IP protection.
First, consider the benefits that would accrue to Canadians in the absence of enhanced trade. En-hanced IP protection for pharmaceuticals would in-crease incentives for activity in this knowledge based industry that pays relatively high wages for both high-skilled and low-skilled employees. The resulting ben-efits include reduced legal ambiguity and litigation in Canada, greater research and development (R&D) expenditures, additional job creation in the pharma-ceutical industry, greater pharmaceutical self-suffi-ciency, improved access to medical innovations, and additional innovation in medicines (Lybecker, 2013).
The benefits from trade, resulting from increased access to international trading agreements, would be more impressive.
The Comprehensive Economic and Trade Agree-ment (CETA) offers access to the world’s largest single common market (the EU), with a population of over 500 million and a gross domestic product of $17.4 trillion (Dawson, 2013). CETA is estimated to offer a 20 percent boost to Canada’s exports to the EU and
STRONGER INTELLECTUAL PROPERTY FOR PHARMACEUTICALS WOULD BENEFIT CANADIANSNadeem Esmail
18 Fraser Forum September/October 2013 www.fraserinstitute.org

to add $12 billion to the economy annually (Scoffield, 2013). CETA offers reduced tariffs (particularly for fish and seafood, footwear, and textiles), access to the EU’s $3 trillion government procurement market, and some $2.3 billion in non-tariff barrier reductions (in-cluding regulatory duplication, packaging, and label-ing requirements) (Dawson, 2013).
TPP offers a similarly large economic benefit, where TPP countries (Australia, Brunei-Darussalam, Canada, Chile, Japan, Malaysia, Mexico, New Zea-land, Peru, Singapore, the US, and Vietnam) represent a prospective free trade zone of over 785 million peo-ple with a GDP in excess of $26.4 trillion (Dawson, 2013). One study estimates TPP may yield annual in-come gains of $9.9 billion for Canada and increase ex-ports by nearly $16 billion (Petri and Plummer, 2012). The major attraction of TPP is the size and dynamism of the Asian market, including China’s potential fu-ture inclusion (Dawson, 2013).
Equally important is Canada’s bargaining position in current and future trade agreement negotiations, where stronger IP protection may not only improve that position but also improve access to future agree-ments in other regions including Asia and Latin America (where the EU and US are aggressively pur-suing free trade agreements) (Dawson, 2013).
Of course, enhanced IP protection is not the only matter to be resolved in these trade negotiations, and other criteria need to be met before Canadians can reap the benefits of these trade agreements. However, this policy area is of significant importance to Cana-da’s counterparts in these discussions and has the po-tential to become a sticking point.
The benefits of more closely aligning Canada’s pro-tection for pharmaceutical IP with international stan-dards are considerable, and likely overwhelm the cost increase in pharmaceutical expenditures. It makes little sense for Canada to continue to provide less protection to pharmaceutical innovators than other nations.
ReferencesCanadian Institute for Health Information [CIHI] (2012). National Health Expenditure Trends, 1975 to 2012. CIHI.
Dawson, Laura (2013). Canada’s Trade Agreements and the Pharmaceutical Industry: The Road to Asia Runs Through Brussels. In Esmail, Nadeem ed. (2013). The Trade and Eco-nomic Benefits of Enhanced Intellectual Property Protection for Pharmaceuticals in Canada. Fraser Institute: 33-51.
Lybecker, Kristina M. (2013). Strengthening Intellectual Property Protection for Pharmaceutical Innovation: What Canada Stands to Gain. In Esmail, Nadeem ed. (2013). The Trade and Economic Benefits of Enhanced Intellectual Prop-erty Protection for Pharmaceuticals in Canada. Fraser Insti-tute: 9-32.
Petri, Peter A., and Michael G. Plummer (2012). The Trans-Pacific Partnership and Asia-Pacific Integration: Policy Im-plications. Policy Brief (June). Peterson Institute for Inter-national Economics. <http://www.iie.com/publications/pb/pb12-16.pdf>, as of July 29, 2013.
Scoffield, Heather (2012, November 13). Canada-EU Trade Deal: Drug Patent Concessions Could Cost Canadians $900 Million Per Year. Huffington Post Business Canada. <http://www.huffingtonpost.ca/2012/11/13/canada-eu-trade-deal-drug-patent_n_2123221.html>, as of July 29, 2013.
Canada’s protection of pharmaceutical innovator intellectual property falls short of protections offered in Europe, the US, and a number of other nations.
Bigs
tock
www.fraserinstitute.org Fraser Forum September/October 2013 19

20 Fraser Forum September/October 2013 www.fraserinstitute.org
Newspaper baron David Black, who is proposing to build a large oil-refinery in Kitimat, is reportedly
puzzled by the lack of interest by potential investors. The answer to his puzzlement is fairly straightforward: in free (and even free-ish) markets, capital flows to its most effi-cient use. Compared to gains that can be had from new oil production, expected gains from new refineries are scant these days.
Most of the growth in Canada’s oil production will come from continued expansion in the capacity to produce raw, and in some cases upgraded, bitumen from the Alberta oil sands. This requires tremendous amounts of capital including the additional cost of implementing new technologies to reduce on-site natural gas consumption and to mitigate environmen-tal impacts. Oil refineries, which also require large amounts of capital, offer only limited profit margins and therefore, aren’t very attractive to investors at this point. It’s simple competi-tiveness.
Mr. Black’s opinion that shipping refined petroleum prod-ucts from our shores instead of crude oil is preferable because gasoline and other refinery products are less costly to cleanup in the event of a spill makes sense. And yes, countries such as China and India will be consuming increasing volumes of gasoline, diesel fuel, and other refined petroleum products. Further, Canadian producers will have oodles of crude oil to supply any refineries that might be built on the west coast. However, basic economic considerations suggest that oil sands producers will avoid investing in refineries on either the west or east coast.
First, there is the matter of price. Western crude oil exports are heavily discounted because of excess supplies and quality differentials in the US midcontinent region where the West Texas Intermediate (WTI) oil price marker that drives the price of most Canadian crude oil shipments to US refineries is set. In fact there is a “double” discount because WTI has been trading at substantially lower levels than other leading oil price markers such as that for Brent (North Sea) crudes.
Although plans are underway to increase the limited pipe-line capacity available to ship oil from Cushing, Oklahoma to the US Gulf Coast, growth in indigenous supply sources, in-
Why investors aren’t biting on a BC oil Refinery
cluding both bitumen from the oil sands and production from oil shale, will probably prevent western Canada crudes from achieving world prices. That is, producers selling crude oil to refineries on the west coast would unlikely be able to make the same profit as they could from exporting to growing markets in Asia, despite the greater transportation costs.
Second, oil refineries are not only complex and costly, but need to be tuned, technically, to refined petroleum product specifications (e.g., for gasoline and diesel fuel) which are sub-ject to changes in environmental policy. This means investors in refineries face risks from changes in product specifications in targeted markets. Stringent environmental regulations also make it very expensive to build and operate refineries in North America. By remaining focused on crude oil exports and es-tablishing supply relationships with oil refineries in a number of Asian Pacific countries, Canada’s oil producers can avoid the risks surrounding oil refinery ventures here.
Finally, the largest petroleum producers—those with suf-ficient financial strength and flexibility to invest in oil refiner-ies as well as new oil production facilities—have other objec-tives. The large Canadian oil companies, such Suncor Inc. and Canadian Natural Resources Ltd., plan to continue to develop their oil sands production capacity, the highly specialized business that they know best. Foreign-owned oil companies heavily involved in the Alberta oil sands have similar plans. Moreover, some (including Conoco-Phillips, Exxon, and Shell) have plans to develop huge, costly LNG export facilities on the BC coast. This suggests they don’t regard investment in Canadian oil refineries to be attractive relative to other invest-ment opportunities.
If Mr. Black can secure the necessary financing and long-term purchase commitments from oil product distributors overseas and builds the refinery, he will likely be able to pur-chase the necessary feedstock from western Canadian oil pro-ducers. This assumes, however, that pipelines or other means are put in place to transport the required crude oil from Alber-ta to the refinery and that the producers are unable to market their oil to refineries in the Asia Pacific where they can realize higher prices. But Mr. Black cannot count on the producers to participate in his project.
Gerry Angevine
Walter Siegmund
www.fraserinstitute.org Fraser Forum September/October 2013 21
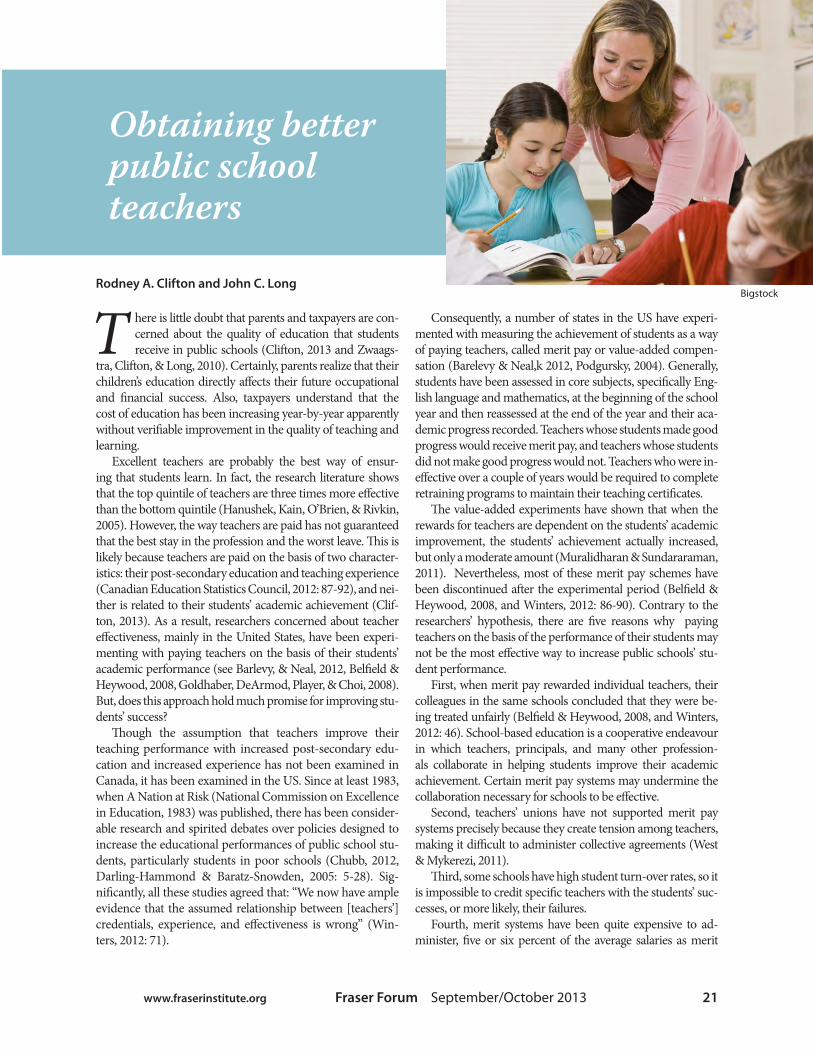
T here is little doubt that parents and taxpayers are con-cerned about the quality of education that students receive in public schools (Clifton, 2013 and Zwaags-
tra, Clifton, & Long, 2010). Certainly, parents realize that their children’s education directly affects their future occupational and financial success. Also, taxpayers understand that the cost of education has been increasing year-by-year apparently without verifiable improvement in the quality of teaching and learning.
Excellent teachers are probably the best way of ensur-ing that students learn. In fact, the research literature shows that the top quintile of teachers are three times more effective than the bottom quintile (Hanushek, Kain, O’Brien, & Rivkin, 2005). However, the way teachers are paid has not guaranteed that the best stay in the profession and the worst leave. This is likely because teachers are paid on the basis of two character-istics: their post-secondary education and teaching experience (Canadian Education Statistics Council, 2012: 87-92), and nei-ther is related to their students’ academic achievement (Clif-ton, 2013). As a result, researchers concerned about teacher effectiveness, mainly in the United States, have been experi-menting with paying teachers on the basis of their students’ academic performance (see Barlevy, & Neal, 2012, Belfield & Heywood, 2008, Goldhaber, DeArmod, Player, & Choi, 2008). But, does this approach hold much promise for improving stu-dents’ success?
Though the assumption that teachers improve their teaching performance with increased post-secondary edu-cation and increased experience has not been examined in Canada, it has been examined in the US. Since at least 1983, when A Nation at Risk (National Commission on Excellence in Education, 1983) was published, there has been consider-able research and spirited debates over policies designed to increase the educational performances of public school stu-dents, particularly students in poor schools (Chubb, 2012, Darling-Hammond & Baratz-Snowden, 2005: 5-28). Sig-nificantly, all these studies agreed that: “We now have ample evidence that the assumed relationship between [teachers’] credentials, experience, and effectiveness is wrong” (Win-ters, 2012: 71).
Obtaining better public school teachers
Consequently, a number of states in the US have experi-mented with measuring the achievement of students as a way of paying teachers, called merit pay or value-added compen-sation (Barelevy & Neal,k 2012, Podgursky, 2004). Generally, students have been assessed in core subjects, specifically Eng-lish language and mathematics, at the beginning of the school year and then reassessed at the end of the year and their aca-demic progress recorded. Teachers whose students made good progress would receive merit pay, and teachers whose students did not make good progress would not. Teachers who were in-effective over a couple of years would be required to complete retraining programs to maintain their teaching certificates.
The value-added experiments have shown that when the rewards for teachers are dependent on the students’ academic improvement, the students’ achievement actually increased, but only a moderate amount (Muralidharan & Sundararaman, 2011). Nevertheless, most of these merit pay schemes have been discontinued after the experimental period (Belfield & Heywood, 2008, and Winters, 2012: 86-90). Contrary to the researchers’ hypothesis, there are five reasons why paying teachers on the basis of the performance of their students may not be the most effective way to increase public schools’ stu-dent performance.
First, when merit pay rewarded individual teachers, their colleagues in the same schools concluded that they were be-ing treated unfairly (Belfield & Heywood, 2008, and Winters, 2012: 46). School-based education is a cooperative endeavour in which teachers, principals, and many other profession-als collaborate in helping students improve their academic achievement. Certain merit pay systems may undermine the collaboration necessary for schools to be effective.
Second, teachers’ unions have not supported merit pay systems precisely because they create tension among teachers, making it difficult to administer collective agreements (West & Mykerezi, 2011).
Third, some schools have high student turn-over rates, so it is impossible to credit specific teachers with the students’ suc-cesses, or more likely, their failures.
Fourth, merit systems have been quite expensive to ad-minister, five or six percent of the average salaries as merit
Rodney A. Clifton and John C. LongBigstock

22 Fraser Forum September/October 2013 www.fraserinstitute.org
awards and additional administration costs, and the students’ achievement gains have been quite modest (Belfield & Heywood, 2008 and Muralidharan & Sundararaman, 2011).
Finally, some teachers and ad-ministrators have devised ways of receiving merit pay without actually improving their students’ academic performance. These “professionals” have been able to “game the system” for their own advantage at the expense of students, parents, and taxpayers (Belfield & Heywood, 2008).
In part because of these difficulties, policymakers have lost some of their initial enthusiasm for merit schemes in public education. Nevertheless, the research literature still suggests ways to improve the academic success of stu-dents by changing school districts’ ac-countability and teachers’ certification requirements.
Almost 15 years ago, James Heck-man, a University of Chicago economist and a Nobel Laureate, pointed out that: “Public schools are local monopolies with few competitors.” “The problem in public education is primarily due to muted incentives, not to inadequate resources” (199: 100 & 107). Recently, a researcher at the Friedman Founda-tion for Educational Choice contends that public educational monopolies empower “a dense cluster of rapacious special interests (basically, teachers’ unions, school boards, and faculties of education) resisting all efforts to im-prove schools” (Foster, 2013: 28). Con-sequently, to improve the education of public school students, the way teachers are recruited, educated, certified, hired, and retained must be changed.
The report, Obtaining Better Teach-ers for Canadian Public Schools (Clif-ton, 2013), recommends a number of policies that will help improve the academic achievement of public school students. The recommendations suggest removing critical decisions from the self-interest of teachers’ unions, facul-ties of education, and even provincial departments of education.
Considerable evidence suggests that principals and vice-principals are very
good at identifying excellent teachers (Chubb, 2012: 115 and Podgursky, 2004: 260), so they should be empowered to hire, and fire, teachers and other school personnel to create school-based teams that collaborate on improving students’ academic achievement. As such, begin-ning teachers would be hired for a pro-visional period of perhaps three years. Thereafter, principals should be relatively free to retain teachers using longer-term contracts so that the school administra-tors can build teams who work effective-ly at advancing students’ learning.
This strategy implies a formal change in principals’ responsibilities, especially in provinces and territories, such as Manitoba, where they are members of the teachers’ union. To be most effec-tive in hiring, retaining, and promoting teachers, they must be unambiguously members of a management team, per-haps with their own professional associ-ation. Also, in provinces and territories where principals are obligated to hire teachers on the basis of their ranking on “occasional teachers’ lists” (substitute teachers), such as Ontario, they must be free to hire the most effective teachers and not necessarily those who have had the longest tenure as substitute teachers.
These recommendations would begin to provide the incentives and ac-countability necessary for improving students’ academic performances in public schools. Specifically, the recom-mendations would give school admin-istrators, their teachers, and other per-sonnel adequate time and opportunities to improve the performances of their students. Equally important, the rec-ommendations would help ensure that those with vested interests in the status quo become more accountable to par-ents and taxpayers for their professional work. As a result, students would more likely become better educated allaying some of the concerns that parents and taxpayers have about the quality of edu-cation in Canadian public schools.
ReferencesBarlevy, G., and D. Neal (2012). Pay for per-centile. American Economic Review, 102: 1805-1831.
Belfield, C.R., and J.S. Heywood (2008). Per-formance pay for teachers: Determinants and consequences. Economics of Education Review, 27: 243-252.
Canadian Education Statistics Council (2012). Education indicators in Canada: An international perspective. Canadian Educa-tion Statistics Council.
Chubb, J.E. (2012). The best teachers in the world: Why we don’t have them and how we could. Hover Institution.
Clifton, R.A. (2013). Obtaining better teach-ers for Canadian public schools: A review of the “teacher effectiveness” research literature. Fraser Institute.
Darling-Hammond, L., and J. Baratz-Snowden (eds.) (2005). A good teacher in ev-ery classroom: Preparing the highly qualified teachers our children deserve. Jossey-Bass.
Foster, G. (2013). A. win-win solution: The empirical evidence on school choice. Fried-man Foundation for Educational Choice.
Goldhaber, D., M. DeArmod, D. Player, and H.J. Choi (2008). Why do so few pub-lic school districts use merit pay? Journal of Education Finance, 33: 262-289.
Hanushek, E.A., J.F. Kain, D. O’Brien, and S.G. Rivkin (2005). The market for teacher quality. National Bureau of Economic Re-search, Working Paper 11154.
Heckman, J.J. (1999). Doing it right: Job train-ing and education. Public Interest, 135: 86-107.
Muralidharan, K., and V. Sundararaman (2011). Teacher performance pay: Experi-mental evidence from India. Journal of Po-litical Economy, 119: 39-77.
National Commission on Excellence in Edu-cation (1983). A nation at risk: The imperative for educational reform. Secretary of Education.
Podgursky, M. (2004). Improving academic performance in U.S. public schools: Why teacher licensing is (almost) irrelevant. In. F.M. Hess, A.J. Rotherham, and K. Walsh (eds.), A quality teacher in every classroom? Appraising old answers and new ideas. Har-vard Education: 255-277.
West, K.L., and E. Mykerezi (2011). Teach-ers’ unions and compensation: The impact of collective bargaining on salary schedules and performance pay schemes. Economics of Education Review, 30: 99-108.
Winters, M. (2012). Teachers matter: Rethink-ing how public schools identify, reward, and re-tain great educators. Rowman and Littlefield.
Zwaagstra, M.C., R.A. Clifton, and J.C. Long (2010). What’s wrong with our schools and how we can fix them. Roman and Littlefield.

www.fraserinstitute.org Fraser Forum September/October 2013 23
BC’s rogue and costly
archaeological bureaucracy
If you own property in British Co-lumbia, you might want to pay attention to a recent court judg-
ment from that province. Attention should especially be paid as the BC government decided to appeal the ruling in an effort to make property owners pay for the priorities of bu-reaucrats in the province’s archaeo-logical branch, this rather than treat regulatory actions as akin to expro-priation.
Some background: In 2006, Vic-toria resident Wendi Mackay and her late husband purchased property from her parents (who bought the land and built a home on it in 1985). The Mackays planned to demolish the existing structure and replace it.
Regulation review
This is where they ran into a prob-lem. Since Mackay’s parents purchased and built on the property in the ’80s, its land designation had changed; now the land is considered an “undesig-nated” heritage site. The BC archaeo-logical branch refuses to list site des-ignations on land titles, and thus, new buyers never know that there could be an issue when deciding to build (and they still won’t, unless they check with that bureaucracy in Victoria) (British Columbia, 2013).1
The result of this new designation was a plethora of extra inspections, permits, and archeological work at Mackay’s expense. The initial bill was $67,000 but the archaeological branch wanted even more work, worth anoth-
er $50,000 (Personal interview with Wendi Mackay, June 12, 2013). That is when Wendi Mackay stopped paying and started her suit against the prov-ince. She claimed roughly $600,000 in damages due to the additional costs resulting from obtaining the site alter-ation permit, construction delays, and lost value to the property (MacKay v. British Columbia, 2013).
In a recent landmark Supreme Court of British Columbia judgment on the Mackay case, Justice Gerow found that departmental officials had “no statutory authority to require the petitioner to pay for a heritage inspection or heritage investigation under any circumstances” (MacKay v. British Columbia 2013).
Mark Milke
Bigstock

24 Fraser Forum September/October 2013 www.fraserinstitute.org
As Justice Gerow wrote, the existing BC Heritage Act allows the Minister of Forests, Lands and Natural Resource Operations (the ministry in which the archaeological division is ensconced) to order someone to incur archaeologi-cal costs. The law does not allow staff to make such an order, nor, as Section 14 (7) of the Act states, can the Minister simply delegate the decision to impose costs. That is an important distinction and point, as if the Minister of For-ests, Lands, and Natural Resource Op-erations wishes to tell private property owners they must bear the cost for costly archaeological digs, that order could be politically contentious and for good rea-son: telling people to ante up for a dig is akin to a government arbitrarily telling one property in an expropriation case that they are not entitled to compensa-tion for the loss of use and thus loss of value of their land. Whatever the reason Section 14(7) exists, it has the benefit of making sure the political cost of such an arbitrary imposition of costs is borne by the politician who wishes to make prop-erty owners bear burdensome costs.
The MacKay story is not the only one where private property owners were illegally forced to ante up by the archaeological branch.
In 2010, an elderly couple, Louise and Hereward Allix, from the Parksville area wanted to build a one-storey house to replace their existing two-storey home. When they applied for a devel-opment permit, they were told to first pay for an archaeological dig. The initial estimate was $4,000; the final price tag was $35,000 (Tomlinson, 2010), not in-consequential for an elderly couple on a fixed income and in ill-health.
In Kamloops, owners of the Harp-er’s Trail Estate Winery/Thadd Springs Vineyard have a similar story. Ed and Vicki Collett have already spent $250,000 to comply with the archaeo-logical branch’s previous directives, and estimate another $40,000 in costs yet to come (Fortems, 2013). In Van-couver, in one high-profile case in-volving private property in the city of Vancouver, and where protests from
the Musqueam First Nation band blocked development for the past year, the initial estimate for the archaeolog-ical dig was $130,000 but it ended up costing $400,000 (Milke, 2013).
This will be an ongoing problem in BC. The archaeological branch catalogues 38,927 property sites in the province as archaeologically sig-nificant, with 11,300 new sites added since 2005 (Vert, 2013). The branch did not provide a breakdown on how many of those apply to private land, nor (as noted above) do owners re-ceive notice of this status on their title. The province deliberately does not register such a designation on land titles (ostensibly fearing archae-ological destruction or looting). As Mackay and others have discovered, owners of such sites face a potentially ruinous bill down the road for any necessary archaeological dig.
The BC government has options. The province could choose to respect property rights and transparency, and respect the fact that much of people’s life savings are tied up in their proper-ty. A government that desires archaeo-logical artefacts should pay for the cost of uncovering them. Akin to compen-sation for financial injuries that results from expropriation, costs that result from regulation are similarly injurious to private property owners.
Or it could appeal the Gerow judgment and/or modify its own legislation and give the archaeologi-cal branch the explicit authority to demand private property owners pay for archaeological digs. That would make what the archaeological branch has been up to “legal” but it would not be reasonable for property own-ers who face increased costs and risk when buying, selling, or developing/re-developing their land. Regrettably, in late June, the province chose to appeal the Gerow decision (British Columbia Court of Appeal, 2013). Thus, the province of British Colum-bia intends that archaeological finds deemed as publicly significant will be paid for by private property own-
ers with the priorities of the bureau-crats in the province’s archaeological branch trumping the rights of private property owners.
Notes1 Such sites are now protected by BC’s 1996 Heritage Conservation Act.
ReferencesBritish Columbia (2013a). Heritage Conservation Act. Government of Brit-ish Columbia. <http://www.bclaws.ca/EPLibraries/bclaws_new/docu-ment/ID/freeside/00_96187_01> as of July 4. 2013.
British Columbia Court of Appeal (2013). Wendi Jane MacKay v. the Crown, Court of Appeal File No. CA 41018, filed June 28, 2013 at Victoria.
Fortems, Cal (2013). Wine pioneers run into archaeological costs ‘out of control’. Kamloops Daily News. <http://www.kamloopsnews.ca/article/20130416/KAMLOOPS0101/130419883/0/ka-mloops/wine-pioneers-run-into-ar-chaeological-costs-out-of-control>, as of July 4, 2013.
MacKay v. British Columbia. 2013 BCSC 945. Supreme Court of British Columbia. <http://www.courts.gov.bc.ca/jdb-txt/SC/13/09/2013BCSC0945.htm>, as of July 4, 2013.
MacKay v. British Columbia (2013). May 31, 2013 judgment from J. Gerow. Supreme Court of British Columbia. 2013 BCSC 945. <http://www.courts.gov.bc.ca/jdb-txt/SC/13/09/2013BCSC0945.htm>, as of July 4, 2013.
Milke, Mark (2013). Aboriginal activ-ism and hidden archaeological claims: The newest threat to private property in BC. Fraser Forum (January-February). <http://www.fraserinstitute.org/uploadedFiles/fraser-ca/Content/research-news/research/articles/ab-original-activism-and-hidden-archae-ological-claims.pdf>, as of July 4, 2013.
Tomlinson, Kathy (2010). Homeowner charged $35,000 by archeologists. CBC. <http://www.cbc.ca/news/canada/british-columbia/story/2010/04/19/bc-diggingbill.html>, as of July 5, 2013.
Vert, Patrick (2013). E-mail from Patrick Vert from British Columbia Ministry of Forest, Lands and Natural Resource Op-erations, June 10, 2013.

Tuesday, October 29th, 2013 Reception & dinner 5:30 - 9:30 p.m.
Fairmont Waterfront Hotel 900 Canada Place Way, Vancouver, BC
Chairman & CEO, H.Y. Louie Company, and Chairman of the Board, London Drugs. A most worthy honouree, Mr. Louie has played a major role in Vancouver’s—and Canada’s—business community and is a leading philanthropist supporting numerous causes, particularly in the fields of health and education .
Contact: Rhogene Dadashzadeh 604.688.0221 ext. 511rhogene.dadashzadeh @fraserinstitute.org
Fraser Institute1770 Burrard Street, Vancouver, BC V6J 3G7
A tribute dinner honouring
BRANDT C. LOUIEO.B.C., LL.D, FCA
GOLD SPONSORS:
Thank you to our PLATINUM SPONSORS:
Special thanks to the Donner Canadian Foundation
SILVER SPONSORS:
Black version
Pantone Spot Colour version(Pantone Reflex Blue)
CMYK versionC-100 M-65 Y-0 K-o
LOGO: The London Drugs logo can only be used in the positive. If placed on a coloured background, you must use the logo with a white keyline (supplied in this briefing package).
COLOUR: When printing with CMYK the Logo must be in this colour value C-100 M-65 Y-0 K-0. When printing with one or two colours either Pantone Reflex Blue or Black must be used. When using in RGB it must be R-0 G-51 B-153. When using the logo on the web it must be in this RGB value or HEX# 003399.
OTHER RESTRICTIONS: Logo must never be reversed white, skewed, stretched, cropped, recoloured or rotated. When scaling logo make sure X and Y axis stay true to the original.
MINIMUM SPACE: When logo is by itself it must always have at least 1/4 of the logo’s x-height of space around it.
RGBR-0 G-51 B-153
LOGO POSITIONING STATEMENT USAGE INSTRUCTIONS:
NOTEFailure to adhere to the London Drugs logo
and positioning statement guidelines is a corporate offence.
X-Height X-Height
1/4 of X-Height
1/4 of X-Height
1/4 of X-Height
1/4 of X-Height
1/4 of X-Height
1/4 of X-Height
MEDIA PARTNER:

Tuesday, October 1st, 2013 Reception & dinner 5:30 - 9:30 p.m.
Four Seasons Hotel 60 Yorkville Ave, Toronto, ON
You are invited to a tribute dinner honouring Eric Sprott, CEO and Senior Portfolio Manager of Sprott Asset Management LP. Reserve your table and purchase tickets today for this exclusive event. You and your guests will join other distinguished business and community leaders in acknowledging the exceptional contributions Mr. Sprott has made to Ontario and Canada.
Contact: Rhogene Dadashzadeh 604.688.0221 ext. 511rhogene.dadashzadeh @fraserinstitute.org
Fraser Institute1770 Burrard Street, Vancouver, BC V6J 3G7
A tribute dinner honouring
ERIC SPROTT
SILVER SPONSORS:
Thank you to our GOLD SPONSORS:
Special thanks to the Donner Canadian Foundation
COPPER SPONSORS: MEDIA PARTNER: