franklincovey annual report 2019
TRANSCRIPT

FranklinCovey
Annual Report 2019Essential Roles ofThe
®ALL ACCESSPASSFranklinCovey
SPECIAL COLLECTIONS
FillingYour Pipeline®
M A N A G E RI M P L E M E N TAT I O N G U I D E
VERSION 4.1VERSION 4.1VERSION 2.0
VERSION 3.0
Clayton Christensen Signature
THE KEY TO SUCCESSFUL INNOVATION
Find Out WHY™
SIGNATURE EDITION 4.0
P A R T I C I P A N T K I T
For the Unofficial Project Manager
PROJECTM A N A G E M E N TE S S E N T I A L STM
Engaging Your Team to
Win the Heart of Every Customer
UNCONSCIOUSBIASUnderstanding Bias to Unleash Potential™
®ALL ACCESSPASSFranklinCovey
SPECIAL COLLECTIONS

F o u n d a t i o n a l B e l i e f s
We believe:
1. People are inherently capable, aspire to greatness, and have the power to choose.
2. Principles are timeless and universal and the foun-dation for lasting effectiveness.
3. Leadership is a choice, built inside out on a foundation of character. Great leaders unleash the collective talent and passion of people toward the right goal.
4. Habits of effectiveness come only from the committed use of integrated processes and tools.
5. Sustained superior performance requires P/PC Balance—a focus on achieving results and build-ing capability.
V a l u e s
1. Commitment to Principles We are passionate about our content and strive
to be models of the principles and practices we teach.
2. Lasting Customer Impact We are relentless about delivering on our promise
to our customers. Our success comes only with their success.
3. Respect for the Whole Person We value each other and treat each person with
whom we work as a true partner.
4. Profitable Growth We embrace profitability and growth as the life-
blood of our organization; they give us the freedom to fulfill our mission and vision.
M i s s i o n S t a t e m e n t
We enable greatness in people and
organizations everywhere.
V i s i o n
Our vision is to profoundly impact
the way billions of people throughout
the world live, work, and achieve
their own great purposes.
Front cover artwork: Based on offerings in FranklinCovey’s All Access Pass.

TABLE OF CONTENTS
Letter from the Chairman . . . . . . . . . . . . . . . . . . . . . . . . . . . . . . 2
Financial Highlights . . . . . . . . . . . . . . . . . . . . . . . . . . . . . . . . . . . 5
Proxy Statement . . . . . . . . . . . . . . . . . . . . . . . . . . . . . . . . . . . . . . 7
Form 10-K. . . . . . . . . . . . . . . . . . . . . . . . . . . . . . . . . . . . . . . . . . . 56
Management’s Discussion and Analysis . . . . . . . . . . . . . . . . . 75
Report of Independent Registered Public Accounting Firm . 94
Consolidated Financial Statements . . . . . . . . . . . . . . . . . . . . . 96
Notes to Consolidated Financial Statements . . . . . . . . . . . . . 100
Corporate Information . . . . . . . . . . . . . . . . . . . . Inside Back Cover
Fellow Shareholders —Four years ago, when we began the transition to our subscription-based business model, we believed that we had thechance to become a new kind of company. A company which would be able to engage with clients in a powerful new waywhich would allow us to have thousands of loyal clients for life. A company which would become the leader in themost lucrative and valuable space in the performance improvement industry. A company with tens of millions of dollarsin recurring, high margin subscription revenue. A company with hundreds of sales people, providing broad reach anddeep market penetration.
We are really pleased that during fiscal 2019 we made significant progress toward each of these major objectives. Wecare deeply about our mission to “enable greatness in people and organizations everywhere” and today, our impact, reachand influence are being felt at a greater scale than at any other time in our company’s history. And strong financialresults have followed.
As shown in Figure 1, our:
• Total subscription and related sales grew 23.1%, or $22.4 million forthe year, from $96.9 million to $119.2 million.
• Balance of Billed and Unbilled Deferred Revenue, all related tosubscription sales, grew 21%, or $15.1 million, to $88.1 million, atthe end of Fiscal 2019 from $73.0 million at the end of the fourthquarter of fiscal 2018.
These strong results are being driven by the combined impact of threekey factors:
FACTOR #1: A significant percent of every dollar of increased salesis flowing-through to increases in Adjusted EBITDA and CashFlow. The combination of high single-digit revenue growth, high grossmargins, and declining SG&A as a percent of sales resulted in significantgrowth in Adjusted EBITDA and Cash Flow again in fiscal 2019.
During Fiscal 2019, approximately 56% of every dollar of increasedrevenue flowed-through to increases in Adjusted EBITDA. This resultedin growth in Adjusted EBITDA of $9.7 million, or 82% in constantcurrency. Our growth in cash flow was also very significant: Our Net
Figure 1
71.4
96.9
119.2
$0
$20
$40
$60
$80
$100
$120
$140
9102 lacsiF8102 lacsiF7102 lacsiF
SUBSCRIPTION AND RELATED SALES
53.5
73.0
88.1
$0
$20
$40
$60
$80
$100
Fiscal 2017 Fiscal 2018 Fiscal 2019
BILLED & UNBILLED DEFERRED REVENUE
2 Letter From the Chairman Franklin Covey 2019 Annual Report

Cash Generated increased $7.2 million, or 48% to $22.2 million, and Cash Flows Provided by Operating Activitiesincreased $13.6 million, or 81%, to $30.5 million, compared with $16.9 million last year.
We believe this high flow-through has put us on a great trajectory for an accelerated “march up the mountain” toachieving significant continued growth in Adjusted EBITDA and cash flow in fiscal 2020, and beyond.
FACTOR #2: The high growth rate of our subscription revenue, with its stickiness and strong gross margins, iscreating high lifetime customer value. It is also establishing strategic and structural durability, and increasing thetrajectory, predictability, and visibility of our future revenue.
This high lifetime customer value is being driven by the effectiveness of our solutions at addressing our customers’most intractable performance challenges…challenges which require significant and lasting change in human behavior.At scale. Helping organizations successfully address these important challenges creates strategic durability and long-termcustomer value.
A couple of client examples:
In our Enterprise Division: A major financial services institution partners with us to provide leadership developmentto their leaders all over the world. In 2019, they had expanded their All Access Pass to a 1,000 leader, multi-year pass,and also purchased over $100,000 in additional add-on services. Upon the launch of our new Unconscious Bias offering,they recently decided to add on a single-content pass to their existing All Access Pass to take the Unconscious Biasoffering to over 10,000 employees. They also extended the term of both their All Access Pass and their Unconscious Biasadd-on pass for another three years.
In our Education Division: In Lehigh Valley, Pennsylvania, in an effort to reinvent the former steel-based economy,the business community and the United Way partnered with local school districts to bring the Leader in Me to all of itsschools for workforce development and to improve literacy. The project began with a single Leader in Me school with450 students, and over the past 8 years has expanded to 33 schools, with 24,634 students. They have a stated plan to bringLeader in Me to all 50 of its schools with approximately 74,000 students. The community is thrilled with the resultsthey are seeing, as evidenced by their desire to bring Leader in Me to all of its schools and to expand it to otherneighboring districts.
As illustrated in Figure 2, simultaneously achieving thecombination of: (a) top tier growth in subscription and relatedsales; (b) top tier subscription economic and customermetrics; and (c) top tier rates of growth in Adjusted EBITDAand Cash Flow is rare. For us, achieving the intersection ofthese three factors accelerates our opportunity to createsignificant increases in value for our shareholders.
FACTOR #3: We are also aggressively taking advantageof a compelling sales force expansion opportunity. We havea lot of headroom for sales force growth in both the Enterpriseand Education Divisions. Both have very large TotalAddressable Markets. And, with only an approximatelyone-year payback period on our investment in a new salesperson, our sales force growth economics are very compelling.
Figure 2
Top tier growth in subscription and
related sales
of growth in Adjusted EBITDA and Cash Flow
Top tier subscription and customer metrics
VALUE
Franklin Covey 2019 Annual Report Letter From the Chairman 3
Top tier high rates

As shown in Figure 3, we have been, and are, aggressivelytaking advantage of this opportunity. Last year at this time,we said that we expected to add at least 20 net new clientpartners in fiscal 2019, and add a total of 75 net new clientpartners by the end of fiscal 2021, increasing our total base ofclient partners from 214 at the end of fiscal 2018, to 234 bythe end of fiscal 2019, and to 289 by the end of fiscal 2021. Wemade a lot of progress toward these objectives in fiscal2019, where we added 31 net new client partners and endedthe year with 245 client partners.
Our various cohorts of sales hires are benefitting from thehigh lifetime customer value generated by our subscriptionofferings and are achieving a ramp rate higher than thetargeted ramp rate shown in Figure 4.
This is an exciting time to be at FranklinCovey. We believethat the combination of these three factors has put us on thepath to becoming the new kind of company that we envisionedfour years ago when we began this transition. We are on agreat trajectory to achieve continued high growth in AdjustedEBITDA and Cash-flow in fiscal 2020, fiscal 2021 and beyond,and believe that these factors will continue to drive significantshareholder value.
We express our deep appreciation to our thousands of clientsworldwide who provide us the opportunity to work hand inhand with them in pursuit of the achievement of their critical objectives; to our associates and partners, who with greatcompetency, character, and passion, represent our mission throughout the world; and to you, our shareholders, foryour continued trust and support.
Sincerely,
Robert A. WhitmanChairman and Chief Executive OfficerFranklin Covey Co.
Figure 3
120 133
169 180
204218 214
245
-
50
100
150
200
250
300
FY 12 FY 13 FY 14 FY 15 FY 16 FY 17 FY 18 FY 19 Future
N����� �� C��� P ������
Figure 4
$200,000
$500,000
$800,000
$1,100,000
$1,300,000
$0
$200,000
$400,000
$600,000
$800,000
$1,000,000
$1,200,000
$1,400,000
Year 1 Year 2 Year 3 Year 4 Year 5
CLIENT PARTNER RAMP*
In $Millions
4 Letter From the Chairman Franklin Covey 2019 Annual Report

Financial Highlights
August 31, 2019 2018 2017 2016 2015In thousands, except per share data
Income Statement Data:Net sales $ 225,356 $ 209,758 $ 185,256 $ 200,055 $ 209,941Gross profit 159,314 148,289 122,667 133,154 138,089Income (loss) from operations 2,655 (3,366) (8,880) 13,849 19,529Income (loss) before income taxes 592 (5,520) (10,909) 11,911 17,412Income tax benefit (provision) (1,615) (367) 3,737 (4,895) (6,296)Net income (loss) (1,023) (5,887) (7,172) 7,016 11,116
Net income (loss) per share:Basic and diluted $ (.07) $ (.43) $ (.52) $ .47 $ .66
Balance Sheet and Cash Flow Data:Total current assets $ 119,340 $ 100,163 $ 91,835 $ 89,741 $ 95,425Other long-term assets 10,039 12,935 16,005 13,713 14,807Total assets 224,913 213,875 210,731 190,871 200,645
Long-term obligations 46,690 50,936 53,158 48,511 36,978Total liabilities 142,899 133,375 125,666 97,156 75,139
Shareholders’ equity 82,014 80,500 85,065 93,715 125,506
Cash flows from operating activities $ 30,452 $ 16,861 $ 17,357 $ 32,665 $ 26,190
Franklin Covey 2019 Annual Report Financial Highlights 5

[This page intentionally left blank]

Proxy Statement


Notice Of Annual Meeting Of ShareholdersTo Be Held January 24, 2020Franklin Covey Co.
You are cordially invited to attend the Annual Meeting of Shareholders of Franklin Covey Co. (the Company), which will beheld on Friday, January 24, 2020 at 8:30 a.m., in the Hyrum W. Smith Auditorium, 2200 West Parkway Boulevard, Salt Lake City,Utah 84119-2331 (the Annual Meeting), for the following purposes:
(i) To elect nine directors to serve until the 2021 annual meeting of shareholders;
(ii) To hold an advisory vote on executive compensation;
(iii) To ratify the appointment of Deloitte & Touche, LLP as the Company’s independent registered public accountantsfor fiscal 2020; and
(iv) To transact such other business as may properly come before the Annual Meeting or at any adjournment orpostponement thereof.
Important Notice Regarding the Availability of Proxy Materials for the Annual Meeting to be Held on January 24,2020. The proxy statement and annual report to shareholders are available at http://www.viewproxy.com/FranklinCovey/2020.
The Board of Directors has fixed the close of business on Friday, November 29, 2019 as the record date for the determinationof shareholders entitled to receive notice of and to vote at the Annual Meeting and at any adjournment or postponementthereof.
You are cordially invited to attend the Annual Meeting in person. To ensure that your vote is counted at the Annual Meeting,however, please vote as promptly as possible.
By Order of the Board of Directors,
/s/ Robert A. Whitman
Robert A. WhitmanChairman of the Board of DirectorsDecember 19, 2019
IMPORTANT
Whether or not you expect to attend the Annual Meeting in person, to assure that your shares will be represented,please promptly complete your proxy. Your proxy will not be used if you are present at the Annual Meeting and desireto vote your shares personally.

Franklin Covey Co.2200 West Parkway Boulevard
Salt Lake City, Utah 84119-2331
PROXY STATEMENT
Annual Meeting of ShareholdersJanuary 24, 2020
SOLICITATION OF PROXIES
This Proxy Statement is being made available to the shareholders of Franklin Covey Co., a Utah corporation (us, our,we, FranklinCovey, or the Company), in connection with the solicitation by the board of directors (the Board or Boardof Directors) of the Company of proxies from holders of outstanding shares of our Common Stock, $0.05 par valueper share (the Common Stock), for use at our Annual Meeting of Shareholders to be held on Friday, January 24, 2020,at 8:30 a.m., at the Hyrum W. Smith Auditorium, 2200 West Parkway Boulevard, Salt Lake City, Utah 84119-2331, and atany adjournment or postponement thereof. This Proxy Statement, the Notice of Annual Meeting of Shareholders, andthe accompanying form of proxy are first being mailed to shareholders of the Company on or about December 20, 2019.
PURPOSE OF THE ANNUAL MEETING
Shareholders of the Company will consider and vote on the following proposals: (i) to elect nine directors to serve untilthe next annual meeting; (ii) to hold an advisory vote on executive compensation; (iii) to ratify the appointment ofDeloitte & Touche, LLP (Deloitte) as our independent registered public accountants for the fiscal year ending August 31,2020; and (iv) to transact such other business as may properly come before the Annual Meeting or at any adjournmentor postponement thereof.
COSTS OF SOLICITATION
We will bear all costs and expenses relating to the solicitation of proxies, including the costs of preparation, assembly,printing, and mailing to shareholders this Proxy Statement and accompanying materials. In addition to the solicitation ofproxies by use of the mails, our directors, officers, and employees, without receiving additional compensation, maysolicit proxies personally or by telephone, facsimile, or electronic mail. Arrangements will be made with brokerage firmsand other custodians, nominees, and fiduciaries for the forwarding of solicitation materials to the beneficial owners ofthe shares of Common Stock held by such persons, and we will reimburse such brokerage firms, custodians, nominees,and fiduciaries for reasonable out-of-pocket expenses incurred by them in connection therewith.
INFORMATION ABOUT VOTINGWho can vote?
The only voting securities that we have outstanding are shares of our Common Stock. Our Board of Directors has fixedthe close of business on Friday, November 29, 2019 as the record date for determination of shareholders entitled tonotice of, and to vote at, the Annual Meeting (the Record Date). Only shareholders of record at the close of business onthe Record Date are entitled to vote at the Annual Meeting. As of the Record Date, there were 13,982,268 shares ofour Common Stock issued and outstanding. The holders of record of the shares of our Common Stock on the RecordDate are entitled to cast one vote per share on each matter submitted to a vote at the Annual Meeting.
11 Solicitation of Proxies/Voting Franklin Covey 2019 Annual Report

What is the difference between a shareholder of record and a “street name” holder?
If your shares are registered directly in your name with Zions Bank, our stock transfer agent, you are considered ashareholder of record with respect to those shares. If your shares are held in a stock brokerage account or by a bank orother nominee, you are considered the beneficial owner of those shares, but not the shareholder of record, and your sharesare held in “street name.” You are entitled to vote your shares whether you are the shareholder of record or you holdthe shares in street name.
How can you vote?
You may submit your proxy by mail, telephone, or the Internet. If you are submitting your proxy by mail, you shouldcomplete, sign, and date your proxy card and return it in the envelope provided. Sign your name exactly as it appears onthe proxy card. If you plan to vote by telephone or the Internet, voting instructions are printed on your proxy card. Ifyou hold your shares through an account with a brokerage firm, bank, or other nominee, please follow the instructionsyou receive from them to vote your shares. If you provide specific voting instructions, your shares will be voted asyou have instructed. Proxy cards submitted by mail must be received by our voting tabulator no later than January 23,2020 to be voted at the Annual Meeting. You may also vote in person at the Annual Meeting.
What if I do not specify on my proxy card how I want my shares voted?
Shares of Common Stock which are entitled to be voted at the Annual Meeting and which are represented by properlyexecuted proxies will be voted in accordance with the instructions indicated on such proxies. If no instructions areindicated, such shares will be voted (i) FOR the election of each of the nine director nominees (Proposal No. 1); (ii) FORthe proposal regarding an advisory vote on executive compensation (Proposal No. 2); (iii) FOR the ratification of theappointment of Deloitte as our independent registered public accountants for the fiscal year ending August 31, 2020(Proposal No. 3); and in the discretion of the proxy holders as to any other matters as may properly come before theAnnual Meeting or at any adjournment or postponement thereof. It is not currently anticipated that any other matterswill be presented at the Annual Meeting.
How do I vote at the Annual Meeting?
You may vote in person by written ballot at the Annual Meeting. However, if your shares are held in street name, youmust bring a legal proxy or other proof from that broker, trust, bank, or other nominee of your beneficial ownership ofthose shares as of the record date in order to vote at the Annual Meeting. If you vote by proxy and also attend theAnnual Meeting, you do not need to vote again at the Annual Meeting.
What are broker non-votes?
When a broker, bank, or other nominee has discretion to vote on one or more proposals at a meeting but does not havediscretion to vote on other matters at the meeting, the broker, bank, or other nominee will inform the inspector ofelection that it does not have the authority to vote on the “non-discretionary” matters with respect to shares held forbeneficial owners which did not provide voting instructions with respect to the “non-discretionary” matters. Thissituation is commonly referred to as a “broker non-vote.”
If my shares are held in street name, will my broker, bank or other nominee vote my shares for me?
Generally no. If you hold your shares in street name and do not give voting instructions to your broker, bank, or othernominee, then your broker, bank, or other nominee may only vote your shares with respect to “discretionary” matters,but may not vote your shares with respect to “non-discretionary” matters. Each of our proposals, except for ProposalNo. 3, the ratification of the appointment of our independent registered public accounting firm, are considered“non-discretionary” matters. As a result, if you hold your shares in street name, your broker, bank, or other nominee
Franklin Covey 2019 Annual Report Solicitation of Proxies/Voting 12

will not have discretion to vote your shares at the Annual Meeting, except for Proposal No. 3, if you do not providevoting instructions. Accordingly, it is important that street name holders give instructions to their broker, bank, or othernominee by following the voting instructions received from their broker, banker, or other nominee.
May I revoke my vote prior to the Annual Meeting?
Yes. A shareholder who has completed a proxy may revoke it at any time prior to its exercise at the Annual Meeting byreturning a proxy bearing a later date, by filing with the Secretary of the Company, at the address set forth below, awritten notice of revocation bearing a later date than the proxy being revoked, or by voting the Common Stock coveredthereby in person at the Annual Meeting.
What is a Quorum?
A quorum is the presence, in person or by proxy, of at least a majority of the shares of our Common Stock outstandingas of the close of business on the Record Date. A quorum is necessary to transact business at the Annual Meeting.Abstentions and “broker non-votes” will be included in determining the presence of a quorum at the Annual Meeting.Holders of common stock will vote as a single class. If there are not sufficient shares represented for a quorum, then theAnnual Meeting may be adjourned or postponed from time to time until a quorum is established.
What Vote is Required for a Proposal to be Approved?
Subject to the paragraph below, the nine nominees receiving the highest number of affirmative votes of the sharesentitled to be voted for them, up to the nine directors to be elected by those shares, will be elected as directors to serveuntil the next annual meeting of shareholders and until their successors are duly elected and qualified. Abstentionsand broker non-votes will have no effect on the election of directors.
Pursuant to the Company’s bylaws, any nominee for director who receives a greater number of votes “withheld” or“against” from his or her election than votes “for” his or her election shall immediately offer to tender his or herresignation following certification of such shareholder vote. The Nominating and Governance Committee shall promptlyconsider the director’s resignation offer and make a recommendation to the Board of Directors on whether to acceptor reject the offer. The Board of Directors shall act on the recommendation of the Nominating and GovernanceCommittee and publicly disclose its decision within 90 days following certification of the shareholder vote.
Approval of Proposal No. 2, the advisory vote on executive compensation, requires that the number of votes cast infavor of the proposal exceeds the number of votes cast in opposition. Abstentions and broker non-votes are notconsidered votes cast for the foregoing purpose and will not have any effect on the outcome of this proposal.
The ratification of the appointment of Deloitte as our independent registered public accountants (Proposal No. 3)requires that the number of votes cast in favor of the proposal exceeds the number of votes cast in opposition. Abstentionsand broker non-votes will not have any effect on the outcome of this proposal.
What are the Board’s voting recommendations?
The Board of Directors recommends that you vote “FOR” proposal nos. 1, 2, and 3, as further described in this ProxyStatement.
The Company’s Principal Office and Main Telephone Number
Our principal executive offices are located at 2200 West Parkway Blvd., Salt Lake City, Utah 84119-2331 and our maintelephone number is (801) 817-1776.
13 Solicitation of Proxies/Voting Franklin Covey 2019 Annual Report

BOARD OF DIRECTORS AND CORPORATE GOVERNANCENominees for Election to the Board of Directors
Our Board currently consists of nine directors, seven of whom are considered independent. Nominees for election tothe board of directors shall be elected to serve until the next annual meeting of shareholders or until their successors shallhave been elected and qualified or until such director’s earlier death, resignation, or removal. At the Annual Meeting,proxies cannot be voted for a greater number of individuals than the nine nominees named in this Proxy Statement.
Our directors have significant experience with our business and are familiar with the risks and competition we face, whichallow them to participate actively and effectively in Board and committee discussions and deliberations. Our directorsmeet and speak frequently with each other and with members of our senior management team. These formal meetingsand informal discussions occur based on the needs of our business and the market environment.
The Nominating and Governance Committee of the Board (the Nominating Committee) and the Board believe theskills, qualities, attributes, and experiences of its directors provide the Company with the business acumen and rangeof perspectives to engage each other and management to effectively address our evolving needs and represent the bestinterests of our shareholders. In addition, the Board firmly believes that the experience, attributes, and skills of anysingle director should not be viewed in isolation, but rather in the context of the experience, attributes, and skills thatall director nominees bring to the Board as a whole, each of whom contributes to the function of an effective Board. Thebiographies below describe the skills, qualities, attributes, and experiences of each of the nominees that led the Boardto determine that it is appropriate to nominate these directors for election.
Anne H. Chow, 53
Independent DirectorDirector Since: March 2016Committees: Chair of Growth Committee and member of the Nominating andGovernance and Innovations committeesOther Directorships: None
Ms. Chow is currently Chief Executive Officer (CEO) of AT&T Business at AT&TCommunications. As CEO of AT&T Business, Anne is responsible for the company’sBusiness Solutions organization, which serves nearly 3 million business customers in morethan 200 countries and territories around the world, including nearly all of the world’sFortune 1000 companies. Ms. Chow’s responsibilities include all of AT&T’s businessservices across wireless, networking, cybersecurity, and advanced solutions, covering morethan $35 billion in revenues. Since 2000, Ms. Chow has held a variety of leadershippositions at AT&T, including Senior Vice President – Global Solutions and SalesOperations and Senior Vice President – Premier Client Group. With decades ofexperience in the industry, Ms. Chow has led many global organizations through majortransformations, developing and executing innovative growth strategies while building rolemodel relationships. Anne is passionate about education, diversity and inclusion,advancing women in technology, and cultivating next generation leaders.
A long standing, active member of the community, Anne has previously served on theboards of the AT&T Foundation, Hunterdon Healthcare System, New Jersey Chamber ofCommerce, Asian and Pacific Islander American Scholarship Fund, Asian AmericanJustice Center, and the Joint Center for Political and Economic Studies. Ms. Chowcurrently serves on the Georgia Tech Parents Board, and as a member of the NationalBoard of Directors for the Girl Scouts of the USA.
Ms. Chow holds a Master’s Degree in Business Administration with Distinction fromThe Johnson School at Cornell University, as well as a Bachelor of Science Degree andMasters of Engineering Degree in Electrical Engineering from Cornell University. Anneis also a graduate of the Pre-College Division of the Juilliard School of Music.
Franklin Covey 2019 Annual Report Nominees for Election 14

Director Qualif ications: The Company believes that Ms. Chow’s strong sales andenterprise relationship background as well as her extensive distribution and globalleadership experience provide valuable insight and skills to our Board of Directors.Ms. Chow’s significant involvement with various other entities throughout her careerprovides her with wide-ranging perspective and experience in the areas of management,operations, and marketing.
Clayton M. Christensen, 67
Independent DirectorDirector Since: March 2004Committees: NoneOther Directorships: None
Dr. Christensen is the Kim B. Clark Professor of Business Administration at the HarvardBusiness School, where he has been a faculty member since 1992. Clayton’s research andteaching interests center on building new growth businesses and sustaining the success ofcompanies. Dr. Christensen was a Rhodes Scholar and received his Masters of PhilosophyDegree from Oxford and his MBA and DBA from the Harvard Business School. Claytonalso served as President and Chairman of CPS Technologies from 1984 to 1989, and from1979 to 1984 he worked as a consultant and project manager for the Boston ConsultingGroup. Dr. Christensen is the founder of Rose Park Advisors, Innosight LLC, and theChristensen Institute.
Director Qualif ications: Dr. Christensen is widely recognized as a leader in developingorganizational capabilities of companies, and his research, knowledge, and valuable insightsenable him to make significant contributions to our strategic direction and to thedevelopment of new training and consulting services. Additionally, Clayton’s previous workwith various companies provides him with a broad perspective in the areas of managementand operations.
Michael Fung, 69
Independent DirectorDirector Since: July 2012Committees: Chair of the Audit Committee and a member of all other standing committeesOther Directorships: 99 Cents Only Stores, LLC, and Floor and Décor Holdings, Inc.
Mr. Fung served as the interim Chief Financial Officer for JC Penney Co. from October2018 through April 2019 and as the interim Chief Operating Officer and Chief FinancialOfficer for the Neiman Marcus Group from November 2016 through June 2017. Prior tothese appointments, Michael retired from Wal-Mart Stores, Inc. in 2012, after 11 years ofservice. Mr. Fung was the Senior Vice-President and Chief Financial Officer of Wal-MartU.S., a position he held from 2006 through his retirement in February 2012. From 2001 to2003, Mr. Fung served as Vice President of Finance and Administration for GlobalProcurement and was promoted in 2003 to Senior Vice President and Chief AuditExecutive. In his previous roles with Wal-Mart, Michael was responsible for U.S. financeoperations, including strategy, merchandising, logistics, real estate, operations, professionalservices, and financial planning and analysis. Prior to his experience at Wal-Mart, Mr. Fungheld financial leadership positions at Universal Foods Corporation, Vanstar Corporation,Bass Pro Shops, Inc., and Beatrice Company. Michael received his bachelor’s degree inaccounting from the University of Illinois and an MBA from the University of Chicago.Mr. Fung is a Certified Public Accountant (inactive) in the state of Illinois, a member ofThe Committee of 100, and the University of Illinois Foundation. Michael is also a BoardLeadership Fellow with the National Association of Corporate Directors.
15 Nominees for Election Franklin Covey 2019 Annual Report

Director Qualif ications: Mr. Fung’s extensive financial background and expertise, as well asinternational leadership experience, provides him with wide-ranging knowledge andexperience. His professional involvement in various capacities during his career enabledMr. Fung to gain experience in many areas including auditing, internal control, financialplanning, organizational development, strategic planning, and corporate governance.Michael’s substantial financial knowledge and leadership experience qualify him to be anaudit committee financial expert and enable him to make valuable contributions to ourBoard of Directors and on the Audit Committee.
Dennis G. Heiner, 76
Lead Independent DirectorDirector Since: January 1997Committees: Chair of the Nominating Committee and member of all other standingcommitteesOther Directorships: None
Mr. Heiner currently serves as a Managing Member of Sunrise Oaks Capital Fund, LLC, asmall private bridge loan financing fund. Mr. Heiner served from 1999 to 2004 as Presidentand Chief Executive Officer of Werner Holding Co., a leading manufacturer of climbingproducts and aluminum extrusions. Prior to joining Werner, he was employed by Black &Decker Corporation from 1985 to 1999 where he served for 6 years as Senior Vice Presidentand President Worldwide Small Electric Appliances, and later as Executive Vice Presidentand President of the Hardware and Home Improvement Group, a world leader in residentialdoor hardware and plumbing fixtures. From 1979 to 1985, Mr. Heiner was employed byBeatrice Foods where he served as a Division President. From 1972 to 1979, Dennis wasemployed by Conroy Inc., a manufacturer of recreational vehicles, where he held thepositions of Director of Marketing and Vice President of Finance and InternationalMarketing. Mr. Heiner has also served on several other boards including Rayteck, Shell Oil’sAERA Board, and Werner Holdings. Mr. Heiner received his Bachelor of Arts degree fromWeber State University and his MBA degree from Brigham Young University. He alsocompleted executive programs at Northwestern’s Kellogg School of Management and theHarvard Business School.
Director Qualif ications: Mr. Heiner brings to the Board of Directors chief executiveleadership and business management experience, as well as strong operational knowledgeand expertise. Mr. Heiner’s broad industry experience, including previous roles in leadership,finance, and marketing, provides the Board of Directors with valuable contributions in theareas of management, strategy, leadership, governance, growth, and long-term planning.Mr. Heiner’s executive leadership experience and strong business background enable him toprovide strong and independent leadership on the Board of Directors in his role as LeadIndependent Director. Dennis also makes important contributions to our Company in theareas of board and business leadership development and succession planning.
Franklin Covey 2019 Annual Report Nominees for Election 16

Donald J. McNamara, 66
Independent DirectorDirector Since: June 1999Committees: NoneOther Directorships: Crow Holdings and A&O Hotels & Hostels
Mr. McNamara is the founder of The Hampstead Group, LLC (The Hampstead Group), aprivate equity investor based in Dallas,Texas, and has served as its Chairman since itsinception in 1989.He has over 35 years of successful investment experience, including BassBrothers Enterprises, Marriott Corporation, and JMB Realty. Mr. McNamara currentlyserves as a Senior Advisor to TPG’s real estate platform, which includes $8 billion of assetscollectively in its equity and debt platforms. Mr. McNamara received an undergraduatedegree in architecture from Virginia Tech in 1976 and an MBA from Harvard University in1978.
Director Qualif ications: Mr. McNamara’s experience in private equity provides him withconsiderable expertise in financial and strategic matters.This expertise enables him to makevaluable contributions to the Company in the areas of raising capital, capital deployment,acquisitions and dispositions, and other major financial decisions. Don’s involvement withother entities throughout his career provides him with wide-ranging perspective andexperience in the areas of management, operations, and strategy. In addition, Mr. McNamarahas a meaningful understanding of our operations having served on our Board of Directorsfor over 20 years, enabling him to make contributions to our strategy, innovation, andlong-range plans.
Joel C. Peterson, 72
DirectorDirector Since: May 1997Committees: NoneOther Directorships: Chairman of the Board at JetBlue Airways (NASDAQ), and Director atPacksize
Mr. Peterson has been on the faculty of the Graduate School of Business at StanfordUniversity since 1992, teaching courses in real estate investment, entrepreneurship, andleadership. Joel is the former Chairman of the Board of Overseers at the Hoover Institutionat Stanford, and is the Founding Partner and Chairman of Peterson Partners, a Salt LakeCity-based investment management firm which has invested in over 200 companies through13 funds in four primary asset classes: growth-oriented private equity, venture capital, realestate, and search funds. Prior to Stanford Business School and founding Peterson Partners,Mr. Peterson was Chief Executive Officer of Trammell Crow Company, then the world’slargest private commercial real estate development firm. Mr. Peterson earned an MBA fromHarvard University and received his bachelor’s degree from Brigham Young University.
Director Qualif ications: Mr. Peterson brings chief executive leadership, extensive financialexperience, and strong academic skills to our Board of Directors. Mr. Peterson’s roles inexecutive leadership, financial management, and private equity enable him to make keycontributions in the areas of leadership, raising capital, capital deployment, strategy,operations, and growth. His experience with Peterson Partners and teaching courses onentrepreneurship adds valuable knowledge in growth and long-term strategic planning aswell as accessing and deploying capital. Joel also has a deep understanding of the Company’soperations and background with over 20 years of experience on our Board of Directors.Further, prior to the FranklinCovey merger, Mr. Peterson served as a director of CoveyLeadership Center from 1993 to 1997.
17 Nominees for Election Franklin Covey 2019 Annual Report

E. Kay Stepp, 74
Independent DirectorDirector Since: May 1997Committees: Chair of the Organization and Compensation Committee and member of allother standing committeesOther Directorships: None
Ms. Stepp, a retired executive, is the former Chairperson of the Board of Providence Healthand Services, and served as President and Chief Operating Officer of Portland GeneralElectric, an electric utility, from 1978 to 1992. She formerly was principal of ExecutiveSolutions, an executive coaching firm, from 1994 to 2001, and was a director of the FederalReserve Bank of San Francisco from 1991 to 1995. Ms. Stepp also served as a director of theCovey Leadership Center from 1992 to 1997 and has served as a director of numerous otherpublic and private company boards. Kay received her Bachelor of Arts degree from StanfordUniversity and a Master of Arts in Management from the University of Portland. Ms. Steppalso attended the Stanford Executive Program and the University of Michigan ExecutiveProgram.
Director Qualif ications: Ms. Stepp’s experience in management and as chief operatingofficer brings valuable knowledge to the Board of Directors in areas such as marketing,distribution, human resources, technology, and administration. Ms. Stepp also brings theCompany extensive governance experience with public corporations, private corporations,and non-profit organizations.This background and experience allow Ms. Stepp to makevaluable contributions to the Board of Directors in the areas of operations, management,compensation, and organizational development. Kay also brings special expertise andexperience in human resource management and compensation from her consulting career,which provides her with the knowledge to serve as the chairperson of the Board’sCompensation and Organization Committee. Ms. Stepp has a deep understanding of ouroperations and long-term goals from her years of experience on the Board of Directors.
Derek C.M. van Bever, 62
Independent DirectorDirector Since: September 2019Committees: Chair of the Innovations Committee and member of the Growth CommitteeOther Directorships: None
On September 9, 2019, Mr. Derek C.M. van Bever was appointed to our Board of Directors.Mr. van Bever is a Senior Lecturer in the General Management Unit at the HarvardBusiness School. Derek teaches courses in the Harvard MBA program, including“Leadership and Corporate Accountability” and “Building and Sustaining a SuccessfulEnterprise,” and he is the faculty lead for Dr. Clay Christensen’s Executive Education courseentitled “Disruptive Innovation.” Mr. van Bever is also the Director of the Forum forGrowth and Innovation, a research project sponsored by Professor Christensen that isfocused on discovering, developing, and disseminating predictive theory on managementand innovation.
In 1983, Derek co-founded The Advisory Board Company (NASDAQ: ABCO), a globalresearch, consulting, and technology firm serving hospital and university executives, and wasa member of the founding executive team of The Corporate Executive Board (NYSE:CEB), a global thought leadership and advisory network, which spun out of the AdvisoryBoard Company in a 1999 Initial Public Offering. Following the IPO, Mr. van Beveroversaw the development and launch of Corporate Executive Board’s new practice areas andhe led the development of the firm’s internal corporate academy. Derek also co-authored thebook Stall Points, an analysis of the growth experience of the Fortune 100 across the pasthalf-century, which was published by Yale University Press in 2008.
Franklin Covey 2019 Annual Report Nominees for Election 18

Derek received his Masters of Business Administration from the Harvard Business Schoolin 1988, and is a 2011 graduate of Harvard Divinity School. His divinity school thesis,“A Mission Beyond Commerce,” examines the challenges to personal and corporate missionposed by pivot points such as a change of ownership or leadership transition and suggestspractices and disciplines for retaining a sense of perspective in the “high hurry” of businesslife.
Director Qualif ications: Mr. van Bever brings experience in thought leadership and expertisein business growth, innovation, subscription businesses, and strategy to our Board ofDirectors. In his role as Chief Research Officer for the Corporate Executive Board, Derekdirected teams studying best practices in strategy, innovation, talent management, finance,and governance in the large-corporate sector worldwide.The Company believes Mr. vanBever’s experience and thought leadership make him a valuable addition to its Board ofDirectors. Mr. Whitman recommended Mr. van Bever to the Nominating Committee forconsideration as a Board member.
Robert A. Whitman, 66
Chair of the Board of Directors and Chief Executive OfficerDirector Since: May 1997Committees: NoneOther Directorships: Charles River Associates (NASDAQ), and Greystar Real Estate
Mr. Whitman has served as the Chairman of the Board of Directors since June 1999 and asour Chief Executive Officer since January 2000. Mr. Whitman previously served as adirector of the Covey Leadership Center from 1994 to 1997. Prior to joining us,Mr. Whitman served as President and Co-Chief Executive Officer of The HampsteadGroup from 1992 to 2000 and is a founding partner at Whitman Peterson. Bob received hisBachelor of Arts Degree in Finance from the University of Utah and his MBA from theHarvard Business School.
Director Qualif ications: Mr. Whitman’s leadership experience as the Chief ExecutiveOfficer of the Company and his in-depth knowledge of our strategic priorities andoperations enable him to provide valuable contributions and facilitate effectivecommunication between management and the Board of Directors. Mr. Whitman’s role asChief Executive Officer also enables him to provide important contributions tostrengthening our leadership, operations, strategy, growth and long-range plans.Mr. Whitman’s extensive experience in finance, private equity investing, and leadership alsoprovides him with the knowledge to make valuable contributions to the Board of Directorsin the areas of finance, raising capital, and capital deployment.
19 Nominees for Election Franklin Covey 2019 Annual Report

Corporate Governance
FranklinCovey upholds a set of basic values and principles to guide our actions, and we are committed to maintainingthe highest standards of business conduct and corporate governance. Our emphasis on corporate governance begins atthe top, with our directors, who are elected by, and are accountable to you, our shareholders. This commitment togovernance extends to our management team and to all of our employees. We have adopted a Code of Business Conductand Ethics for our directors, officers, and senior financial officers that include the Chief Executive Officer and ChiefFinancial Officer (CFO) and other members of our financial leadership team. The Corporate Governance Guidelines andCode of Business Conduct and Ethics are available on our website at www.franklincovey.com. In addition, each of theCorporate Governance Guidelines and the Code of Business Conduct and Ethics are available in print free of charge toany shareholder by making a written request to Investor Relations, Franklin Covey Co., 2200 West Parkway Boulevard,Salt Lake City, Utah 84119-2331. The Code of Business Conduct and Ethics applies to all directors, officers, andemployees of FranklinCovey.
A feature of our corporate governance is that our standing committees are comprised of independent directors, asdiscussed below. We believe this structure allows for a collective focus by a majority of our independent directors onthe various complex matters that come before Board committees. The overlap inherent in this structure assists theseindependent directors in the execution of their responsibilities.
Board Oversight
Our Board is responsible for and committed to the independent oversight of the business and affairs of our Company,including financial performance, CEO performance, succession planning, strategy, risk management, and compensation.In carrying out this responsibility, the Board advises our CEO and other members of our senior management team tohelp drive success for our clients and long-term value creation for our shareholders.
Affirmative Determination Regarding Board Independence
The Board of Directors has determined each of the following directors to be an “independent director” under thelisting standards of the New York Stock Exchange (NYSE): Anne H. Chow, Clayton M. Christensen, Michael Fung,Dennis G. Heiner, Donald J. McNamara, E. Kay Stepp, and Derek Van Bever.
In assessing the independence of the directors, the Board of Directors determines whether or not any director has amaterial relationship with us (either directly, or as a partner, shareholder, or officer of an organization that has arelationship with us). The Board of Directors considers all relevant facts and circumstances in making independencedeterminations, including the director independence standards adopted by the Board of Directors and the existence ofrelated party transactions as described in the section entitled “Certain Relationships and Related Transactions” foundin this report.
Board Leadership Structure
Under our current leadership structure, we have a combined position of Chairman and CEO and an independentdirector serving as a Lead Independent Director. The Board of Directors does not have a policy on whether the roles ofChairman and CEO should be separate or combined. Our Board assesses these roles and deliberates the merits of itsleadership structure to ensure that the most efficient and appropriate structure is in place. The Board of Directors hasdetermined that if the Chairman is not an independent director, then there should also be a Lead Independent Director.
Our Board believes that combining the roles of Chairman and CEO is currently the most effective leadership structurefor our Company. Combining these roles ensures that our Company has a single leader who speaks with one voice toour shareholders, clients, employees, regulators, other stakeholders, and to the broader public. Our current CEO,Mr. Whitman, has significant knowledge of, and experience in, our business, industry, operations, and risks, whichaffords him the insight necessary to guide discussions at Board meetings. Mr. Whitman also provides our Board withupdates on significant business developments and other time-sensitive matters.
Franklin Covey 2019 Annual Report Corporate Governance 20

As CEO, Mr. Whitman is directly accountable to our Board and, through our Board, to our shareholders. His role asChairman is both counterbalanced and enhanced by the overall independence of the Board and independent leadershipprovided by our Lead Independent Director, Mr. Heiner. Mr. Heiner, as Chairman of our Nominating Committee, wasdesignated as the Lead Independent Director by our Board. Our independent directors may elect another independentdirector as Lead Independent Director at any time. Mr. Whitman and Mr. Heiner meet and speak frequently regardingour Board and our Company.
The Board of Director’s Role in Risk Management Oversight
The Audit Committee of our Board of Directors has responsibility for the oversight of risk management, while ourmanagement team is responsible for the day-to-day risk management process. With the oversight of the Board ofDirectors, management has developed an enterprise risk management strategy, whereby management identifies the topindividual risks that we face with respect to our business, operations, strategy, and other factors that were recognizedafter discussions with key business and functional leaders and reviews of external information. In addition to evaluatingvarious key risks, management identifies ways to manage and mitigate such risks. During fiscal 2019, managementmet regularly with the Audit Committee to discuss the identified risks and the efforts that are designed to mitigate andmanage these risks. These risks are allocated to the various committees of the Board of Directors to allow the committeesto examine a particular risk in detail and assess its potential impact to our operations. For example, the Audit Committeereviews compliance and risk management processes and practices related to accounting and financial reporting matters;the Nominating Committee reviews the risks related to succession planning and the independence of the Board ofDirectors; and the Organization and Compensation Committee (the Compensation Committee) reviews the risks relatedto our various compensation plans. In the event that a committee is allocated responsibility for examining and analyzinga specific risk, such committee reports on the relevant risk exposure during its regular reports to the entire Board ofDirectors.
As part of its responsibilities, the Compensation Committee periodically reviews our compensation policies andprograms to ensure that the compensation programs offer appropriate performance incentives for employees, includingexecutive officers, while mitigating excessive risk taking. We believe that our various compensation programs containprovisions that discourage excessive risk taking. These provisions include:
• An appropriate balance between annual cash compensation and equity compensation that may be earned overseveral years.
• Metrics that are weighted between the achievement of overall financial goals and individual objectives.
• Stock ownership guidelines that encourage executive officers to accumulate meaningful levels of equity ownership,which align the interests of executives with those of long-term shareholders.
Based on a review of the nature of our operations by the Compensation Committee, we do not believe that any areas ofthe Company are incented to take excessive risks that would likely have a material adverse effect on our operations.
BOARD OF DIRECTOR COMMITTEES AND MEETINGS
Our Board has three standing committees: Audit, Corporate Governance and Nominating, and Organization andCompensation. The specific membership of each committee allows us to take advantage of our directors’ diverse skillsets, which enables deep focus on committee matters.
21 Committees Franklin Covey 2019 Annual Report

The following table shows the current membership of each of our standing committees.
Director Audit Nominating Compensation
Anne H. Chow — —
Clayton M. Christensen — — —
Michael Fung
Dennis G. Heiner
Donald J. McNamara — — —
Joel C. Peterson — — —
E. Kay Stepp
Derek van Bever — — —
Robert A. Whitman — — —
Committee ChairpersonCommittee Member
The Board of Directors has adopted a written charter for each of the standing committees, which are reviewed annually.These charters are available on our website at www.franklincovey.com. Shareholders may obtain a printed copy of anyof these charters free of charge by making a written request to Investor Relations, Franklin Covey Co., 2200 West ParkwayBoulevard, Salt Lake City, Utah 84119-2331.
The Audit Committee
The Audit Committee functions on behalf of the Board of Directors in accordance with Section 3(a)(58)(A) of theSecurities Exchange Act of 1934, as amended (the Exchange Act). The Audit Committee’s primary functions are to:
• assist our Board in its oversight of our financial statements, legal and regulatory compliance, independent auditors’qualification, independence, internal audit function performance, and internal controls over financial reporting;
• decide whether to appoint, retain, or terminate our independent auditors;
• pre-approve all audit, audit-related, tax, and other services, if any, to be provided by the independent auditors; and
• prepare the Audit Committee Report.
The Audit Committee is chaired by Mr. Fung, and each of the members of the Audit Committee is independent asdescribed under NYSE rules and meets the enhanced independence standards established by Rule 10A-3 promulgatedunder the Exchange Act. The Board of Directors has determined that one of the Audit Committee members, MichaelFung, is an “audit committee financial expert” as defined in Item 407(d)(5)(ii) of Regulation S-K.
The Nominating Committee
The Corporate Governance and Nominating Committee is chaired by Mr. Heiner. The primary purposes of theNominating Committee are to:
• recommend individuals for nomination, election, or appointment as members of our Board and its committees;
Franklin Covey 2019 Annual Report Committees 22

• oversee the evaluation of the performance of our Board and its committees and our management;
• ensure that our committees are comprised of qualified and experienced independent directors;
• review and concur in the succession plans for our CEO and other members of senior management; and
• take a leadership role in shaping our corporate governance, including developing, recommending to the Board, andreviewing on an ongoing basis the corporate governance principles and practices that apply to our Company.
In carrying out the responsibilities of the Nominating Committee, Mr. Heiner frequently met or had discussions withour CEO during the fiscal year. All of the members of the Nominating Committee are “independent” as defined underNYSE rules.
The Organization and Compensation Committee
We are in a business that relies heavily on our people for a competitive advantage. As a result, our Organization andCompensation Committee plays a pivotal role in enabling us to attract and retain the best talent for the growth andstrategic needs of our Company.
The Compensation Committee is chaired by Ms. Stepp and regularly met without any employees present to discussexecutive compensation matters, including Mr. Whitman’s compensation package, during fiscal 2019. The primaryfunctions of the Compensation Committee are to:
• determine and approve the compensation of our CEO and other executive officers;
• review and make recommendations to the Board for any incentive compensation and equity-based plans that aresubject to Board approval;
• assist our Board in its oversight of the development, implementation, and effectiveness of our policies and strategiesrelating to our human capital management, including recruiting, retention, career development and progression,diversity, and employment practices;
• review management development plans and succession plans to ensure business continuity (other than that withinthe purview of the Nominating Committee);
• provide risk oversight of all Company compensation plans;
• review periodically the form and amount of non-employee director compensation and make recommendations toour Board with respect thereto; and
• prepare the Compensation Committee Report.
All of the Compensation Committee members are “independent” as defined under the NYSE enhanced independencestandards. As described below in “Compensation Committee Interlocks and Insider Participation” and “CertainRelationships and Related Transactions,” none of the Compensation Committee members had any material businessrelationships with the Company, other than the share repurchase transaction with Ms. Stepp described under “RelatedParty Transactions” below.
The Compensation Committee administers all elements of our executive compensation program, including ourstock-based long-term incentive plans. In consultation with the Compensation Committee, Mr. Whitman annuallyreviews and establishes compensation for the other Named Executive Officers (as defined below). The CompensationCommittee regularly reports to the full Board on decisions related to the executive compensation program.
Compensation Consultants
Within its charter, the Compensation Committee has the authority to engage the services of outside advisors, experts,and others to assist the committee. During fiscal 2019, the Compensation Committee engaged Mercer as compensationconsultants. These compensation consultants provided information to the Compensation Committee regarding
23 Committees Franklin Covey 2019 Annual Report

stock-based compensation plans, executive compensation, and director compensation that were used as componentsof the overall mix of information used to evaluate our compensation plans. The Compensation Committee reviewed itsrelationship with Mercer and has determined that its work has not raised any conflicts of interest. Further informationregarding the role of these compensation consultants can be found in the Compensation Discussion and Analysis.
Compensation Committee Interlocks and Insider Participation
No member of the Compensation Committee was or is an officer or employee of the Company or any of our subsidiaries.
New Board Committees
During late fiscal 2019, our Board of Directors established two new supplemental committees to leverage the skills andabilities of our Directors to achieve specific objectives. These new committees do not have a charter and are notrequired by Securities and Exchange Commission rules or Company bylaws. The following is a brief description ofthese new committees.
Growth Committee
We believe that our best-in-class offerings, combined with flexible delivery modalities and worldwide sales anddistribution capabilities are the foundation for future growth at Franklin Covey. Our Growth Committee is designed toassist our management with strategic guidance over growth initiatives and the execution of these initiatives to driveincreased sales and shareholder return. Ms. Chow is the Chair of the Growth Committee and will be joined by Mr. vanBever as a member of the committee. We believe the experience and skills of these directors will provide valuablestrategic direction to the Company’s growth objectives.
Innovations Committee
Franklin Covey’s vision is to profoundly impact the way billions of people throughout the world live, work, and achievetheir own great purposes. We believe ongoing investment in our existing content and new offerings is key to ourefforts to achieve this vision. The Innovations Committee is designed to provide strategic direction in our efforts toexpand our content and offerings into areas that will provide meaningful results for clients and new growth opportunities.Mr. van Bever is the Chair of the Innovations Committee and Ms. Chow and Mr. Heiner are members of this newcommittee. We believe the knowledge and experience of the directors on the Innovations Committee will providemeaningful direction to the development of our offerings and services.
Commitment of our Directors
Our Board and its standing committees met regularly during fiscal 2019 as shown below.
MeetingsBoard 4Audit 8Nominating 4Compensation 5
In addition to the formal meetings shown above, our Board regularly participated in informal update calls with membersof our executive management as necessary throughout fiscal 2019.
Our Lead Independent Director plays an active role on our Board of Directors. Mr. Heiner reviews the agenda, schedule,and materials for each Board and Nominating Committee meeting and presides over executive sessions of the independentdirectors. Any independent director may call for an executive session and suggest agenda items for Board or committeemeetings.
Franklin Covey 2019 Annual Report Committees 24

All of the members of our Board of Directors were able to attend at least 75 percent of the Board and committeemeetings for which they were entitled to participate except for Ms. Chow and Mr. Christensen. Ms. Chow was unableto attend some committee meetings during fiscal 2019 due to scheduling conflicts associated with her significant newresponsibilities as CEO of AT&T Business, but was in attendance for at least 75 percent of full Board meetings.Mr. Christensen was unable to attend the Board meetings due to ongoing serious health challenges. We believe thatthese Board members continue to provide meaningful insight and experience to our Board of Directors. Although weencourage Board members to attend our Annual Meeting, we do not have a formal policy regarding director attendanceat our annual shareholder meetings. Seven members of our Board of Directors attended our most recent annualmeeting of shareholders, which was held in January 2019.
Director Nomination Process
As indicated above, the Nominating Committee of the Board of Directors oversees the director nomination process.The Nominating Committee is responsible for identifying and evaluating candidates for membership on the Board ofDirectors and recommending to the Board of Directors nominees to stand for election. Each candidate to serve on theBoard of Directors must be able to fulfill the responsibilities for directors set out in the Corporate Governance Guidelinesapproved by the Board of Directors. These Corporate Governance Guidelines may be found on our website atwww.franklincovey.com. In addition to the qualifications set forth in the Corporate Governance Guidelines, nomineesfor director will be selected on the basis of such attributes as their integrity, experience, achievements, judgment,intelligence, personal character, ability to make independent analytical inquiries, willingness to devote adequate timeto Board duties, and the likelihood that he or she will be able to serve on the Board for a sustained period. In connectionwith the selection of nominees for director, consideration will be given to the Board’s overall balance of diversity ofperspectives, backgrounds, and experiences. We believe it is important to have an appropriate mix of diversity for theoptimal functionality of the Board of Directors. Although we do not have a formal diversity policy relating to theidentification and evaluation of nominees for director, the Nominating Committee considers all of the criteria describedabove in identifying and selecting nominees and in the future may establish additional minimum criteria for nominees.
Although not an automatically disqualifying factor, the inability of a director candidate to meet independence standardsof the NYSE will weigh negatively in any assessment of a candidate’s suitability.
The Nominating Committee intends to use a variety of means of identifying nominees for director, including outsidesearch firms, recommendations from current Board members, and recommendations from shareholders. In determiningwhether to nominate a candidate, the Nominating Committee will consider the current composition and capabilitiesof serving Board members, as well as additional capabilities considered necessary or desirable in light of existingCompany needs and then assess the need for new or additional members to provide those capabilities.
Unless well known to one or more members of the Nominating Committee, normally at least one member of theNominating Committee will interview a prospective candidate who is identified as having high potential to satisfy theexpectations, requirements, qualities, and capabilities for Board membership.
Shareholder Nominations
The Nominating Committee, which is responsible for the nomination of candidates for appointment or election to theBoard of Directors, will consider, but shall not be required to nominate, candidates recommended by our shareholderswho beneficially own at the time of the recommendation not less than one percent of our outstanding stock (QualifyingShareholders).
Generally speaking, the manner in which the Nominating Committee evaluates nominees for director recommendedby a Qualifying Shareholder will be the same as for nominees from other nominating sources. However, the NominatingCommittee will seek and consider information concerning the relationship between a Qualifying Shareholder’s nomineeand that Qualifying Shareholder to determine whether the nominee can effectively represent the interests of allshareholders.
25 Committees Franklin Covey 2019 Annual Report

Qualifying Shareholders wishing to make recommendations to the Nominating Committee for its consideration maydo so by submitting a written recommendation, including detailed information on the proposed candidate, includingeducation, professional experience, and expertise, via mail addressed as follows:
Franklin Covey Co.c/o Stephen D. Young, Corporate Secretary2200 West Parkway BoulevardSalt Lake City, UT 84119-2331
Communications with Directors
Shareholders or other interested parties wishing to communicate directly with the Board of Directors or thenon-management directors as a group, may contact the Lead Independent Director directly via e-mail [email protected]. Our audit committee chairman may also be contacted directly via e-mail [email protected]. You may also contact members of the Board in writing by addressing thecorrespondence to that individual or group, c/o Stephen D. Young, Corporate Secretary, Franklin Covey Co., 2200 WestParkway Boulevard, Salt Lake City, Utah 84119-2331. All such written communications will initially be received andprocessed by the office of the Corporate Secretary. Depending on the nature of the correspondence, the Secretary orAssistant Secretary will initially review such correspondence and either (i) immediately forward the correspondence tothe indicated director and to the Chair of the Nominating Committee, or (ii) hold for review during the next regularmeeting of the Board of Directors.
Fiscal 2019 Director Compensation
Director compensation is set by the Organization and Compensation Committee and approved by the Board of Directors.The Company’s management does not play a role in setting Board Compensation. We compensate members of theBoard of Directors using a combination of cash and equity-based compensation. Robert A. Whitman, our Chairman ofthe Board of Directors and CEO, does not currently receive compensation for his service as a director. The compensationreceived by Mr. Whitman for his role as Chairman and CEO is shown in the Fiscal 2019 Summary Compensation Table,contained in the Executive Compensation section of this proxy statement.
During fiscal 2019, the other directors were paid the following amounts for services provided:
Compensation Element AmountAnnual restricted stock award $100,000Annual cash retainer 40,000Committee retainer, paid for service on each committee 10,000Lead independent director annual retainer 30,000Audit committee chairperson annual retainer 15,000Compensation committee chairperson annual retainer 10,000Nominating committee chairperson annual retainer 5,000
Directors were reimbursed by the Company for their out-of-pocket travel and related expenses incurred in attendingall Board and committee meetings.
Franklin Covey 2019 Annual Report Committees 26

Fiscal 2019 Director Compensation Table
A B C D E F G H
Name
Feesearnedor paidin cash
($)
Stockawards
($)
OptionAwards
($)
Non-EquityIncentive PlanCompensation
($)
Change inpension value
and nonqualifieddeferred
compensationearnings
($)
All otherComp
($)Total
($)Anne H. Chow 70,000 100,000 — — — — 170,000Clayton M. Christensen 40,000 100,000 — — — — 140,000Michael Fung 85,000 100,000 — — — — 185,000Dennis G. Heiner 105,000 100,000 — — — — 205,000Joel C. Peterson 40,000 100,000 — — — — 140,000E. Kay Stepp 80,000 100,000 — — — — 180,000Donald J. McNamara 40,000 100,000 — — — — 140,000
Amounts reported in column C represent the fair value of stock-based compensation granted to each non-employeemember of the Board of Directors. All Board of Director restricted stock awards are made annually in January followingthe Annual Meeting and have one-year vesting terms. In January 2019, each non-employee member of the Boardreceived a restricted share award of 4,075 shares that had a fair value of $100,000. The fair value of the stock awardspresented in column C was based on a share price of $24.54 per share, which was the closing price of our common stockon the date that the award was granted. At August 31, 2019, the directors held a total of 28,525 shares of restrictedstock. For further information on the calculation used to value the stock awards presented in Column C, refer to Note 12to our Consolidated Financial Statements in our Annual Report on Form 10-K for the fiscal year ended August 31,2019 as filed with the SEC on November 14, 2019.
Fiscal 2020 Director Compensation
There are no anticipated changes to fiscal 2020 director compensation from amounts previously described.
PRINCIPAL HOLDERS OF VOTING SECURITIES
The following table sets forth information as of November 30, 2019, with respect to the beneficial ownership of sharesof Common Stock by each person known by us to be the beneficial owner of more than five percent of our CommonStock, by each director, by the Named Executive Officers, and by all directors and officers as a group. Unless notedotherwise, each person named has sole voting and investment power with respect to the shares indicated. In computingthe number of shares of Common Stock beneficially owned by a person or entity and the percentage ownership ofthat person or entity, we deemed outstanding shares of Common Stock subject to options held by that person or entitythat are currently exercisable or exercisable within 60 days of November 30, 2019. We did not deem these sharesoutstanding, however, for the purpose of computing the percentage ownership of any other person or entity.The percentages set forth below have been computed without taking into account treasury shares held by us and arebased on 13,982,268 shares of Common Stock outstanding as of November 30, 2019. At the date of this report, therewere no shares of Series A or B Preferred Stock outstanding.
27 Principal Holders of Voting Securities Franklin Covey 2019 Annual Report

As of November 30, 2019
Number ofCommon
SharesPercentage of
ClassDonald J. McNamara(1)(2)(4)
c/o Franklin Covey Co.2200 West Parkway Blvd.Salt Lake City, UT 84119-2331 3,225,079 23.1%
Knowledge Capital Investment Group(1)
3899 Maple Ave., Suite 300Dallas, TX 75219 2,812,805 20.1%
Dimensional Fund Advisors, Inc.(3)
1299 Ocean AvenueSanta Monica, CA 90401 817,535 5.8%
Pembroke Management, LTD(3)
1002 Sherbrooke Street WestSuite 1700Montreal, Canada A8 H3A 354 810,759 5.8%
Blackrock, Inc.(3)
55 East 52nd StreetNew York, NY 10055 800,693 5.7%
Robert A. Whitman(5)(6) 677,640 4.7%Stephen D. Young(5) 283,994 2.0%Joel C. Peterson(4) 226,821 1.6%M. Sean Covey 188,600 1.3%Dennis G. Heiner(4) 65,797 *%E. Kay Stepp(4) 53,294 *%Clayton M. Christensen(4) 28,588 *%Michael Fung(4) 28,388 *%Colleen Dom 19,081 *%C. Todd Davis 17,699 *%Scott J. Miller 9,130 *%Paul S. Walker 8,883 *%Anne H. Chow(4) 4,262 *%Derek C.M. van Bever — *%All directors and executive officers as a group (14 persons)(4)(5) 4,837,256 33.2%
(1) Mr. McNamara, who is a director of the Company, is a principal of The Hampstead Group, the private investmentfirm that sponsors Knowledge Capital Investment Group (Knowledge Capital), and therefore may be deemedthe beneficial owner of the Common Stock held by Knowledge Capital. Mr. McNamara disclaims beneficialownership of the Common Stock held by Knowledge Capital. In December 2019, Knowledge Capital (i) sold284,608 shares of our Common Stock to the Company and (ii) distributed all of its remaining shares of the Company’scommon stock to Knowledge Capital’s investors. Mr. McNamara, as an investor in Knowledge Capital, received19,620 shares of our Common Stock in the distribution from Knowledge Capital. As a result of these transactions,as of the date hereof, Knowledge Capital does not beneficially own any of the Company’s Common Stock.
(2) The share amounts include those held for Donald J. McNamara by the Donald J. and Joan P. McNamara Foundationwith respect to 23,000 shares. Mr. McNamara is the trustee of his foundation, having sole voting and dispositivecontrol of all shares held by the foundation, and may be deemed to have beneficial ownership of such shares.
(3) Information for Dimensional Fund Advisors Inc., Blackrock Inc., and Pembroke Management LTD is provided asof September 30, 2019, the filing of their last 13F Reports.
(4) The share amounts indicated exclude restricted stock awards currently held by the following persons in thefollowing amounts: Anne H. Chow, 4,075 shares; Clayton M. Christensen, 4,075 shares; Michael Fung, 4,075 shares;
Franklin Covey 2019 Annual Report Principal Holders of Voting Securities 28

Dennis G. Heiner, 4,075 shares; Donald J. McNamara, 4,075 shares; Joel C. Peterson, 4,075 shares; E. Kay Stepp,4,075 shares; and all directors as a group, 28,525 shares. These restricted stock awards do not have voting power ordividend rights until the shares actually vest to members of the Board of Directors.
(5) The share amounts indicated include shares subject to options currently exercisable held by the following personsin the following amounts: Robert A. Whitman 437,500 shares; Stephen D. Young 131,250 shares; and all executiveofficers and directors as a group, 568,750 shares.
(6) In December 2019, Knowledge Capital distributed all of its remaining shares of our Common Stock to KnowledgeCapital’s investors. Mr. Whitman, as an investor in Knowledge Capital, received 214,108 shares of our CommonStock in the distribution from Knowledge Capital.
CERTAIN RELATIONSHIPS AND RELATED TRANSACTIONS
Review and Approval of Related Party Transactions
We review all relationships and transactions in which the Company and certain related persons, including our directors,Named Executive Officers, and their immediate family members, are participants, to determine whether such personshave a direct or indirect material interest. Our legal and accounting departments have responsibility for the developmentand implementation of processes and controls to obtain information from the directors and Named Executive Officerswith respect to related party transactions and for then determining, based upon the facts and circumstances, whetherthe Company or a related party has a direct or indirect material interest in the transaction. As required under SEC rules,transactions that are determined to be directly or indirectly material to us or the related party are disclosed in ourProxy Statement. In addition, a disinterested majority of the full Board of Directors or Audit Committee reviews andapproves any related party transaction that is required to be disclosed.
Related Party Transactions
We previously acquired CoveyLink Worldwide, LLC (CoveyLink). CoveyLink conducts seminars and training coursesand provides consulting based upon the book The Speed of Trust by Stephen M.R. Covey, who is the brother of M. SeanCovey. Prior to the acquisition date, CoveyLink granted us a non-exclusive license related to The Speed of Trust bookand related training courses for which we paid CoveyLink specified royalties. As part of the CoveyLink acquisition, weobtained an amended and restated license of intellectual property that granted us an exclusive, perpetual, worldwide,transferable, royalty-bearing license to use, sell, and perform the licensed material in any format or medium and throughany market or distribution channel. The amount expensed for these royalties due to Stephen M.R. Covey under theamended and restated license agreement totaled $1.7 million during the fiscal year ended August 31, 2019. In connectionwith the CoveyLink acquisition, we also signed a speaking services agreement that pays Stephen M.R. Covey a portionof the speaking revenues received for his presentations. During fiscal 2019 we expensed $1.2 million for thesepresentations.
We pay M. Sean Covey, who is also an executive officer of the Company, a percentage of the royalty proceeds receivedfrom the sales of certain books authored by him in addition to his salary. During the fiscal year ended August 31, 2019,we expensed $0.1 million for these royalty payments.
During fiscal 2019, we employed Joshua M.R. Covey, who is the brother of M. Sean Covey, and paid him compensationtotaling $202,117. We also employed Dr. John Covey, an uncle of M. Sean Covey, and paid him compensation totaling$151,073 in fiscal 2019.
We employ John Harding, who is the brother-in-law of Stephen D. Young, and paid him compensation totaling $347,961during fiscal 2019. We also employed Jonathan Lofgren, who is Scott J. Miller’s brother-in-law, and paid him compensationtotaling $147,689 in fiscal 2019.
29 Certain Relationships and Related Transactions Franklin Covey 2019 Annual Report

Robert A. Whitman, our Chairman of the Board of Directors and CEO, beneficially owns a partnership interest inKnowledge Capital. Donald J. McNamara, a member of our Board of Directors, also beneficially owns a partnershipinterest in Knowledge Capital and serves as a principal of The Hampstead Group, the private investment firm thatsponsors Knowledge Capital. Knowledge Capital beneficially owned 2,812,805 shares of our Common Stock atNovember 30, 2019. In December 2019, Knowledge Capital distributed all of its shares of our Common Stock to itsinvestors. Immediately prior to the distribution, we repurchased 284,608 shares of our Common Stock from KnowledgeCapital, at $35.1361 per share, for an aggregate purchase price of approximately $10 million. As of the date hereof,Knowledge Capital does not own any shares of our Common Stock.
On December 10, 2019, the Company repurchased 5,000 shares of its Common Stock from E. Kay Stepp, a member ofour Board of Directors, at $35.1361 per share for an aggregate purchase price of approximately $0.2 million. Therepurchase from Ms. Stepp was made under the Company’s existing share repurchase plan.
Each of these listed transactions was approved according to the procedures cited above.
COMPENSATION DISCUSSION AND ANALYSISOur Compensation Committee, composed of four independent directors, determined the fiscal 2019 compensation forour named executive officers (NEOs):• Robert A. Whitman — Chairman and Chief Executive Officer (CEO);• Stephen D. Young — Chief Financial Officer (CFO);• Paul S. Walker — President of Enterprise Division and Global Partnerships;• M. Sean Covey — President of Education Division; and• Colleen Dom — Executive Vice President of Operations.
The material elements of our executive compensation programs and policies, including program objectives, reasons forpaying each element and the specific amounts of our NEOs’ compensation for fiscal 2019, are explained below. Followingthis description, you will find a series of tables containing more specific information about our NEOs’ compensation. Webegin with an executive summary to provide a framework for analysis of this information.
Executive Summary
Overview
The Company’s transition from selling engagement-by-engagement training and performance solutions to sellingtraining and performance content and solutions delivered through a subscription-based business model continued infiscal 2019. Our subscription-based business model:
(1) provides clients with unlimited access to Franklin Covey’s entire collection of best-in-class content for adefined population;
(2) enables content to be delivered through an almost unlimited combination of delivery modalities, and in19 languages worldwide;
(3) includes the services of an implementation specialist to help clients design “impact journeys” to help themachieve their performance objectives; and
(4) offers a price per population trained that is equivalent to that typically charged in the industry for just asingle course in a single delivery modality.
We anticipated that this value proposition would be compelling to our customers. We also expected that it would bedisruptive to both our historical course-by-course business model, and our financial reporting, since the recognition ofa significant portion of the value of contracts sold in a given period would be deferred into future periods, rather thanbeing recognized in the initial period.
Franklin Covey 2019 Annual Report Compensation Discussion and Analysis 30

Fiscal 2019 Performance
The significant growth of our subscription business is increasingly offsetting the ongoing declines in our historicalsales channels. As a result, we expect both our reported and economic revenue growth to continue to accelerate in fiscal2020 and beyond.
Subscription and subscription-related revenue accounts for over 55% of all revenue in our English speaking directoffices, and the All Access Pass (AAP) subscription offering was also launched in Japan this past year. In addition, morethan 80% of our Education business is now subscription or subscription-related. The value proposition of our AAPoffering is continuing to drive a higher initial sale, a higher rate of revenue renewal, and more add-on sales of services,resulting in a significantly higher lifetime value of our customers. This higher lifetime customer value is drivingaccelerated growth for our subscription model.
Key Compensation Decisions and Actions for Fiscal 2019
The Compensation Committee made the following key executive compensation decisions and took the following keyexecutive compensation actions for fiscal 2019:
• Salaries — Fiscal 2019 salaries for all NEOs remained at substantially the same levels as in the prior year.
• Annual Incentive Payments — Consistent with prior years, the Compensation Committee approved an annualincentive plan for fiscal 2019 that provided for potential cash incentives based on (1) the annual financial performanceof the Company, based on Qualified Adjusted EBITDA, which is defined in the Analysis of Fiscal 2019 CompensationDecisions and Actions section of this document (70% of payout) and (2) executive team performance objectives(30% of payout). Based on actual performance against the financial targets set, the NEOs received 191% of the 70%portion of this payout for exceeding the target achievement under the Qualified Adjusted EBITDA performanceobjectives for the fiscal 2019 annual incentive plan. In addition, the NEOs received 84% of the 30% portion of themetric-based executive team performance objectives for fiscal 2019. These amounts are reflected in the Fiscal Year2019 Summary Compensation Table found in this document under the heading “Non-Equity IncentivePlan Compensation.” No other annual variable cash compensation awards were earned during fiscal 2019. Furtherdetails of our annual incentive plan for fiscal 2019 are explained in the section below entitled “AnnualPerformance-Based Variable Pay.”
• Long-Term Incentive Awards — The Compensation Committee again granted to each of the NEOs performanceand service-based restricted stock units (RSUs). There are three tranches in the fiscal 2019 LTIP awards: (1) a tranchefor Qualified Adjusted EBITDA performance, (2) a tranche for “subscription sales” performance, and (3) a tranchethat vests after three years of service. The number of shares that vest in each of the Qualified Adjusted EBITDA andsubscription sale tranches is based on fiscal 2021 financial results. As of August 31, 2019, all three tranches of thefiscal 2019 RSUs remain unvested. Further details of the performance-based RSUs granted in fiscal 2019 are explainedin the section below entitled “Equity Compensation.”
The Compensation Committee also granted a restricted stock unit awards to our CEO and CFO as partial replacementfor equity awards received in fiscal 2012 and fiscal 2013 which were forfeited or did not fully vest largely as a resultof the change in Franklin Covey’s business model to emphasize subscription services. These awards vest after thecompletion of a two-year service period ending January 25, 2021. These equity awards are reflected in the 2019 FiscalYear Summary Compensation Table found in this document under the caption “Stock Awards.”
Shareholder-Minded Compensation Practices
The Compensation Committee reviews and considers the views of shareholders and proxy advisory firms on corporatepay practices. In this regard, we reach out to key shareholders to solicit their views on executive compensation andconsider the results of our annual “say-on-pay” voting. Taking these, and other inputs into account, the CompensationCommittee implemented and maintains the following policies:
• Clawback Policy — The Board has authority to require reimbursement of any annual or long-term incentive paymentmade to an executive officer where: (1) the payment was based on achieving financial results that were subsequently
31 Compensation Discussion and Analysis Franklin Covey 2019 Annual Report

the subject of a substantial restatement of Company financial statements filed with the SEC; (2) the Board determinesthe executive engaged in misconduct that caused the need for the substantial restatement; and (3) a lower paymentwould have been made to the executive based on the restated financial results. In such instance, the Company expectsthat it will seek to recover from the individual executive the amount by which the individual executive’s incentivepayments for the relevant period exceeded the lower payment that would have been made based on the restatedfinancial results.
• Hedging Policy — Our directors and executive officers are prohibited from buying or selling publicly traded options,puts, calls or other derivative instruments related to Company stock. All other employees are discouraged fromengaging in hedging transactions related to Company stock.
• No Option Repricing Without Shareholder Approval — Our equity plans expressly prohibit option repricingwithout shareholder approval.
• No Excise Tax Gross-ups — Excise tax gross-ups for our NEOs are prohibited.
• Stock Ownership Guidelines — Our stock ownership guidelines require an ownership threshold of five times basesalary for our CEO, three times base salary for our CFO and two times base salary for our other NEOs. Each NEO istargeted to reach the applicable threshold within five years of the policy becoming applicable to the NEO and fromthe date the NEO first has shares awarded as part of his or her annual compensation. Unvested share awards areincluded in calculating whether the required threshold has been achieved. NEOs are prohibited from selling any sharesuntil after these guidelines are met. The Compensation Committee annually reviews executives’ progress towardmeeting these guidelines. Currently, the stock ownership of each of our CEO, our CFO, Mr. Covey, and Ms. Dommeets or exceeds the applicable threshold, and Mr. Walker is also currently expected to meet his ownership thresholdwithin the allotted time. In addition, a Board policy requires that each director who is not an employee of theCompany maintain beneficial ownership of the Company’s common stock and/or vested RSUs equal in value to atleast four times the Board cash retainer at all times during his or her tenure on the Board. New directors have up tothree years of service on the Board in which to meet this ownership requirement.
• No Significant Perquisites — No significant “corporate perquisites” such as country club memberships or automobileallowances are provided to our NEOs.
• No Employment Agreements for NEOs and Limited Change-in-Control Benefits — The Company does notenter into employment agreements with its NEOs, and has a change-in-control policy for its NEOs that provides fora potential change-in-control severance benefit of only one times total targeted annual cash compensation withoutany excise tax gross-ups. Our NEOs are subject to the same general (non-change-in-control) severance policies as allCompany employees.
• Pay for Performance Awards — The 2019 long-term incentive plan (LTIP) performance-based stock awards weredesigned to incentivize even greater achievement levels in the Company’s results of operations, and pay out only if theseoperating improvements are achieved.
• Efficient Share Utilization — The Compensation Committee believes that the Company’s historical share utilizationfor compensation purposes has been relatively low; this utilization rate is expected to remain relatively low in thefuture.
Consideration of 2019 “Say-On-Pay” Voting Results
At our 2019 Annual Meeting, we held our annual advisory “say-on-pay” vote with respect to the compensation of ourNEOs. Over 99% of the votes cast were in favor of the compensation of our NEOs. Our Board of Directors and theCompensation Committee considered and discussed this shareholder vote result during fiscal 2019 and determinednot to make significant changes to the existing program for fiscal 2019 specifically as a result of the 2019 say-on-pay vote.The Compensation Committee will, from time to time, explore various executive pay and corporate governancechanges to the extent appropriate in an effort to keep our executive compensation program aligned with best practicesin our competitive market and the Company’s particular circumstances, and expects to consider shareholder views
Franklin Covey 2019 Annual Report Compensation Discussion and Analysis 32

in so doing. The Compensation Committee intends to continue holding say-on-pay votes with shareholders on anannual basis, consistent with our shareholders’ recommendation from our 2019 Annual Meeting, and the next suchvote is scheduled for the 2020 Annual Meeting.
Guiding Philosophy, Principles, and Objectives of Our Executive Compensation Program
To fulfill our mission and implement our strategy, Franklin Covey must attract, motivate, and retain highly qualifiedemployees. We achieve this, in part, through working to ensure that we have both a winning culture and a competitiveperformance-based total compensation program. We align our executives’ interests with those of our shareholdersby tying almost all short- and long-term incentive compensation to the Company’s achievement of key measures ofgrowth and key strategic objectives.
We believe variable, performance-based compensation should constitute a significant percentage of our executives’overall compensation opportunity. All executive base salary, short-term incentive, and long-term incentive compensationis designed to be market-based. Variable pay and long-term incentive pay is linked to, and designed to reward theachievement of, specific performance targets.
The philosophy and objectives of our executive compensation program are reflected in the compensation principleslisted below, which guide the Compensation Committee in its oversight of our compensation practices and plans. Thespecific objectives of our executive compensation program are to reward achievement of our strategic and annualbusiness plans and to link a major portion of pay directly to performance. The key principles that guide the CompensationCommittee are that the Company’s executive compensation program should:
• Reflect Performance: To align compensation with performance over both the short and long term, we establishmulti-year objectives for the Company relating to both growth and the achievement of key strategic objectives. Annualperformance targets are established in the context of these multi-year objectives, and for fiscal 2019 consistedprimarily of goals for growth in revenue, Adjusted EBITDA, and deferred revenue. NEO performance pay levels forthe year are generally determined by assessing the Company’s level of achievement compared to these objectives. Sinceour NEOs have responsibility for overall Company performance against these objectives, their compensation canvary (and has varied) significantly from year to year.
• Encourage Long-Term Company-Wide Focus: We believe that compensation should encourage and reward both theachievement of annual objectives and longer-term, Company-wide performance improvement. We use a service-basedand performance-based RSU program to focus NEO efforts on long-term growth in shareholder value. We believethat paying a significant portion of variable compensation to our NEOs in the form of equity-based compensation thatvests over a period of time, based on performance, also encourages a long-term, Company-wide focus. Value isrealized through delivering results today, but in a way that builds the foundation for delivering even stronger resultsin the future. We believe that this practice will lead to our NEOs having a considerable investment in our shares overtime. This investment in turn advances both a culture of teamwork and partnership, and encourages a stewardshipmentality for the Company among our key leaders.
• Attract and Retain Talent: We understand the importance of hiring and retaining the best people. Retention oftalented employees is critical to successfully executing our business strategy. We seek to be what we refer to internallyas “the workplace of choice for achievers with heart.” Successful execution of our business strategy requires that ourmanagement team be in place, engaged and focusing their best energy and talents on achieving our business goals andstrategies. For us, compensation is not just an overhead expense; it is a key component of the investments we makeand costs we incur to generate our revenues. For our delivery consultants, the majority of this compensation cost isreflected as cost of goods sold. In determining the compensation of our NEOs and in reviewing the effectivenessof our compensation program for attracting and retaining talent, the Compensation Committee generally considersthe competitive market for talent. We believe that our compensation programs should enable us to attract and retaintalented people, and incentivize them to contribute their finest talents to achieving our objectives. We are pleasedthat our executive officers have an average tenure of over 23 years with our Company (ranging from 18 to 34 years).
33 Compensation Discussion and Analysis Franklin Covey 2019 Annual Report

In addition to aligning our compensation programs with the achievement of objectives that drive shareholder value,the Compensation Committee also considers the consistency of our compensation programs and works to ensure thatour variable compensation does not encourage imprudent risk-taking. We have determined that our Company’s approachto the compensation process addresses the need to balance prudence and pay-for-performance through a combinationof:
• Controls on the allocation and overall management of risk-taking;
• Comprehensive profit and loss and other management information, that provides ongoing performance feedback;
• Rigorous, multi-party performance assessments and compensation decisions; and
• A Company-wide compensation structure that strives to meet industry best practice standards, including a businessmodel that is based on compensating our associates in direct proportion to the revenue and profit contributionthey generate.
Our compensation framework seeks to balance risk and reward. Our executive team is involved in identifying relevantrisks and performance metrics for our business. We work to create a cadence of accountability within our organizationthrough continuous evaluation and measurement of performance compared to what we refer to internally as our “WildlyImportant Goals” of achieving profitable growth, meeting strategic objectives, and building a winning culture. Basedon the considerations discussed above, in connection with its compensation decisions for fiscal 2019, our CompensationCommittee concluded that our Company’s compensation program and policies are structured such that they do notencourage imprudent risk-taking, and that there are no risks arising from such programs and policies that are reasonablylikely to have a material adverse effect on the Company.
2019 Executive Compensation Program
Our fiscal 2019 executive compensation program incorporated five main elements:
• Base salary;
• Short-term, performance-based cash variable pay plan;
• Long-term incentive equity awards in the form of ongoing service-based and performance-based RSUs;
• Other benefits (primarily insurance, as discussed below) that are generally available to all employees on similarterms, except as specifically described below; and
• Severance and change-in-control benefits, which are substantially the same for our NEOs as they are for otheremployees.
Analysis of Fiscal 2019 Compensation Decisions and Actions
Fiscal 2019 Executive Compensation Determination Process
The Compensation Committee determined the form and amount of fixed compensation and established specificperformance metrics for determining year-end variable compensation to be awarded to our NEOs for fiscal 2019considering: (1) our financial performance over the prior year and past several years and, expectations for fiscal 2019;(2) the individual and collective performance of our NEOs relative to the achievement of metric-based strategic objectivesrelated to growth in key areas; and (3) in connection with our goal of attracting and retaining the best talent, a generalunderstanding of market compensation practices. In particular, the Compensation Committee reviewed at a general levelthe following financial metrics and related growth rates in connection with making its key compensation decisions:
• Revenue;
• Adjusted EBITDA and operating income;
• Multi-year changes in operating income, Adjusted EBITDA, and specific revenue targets; and
Franklin Covey 2019 Annual Report Compensation Discussion and Analysis 34

• Achieving high rates of retention for subscription-based revenue.
Management Input Regarding Compensation Decisions: Our Compensation Committee meets in executive session todiscuss the performance of our CEO and each of the other NEOs. Our CEO submitted year-end variable compensationcalculations (certified by our CFO) and recommendations to the Committee for our other NEOs. These calculationsand recommendations precisely followed the payout guidelines established for incentive compensation relating tofinancial performance.
Market Assessment: Our Compensation Committee evaluates our NEO compensation program at a high level againstmarket practices. In 2019, the Committee asked Mercer, the Committee’s compensation consultant, to assess our NEOcompensation program, identify considerations that could inform compensation decisions, and advise as to currentmarket practices, trends, and plan designs. Mercer reviewed data from its own research and databases and used thisinformation primarily as supplemental data to assist the Compensation Committee in understanding current marketpractices related to executive compensation. In its assessment of our compensation program, Mercer confirmed that thecompensation amounts are consistent with market compensation for similar-sized and comparable professionalservices and content companies, and that the program has been aligned with corporate performance. Further, Merceradvised us that the compensation program contains features that reinforce significant alignment with shareholders anda long-term focus, and blends subjective assessment and policies in a way that addresses known and perceived risks.
The Compensation Committee has assessed Mercer’s independence, as required under NYSE rules, and considered andassessed all relevant factors, including those required by the SEC that could give rise to a potential conflict of interestduring fiscal 2019. The Compensation Committee did not identify any conflicts of interest raised by the work performedby Mercer.
In making pay decisions for fiscal 2019, the Compensation Committee considered how executive compensation shoulddrive desired performance toward our business objectives. The Compensation Committee also took into considerationthe specific business opportunities and challenges facing the Company compared to those of our competitors andsimilar-sized companies. However, the Compensation Committee did not specifically benchmark elements ofcompensation when making its fiscal 2019 executive compensation decisions. Finally, the Compensation Committeegenerally considered the past performance of our NEOs, including performance against previous individual andcorporate objectives, expected contribution to future corporate objectives, and whether the NEOs’ performance wasachieved consistent with our governing values. The Compensation Committee made final judgments regarding theappropriate compensation level for each NEO based on these additional inputs.
The following peer group was used for fiscal 2019. These companies were selected based on size, industry and types ofprofessional services offered. Annual revenues for the peer group (which is one of several factors considered in selectingthe peers) range from approximately $175 million to $806 million. The data for this peer group was discounted due to theoverall revenue of the peer group, to be more comparable with our revenue. Since our fiscal 2019 revenues totaled$225.4 million, we believe with the previously stated discounts, this peer group is appropriate for comparison purposes.This peer group is one of many tools used by the Compensation Committee for assessing executive compensation andwas comprised of the following companies for fiscal 2019:
• CRA International, Inc.
• Exponent, Inc.
• Forrester Research, Inc.
• GP Strategies Corporation
• The Hackett Group, Inc.
• HealthStream, Inc.
• Heidrick & Struggles International, Inc.
• Huron Consulting Group, Inc.
35 Compensation Discussion and Analysis Franklin Covey 2019 Annual Report

• Information Services Group, Inc.
• RCM Technologies, Inc.
• Resources Connection, Inc.
• Rosetta Stone, Inc.
As compared to the peer group for fiscal 2018, this peer group added Rosetta Stone, Inc. and eliminated CambiumLearning Group, Inc. based on application of the criteria described above.
Decisions on Key Elements of Fiscal 2019 Executive Compensation
Total Compensation: In addition to the specific elements of compensation discussed below, we establish annual targetsfor the total compensation provided to our NEOs. Based on the key factors described above, the CompensationCommittee established fiscal 2019 total compensation targets of approximately $2.6 million for our CEO andapproximately $836,000, on average, for our other NEOs, assuming achievement of targeted results under ourshort- and long-term performance-based variable pay plans. The calculation excludes book royalty payments made toMr. Covey, as noted in the Fiscal 2019 Summary Compensation Table.
Total Compensation Mix: The following charts identify the fiscal 2019 target compensation mix for our CEO andaverage mix for our other NEOs.
2019 Target Compensation Mix (CEO) 2019 Target Compensation Mix (Other NEOs)
Base Salary
Stock Awards (LTIP RSUs)
Performance-Based Cash Variable Pay (STIP)
23% 23% 25%
34%
41%
54%
Base Salaries
The Company pays a base salary to each of our NEOs to provide a base level of fixed income for services rendered. TheCompensation Committee annually reviews base salary market data and if appropriate, will adjust base salaries toremain at competitive levels. Based primarily on the Compensation Committee’s subjective consideration of the 2019market data, salaries for all NEOs remained at substantially the same levels as in the prior year. The Committee continuesto emphasize performance-based variable pay as the means by which NEOs may increase their total compensation.
Annual Performance-Based Variable Pay
Fiscal 2019 Performance-Based Cash Variable Pay Plan: The Company provides annual performance-based cashincentive opportunities to link our NEOs compensation interests to specific financial and strategic goals established bythe Compensation Committee. In fiscal 2019, the Performance-Based Cash Variable Pay Plan (STIP) for our NEOsincluded two components for the payout calculation: (1) Annual financial performance objectives (70% of payout) and(2) metric-based executive team performance objectives (30% of payout). The target STIP payout opportunities for ourNEOs were determined by the Compensation Committee based on the considerations described above as follows:$575,000 for Mr. Whitman; $235,000 for Mr. Young; and $200,000 for each of Mr. Covey, Mr. Walker, and Ms. Dom.These target STIP payout opportunities remained the same for our NEOs from fiscal 2018. The STIP reinforces ourstrong pay-for-performance philosophy and rewards the achievement of specific business and financial goals duringthe fiscal year.
Financial Performance Component: The financial performance threshold necessary for NEOs to earn 100% of thefinancial performance component of their target STIP payout opportunity in fiscal 2019 was to increase Qualified
Franklin Covey 2019 Annual Report Compensation Discussion and Analysis 36

Adjusted EBITDA from $11.9 million in fiscal 2018, to $19.0 million of Qualified Adjusted EBITDA in fiscal 2019,growth of 59.7%. Qualified Adjusted EBITDA is calculated as reported Adjusted EBITDA which is adjusted for theimpact of foreign exchange, STIP, and other items.
The Company utilizes Adjusted EBITDA in its analysis and decision making because it provides supplemental informationthat facilitates consistent internal comparisons to the historical operating performance of prior periods and we believethe measure provides greater transparency to evaluate operational activities and financial results. Adjusted EBITDAis also the primary measure by which internal business segment performance is evaluated and is regularly communicatedto our analysts. Refer to the table in Appendix A for the reconciliation of Adjusted EBITDA, to consolidated net income(loss), a comparable GAAP financial measure.
In fiscal 2019, Qualified Adjusted EBITDA equaled $20.9 million, after being adjusted for foreign exchange. Accordingly,the Company exceeded the $19.0 million threshold of Qualified Adjusted EBITDA and, as a result, 191% of the 70%financial performance component of the fiscal 2019 annual incentive for each of the NEOs was paid. As further describedbelow, our NEOs also received a payout of 84% of the 30% metric-based component of targeted annual incentive pay,based on the degree of achievement of the specified strategic objectives as evaluated by the Compensation Committee.
The following table shows the potential payouts to our NEOs based on the degree of attainment of fiscal 2019 STIPQualified Adjusted EBITDA objectives (and assuming metric-based executive team performance objectives wereachieved).
Qualified AdjustedEBITDA less than
$14.0 million and notmeeting performance
objectives
Pro-rata share of 70%financial performancemetric for achievingQualified Adjusted
EBITDA as calculated if> $14.0 million and< $19.0 million and
meeting performanceobjectives
Targeted QualifiedAdjusted EBITDA of
$19.0 million andmeeting performance
objectives
Pro-rata share of totaltarget opportunity for
achieving QualifiedAdjusted EBITDA
(including STIP expense)if > $19.0 million and< $22.0 million and
meeting performanceobjectives
Qualified AdjustedEBITDA (including STIP
expense) equal to orgreater than $22 million
and meeting performanceobjectives
0% Pro-rata calculation 100% Pro-rata calculation 200%
Performance Objectives Component: The Performance Objectives Component of the STIP represents 30% of the STIPaward and in fiscal 2019 it was paid out at 84% of the target for executive team performance objectives based onachievement of key strategic goals established by the Compensation Committee at the beginning of fiscal 2019. Whilethese goals were strategic in nature, and disclosing all details could cause potential competitive harm, they were objectiveswith specific measures related to the transition to a subscription-based business model as well as recurring AAPrevenue. Each key strategic goal was individually weighted based on difficulty and on the effort required to achieve thegoal, with most goals weighted between 30% and 40% of this portion of the STIP award opportunity. We believe thatthe goals established for each NEO were “stretch” goals tied to over-achieving compared to our annual plan in supportof the Company’s long-term strategy of building its subscription business. Each goal was typically linked to what werefer to internally as our “Wildly Important Goals” that are cascaded throughout the Company, and progress towardeach of these goals was tracked regularly. For fiscal 2019, the metric-based executive team performance objectivescomponent of the STIP were not all met. Accordingly, despite significant gains in each of the key metrics on which thiscomponent of STIP was based, the NEOs received only a portion of the target level of cash compensation for theexecutive team performance objectives, which cash payment reflected 84% of the 30% of the total targeted STIPopportunity.
These amounts are reflected in the Fiscal Year 2019 Summary Compensation Table found in this document under theheading “Non-Equity Incentive Plan Compensation.” No other annual variable cash compensation awards were earnedby the NEOs during fiscal 2019.
37 Compensation Discussion and Analysis Franklin Covey 2019 Annual Report

Equity CompensationWe believe that the granting of long-term equity awards over the years has created strong alignment of interest betweenNEOs and shareholders, as reflected in our strong financial performance from fiscal 2010 through fiscal 2019. Thesame program and philosophy were reflected in our use of equity awards in fiscal 2019.Fiscal 2019 Long-Term Incentive Plan (LTIP) — Service-Based and Performance-Based Equity Grants: A significantportion of our NEOs’ total targeted compensation for fiscal 2019 was provided in the form of service-based RSUs andperformance-based RSUs that vest solely upon the achievement of key financial objectives included in our long-termfinancial plan over a period of years. If the performance targets are not achieved within the allotted time frame, then theperformance-based RSUs are forfeited.During fiscal 2019, the Compensation Committee granted service-based and performance-based RSU awards to ourNEOs. Shares may be earned under the fiscal 2019 RSU award based on three components over a three-year vestingperiod, ending August 31, 2021, as identified below:
(1) 25% of the fiscal 2019 RSU award is time-vested and in general will vest on August 31, 2021;
(2) 70% of the remaining 75% of the fiscal 2019 RSU award is based on Qualified Adjusted EBITDA performance,as previously defined. Because Adjusted EBITDA is important in the short term and in the long term, themeasure is utilized in both our STIP and LTIP awards. Qualified adjusted EBITDA for purposes of fiscal 2019LTIP is based on the highest qualified adjusted EBITDA achieved for any four quarter period during thethree years ended August 31, 2021; and
(3) 30% of the remaining 75% of the fiscal 2019 RSU award is based on fiscal 2021 subscription sales results.
In addition to payout levels of 50%, 100%, and 200% for the achievement of applicable performance goals, the numberof shares paid in settlement of the RSU tranches with financial targets is a pro-rata calculation between a 50% target anda 100% target, and a different pro rata calculation between 100% target and 200% target. As of August 31, 2019, allthree tranches of RSUs granted in fiscal 2019 remain unvested. The targets for the RSUs granted in fiscal 2019 (and thecorresponding payout levels for achieving the targets) are identified below:
Fiscal 2021 Qualified Adjusted EBITDA
• $28.0 million (50% of target — minimum threshold);
• $35.0 million (100% of target); and
• $40.0 million (200% of target — maximum threshold).
Fiscal 2021 Subscription and Related Sales
• $145.0 million (50% of target — minimum threshold);
• $165.0 million (100% of target); and
• $185.0 million (200% of target — maximum threshold).We believe that our RSU program aligns a significant portion of our executive compensation with increasing valuerealized by our shareholders. For further information regarding our LTIP awards and other share-based compensationinstruments (including applicable performance achievement), please refer to the notes to our financial statementsfound in our Annual Report on Form 10-K for the fiscal year ended August 31, 2019 and the footnotes to the OutstandingEquity Awards at Fiscal 2019 Year-End table that are provided further below. None of the outstanding RSUs as reportedin the fiscal 2018 Compensation Discussion and Analysis were earned during fiscal 2019. Please see the outstandingequity awards section below for additional details relating to the outstanding awards.Qualified Retirement Benefits: Each of our NEOs participates in our 401(k) plan, which is our tax-qualified retirementplan available to all eligible U.S. employees. We match participant contributions dollar-for-dollar on the first 1% of salarycontributed to the 401(k) plan and 50 cents on the dollar for the next 4% of salary contributed. Our match for executivesis the same received by all associates who participate in the 401(k) plan. Contributions to the 401(k) plan from highlycompensated employees are currently limited to a maximum of 10% of compensation, subject to statutory limits.
Franklin Covey 2019 Annual Report Compensation Discussion and Analysis 38

Other Benefits: The Compensation Committee evaluated the market competitiveness of the executive benefit packageto determine the most critical and essential benefits necessary to retain executives. Based on information received fromMercer, the Compensation Committee determined to include executive life insurance for certain NEOs. In addition,the Company agreed to provide our CEO with supplemental disability insurance after he voluntarily terminated hisemployment agreement with the Company, and in consideration of previous years during which our CEO accepted nocompensation. For fiscal 2019, our Compensation Committee was provided with the estimated value of these items(which value is included in the Fiscal 2019 Summary Compensation Table below), and determined, as in prior years, thatthese amounts were not material in determining our NEOs’ fiscal 2019 compensation.
• Term Life Insurance: Franklin Covey provides a portable 20-year term life policy for the CEO and CFO. The coverageamount is approximately 2.5 times each NEO’s target annual cash compensation (base salary plus targetperformance-based cash variable pay).
• Supplemental Disability Insurance: We provide our CEO with long-term disability insurance which, combined withour current group policy, provides, in the aggregate, monthly long-term disability benefits equal to approximately 75%of his fiscal 2019 target cash compensation. Our other NEOs may purchase voluntary supplemental disabilityinsurance at their own expense.
We maintain a number of other broad-based employee benefit plans in which, consistent with our values, our NEOsparticipate on the same terms as other employees who meet the eligibility requirements, subject to any legal limitationson amounts that may be contributed to or benefits payable under the plans. These benefits include:
• Our High Deductible Health Plans and Health Savings Accounts administered pursuant to Sections 125 and 223 ofthe Internal Revenue Code of 1986, as amended (the Code).
• Our Employee Stock Purchase Plan implemented and administered pursuant to Section 423 of the Code.
Severance Policy: We have implemented a severance policy to establish, in advance, the appropriate treatment forterminated NEOs and to help ensure market competitiveness. The severance policy uses the same benefit formula forour NEOs as it uses for all of our employees. We do not “gross-up” severance payments to compensate for taxes. For moreinformation about the terms of the severance policy, see the section below entitled “Executive Compensation — PotentialPayments Upon Termination or Change-in-Control.”
Employment Agreements and Change-in-Control Severance Agreements: We do not have employment agreements withany of our NEOs, but we are a party to change-in-control severance agreements with each of our NEOs. Theseagreements are designed to retain our NEOs in the event a change-in-control transaction is proposed. In such situations,the change-in-control benefit may alleviate some of the financial and career concerns often associated with achange-in-control, and enable our NEOs to focus on the proposed transaction. For more information about the termsof these change-in-control severance agreements, see the section below entitled “Executive Compensation — PotentialPayments Upon Termination or Change-in-Control.”
Section 162(m): U.S. federal tax law generally prohibits us from taking a tax deduction for certain compensation paid inexcess of $1 million to certain executive officers (and, beginning in 2018, certain former executive officers). Historically,compensation that qualified as “performance-based compensation” could be excluded from this $1 million limit.This exception was repealed, effective for taxable years beginning after December 31, 2017, except for certaincompensation arrangements in place as of and not modified after November 2, 2017 for which transition relief is available.We continue to evaluate the impact of the revisions to Section 162(m) of the Code for their potential impact on theCompany. Regardless of that impact, the Compensation Committee believes that the tax deduction limitation shouldnot be permitted to compromise our ability to design and maintain executive compensation arrangements that willattract, retain, motivate and reward executive talent needed to compete successfully. Accordingly, achieving the desiredflexibility in the design and delivery of compensation may result in compensation that in certain cases is not deductiblefor federal tax purposes. In addition, because of the uncertainties associated with the application and interpretationof Section 162(m) and the regulations issued thereunder, there can be no assurance that compensation intended to satisfythe requirements for deductibility under Section 162(m), as in effect prior to 2018, will in fact be deductible.
39 Compensation Discussion and Analysis Franklin Covey 2019 Annual Report

EXECUTIVE COMPENSATION
The Fiscal 2019 Summary Compensation Table below sets forth compensation information for our NEOs relating tofiscal 2019, fiscal 2018 and fiscal 2017 as applicable.
Fiscal 2019 Summary Compensation Table
Name and Principal Position YearSalary
($)Bonus
($)
StockAwards
($)
Non-EquityIncentive PlanCompensation
($)
All OtherCompensation
($)Total($)
Robert A. WhitmanChairman and CEO
2019 575,000 — 1,369,289 914,250 73,863 2,932,402
2018 566,442 367,500 1,150,000 575,000 70,666 2,729,608
2017 525,000 309,136 1,050,000 157,500 64,906 2,106,542
Stephen D. YoungCFO
2019 350,000 — 404,822 373,650 16,697 1,145,169
2018 351,347 164,500 350,000 235,000 16,407 1,117,254
2017 350,000 126,598 350,000 70,500 15,652 912,750
Paul S. WalkerPresident of Enterprise Division &Global Partnerships
2019 400,000 — 300,000 315,600 12,259 1,027,859
2018 379,546 140,000 300,000 200,000 13,160 1,032,706
2017 309,500 117,766 200,000 60,000 10,493 697,759
M. Sean CoveyPresident of Education Division
2019 300,000 — 200,000 324,600 135,523 960,123
2018 301,153 140,000 200,000 200,000 213,103 1,054,256
2017 300,000 117,766 200,000 60,000 206,340 884,106
Colleen DomExecutive Vice President of Operations
2019 300,000 — 200,000 315,600 10,592 826,192
Salary: The amounts reported in the “Salary” column for fiscal 2019 represent base salaries paid to each NEO for fiscal2019.
Stock Awards: The amounts reported in the “Stock Awards” column for fiscal 2019 represent the aggregate grant datefair value (computed in accordance with Financial Accounting Standards Board Accounting Standards CodificationTopic 718, or ASC Topic 718), based on the probable outcome of any applicable performance criteria, excluding the effectof estimated forfeitures, for the RSUs granted to NEOs as LTIP awards during fiscal 2019. The probable outcome ofthe RSUs granted during fiscal 2019 with performance conditions were based on the Company meeting the 100% targetfor both tranches with financial performance conditions (in other words, fiscal 2021 Qualified Adjusted EBITDA andfiscal 2021 Subscription Sales). Assuming the maximum performance level was achieved, the reported value of theaggregate LTIP RSUs for each of the NEOs in this column would be 200% of target as follows: Mr. Whitman, to $2,012,500;Mr. Young, to $612,500; Mr. Walker, to $525,000; Mr. Covey, to $350,000; and Ms. Dom, to $350,000 (for furtherinformation regarding these stock awards and the assumptions made in their valuation, refer to Note 12, Stock-BasedCompensation Plans, to our consolidated financial statements included in our Annual Report on Form 10-K for the fiscalyear ended August 31, 2019). Also included in the “Stock Awards” column is an incentive award for the CEO and CFOwhich have a two-year time based vesting condition.
Non-Equity Incentive Plan Compensation: The amounts reported in the “Non-Equity Incentive Plan Compensation”column for fiscal 2019 represent the amounts paid to each NEO under the STIP for formulaic fiscal 2019 achievement,which is discussed above in the section entitled “Compensation Discussion and Analysis — Analysis of Fiscal 2019Compensation Decisions and Actions.” Payouts are based on achieving objectives established annually and meetingannual financial targets. Incentive amounts were approved by the Compensation Committee and were paid followingthe conclusion of the fiscal year.
Franklin Covey 2019 Annual Report Executive Compensation 40

All Other Compensation: The amounts reported for fiscal 2019 in the “All Other Compensation” column are set forthin the “Fiscal 2019 All Other Compensation Table” below.
Name Year
CompanyContributions
to 401(k)Plan(a)
($)
Executive LifeInsurance
Premiums(b)
($)
ExecutiveDisability
Premiums(c)
($)Other
($)Total
($)Mr. Whitman 2019 8,284 8,084 50,778 6,717 73,863Mr. Young 2019 8,250 4,409 — 4,038 16,697Mr. Walker 2019 8,269 — — 3,990 12,259Mr. Covey 2019 8,479 — — 127,044(d) 135,523Ms. Dom 2019 6,231 — — 4,361 10,592(a) We match dollar-for-dollar the first 1% of salary contributed to the 401(k) plan and 50 cents on the dollar of the
next 4% of salary contributed. Our match for executives is the same match received by all associates who participatein the 401(k) plan.
(b) For the CEO and CFO, we maintain an executive life insurance policy with a face value of approximately 2.5 timestheir target annual cash compensation. These amounts show the annual premiums paid for each 20-year termexecutive life insurance policy.
(c) We provide Mr. Whitman with long-term disability insurance which, combined with our current group policy,provides, in the aggregate, monthly long-term disability benefits equal to approximately 75% of his fiscal 2019 targetcash compensation. The amount shows the premiums paid for Mr. Whitman’s supplemental long-term disabilitycoverage.
(d) For Mr. Covey, this amount includes $122,780 of royalties earned during fiscal 2019 from books he authored thatare used in our training and education businesses.
41 Executive Compensation Franklin Covey 2019 Annual Report

Fiscal 2019 Grants of Plan-Based Awards
The following table sets forth the plan-based awards that were granted to our NEOs during fiscal 2019. We grantedthree types of awards in fiscal 2019: annual incentive-based cash awards identified in the table as STIP; long-term LTIPequity awards in the form of service-based RSUs and long-term LTIP equity awards in the form of performance-basedRSUs.
Estimated Possible Payouts UnderNon-Equity Incentive Plan
AwardsEstimated Future Payouts Under
Equity Incentive Plan Awards
All OtherStock Awards:
Number ofShares of Stock
or Units(#)
GrantDate FairValue of
Stock and OptionAwards(e)
($)NameGrantDate
Threshold($)
Target($)
Maximum($)
Threshold(#)
Target(#)
Maximum(#)
Mr. WhitmanSTIP(a) — — 575,000 1,150,000 — — — — —LTIP RSUs(b) 1/25/2019 — — — — — — 8,936 219,289LTIP RSUs(c) 10/01/2018 — — — 18,423 36,844 73,688 — 862,500LTIP RSUs(d) 10/01/2018 — — — — — — 12,282 287,500Mr. YoungSTIP(a) — — 235,000 470,000 — — — — —LTIP RSUs(b) 1/25/2019 — — — — — — 2,234 54,822LTIP RSUs(c) 10/01/2018 — — — 5,607 11,214 22,428 — 262,500LTIP RSUs(d) 10/01/2018 — — — — — — 3,738 87,500Mr. WalkerSTIP(a) — — 200,000 400,000 — — — — —LTIP RSUs(c) 10/01/2018 — — — 4,806 9,612 19,223 — 225,000LTIP RSUs(d) 10/01/2018 — — — — — — 3,204 75,000Mr. CoveySTIP(a) — — 200,000 400,000 — — — — —LTIP RSUs(c) 10/01/2018 — — — 3,205 6,410 12,816 — 150,000LTIP RSUs(d) 10/01/2018 — — — — — — 2,136 50,000Ms. DomSTIP(a) — — 200,000 400,000 — — — — —LTIP RSUs(c) 10/01/2018 — — — 3,205 6,410 12,816 — 150,000LTIP RSUs(d) 10/01/2018 — — — — — — 2,136 50,000(a) These amounts relate to the STIP for the annual performance period ending August 31, 2019. For additional
information regarding the STIP, see the section above entitled “Compensation Discussion and Analysis — Analysisof Fiscal 2019 Compensation Decisions and Actions.” The actual payouts made to the NEOs for this program arereflected in the “Non-Equity Incentive Plan Compensation” column of the Fiscal 2019 Summary CompensationTable above.
(b) On January 25, 2019, Mr. Whitman and Mr. Young each received a supplemental time-based LTIP award, whichvests two years from the grant date, or January 25, 2021. For additional information about these equity awards, seethe section entitled “Compensation Discussion and Analysis — Analysis of Fiscal 2019 Compensation Decisionsand Actions” above.
(c) These amounts relate to the LTIP awards granted to the NEOs in the form of performance-based RSUs, whichvest based on fiscal 2021 Qualified Adjusted EBITDA and fiscal 2021 subscription sales. Payout for these awardsis expected, if at all, after August 31, 2021. For additional information about these equity awards, see the sectionentitled “Compensation Discussion and Analysis — Analysis of Fiscal 2019 Compensation Decisions and Actions”above.
(d) These amounts relate to the LTIP awards granted to the NEOs in the form of service-based RSUs, which vest onAugust 31, 2021. For additional information about these equity awards, see the section entitled “CompensationDiscussion and Analysis — Analysis of Fiscal 2019 Compensation Decisions and Actions” above.
Franklin Covey 2019 Annual Report Executive Compensation 42

(e) The amounts reported in the “Grant Date Fair Value of Stock and Option Awards” column for fiscal 2019 representthe aggregate grant date fair values (computed in accordance with ASC Topic 718), based on the probable outcomeof any applicable performance conditions, excluding the effect of estimated forfeitures, for the RSUs granted toNEOs as LTIP awards. For the performance-based RSUs, the fair value on the grant date was based on the probableoutcome that only the target award would vest.
Employment and Change-in-Control Severance Agreements
We do not maintain employment agreements with any of our NEOs, but we do maintain change-in-control severanceagreements with each of our NEOs. For more information about the terms of these change-in-control severanceagreements, see the section below entitled “Executive Compensation — Potential Payments Upon Termination orChange-in-Control.” Also see the section above entitled “Compensation Discussion and Analysis — Total CompensationMix” for more information about the mix of compensation elements for our NEOs.
Outstanding Equity Awards at Fiscal 2019 Year-End
The following equity awards granted to our NEOs were outstanding as of August 31, 2019.
Option Awards Stock Awards
NameGrantDate
Number ofSecurities
UnderlyingUnexercisedOptions (#)
Exercisable(a)
OptionExercisePrice ($)
OptionExpiration
Date
Number ofShares orUnits of
Stock ThatHave Not
Vested(#)
MarketValue ofShares orUnits of
Stock ThatHave Not
Vested($)(h)
Equity IncentivePlan Awards:Number ofUn-earned
Shares, Units orOther Rights
That Have NotVested
(#)
Equity IncentivePlan Awards:
Market orPayout Value of
Un-earnedShares, Units
or OtherRights ThatHave Not
Vested($)(j)
Mr. Whitman 1/25/19 — — — 8,936(b) 328,755 — —10/01/18 — — — — — 73,688(c) 2,710,98210/01/18 — — — 12,282(d) 451,855 — —11/14/17 — — — — — 89,610(e) 3,296,75211/14/17 — — — 14,935(f ) 549,459 — —10/18/16 — — — — — 27,146(g) 998,70111/12/15 — — — — — 33,980(h) 1,250,12411/21/14 — — — — — 25,350(i) 932,6279/28/11 — — — — — — —1/28/11 62,500 9.00 1/28/2021 — — — —1/28/11 62,500 10.00 1/28/2021 — — — —1/28/11 62,500 12.00 1/28/2021 — — — —1/28/11 62,500 14.00 1/28/2021 — — — —1/28/10 62,500 10.00 1/28/2020 — — — —1/28/10 62,500 12.00 1/28/2020 — — — —1/28/10 62,500 14.00 1/28/2020 — — — —
Mr. Young 1/25/19 — — — 2,234(b) 82,189 — —10/01/18 — — 22,428(c) 825,12610/01/18 3,738(d) 137,521 — —11/14/17 — — — — — 27,273(e) 1,003,37411/14/17 — — — 4,545(f ) 167,211 — —10/18/16 — — — — — 9,048(g) 332,87611/12/15 — — — — — 11,326(h) 416,68411/21/14 — — — — — 8,450(i) 310,8769/28/11 — — — — — — —1/28/10 43,750 10.00 1/28/2020 — — — —1/28/10 43,750 12.00 1/28/2020 — — — —1/28/10 43,750 14.00 1/28/2020 — — — —
43 Executive Compensation Franklin Covey 2019 Annual Report
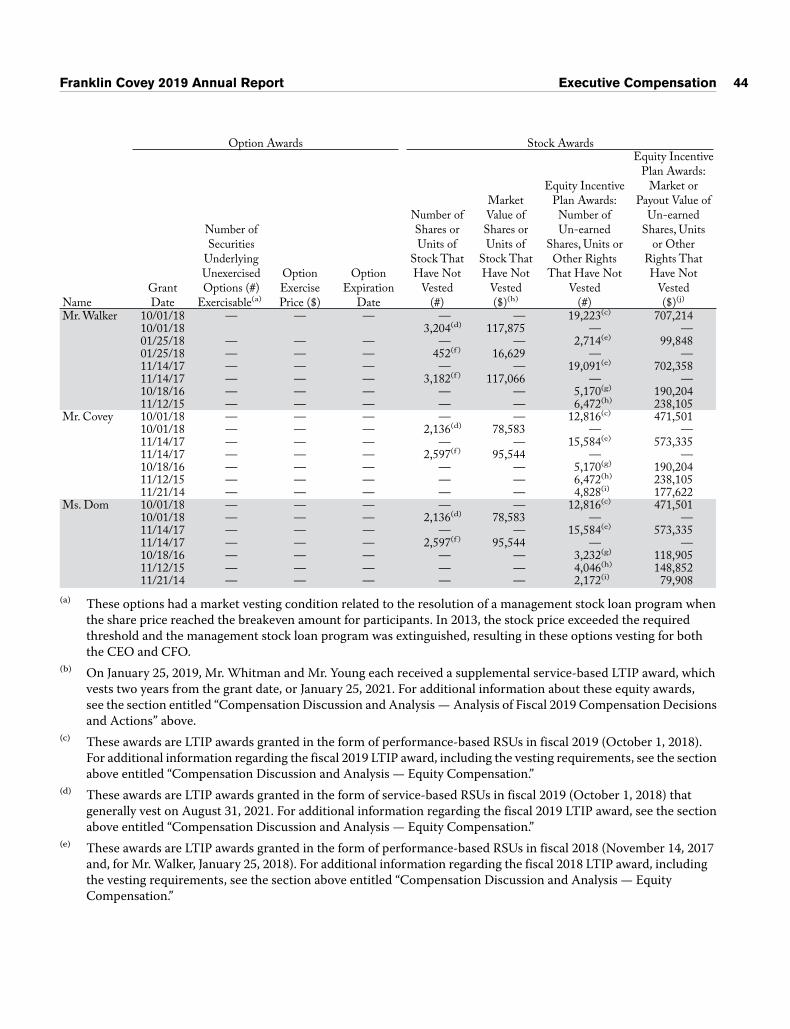
Option Awards Stock Awards
NameGrantDate
Number ofSecurities
UnderlyingUnexercisedOptions (#)
Exercisable(a)
OptionExercisePrice ($)
OptionExpiration
Date
Number ofShares orUnits of
Stock ThatHave Not
Vested(#)
MarketValue ofShares orUnits of
Stock ThatHave Not
Vested($)(h)
Equity IncentivePlan Awards:Number ofUn-earned
Shares, Units orOther Rights
That Have NotVested
(#)
Equity IncentivePlan Awards:
Market orPayout Value of
Un-earnedShares, Units
or OtherRights ThatHave Not
Vested($)(j)
Mr. Walker 10/01/18 — — — — — 19,223(c) 707,21410/01/18 3,204(d) 117,875 — —01/25/18 — — — — — 2,714(e) 99,84801/25/18 — — — 452(f ) 16,629 — —11/14/17 — — — — — 19,091(e) 702,35811/14/17 — — — 3,182(f ) 117,066 — —10/18/16 — — — — — 5,170(g) 190,20411/12/15 — — — — — 6,472(h) 238,105
Mr. Covey 10/01/18 — — — — — 12,816(c) 471,50110/01/18 — — — 2,136(d) 78,583 — —11/14/17 — — — — — 15,584(e) 573,33511/14/17 — — — 2,597(f ) 95,544 — —10/18/16 — — — — — 5,170(g) 190,20411/12/15 — — — — — 6,472(h) 238,10511/21/14 — — — — — 4,828(i) 177,622
Ms. Dom 10/01/18 — — — — — 12,816(c) 471,50110/01/18 — — — 2,136(d) 78,583 — —11/14/17 — — — — — 15,584(e) 573,33511/14/17 — — — 2,597(f ) 95,544 — —10/18/16 — — — — — 3,232(g) 118,90511/12/15 — — — — — 4,046(h) 148,85211/21/14 — — — — — 2,172(i) 79,908
(a) These options had a market vesting condition related to the resolution of a management stock loan program whenthe share price reached the breakeven amount for participants. In 2013, the stock price exceeded the requiredthreshold and the management stock loan program was extinguished, resulting in these options vesting for boththe CEO and CFO.
(b) On January 25, 2019, Mr. Whitman and Mr. Young each received a supplemental service-based LTIP award, whichvests two years from the grant date, or January 25, 2021. For additional information about these equity awards,see the section entitled “Compensation Discussion and Analysis — Analysis of Fiscal 2019 Compensation Decisionsand Actions” above.
(c) These awards are LTIP awards granted in the form of performance-based RSUs in fiscal 2019 (October 1, 2018).For additional information regarding the fiscal 2019 LTIP award, including the vesting requirements, see the sectionabove entitled “Compensation Discussion and Analysis — Equity Compensation.”
(d) These awards are LTIP awards granted in the form of service-based RSUs in fiscal 2019 (October 1, 2018) thatgenerally vest on August 31, 2021. For additional information regarding the fiscal 2019 LTIP award, see the sectionabove entitled “Compensation Discussion and Analysis — Equity Compensation.”
(e) These awards are LTIP awards granted in the form of performance-based RSUs in fiscal 2018 (November 14, 2017and, for Mr. Walker, January 25, 2018). For additional information regarding the fiscal 2018 LTIP award, includingthe vesting requirements, see the section above entitled “Compensation Discussion and Analysis — EquityCompensation.”
Franklin Covey 2019 Annual Report Executive Compensation 44

(f ) These awards are LTIP awards granted in the form of service-based RSUs in fiscal 2018 (November 14, 2017 and,for Mr. Walker, January 25, 2018) that generally vest on August 31, 2020. For additional information regarding thefiscal 2018 LTIP award, see the section above entitled “Compensation Discussion and Analysis — EquityCompensation.”
(g) These awards are LTIP awards granted in fiscal 2017 (October 18, 2016). The number of shares that may be awardedunder the RSUs to the participants is based on six individual vesting conditions that are divided into two performancemeasures: (1) trailing four-quarter LTIP Adjusted EBITDA, which equals Adjusted EBITDA plus the change indeferred revenue (less certain costs), and excludes the impact of foreign exchange and (2) increased All Access Passsales. Multi-year LTIP Adjusted EBITDA targets for this award (excluding the impact of fluctuations in foreigncurrency exchange rates and STIP) are $36.7 million, $41.8 million and $47.7 million (70% of the award shares), andthe targets related to All Access Pass sales are $30.1 million, $35.4 million and $40.8 million (30% of the awardshares). As of August 31, 2019, participants had vested in all three tranches of 18,338 shares related to All AccessPass sales and the first tranche of 42,789 shares related to LTIP Adjusted EBITDA. All other tranches of this awardremain unvested.
(h) These awards are LTIP awards granted in fiscal 2016 (November 12, 2015). The number of shares that may beawarded under the RSUs to the participants is based on six individual vesting conditions that are divided into twoperformance measures: (1) trailing four-quarter LTIP Adjusted EBITDA, which equals Adjusted EBITDA plusthe change in deferred revenue (less certain costs), and excludes the impact of foreign exchange and (2) increasedsales of the Organization Development Suite (OD Suite) of offerings. The OD Suite is defined as Leadership,Productivity and Trust offerings. Multi-year LTIP Adjusted EBITDA targets for this award (excluding the impactof fluctuations in foreign currency exchange rates and STIP) are $36.0 million, $40.0 million and $44.0 million (70%of the award shares), and the targets related to increased sales of the OD Suite are $107.0 million, $116.0 millionand $125.0 million (30% of the award shares). As of August 31, 2019, participants had vested in all three tranches of23,128 shares related to increased OD Suite sales and the first tranche of 53,964 shares related to LTIP AdjustedEBITDA. All other tranches of this award remain unvested.
(i) These awards are LTIP awards granted in fiscal 2015 (November 21, 2014). The number of shares that may beawarded to the participants is based on six individual vesting conditions that are divided into two performancemeasures: (1) trailing four-quarter LTIP Adjusted EBITDA and (2) increased sales of the OD Suite of offerings.Multi-year LTIP Adjusted EBITDA targets for this award are $39.6 million, $45.5 million and $52.3 million (70%of the award shares), and the targets related to increased sales of the OD Suite are $107.0 million, $118.0 million and$130.0 million (30% of the award shares). As of August 31, 2019, participants had vested in all three tranches of11,247 shares related to increased OD Suite sales and the first tranche of 26,241 shares related to LTIP AdjustedEBITDA. All other tranches of this award remain unvested and it is anticipated that at least one tranche will not vestprior to the expiration date.
(j) Values were determined by multiplying the target number of RSUs or other performance awards, or the numberof service-based RSUs, by the closing price per share of the Company’s common stock on the NYSE on August 31,2019 of $36.79.
Fiscal 2019 Option Exercises and Stock Vested
There were no options exercised or stock awards that vested during fiscal 2019.
Potential Payments Upon Termination or Change-in-Control
Severance Benefits Upon Termination Without Cause
Our NEOs are subject to the same general (non-change-in-control) severance policies as all Franklin Covey employees.Under our severance policy, Company employees, including each of the NEOs, who are terminated involuntarily bythe Company without cause receive a lump-sum payment equal to one week’s salary for every $10,000 of their annualtotal targeted cash compensation. Additionally, we pay COBRA medical and dental premiums for the term of the
45 Executive Compensation Franklin Covey 2019 Annual Report

severance period. As a condition to receipt of severance benefits, the NEO must agree to abide by specific non-compete,non-solicitation and confidentiality requirements. The target total severance payment equals the target annual cashcompensation plus target COBRA premiums for the severance period. The COBRA benefits are generally limited to18 months for all NEOs. The amounts below assume that each NEO experienced a qualifying termination of employmenton August 31, 2019 (the last business day of fiscal 2019).
Estimated Severance Amounts as of August 31, 2019
Name Year
TargetTotal
SeverancePayment
($)
BaseSalary
($)
Target AnnualSTIP($)
TargetAnnual Cash
Compensation($)
TargetSeverance
Compensation(ExcludingCOBRA)
($)
TargetCOBRA
Premiums($)
Mr. Whitman 2019 2,578,872 575,000 575,000 1,150,000 2,543,269 35,603Mr. Young 2019 682,016 350,000 235,000 585,000 663,750 18,266Mr. Covey 2019 503,407 300,000 200,000 500,000 480,769 22,638Mr. Walker 2019 719,474 400,000 200,000 600,000 692,308 27,166Ms. Dom 2019 503,407 300,000 200,000 500,000 480,769 22,638
Change-in-Control Severance Benefit
The Company has entered into a change-in-control severance agreement with each NEO. Under the terms of theagreements, upon the occurrence of a change-in-control and a qualifying termination, each NEO is entitled to a lump-sumseverance payment equal to one time his or her current annual total targeted cash compensation, plus reimbursementof premiums to secure medical benefit continuation coverage for a period of one year. The target total severance paymentequals the target annual cash compensation plus target COBRA premiums for the severance period. There are noexcise tax gross-ups provided under the agreements. The amounts below assume that each NEO experienced a qualifyingtermination of employment on August 31, 2019.
Estimated Change-in-Control Severance Amounts as of August 31, 2019
Name Year
TargetTotal
SeverancePayment
($)
BaseSalary
($)
Target AnnualSTIP($)
TargetAnnual
CashCompensation
($)
TargetCOBRA
Premiums for12 Months
($)Mr. Whitman 2019 1,166,099 575,000 575,000 1,150,000 16,099Mr. Young 2019 601,099 350,000 235,000 585,000 16,099Mr. Covey 2019 523,544 300,000 200,000 500,000 23,544Mr. Walker 2019 533,404 400,000 200,000 600,000 23,544Ms. Dom 2019 523,544 300,000 200,000 500,000 23,544
Franklin Covey 2019 Annual Report Executive Compensation 46

Compensation Committee Report
Our Compensation Committee reviewed the Compensation Discussion and Analysis (CD&A), as prepared bymanagement of Franklin Covey, and discussed the CD&A with management of Franklin Covey. Based on the Committee’sreview and discussions, the Committee recommended to the Board that the CD&A be included in this Proxy Statementand in the Company’s Annual Report on Form 10-K for the fiscal year ended August 31, 2019.
COMPENSATION COMMITTEE:
E. Kay Stepp, ChairDennis HeinerMichael FungAnne Chow
CEO Pay Ratio Disclosure• The Dodd-Frank Wall Street Reform and Consumer Protection Act (Dodd-Frank Act) requires the Company to
disclose the ratio of the CEO’s annual total compensation (under the Summary Compensation Table definition) tothat of the Company’s median employee (excluding the CEO) using the same methodology.
• Our CEO’s compensation for fiscal 2019, as disclosed in the Summary Compensation Table, is $2,932,402. Theannual total compensation for our median employee is $91,996. The ratio between the CEO’s and median employee’sannual total compensation as of August 31, 2019 is 32:1.
• We did not experience any change in our employee population or compensation arrangements during fiscal 2019compared to fiscal 2018 that we reasonably believe would significantly impact our pay ratio disclosure. Therefore, aspermitted under SEC rules, we have used the same median employee compensation as we did in fiscal 2018. Todetermine the median employee, we prepared a list of our full employee population as of June 30, 2018. The populationincluded all US and non-US employees, whether employed on a full-time, part-time, temporary or seasonal basis.
• We established a consistently applied compensation measure inclusive of total cash paid from July 1, 2017 throughJune 30, 2018. We annualized compensation for employees hired during that time. Non-US employee compensationwas converted to US dollars based on applicable exchange rates as of June 30, 2018.
• We believe that the ratio is a reasonable estimate calculated in a manner consistent with Item 402(u) of SECRegulation S-K. Given the rule’s flexibility, the method the Company used to determine the median employee maybe different from its peers, so the ratios may not be comparable.
47 Compensation Committee Report Franklin Covey 2019 Annual Report

AUDIT COMMITTEE REPORT
The following is the report of the Audit Committee with respect to our audited financial statements for the fiscal yearended August 31, 2019. The information contained in this report shall not be deemed “soliciting material” or otherwiseconsidered “filed” with the SEC, and such information shall not be incorporated by reference under the Exchange Act exceptto the extent that we specifically incorporate such information by reference in such filing.
The Audit Committee assists the Board of Directors in fulfilling its responsibility for oversight of the quality andintegrity of the accounting, auditing, and reporting practices of the Company. The Audit Committee is comprisedentirely of independent directors and operates in accordance with a written charter, which was adopted by the Board ofDirectors. A copy of that charter is available on our website at www.franklincovey.com. Each member of the AuditCommittee is “independent,” as required by the applicable listing standards of the New York Stock Exchange and therules of the SEC.
The Audit Committee oversees the Company’s financial reporting process on behalf of the Board of Directors. TheCompany’s management has primary responsibility for the financial statements and reporting process, including theCompany’s internal control over financial reporting. The independent registered public accounting firm is responsiblefor performing an integrated audit of the Company’s financial statements and internal control over financial reportingin accordance with the auditing standards of the Public Company Accounting Oversight Board.
In fulfilling its oversight responsibilities, the Audit Committee reviewed and discussed with management the auditedfinancial statements to be included in the Annual Report on Form 10-K for the fiscal year ended August 31, 2019. Thisreview included a discussion of the quality and the acceptability of the Company’s financial reporting and system ofinternal controls, including the clarity of disclosures in the financial statements. The Audit Committee also reviewedand discussed with the Company’s independent registered public accounting firm the audited financial statements of theCompany for the fiscal year ended August 31, 2019, their judgments as to the quality and acceptability of the Company’sfinancial reporting, and such other matters as are required to be discussed by Public Company Accounting OversightBoard standards.
The Audit Committee obtained from the independent registered public accountants a formal written statementdescribing all relationships between the auditors and the Company that might bear on the auditors’ independenceconsistent with applicable requirements of the Public Company Accounting Oversight Board and discussed with theauditors any relationships that may impact their objectivity and independence, and satisfied itself as to the auditors’independence. The Audit Committee meets periodically with the independent registered public accounting firm, withand without management present, to discuss the results of the independent registered public accounting firm’sexaminations and evaluations of the Company’s internal control and the overall quality of the Company’s financialreporting.
Based upon the review and discussions referred to above, the Audit Committee recommended that the Company’saudited financial statements be included in the Company’s Annual Report on Form 10-K for the fiscal year endedAugust 31, 2019, for filing with the SEC.
Date: November 6, 2019
Michael Fung, ChairmanAnne H. ChowDennis G. HeinerE. Kay Stepp
Franklin Covey 2019 Annual Report Audit Committee Report 48
OVERVIEW OF PROPOSALS
This Proxy Statement includes three proposals requiring shareholder action. Proposal No. 1 requests the election ofnine directors to the Board of Directors. Proposal No. 2 requests an advisory vote on executive compensation. ProposalNo. 3 requests the ratification of Deloitte & Touche, LLP as our independent registered public accounting firm forfiscal 2020. Each of these proposals is discussed in more detail in the pages that follow.
Proposal No. 1
ELECTION OF DIRECTORS
At the Annual Meeting, nine directors are to be elected to serve until the next annual meeting of shareholders anduntil their successors shall be duly elected and qualified. Our director nominees have a great diversity of experiencesand bring to our Board a wide variety of skills, qualifications, and viewpoints that strengthen their ability to carry outtheir oversight role on behalf of our shareholders. They have developed their skills and gained experience across a broadrange of industries and disciplines in both established and growth markets. The biographies contained in the sectionof this Proxy Statement entitled, “Nominees for Election to the Board of Directors” describe the many areas of individualexpertise that each director nominee brings to our board.
Unless the shareholder indicates otherwise, each proxy will be voted in favor of the nine nominees listed below. Each ofthe nominees is currently serving as a Director of the Company. If any of the nominees should be unavailable to serve,which is not now anticipated, the proxies solicited hereby will be voted for such other persons as shall be designated bythe present Board of Directors.
Vote Required
The nine nominees receiving the highest number of affirmative votes of the shares entitled to be voted for them, up tothe nine directors to be elected by those shares, will be elected as directors to serve until the next annual meeting ofshareholders and until their successors are duly elected and qualified. Abstentions and broker non-votes will have noeffect on the election of directors.
Pursuant to the Company’s bylaws, any nominee for director who receives a greater number of votes “withheld” or“against” from his or her election than votes “for” his or her election shall immediately offer to tender his or herresignation following certification of such shareholder vote. The Nominating Committee shall promptly consider thedirector’s resignation offer and make a recommendation to the Board of Directors on whether to accept or reject the offer.The Board of Directors shall act on the recommendation of the Nominating Committee and publicly disclose itsdecision within 90 days following certification of the shareholder vote.
Recommendation of the Board
The Board of Directors recommends that shareholders vote FOR the election of Anne H. Chow, Clayton M.Christensen, Michael Fung, Dennis G. Heiner, Donald J. McNamara, Joel C. Peterson, E. Kay Stepp, Derek C.M.Van Bever, and Robert A. Whitman.
49 Overview of Proposals Franklin Covey 2019 Annual Report

Proposal No. 2
ADVISORY VOTE ON EXECUTIVE COMPENSATION
In accordance with the requirements of Section 14A of the Exchange Act (which was added by the Dodd-Frank WallStreet Reform and Consumer Protection Act) and the related rules of the SEC, the Company is providing its shareholderswith the opportunity to cast an advisory vote on executive compensation as described below. We believe that it isappropriate to seek the views of shareholders on the design and effectiveness of our executive compensation program.
The overall goal of our executive compensation program is to attract, motivate, and retain a talented and creative team ofexecutives who will provide leadership for our success in dynamic and competitive markets. The Company seeks toaccomplish this goal in a way that rewards performance and that is aligned with shareholders’ long-term interests. Webelieve that our executive compensation program, which utilizes both short-term cash awards and long-term equityawards, satisfies this goal and is strongly aligned with the long-term interest of our shareholders.
The Compensation Discussion and Analysis, as presented within this Proxy Statement, describes the Company’sexecutive compensation program and the decisions made by the Compensation Committee during fiscal 2019 in moredetail. We believe that the compensation program for the Named Executive Officers is instrumental in helping theCompany achieve financial goals. Please refer to the information contained in the Compensation Discussion and Analysisas you consider this proposal.
We are asking the shareholders to vote on the following resolution:
RESOLVED, that the shareholders hereby approve the compensation of the Company’s Named Executive Officers, asdisclosed in this Proxy Statement pursuant to Item 402 of Regulation S-K, including the Compensation Discussion andAnalysis, compensation tables, and narrative disclosure.
As an advisory vote, this proposal is not binding upon the Company. However, the Compensation Committee, which isresponsible for designing and administering our executive compensation program, values the opinions expressed byshareholders in their vote on this proposal and will consider the outcome of the vote when making future compensationdecisions for the Named Executive Officers. We currently intend to include a shareholder advisory vote on our executivecompensation program each year at our annual meeting of shareholders.
Vote Required
Approval of Proposal No. 2 requires that the number of votes cast in favor of the proposal exceeds the number of votescast in opposition. Abstentions and broker non-votes will not have any effect on the outcome of this proposal.
Recommendation of the Board
The Board recommends that shareholders vote FOR Proposal No. 2.
Franklin Covey 2019 Annual Report Overview of Proposals 50

Proposal No. 3
RATIFICATION OF APPOINTMENT OF INDEPENDENT REGISTERED PUBLIC ACCOUNTING FIRM
The Audit Committee has selected the independent registered public accounting firm Deloitte & Touche, LLP to auditour financial statements for fiscal 2020. Deloitte began serving as our independent registered public accounting firmin the third quarter of fiscal 2016. The Board of Directors anticipates that one or more representatives of Deloitte will bepresent at the Annual Meeting, will have the opportunity to make a statement if they desire to do so and will be availableto respond to appropriate questions.
Principal Accountant Fees
The following table shows the fees accrued or paid to our independent registered public accounting firm for thefiscal years ended August 31, 2019 and 2018:
Fiscal 2019 Fiscal 2018Audit Fees(1) $648,414 $708,979Audit-Related Fees(2) 13,500 —Tax Fees(3) 48,694 29,400All Other Fees(4) — —
$710,608 $738,379
(1) Audit fees represent fees and expenses for professional services provided in connection with the audit of ourconsolidated financial statements and the effectiveness of internal controls over financial reporting found in theAnnual Report on Form 10-K and reviews of our financial statements contained in Quarterly Reports on Form 10-Q,procedures related to registration statements, accounting consultations on actual transactions, and audit servicesprovided in connection with other statutory filings.
(2) Audit-Related Fees consist of fees for services on a registration statement on Form S-8.(3) Tax Fees consisted primarily of fees and expenses for services related to tax compliance, tax planning, and tax
consulting.(4) Deloitte did not provide any “other services” during the periods presented.
The Audit Committee pre-approves all services to be performed by our independent registered public accountants andsubsequently reviews the actual fees and expenses paid to them. All of the audit-related services and tax servicesprovided by our independent registered public accounting firm during the fiscal years ended August 31, 2019 and 2018were pre-approved by the Audit Committee. The Audit Committee has determined that the fees paid for non-auditservices are compatible with maintaining independence as our independent registered public accountants.
Vote Required
The ratification of the appointment of Deloitte & Touche, LLP as our independent registered public accountantsrequires that the number of votes cast in favor of the proposal exceeds the number of votes cast in opposition. Abstentionsand broker non-votes will not have any effect on the outcome of this proposal.
Board Recommendation
The Board recommends that shareholders vote FOR the appointment of Deloitte & Touche, LLP as the Company’sindependent registered public accountants.
51 Overview of Proposals Franklin Covey 2019 Annual Report

OTHER MATTERS
As of the date of this Proxy Statement, the Board of Directors knows of no other matters to be presented for action atthe meeting. However, if any further business should properly come before the meeting, the persons named as proxies inthe accompanying form of proxy will vote on such business in accordance with their best judgment.
PROPOSALS OF SHAREHOLDERS
Requirements for Shareholder Proposals to be Considered for Inclusion in Our Proxy Materials
Shareholders may present proposals for inclusion in our proxy statement and form of proxy for the annual meeting ofshareholders to be held in calendar year 2021, provided that such proposals must be received by us, at our executiveoffices (2200 West Parkway Boulevard, Salt Lake City, Utah 84119-2331) no later than August 22, 2020, provided thatthis date may be changed in the event that the date of the annual meeting of shareholders to be held in calendar year 2021is changed by more than 30 days from the date of the annual meeting of shareholders to be held in calendar year 2020.Such proposals must also comply with the requirements as to form and substance established by the SEC if such proposalsare to be included in our proxy statement and form of proxy.
Requirements for Shareholder Proposals to be Brought Before the Annual Meeting
Our bylaws provide that, except in the case of proposals made in accordance with Rule 14a-8, for shareholder nominationsto the Board of Directors or other proposals to be considered at an annual meeting of shareholders, the shareholdermust have given timely notice thereof in writing to the Secretary of Franklin Covey not less than 60 nor more than 90calendar days prior to the anniversary of the date of the immediately preceding annual meeting. To be timely for theannual meeting of shareholders to be held in calendar year 2021, a shareholder’s notice must be delivered or mailed to,and received by, our Secretary at our executive offices (2200 West Parkway Boulevard, Salt Lake City, Utah 84119-2331)between October 27, 2020 and November 25, 2020. However, in the event that the annual meeting is called for a date thatis not within 30 calendar days of the anniversary of the date on which the immediately preceding annual meeting ofshareholders was called, to be timely, notice by the shareholder must be so received not earlier than the close of businesson the 90th day prior to such annual meeting and not later than the close of business on the later of either (i) the 60th
day prior to such annual meeting, or (ii) the close of business on the tenth day following the day on which notice of thedate of the meeting was mailed or public disclosure of the date of the meeting was made by the Company, whicheveroccurs first. In no event will the public announcement of an adjournment of an annual meeting of shareholderscommence a new time period for the giving of a shareholder’s notice as provided above. A shareholder’s notice to ourSecretary must set forth the information required by our bylaws with respect to each matter the shareholder proposes tobring before the annual meeting.
Pursuant to rules adopted by the SEC, if a shareholder intends to propose any matter for a vote at our annual meetingto be held in calendar year 2020 but fails to notify us of that intention prior to November 6, 2019, then a proxy solicitedby the Board of Directors may be voted on that matter in the discretion of the proxy holder, provided that this datemay be changed in the event that the date of the annual meeting of shareholders to be held in calendar year 2020 ischanged by more than 30 days from the date of the annual meeting of shareholders held in calendar year 2019.
Franklin Covey 2019 Annual Report Other Matters/Proposals of Shareholders 52

WHERE YOU CAN FIND MORE INFORMATION
We file annual, quarterly, and current reports, proxy statements and other information with the SEC. These filings arealso available to the public from the SEC’s web site at http://www.sec.gov.
We will provide without charge to any person from whom a Proxy is solicited by the Board of Directors, uponthe written request of such person, a copy of our 2019 Annual Report on Form 10-K, including the financialstatements and schedules thereto (as well as exhibits thereto, if specifically requested), required to be filed withthe Securities and Exchange Commission. Written requests for such information should be directed to FranklinCovey Co., Investor Relations Department, 2200 West Parkway Boulevard, Salt Lake City, Utah 84119-2331, Attn:Mr. Stephen D. Young.
You should rely only on the information contained in this Proxy Statement. We have not authorized anyone to provideyou with information different from that contained in this Proxy Statement. The information contained in this ProxyStatement is accurate only as of the date of this Proxy Statement, regardless of the time of delivery of this Proxy Statement.
53 Where You Can Find More Information Franklin Covey 2019 Annual Report

DIRECTIONS TO THE ANNUAL MEETING
W Parkway Blvd.
N
Red
wood
Road
21st South Freeway
Deck
er Lak
e Blvd
.
Ban
gerter High
way
Directions to FranklinCovey from Provo/South
♦ Take I-15 North to the 21st South Freeway;merge onto the 21st South Freeway Westbound
♦ Take the Redwood Road exit♦ Turn left (South) onto Redwood Road.♦ Turn right at Parkway Blvd. (2495 South), this
intersection has a traffic light, gas station oncorner
♦ You will pass UPS on your right♦ FranklinCovey will be the block after UPS on
your right♦ 2200 West Parkway Blvd., Salt Lake City,
UT 84119♦ Park at the Washington Building, this building
has 3 big flagpoles at the front door♦ Receptionist in the Washington building will be
able to help you
Directions to Franklin Covey from Downtown/North♦ If entering I-15 from 600 South on-ramp
southbound♦ Take the 21st South Freeway♦ Take the first exit off 21st South Freeway which is
Redwood Road♦ Turn left (South) onto Redwood Road.♦ Turn right at Parkway Blvd. (2495 South), this
intersection has a traffic light, gas station oncorner
♦ You will pass UPS on your right♦ FranklinCovey will be the block after UPS on
your right♦ 2200 West Parkway Blvd., Salt Lake City,
UT 84119♦ Park at the Washington Building, this building
has 3 big flagpoles at the front door♦ Receptionist in the Washington building will be
able to help you
If you need further assistance or additional directions, please call our receptionist at (801) 817-1776.
Franklin Covey 2019 Annual Report Directions to the Annual Meeting 54

APPENDIX A
ADJUSTED EBITDA RECONCILIATION TO NET INCOME (LOSS)
For fiscal 2014 to fiscal 2019, Adjusted EBITDA means net income or loss excluding the impact of interest expense,income tax expense, amortization, depreciation, share-based compensation expense, adjustments to the fair value ofcontingent earn out liabilities, and certain other items. The Company references this non-GAAP financial measure in itsdisclosure and decision making because it provides supplemental information that facilitates consistent internalcomparisons to the historical operating performance of prior periods and the Company believes it provides investorswith greater transparency to evaluate operational activities and financial results.
Reconciliation of Net Income (Loss) to Adjusted EBITDA(in thousands and unaudited)
Fiscal Year Ended August 31,2019 2018 2017 2016 2015 2014
Reconciliation of net income (loss) to Adjusted EBITDA:Net income (loss) $ (1,023) $ (5,887) $(7,172) $ 7,016 $11,116 $18,067Adjustments:
Interest expense, net 2,063 2,154 2,029 1,938 1,754 1,810Discount on related party receivable — — — — 363 1,196Income tax provision (benefit) 1,615 367 (3,737) 4,895 6,296 3,692Amortization 4,976 5,368 3,538 3,263 3,727 3,954Depreciation 6,364 5,161 3,879 3,677 4,142 3,383Stock-based compensation 4,789 2,846 3,658 3,121 2,536 3,534Increase (decrease) to the fair value of contingent earn-out
liabilities 1,334 1,014 (1,936) 1,538 35 (1,579)Impairment of related party receivable — — — — — 363Impairment of assets — — — — 1,302 —Costs to exit Japan publishing business — — 2,107 — — —Restructuring costs — — 1,482 776 587 —ERP system implementation costs — 855 1,404 448 — —Business acquisition costs — — 442 — — —Contract termination costs — — 1,500 — — —Licensee transition costs 488 — 505 222 — —
$20,606 $11,878 $ 7,699 $26,894 $31,858 $34,420
55 Adjusted EBITDA Reconciliation to Net Income (Loss) Franklin Covey 2019 Annual Report

Form 10-K

UNITED STATESSECURITIES AND EXCHANGE COMMISSION
Washington, D.C. 20549
FORM 10-K☑ ANNUAL REPORT PURSUANT TO SECTION 13 OR 15(d) OF THE SECURITIES EXCHANGE ACT OF 1934
FOR THE FISCAL YEAR ENDED AUGUST 31, 2019OR
☐ TRANSITION REPORT PURSUANT TO SECTION 13 OR 15(d) OF THE SECURITIES EXCHANGE ACT OF1934 FOR THE TRANSITION PERIOD FROM ___ TO ___
FRANKLIN COVEY CO.(Exact name of registrant as specified in its charter)
Utah 1-11107 87-0401551(State or other jurisdiction
of incorporation or organization)(Commission File No.) (IRS Employer
Identification No.)2200 West Parkway Boulevard
Salt Lake City, Utah 84119-2331(Address of principal executive offices, including zip code)
Registrant’s telephone number, including area code: (801) 817-1776Securities registered pursuant to Section 12(b) of the Act:
Title of Each Class Name of Each Exchange on Which RegisteredCommon Stock, $.05 Par Value New York Stock Exchange
Securities registered pursuant to Section 12(g) of the Act: NoneIndicate by check mark if the registrant is a well-known seasoned issuer, as defined in Rule 405 of the Securities Act. Yes ☐ No ☑
Indicate by check mark if the registrant is not required to file reports pursuant to Section 13 or Section 15(d) of the Act. Yes ☐ No ☑
Indicate by check mark whether the Registrant (1) has filed all reports required to be filed by Section 13 or 15(d) of the Securities Exchange Act of1934 during the preceding 12 months (or for such shorter period that the Registrant was required to file such reports), and (2) has been subject to suchfiling requirements for the past 90 days. Yes ☑ No ☐
Indicate by check mark whether the registrant has submitted electronically and posted on its corporate Website, if any, every Interactive Data Filerequired to be submitted and posted pursuant to Rule 405 of Regulation S-T (§232.405 of this chapter) during the preceding 12 months (or for suchshorter period that the registrant was required to submit and post such files). Yes ☑ No ☐
Indicate by check mark whether the registrant is a large accelerated filer, an accelerated filer, a non-accelerated filer, a smaller reporting company, oran emerging growth company. See definitions of “large accelerated filer,” “accelerated filer,” “smaller reporting company,” and “emerging growthcompany” in Rule 12b-2 of the Exchange Act:Large Accelerated Filer ☐ Accelerated Filer ☑
Non-accelerated Filer ☐ Smaller Reporting Company ☑
Emerging growth company ☐
If an emerging growth company, indicate by check mark if the registrant has elected not to use the extended transition period for complying with anynew or revised financial accounting standards provided pursuant to Section 13(a) of the Exchange Act. ☐
Indicate by check mark whether the registrant is a shell company (as defined in Rule 12b-2 of the Exchange Act). Yes ☐ No ☑
As of February 28, 2019, the aggregate market value of the Registrant’s Common Stock held by non-affiliates of the Registrant was approximately$175.4 million, which was based upon the closing price of $26.02 per share as reported by the New York Stock Exchange.As of October 31, 2019, the Registrant had 13,982,356 shares of Common Stock outstanding.
DOCUMENTS INCORPORATED BY REFERENCEParts of the Registrant’s Definitive Proxy Statement for the Annual Meeting of Shareholders, which is scheduled to be held on January 24, 2020, areincorporated by reference in Part III of this Form 10-K.
Form 10-K Franklin Covey 2019 Annual Report
PART IDisclosure Regarding Forward-Looking Statements
This Annual Report on Form 10-K contains “forward-looking statements” within the meaning of Section 27Aof the Securities Act of 1933, as amended (the SecuritiesAct), and Section 21E of the Securities Exchange Act of1934, as amended (the Exchange Act), and suchforward-looking statements involve risks anduncertainties. Statements about future sales, costs,margins, cost savings, foreign currency exchange rates,earnings, earnings per share, cash flows, plans, objectives,expectations, growth, or profitability are forward-lookingstatements based on management’s estimates,assumptions, and projections. Words such as “could,”“may,” “will,” “should,” “likely,” “anticipates,” “expects,”“intends,” “plans,” “projects,” “believes,” “estimates,” andvariations on such words, including similar expressions,are used to identify these forward-looking statements.These forward-looking statements are only predictions,subject to risks and uncertainties, and actual results coulddiffer materially from those discussed in this, and otherreports, filed with the Securities and ExchangeCommission (SEC) and elsewhere. Forward-lookingstatements are not guarantees of future performance andinvolve risks, uncertainties, and assumptions that aredifficult to predict. Risks, uncertainties, and other factorsthat might cause such differences, some of which couldbe material, include, but are not limited to, the factorsdiscussed under the section of this report entitled “RiskFactors.”
Forward-looking statements in this report are based onmanagement’s current views and assumptions regardingfuture events and speak only as of the date when made.Franklin Covey Co. undertakes no obligation to publiclyupdate or revise any forward-looking statements, whetheras a result of new information, future events or otherwise,except as required by the federal securities laws.
In this Annual Report on Form 10-K, unless the contextrequires otherwise, the terms “the Company,” “FranklinCovey,” “us,” we,” and “our” refer to Franklin Covey Co. andits subsidiaries.
ITEM 1. BUSINESSGeneral Information
Franklin Covey is a global company focused onorganizational performance improvement. Our missionis to “enable greatness in people and organizations
everywhere,” and our global structure is designed to helpindividuals and organizations achieve sustained superiorperformance through changes in human behavior.From the foundational work of Dr. Stephen R. Covey inleadership and personal effectiveness, and Hyrum W.Smith in productivity and time management, we havedeveloped deep expertise that extends to helpingorganizations and individuals achieve lasting behavioralchange in seven crucial areas: Leadership, Execution,Productivity, Trust, Sales Performance, Customer Loyalty,and Educational Improvement. We believe that ourclients are able to utilize our content and offerings tocreate cultures whose hallmarks are high-performing,collaborative individuals, led by effective, trust buildingleaders who execute with excellence and delivermeasurably improved results for all of their keystakeholders.
The Company was incorporated in 1983 under the lawsof the state of Utah, and we merged with the CoveyLeadership Center in 1997 to form Franklin Covey Co.Our consolidated net sales for the fiscal year endedAugust 31, 2019 totaled $225.4 million and our shares ofcommon stock are traded on the New York StockExchange (NYSE) under the ticker symbol “FC.”
Our fiscal year ends on August 31 of each year. Unlessotherwise noted, references to fiscal years apply tothe 12 months ended August 31 of the specified year.
The Company’s principal executive offices are located at2200 West Parkway Boulevard, Salt Lake City, Utah84119-2331, and our telephone number is (801) 817-1776.Our website is www.franklincovey.com.
Business Development
Our business is currently structured around two divisions,the Enterprise Division and the Education Division. TheEnterprise Division consists of our Direct Office andInternational Licensee segments and is focused on sellingour offerings to corporations, governments, not-for-profits, and other related organizations. Franklin Coveyofferings delivered through the Enterprise Divisionare designed to help organizations and individuals achievetheir own great results. Our Education Division iscentered around the principles found in the Leader in Meand is dedicated to helping educational institutionsbuild cultures that will produce great results, includingincreased student performance, improved school culture,and increased parental and teacher involvement.
During 2016, we introduced the All Access Pass (AAP),which we believe is a ground-breaking subscription service
Franklin Covey 2019 Annual Report Business 58

that allows our clients unlimited access to our contentthrough an electronic portal. We believe the All AccessPass is a revolutionary and innovative way to deliver ourcontent to clients of various sizes, including large,multinational organizations in a flexible and cost-effectivemanner. Clients may utilize complete offerings such asThe 7 Habits of Highly Effective People and The 5 Choicesto Extraordinary Productivity, or use individual conceptsfrom any of our well-known offerings to create a customsolution to fit their organizational or individual trainingneeds. Since the introduction of the All Access Pass,we have invested in additional implementation specialiststo provide our clients with the direction necessary tocreate meaningful impact journeys using our tools andcontent. An impact journey is a customized plan to utilizethe content and offerings on the AAP to achieve a client’sspecific goals and to provide them with the keys toobtain maximum value from the pass. We have alsotranslated All Access Pass materials into numerousadditional languages, which allows the AAP to be usedeffectively by multinational entities and provides forgreater international sales opportunities. The AAPis primarily sold through our Enterprise Division.
In our Education Division, we have launched the Leaderin Me membership, which provides coaching, access to theLeader in Me online service, and authorizes use ofFranklin Covey’s proprietary intellectual property. TheLeader in Me online service provides access to studentleadership guides, leadership lessons, illustratedleadership stories, and a variety of other resources toenable an educational institution to effectively implementand utilize the Leader in Me program. We believe thatthe tools and resources available through the Leader in Memembership will provide measurable results that aredesigned to develop student leadership, improve schoolculture, and increase academic proficiency.
We believe that continued investments in personnel,content, and technological innovation are key tosubscription service renewals and the future growth ofour offerings.
In addition to the internal development of our offeringsas previously described, we have sought to grow throughopening new international offices and through acquisitionsof businesses and content licenses. Over the past threeyears, these activities have included the following:
• New Offices in Germany, Switzerland, andAustria – During fiscal 2019, we acquired the formerindependent licensee that provided services in thesecountries and transitioned the operations into directly
owned offices similar to the fiscal 2017 transition ofour China licensee into a direct office operation.We believe that we will be able to significantly growour business in these countries through this acquisition.
• License of “Multipliers” Leadership Content – Duringlate fiscal 2019, we obtained a license to develop andsell Multipliers leadership content written by LizWiseman. We are currently in the process of developingvarious offerings based on Multipliers content andare currently expecting to launch these courses in thefall of 2020.
• Offices in China – In fiscal 2017, we transitioned theoperations of our licensee operations in China intodirect offices. With offices in Shanghai, Beijing,Guangzhou, and Shenzhen, we have grown ouroperations in China during the past three years andbelieve we are positioned for significant future growth.
• Robert Gregory Partners – In third quarter of fiscal2017, we acquired the assets of Robert GregoryPartners, LLC (RGP), a corporate coaching firm withexpertise in executive coaching, transition accelerationcoaching, leadership development coaching,implementation coaching, and consulting. We believethese coaching services are important componentsof our various offerings.
• Jhana Education – In the fourth quarter of fiscal2017, we acquired the stock of Jhana Education (Jhana),a company that specializes in the creation anddissemination of relevant, bite-sized content andlearning tools for leaders and managers. These serviceshave been a significant strategic addition to our AllAccess Pass and Leader in Me online offerings.
Services Overview
We operate globally with one common brand and abusiness model designed to enable us to provide clientsaround the world with the same high level of service. Toachieve this high level of service we have sales andsupport associates in various locations around the UnitedStates and Canada, and operate wholly owned subsidiariesin Australia, China, Japan, the United Kingdom, Germany,Switzerland, and Austria. In foreign locations where wedo not have a directly owned office, we may contract withindependent licensee partners who deliver our contentand provide services in over 140 other countries andterritories around the world.
Our mission is to “enable greatness in people andorganizations everywhere,” and we believe that we areexperts at solving certain pervasive, intractable problems,
59 Business Franklin Covey 2019 Annual Report

each of which requires a change in human behavior. Weseek to consistently deliver world-class content withthe broadest and deepest distribution capabilities throughthe most flexible content delivery modalities. We believethese characteristics distinguish us from our competitorsas follows:
1. World Class Content – Rather than rely on “flavor ofthe month” training fads, our content is principle-centered and based on natural laws of human behaviorand effectiveness. Our content is designed to buildnew skillsets, establish new mindsets, and provideenabling toolsets. When our content is appliedconsistently in an organization, we believe the cultureof that organization will change to enable theorganization to achieve its own great purposes. Ourcontent is well researched, subjected to numerous fieldbeta tests, and improved through a proven developmentprocess.
2. Breadth and Scalability of Delivery Options – Wehave a wide range of content delivery options, including:The All Access Pass and Leader in Me membership,other intellectual property licensing arrangements,on-site training, training led through certifiedfacilitators, on-line learning, blended learning, andorganization-wide transformational processes,including consulting and coaching services.
3. Global Capability – We not only operate domesticallywith sales personnel in the United States and Canada,but we also deliver content through our directly ownedinternational offices and independently ownedinternational licensees who deliver our content in over140 other countries and territories around the world.This capability allows us to deliver content to a widerange of customers, from large multinationalcorporations to smaller local entities.
We hold ourselves responsible for and measure ourselvesby our clients’ achievement of transformational results.
Our content and offerings are designed to help our clientsachieve their own great purposes through a variety ofresources, including best-selling books and audio,innovative and widely recognized thought leadership,and multiple delivery and teaching methods. Theseelements allow us to offer our clients training andconsulting solutions that are designed to improveindividual and organizational behaviors, deliver contentthat adapts to an organization’s unique needs, and providemeaningful improvements in our clients’ businessperformance. Further information about our content andservices can be found on our website at
www.franklincovey.com. However, the informationcontained in, or that can be accessed through, our websitedoes not constitute any part of this Annual Report.
Industry Information
According to the Training magazine 2019 TrainingIndustry Survey, the total size of the U.S. training industryis estimated to be $83 billion. The training industry ishighly fragmented and includes a wide variety of trainingand service providers of varying sizes. We believe ourcompetitive advantages in this industry stem from ourfully integrated principle-centered training offerings, ourwide variety of delivery options, and variousimplementation tools to help organizations and individualsmeasurably improve their effectiveness. These advantagesallow us to deliver not only training to corporations,educational institutions, and individuals, but also toimplement the training through powerful behavior-changing tools and coaching with the capability to thenmeasure the impact of the delivered content and solutions.
Clients
We have a relatively broad base of clients, which includesthousands of organizational, governmental, educational,and individual clients in both the United States and inother countries that are served through our directly ownedoperations. We have thousands of additionalorganizational clients throughout the world which areserved through our global licensee partner network, andwe believe that our content, in all its forms, delivers resultsthat encourage strong client loyalty. Our clients are in abroad array of industries and we are not dependent on asingle client or industry group. During the periodspresented in this report, none of our clients wereresponsible for more than ten percent of our consolidatedrevenues.
Due to the nature of our business, we do not have asignificant backlog of orders. Nearly all of our deferredrevenue is attributable to subscription services for whichwe recognize revenue over the lives of the correspondingagreements.
Competition
We operate in a highly competitive and rapidly changingglobal marketplace and compete with a variety oforganizations of various sizes that offer servicescomparable with ours. The nature of competition in theperformance improvement industry, however, is highly
Franklin Covey 2019 Annual Report Business 60

fragmented with few large competitors. Based upon ourfiscal 2019 consolidated sales of $225.4 million, we believethat we are a significant competitor in the performanceskills and education market. Other significant comparativecompanies that compete with our Enterprise Divisioninclude: Design Dimension International, GP StrategiesCorp., LinkedIn Learning, Center for Creative Leadership,SkillSoft, and Vital Smarts. Our Education Divisioncompetes with entities such as: Character Counts,Responsive Classroom, 7 Mindsets, Second Step, and K12.
We believe that the principal competitive factors in theindustry in which we compete include the following:• Quality of offerings, services, and solutions• Skills and capabilities of people• Innovative training and consulting services combined
with effective products• Ability to add value to client operations• Reputation and client references• Price• Availability of appropriate resources• Global reach and scale• Branding and name recognition in our marketplace
Given the relative ease of entry into the training market,the number of our competitors could increase, manyof whom may imitate existing methods of distribution, orcould offer similar content and programs at lower prices.However, we believe that we have several areas ofcompetitive differentiation in our industry. We believethat our competitive advantages include: (1) the quality ofour content, as indicated by our strong gross margins,branded content, and best-selling books; (2) the breadthof delivery options we are able to offer to customersfor utilizing our content, including the All Access Passand Leader in Me membership, live presentations by ourown training consultants, live presentations thoughCompany certified client-employed facilitators, intellectualproperty licensing, web-based presentations, andfilm-based presentations; (3) our global reach, whichallows truly multinational clients to scale our contentuniformly across the globe, through our mix of directoffices and our global licensee network; and (4) thesignificant impact which our offerings can have on ourclients’ results. Moreover, we believe that we are a marketleader in the U.S. in leadership, execution, productivity,individual effectiveness, and educational improvement.
Seasonality
Our fourth quarter of each fiscal year typically has highersales and operating income than other fiscal quarters
primarily due to increased revenues in our EducationDivision (when school administrators and faculty haveprofessional development days) and to increased sales thattypically occur during that quarter from year-endincentive programs. Overall, training sales are moderatelyseasonal because of the timing of corporate training,which is not typically scheduled as heavily during holidayand certain vacation periods.
Manufacturing and Distribution
We do not manufacture any of our products. We purchaseour training materials and related products from variousvendors and suppliers located both domestically andinternationally, and we are not dependent upon any onevendor for the production of our training and relatedmaterials as the raw materials for these products arereadily available. We currently believe that we have goodrelationships with our suppliers and contractors. Ourmaterials are primarily warehoused and distributed froman independent warehouse facility located in Des Moines,Iowa.
Trademarks, Copyrights, and Intellectual Property
Our success has resulted in part from our proprietarycontent, methodologies, and other intellectual propertyrights. We seek to protect our intellectual propertythrough a combination of trademarks, copyrights, andconfidentiality agreements. We claim rights for over 630trademarks in the United States and foreign countries, andwe have obtained registration in the United States andnumerous foreign countries for many of our trademarksincluding FranklinCovey, The 7 Habits of Highly EffectivePeople, The 4 Disciplines of Execution, and The 7 Habits.We consider our trademarks and other proprietary rightsto be important and material to our business.
We claim over 230 registered copyrights, and own sole orjoint copyrights on our books, manuals, text and otherprinted information provided in our training programs,and other electronic media products, including audio andvideo media. We may license, rather than sell, facilitatorworkbooks and other seminar and training materialsin order to protect our intellectual property rights therein.We place trademark and copyright notices on ourinstructional, marketing, and advertising materials. Inorder to maintain the proprietary nature of our productinformation, we enter into written confidentialityagreements with certain executives, product developers,sales professionals, training consultants, other employees,and licensees.
61 Business Franklin Covey 2019 Annual Report

Employees
One of our most important assets is our people. Thediverse and global makeup of our workforce allows us toserve a variety of clients on a worldwide basis. We arecommitted to attracting, developing, and retaining qualitypersonnel and actively strive to reinforce our employees’commitment to our clients, and to our mission, vision,culture, and values through the creation of a motivationaland rewarding work environment. We currently haveapproximately 940 associates around the world andmanagement believes that its relations with its associatesis good. None of our associates are represented by aunion or other collective bargaining group. Whilecompetition is intense for skilled personnel in variousfunctions, we currently do not foresee a shortage inqualified personnel needed to operate and grow ourbusiness.
Our benefit programs are designed to be bothcomprehensive and tailored to the needs of our employeepopulation, such as a paid time off policy that allows forflexibility to meet our associates’ needs. Our wellnessbenefits are aimed at encouraging employees to be awareof their current state of health and provides varioustools and resources to assist them in maintaining theirhealth given the demanding nature of the work. Throughour offered benefits, including health plans, retirementbenefits, stock purchase plan, and other benefit programs,we seek to provide a core sense of security to ouremployees.
Information About Our Executive Officers
On November 7, 2019, we appointed Paul S. Walker asPresident and Chief Operating Officer of Franklin CoveyCo. Each of the executive officers of Franklin CoveyCo. listed below served with the described responsibilitiesthroughout the fiscal year ended August 31, 2019:
M. Sean Covey, 55, currently serves as President ofFranklin Covey Education, and has led the growth of thisDivision from its infancy to its status today. The EducationDivision works with thousands of education entitiesthroughout the world in Higher Education and the K-12market. Mr. Covey was previously the Executive VicePresident of Global Solutions and Partnerships andEducation Practice Leader and has been an ExecutiveOfficer since September 2008. Sean also served as theSenior Vice President of Innovations and ProductDevelopment from April 2006 to September 2009, wherehe led the development of nearly all of the Company’s
current organizational offerings, including: The 7 Habitscurriculum; The 4 Disciplines of Execution; The Leader inMe; and Leadership Greatness. Prior to 2006, Sean ranthe Franklin Covey retail chain of stores, growing itto $152 million in sales. Before joining Franklin Covey,Sean worked for the Walt Disney Company, TrammelCrow Ventures, and Deloitte & Touche Consulting.Mr. Covey is also a New York Times best-selling authorand has written several books, including The 4 Disciplinesof Execution, The 6 Most Important Decisions You’ll EverMake, The Leader in Me, and the international bestsellerThe 7 Habits of Highly Effective Teens. Sean graduated withhonors from Brigham Young University with a Bachelor’sdegree in English and later earned his MBA from theHarvard Business School. Sean is the son of the lateDr. Stephen Covey.
Colleen Dom, 57, was appointed to be the ExecutiveVice-President of Operations in September 2013.Ms. Dom began her career with the Company in 1985and served as the first “Client Service Coordinator,”providing service and seminar support for some of theCompany’s very first clients. Prior to her appointment asan Executive Vice President, Ms. Dom served as VicePresident of Domestic Operations since 1997 where shehad responsibility for the Company’s North Americanoperations, including client support, supply chain,and feedback operations. During her time at FranklinCovey Co., Colleen has been instrumental in creating andimplementing systems and processes that have supportedthe Company’s strategic objectives and has more than30 years of experience in client services, sales support,operations, management, and supply chain. Due to hervaluable understanding of the Company’s globaloperations, Ms. Dom has been responsible for numerouskey assignments that have enhanced client support,optimized operations, and built capabilities for futuregrowth. Prior to joining the Company, Colleen worked inretail management and in the financial investmentindustry.
C. Todd Davis, 62, is an Executive Vice President andChief People Officer, and has been an Executive Officersince September 2008. Todd has over 30 years ofexperience in training, training development, sales andmarketing, human resources, coaching, and executiverecruiting. He has been with Franklin Covey for more thanthe past 20 years. Previously, Mr. Davis was a Directorof our Innovations Group where he led the developmentof core offerings including The 7 Habits of Highly EffectivePeople – Signature Program. Todd also worked forseveral years as our Director of Recruitment and was
Franklin Covey 2019 Annual Report Business 62
responsible for attracting, hiring, and retaining top talentfor the organization. Prior to joining Franklin Covey,Mr. Davis worked in the medical industry for 9 years wherehe recruited physicians and medical executives alongwith marketing physician services to hospitals and clinicsthroughout the country. Todd is the author of Get Better:15 Proven Practices to Build Effective Relationships atWork.
Scott J. Miller, 51, is the Executive Vice-President ofThought Leadership at Franklin Covey. Mr. Miller, whohas been with the Company for 23 years, was previouslythe Executive Vice-President of Business Developmentand Marketing and has served as an executive of theCompany since March 2012. Scott’s role as ExecutiveVice-President caps 12 years on our front line, workingwith thousands of client facilitators across many marketsand countries. Prior to his appointment as Vice-Presidentof Business Development and Marketing, Mr. Millerserved as the general manager of our central regional salesoffice for six years. Scott originally joined the CoveyLeadership Center in 1996 as a client partner with theEducation Division. Mr. Miller started his professionalcareer with the Disney Development Company, the realestate development division of the Walt Disney Company,in 1992. During his time with the Disney DevelopmentCompany, Scott identified trends and industry bestpractices in community development, education,healthcare, architectural design, and technology.Mr. Miller received a Bachelor of Arts in OrganizationalCommunication from Rollins College in 1996.
Paul S. Walker, 44, is a 19-year veteran of FranklinCovey Co. Mr. Walker currently serves as the Presidentof the Enterprise Division, which includes the operationsof the Direct Office and International Licensee segments.Mr. Walker was previously the Executive Vice-President ofGlobal Sales and Delivery and began his service as anexecutive officer on September 1, 2015. Paul began hiscareer with Franklin Covey in 2000 in the role of businessdeveloper, was promoted to a Client Partner, and thento an Area Director. In 2007, Mr. Walker became GeneralManager of the Company’s central sales region, an11-state area that also included Ontario, Canada. Prior toworking for Franklin Covey, Mr. Walker was a seniorsales partner for Alexander’s Digital Printing and amiddle-market pilot coordinator with New York Life.Mr. Walker graduated from Brigham Young Universitywith a Bachelor of Arts in Communications.
Robert A. Whitman, 66, has served as Chairman of theBoard of Directors since June 1999 and as Presidentand Chief Executive Officer of the Company sinceJanuary 2000. Mr. Whitman previously served as a directorof the Covey Leadership Center from 1994 to 1997.Prior to joining us, Mr. Whitman served as President andCo-Chief Executive Officer of The Hampstead Groupfrom 1992 to 2000 and is a founding partner at WhitmanPeterson. Mr. Whitman received his Bachelor of Artsdegree in Finance from the University of Utah andhis MBA from the Harvard Business School.
Stephen D. Young, 66, joined FranklinCovey as ExecutiveVice President of Finance, was appointed Chief AccountingOfficer and Controller in January 2001, Chief FinancialOfficer in November 2002, and Corporate Secretaryin March 2005. Prior to joining us, he served as SeniorVice-President of Finance, Chief Financial Officer, anddirector of international operations for Weider Nutritionfor seven years; as Vice-President of Finance at FirstHealth for ten years; and as an auditor at Fox andCompany, a public accounting firm, for four years.Mr. Young has more than 35 years of accounting andmanagement experience and is a Certified PublicAccountant. Mr. Young was awarded a Bachelor ofScience in Accounting from Brigham Young University.
Available Information
We regularly file reports with the SEC. These reportsinclude, but are not limited to, Annual Reports on Form10-K, Quarterly Reports on Form 10-Q, Current Reportson Form 8-K, and security transaction reports on Forms3, 4, or 5. The SEC also maintains electronic versions of theCompany’s reports, proxy and information statements,and other information that the Company files with the SECon its website at www.sec.gov.
The Company makes our Annual Report on Form 10-K,Quarterly Reports on Form 10-Q, current reports onForm 8-K, and other reports filed or furnished with theSEC available to the public, free of charge, throughour website at www.franklincovey.com. These reports areprovided through our website as soon as is reasonablypracticable after we file or furnish these reports with theSEC.
63 Business Franklin Covey 2019 Annual Report

ITEM 1A. RISK FACTORS
Our business environment, current domestic andinternational economic conditions, geopoliticalcircumstances, and other specific risks may affect ourfuture business decisions and financial performance. Thematters discussed below may cause our future results todiffer from past results or those described in forward-looking statements and could have a material adverseeffect on our business, financial condition, liquidity, resultsof operations, and stock price, and should be consideredin evaluating our Company.
The risks included here are not exhaustive. Other sectionsof this report may include additional risk factors whichcould adversely affect our business and financialperformance. Moreover, we operate in a very competitiveand rapidly changing global environment. New riskfactors emerge from time to time and it is not possiblefor management to predict all such risk factors, nor canwe assess the impact of all such risk factors on our businessor the extent to which any factor, or combination offactors, may cause actual results to differ materially fromthose contained in any forward-looking statements.Given these risks and uncertainties, investors should notplace undue reliance on forward-looking statements asa prediction of actual results.
We operate in an intensely competitive industry andour competitors may develop programs, services,or courses that adversely affect our ability to sell ourofferings.
The training and consulting services industry is intenselycompetitive with relatively easy entry. Competitorscontinually introduce new programs, services, and deliverymethods that may compete directly with our offerings,or that may make our offerings uncompetitive or obsolete.Larger competitors may have superior abilities to competefor clients and skilled professionals, reducing our abilityto deliver quality work to our clients. Some of ourcompetitors may have greater financial and other resourcesthan we do. In addition, one or more of our competitorsmay develop and implement training courses ormethodologies that may adversely affect our ability to sellour offerings and products to new clients. Any one ofthese circumstances could have an adverse effect on ourability to obtain new business and successfully deliver ourservices.
The introduction of the All Access Pass has beendisruptive to our business and may continue to createboth operational and financial challenges duringthe transition to a subscription services-focusedbusiness model.
In fiscal 2016, we introduced the All Access Pass, whichis an internet-based platform that allows our clients topurchase unlimited access to our intellectual property fora specified period. We have also introduced the Leaderin Me online subscription that provides our EducationDivision clients with the tools and additional services theyneed to successfully implement the Leader in Me programin their schools. As expected, the change to a subscriptionservices-focused business model has been disruptive as wetransition our legacy business to this new delivery model,but we believe the benefits of the AAP and The Leaderin Me online service to our clients and to our business willultimately prove beneficial as we continue to emphasizeand grow sales of subscription services.
The change to a subscription-focused business model hasrequired a transition both operationally and from anaccounting and reporting point of view. Operationally,we have reorganized our sales forces to focus on andsupport subscription sales and renewals. However, westill sell a significant amount of services and relatedproducts through our legacy business, which we continueto operate and support. As such, our selling, general,and administrative expenses have increased to supportboth the growth of our subscription business and ourlegacy business. The applicable accounting guidance forsubscription sales requires that we defer subscriptioncontract revenue at the inception of the agreement andthen recognize the revenue over the life of thecorresponding arrangement. These changes to asubscription-based business model have producedsignificant changes in our recent financial statements,including reduced operating income compared withprevious years and increased liabilities resulting fromdeferred revenues.
If we are unable to effectively adapt our sales force andsales strategy to sell subscription services, or iftechnological development of these services becomes toocostly or is not accepted by the market, or we are unableto optimize our costs to support a subscription-based andlegacy business model, the transition period to asubscription-focused business model may be lengthenedand our ability to achieve previous levels of profitabilitymay be adversely affected.
Franklin Covey 2019 Annual Report Risk Factors 64

The All Access Pass and Leader in Me online serviceare internet-based platforms, and as such we aresubject to increased risks of cyber-attacks and othersecurity breaches that could have a material adverseeffect on our business.
As part of selling subscription-based services, we collect,process, and retain a limited amount of sensitive andconfidential information regarding our customers.Because our subscription services are internet-basedplatforms, our facilities and systems may be vulnerable toexternal or internal security breaches, acts of vandalism,computer viruses, misplaced or lost data, stolenintellectual property, programming or human errors, orother similar events.
The access by unauthorized persons to, or the improperdisclosure by us of, confidential information regarding ourcustomers or our own proprietary information, software,methodologies, and business secrets could result insignificant legal and financial exposure, damage to ourreputation, or a loss of confidence in the security of oursystems, products, and services, which could have amaterial adverse effect on our business, financialcondition, or results of operations. To the extent we areinvolved in any future cyber-attacks or other breaches, ourbrand and reputation could be affected, and theseconditions could also have a material adverse effect onour business, financial condition, or results of operations.
Our business is becoming increasingly dependent oninformation technology and will require additionalcash investments in order to grow and meet thedemands of our clients.
Since the introduction of our subscription services, ourdependence on the use of sophisticated technologies andinformation systems has increased. Moreover, ourtechnology platforms will require continuing cashinvestments by us to expand existing offerings, improvethe client experience, and develop complementaryofferings. Our future success depends in part on ourability to adapt our services and infrastructure whilecontinuing to improve the performance, features, andreliability of our services in response to the evolvingdemands of the marketplace. Failure to adapt and improvethese areas could have an adverse effect on our business,including our results of operations, financial position, andcash flows.
We could incur additional liabilities or our reputationcould be damaged if we do not protect client data orif our information systems are breached.
We are dependent on information technology networksand systems to process, transmit, and store electronic
information and to communicate between our locationsaround the world and with our clients. Security breachesof this infrastructure could lead to shutdowns ordisruptions of our systems and potential unauthorizeddisclosure of confidential information. We are alsorequired at times to manage, utilize, and store sensitiveor confidential client or employee data. As a result, we aresubject to numerous U.S. and foreign jurisdiction lawsand regulations designed to protect this information, suchas the various U.S. federal and state laws governing theprotection of individually identifiable information. If anyperson, including any of our associates, negligentlydisregards or intentionally breaches our establishedcontrols with respect to such data or otherwisemismanages or misappropriates that data, we could besubject to monetary damages, fines, and/or criminalprosecution. Unauthorized disclosure of sensitive orconfidential client or employee data, whether throughsystems failure, employee negligence, fraud, ormisappropriation could damage our reputation and causeus to lose clients.
Legal requirements relating to the collection, storage,handling, and transfer of personal data continue to evolve.For example, the European Union and the U.S. formallyentered into a new framework in July 2016 that provides amechanism for companies to transfer data from EuropeanUnion member states to the U.S. This new framework,called the E.U.-U.S. Privacy Shield Framework, is intendedto address shortcomings identified by the EuropeanCourt of Justice in a predecessor mechanism. The PrivacyShield and other data protection mechanisms face anumber of legal challenges by both private parties andregulators, which may lead to uncertainty about the legalbasis for data transfers across the Atlantic. Ongoinglegal reviews may result in burdensome or inconsistentrequirements affecting the location and movement of ourcustomer and internal employee data as well as themanagement of that data. Compliance may requirechanges in services, business practices, or internal systemsthat may result in increased costs, lower revenue, reducedefficiency, or greater difficulty in competing withforeign-based firms. Failure to comply with existing ornew rules may result in significant penalties or orders tostop the alleged noncompliant activity.
In addition, during May 2018 the new General DataProtection Regulation (GDPR) became effective in theEuropean Union. The GDPR imposes strict requirementson the collection, use, security, and transfer of personalinformation in and from European Union member states.The GDPR is designed to unify data protection within
65 Risk Factors Franklin Covey 2019 Annual Report

the European Union under a single law, which may resultin significantly greater compliance burdens and costsrelated to our European Union operations and customers.Under GDPR, fines of up to 20 million Euros or up tofour percent of the annual global revenues of the infringer,whichever is greater, could be imposed. Although GDPRapplies across the European Union, local data protectionauthorities still have the ability to interpret GDPR, whichmay create inconsistencies in application on a country-by-country basis. Furthermore, as the United Kingdomtransitions out of the European Union, we may encounteradditional complexity with respect to data privacy anddata transfers from the United Kingdom. We implementednew controls and procedures, including a team dedicatedto data protection, to comply with the Privacy Shieldand the requirements of GDPR, which were effective forus in May 2018. However, these new procedures andcontrols may not be completely effective in preventingunauthorized breaches of personal data.
Other governmental authorities throughout the U.S. andaround the world are considering similar types oflegislative and regulatory proposals concerning dataprotection. For example, in June 2018, the State ofCalifornia enacted the California Consumer Privacy Actof 2018 (the CCPA), which will come into effect onJanuary 1, 2020. The CCPA requires companies thatprocess information on California residents to make newdisclosures to consumers about their data collection,use and sharing practices, and allows consumers to optout of certain data sharing with third parties and providesa new cause of action for data breaches. However,legislators have stated that they intend to proposeamendments to the CCPA, and it remains unclear what,if any, modifications will be made to the CCPA or howit will be interpreted. Additionally, the Federal TradeCommission and many state attorneys general areinterpreting federal and state consumer protection lawsto impose standards for the online collection, use,dissemination and security of data. Each of these privacy,security, and data protection laws and regulations couldimpose significant limitations, require changes to ourbusiness, or restrict our use or storage of personalinformation, which may increase our compliance expensesand make our business more costly or less efficient toconduct.
We employ global best practices in securing andmonitoring code, applications, systems, processes anddata, and our security practices are regularly reviewed andvalidated by an external auditing firm. However, theseefforts may be insufficient to protect sensitive information
against illegal activities and we may be exposed toadditional liabilities from the various data protectionlaws enacted within the jurisdictions where we operate.
The sale of a large number of common shares byKnowledge Capital could depress the market price ofour common stock.
Knowledge Capital Investment Group (KnowledgeCapital), a related party primarily controlled by a memberof our Board of Directors, holds 2.8 million shares, orapproximately 20 percent, of our outstanding commonshares. On January 26, 2015, the SEC declared effective aregistration statement on Form S-3 to register the resaleof shares held by Knowledge Capital. The sale or prospectof the sale of a substantial number of the shares held byKnowledge Capital may have an adverse effect on themarket price of our common stock.
Our results of operations could be adversely affectedby economic and political conditions and the effects ofthese conditions on our clients’ businesses and theirlevels of business activity.
Global economic and political conditions affect ourclients’ businesses and the markets in which they operate.Our financial results are somewhat dependent on theamount that current and prospective clients budget fortraining. A serious and/or prolonged economic downturncombined with a negative or uncertain political climatecould adversely affect our clients’ financial condition andthe amount budgeted for training by our clients. Theseconditions may reduce the demand for our servicesor depress the pricing of those services and have an adverseimpact on our results of operations. Changes in globaleconomic conditions may also shift demand to services forwhich we do not have competitive advantages, and thiscould negatively affect the amount of business that we areable to obtain. Such economic, political, and clientspending conditions are influenced by a wide range offactors that are beyond our control and that we have nocomparative advantage in forecasting. If we are unable tosuccessfully anticipate these changing conditions, wemay be unable to effectively plan for and respond to thosechanges, and our business could be adversely affected.
Our business success also depends in part upon continuedgrowth in the use of training and consulting servicesand the renewal of existing contracts by our clients. Inchallenging economic environments, our clients mayreduce or defer their spending on new services andconsulting solutions in order to focus on other priorities.At the same time, many companies have already invested
Franklin Covey 2019 Annual Report Risk Factors 66

substantial resources in their current means of conductingtheir business and they may be reluctant or slow toadopt new approaches that could disrupt existingpersonnel and/or processes. If growth in the general useof training and consulting services in business or ourclients’ spending on these items declines, or if we cannotconvince our clients or potential clients to embracenew services and solutions, our results of operations couldbe adversely affected.
In addition, our business tends to lag behind economiccycles and, consequently, the benefits of an economicrecovery following a period of economic downturn maytake longer for us to realize than other segments ofthe economy.
Recent developments in international trade may havea negative effect on global economic conditions and ourbusiness, financial results, and financial condition.
The United States recently proposed and enacted certaintariffs. In addition, there have been ongoing discussionsand activities regarding changes to other U.S. tradepolicies and treaties. In response, some countries in whichwe operate, including China, are threatening to implementor have already implemented tariffs on U.S. imports orotherwise imposed non-tariff barriers. Thesedevelopments may have a material adverse effect onglobal economic conditions and the stability of globalfinancial markets, and they may significantly reduce globaltrade and, in particular, trade between China and theUnited States. Any of these factors could depresseconomic activity, create anti-American consumersentiment, restrict our access to suppliers or customers,and have a material adverse effect on our business,financial condition, and results of operations. In addition,any actions by non-U.S. markets to implement furthertrade policy changes, including limiting foreigninvestment or trade, increasing regulatory scrutiny ortaking other actions which impact U.S. companies’ abilityto obtain necessary licenses or approvals could negativelyimpact our business.
We have only a limited ability to protect our intellectualproperty rights, which are important to our success.
Our financial success is partially dependent on our abilityto protect our proprietary offerings and other intellectualproperty. The existing laws of some countries in which weprovide services might offer only limited protection ofour intellectual property rights. To protect our intellectualproperty, we rely upon a combination of confidentialitypolicies, nondisclosure and other contractual
arrangements, as well as copyright and trademark laws.The steps we take in this regard may not be adequateto prevent or deter infringement or other misappropriationof our intellectual property, and we might not be able todetect unauthorized use of, or take appropriate and timelysteps to enforce, our intellectual property rights, especiallyin foreign jurisdictions.
The loss of proprietary content or the unauthorized useof our intellectual property may create greatercompetition, loss of revenue, adverse publicity, and maylimit our ability to reuse that intellectual property for otherclients. Any limitation on our ability to provide a serviceor solution could cause us to lose revenue-generatingopportunities and require us to incur additional expensesto develop new or modified solutions for futureengagements.
We depend on key personnel, the loss of whom couldharm our business.
Our future success will depend, in part, on the continuedservice of key executive officers and personnel. The lossof the services of any key individuals could harm ourbusiness. Our future success also depends on our abilityto identify, attract, and retain additional qualified seniorpersonnel. Competition for such individuals in ourindustry is intense, and we may not be successful inattracting and retaining such personnel.
If we are unable to attract, retain, and motivatehigh-quality employees, including sales personnel andtraining consultants, we may not be able to grow ourbusiness as projected or may not be able to competeeffectively.
Our success and ability to grow are partially dependenton our ability to hire, retain, and motivate sufficientnumbers of talented people with the increasingly diverseskills needed to serve our clients and grow our business.Competition for skilled personnel is intense at all levels ofexperience and seniority. There is a risk that we will findit difficult to hire and retain a sufficient number ofemployees with the skills or backgrounds we require, orthat it will prove difficult to retain them in a competitivelabor market. If we are unable to hire and retain talentedsales and delivery employees with the skills, and in thelocations, we require, we might not be able to grow ourbusiness at projected levels or may not be able toeffectively deliver our content and services. If we need tohire additional personnel to maintain a specified numberof sales personnel or are required to re-assign personnelfrom other geographic areas, it could increase our costs
67 Risk Factors Franklin Covey 2019 Annual Report

and adversely affect our profit margins. In addition, theinability of newly hired sales personnel to achieveprojected sales levels may inhibit our ability to attainanticipated growth.
Our global operations pose complex management,foreign currency, legal, tax, and economic risks, whichwe may not adequately address.
We have sales offices in Australia, China, Japan, Germany,Switzerland, Austria, and the United Kingdom. We alsohave licensed operations in numerous other foreigncountries. As a result of these foreign operations andtheir impact upon our financial statements, we are subjectto a number of risks, including:• Restrictions on the movement of cash• Burdens of complying with a wide variety of national
and local laws, including tax laws• The absence in some jurisdictions of effective laws to
protect our intellectual property rights• Political instability• Currency exchange rate fluctuations• Longer payment cycles• Price controls or restrictions on exchange of foreign
currencies
For instance, on June 23, 2016, the United Kingdom helda referendum in which a majority of voters chose toexit the European Union, commonly referred to as “Brexit.”The outcome of this referendum produced significantcurrency exchange rate fluctuations and volatility in globalstock markets. The British government has commencednegotiations to determine the terms of Brexit, but theterms have not yet been determined and the process andeffects of such separation remain uncertain. Given thelack of comparable precedent, the implications of Brexitor how such implications might affect us are unclear.Brexit could, among other things, disrupt trade and thefree movement of data, goods, services, and peoplebetween the United Kingdom and the European Union orother countries as well as create legal and global economicuncertainty. These and other potential implications ofBrexit could adversely affect our business and financialresults.
Our global operations expose us to numerous andsometimes conflicting legal and regulatoryrequirements, and violation of these regulations couldharm our business.
Because we provide services to clients in many countries,we are subject to numerous, and sometimes conflicting,
regulations on matters as diverse as import/exportcontrols, content requirements, trade restrictions, tariffs,taxation, sanctions, government affairs, internal anddisclosure control obligations, data privacy, and laborrelations. Violations of these regulations in the conductof our business could result in fines, criminal sanctionsagainst us or our officers, prohibitions on doing business,and damage to our reputation. Violations of theseregulations in connection with the performance of ourobligations to our clients also could result in liability formonetary damages, fines, unfavorable publicity, andallegations by our clients that we have not performed ourcontractual obligations. Due to the varying degrees ofdevelopment of the legal systems of the countries in whichwe operate, local laws may be insufficient to protect ourrights.
In many parts of the world, including countries in whichwe operate, practices in the local business communitymight not conform to international business standards andcould violate anticorruption regulations, including theUnited States Foreign Corrupt Practices Act, whichprohibits giving anything of value intended to influencethe awarding of government contracts. Although we havepolicies and procedures to ensure legal and regulatorycompliance, our employees, licensee operators, and agentscould take actions that violate these requirements.Violations of these regulations could subject us to criminalor civil enforcement actions, including fines andsuspension or disqualification from United States federalprocurement contracting, any of which could have anadverse effect on our business.
We may fail to meet analyst expectations, which couldcause the price of our stock to decline.
Our common stock is publicly traded on the NYSE, andat any given time various securities analysts follow ourfinancial results and issue reports on us. These periodicreports include information about our historical financialresults as well as the analysts’ estimates of our futureperformance. The analysts’ estimates are based on theirown opinions and are often different from our estimates orexpectations. If our operating results are below theestimates or expectations of public market analysts andinvestors, our stock price could decline. If our stock priceis volatile, we may become involved in securities litigationfollowing a decline in price. Any litigation could result insubstantial costs and a diversion of management’sattention and resources that are needed to successfullyrun our business.
Franklin Covey 2019 Annual Report Risk Factors 68

Our business performance may not be sufficient for usto meet the financial guidance that we providepublicly.
We may provide financial guidance to the public basedupon our expectations regarding our financialperformance. While we believe that our annual financialguidance provides investors and analysts with insight intoour view of the Company’s future performance, suchfinancial guidance is based on assumptions that may notalways prove to be accurate and may vary from actualresults. If we fail to meet the full-year financial guidancethat we provide, or if we find it necessary to revise suchguidance during the year, the market value of our commonstock could be adversely affected.
Our future quarterly operating results are subject tofactors that can cause fluctuations in our stock price.
Historically, our stock price has experienced significantvolatility. We expect that our stock price may continue toexperience volatility in the future due to a variety ofpotential factors that may include the following:
• Fluctuations in our quarterly results of operations andcash flows
• Increased overall market volatility
• Variations between our actual financial results andmarket expectations
• Changes in our key balances, such as cash and cashequivalents
• Currency exchange rate fluctuations
• Unexpected asset impairment charges
• Increased or decreased analyst coverage
These factors may have an adverse effect upon our stockprice in the future.
Our profitability will suffer if we are not able tomaintain our pricing and utilization rates.
The profit margin on our services is largely a function ofthe rates we are able to recover for our services and theutilization, or chargeability, of our trainers, client partners,and consultants. Accordingly, if we are unable to maintainsufficient pricing for our services or an appropriateutilization rate for our training professionals withoutcorresponding cost reductions, our profit margin andoverall profitability will suffer. The rates that we are ableto recover for our services are affected by a number offactors that we may be unable to control, including:
• Our clients’ perceptions of our ability to add valuethrough our programs and content
• Competition
• General economic conditions
• Introduction of new programs or services by us or ourcompetitors
There can be no assurance that we will be able to maintainfavorable pricing or utilization rates in future periods.Additionally, we may not achieve pricing or utilizationrates that are optimal for us. If our utilization rates aretoo high, it could have an adverse effect on employeeengagement and attrition. If our pricing or utilization ratesare too low, our profit margin and profitability maysuffer.
Our work with governmental clients exposes us toadditional risks that are inherent in the governmentcontracting process.
Our clients include national, state, provincial, and localgovernmental entities, and our work with thesegovernmental entities has various risks inherent in thegovernmental contracting process. These risks include,but are not limited to, the following:
• Governmental entities typically fund projects throughappropriated monies. While these projects are oftenplanned and executed as multi-year projects, thegovernmental entities usually reserve the right to changethe scope of, or terminate, these projects for lack ofapproved funding and other discretionary reasons.Changes in governmental priorities or other politicaldevelopments, including disruptions in governmentaloperations, could result in changes in the scope of, or intermination of, our existing contracts.
• Governmental entities often reserve the right to auditour contract costs, including allocated indirect costs,and conduct inquiries and investigations of our businesspractices with respect to our government contracts. Ifthe governmental entity finds that the costs are notreimbursable, then we will not be allowed to billfor those costs or the cost must be refunded to theclient if it has already been paid to us. Findings froman audit also may result in our being required toprospectively adjust previously agreed upon rates forour work, which may affect our future margins.
• If a governmental client discovers improper activitiesin the course of audits or investigations, we may becomesubject to various civil and criminal penalties andadministrative sanctions, which may include
69 Risk Factors Franklin Covey 2019 Annual Report

termination of contracts, forfeiture of profits,suspension of payments, fines and suspensions ordebarment from doing business with other agencies ofthat government. The inherent limitations of internalcontrols may not prevent or detect all improper orillegal activities, regardless of their adequacy.
• Political and economic factors such as pending elections,the outcome of elections, revisions to governmentaltax policies, sequestration, debt ceiling negotiations,and reduced tax revenues can affect the number andterms of new governmental contracts signed.
The occurrences or conditions described above couldaffect not only our business with the particulargovernmental agency involved, but also our business withother agencies of the same or other governmental entities.Additionally, because of their visibility and political nature,governmental contracts may present a heightened riskto our reputation. Any of these factors could have anadverse effect on our business or our results of operations.
Changes in U.S. tax laws could have an adverse effecton our business, cash flows, results of operations,and financial condition.
We are subject to income and other taxes in the U.S. atthe state and federal level, and in foreign jurisdictions.Changes in applicable U.S. state, federal, or foreign taxlaws and regulations, or their interpretation andapplication, could materially affect our tax expense andprofitability.
On December 22, 2017, the President of the UnitedStates signed into law the Tax Cuts and Jobs Act (2017Tax Reform), a tax reform bill which contains significantchanges to corporate taxation, including a reduction in thecurrent corporate federal income tax rate from 35 percentto 21 percent, additional limitations on the deductibilityof interest expense, substantial changes to the taxation offoreign earnings, and modification or repeal of manybusiness deductions and credits. The changes included inthe 2017 Tax Reform are broad and complex and anyamended legislation or other changes in the U.S. federalincome tax laws could adversely affect the U.S. federaltaxation of our ongoing operations. Any such changes andrelated consequences could have a material adverseimpact on our financial results.
The Company’s use of accounting estimates involvesjudgment and could impact our financial results.
Our most critical accounting estimates are described inManagement’s Discussion and Analysis found in Item 7 ofthis report under the section entitled “Use of Estimates
and Critical Accounting Policies.” In addition, as discussedin various footnotes to our financial statements as foundin Item 8, we make certain estimates for loss contingencies,including decisions related to legal proceedings andreserves. Because, by definition, these estimates andassumptions involve the use of judgment, our actualfinancial results may differ from these estimates. If ourestimates or assumptions underlying such contingenciesand reserves prove incorrect, we may be required to recordadditional adjustments or losses relating to such matters,which would negatively affect our financial results.
We may not be able to generate sufficient cash to serviceour indebtedness, and we may be forced to take otheractions to satisfy our payment obligations underour indebtedness, which may not be successful.
Our ability to make scheduled payments on or to refinanceour indebtedness depends on our future performance,including the performance of our subsidiaries, which willbe affected by financial, business and economic conditions,competition, and other factors. We are unable to controlmany of these factors, such as the general economy,economic conditions in the industries in which we operateand competitive pressures. Our cash flow may not besufficient to allow us to pay principal and interest on ourindebtedness and to meet our other obligations. If ourcash flows and capital resources are insufficient to fundour debt service obligations, we may be forced to reduceor delay investments and capital expenditures or to sellassets, seek additional capital, or restructure or refinanceour indebtedness. These alternative measures may beunsuccessful and we may not meet our scheduled debtservice obligations. In addition, the terms of existingor future debt agreements, including our new 2019 CreditFacility, may restrict us from pursuing any of thesealternatives.
In the event that we need to refinance all or a portion ofour outstanding indebtedness before maturity or as itmatures, we may not be able to obtain terms as favorableas the terms of our existing indebtedness or refinanceour existing indebtedness at all. If interest rates or otherfactors existing at the time of refinancing result in higherinterest rates upon refinancing, we will incur higherinterest expense. Furthermore, if any rating agencychanges our credit rating or outlook, our debt and equitysecurities could be negatively affected, which couldadversely affect our financial condition and financialresults.
Franklin Covey 2019 Annual Report Risk Factors 70

Failure to comply with the terms and conditions of ourcredit facility may have an adverse effect upon ourbusiness and operations.
Our secured credit agreement and subsequentmodifications require us to be in compliance withcustomary non-financial terms and conditions as well asspecified financial ratios. Failure to comply with theseterms and conditions or maintain adequate financialperformance to comply with specific financial ratiosentitles the lender to certain remedies, including the rightto immediately call due any amounts outstanding on theline of credit. Such events would have an adverse effectupon our business and operations as there can be noassurance that we may be able to obtain other forms offinancing or raise additional capital on terms that wouldbe acceptable to us.
We may need additional capital in the future, and thiscapital may not be available to us on favorable termsor at all.
We may need to raise additional funds through public orprivate debt offerings or equity financings in order to:
• Develop new services, programs, or offerings
• Take advantage of opportunities, including businessacquisitions
• Respond to competitive pressures
Going forward, we will continue to incur costs necessaryfor the day-to-day operation and potential growth ofthe business and may use our available revolving line ofcredit facility and other financing alternatives, if necessary,for these expenditures. We obtained a new creditagreement in August 2019 with our existing lender thatexpires in August 2024. We expect to regularly renew oramend our lending agreement in the future to maintainthe availability of this credit facility. Additional potentialsources of liquidity available to us include factoringreceivables, issuance of additional equity, or issuance ofdebt from public or private sources. If necessary, we willevaluate all of these options and select one or more ofthem depending on overall capital needs and theassociated cost of capital.
Any additional capital raised through the sale of equitycould dilute current shareholders’ ownership percentagein us. Furthermore, we may be unable to obtain thenecessary capital on terms or conditions that are favorableto us, or at all.
We have significant intangible assets, goodwill, andlong-term asset balances that may be impaired if cashflows from related activities decline.
Due to the nature of our business, we have significantamounts of intangible assets, including goodwill, resultingfrom events such as the acquisition of businesses andthe licensing of content. Our intangible assets areevaluated for impairment based on qualitative factors orupon cash flows and estimated royalties from revenuestreams (indefinite-lived intangible assets) if necessary.Our goodwill is evaluated through qualitative factors andby comparing the fair value of the reporting units to thecarrying value of our net assets if necessary. Although ourcurrent sales, cash flows, and market capitalization aresufficient to support the carrying basis of these long-livedassets, if our sales, cash flows, or common stock pricedecline, we may be faced with significant asset impairmentcharges that would have an adverse impact upon ourresults of operations.
Ineffective internal controls could impact our businessand operating results.
Our internal control over financial reporting may notprevent or detect misstatements because of its inherentlimitations, including the possibility of human error,the circumvention or overriding of controls, or fraud.Even effective internal controls can provide onlyreasonable assurance with respect to the preparation andfair presentation of financial statements. If we fail tomaintain the adequacy of our internal controls, includingany failure to implement required new or improvedcontrols, or if we experience difficulties in theirimplementation, our business and operating results maybe harmed and we could fail to meet our financialreporting obligations.
ITEM 1B. UNRESOLVED STAFF COMMENTS
None.
ITEM 2. PROPERTIES
As of August 31, 2019, our principal executive offices inSalt Lake City, Utah occupy approximately 84,000 squarefeet of leased office space that is accounted for as afinancing arrangement, which expires in 2025. This facilityaccommodates our executive team and corporatedepartments, as well as other professionals. The masterlease agreement on our principal executive offices containssix five-year renewal options that may be exercised at
71 Properties Franklin Covey 2019 Annual Report

our discretion. Additionally, we occupy leased sales andadministrative offices both in the United States andvarious countries around the world as shown below. Theseleased facilities are accounted for as operating leases.
We consider our existing facilities to be in good conditionand suitable for our current and expected level ofoperations in the upcoming fiscal year and in futureperiods.
U.S./Canada Sales Offices
Columbus, Ohio
International Sales Offices
Banbury, EnglandTokyo, JapanChina: Beijing, Shanghai, Guangzhou, andShenzhen
During fiscal 2019, we acquired the licensee operationthat serves Germany, Switzerland, and Austria (GSA),which was headquartered in Munich, Germany. InJuly 2019, we closed the headquarters office in Munichand our sales personnel in the GSA countries now operatefrom their homes similar to our sales personnel in the
United States, Canada, and in certain other countries. Infiscal 2017, we restructured the operations of ourdomestic sales regions to focus on sales and support ofthe All Access Pass. As part of this restructuring, we closedour three remaining sales offices in Atlanta, Georgia;Chicago, Illinois; and Irvine, California. Our remainingsales office in the United States is used by Robert GregoryPartners, which is one of the businesses that we acquiredduring fiscal 2017. There were no other significantchanges to the properties used for our operations duringthe periods presented in this report.
ITEM 3. LEGAL PROCEEDINGSFrom time to time, we are the subject of certain legalactions, which we consider routine to our businessactivities. At August 31, 2019, we were not party to anylitigation or legal proceeding that, in the current opinionof management, could have a material adverse effecton our financial position, liquidity, or results of operations.However, due to the risks and uncertainties inherent inlegal proceedings, actual results could differ from currentexpectations.
ITEM 4. MINE SAFETY DISCLOSURESNot applicable.
Franklin Covey 2019 Annual Report Properties 72

PART IIITEM 5. MARKET FOR REGISTRANT’S COMMONEQUITY, RELATED STOCKHOLDER MATTERSAND ISSUER PURCHASES OF EQUITY SECURITIESOur common stock is listed and traded on the NewYork Stock Exchange (NYSE) under the symbol “FC.”
We did not pay or declare dividends on our common stockduring the fiscal years ended August 31, 2019 or 2018.Any determination to pay cash dividends will be atthe discretion of our board of directors and will bedependent upon our results of operations, financialcondition, terms of our financing arrangements, and suchother factors as the board deems relevant. We currentlyanticipate that we will retain all available funds to repayour liabilities, finance future growth and businessopportunities, and to repurchase outstanding shares ofour common stock.
As of October 31, 2019, we had 13,982,356 shares ofcommon stock outstanding, which were held by 528shareholders of record. A number of our shareholdershold their shares in street name; therefore, we believe thatthere are substantially more beneficial owners of ourcommon stock.
Purchases of Common Stock by the Issuer
We did not have any purchases of our common stockduring the fourth quarter of fiscal 2019.
On January 23, 2015, our Board of Directors approved anew plan to repurchase up to $10.0 million of theCompany’s outstanding common stock. All previouslyexisting common stock repurchase plans were canceledand the new common share repurchase plan does not havean expiration date. On March 27, 2015, our Board ofDirectors increased the aggregate value of shares ofCompany common stock that may be purchased underthe January 2015 plan to $40.0 million so long as we haveeither $10.0 million in cash and cash equivalents orhave access to debt financing of at least $10.0 million.Under the terms of this expanded common stockrepurchase plan, we have purchased 1,539,828 shares ofour common stock for $26.8 million through August 31,2019.
The actual timing, number, and value of common sharesrepurchased under this plan will be determined at ourdiscretion and will depend on a number of factors,including, among others, general market and businessconditions, the trading price of common shares, andapplicable legal requirements. The Company has noobligation to repurchase any common shares under theauthorization, and the repurchase plan may be suspended,discontinued, or modified at any time for any reason.
73 Market for Registrant’s Common Equity Franklin Covey 2019 Annual Report

Performance Graph
The following graph demonstrates a five-year comparisonof cumulative total returns for Franklin Covey Co.common stock, the S&P SmallCap 600 Index, and theS&P 600 Commercial & Professional Services Index. The
graph assumes an investment of $100 on August 31, 2014in each of our common stock, the stocks comprisingthe S&P SmallCap 600 Index, and the stocks comprisingthe S&P 600 Commercial & Professional Services Index.Each of the indices assumes that all dividends werereinvested.
80.00
100.00
120.00
140.00
160.00
180.00
200.00
Aug-14 Aug-15 Aug-16 Aug-17 Aug-19Aug-18
Franklin Covey Co.S&P SmallCap 600 IndexCommercial & Professional Services
Indexed Returns
The stock performance shown on the performance graphabove is not necessarily indicative of future performance.The Company will not make nor endorse any predictionsas to our future stock performance.
The performance graph above is being furnished solely toaccompany this Annual Report on Form 10-K pursuant
to Item 201(e) of Regulation S-K, and is not being filedfor purposes of Section 18 of the Exchange Act, asamended, and is not to be incorporated by reference intoany filing of the Company, whether made before orafter the date hereof, regardless of any generalincorporation language in such filing.
Franklin Covey 2019 Annual Report Market for Registrant’s Common Equity 74

ITEM 6. SELECTED FINANCIAL DATA
The selected consolidated financial data presented below should be read in conjunction with our consolidated financialstatements and related footnotes as found in Item 8 of this Annual Report on Form 10-K.
August 31, 2019 2018 2017(1) 2016 2015(2)
In thousands, except per-share dataIncome Statement Data:Net sales $225,356 $209,758 $185,256 $200,055 $209,941Gross profit 159,314 148,289 122,667 133,154 138,089Income (loss) from operations 2,655 (3,366) (8,880) 13,849 19,529Income (loss) before income taxes 592 (5,520) (10,909) 11,911 17,412Income tax benefit (provision) (1,615) (367) 3,737 (4,895) (6,296)Net income (loss) (1,023) (5,887) (7,172) 7,016 11,116Earnings (loss) per share:
Basic and diluted $ (.07) $ (.43) $ (.52) $ .47 $ .66
Balance Sheet Data:Total current assets $119,340 $100,163 $ 91,835 $ 89,741 $ 95,425Other long-term assets 10,039 12,935 16,005 13,713 14,807Total assets 224,913 213,875 210,731 190,871 200,645Long-term obligations 46,690 50,936 53,158 48,511 36,978Total liabilities 142,899 133,375 125,666 97,156 75,139Shareholders’ equity 82,014 80,500 85,065 93,715 125,506
Cash flows from operating activities $ 30,452 $ 16,861 $ 17,357 $ 32,665 $ 26,190
(1) During fiscal 2017 we decided to allow new All Access Pass agreements to receive updated content throughout the contracted period. Accordingly,we defer substantially all AAP revenues at the inception of the agreements and recognize the revenue over the lives of the arrangements. Thetransition to the AAP model resulted in significantly reduced revenues and operating income during fiscal 2017.
(2) We elected to amend previously filed U.S. federal income tax returns to claim foreign tax credits instead of foreign tax deductions and recognizedsignificant income tax benefits which reduced our effective income tax rate during these years.
ITEM 7. MANAGEMENT’S DISCUSSION ANDANALYSIS OF FINANCIAL CONDITION ANDRESULTS OF OPERATIONS
The following management’s discussion and analysis isintended to provide a summary of the principal factorsaffecting the results of operations, liquidity and capitalresources, contractual obligations, and the criticalaccounting policies of Franklin Covey Co. (also referredto as we, us, our, the Company, and Franklin Covey)and subsidiaries. This discussion and analysis should beread together with the accompanying consolidatedfinancial statements and related notes contained in Item 8of this Annual Report on Form 10-K (Form 10-K) andthe Risk Factors discussed in Item 1A of this Form 10-K.Forward-looking statements in this discussion arequalified by the cautionary statement under the heading“Safe Harbor Statement Under the Private SecuritiesLitigation Reform Act Of 1995” contained later in Item 7of this Form 10-K.
Non-GAAP Measures
This management’s discussion and analysis includes theconcepts of adjusted earnings before interest, incometaxes, depreciation, and amortization (Adjusted EBITDA)and “constant currency,” which are non-GAAP measures.We define Adjusted EBITDA as net income or lossexcluding the impact of interest expense, income taxes,intangible asset amortization, depreciation, stock-based compensation expense, and certain other itemssuch as adjustments to the fair value of expectedcontingent consideration liabilities arising from businessacquisitions. Constant currency is a non-GAAP financialmeasure that removes the impact of fluctuations in foreigncurrency exchange rates and is calculated by translatingthe current period’s financial results at the same averageexchange rates in effect during the prior year and thencomparing this amount to the prior year.
We reference these non-GAAP financial measures in ourdecision making because they provide supplementalinformation that facilitates consistent internal
75 Selected Financial Data Franklin Covey 2019 Annual Report

comparisons to the historical operating performance ofprior periods and we believe they provide investors withgreater transparency to evaluate operational activitiesand financial results. For a reconciliation of our segmentAdjusted EBITDA to net loss, the nearest comparableGAAP measure, please refer to Note 17 (SegmentInformation) to our consolidated financial statements aspresented in Item 8 of this Form 10-K.
EXECUTIVE SUMMARY
General Overview
Franklin Covey Co. is a global company focused onindividual and organizational performance improvement.Our mission is to “enable greatness in people andorganizations everywhere,” and our worldwide resourcesare organized to help individuals and organizationsachieve sustained superior performance through changesin human behavior. We believe that our content andservices create the connection between capabilities andresults. We believe that our clients are able to utilize ourcontent to create cultures whose hallmarks arehigh-performing, collaborative individuals, led by effective,trust-building leaders who execute with excellence anddeliver measurably improved results for all of theirkey stakeholders.
In the training and consulting marketplace, we believethere are three important characteristics that distinguishus from our competitors.
1. World Class Content – Our content isprinciple-centered and based on natural laws ofhuman behavior and effectiveness. When our contentis applied consistently in an organization, we believethe culture of that organization will change toenable the organization to achieve their own greatpurposes. Our offerings are designed to buildnew skillsets, establish new mindsets, and provideenabling toolsets.
2. Breadth and Scalability of Delivery Options – Wehave a wide range of content delivery options,including: the All Access Pass, the Leader in Memembership, and other intellectual property licenses,on-site training, training led through certifiedfacilitators, on-line learning, blended learning, andorganization-wide transformational processes,including consulting and coaching.
3. Global Capability – We have sales professionals inthe United States and Canada who serve clients in theprivate sector, in government, and in educational
institutions; wholly owned subsidiaries in Australia,China, Japan, the United Kingdom, Germany,Switzerland, and Austria; and we contract withindependent licensee partners who deliver ourcontent and provide services in over 140 countriesand territories around the world.
We hold ourselves responsible for and measure ourselvesby our clients’ achievement of transformational results.
We have some of the best-known offerings in the trainingindustry, including a suite of individual-effectivenessand leadership-development training content based onthe best-selling books, The 7 Habits of Highly EffectivePeople, The Speed of Trust, and The 4 Disciplines ofExecution, and proprietary content in the areas ofExecution, Sales Performance, Productivity, CustomerLoyalty, and Education. We believe that our offerings helpindividuals, teams, and entire organizations transformtheir results through achieving systematic, sustainable,and measurable changes in human behavior. Our offeringsare described in further detail at www.franklincovey.com.The information contained in, or that can be accessedthrough, our website does not constitute a part of thisannual report, and the descriptions found therein shouldnot be viewed as a warranty or guarantee of results.
Our fiscal year ends on August 31, and unless otherwiseindicated, fiscal 2019, fiscal 2018, and fiscal 2017 refer tothe twelve-month periods ended August 31, 2019, 2018,2017, and so forth.
Financial OverviewOur fiscal 2019 financial results reflect strong growth inrevenues, operating results, and cash flows over the prioryear. Increased sales were driven by strong performancefrom both our Enterprise and Education Divisions duringfiscal 2019 as shown in the table below. We believe thatthe ongoing transition to a subscription-based businessmodel is working well and results for fiscal 2019 reflect themomentum that began in fiscal 2018. For the fiscal yearended August 31, 2019, our consolidated sales increasedseven percent to $225.4 million compared with$209.8 million in fiscal 2018, despite $2.0 million ofunfavorable foreign exchange impact on our sales duringthe fiscal year. In constant currency, our sales in fiscal2019 grew eight percent compared with the prior year.Increased sales, combined with continued strong grossmargins and controlled operating expense growth,produced significant improvements in our operatingresults and cash flows during fiscal 2019 when comparedwith the prior year.
Franklin Covey 2019 Annual Report Management’s Discussion and Analysis 76

For fiscal 2019, our subscription and subscription-relatedrevenue grew 23 percent compared with fiscal 2018. AtAugust 31, 2019, we had $65.8 million of deferred revenuecompared with $52.9 million at August 31, 2018. Totaldeferred revenue reported above at August 31, 2019 andAugust 31, 2018 includes $3.6 million and $1.0 million,respectively, of deferred revenue that was reclassified toother long-term liabilities based on expected recognition.At August 31, 2019, our unbilled deferred revenue grew
22 percent to $29.9 million compared with $24.5 millionat the end of fiscal 2018. Unbilled deferred revenuerepresents business that is contracted, but unbilled andtherefore excluded from our balance sheet.
The following table sets forth our consolidated net salesby division and by reportable segment for the fiscal yearsindicated (in thousands):
YEAR ENDED AUGUST 31, 2019 % change 2018 % change 2017Enterprise Division:
Direct offices $157,754 8 $145,890 19 $122,309International licensees 12,896 (3) 13,226 (3) 13,571
170,650 7 159,116 17 135,880Education Division 48,880 8 45,272 3 44,122Corporate and other 5,826 8 5,370 2 5,254Consolidated sales $225,356 7 $209,758 13 $185,256
Gross profit consists of net sales less the cost of servicesprovided or the cost of goods sold. Our cost of salesincludes the direct costs of delivering content onsite atclient locations, including presenter costs, materials usedin the production of training products and relatedassessments, assembly, manufacturing labor costs, andfreight. Gross profit may be affected by, among otherthings, the mix of services sold to clients, prices ofmaterials, labor rates, changes in product discount levels,and freight costs. Consolidated cost of sales in fiscal2019 totaled $66.0 million compared with $61.5 millionin fiscal 2018. Our gross profit for the fiscal year endedAugust 31, 2019 increased to $159.3 million, comparedwith $148.3 million in fiscal 2018. The increase in grossprofit was primarily due to increased sales as describedabove. Our gross margin, which is gross profit as a percentof sales, remained strong and was consistent with theprior year at 70.7 percent.
For the fiscal year ended August 31, 2019, our operatingexpenses increased $5.0 million compared with the prioryear. The increase was primarily due to a $4.2 millionincrease in selling, general, and administrative (SG&A)expenses, and a $1.2 million increase in depreciationexpense primarily related to capital spending on our AAPportal and new ERP system in prior years. These increaseswere partially offset by a $0.4 million decrease inamortization expense. Increased SG&A expenses duringfiscal 2019 were primarily due to associate costs resultingfrom increased commissions and bonuses on highersales, new sales and sales related personnel, a $1.9 millionincrease in non-cash stock-based compensation, andthe addition of GSA personnel, who were formerly
employed by a licensee. Although SG&A expensesincreased compared with the prior year, as a percent ofrevenues, SG&A expenses decreased to 64.5 percentcompared with 67.3 percent in fiscal 2018.
Our results of operations in fiscal 2019 improved$6.0 million to $2.7 million of income compared with aloss from operations in fiscal 2018 of $(3.4) million. Fiscal2019 pre-tax income increased $6.1 million to $0.6 millioncompared with a pre-tax loss of $(5.5) million in fiscal2018.
Our effective income tax rate for fiscal 2019 wasapproximately 273 percent compared with an effectivetax rate of approximately 7 percent in fiscal 2018. Theincreased effective tax rate in fiscal 2019 was primarilydue to the relatively small amount of our 2019 pre-taxincome, which greatly amplified the effect ofnon-temporary items on our effective tax rate. Oureffective tax rate was also increased by tax expense fromGlobal Intangible Low-Taxed Income (GILTI),nondeductible expenses, and effective foreign tax rateswhich were significantly higher than the U.S. federalstatutory rate, offset by a much smaller increase in ourvaluation allowance against deferred income tax assetsduring fiscal 2019 than the increase recorded during fiscal2018. In addition, we recorded a one-time benefit duringfiscal 2018 resulting from the 2017 Tax Act’s reductionof the U.S. federal income tax rate. This income tax benefitdid not repeat in fiscal 2019.
Net loss for the year ended August 31, 2019 was$(1.0) million, or $(.07) per share, compared with a lossof $(5.9) million, or $(.43) per share, in fiscal 2018.
77 Management’s Discussion and Analysis Franklin Covey 2019 Annual Report

Further details regarding these items can be found in thecomparative analysis of fiscal 2019 with fiscal 2018 asdiscussed within this management’s discussion andanalysis.
Our liquidity position remained strong during fiscal 2019and we had $27.7 million of cash at August 31, 2019,with no borrowings on our $15.0 million revolving creditfacility, compared with $10.2 million of cash at August 31,2018. During August 2019, we obtained a new creditagreement with our existing lender, which included a new$20.0 million term loan. For further information regardingour liquidity and cash flows, refer to the Liquidity andCapital Resources discussion found later in thismanagement’s discussion and analysis.
Key Growth Objectives
We believe that our best-in-class offerings, combinedwith flexible delivery modalities and worldwide sales anddistribution capabilities are the foundation for futuregrowth at Franklin Covey. Building on this foundation,we have identified the following key drivers of growth infiscal 2020 and beyond:
• New Subscription Service Sales and the Renewal ofExisting Client Contracts – We are striving to fullyintegrate the subscription model throughout ourEnterprise and Education Division operations. Webelieve the subscription-based business model createsstrategic and structural durability with our clients whileproviding significant visibility and predictability intofuture revenue and earnings. These factors contributeto higher margins, high recurring revenue, andpredictable cash flow-through of sales to earnings.Accordingly, we are focused on sales of multi-yearsubscription contracts and have restructured our salesforce and sales support functions to more effectivelysell and support subscription services.
• Aggressive Expansion of the Client PartnerModel – We are focused on consistently increasing thenumber of new client partners to increase our salesforce and market penetration. We believe our clientpartner model is a key driver of future growth as newclient partners on average break even during their firstyear and make significant contributions to salesgrowth thereafter. At August 31, 2019, we had 245client partners compared with 214 at the end of fiscal2018.
• Content Expansion – We believe that our offeringsare based on best-in-class content driven by best-sellingbooks and world-class thought leadership. Our contentis focused on performance improvement throughbehavior-changing outcome oriented training. TheCompany’s vision is to profoundly impact the waybillions of people throughout the world live, work, andachieve their own great purposes. We believe ongoinginvestment in our existing and new content will allow usto achieve this vision.
• Continued Emphasis on Client Loyalty – Another ofour underlying strategic objectives is to consistentlydeliver quality results to our clients. This conceptis focused on ensuring that our content and offeringsare best-in-class, and that they have a measurable,lasting impact on our clients’ results. We believe thatmeasurable improvement in our clients’ organizationsis key to retaining current clients and to obtaining newsales opportunities.
Other key factors that influence our operating resultsinclude: the number and productivity of our internationallicensee operations; the number of organizations thatare active customers; the number of people trained withinthose organizations; the continuation or renewal ofexisting services contracts, especially subscriptionrenewals; the availability of budgeted training spending atour clients and prospective clients, which, in certaincontent categories, can be significantly influencedby general economic conditions; and our ability to manageoperating costs necessary to develop and providemeaningful training and related services and products toour clients.
Franklin Covey 2019 Annual Report Management’s Discussion and Analysis 78
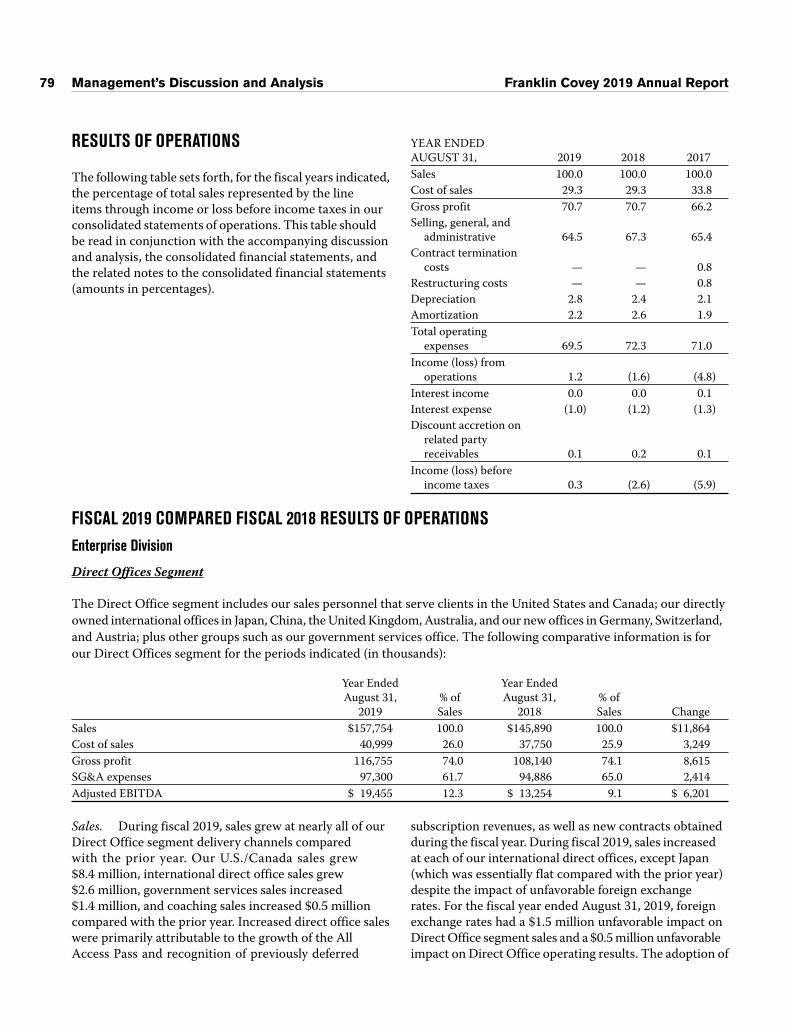
RESULTS OF OPERATIONS
The following table sets forth, for the fiscal years indicated,the percentage of total sales represented by the lineitems through income or loss before income taxes in ourconsolidated statements of operations. This table shouldbe read in conjunction with the accompanying discussionand analysis, the consolidated financial statements, andthe related notes to the consolidated financial statements(amounts in percentages).
YEAR ENDEDAUGUST 31, 2019 2018 2017Sales 100.0 100.0 100.0Cost of sales 29.3 29.3 33.8Gross profit 70.7 70.7 66.2Selling, general, and
administrative 64.5 67.3 65.4Contract termination
costs — — 0.8Restructuring costs — — 0.8Depreciation 2.8 2.4 2.1Amortization 2.2 2.6 1.9Total operating
expenses 69.5 72.3 71.0Income (loss) from
operations 1.2 (1.6) (4.8)Interest income 0.0 0.0 0.1Interest expense (1.0) (1.2) (1.3)Discount accretion on
related partyreceivables 0.1 0.2 0.1
Income (loss) beforeincome taxes 0.3 (2.6) (5.9)
FISCAL 2019 COMPARED FISCAL 2018 RESULTS OF OPERATIONSEnterprise Division
Direct Offices Segment
The Direct Office segment includes our sales personnel that serve clients in the United States and Canada; our directlyowned international offices in Japan, China, the United Kingdom, Australia, and our new offices in Germany, Switzerland,and Austria; plus other groups such as our government services office. The following comparative information is forour Direct Offices segment for the periods indicated (in thousands):
Year EndedAugust 31,
2019% ofSales
Year EndedAugust 31,
2018% ofSales Change
Sales $157,754 100.0 $145,890 100.0 $11,864Cost of sales 40,999 26.0 37,750 25.9 3,249Gross profit 116,755 74.0 108,140 74.1 8,615SG&A expenses 97,300 61.7 94,886 65.0 2,414Adjusted EBITDA $ 19,455 12.3 $ 13,254 9.1 $ 6,201
Sales. During fiscal 2019, sales grew at nearly all of ourDirect Office segment delivery channels comparedwith the prior year. Our U.S./Canada sales grew$8.4 million, international direct office sales grew$2.6 million, government services sales increased$1.4 million, and coaching sales increased $0.5 millioncompared with the prior year. Increased direct office saleswere primarily attributable to the growth of the AllAccess Pass and recognition of previously deferred
subscription revenues, as well as new contracts obtainedduring the fiscal year. During fiscal 2019, sales increasedat each of our international direct offices, except Japan(which was essentially flat compared with the prior year)despite the impact of unfavorable foreign exchangerates. For the fiscal year ended August 31, 2019, foreignexchange rates had a $1.5 million unfavorable impact onDirect Office segment sales and a $0.5 million unfavorableimpact on Direct Office operating results. The adoption of
79 Management’s Discussion and Analysis Franklin Covey 2019 Annual Report

Accounting Standards Update (ASU) No. 2014-09,Revenue from Contracts with Customers (Topic 606) didnot have a significant impact on our Direct Office sales.
Gross Profit. Gross profit increased due to increasedsales in fiscal 2019 as previously described. Gross marginremained strong and was consistent with fiscal 2018.
SG&A Expenses. Direct Office operating expensesincreased primarily due to increased commissions onhigher sales, new sales and sales related personnel, andnew GSA direct office expenses, which totaled$1.3 million. These increases were partially offset by
reductions and cost savings initiatives in various otherareas of our Direct Office operations.
International Licensees Segment
In countries or foreign locations where we do not have adirectly owned office, our training and consulting servicesare delivered through independent licensees. Thefollowing comparative information is for our internationallicensee operations for the periods indicated (inthousands):
Year EndedAugust 31,
2019% ofSales
Year EndedAugust 31,
2018% ofSales Change
Sales $12,896 100.0 $13,226 100.0 $(330)Cost of sales 2,665 20.7 3,195 24.2 (530)Gross profit 10,231 79.3 10,031 75.8 200SG&A expenses 4,159 32.3 4,950 37.4 (791)Adjusted EBITDA $ 6,072 47.0 $ 5,081 38.4 $ 991
Sales. International licensee revenues are primarilycomprised of royalty revenues received from ourinternational licensees. Licensee revenues declinedduring fiscal 2019 primarily due to the conversion of ourGSA licensee to a direct office, which produced$0.4 million of royalty revenues in the prior year, theunfavorable impact of foreign exchange rates, and reducedsales of wholesale materials (primarily kits) and consultingservices to the licensees. Foreign exchange rates had a$0.3 million unfavorable impact on licensee revenues andoperating results during fiscal 2019. These decreaseswere partially offset by higher royalty revenues fromcertain licensees during the fiscal year.
Gross Profit. Licensee gross profit increased primarilydue to decreased sales of wholesale materials andconsulting services to the licensees. These products and
services have much lower margins than licensee royaltyrevenues.
SG&A Expenses. International licensee SG&A expensesdecreased primarily due to the implementation of variouscost savings initiatives during fiscal 2019 to improvethe operating results of this segment.
Education Division
Our Education Division is comprised of our domesticand international Education practice operations (focusedon sales to educational institutions) and includes ourwidely acclaimed Leader In Me program. The followingcomparative information is for our Education Division inthe periods indicated (in thousands):
Year EndedAugust 31,
2019% ofSales
Year EndedAugust 31,
2018% ofSales Change
Sales $48,880 100.0 $45,272 100.0 $3,608Cost of sales 18,507 37.9 16,618 36.7 1,889Gross profit 30,373 62.1 28,654 63.3 1,719SG&A expenses 26,820 54.8 25,944 57.3 876Adjusted EBITDA $ 3,553 7.3 $ 2,710 6.0 $ 843
Franklin Covey 2019 Annual Report Management’s Discussion and Analysis 80

Sales. For the fiscal year ended August 31, 2019, ourEducation Practice sales increased primarily due toincreased subscription revenues and the addition of newschools. Partially offsetting these increases was theprevious expiration of a large six-year fundingcommitment from a charitable educational foundation,which significantly reduced the number of open grants infiscal 2019 and 2018. This contract expiration reducedrevenues in the Education Division by $1.1 million, andgross profit by approximately $0.7 million during fiscal2019. International Education licensee sales and operatingresults were also adversely affected by $0.2 million ofunfavorable exchange rates during fiscal 2019. Theadoption of ASC 606 had a net $0.1 million favorableimpact on Education Division sales and operating resultsduring fiscal 2019. Consistent with prior years, wecontinue to see increased demand for the Leader in Meprogram throughout the world. As of August 31, 2019, theLeader in Me program is used in over 4,000 schools andin over 50 countries.
Gross Profit. Education segment gross profit increasedprimarily due to increased sales as previously described.Education Division gross margin was slightly lower thanthe prior year primarily due to increased costs associatedwith the Leader in Me online offering.
SG&A Expenses. The increase in Education DivisionSG&A expense was primarily due to investments in newsales personnel, increased commissions on higher sales,and the cost of developing new materials to providegrowth opportunities in future periods.
Other Expenses
Depreciation – Depreciation expense increased due tothe acquisition of capital assets, including significanttechnology related investments in fiscal 2018, andpurchases during fiscal 2019. Based on previous propertyand equipment acquisitions, and expected capitaladditions during fiscal 2020, we expect depreciationexpense will total approximately $6.7 million in fiscal2020.
Amortization – Our amortization expense decreasedcompared with the prior year primarily due to the fullamortization of certain intangible assets during fiscal
2019. We expect the amortization of intangible assets willtotal approximately $4.6 million during fiscal 2020.
Accretion of Discount on Related PartyReceivables – We have receivables from FCOrganizational Products (FCOP), an entity in which weown a 19.5 percent interest. We classify these receivablesas current or long-term based on expected paymentdates, and discounted the long-term receivables at a rateof 15 percent, which we believe is an approximation ofFCOP’s incremental borrowing rate. During the secondquarter of fiscal 2019, we received $1.4 million of cashfrom FCOP as payment on outstanding receivables. Thispayment was larger than previously anticipated and weaccelerated the accretion of the remaining discount on thelong-term FCOP receivable during fiscal 2019.
Income Taxes
Our effective income tax rate for the fiscal year endedAugust 31, 2019 was approximately 273 percent, comparedwith approximately 7 percent in fiscal 2018. The increasedeffective tax rate in fiscal 2019 was primarily due to therelatively small amount of our 2019 pre-tax income, whichgreatly amplified the effect of non-temporary items onour effective tax rate. Our effective tax rate was alsoincreased by tax expense from GILTI, nondeductibleexpenses, and effective foreign tax rates which weresignificantly higher than the U.S. federal statutory rate.These increases were partially offset by changes in ourvaluation allowance against deferred income tax assets in2019 compared with fiscal 2018. During fiscal 2019, ourvaluation allowance against deferred tax assets increasedby $0.5 million, which was significantly less than the$2.8 million net increase in fiscal 2018. In addition, werecorded a one-time benefit in fiscal 2018 from the 2017Tax Act’s reduction of the U.S. federal income tax rate.This benefit did not repeat in fiscal 2019.
Although we paid $1.8 million in cash for income taxesduring fiscal 2019, we anticipate that our total cash paidfor income taxes over the coming three to five years will beless than our total income tax provision as we utilize netoperating loss carryforwards, foreign tax creditcarryforwards and other deferred income tax assets.
81 Management’s Discussion and Analysis Franklin Covey 2019 Annual Report

FISCAL 2018 COMPARED WITH FISCAL 2017 RESULTS OF OPERATIONSEnterprise DivisionDirect Offices Segment
The following comparative information is for our Direct Offices segment for the periods indicated (in thousands):
Year EndedAugust 31,
2018% ofSales
Year EndedAugust 31,
2017% ofSales Change
Sales $145,890 100.0 $122,309 100.0 $23,581Cost of sales 37,750 25.9 40,609 33.2 (2,859)Gross profit 108,140 74.1 81,700 66.8 26,440SG&A expenses 94,886 65.0 77,458 63.3 17,428Adjusted EBITDA $ 13,254 9.1 $ 4,242 3.5 $ 9,012
Sales. During fiscal 2018, our Direct Office segmentsales increased primarily due to increased sales ofsubscription services and recognition of previouslydeferred subscription sales. In addition, our governmentservices sales increased $4.1 million, and we had$4.0 million of increased revenue from businesses acquiredin the third and fourth quarters of fiscal 2017. Theseincreases were partially offset by decreased facilitatorsales, as many of these clients have transitioned tothe AAP, and decreased onsite training revenues.
International direct office sales increased $4.9 millionwhen compared with the prior year. Sales increased at allof our international offices compared with fiscal 2017.Our sales in the United Kingdom and Australia werefavorably impacted by the recognition of previouslydeferred AAP revenues and new contracts. Our offices inChina continued to perform well and we recognized a$1.3 million increase in sales compared with the prior year.Our Japan office sales increased by $0.2 million despiteour decision to exit the publishing business in the thirdquarter of fiscal 2017. Foreign exchange rates had a$1.0 million favorable impact on our international directoffices sales and a $0.2 million favorable impact on ourinternational direct office results of operations duringfiscal 2018.
Gross Profit. Gross profit increased due to increasedsales during fiscal 2018 as described above. Gross marginincreased primarily due to increased subscription servicesales, which generally have higher gross margins than ourother services, and our decision to exit the publishingbusiness in Japan during fiscal 2017. During fiscal 2017,we recorded a $2.1 million charge in cost of goods sold toexit this business and write off the majority of our bookinventory in Japan.
SG&A Expenses. Direct Office operating expensesincreased primarily due to increased commissions onhigher sales; new sales and sales related personnel,including implementation specialists; and new personnelfrom businesses acquired during the third and fourthquarters of fiscal 2017.
International Licensees Segment
The following comparative information is for ourinternational licensee operations in the periods indicated(in thousands):
Year EndedAugust 31,
2018% ofSales
Year EndedAugust 31,
2017% ofSales Change
Sales $13,226 100.0 $13,571 100.0 $ (345)Cost of sales 3,195 24.2 3,088 22.8 107Gross profit 10,031 75.8 10,483 77.2 (452)SG&A expenses 4,950 37.4 4,068 30.0 882Adjusted EBITDA $ 5,081 38.4 $ 6,415 47.3 $(1,334)
Franklin Covey 2019 Annual Report Management’s Discussion and Analysis 82
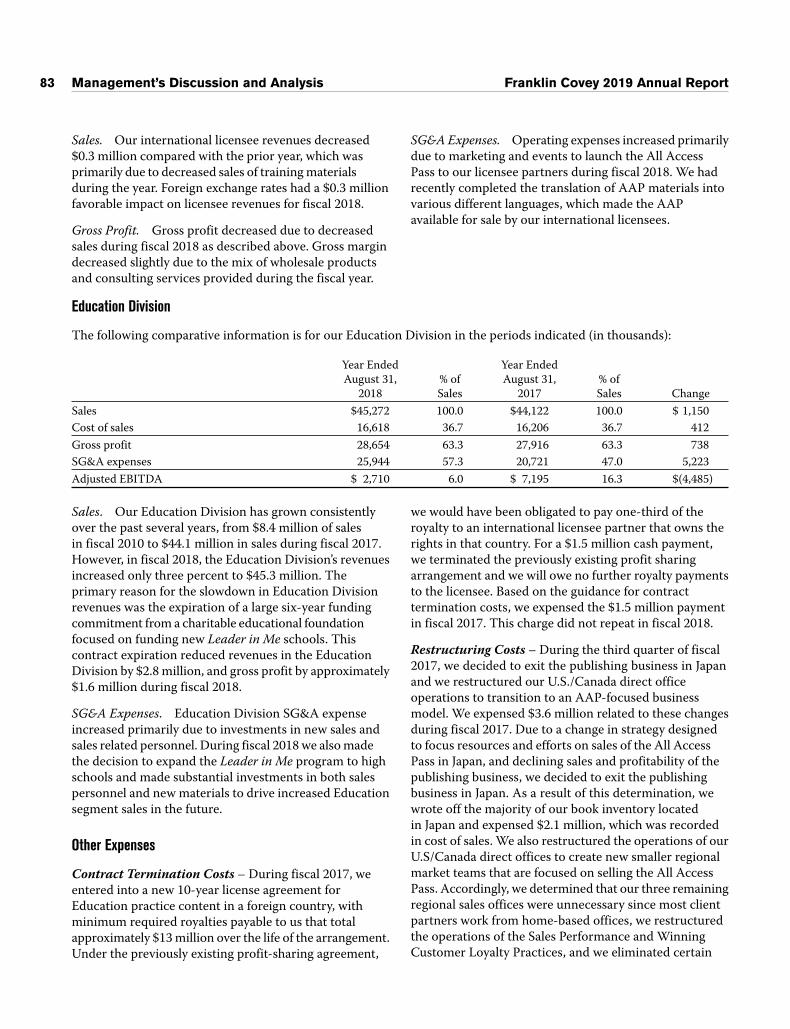
Sales. Our international licensee revenues decreased$0.3 million compared with the prior year, which wasprimarily due to decreased sales of training materialsduring the year. Foreign exchange rates had a $0.3 millionfavorable impact on licensee revenues for fiscal 2018.
Gross Profit. Gross profit decreased due to decreasedsales during fiscal 2018 as described above. Gross margindecreased slightly due to the mix of wholesale productsand consulting services provided during the fiscal year.
SG&A Expenses. Operating expenses increased primarilydue to marketing and events to launch the All AccessPass to our licensee partners during fiscal 2018. We hadrecently completed the translation of AAP materials intovarious different languages, which made the AAPavailable for sale by our international licensees.
Education Division
The following comparative information is for our Education Division in the periods indicated (in thousands):
Year EndedAugust 31,
2018% ofSales
Year EndedAugust 31,
2017% ofSales Change
Sales $45,272 100.0 $44,122 100.0 $ 1,150Cost of sales 16,618 36.7 16,206 36.7 412Gross profit 28,654 63.3 27,916 63.3 738SG&A expenses 25,944 57.3 20,721 47.0 5,223Adjusted EBITDA $ 2,710 6.0 $ 7,195 16.3 $(4,485)
Sales. Our Education Division has grown consistentlyover the past several years, from $8.4 million of salesin fiscal 2010 to $44.1 million in sales during fiscal 2017.However, in fiscal 2018, the Education Division’s revenuesincreased only three percent to $45.3 million. Theprimary reason for the slowdown in Education Divisionrevenues was the expiration of a large six-year fundingcommitment from a charitable educational foundationfocused on funding new Leader in Me schools. Thiscontract expiration reduced revenues in the EducationDivision by $2.8 million, and gross profit by approximately$1.6 million during fiscal 2018.
SG&A Expenses. Education Division SG&A expenseincreased primarily due to investments in new sales andsales related personnel. During fiscal 2018 we also madethe decision to expand the Leader in Me program to highschools and made substantial investments in both salespersonnel and new materials to drive increased Educationsegment sales in the future.
Other Expenses
Contract Termination Costs – During fiscal 2017, weentered into a new 10-year license agreement forEducation practice content in a foreign country, withminimum required royalties payable to us that totalapproximately $13 million over the life of the arrangement.Under the previously existing profit-sharing agreement,
we would have been obligated to pay one-third of theroyalty to an international licensee partner that owns therights in that country. For a $1.5 million cash payment,we terminated the previously existing profit sharingarrangement and we will owe no further royalty paymentsto the licensee. Based on the guidance for contracttermination costs, we expensed the $1.5 million paymentin fiscal 2017. This charge did not repeat in fiscal 2018.
Restructuring Costs – During the third quarter of fiscal2017, we decided to exit the publishing business in Japanand we restructured our U.S./Canada direct officeoperations to transition to an AAP-focused businessmodel. We expensed $3.6 million related to these changesduring fiscal 2017. Due to a change in strategy designedto focus resources and efforts on sales of the All AccessPass in Japan, and declining sales and profitability of thepublishing business, we decided to exit the publishingbusiness in Japan. As a result of this determination, wewrote off the majority of our book inventory locatedin Japan and expensed $2.1 million, which was recordedin cost of sales. We also restructured the operations of ourU.S/Canada direct offices to create new smaller regionalmarket teams that are focused on selling the All AccessPass. Accordingly, we determined that our three remainingregional sales offices were unnecessary since most clientpartners work from home-based offices, we restructuredthe operations of the Sales Performance and WinningCustomer Loyalty Practices, and we eliminated certain
83 Management’s Discussion and Analysis Franklin Covey 2019 Annual Report
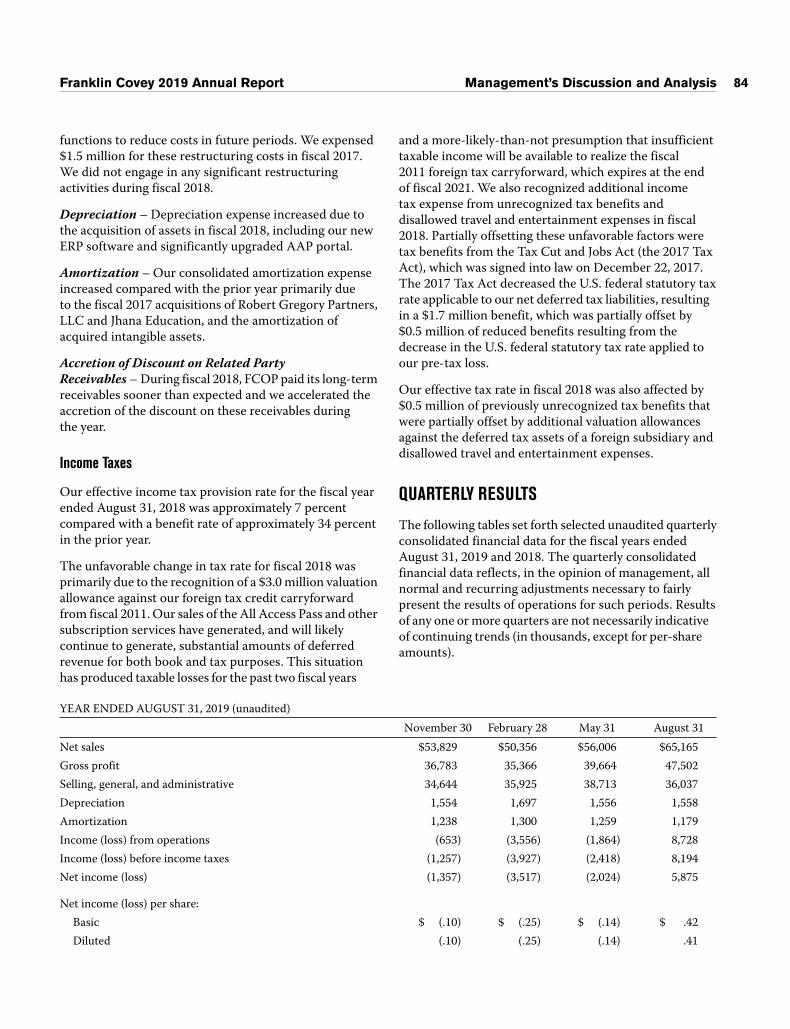
functions to reduce costs in future periods. We expensed$1.5 million for these restructuring costs in fiscal 2017.We did not engage in any significant restructuringactivities during fiscal 2018.
Depreciation – Depreciation expense increased due tothe acquisition of assets in fiscal 2018, including our newERP software and significantly upgraded AAP portal.
Amortization – Our consolidated amortization expenseincreased compared with the prior year primarily dueto the fiscal 2017 acquisitions of Robert Gregory Partners,LLC and Jhana Education, and the amortization ofacquired intangible assets.
Accretion of Discount on Related PartyReceivables – During fiscal 2018, FCOP paid its long-termreceivables sooner than expected and we accelerated theaccretion of the discount on these receivables duringthe year.
Income Taxes
Our effective income tax provision rate for the fiscal yearended August 31, 2018 was approximately 7 percentcompared with a benefit rate of approximately 34 percentin the prior year.
The unfavorable change in tax rate for fiscal 2018 wasprimarily due to the recognition of a $3.0 million valuationallowance against our foreign tax credit carryforwardfrom fiscal 2011. Our sales of the All Access Pass and othersubscription services have generated, and will likelycontinue to generate, substantial amounts of deferredrevenue for both book and tax purposes. This situationhas produced taxable losses for the past two fiscal years
and a more-likely-than-not presumption that insufficienttaxable income will be available to realize the fiscal2011 foreign tax carryforward, which expires at the endof fiscal 2021. We also recognized additional incometax expense from unrecognized tax benefits anddisallowed travel and entertainment expenses in fiscal2018. Partially offsetting these unfavorable factors weretax benefits from the Tax Cut and Jobs Act (the 2017 TaxAct), which was signed into law on December 22, 2017.The 2017 Tax Act decreased the U.S. federal statutory taxrate applicable to our net deferred tax liabilities, resultingin a $1.7 million benefit, which was partially offset by$0.5 million of reduced benefits resulting from thedecrease in the U.S. federal statutory tax rate applied toour pre-tax loss.
Our effective tax rate in fiscal 2018 was also affected by$0.5 million of previously unrecognized tax benefits thatwere partially offset by additional valuation allowancesagainst the deferred tax assets of a foreign subsidiary anddisallowed travel and entertainment expenses.
QUARTERLY RESULTS
The following tables set forth selected unaudited quarterlyconsolidated financial data for the fiscal years endedAugust 31, 2019 and 2018. The quarterly consolidatedfinancial data reflects, in the opinion of management, allnormal and recurring adjustments necessary to fairlypresent the results of operations for such periods. Resultsof any one or more quarters are not necessarily indicativeof continuing trends (in thousands, except for per-shareamounts).
YEAR ENDED AUGUST 31, 2019 (unaudited)November 30 February 28 May 31 August 31
Net sales $53,829 $50,356 $56,006 $65,165Gross profit 36,783 35,366 39,664 47,502Selling, general, and administrative 34,644 35,925 38,713 36,037Depreciation 1,554 1,697 1,556 1,558Amortization 1,238 1,300 1,259 1,179Income (loss) from operations (653) (3,556) (1,864) 8,728Income (loss) before income taxes (1,257) (3,927) (2,418) 8,194Net income (loss) (1,357) (3,517) (2,024) 5,875
Net income (loss) per share:Basic $ (.10) $ (.25) $ (.14) $ .42Diluted (.10) (.25) (.14) .41
Franklin Covey 2019 Annual Report Management’s Discussion and Analysis 84

YEAR ENDED AUGUST 31, 2018 (unaudited)November 30 February 28 May 31 August 31
Net sales $47,932 $46,547 $50,461 $64,818Gross profit 32,868 32,744 34,916 47,761Selling, general, and administrative 33,824 35,097 34,910 37,294Depreciation 901 1,379 1,267 1,615Amortization 1,395 1,395 1,326 1,251Income (loss) from operations (3,252) (5,127) (2,587) 7,601Income (loss) before income taxes (3,740) (5,765) (3,088) 7,074Net income (loss) (2,392) (2,740) (2,534) 1,779
Net income (loss) per share:Basic and diluted $ (.17) $ (.20) $ (.18) $ .13
Our fourth quarter of each fiscal year typically has highersales and operating income than other fiscal quartersprimarily due to increased revenues in our Educationpractice (when school administrators and faculty haveprofessional development days) and to increased sales thattypically occur during that quarter resulting from year-endincentive programs. Overall, training sales are moderatelyseasonal because of the timing of corporate training, whichis not typically scheduled as heavily during holiday andcertain vacation periods. Quarterly fluctuations may alsobe affected by other factors including the introductionof new offerings, business acquisitions, the addition of neworganizational customers, and the elimination ofunderperforming offerings.
For more information on our quarterly results ofoperations, refer to our quarterly reports on Form 10-Qas filed with the SEC. Our quarterly reports for the periodsindicated are available free of charge at www.sec.gov.
LIQUIDITY AND CAPITAL RESOURCESIntroduction
Our cash balance at August 31, 2019 totaled $27.7 million,with no borrowings on our $15.0 million revolvingcredit facility, compared with $10.2 million of cash atAugust 31, 2018. Our cash balance increased primarilydue our new credit facility obtained in August 2019, whichincluded a new $20.0 million term note as discussedbelow. Of our $27.7 million in cash at August 31, 2019,$10.6 million was held outside the U.S. by our foreignsubsidiaries. We routinely repatriate cash from our foreignsubsidiaries and consider cash generated from foreignactivities a key component of our overall liquidity position.Our primary sources of liquidity are cash flows from thesale of services in the normal course of business andavailable proceeds from our credit facility. Our primary
uses of liquidity include payments for operating activities,capital expenditures (including curriculum development),debt payments, contingent payments from the prioracquisition of businesses, working capital expansion, andpurchases of our common stock.
The following table summarizes our cash flows fromoperating, investing, and financing activities for the pastthree years (in thousands):
YEAR ENDEDAUGUST 31, 2019 2018 2017Total cash provided by
(used for):Operating activities $30,452 $ 16,861 $ 17,357Investing activities (6,873) (10,634) (21,675)Financing activities (5,932) (4,679) 3,134Effect of exchange
rates on cash (101) (319) (348)Increase (decrease) in
cash and cashequivalents $17,546 $ 1,229 $ (1,532)
2019 Credit Agreement
On August 7, 2019, we entered into a new credit agreement(the 2019 Credit Agreement) with our existing lender,which replaced the amended and restated creditagreement, dated March 2011 (the Original CreditAgreement). The 2019 Credit Agreement provides up to$25.0 million in term loans and a $15.0 million revolvingline of credit which expires in August 2024. Upon enteringinto the 2019 Credit Agreement, we borrowed$20.0 million through a term loan and used the proceedsto repay all indebtedness under the Original CreditAgreement. The proceeds from the 2019 CreditAgreement may be used for general corporate purposesas well as for other transactions, unless specificallyprohibited by the terms of the agreement. Surplus
85 Management’s Discussion and Analysis Franklin Covey 2019 Annual Report

proceeds from the $20.0 million term note were classifiedas cash and cash equivalents on our consolidated balancesheet at August 31, 2019. Within one year of the date of the2019 Credit Agreement, we may request an additional$5.0 million term loan. Interest on all borrowings underthe 2019 Credit Agreement is equal to LIBOR plus1.85 percent, which pricing matches the Original CreditAgreement.
The 2019 Credit Agreement preserves existing debtcovenants that include (i) a funded debt to EBITDARratio of less than 3.0 to 1.0; (ii) a fixed charge coverageratio greater than 1.15 to 1.0; (iii) an annual limit on capitalexpenditures (excluding capitalized curriculumdevelopment) of $8.0 million; and (iv) consolidatedaccounts receivable of not less than 150% of the aggregateamount of the outstanding borrowings on the revolvingline of credit, the undrawn amount of outstanding lettersof credit, and the amount of unreimbursed letter ofcredit disbursements. We believe that we were incompliance with the financial covenants and other termsapplicable to the 2019 Credit Agreement at August 31,2019.
In addition to our revolving line of credit facility andterm loan obligations, we have a long-term lease on ourcorporate campus that is accounted for as a financingobligation. For further information on our operating leaseobligations, which are not currently recorded on ourconsolidated balance sheet, refer to the notes to ourconsolidated financial statements as presented in Item 8of this report on Form 10-K.
The following discussion is a description of the primaryfactors affecting our cash flows and their effects upon ourliquidity and capital resources during the fiscal yearended August 31, 2019.
Cash Flows from Operating Activities
Our primary source of cash from operating activities wasthe sale of services and products to our customers inthe normal course of business. The primary uses of cashfor operating activities were payments for selling, general,and administrative expenses, payments for direct costsnecessary to conduct training programs, payments tosuppliers for materials used in training manuals sold, andto fund working capital needs. For the fiscal year endedAugust 31, 2019, our cash provided by operating activitiesincreased 81 percent to $30.5 million compared with$16.9 million for the fiscal year ended August 31, 2018.The increase was primarily due to improved operatingresults during the year and from cash used to support
changes in working capital balances. Our collection ofaccounts receivable remained strong during fiscal 2019and provided a significant amount of cash to supportoperations, pay our obligations, and make criticalinvestments. Although we are required to defer AAP andother subscription revenues over the lives of the underlyingcontracts, we invoice the entire contract amount andcollect the associated receivable at the inception of theagreement.
Cash Flows from Investing Activities and CapitalExpenditures
Our cash used for investing activities during the fiscalyear ended August 31, 2019 totaled $6.9 million. Theprimary uses of cash for investing activities includedpurchases of property and equipment in the normal courseof business and additional investments in our offerings.
Our fiscal 2019 purchases of property and equipment,which totaled $4.2 million, consisted primarily ofcomputer software, hardware, and leaseholdimprovements on our corporate campus. We currentlyanticipate that our purchases of property and equipmentwill total approximately $5.8 million in fiscal 2020.
We spent $2.7 million during fiscal 2019 on thedevelopment of various offerings. We believe continuedinvestment in our offerings is critical to our future successand anticipate that our capital spending for curriculumdevelopment will total $5.0 million during fiscal 2020.
During the first quarter of fiscal 2018, we paid $1.1 millionto the former owners of Jhana Education for contingentconsideration related to this acquisition. Due to the closeproximity of this payment to the acquisition date, weclassified the $1.1 million as a component of investingactivities in our consolidated statement of cash flows.Other contingent consideration payments from thisacquisition are classified as components of financingactivities in our consolidated statements of cash flows.
Cash Flows from Financing Activities
During the fiscal year ended August 31, 2019, we used$5.9 million of net cash for financing activities. Ourprimary uses of financing cash during fiscal 2019 included$14.9 million of cash used for principal payments on theterm loans from our Original Credit Agreement andthe financing obligation on our corporate campus;$11.3 million used to reduce the balance on our revolvingline of credit obligation, which had a zero balance prior
Franklin Covey 2019 Annual Report Management’s Discussion and Analysis 86

to completing the 2019 Credit Agreement; and $0.7 millionof cash paid to the former owners of Jhana Educationfor contingent acquisition consideration. These uses offinancing cash were partially offset by $20.0 millionof proceeds from a term loan on our 2019 CreditAgreement and $1.0 million of cash received fromparticipants in our employee stock purchase programto acquire shares of our common stock.
During fiscal 2017, we completed the acquisitions of RGPand Jhana as previously described. Each of theseacquisitions have contingent consideration that may beearned by their former owners based on specifiedperformance criteria. As the operations of theseacquisitions reach the specified milestones for requiredcontingent payments, our uses of cash for financingactivities may increase.
On January 23, 2015, our Board of Directors approved anew plan to repurchase up to $10.0 million of theCompany’s outstanding common stock. All previouslyexisting common stock repurchase plans were canceledand the new common share repurchase plan does not havean expiration date. On March 27, 2015, our Board ofDirectors increased the aggregate value of shares ofCompany common stock that may be purchased underthe January 2015 plan to $40.0 million so long as we haveeither $10.0 million in cash and cash equivalents orhave access to debt financing of at least $10.0 million.Under the terms of this expanded common stockrepurchase plan, we have purchased 1,539,828 shares ofour common stock for $26.8 million through August 31,2019. Our cash used for financing activities will increaseas we make purchases of shares under the terms of thisplan or other share purchase plans in the future.
Sources of Liquidity
We expect to meet our projected capital expenditures,repay amounts borrowed on our 2019 Credit Agreement,service our existing financing obligation, and meetother working capital requirements during fiscal 2020from current cash balances, future cash flows fromoperating activities, and available borrowings from ourrecently completed 2019 Credit Agreement. Goingforward, we will continue to incur costs necessary for theday-to-day operation and potential growth of the businessand may use our available revolving line of credit and otherfinancing alternatives, if necessary, for these expenditures.Our 2019 Credit Agreement expires in August 2024and we expect to renew and amend the 2019 CreditAgreement on a regular basis to maintain the long-term
borrowing capacity of this credit facility. At August 31,2019, we had $19.9 million of available borrowing capacityon our 2019 Credit Agreement, which consisted of$14.9 million of credit on our revolving credit facility(amount reduced by $0.1 million of open standby lettersof credit) and an additional $5.0 million term loan.Additional potential sources of liquidity available to usinclude factoring receivables, issuance of additional equity,or issuance of debt from public or private sources. Ifnecessary, we will evaluate all of these options and selectone or more of them depending on overall capital needsand the associated cost of capital.
We believe that our existing cash and cash equivalents,cash generated by operating activities, and availability ofexternal funds as described above, will be sufficient for usto maintain our operations on both a short- and long-termbasis. However, our ability to maintain adequate capitalfor our operations in the future is dependent upon anumber of factors, including sales trends, macroeconomicactivity, our ability to contain costs, levels of capitalexpenditures, collection of accounts receivable, and otherfactors. Some of the factors that influence our operationsare not within our control, such as general economicconditions and the introduction of new offerings ortechnology by our competitors. We will continue tomonitor our liquidity position and may pursue additionalfinancing alternatives, as described above, to maintainsufficient resources for future growth and capitalrequirements. However, there can be no assurance suchfinancing alternatives will be available to us on acceptableterms, or at all.
Contractual Obligations
We have not structured any special purpose entities, orparticipated in any commodity trading activities, whichwould expose us to potential undisclosed liabilitiesor create adverse consequences to our liquidity. Requiredcontractual payments primarily consist of lease paymentsresulting from the sale of our corporate campus (financingobligation); repayment of term loan obligations; expectedcontingent consideration payments from businessacquisitions; short-term purchase obligations for inventoryitems and other products and services used in theordinary course of business; minimum operating leasepayments; and minimum payments for outsourcedwarehousing and distribution service charges. AtAugust 31, 2019, our expected payments on theseobligations over the next five fiscal years and thereafterare as follows (in thousands):
87 Management’s Discussion and Analysis Franklin Covey 2019 Annual Report

Contractual ObligationsFiscal2020
Fiscal2021
Fiscal2022
Fiscal2023
Fiscal2024 Thereafter Total
Required lease payments on corporate campus $ 3,724 $ 3,798 $ 3,874 $3,952 $4,031 $3,301 $22,680Term loan payable to bank(1) 5,653 5,504 5,299 5,094 — — 21,550Purchase obligations 4,510 — — — — — 4,510Jhana contingent consideration payments(2) 888 1,076 1,282 588 — — 3,834Minimum operating lease payments 752 472 112 97 79 92 1,604RGP contingent consideration payments(2) 1,000 500 — — — — 1,500Minimum required payments for warehousing
services(3) 195 — — — — — 195Total expected contractual obligation payments $16,722 $11,350 $10,567 $9,731 $4,110 $3,393 $55,873
(1) Payment amounts shown include interest at 4.1 percent, which is the current rate on our term loan obligation under the 2019 Credit Agreement.(2) The payment of contingent consideration resulting from prior business acquisitions is based on current estimates and projections. We reassess
the fair value of estimated contingent consideration payments each quarter based on information available. The actual payment of contingentconsideration amounts may differ in amount and timing from those shown in the table.
(3) The warehousing services contract expires in June 2020.
Our contractual obligations presented above excludeuncertain tax positions totaling $1.9 million for which wecannot make a reasonably reliable estimate of the amountand period of payment. For further information regardingour uncertain tax positions, refer to the notes to ourconsolidated financial statements as presented in Part II,Item 8 of this report on Form 10-K.
USE OF ESTIMATES AND CRITICAL ACCOUNTINGPOLICIESOur consolidated financial statements were prepared inaccordance with accounting principles generally acceptedin the United States of America. The significant accountingpolicies that we used to prepare our consolidated financialstatements are outlined primarily in Note 1 and in Note 2(new revenue recognition guidance) to the consolidatedfinancial statements, which are presented in Part II, Item 8of this Annual Report on Form 10-K. Some of thoseaccounting policies require us to make assumptions anduse judgments that may affect the amounts reported in ourconsolidated financial statements. Management regularlyevaluates its estimates and assumptions and bases thoseestimates and assumptions on historical experience,factors that are believed to be reasonable under thecircumstances, and requirements under accountingprinciples generally accepted in the United States ofAmerica. Actual results may differ from these estimatesunder different assumptions or conditions, includingchanges in economic and political conditions and othercircumstances that are not in our control, but which mayhave an impact on these estimates and our actual financialresults.
The following items require the most significant judgmentand often involve complex estimates:
Revenue Recognition
We adopted ASC Topic 606 on September 1, 2018. Forthe AAP, judgment is required to determine whether theintellectual property and web-based functionality andcontent are considered distinct and accounted forseparately, or not distinct and accounted for together.
We have determined to account for the AAP as a singleperformance obligation and recognize the associatedtransaction price ratably over the term of the underlyingcontract beginning on the commencement date of eachcontract, which is the date the Company’s platforms andresources are made available to the customer. Thisdetermination was reached after considering that ourweb-based functionality and content, in combination withour intellectual property, each represent inputs thattransform into a combined output that represents theintended outcome of the AAP, which is to provide acontinuously accessible, customized, and dynamic learningand development solution only accessible through theAAP platform.
Judgment is required to determine the stand-aloneselling price (SSP) for each distinct performanceobligation. Where we have more than onedistinct performance obligation, we must allocate thetransaction price to each performance obligation basedon its relative SSP. The SSP is the price which we would sella promised product or service separately to a customer.In determining the SSP, we consider the size and volumeof transactions, price lists, historical sales, and contractprices. We may modify our pricing from time-to-time inthe future, which could result in changes to the SSP.
Franklin Covey 2019 Annual Report Management’s Discussion and Analysis 88

Stock-Based Compensation
Our shareholders have approved performance-basedlong-term incentive plans (LTIPs) that provide for grantsof stock-based performance awards to certain managerialpersonnel and executive management as directed bythe Organization and Compensation Committee of theBoard of Directors. The number of common shares thatare vested and issued to LTIP participants is variable and isbased upon the achievement of specified performanceobjectives during defined performance periods. Due to thevariable number of common shares that may be issuedunder the LTIP, we reevaluate our LTIP grants on aquarterly basis and adjust the expected vesting dates andnumber of shares expected to be awarded based uponactual and estimated financial results of the Companycompared with the performance goals set for the award.Adjustments to the number of shares awarded, and to thecorresponding compensation expense, are made on acumulative basis at the adjustment date based upon theestimated probable number of common shares to beawarded.
The analysis of our LTIP awards contains uncertaintiesbecause we are required to make assumptions andjudgments about the timing and eventual number ofshares that will vest in each LTIP grant. The assumptionsand judgments that are essential to the analysis includeforecasted sales and operating income levels duringthe LTIP service periods. These forecasted amounts maybe difficult to predict over the life of the LTIP awardsdue to changes in our business, such as from theintroduction of subscription-based services and theirimpact on our financial results. These business changesmay also leave some previously approved performancemeasures obsolete or unattainable. The evaluation of LTIPperformance awards and the corresponding use ofestimated amounts may produce additional volatility inour consolidated financial statements as we recordcumulative adjustments to the estimated service periodsand number of common shares to be awarded underthe LTIP grants as described above.
Accounts Receivable Valuation
Trade accounts receivable are recorded at the invoicedamount and do not bear interest. Our allowance fordoubtful accounts calculations contain uncertaintiesbecause the calculations require us to make assumptionsand judgments regarding the collectability of customeraccounts, which may be influenced by a number of factorsthat are not within our control, such as the financial
health of each customer. We regularly review thecollectability assumptions of our allowance for doubtfulaccounts calculation and compare them against historicalcollections. Adjustments to the assumptions may eitherincrease or decrease our total allowance for doubtfulaccounts and may adversely impact our financial results.For example, a 10 percent increase to our allowance fordoubtful accounts at August 31, 2019 would decrease ourreported income from operations by approximately$0.4 million.
For further information regarding the calculation of ourallowance for doubtful accounts, refer to the notes to ourfinancial statements as presented in Item 8 of this reporton Form 10-K.
Valuation of Indefinite-Lived Intangible Assets andGoodwill
Intangible assets that are deemed to have an indefinitelife and goodwill balances are not amortized, but ratherare tested for impairment on an annual basis, or moreoften if events or circumstances indicate that a potentialimpairment exists. The Covey trade name intangible assetoriginated from the merger with the Covey LeadershipCenter in 1997 and has been deemed to have an indefinitelife. This intangible asset is quantitatively tested forimpairment using the present value of estimated royaltieson trade name related revenues, which consist primarilyof training seminars, and related products, andinternational licensee royalties.
Goodwill is recorded when the purchase price for anacquisition exceeds the estimated fair value of the nettangible and identified intangible assets acquired. Undercurrent accounting guidance, an annual or interimgoodwill impairment test is performed by comparing thefair value of a reporting unit with its carrying amount,and an impairment charge is recognized for the amountby which the carrying amount exceeds the reporting unit’sfair value.
We tested goodwill for impairment at August 31, 2019 atthe reporting unit level using a quantitative approach.The estimated fair value of each reporting unit wascalculated using a combination of the income approach(discounted cash flows) and the market approach (usingmarket multiples derived from a set of companies withcomparable market characteristics). The estimated fairvalues of the reporting units from these approaches wereweighted in the determination of the total fair value.
On an interim basis, we consider whether events orcircumstances are present that may lead to the
89 Management’s Discussion and Analysis Franklin Covey 2019 Annual Report

determination that goodwill may be impaired. Thesecircumstances include, but are not limited to, thefollowing:
• significant underperformance relative to historical orprojected future operating results;
• significant change in the manner of our use of acquiredassets or the strategy for the overall business;
• significant change in prevailing interest rates;
• significant negative industry or economic trend;
• significant change in market capitalization relative tobook value; and/or
• significant negative change in market multiples of thecomparable company set.
If, based on events or changing circumstances, wedetermine it is more likely than not that the fair value of areporting unit does not exceed its carrying value, wewould be required to test goodwill for impairment.
Determining the fair value of a reporting unit is judgmentalin nature and involves the use of significant estimatesand assumptions. These estimates and assumptionsinclude revenue growth rates and operating margins usedto calculate projected future cash flows, risk-adjusteddiscount rates, future economic and market conditions,and determination of appropriate market comparables.We base our fair value estimates on assumptions webelieve to be reasonable, but that are unpredictable andinherently uncertain. Actual future results may differ fromthose estimates. In addition, we make certain judgmentsand assumptions in allocating shared assets and liabilitiesto determine the carrying values for each of ourreporting units. The timing and frequency of our goodwillimpairment tests are based on an ongoing assessment ofevents and circumstances that would indicate a possibleimpairment. Based on the results of our goodwillimpairment testing during fiscal 2019, we determinedthat no impairment existed at August 31, 2019, as eachreportable operating segment’s estimated fair valueexceeded its carrying value. We will continue to monitorour goodwill and intangible assets for impairment andconduct formal tests when impairment indicators arepresent.
Acquisitions and Contingent Consideration Liabilities
We record acquisitions resulting in the consolidation ofan enterprise using the purchase method of accounting.Under this method, the acquiring company records
the assets acquired, including intangible assets that canbe identified and named, and liabilities assumed based ontheir estimated fair values at the date of acquisition. Thepurchase price in excess of the fair value of the assetsacquired and liabilities assumed is recorded as goodwill.If the assets acquired, net of liabilities assumed, are greaterthan the purchase price paid, then a bargain purchasehas occurred and the company will recognize the gainimmediately in earnings. Among other sources of relevantinformation, we use independent appraisals or othervaluations to assist in determining the estimated fairvalues of the assets and liabilities. Various assumptionsare used in the determination of these estimated fair valuesincluding discount rates, market and volume growthrates, product or service selling prices, cost structures,royalty rates, and other prospective financial information.
Additionally, we are required to reassess the fair value ofcontingent consideration liabilities resulting from businessacquisitions at each reporting period. Althoughsubsequent changes to the contingent considerationliabilities do not affect the goodwill generated from theacquisition transaction, the valuation of expectedcontingent consideration often requires us to estimatefuture sales and profitability. These estimates require theuse of numerous assumptions, many of which maychange frequently and lead to increased or decreasedoperating income in future periods. For instance, duringfiscal 2019 we recorded $1.3 million of increases to the fairvalue of the contingent consideration liabilities from ourprevious business acquisitions, which resulted in acorresponding increase in selling, general, andadministrative expenses.
Impairment of Long-Lived Assets
Long-lived tangible assets and finite-lived intangibleassets are reviewed for possible impairment wheneverevents or changes in circumstances indicate that thecarrying amount of such assets may not be recoverable.We use an estimate of undiscounted future net cash flowsof the assets over their remaining useful lives indetermining whether the carrying value of the assets isrecoverable. If the carrying values of the assets exceed theanticipated future cash flows of the assets, we calculatean impairment loss. The impairment loss calculationcompares the carrying value of the asset to the asset’sestimated fair value, which may be based upon discountedcash flows over the estimated remaining useful life ofthe asset. If we recognize an impairment loss, the adjustedcarrying amount of the asset becomes its new cost basis,which is then depreciated or amortized over the remaining
Franklin Covey 2019 Annual Report Management’s Discussion and Analysis 90

useful life of the asset. Impairment of long-lived assets isassessed at the lowest levels for which there are identifiablecash flows that are independent from other groups ofassets.
Our impairment evaluation calculations containuncertainties because they require us to makeassumptions and apply judgment in order to estimatefuture cash flows, forecast the useful lives of the assets,and select a discount rate that reflects the risk inherent infuture cash flows. Although we have not made anymaterial recent changes to our long-lived assetsimpairment assessment methodology, if forecasts andassumptions used to support the carrying value of ourlong-lived tangible and finite-lived intangible assetschange in the future, significant impairment charges couldresult that would adversely affect our results of operationsand financial condition.
Income Taxes
We regularly evaluate our United States federal andvarious state and foreign jurisdiction income taxexposures. We account for certain aspects of our incometax provision using the provisions of ASC 740-10-05,which addresses the determination of whether tax benefitsclaimed or expected to be claimed on a tax return shouldbe recorded in the financial statements. We may recognizethe tax benefit from an uncertain tax position only if itis more likely than not that the tax position will besustained upon examination by the taxing authorities,based on the technical merits of the position. The taxbenefits recognized in the financial statements from sucha position are measured based on the largest benefitthat has a greater than 50 percent likelihood of beingrealized upon final settlement. The provisions of ASC740-10-05 also provide guidance on de-recognition,classification, interest, and penalties on income taxes,accounting for income taxes in interim periods, andrequire increased disclosure of various income tax items.Taxes and penalties are components of our overallincome tax provision.
We record previously unrecognized tax benefits in thefinancial statements when it becomes more likely than not(greater than a 50 percent likelihood) that the tax positionwill be sustained. To assess the probability of sustaininga tax position, we consider all available evidence. In manyinstances, sufficient positive evidence may not be availableuntil the expiration of the statute of limitations foraudits by taxing jurisdictions, at which time the entirebenefit will be recognized as a discrete item in theapplicable period.
Our unrecognized tax benefits result from uncertain taxpositions about which we are required to makeassumptions and apply judgment to estimate the exposuresassociated with our various tax filing positions. Thecalculation of our income tax provision or benefit, asapplicable, requires estimates of future taxable income orlosses. During the course of the fiscal year, these estimatesare compared to actual financial results and adjustmentsmay be made to our tax provision or benefit to reflect theserevised estimates. Our effective income tax rate is alsoaffected by changes in tax law and the results of tax auditsby various jurisdictions. Although we believe that ourjudgments and estimates discussed herein are reasonable,actual results could differ, and we could be exposed tolosses or gains that could be material.
We establish valuation allowances for deferred tax assetswhen we estimate it is more likely than not that the taxassets will not be realized. The determination of whethervaluation allowances are needed on our deferred incometax assets contains uncertainties because we must projectfuture income, including the use of tax-planning strategies,by individual tax jurisdictions. Changes in industry andeconomic conditions and the competitive environmentmay impact the accuracy of our projections. We regularlyassess the likelihood that our deferred tax assets will berealized and determine if adjustments to our valuationallowance are necessary.
RECENT ACCOUNTING PRONOUNCEMENTS
See Note 1 to the consolidated financial statements forinformation on recent accounting pronouncements.
REGULATORY COMPLIANCE
We are registered in states in which we do business thathave a sales tax and we collect and remit sales or use tax onsales made in these jurisdictions. Compliance withenvironmental laws and regulations has not had a materialeffect on our operations.
INFLATION AND CHANGING PRICES
Inflation has not had a material effect on our operations.However, future inflation may have an impact on theprice of materials used in the production of trainingproducts and related accessories, including paper andrelated raw materials. We may not be able to pass on suchincreased costs to our customers.
91 Management’s Discussion and Analysis Franklin Covey 2019 Annual Report

SAFE HARBOR STATEMENT UNDER THE PRIVATESECURITIES LITIGATION REFORM ACT OF 1995
Certain written and oral statements made by us in thisreport are “forward-looking statements” within themeaning of the Private Securities Litigation Reform Actof 1995 and Section 21E of the Securities Exchange Act of1934 as amended (the Exchange Act). Forward-lookingstatements include, without limitation, any statement thatmay predict, forecast, indicate, or imply future results,performance, or achievements, and may contain wordssuch as “believe,” “anticipate,” “expect,” “estimate,” “project,”or words or phrases of similar meaning. In our reportsand filings we may make forward-looking statementsregarding our expectations about future reported revenuesand operating results, future sales growth, the expectedintroduction of new or refreshed offerings, includingadditions to the All Access Pass, future training andconsulting sales activity, the impact of multi-year contractsfor the All Access Pass, renewal of existing contracts,the release and success of new publications, the expectedgrowth of our business in various markets, anticipatedexpenses, the adequacy of existing capital resources,projected cost reduction and strategic initiatives, expectedlevels of depreciation and amortization expense,expectations regarding tangible and intangible assetvaluations, the seasonality of future sales, the seasonalfluctuations in cash used for and provided by operatingactivities, future compliance with the terms and conditionsof our 2019 Credit Agreement, the ability to borrow on,and renew, our 2019 Credit Agreement, expectationsregarding income tax expenses as well as tax assets andcredits and the amount of cash expected to be paidfor income taxes, estimated capital expenditures, andcash flow estimates used to determine the fair value oflong-lived assets. These, and other forward-lookingstatements, are subject to certain risks and uncertaintiesthat may cause actual results to differ materially from theforward-looking statements. These risks and uncertaintiesare disclosed from time to time in reports filed by uswith the SEC, including reports on Forms 8-K, 10-Q, and10-K. Such risks and uncertainties include, but are notlimited to, the matters discussed in Item 1A of this annualreport on Form 10-K for the fiscal year ended August 31,2019, entitled “Risk Factors.” In addition, such risksand uncertainties may include unanticipated developmentsin any one or more of the following areas: unanticipatedcosts or capital expenditures; delays or unanticipatedoutcomes relating to our strategic plans; dependence onexisting products or services; the rate and consumeracceptance of new product introductions, including the
new AAP portal; foreign currency exchange rates;competition; the number and nature of customers andtheir product orders, including changes in the timing ormix of product or training orders; pricing of our productsand services and those of competitors; adverse publicity;adverse effects on certain licensee’s performance dueto civil unrest in some of the countries where our licenseesoperate; and other factors which may adversely affectour business.
The risks included here are not exhaustive. Other sectionsof this report may include additional factors that couldadversely affect our business and financial performance.Moreover, we operate in a very competitive and rapidlychanging environment. New risk factors may emerge andit is not possible for our management to predict all suchrisk factors, nor can we assess the impact of all suchrisk factors on our business or the extent to which anysingle factor, or combination of factors, may cause actualresults to differ materially from those contained inforward-looking statements. Given these risks anduncertainties, investors should not rely on forward-looking statements as a prediction of actual results.
The market price of our common stock has been andmay remain volatile. In addition, the stock marketsin general have experienced increased volatility. Factorssuch as quarter-to-quarter variations in revenues andearnings or losses and our failure to meet expectationscould have a significant impact on the market price of ourcommon stock. In addition, the price of our commonstock can change for reasons unrelated to ourperformance. Due to our relatively low marketcapitalization, the price of our common stock may alsobe affected by conditions such as a lack of analyst coverageand fewer potential investors.
Forward-looking statements are based on management’sexpectations as of the date made, and the Companydoes not undertake any responsibility to update any ofthese statements in the future except as required by law.Actual future performance and results will differ and maydiffer materially from that contained in or suggested byforward-looking statements as a result of the factorsset forth in this Management’s Discussion and Analysisof Financial Condition and Results of Operations andelsewhere in our filings with the SEC.
ITEM 7A. QUANTITATIVE AND QUALITATIVEDISCLOSURES ABOUT MARKET RISKMarket Risk of Financial InstrumentsWe are exposed to financial instrument market riskprimarily through fluctuations in foreign currency
Franklin Covey 2019 Annual Report Quantitative and Qualitative Disclosures About Market Risk 92

exchange rates and interest rates. To manage risksassociated with foreign currency exchange and interestrates, we may make limited use of derivative financialinstruments. Derivatives are financial instruments thatderive their value from one or more underlying financialinstruments. As a matter of policy, our derivativeinstruments are entered into for periods consistent withthe related underlying exposures and do not constitutepositions that are independent of those exposures. Inaddition, we do not enter into derivative contracts fortrading or speculative purposes, nor are we party to anyleveraged derivative instrument. However, during thefiscal years ended August 31, 2019, 2018, and 2017, wewere not party to any foreign exchange contracts, interestrate swap agreements, or similar derivative instruments.
Foreign Exchange Sensitivity
Due to the global nature of our operations, we are subjectto risks associated with transactions that are denominatedin currencies other than the United States dollar, as well asthe effects of translating amounts denominated in foreigncurrencies to United States dollars as a normal part ofthe reporting process. The objective of our foreigncurrency risk management activities is to reduce foreigncurrency risk in the consolidated financial statements. Inorder to manage foreign currency risks, we may make
limited use of foreign currency forward contracts andother foreign currency related derivative instruments.
Interest Rate Sensitivity
Our long-term liabilities primarily consist of term loanspayable obtained from the lender on our 2019 CreditAgreement, a long-term lease agreement (financingobligation) associated with the previous sale of ourcorporate headquarters, amounts borrowed on ourrevolving credit facility, deferred income taxes, andcontingent consideration payments resulting from ourbusiness acquisitions. Our overall interest rate sensitivityis primarily influenced by any amounts borrowed onterm loans or on our revolving line of credit facility, andthe prevailing interest rate on these instruments. Theeffective interest rate on the term loans and our revolvingline of credit facility was 4.1 percent at August 31, 2019,and we may incur additional expense if interest ratesincrease in future periods. For example, a one percentincrease in the interest rate on our term loans payable atAugust 31, 2019 would result in approximately $0.2 millionof additional interest expense in fiscal 2020. We did nothave borrowings on our revolving credit facility atAugust 31, 2019. Our financing obligation has a paymentstructure equivalent to a long-term leasing arrangementwith a fixed interest rate of 7.7 percent.
93 Quantitative and Qualitative Disclosures About Market Risk Franklin Covey 2019 Annual Report

ITEM 8. FINANCIAL STATEMENTS ANDSUPPLEMENTARY DATA
Report of Independent Registered PublicAccounting Firm
To the shareholders and the Board of Directors of FranklinCovey Co.
Opinion on Internal Control over Financial Reporting
We have audited the internal control over financialreporting of Franklin Covey Co. and subsidiaries (the“Company”) as of August 31, 2019, based on criteriaestablished in Internal Control – Integrated Framework(2013) issued by the Committee of SponsoringOrganizations of the Treadway Commission (COSO). Inour opinion, the Company maintained, in all materialrespects, effective internal control over financial reportingas of August 31, 2019, based on criteria established inInternal Control – Integrated Framework (2013) issued byCOSO.
We have also audited, in accordance with the standardsof the Public Company Accounting Oversight Board(United States) (PCAOB), the consolidated financialstatements as of and for the year ended August 31, 2019,of the Company and our report dated November 14, 2019,expressed an unqualified opinion on those financialstatements and included an explanatory paragraph relatedto the Company’s change in method of accounting forrevenue from contracts with customers in fiscal year 2019due to the adoption of Accounting Standards UpdateNo. 2014-09, Revenue from Contracts with Customers.
Basis for Opinion
The Company’s management is responsible formaintaining effective internal control over financialreporting and for its assessment of the effectiveness ofinternal control over financial reporting, included in theaccompanying Management’s Report on Internal Controlover Financial Reporting. Our responsibility is to expressan opinion on the Company’s internal control overfinancial reporting based on our audit. We are a publicaccounting firm registered with the PCAOB and arerequired to be independent with respect to the Companyin accordance with the U.S. federal securities laws andthe applicable rules and regulations of the Securities andExchange Commission and the PCAOB.
We conducted our audit in accordance with the standardsof the PCAOB. Those standards require that we planand perform the audit to obtain reasonable assuranceabout whether effective internal control over financialreporting was maintained in all material respects. Ouraudit included obtaining an understanding of internalcontrol over financial reporting, assessing the risk that amaterial weakness exists, testing and evaluating the designand operating effectiveness of internal control based onthe assessed risk, and performing such other proceduresas we considered necessary in the circumstances. Webelieve that our audit provides a reasonable basis for ouropinion.
Definition and Limitations of Internal Control over FinancialReporting
A company’s internal control over financial reporting is aprocess designed to provide reasonable assuranceregarding the reliability of financial reporting and thepreparation of financial statements for external purposesin accordance with generally accepted accountingprinciples. A company’s internal control over financialreporting includes those policies and procedures that(1) pertain to the maintenance of records that, inreasonable detail, accurately and fairly reflect thetransactions and dispositions of the assets of the company;(2) provide reasonable assurance that transactions arerecorded as necessary to permit preparation of financialstatements in accordance with generally acceptedaccounting principles, and that receipts and expendituresof the company are being made only in accordance withauthorizations of management and directors of thecompany; and (3) provide reasonable assurance regardingprevention or timely detection of unauthorizedacquisition, use, or disposition of the company’s assetsthat could have a material effect on the financialstatements.
Because of its inherent limitations, internal control overfinancial reporting may not prevent or detectmisstatements. Also, projections of any evaluation ofeffectiveness to future periods are subject to the risk thatcontrols may become inadequate because of changes inconditions, or that the degree of compliance with thepolicies or procedures may deteriorate.
Salt Lake City, UtahNovember 14, 2019
Franklin Covey 2019 Annual Report Auditor’s Opinion on Internal Control 94
Report of Independent Registered PublicAccounting Firm
To the shareholders and the Board of Directors of FranklinCovey Co.
Opinion on the Financial Statements
We have audited the accompanying consolidated balancesheets of Franklin Covey Co. and subsidiaries (the“Company”) as of August 31, 2019 and 2018, the relatedconsolidated statements of operations and comprehensiveloss, shareholders’ equity, and cash flows for each of thethree years in the period ended August 31, 2019, and therelated notes (collectively referred to as the “financialstatements”). In our opinion, the financial statementspresent fairly, in all material respects, the financial positionof the Company as of August 31, 2019 and 2018, and theresults of its operations and its cash flows for each of thethree years in the period ended August 31, 2019, inconformity with accounting principles generally acceptedin the United States of America.
We have also audited, in accordance with the standardsof the Public Company Accounting Oversight Board(United States) (PCAOB), the Company’s internal controlover financial reporting as of August 31, 2019, based oncriteria established in Internal Control – IntegratedFramework (2013) issued by the Committee of SponsoringOrganizations of the Treadway Commission and ourreport dated November 14, 2019, expressed an unqualifiedopinion on the Company’s internal control over financialreporting.
Change in Accounting Principle
As discussed in Note 1 to the financial statements, theCompany changed its method of accounting for revenuefrom contracts with customers in fiscal year 2019 due
to the adoption of Accounting Standards Update No.2014-09, Revenue from Contracts with Customers, usingthe modified retrospective approach.
Basis for Opinion
These financial statements are the responsibility of theCompany’s management. Our responsibility is to expressan opinion on the Company’s financial statements basedon our audits. We are a public accounting firm registeredwith the PCAOB and are required to be independentwith respect to the Company in accordance with the U.S.federal securities laws and the applicable rules andregulations of the Securities and Exchange Commissionand the PCAOB.
We conducted our audits in accordance with the standardsof the PCAOB. Those standards require that we planand perform the audit to obtain reasonable assuranceabout whether the financial statements are free of materialmisstatement, whether due to error or fraud. Our auditsincluded performing procedures to assess the risks ofmaterial misstatement of the financial statements, whetherdue to error or fraud, and performing procedures thatrespond to those risks. Such procedures includedexamining, on a test basis, evidence regarding the amountsand disclosures in the financial statements. Our auditsalso included evaluating the accounting principles usedand significant estimates made by management, as well asevaluating the overall presentation of the financialstatements. We believe that our audits provide a reasonablebasis for our opinion.
Salt Lake City, UtahNovember 14, 2019
We have served as the Company’s auditor since 2016.
95 Auditor’s Opinion Franklin Covey 2019 Annual Report

FRANKLIN COVEY CO.CONSOLIDATED BALANCE SHEETS
AUGUST 31, 2019 2018In thousands, except per-share data
AssetsCurrent assets:
Cash and cash equivalents $ 27,699 $ 10,153Accounts receivable, less allowance for doubtful accounts of $4,242 and $3,555 73,227 71,914Inventories 3,481 3,160Income taxes receivable — 179Prepaid expenses 3,906 3,864Other current assets 11,027 10,893
Total current assets 119,340 100,163
Property and equipment, net 18,579 21,401Intangible assets, net 47,690 51,934Goodwill 24,220 24,220Deferred income tax assets 5,045 3,222Other long-term assets 10,039 12,935
$224,913 $213,875
Liabilities And Shareholders’ EquityCurrent liabilities:
Current portion of term notes payable $ 5,000 $ 10,313Current portion of financing obligation 2,335 2,092Accounts payable 9,668 9,790Income taxes payable 764 —Deferred subscription revenue 56,250 47,417Other deferred revenue 5,972 4,471Accrued liabilities 23,555 20,761
Total current liabilities 103,544 94,844
Line of credit — 11,337Term notes payable, less current portion 15,000 2,500Financing obligation, less current portion 16,648 18,983Other liabilities 7,527 5,501Deferred income tax liabilities 180 210
Total liabilities 142,899 133,375
Commitments and contingencies (Notes 6, 8 and 9)
Shareholders’ equity:Common stock, $.05 par value; 40,000 shares authorized, 27,056 shares issued 1,353 1,353Additional paid-in capital 215,964 211,280Retained earnings 59,403 63,569Accumulated other comprehensive income 269 341Treasury stock at cost, 13,087 shares and 13,159 shares (194,975) (196,043)
Total shareholders’ equity 82,014 80,500$224,913 $213,875
Franklin Covey 2019 Annual Report Balance Sheets 96
See accompanying notes to consolidated financial statements.

FRANKLIN COVEY CO.CONSOLIDATED STATEMENTS OF OPERATIONS AND COMPREHENSIVE LOSS
YEAR ENDED AUGUST 31, 2019 2018 2017In thousands, except per-share amountsNet sales $225,356 $209,758 $185,256Cost of sales 66,042 61,469 62,589Gross profit 159,314 148,289 122,667
Selling, general, and administrative 145,319 141,126 121,148Contract termination costs — — 1,500Restructuring costs — — 1,482Depreciation 6,364 5,161 3,879Amortization 4,976 5,368 3,538
Income (loss) from operations 2,655 (3,366) (8,880)
Interest income 37 104 223Interest expense (2,358) (2,676) (2,408)Discount accretion on related-party receivables 258 418 156
Income (loss) before income taxes 592 (5,520) (10,909)Benefit (provision) for income taxes (1,615) (367) 3,737
Net loss $ (1,023) $ (5,887) $ (7,172)
Net loss per share:Basic and diluted $ (0.07) $ (0.43) $ (0.52)
Weighted average number of common shares:Basic and diluted 13,948 13,849 13,819
COMPREHENSIVE LOSS:Net loss $ (1,023) $ (5,887) $ (7,172)Foreign currency translation adjustments, net of income tax benefit
(provision) of $(5), $(75), and $37 (72) (326) (555)Comprehensive loss $ (1,095) $ (6,213) $ (7,727)
97 Statements of Operations and Comprehensive Loss Franklin Covey 2019 Annual Report
See accompanying notes to consolidated financial statements.

FRANKLIN COVEY CO.CONSOLIDATED STATEMENTS OF CASH FLOWS
YEAR ENDED AUGUST 31, 2019 2018 2017In thousands
Cash Flows From Operating ActivitiesNet loss $ (1,023) $ (5,887) $ (7,172)Adjustments to reconcile net loss to net cash provided by operating
activities:Depreciation and amortization 11,359 10,525 7,443Amortization of capitalized curriculum development costs 4,954 5,280 3,745Deferred income taxes (1,051) (2,535) (5,594)Stock-based compensation expense 4,789 2,846 3,658Excess tax benefit from stock-based compensation — — (168)Increase (decrease) in contingent consideration liabilities 1,334 1,014 (1,936)Changes in assets and liabilities, net of effect of acquired businesses:
Decrease (increase) in accounts receivable, net (1,770) (5,679) 164Decrease (increase) in inventories (260) 157 1,583Decrease in receivable from related party 535 213 1,421Decrease (increase) in prepaid expenses and other assets 32 (1,335) (4,861)Increase in accounts payable and accrued liabilities 2,932 1,746 676Increase in deferred revenue 8,828 11,613 19,142Increase (decrease) in income taxes payable/receivable 889 109 (249)Decrease in other liabilities (1,096) (1,206) (495)
Net cash provided by operating activities 30,452 16,861 17,357
Cash Flows From Investing ActivitiesPurchases of property and equipment (4,153) (6,528) (7,187)Capitalized curriculum development costs (2,688) (2,998) (6,466)Acquisition of businesses, net of cash acquired (32) (1,108) (7,272)Acquisition of license rights — — (750)Net cash used for investing activities (6,873) (10,634) (21,675)
Cash Flows From Financing ActivitiesProceeds from line of credit borrowings 82,282 93,391 34,320Payments on line of credit borrowings (93,619) (86,431) (29,943)Proceeds from term notes payable financing 20,000 — 10,000Principal payments on term notes payable (12,813) (6,250) (5,000)Principal payments on financing obligation (2,092) (1,868) (1,662)Purchases of common stock for treasury (12) (2,006) (5,431)Payment of contingent consideration liabilities (653) (2,323) —Income tax benefit recorded in paid-in capital — — 168Proceeds from sales of common stock held in treasury 975 808 682Net cash provided by (used for) financing activities (5,932) (4,679) 3,134
Effect of foreign currency exchange rates on cash and cash equivalents (101) (319) (348)Net increase (decrease) in cash and cash equivalents 17,546 1,229 (1,532)Cash and cash equivalents at beginning of the year 10,153 8,924 10,456Cash and cash equivalents at end of the year $27,699 $ 10,153 $ 8,924
Supplemental disclosure of cash flow information:Cash paid for income taxes $ 1,778 $ 2,512 $ 2,562Cash paid for interest 2,386 2,655 2,314
Non-cash investing and financing activities:Purchases of property and equipment financed by accounts payable $ 410 $ 1,018 $ 697Consideration for business acquisition from liabilities of acquiree 798 — —
Franklin Covey 2019 Annual Report Statements of Cash Flows 98
See accompanying notes to consolidated financial statements.

FRANKLIN COVEY CO.CONSOLIDATED STATEMENTS OF SHAREHOLDERS’ EQUITY
CommonStockShares
CommonStock
Amount
AdditionalPaid-InCapital
RetainedEarnings
AccumulatedOther
ComprehensiveIncome
TreasuryStockShares
TreasuryStock
AmountIn thousandsBalance at August 31, 2016 27,056 $ 1,353 $ 211,203 $ 76,628 $1,222 (13,332) $ (196,691)Issuance of common stock from
treasury (2,103) 188 2,785Purchase of treasury shares (300) (5,431)Restricted share award (442) 30 442Stock-based compensation 3,658Cumulative translation
adjustments (555)Tax benefit recorded in paid-in
capital 168Net loss (7,172)
Balance at August 31, 2017 27,056 1,353 212,484 69,456 667 (13,414) (198,895)Issuance of common stock from
treasury (3,702) 337 4,510Purchase of treasury shares (105) (2,006)Restricted share award (348) 23 348Stock-based compensation 2,846Cumulative translation
adjustments (326)Net loss (5,887)
Balance at August 31, 2018 27,056 1,353 211,280 63,569 341 (13,159) (196,043)Issuance of common stock from
treasury 321 43 654Purchase of treasury shares 1 (12)Restricted share award (426) 28 426Stock-based compensation 4,789Cumulative translation
adjustments (72)Cumulative effect of new
accounting principle (3,143)Net loss (1,023)Balance at August 31, 2019 27,056 $1,353 $215,964 $59,403 $ 269 (13,087) $(194,975)
99 Statements of Shareholders’ Equity Franklin Covey 2019 Annual Report
See accompanying notes to consolidated financial statements.

FRANKLIN COVEY CO.NOTES TO CONSOLIDATED FINANCIALSTATEMENTS1. Nature Of Operations And Summary Of SignificantAccounting PoliciesFranklin Covey Co. (hereafter referred to as we, us, our,or the Company) is a global company specializing inorganizational performance improvement. We helpindividuals and organizations achieve results that requirea change in human behavior and our mission is to “enablegreatness in people and organizations everywhere.”We have some of the best-known offerings in the trainingindustry, including a suite of individual-effectivenessand leadership-development training and products basedon the best-selling books, The 7 Habits of Highly EffectivePeople, The Speed of Trust, The Leader In Me, and The FourDisciplines of Execution, and proprietary content in theareas of Execution, Sales Performance, Productivity,Customer Loyalty, and Educational improvement. Ourofferings are described in further detail atwww.franklincovey.com and elsewhere in this report.Through our organizational research and curriculumdevelopment efforts, we seek to consistently create,develop, and introduce new services and products thathelp individuals and organizations achieve their own greatpurposes.
Fiscal Year
Our fiscal year ends on August 31 of each year and ourfiscal quarters end on the last day of November, February,and May. Unless otherwise noted, references to fiscal yearsapply to the 12 months ended August 31 of the specifiedyear.
Basis of Presentation
The accompanying consolidated financial statementsinclude the accounts of the Company and ourwholly-owned subsidiaries, which consist of FranklinDevelopment Corp., and our offices in Japan, China, theUnited Kingdom, Australia, Germany, Switzerland,and Austria. Intercompany balances and transactions areeliminated in consolidation.
Pervasiveness of Estimates
The preparation of financial statements in conformitywith generally accepted accounting principles requires us
to make estimates and assumptions that affect the reportedamounts of assets, liabilities, revenues, and expenses.Actual results could differ from those estimates.
Reclassifications
Certain reclassifications have been made to our priorperiod financial statements to conform with the currentperiod presentation. On our August 31, 2018 consolidatedbalance sheet, we have separately classified subscriptionrevenue and other deferred revenue to conform to thecurrent presentation of these balances. As product andleasing revenues have become immaterial to thepresentation of our consolidated sales, we have combinedrevenues from services, products, and leasing into oneline item on our consolidated statements of operations forall periods presented in this report.
Cash and Cash Equivalents
Some of our cash is deposited with financial institutionslocated throughout the United States of America and atbanks in foreign countries where we operate subsidiaryoffices, and at times may exceed insured limits. Weconsider all highly liquid debt instruments with a maturitydate of three months or less to be cash equivalents. Wedid not hold a significant amount of investments thatwould be considered cash equivalent instruments atAugust 31, 2019 or 2018. Of our $27.7 million in cash atAugust 31, 2019, $10.6 million was held outside the U.S. byour foreign subsidiaries. We routinely repatriate cashfrom our foreign subsidiaries and consider cash generatedfrom foreign activities a key component of our overallliquidity position.
Inventories
Inventories are stated at the lower of cost or net realizablevalue, cost being determined using the first-in, first-outmethod. Elements of cost in inventories generally includeraw materials and direct labor. Cash flows from the saleof inventory are included in cash flows provided byoperating activities in our consolidated statements ofcash flows. Our inventories are comprised primarily oftraining materials, books, and training-related accessories,and consisted of the following (in thousands):
AUGUST 31, 2019 2018Finished goods $3,434 $3,130Raw materials 47 30
$3,481 $3,160
Franklin Covey 2019 Annual Report Notes to Consolidated Financial Statements 100

Provision is made to reduce excess and obsoleteinventories to their estimated net realizable value. Inassessing the valuation of inventories, we make judgmentsregarding future demand requirements and comparethese estimates with current and committed inventorylevels. Inventory requirements may change based onprojected customer demand, training curriculum life-cyclechanges, and other factors that could affect the valuationof our inventories.
Other Current Assets
Significant components of our other current assets wereas follows (in thousands):
AUGUST 31, 2019 2018Deferred commissions $ 8,337 $ 6,958Other current assets 2,690 3,935
$11,027 $10,893
We defer commission expense on subscription-basedsales and recognize the commission expense with therecognition of the corresponding revenue.
Property and Equipment
Property and equipment are recorded at cost. Depreciationexpense, which includes depreciation on our corporatecampus that is accounted for as a financing obligation(Note 7), and the amortization of assets recorded undercapital lease obligations, is calculated using thestraight-line method over the lesser of the expecteduseful life of the asset or the contracted lease period. Wegenerally use the following depreciable lives for ourmajor classifications of property and equipment:
Description Useful LivesBuildings 20 yearsMachinery and equipment 5 – 7 yearsComputer hardware and software 3 – 5 yearsFurniture, fixtures, and leasehold
improvements 5 – 7 years
Our property and equipment were comprised of thefollowing (in thousands):
AUGUST 31, 2019 2018Land and improvements $ 1,312 $ 1,312Buildings 30,038 30,038Machinery and equipment 1,162 1,723Computer hardware and software 28,665 27,066Furniture, fixtures, and leasehold
improvements 8,409 8,27269,586 68,411
Less accumulated depreciation (51,007) (47,010)$ 18,579 $ 21,401
We expense costs for repairs and maintenance as incurred.Gains and losses resulting from the sale of property andequipment are recorded in operating income (loss).Depreciation of capitalized portal costs is included indepreciation expense in the accompanying consolidatedstatements of operations. During each of the fiscal yearsended August 31, 2018 and 2017, we capitalized$0.1 million of interest expense in connection with theinstallation of our new enterprise resource planningsystem and the development of our improved All AccessPass (AAP) portal.
Impairment of Long-Lived Assets
Long-lived tangible assets and finite-lived intangibleassets are reviewed for possible impairment wheneverevents or changes in circumstances indicate that thecarrying amount of such assets may not be recoverable.We use an estimate of undiscounted future net cash flowsof the assets over the remaining useful lives in determiningwhether the carrying value of the assets is recoverable.If the carrying values of the assets exceed the anticipatedfuture cash flows of the assets, we recognize an impairmentloss equal to the difference between the carrying valuesof the assets and their estimated fair values. Impairmentof long-lived assets is assessed at the lowest levels forwhich there are identifiable cash flows that areindependent from other groups of assets. The evaluationof long-lived assets requires us to use estimates of futurecash flows. If forecasts and assumptions used to supportthe realizability of our long-lived tangible and finite-lived intangible assets change in the future, significantimpairment charges could result that would adverselyaffect our results of operations and financial condition.
101 Notes to Consolidated Financial Statements Franklin Covey 2019 Annual Report

Indefinite-Lived Intangible Assets and Goodwill ImpairmentTesting
Intangible assets that are deemed to have an indefinitelife and acquired goodwill are not amortized, but ratherare tested for impairment on an annual basis or more oftenif events or circumstances indicate that a potentialimpairment exists. The Covey trade name intangibleasset has been deemed to have an indefinite life. Thisintangible asset is tested for impairment using qualitativefactors or the present value of estimated royalties ontrade name related revenues, which consist primarily oftraining seminars and work sessions, international licenseesales, and related products. Based on the fiscal 2019evaluation of the Covey trade name, we believe the fairvalue of the Covey trade name substantially exceedsits carrying value. No impairment charges were recordedagainst the Covey trade name during the periodspresented in this report.
Goodwill is recorded when the purchase price for anacquisition exceeds the estimated fair value of the nettangible and identified intangible assets acquired. Anannual (or interim test if events and circumstancesindicate a test should be performed) goodwill impairmenttest is performed by comparing the fair value of a reportingunit with its carrying amount, and an impairment chargeis recognized for the amount by which the carryingamount exceeds the reporting unit’s fair value. We testedgoodwill for impairment at August 31, 2019 at thereporting unit level using a quantitative approach. Theestimated fair value of each reporting unit was calculatedusing a combination of the income approach (discountedcash flows) and the market approach (using marketmultiples derived from a set of companies with comparablemarket characteristics).
On an interim basis, we consider whether events orcircumstances are present that may lead to thedetermination that goodwill may be impaired. If, basedon events or changing circumstances, we determine it ismore likely than not that the fair value of a reporting unitdoes not exceed its carrying value, we would be requiredto test goodwill for impairment.
Determining the fair value of a reporting unit is judgmentalin nature and involves the use of significant estimatesand assumptions. These estimates and assumptionsinclude revenue growth rates and operating margins usedto calculate projected future cash flows, risk-adjusteddiscount rates, future economic and market conditions,and determination of appropriate market comparables.We base our fair value estimates on assumptions we
believe to be reasonable, but that are unpredictable andinherently uncertain. Actual future results may differfrom those estimates. In addition, we make certainjudgments and assumptions in allocating shared assetsand liabilities to determine the carrying values for each ofour reporting units. The timing and frequency of ourgoodwill impairment tests are based on an ongoingassessment of events and circumstances that wouldindicate a possible impairment. Based on the results ofour goodwill impairment testing, we determined that noimpairment existed at either of August 31, 2019 or 2018 aseach reporting unit’s estimated fair value exceeded itscarrying value. We will continue to monitor our goodwilland intangible assets for impairment and conduct formaltests when impairment indicators are present. For moreinformation regarding our intangible assets and goodwill,refer to Note 5.
Capitalized Curriculum Development Costs
During the normal course of business, we develop trainingcourses and related materials that we sell to our clients.Capitalized curriculum development costs include certainexpenditures to develop course materials such as videosegments, course manuals, and other related materials.Our capitalized curriculum development spendingin fiscal 2019, which totaled $2.7 million, was primarilyfor various Education practice offerings and coursesfor the All Access Pass, including Unconscious Bias.Curriculum costs are capitalized when there is a majorrevision to an existing course that requires a significantre-write of the course materials. Costs incurred tomaintain existing offerings are expensed when incurred.In addition, development costs incurred in the researchand development of new offerings and software productsto be sold, leased, or otherwise marketed are expensedas incurred until economic and technological feasibilityhas been established.
Capitalized development costs are amortized over three-to five-year useful lives, which are based on numerousfactors, including expected cycles of major changes to ourcontent. Capitalized curriculum development costs arereported as a component of other long-term assets in ourconsolidated balance sheets and totaled $7.0 millionand $9.3 million at August 31, 2019 and 2018.Amortization of capitalized curriculum developmentcosts is reported as a component of cost of sales in theaccompanying consolidated statements of operations.
Franklin Covey 2019 Annual Report Notes to Consolidated Financial Statements 102

Accrued Liabilities
Significant components of our accrued liabilities were asfollows (in thousands):
AUGUST 31, 2019 2018Accrued compensation $14,003 $11,858Other accrued liabilities 9,552 8,903
$23,555 $20,761
Contingent Consideration Payments from BusinessAcquisitions
Business acquisitions may include contingentconsideration payments based on various future financialmeasures related to the acquired entity. Contingentconsideration is required to be recognized at fair value asof the acquisition date. We estimate the fair value ofthese liabilities based on financial projections of theacquired company and estimated probabilities ofachievement. Based on updated estimates and projections,the contingent consideration liabilities are adjusted ateach reporting date to their estimated fair value. Changesin fair value subsequent to the acquisition date arereported in selling, general, and administrative expensein our consolidated statements of operations, and mayhave a material impact on our operating results. Variationsin the fair value of contingent consideration liabilitiesmay result from changes in discount periods or rates,changes in the timing and amount of earnings estimates,and changes in probability assumptions with respect tothe likelihood of achieving various payment criteria.
Foreign Currency Translation and Transactions
The functional currencies of our foreign operations arethe reported local currencies. Translation adjustmentsresult from translating our foreign subsidiaries’ financialstatements into United States dollars. The balancesheet accounts of our foreign subsidiaries are translatedinto United States dollars using the exchange rate in effectat the balance sheet dates. Revenues and expenses aretranslated using average exchange rates for each monthduring the fiscal year. The resulting translation differencesare recorded as a component of accumulated othercomprehensive income in shareholders’ equity. Foreigncurrency transaction losses totaled $0.2 million,$0.5 million, and $0.2 million for the fiscal years endedAugust 31, 2019, 2018, and 2017, respectively, and areincluded as a component of selling, general, andadministrative expenses in our consolidated statementsof operations.
Sales Taxes
We collect sales tax on qualifying transactions withcustomers based upon applicable sales tax rates in variousjurisdictions. We account for sales taxes collected usingthe net method; accordingly, we do not include sales taxesin net sales reported in our consolidated statements ofoperations.
Revenue Recognition
We account for revenue in accordance with AccountingStandards Update (ASU) No. 2014-09, Revenue fromContracts with Customers (Topic 606), which we adoptedon September 1, 2018 using the modified retrospectivemethod (see also Note 2).
Prior to the adoption of Topic 606, we recognized revenuewhen: 1) persuasive evidence of an arrangement existed,2) delivery of the product occurred or the services wererendered, 3) the price to the customer was fixed ordeterminable, and 4) collectability was reasonably assured.These principles governed our revenue recognitionpolicies and procedures for fiscal 2018 and fiscal 2017 aspresented in this report. For training and service sales,these conditions were generally met upon presentation ofthe training seminar or delivery of the consulting servicesbased upon daily rates. For most of our product sales,these conditions were met upon shipment of the productto the customer. For intellectual property license sales,the revenue recognition conditions were generally met atthe later of delivery of the content to the client or theeffective date of the arrangement. Our subscriptionrevenues from the All Access Pass and the Leader in Memembership were recognized over the duration of theunderlying contracts since our clients had the rightto content updates during the contracted period.
Revenue recognition for multiple-element arrangementsrequired judgment to determine if multiple elementsexisted, whether elements could be accounted for asseparate units of accounting, and if so, the fair value foreach of the elements. A deliverable constituted a separateunit of accounting when it had standalone value to ourclients. We entered into arrangements that includedvarious combinations of multiple training offerings,consulting services, and intellectual property licenses.The timing of delivery and performance of the elementstypically varied from contract to contract. Generally, theseitems qualified as separate units of accounting becausethey had value to the customer on a standalone basis. Wedetermined the fair value to be used for allocating
103 Notes to Consolidated Financial Statements Franklin Covey 2019 Annual Report

revenue to the elements based on (i) vendor-specificobjective evidence of fair value (VSOE), (ii) third-partyevidence (TPE), and (iii) best estimate of selling price(BESP).
Our international strategy includes the use of licensees incountries where we do not have a wholly-owned directoffice. Licensee companies are unrelated entities that havebeen granted a license to translate our content andofferings, adapt the content to the local culture, and sellour content in a specific country or region. Licensees arerequired to pay us royalties based upon a percentage oftheir sales to clients. We recognize royalty income eachperiod based upon the sales information reported to usfrom our licensees. Refer to disaggregated revenueinformation presented in Note 17 for our royalty revenuesin the fiscal years presented in this report.
Revenue is recognized as the net amount to be receivedafter deducting estimated amounts for discounts andproduct returns.
Stock-Based Compensation
We record the compensation expense for all stock-basedpayments, including grants of stock options and thecompensatory elements of our employee stock purchaseplan, in our consolidated statements of operations basedupon their fair values over the requisite service period. Formore information on our stock-based compensationplans, refer to Note 12.
Shipping and Handling Fees and Costs
All shipping and handling fees billed to customers arerecorded as a component of net sales. All costs incurredrelated to the shipping and handling of products arerecorded in cost of sales.
Advertising Costs
Costs for advertising are expensed as incurred. Advertisingcosts included in selling, general, and administrativeexpenses totaled $4.6 million, $6.9 million, and$6.4 million for the fiscal years ended August 31, 2019,2018, and 2017.
Income Taxes
Our income tax provision has been determined using theasset and liability approach of accounting for incometaxes. Under this approach, deferred income taxes
represent the future tax consequences expected to occurwhen the reported amounts of assets and liabilities arerecovered or paid. The income tax provision representsincome taxes paid or payable for the current year plus thechange in deferred taxes during the year. Deferred incometaxes result from differences between the financial and taxbases of our assets and liabilities and are adjusted fortax rates and tax laws when changes are enacted. Avaluation allowance is provided against deferred incometax assets when it is more likely than not that all or someportion of the deferred income tax assets will not berealized. Interest and penalties related to uncertain taxpositions are recognized as components of incometax benefit or expense in our consolidated statements ofoperations.
We may recognize the tax benefit from an uncertain taxposition only if it is more likely than not that the taxposition will be sustained on examination by the taxingauthorities based on the technical merits of the position.The tax benefits recognized in the financial statementsfrom such a position are measured based on the largestbenefit that has a greater than 50 percent likelihoodof being realized upon ultimate settlement.
We provide for income taxes, net of applicable foreigntax credits, on temporary differences in our investmentin foreign subsidiaries, which consist primarily ofunrepatriated earnings.
Comprehensive Loss
Comprehensive loss includes changes to equity accountsthat were not the result of transactions with shareholders.Comprehensive loss is comprised of net income or loss andother comprehensive income and loss items. Our othercomprehensive income and losses generally consist ofchanges in the cumulative foreign currency translationadjustment, net of tax.
Accounting Pronouncements Issued and AdoptedRevenue Recognition
In May 2014, the Financial Accounting Standards Board(FASB) issued ASU No. 2014-09, Revenue from Contractswith Customers (Topic 606). This new standard wasissued in conjunction with the International AccountingStandards Board (IASB) and is designed to create a single,principles-based process by which all businesses calculaterevenue. The core principle of this standard is that anentity should recognize revenue for the transfer of goodsor services equal to the amount that it expects to be
Franklin Covey 2019 Annual Report Notes to Consolidated Financial Statements 104

entitled to receive for those goods or services. The newstandard replaces numerous individual, industry-specificrevenue rules found in generally accepted accountingprinciples in the United States. We adopted ASUNo. 2014-09 on September 1, 2018 using the “modifiedretrospective” approach. Under this transition method, weapplied the new standard to contracts that were notcompleted as of the adoption date and recognized acumulative effect adjustment which reduced our retainedearnings by $4.1 million ($3.1 million, net of tax) onSeptember 1, 2018, which primarily consisted of initiallicensing fees on international locations. The comparativeperiod information for fiscal 2018 and fiscal 2017 hasnot been restated and continues to be presented accordingto accounting standards for revenue recognition ineffect during the periods presented.
The primary impact of ASU No. 2014-09 on our revenuerecognition policies is a change in the way we accountfor our initial license fee associated with licensing aninternational location. The Company previously recordedthe non-refundable initial license fee from licensing aninternational location as revenue at the time the licenseperiod begins if all other revenue requirements had beenmet. However, under Topic 606, the Company willrecognize revenue on the upfront license fees over theduration of the contract.
Under Topic 606, we account for the All Access Pass as asingle performance obligation and recognize theassociated transaction price on a straight-line basis overthe term of the underlying contract. This determinationwas reached after considering that our web-basedfunctionality and content, in combination with ourintellectual property, each represent inputs that transforminto a combined output that represents the intendedoutcome of the AAP, which is to provide a continuouslyaccessible, customized, and dynamic learning anddevelopment solution only accessible through the AAPplatform.
We do not expect the accounting for fulfillment costs orcosts incurred to obtain a contract to be materially effectedin any period due to the adoption of ASU 2014-09. Referto Note 2 for further details regarding our revenuerecognition accounting policies under Topic 606.
The cumulative after-tax effects of the changes made toour consolidated balance sheet from the adoption ofTopic 606 were as follows (in thousands):
August 31,2018
ASC 606Adjustments
September 1,2018
Assets:Other current assets $10,893 $ 109 $11,002Deferred income tax assets 3,222 1,005 4,227
Liabilities andShareholders’ Equity:
Deferred subscriptionrevenue 47,417 1,453 48,870
Other deferred revenue 4,471 555 5,026Other liabilities 5,501 2,249 7,750Retained earnings 63,569 (3,143) 60,426
The following line items in our consolidated statement ofoperations were impacted by the adoption of the newrevenue recognition standard for the year endedAugust 31, 2019 (in thousands, except per-share data):
August 31,2019
As Reported
August 31,2019
Without ASC 606Impact ofASC 606
Net sales $225,356 $225,222 $134Cost of sales 66,042 66,042 —Selling, general, and
administrative 145,319 145,329 (10)Income tax provision (1,615) (1,580) (35)Net loss (1,023) (1,132) 109
Net loss per share:Basic and diluted $ (0.07) $ (0.08)
Selected consolidated balance sheet line items as ofAugust 31, 2019, which were impacted by the adoption ofthe new standard, are as follows (in thousands):
August 31,2019
As Reported
August 31,2019
Without ASC 606Impact ofASC 606
Assets:Other current assets $ 11,027 $ 10,908 $ 119Deferred income tax
assets 5,045 4,075 970Total assets 224,913 223,824 1,089
Liabilities andShareholders’Equity:
Deferred subscriptionrevenue $ 56,250 $ 55,247 $ 1,003
Other deferred revenue 5,972 5,417 555Other liabilities 7,527 4,961 2,566Retained earnings 59,403 62,438 (3,035)Total liabilities and
shareholders’ equity 224,913 223,824 1,089
The adoption of ASC Topic 606 did not have a materialimpact on our cash flows from operating, investing,or financing activities.
105 Notes to Consolidated Financial Statements Franklin Covey 2019 Annual Report

Stock-Based Compensation (Topic 718): Improvements toNonemployee Share-Based Payment Accounting
In June 2018, the FASB issued ASU No. 2018-07,Compensation – Stock Compensation: Improvements toNonemployee Share-Based Payment Accounting (Topic718). ASU No. 2018-07 expands the scope of Topic 718 toinclude share-based payment transactions for acquiringgoods and services from nonemployees. The amendmentsin this update specify that Topic 718 applies to all share-based payment transactions in which a grantor acquiresgoods or services to be used or consumed in a grantor’sown operations by issuing share-based payment awards.The amendments also clarify that Topic 718 does not applyto share-based payments used effectively to providefinancing to the issuer or awards granted in conjunctionwith selling goods or services to customers as part of acontract accounted for under Topic 606, Revenue fromContracts with Customers. The new guidance is effectivefor interim and annual periods beginning afterDecember 15, 2018, with early application permitted. Weadopted the provisions of ASU No. 2018-07 on June 1,2019. However, we have not previously granted awards tonon-employees (except for members of the Board ofDirectors) and there was no cumulative impact from theadoption ASU No. 2018-07.
Accounting Pronouncements Issued Not Yet AdoptedLeases (Topic 842)
In February 2016, the FASB issued ASU No. 2016-02,Leases (Topic 842), which supersedes FASB AccountingStandards Codification (ASC) Topic 840, Leases. Underthe new guidance, we will recognize liabilities andcorresponding “right-of-use” (ROU) assets for mostleases but will recognize lease expenses similar to currentlease accounting. The lease liability will be equal to thepresent value of lease payments not yet paid and the ROUasset will be based on the liability, adjusted for initialdirect costs, prepaid lease payments, and lease incentives.For lessors, accounting for leases is substantially thesame as in prior periods. In July 2018, the FASB issued anadoption approach that allows entities to apply the newguidance and recognize a cumulative-effect adjustment tothe opening balance of retained earnings in the periodof adoption without restating prior periods. We will adoptthe new leasing standard on September 1, 2019 usingthis transition method.
At August 31, 2019, our leases primarily consist of thelease on our corporate campus, and operating leases foroffice space, warehousing space, and equipment. The lease
for our corporate campus is currently accounted for as afinancing obligation and related building asset on ourconsolidated balance sheets, as the contract representeda failed sale-leaseback under Topic 840. In transitionto Topic 842, we will be required to reassess whether thepreviously failed sale-leaseback will meet the sale criteriaunder the new leasing standard. We currently believe thatthe sale criteria under the new leasing standard will notbe met and we will continue to account for the corporatecampus lease as a finance obligation upon transition.For our operating leases, we will elect to apply the packageof practical expedients, which allows us to not reassessprior conclusions related to contracts containing leases,lease classification, and initial direct costs. We continue tofinalize our implementation efforts and currently estimatethat the adoption of the new leasing standard will resultin recognition of approximately $1.4 million to $1.6 millionof lease liabilities for operating leases and a correspondingamount for ROU assets on the date of adoption. Thenew lease standard also provides practical expedients foran entity’s ongoing accounting. We currently expect toelect the short-term lease recognition exemption forall leases that qualify, which means leases with initial termsof 12 months or less will not be recorded on the balancesheet. We do not expect the adoption of the new leasestandard to have a material impact on our consolidatedstatements of operations or cash flows.
Credit Losses on Financial Instruments
In June 2016, the FASB issued ASU No. 2016-13, FinancialInstruments – Credit Losses (Topic 326): Measurement ofCredit Losses on Financial Instruments. This accountingstandard changes the methodology for measuring creditlosses on financial instruments, including trade accountsreceivable, and the timing of when such losses arerecorded. ASU No. 2016-13 is effective for fiscal years,and interim periods within those years, beginning afterDecember 15, 2019. Early adoption is permitted forfiscal years, and interim periods within those years,beginning after December 15, 2018. The Companyis currently evaluating the impact of ASU No. 2016-13 onits financial position, results of operations, and liquidity.
Accounting for Implementation Costs Incurred in a CloudComputing Arrangement
In August 2018, the FASB issued ASU No. 2018-15,Intangibles – Goodwill and Other – Internal-Use Software(Subtopic 350-40): Customer’s Accounting forImplementation Costs Incurred in a Cloud ComputingArrangement That Is a Service Contract (ASU 2018-15).This guidance clarifies the accounting for implementation
Franklin Covey 2019 Annual Report Notes to Consolidated Financial Statements 106

costs in a cloud computing arrangement that is a servicecontract and aligns the requirements for capitalizing thosecosts with the capitalization requirements for costsincurred to develop or obtain internal-use software. Thenew standard is effective for interim and annual periodsbeginning after December 15, 2019, and early adoption ispermitted. We are currently evaluating the effects, ifany, the adoption of ASU 2018-15 may have on ourfinancial position, results of operations, cash flows, ordisclosures.
2. Revenue Recogntion
We account for revenue in accordance with Topic 606,which was adopted on September 1, 2018 using themodified retrospective method (Note 1). We earn revenuefrom contracts with customers primarily through thedelivery of our All Access Pass and the Leader in Memembership subscription offerings, through the deliveryof training days and training course materials, andthrough the licensing of rights to sell our content intogeographic locations where the Company does notmaintain a direct office. We also earn revenues fromleasing arrangements that are not accounted for underTopic 606. Returns and refunds are generally immaterial,and we do not have any significant warranty obligations.
Under Topic 606, we recognize revenue upon the transferof control of promised products and services to customersin an amount equal to the consideration we expect toreceive in exchange for those products or services.Although rare, if the consideration promised in a contractincludes variable amounts, we evaluate the estimate ofvariable consideration to determine whether the estimateneeds to be constrained. We include the variableconsideration in the transaction price only to the extentthat it is probable a significant reversal of the amountof cumulative revenue recognized will not occur.
We determine the amount of revenue to be recognizedthrough application of the following steps:
• Identification of the contract with a customer
• Identification of the performance obligations in thecontract
• Determination of the transaction price
• Allocation of the transaction price to the performanceobligations in the contract
• Recognition of revenue when the Company satisfiesthe performance obligations
Taxes assessed by a government authority that arecollected from a customer are excluded from net revenue.
Services and Products
We deliver Company-led training days from our offerings,such as The 7 Habits of Highly Effective People, at acustomer’s location based upon a daily consultant rateand a set price for training materials. These revenues arerecognized as the training days occur and the servicesare performed. Customers also have the option topurchase training materials and present our offeringsthrough internal facilitators and not through the use of aFranklin Covey consultant. Revenue is recognized fromthese product sales when the materials are shipped.Shipping revenues associated with product sales arerecorded in revenue with the corresponding shippingcost being recorded as a component of cost of sales.
Subscription Revenues
Subscription revenues primarily relate to the Company’sAll Access Pass and the Leader in Me membershipofferings. We have determined that it is most appropriateto account for the AAP as a single performance obligationand recognize the associated transaction price ratably overthe term of the underlying contract beginning on thecommencement date of each contract, which is the datethe Company’s platforms and resources are made availableto the customer. This determination was reached afterconsidering that our web-based functionality and content,in combination with our intellectual property, eachrepresent inputs that transform into a combined outputthat represents the intended outcome of the AAP, which isto provide a continuously accessible, customized, anddynamic learning and development solution onlyaccessible through the AAP platform.
We typically invoice our customers annually uponexecution of the contract or subsequent renewals.Amounts that have been invoiced are recorded in accountsreceivable and in unearned revenue or revenue, dependingon whether transfer of control has occurred.
Our Leader in Me offering is bifurcated into a portalmembership obligation and a coaching delivery obligation.We have determined that it is appropriate to recognizerevenue related to the portal membership over the term ofthe underlying contract and to recognize revenue fromcoaching as those services are performed. The combinedcontract amount is recorded in deferred subscriptionrevenue until the performance obligations are satisfied.
107 Notes to Consolidated Financial Statements Franklin Covey 2019 Annual Report

Any additional coaching or training days which arecontracted independent of the Leader in Me contract arerecorded as revenue in accordance with our generalpolicy for services and products as previously described.
Royalties
Our international strategy includes the use of licensees incountries where we do not have a wholly-owned directoffice. Licensee companies are unrelated entities that havebeen granted a license to translate our content andofferings, adapt the content to the local culture, and sellour content in a specific country or region. Licensees arerequired to pay us royalties based upon a percentage oftheir sales to clients. We recognize royalty income eachreporting period based upon the sales informationreported to us from our licensees. When sales informationis not received from a particular licensee at the end of areporting period, the Company estimates the amountof royalties to be received for the period that is beingreported based upon prior forecasts and historicalperformance. These estimated royalties are recorded asrevenue and are adjusted, if necessary, in the subsequentperiod.
The primary impact of ASU No. 2014-09 on our financialstatements is a change in the way we account for theinitial license fee associated with licensing an internationallocation. The Company previously recorded thenon-refundable initial license fee from licensing aninternational location as revenue at the time the licenseperiod began if all other revenue requirements had beenmet. However, under Topic 606, we recognize revenueon the upfront fees over the term of the initial contract.
Contracts with Multiple Performance Obligations
We periodically enter into contracts that include multipleperformance obligations. A performance obligation is apromise in a contract to transfer products or services thatare distinct, or that are distinct within the context of thecontract. A contract’s transaction price is allocated to eachdistinct performance obligation and recognized asrevenue when the performance obligation is satisfied.Determining whether products and services meet thedistinct criteria that should be accounted for separatelyor combined as one unit of accounting requires significantjudgment.
When determining whether goods and services meet thedistinct criteria, we consider various factors for eachagreement including the availability of the services and
the nature of the offerings and services. We allocate thetransaction price to each performance obligation on arelative standalone selling price (SSP) basis. Judgment isrequired to determine the SSP for each distinctperformance obligation. The SSP is the price which theCompany would sell a promised product or serviceseparately to a customer. In determining the SSP, weconsider the size and volume of transactions, price lists,historical sales, and contract prices. We may modifyour pricing from time-to-time in the future, which couldresult in changes to the SSP.
Contract Balances
As described above, subscription revenue is generallyrecognized ratably over the term of the underlyingcontract beginning on the commencement date of eachcontract. The timing of when these contracts are invoiced,cash is collected, and revenue is recognized impacts ouraccounts receivable and deferred revenue accounts.We generally bill our clients in advance for subscriptionofferings or within the month that the training andproducts are delivered. As such, consideration due to theCompany for work performed is included in accountsreceivable and we do not have a significant amountof contract assets. Our receivables are generally collectedwithin 30 to 120 days but typically no longer than12 months. Deferred revenue primarily consists of billingsor payments received in advance of revenue beingrecognized from our subscription offerings. Furthermore,our clients, to expend funds in a particular budget cycle,may prepay for services or products which are also acomponent of our consolidated deferred revenue. Ourdeferred revenue totaled $65.8 million at August 31, 2019and $52.9 million at August 31, 2018, of which $3.6 millionand $1.0 million were classified as components of otherlong-term liabilities at August 31, 2019 and August 31,2018, respectively. The amount of deferred revenue thatwas generated from subscription offerings totaled$58.2 million at August 31, 2019 and $48.4 million atAugust 31, 2018. During the fiscal year ended August 31,2019, we recognized $74.7 million of previously deferredsubscription revenue.
Remaining Performance Obligations
When possible, we enter into multi-year non-cancellablecontracts which are invoiced either upon execution ofthe contract or at the beginning of each annual contractperiod. Topic 606 introduced the concept of remainingtransaction price which represents contracted revenue
Franklin Covey 2019 Annual Report Notes to Consolidated Financial Statements 108

that has not yet been recognized, including unearnedrevenue and unbilled amounts that will be recognized asrevenue in future periods. Transaction price is influencedby factors such as seasonality, the average length of thecontract term, and the ability of the Company to continueto enter multi-year non-cancellable contracts. AtAugust 31, 2019 we had $88.1 million of remainingperformance obligations, including the amount of deferredrevenue related to our subscription offerings, of whichapproximately 75 percent will be recognized over the next12 months. The remaining performance obligation doesnot include other deferred revenue as amounts included inother deferred revenue include items such as depositsthat are generally refundable at the client’s request priorto the satisfaction of the obligation.
Costs Capitalized to Obtain Contracts
We capitalize the incremental costs of obtainingnon-cancellable subscription revenue, primarily from theAll Access Pass and the Leader in Me membershipofferings. These incremental costs consist of salescommissions paid to our sales force and include theassociated payroll taxes and fringe benefits. As the samecommission rates are paid annually when the customerrenews their contract, the capitalized commission costsare amortized ratably on an annual basis. At August 31,2019 we have capitalized $9.0 million of direct salescommissions, of which $8.3 million is included in othercurrent assets and $0.7 million is included in otherlong-term liabilities based on expected recognition of thecommissions. During the fiscal year ended August 31,2019, we capitalized $13.7 million of costs to obtainrevenue contracts and amortized $11.7 million to selling,general, and administrative expense.
Refer to Note 17 (Segment Information) to theseconsolidated financial statements for our disaggregatedrevenue information.
3. Business AcquisitionsAcquisition of Germany, Switzerland, and Austria Licensee
On December 5, 2018, we purchased all of the equity ofLeadership Institut GmbH, a Munich, Germany basedcompany with wholly owned subsidiary companiesin Switzerland and Austria. Leadership Institut GmbHpreviously operated as an independent licensee thatprovided our training and products to Germany,Switzerland, and Austria (GSA). We transitioned theGSA licensee operation into a directly owned office
operation during fiscal 2019. The purchase price was$0.2 million in cash, plus $0.8 million in forgiveness ofliabilities owed to the Company from the pre-existingrelationship at the purchase date. There is no contingentor other additional consideration associated with thepurchase of the former GSA licensee. We accounted forthe acquisition of Leadership Institut Gmbh as a businesscombination in the second quarter of fiscal 2019. Weincurred costs for severance, legal, and other relatedacquisition expenses which totaled $0.5 million and wereexpensed in selling, general, and administrative expenseduring fiscal 2019. The acquisition of the GSA licensee willprovide us with the opportunity to operate a directlyowned office in one of the world’s largest economicmarkets and is expected to provide significant futuregrowth opportunities. The total purchase price consistedof the following (in thousands):
Cash paid at closing $159Accounts receivable from GSA licensee 798
Total purchase price $957
The major classes of assets and liabilities to which wehave preliminarily allocated the purchase price were asfollows (in thousands):
Cash acquired $ 127Accounts receivable 564Inventories 80Prepaid expenses and other current assets 45Intangible assets 741Property and equipment 27Other long-term assets 11
Assets acquired 1,595Accounts payable (208)Accrued liabilities (383)Income taxes payable (47)
Liabilities assumed (638)$ 957
The allocation of the purchase price to the intangibleassets acquired was as follows (in thousands):
Description Amount
WeightedAverage
LifeReacquisition of license rights $360 3 yearsLocalized content 202 3 yearsCustomer relationships 179 3 years
$741
We have included the financial results of the former GSAlicensee in our financial results since the date of
109 Notes to Consolidated Financial Statements Franklin Covey 2019 Annual Report

acquisition. Since the date of the acquisition, the newdirect office that serves the GSA region recognized$1.5 million of sales and a $0.2 million operating loss.During fiscal 2018, we recognized $0.4 million of royaltyrevenue from the GSA licensee. The acquisition of theformer GSA licensee was immaterial to our financialstatements and pro forma financial information was notdeemed necessary for this acquisition.
Robert Gregory Partners, LLC
On May 15, 2017, we acquired the assets of RobertGregory Partners, LLC (RGP), a Dublin, Ohio basedcorporate coaching firm, for $3.5 million in cash pluspotential contingent consideration totaling $4.5 million.Robert Gregory Partners is a corporate coaching firm withexpertise in executive coaching, transition accelerationcoaching, leadership development coaching,implementation coaching, and consulting. We believethat the acquired RGP services and methodologies havebecome important offerings in our training and consultingbusiness. The financial results of RGP have been includedin our consolidated financial statements since the dateof the acquisition.
The total purchase price consisted of the following (inthousands):
Cash paid to RGP at closing $3,500Fair value of contingent consideration 1,413
Total purchase price $4,913
The major classes of assets and liabilities to which wehave allocated the purchase price were as follows (inthousands):
Accounts receivable $ 458Prepaid expenses 136Intangible assets 3,811Goodwill 1,232
Assets acquired 5,637Accounts payable (51)Accrued liabilities (80)Deferred revenues (593)
Liabilities assumed (724)$4,913
The goodwill generated from the RGP acquisition wasallocated to each of our operating segments. The goodwillwas primarily attributed to increased synergies that areexpected to be achieved from the integration of RGP’scoaching methodologies into our services and offerings.All of the goodwill from the RGP acquisition is expected tobe deductible for income tax purposes.
The payment of contingent consideration is based on theachievement of specified financial results and the deliveryof “add-on coaching services” content that is includedin our All Access Pass offering. We paid the former ownersof RGP $1.0 million during fiscal 2018 as contingentconsideration for achieving specified financial results.During the fourth quarter of fiscal 2017, we paid theformer owners of RGP $0.5 million of contingentconsideration for delivery of the content that wasintegrated into our AAP offering. Due to the timing ofthe $0.5 million payment for add-on coaching services, thisamount was included in the investing activities sectionof the accompanying consolidated statement of cash flowsfor fiscal 2017. Refer to Note 11 for further informationregarding the fair value of the contingent considerationliability resulting from the RGP acquisition.
The details of the purchase price allocated to the intangibleassets acquired were as follows (in thousands):
Description Amount
WeightedAverage
LifeCustomer list $2,249 10 yearsContent 461 5 yearsTrade name 341 5 yearsNon-compete agreements 328 2 yearsDeferred contract revenue 237 2 yearsCoach relationships 150 10 yearsAcquired technology 45 3 years
$3,811 8 years
Our fiscal 2017 consolidated statement of operationsinclude $1.2 million of revenue and $0.4 million of incomefrom operations, excluding amortization of intangibleassets, attributable to RGP since the date of theacquisition. The costs to acquire RGP totaledapproximately $0.1 million and were expensed ascomponents of selling, general, and administrativeexpense in our consolidated financial statements.
Jhana Education
On July 11, 2017, we acquired all of the outstanding stockof Jhana Education (Jhana), a San Francisco basedcompany that specializes in the creation and disseminationof relevant, bite-sized content and learning tools forleaders and managers. The acquired Jhana content anddelivery methodologies have become key features of ourcurrent AAP offering. The purchase price was $3.5 millionin cash plus up to $7.2 million of contingent consideration.The financial results of Jhana have been included inour consolidated financial statements since the date ofthe acquisition.
Franklin Covey 2019 Annual Report Notes to Consolidated Financial Statements 110

The total purchase price consisted of the following (inthousands):
Cash paid to Jhana at closing $3,525Fair value of contingent consideration 6,052
Total purchase price $9,577
The major classes of assets and liabilities to which wehave allocated the purchase price were as follows (inthousands):
Cash $ 253Accounts receivable 195Prepaid expenses and other current assets 86Deferred tax asset 3,138Intangible assets 6,076Goodwill 3,085
Assets acquired 12,833Accounts payable (185)Accrued liabilities (19)Deferred tax liability (2,257)Deferred revenues (795)
Liabilities assumed (3,256)$ 9,577
The details of the purchase price allocated to the intangibleassets acquired consisted of the following (in thousands):
Description Amount
WeightedAverage
LifeContent $3,097 5 yearsAcquired technology 1,474 3 yearsCustomer list 1,016 5 yearsTrade name 445 5 yearsNon-compete agreements 44 3 years
$6,076 5 years
The goodwill from the Jhana acquisition was assigned tothe Direct Offices and International Licensee segments.The goodwill was primarily attributed to increasedsynergies that are expected to be achieved from theintegration of Jhana’s content and delivery methodologiesinto our services and offerings, especially in the AllAccess Pass. None of the goodwill from the Jhanaacquisition is expected to be deductible for income taxpurposes.
During fiscal 2018, we paid $2.4 million to the formerowners of Jhana as contingent consideration based on theacquisition agreement. The first $1.1 million was paidwithin 90 days of the acquisition date and was classifiedas a component of cash flows from investing activities in
our fiscal 2018 consolidated statement of cash flows. Thepayment of the remaining contingent consideration isbased on certain revenue streams over the measurementperiod, which ends in July 2026. Refer to Note 11 forfurther information regarding the fair value of contingentconsideration resulting from the Jhana acquisition.
The acquisition of Jhana had an immaterial impact onour consolidated financial statements for the fiscal yearended August 31, 2017. The costs to acquire Jhana totaledapproximately $0.1 million and were expensed as incurred.The acquisition costs were included in our selling,general, and administrative expenses.
Unaudited Pro Forma Information
The following are supplemental consolidated financialresults of Franklin Covey Co. on an unaudited pro formabasis as if the acquisitions of RGP and Jhana had beencompleted on September 1, 2016 (in thousands, exceptper share amounts):
YEAR ENDEDAUGUST 31, 2017Revenue $187,745Net loss (7,976)Diluted loss per share (0.58)
These pro forma results were based on estimates andassumptions, which we believe are reasonable. They arenot the results that would have been realized had we beena combined company during the period presented, andare not necessarily indicative of our consolidated resultsof operations in future periods. The pro forma resultsinclude adjustments related to purchase accounting,primarily the amortization of intangible assets, interestexpense, and inclusion of acquisition costs.
4. Accounts Receivable
Accounts receivable are recorded at the invoiced amountand do not bear interest. The allowance for doubtfulaccounts represents our best estimate of the amount ofprobable credit losses in the existing accounts receivablebalance, and we review the adequacy of the allowance fordoubtful accounts on a regular basis. We determine theallowance for doubtful accounts using historical write-offexperience based on the age of the receivable balancesand current general economic conditions. Receivablebalances past due over 90 days, which exceed a specifieddollar amount, are reviewed individually for collectability.As we increase sales to governmental organizations,
111 Notes to Consolidated Financial Statements Franklin Covey 2019 Annual Report
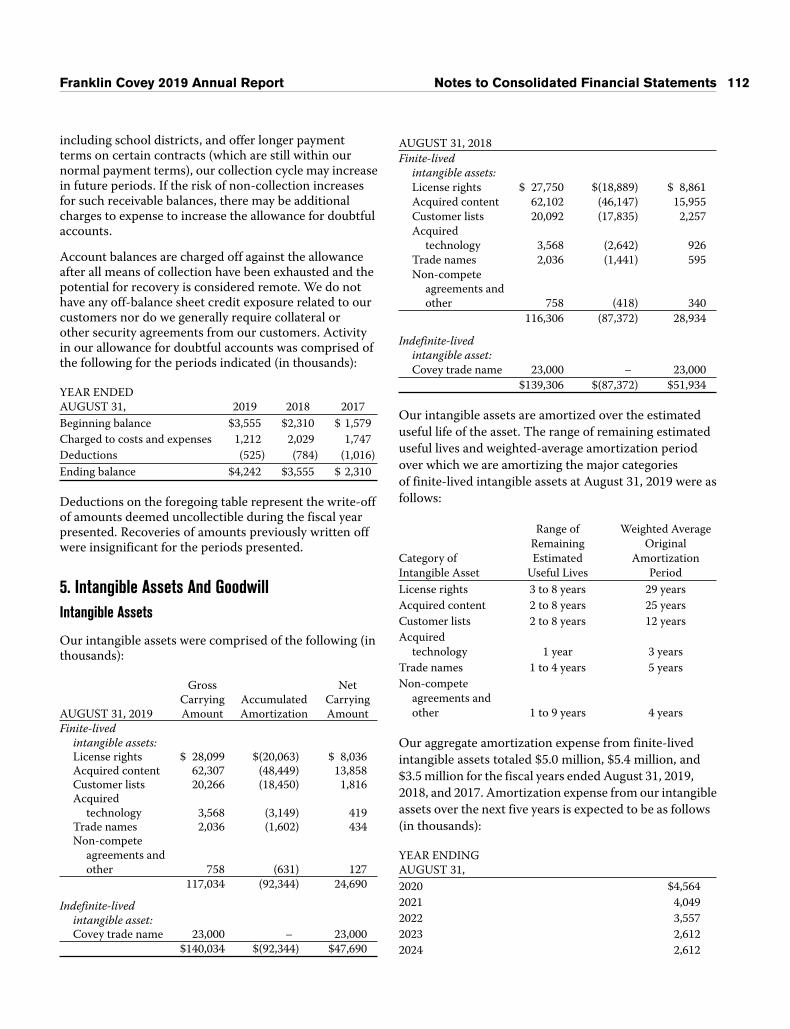
including school districts, and offer longer paymentterms on certain contracts (which are still within ournormal payment terms), our collection cycle may increasein future periods. If the risk of non-collection increasesfor such receivable balances, there may be additionalcharges to expense to increase the allowance for doubtfulaccounts.
Account balances are charged off against the allowanceafter all means of collection have been exhausted and thepotential for recovery is considered remote. We do nothave any off-balance sheet credit exposure related to ourcustomers nor do we generally require collateral orother security agreements from our customers. Activityin our allowance for doubtful accounts was comprised ofthe following for the periods indicated (in thousands):
YEAR ENDEDAUGUST 31, 2019 2018 2017Beginning balance $3,555 $2,310 $ 1,579Charged to costs and expenses 1,212 2,029 1,747Deductions (525) (784) (1,016)Ending balance $4,242 $3,555 $ 2,310
Deductions on the foregoing table represent the write-offof amounts deemed uncollectible during the fiscal yearpresented. Recoveries of amounts previously written offwere insignificant for the periods presented.
5. Intangible Assets And GoodwillIntangible Assets
Our intangible assets were comprised of the following (inthousands):
AUGUST 31, 2019
GrossCarryingAmount
AccumulatedAmortization
NetCarryingAmount
Finite-livedintangible assets:License rights $ 28,099 $(20,063) $ 8,036Acquired content 62,307 (48,449) 13,858Customer lists 20,266 (18,450) 1,816Acquired
technology 3,568 (3,149) 419Trade names 2,036 (1,602) 434Non-compete
agreements andother 758 (631) 127
117,034 (92,344) 24,690
Indefinite-livedintangible asset:Covey trade name 23,000 – 23,000
$140,034 $(92,344) $47,690
AUGUST 31, 2018Finite-lived
intangible assets:License rights $ 27,750 $(18,889) $ 8,861Acquired content 62,102 (46,147) 15,955Customer lists 20,092 (17,835) 2,257Acquired
technology 3,568 (2,642) 926Trade names 2,036 (1,441) 595Non-compete
agreements andother 758 (418) 340
116,306 (87,372) 28,934
Indefinite-livedintangible asset:Covey trade name 23,000 – 23,000
$139,306 $(87,372) $51,934
Our intangible assets are amortized over the estimateduseful life of the asset. The range of remaining estimateduseful lives and weighted-average amortization periodover which we are amortizing the major categoriesof finite-lived intangible assets at August 31, 2019 were asfollows:
Category ofIntangible Asset
Range ofRemainingEstimated
Useful Lives
Weighted AverageOriginal
AmortizationPeriod
License rights 3 to 8 years 29 yearsAcquired content 2 to 8 years 25 yearsCustomer lists 2 to 8 years 12 yearsAcquired
technology 1 year 3 yearsTrade names 1 to 4 years 5 yearsNon-compete
agreements andother 1 to 9 years 4 years
Our aggregate amortization expense from finite-livedintangible assets totaled $5.0 million, $5.4 million, and$3.5 million for the fiscal years ended August 31, 2019,2018, and 2017. Amortization expense from our intangibleassets over the next five years is expected to be as follows(in thousands):
YEAR ENDINGAUGUST 31,2020 $4,5642021 4,0492022 3,5572023 2,6122024 2,612
Franklin Covey 2019 Annual Report Notes to Consolidated Financial Statements 112

Goodwill
There were no changes to our consolidated goodwillbalance during fiscal 2019 and we do not have anyaccumulated impairment charges against the carryingvalue of our goodwill. At August 31, 2019 and 2018,goodwill was allocated to our segments as shown below(in thousands):
Direct offices $16,825International licensees 5,065Education practice 2,330
$24,220
6. Term Loans Payable And Revolving Line OfCredit
On August 7, 2019, we entered into a new credit agreement(the 2019 Credit Agreement) with our existing lender,which replaced the amended and restated creditagreement, dated March 2011 (the Original CreditAgreement). The 2019 Credit Agreement provides up to$25.0 million in term loans and a $15.0 million revolvingline of credit. Upon entering into the 2019 CreditAgreement, we borrowed $20.0 million through a termloan and used the proceeds to repay all indebtedness underthe Original Credit Agreement. Surplus proceeds fromthe term loan are classified as cash and cash equivalentson our consolidated balance sheet. Within one year of thedate of the 2019 Credit Agreement, we may request anadditional $5.0 million term loan. Interest on allborrowings under the 2019 Credit Agreement is due andpayable on the first day of each month and will be equalto LIBOR plus 1.85 percent, which pricing matches that ofthe Original Credit Agreement. The effective interestrate on our term loan and revolving line of credit was4.1 percent at August 31, 2019 and 3.9 percent atAugust 31, 2018. We incurred approximately $0.1 millionof legal fees to obtain the 2019 Credit Agreement.
The 2019 Credit Agreement preserves the financialcovenants in the Original Credit Agreement, which are(i) a Funded Indebtedness to Adjusted EBITDAR Ratio ofless than 3.00 to 1.00; (ii) a Fixed Charge Coverage rationot less than 1.15 to 1.00; (iii) an annual limit on capitalexpenditures (excluding capitalized curriculumdevelopment costs) of $8.0 million; and (iv) consolidatedaccounts receivable of not less than 150% of the aggregateamount of the outstanding borrowings on the revolvingline of credit, the undrawn amount of outstanding lettersof credit, and the amount of unreimbursed letter ofcredit disbursements.
In the event of noncompliance with these financialcovenants and other defined events of default, the lenderis entitled to certain remedies, including acceleration ofthe repayment of any amounts outstanding on the 2019Credit Agreement. At August 31, 2019, we believe that wewere in compliance with the terms and covenantsapplicable to the 2019 Credit Agreement.
The 2019 Credit Agreement is secured by substantiallyall of the assets of the Company and certain of oursubsidiaries and contains customary representations,warranties, and covenants.
Term Loans Payable
As previously described, we borrowed $20.0 million on aterm loan and used the proceeds to repay all indebtednessunder the Original Credit Agreement. Within one year ofthe date of the 2019 Credit Agreement, we may requestan additional $5.0 million term loan with the same termsas the original $20.0 million term loan. Principal paymentson the term loans of $1.25 million will be due and payableon the first day of each January, April, July, and October($5.0 million per year) until the term loan obligationis repaid. Quarterly principal payments remain the samewhether or not we choose to obtain the additional$5.0 million term loan. Accordingly, at August 31, 2019,the principal of the $20.0 million term loan will be repaidover four years as shown below (in thousands):
YEAR ENDINGAUGUST 31,2020 $ 5,0002021 5,0002022 5,0002023 5,000
$20,000
Revolving Line of Credit
The key terms and conditions of our revolving line ofcredit associated with the 2019 Credit Agreement are asfollows:
• Available Credit – $15.0 million less outstandingstandby letters of credit, which totaled $0.1 million atAugust 31, 2019.
• Maturity Date – August 7, 2024.
• Interest Rate – The effective interest rate is LIBORplus 1.85 percent per annum and the unusedcommitment fee on the line of credit is 0.20 percentper annum.
113 Notes to Consolidated Financial Statements Franklin Covey 2019 Annual Report

At August 31, 2019, we did not have any borrowings onthe revolving line of credit. We had $11.3 millionoutstanding on our revolving line of credit at August 31,2018.
7. Financing Obligation
In connection with the sale and leaseback of our corporateheadquarters facility located in Salt Lake City, Utah, weentered into a 20-year master lease agreement withthe purchaser, an unrelated private investment group.The 20-year master lease agreement also contains sixfive-year renewal options that allow us to maintain ouroperations at the current location for up to 50 years.Although the corporate headquarters facility was soldand the Company has no legal ownership of the property,under applicable accounting guidance we were prohibitedfrom recording the transaction as a sale since we havesubleased a significant portion of the property that wassold. Accordingly, we account for the sale as a financingtransaction, which requires us to continue reporting thecorporate headquarters facility as an asset and to record afinancing obligation for the sale price.
The financing obligation on our corporate campus wascomprised of the following (in thousands):
AUGUST 31, 2019 2018Financing obligation payable in monthly
installments of $309 at August 31,2019, including principal and interest,with two percent annual increases(imputed interest at 7.7%), throughJune 2025 $18,983 $21,075
Less current portion (2,335) (2,092)Total financing obligation, less current
portion $16,648 $18,983
Future principal maturities of our financing obligationwere as follows at August 31, 2019 (in thousands):
YEAR ENDINGAUGUST 31,2020 $ 2,3352021 2,6002022 2,8872023 3,1992024 3,538Thereafter 4,424
$18,983
Our remaining future minimum payments under thefinancing obligation in the initial 20-year lease term areas follows (in thousands):
YEAR ENDINGAUGUST 31,2020 $ 3,7242021 3,7982022 3,8742023 3,9522024 4,031Thereafter 3,301Total future minimum financing obligation
payments 22,680Less interest (5,009)Present value of future minimum financing
obligation payments $17,671
The $1.3 million difference between the carrying value ofthe financing obligation and the present value of thefuture minimum financing obligation payments representsthe carrying value of the land sold in the financingtransaction, which is not depreciated. At the conclusionof the master lease agreement, the remaining financingobligation and carrying value of the land will be offset andwritten off our consolidated financial statements.
8. Operating LeasesLease Expense
In the normal course of business, we lease office spaceand warehouse and distribution facilities undernon-cancelable operating lease agreements. We rentoffice space, primarily for international and domesticregional sales administration offices, in commercial officecomplexes that are conducive to sales and administrativeoperations. We also rent warehousing and distributionfacilities that are designed to provide secure storage andefficient distribution of our training products, books, andaccessories. These operating lease agreements oftencontain renewal options that may be exercised at ourdiscretion after the completion of the base rental term. Inaddition, some of the rental agreements provide forregular increases to the base rental rate at specifiedintervals, which usually occur on an annual basis. AtAugust 31, 2019, we had operating leases with remainingterms ranging from less than one year to approximatelysix years. The following table summarizes our future
Franklin Covey 2019 Annual Report Notes to Consolidated Financial Statements 114

minimum lease payments under operating leaseagreements at August 31, 2019 (in thousands):
YEAR ENDINGAUGUST 31,2020 $ 7522021 4722022 1122023 972024 79Thereafter 92
$1,604
We recognize lease expense on a straight-line basis overthe life of the lease agreement. Contingent rent expense isrecognized as it is incurred and was insignificant for theperiods presented. Total rent expense recorded in selling,general, and administrative expense from operatinglease agreements was $1.5 million, $1.6 million, and$1.8 million for the fiscal years ended August 31, 2019,2018, and 2017.
Lease Income
We have subleased the majority of our corporateheadquarters campus located in Salt Lake City, Utah tomultiple, unrelated tenants as well as to FC OrganizationalProducts (FCOP, Note 18). We recognize sublease incomeon a straight-line basis over the life of the subleaseagreement. The cost basis of our corporate campus was$35.1 million, which had a carrying value of $6.3 million atAugust 31, 2019. The following future minimum leasepayments due to us from our sublease agreements atAugust 31, 2019 include lease income of approximately$0.6 million per year from FCOP (in thousands):
YEAR ENDINGAUGUST 31,2020 $ 3,8902021 2,3412022 1,5142023 1,5142024 1,527Thereafter 1,275
$12,061
Sublease revenue totaled $3.9 million, $3.5 million, and$3.6 million during the fiscal years ended August 31, 2019,2018, and 2017.
9. Commitments And ContingenciesWarehouse Outsourcing Contract
Effective July 1, 2016, we entered into a warehousingservices agreement with an independent warehouse anddistribution company to provide product kitting,warehousing, and order fulfillment services at a facility inDes Moines, Iowa. Under the terms of this contract, wepay a fixed charge of approximately $19,000 per month foraccount management services and variable charges forother warehousing services based on specified activities,including shipping charges. The warehouse chargesmay be increased each year of the contract based uponchanges in the Employment Cost Index. The originalwarehousing and distribution contract expired on June 30,2019, and we extended the contract with essentially thesame terms until June 30, 2020.
During fiscal years 2019, 2018, and 2017, we expensed$3.1 million, $2.9 million, and $2.6 million for servicesprovided under the terms of our warehouse anddistribution outsourcing contract. The total amountexpensed each year includes freight charges, which arebilled to the Company based upon activity. Freight chargesincluded in the warehouse and distribution outsourcingcosts totaled $2.1 million, $1.9 million, and $1.5 millionduring the fiscal years ended August 31, 2019, 2018, and2017. Because of the variable component of the agreement,our payments for warehouse and distribution servicesmay fluctuate in the future due to changes in sales andlevels of specified activities.
Purchase Commitments
During the normal course of business, we issue purchaseorders to various vendors for products and services. AtAugust 31, 2019, we had open purchase commitmentstotaling $4.5 million for products and services to bedelivered primarily in fiscal 2020.
Letters of Credit
At August 31, 2019 and 2018, we had standby letters ofcredit totaling $0.1 million. These letters of credit wereprimarily required to secure commitments for certaininsurance policies and expire in January 2020. No amountswere drawn on the letters of credit at either August 31,2019 or August 31, 2018.
Legal Matters and Loss Contingencies
We are the subject of certain legal actions, which weconsider routine to our business activities. At August 31,
115 Notes to Consolidated Financial Statements Franklin Covey 2019 Annual Report

2019, we believe that, after consultation with legal counsel,any potential liability to us under these other actionswill not materially affect our financial position, liquidity,or results of operations.
10. Shareholders’ EquityPreferred Stock
We have 14.0 million shares of preferred stock authorizedfor issuance. At August 31, 2019 and 2018, no shares ofpreferred stock were issued or outstanding.
Treasury Stock
On January 23, 2015, our Board of Directors approved anew plan to repurchase up to $10.0 million of theCompany’s outstanding common stock. All previouslyexisting common stock repurchase plans were canceledand the new common share repurchase plan does not havean expiration date. On March 27, 2015, our Board ofDirectors increased the aggregate value of shares ofCompany common stock that may be purchased underthe January 2015 plan to $40.0 million so long as we haveeither $10.0 million in cash and cash equivalents orhave access to debt financing of at least $10.0 million.Through August 31, 2019, we have purchased 1,539,828shares of our common stock for $26.8 million underthe terms of this expanded common stock repurchaseplan. The actual timing, number, and value of commonshares repurchased under this plan will be determined atour discretion and will depend on a number of factors,including, among others, general market and businessconditions, the trading price of our common shares, andapplicable legal requirements. We have no obligationto repurchase any common shares under theauthorization, and the repurchase plan may be suspended,discontinued, or modified at any time for any reason.
The cost of common stock purchased for treasury asshown on our consolidated statement of cash flows forthe year ending August 31, 2019 is comprised of the costof 561 shares that were withheld for statutory income taxeson stock-based compensation awards issued toparticipants during the fiscal 2019. The withheld shareswere valued at the market price on the date the shares weredistributed to participants, which totaled approximately$12,000. For the fiscal years ended August 31, 2018and 2017, we withheld 104,699 shares and 51,156 sharesfor statutory taxes on stock-based compensation awards,which had a total market value of $2.0 million and$0.9 million, respectively.
11. Fair Value Of Financial Instruments
Fair value is defined as the price that would be receivedto sell an asset or paid to transfer a liability (an exit price)in an orderly transaction between market participantsat the measurement date. The accounting standardsrelated to fair value measurements include a hierarchyfor information and valuations used in measuring fairvalue that is broken down into the following three levelsbased on reliability:
• Level 1 valuations are based on quoted prices in activemarkets for identical instruments that the Companycan access at the measurement date.
• Level 2 valuations are based on inputs other thanquoted prices included in Level 1 that are observablefor the instrument, either directly or indirectly, forsubstantially the full term of the asset or liabilityincluding the following:
a. quoted prices for similar, but not identical,instruments in active markets;
b. quoted prices for identical or similar instruments inmarkets that are not active;
c. inputs other than quoted prices that are observablefor the instrument; or
d. inputs that are derived principally from orcorroborated by observable market data bycorrelation or other means.
• Level 3 valuations are based on information that isunobservable and significant to the overall fair valuemeasurement.
The book values of our financial instruments at August 31,2019 and 2018 approximated their fair values. Theassessment of the fair values of our financial instrumentsis based on a variety of factors and assumptions.Accordingly, the fair values may not represent the actualvalues of the financial instruments that could have beenrealized at August 31, 2019 or 2018, or that will be realizedin the future, and do not include expenses that could beincurred in an actual sale or settlement. The followingmethods and assumptions were used to determine the fairvalues of our financial instruments, none of which wereheld for trading or speculative purposes:
Cash, Cash Equivalents, and AccountsReceivable – The carrying amounts of cash, cashequivalents, and accounts receivable approximate theirfair values due to the liquidity and short-term maturity ofthese instruments.
Franklin Covey 2019 Annual Report Notes to Consolidated Financial Statements 116

Other Assets – Our other assets, including notesreceivable, were recorded at the net realizable value ofestimated future cash flows from these instruments.
Debt Obligations – At August 31, 2019, our debtobligations consisted primarily of a variable-rate termnote payable. Our term note payable and revolving line ofcredit (Note 6) are negotiated components of our 2019Credit Agreement, which was completed in August 2019.Accordingly, the applicable interest rates on the termloan and revolving line of credit are reflective of currentmarket conditions, and the carrying value of term loan andrevolving line of credit (when applicable) obligationstherefore approximate their fair value.
Contingent Consideration Liabilities from BusinessAcquisitions
We have contingent consideration liabilities arising fromprevious business acquisitions (Note 3). We measurethe fair values of our contingent consideration liabilitiesat each reporting date based on various valuation modelsas described below. Changes to the fair value of thecontingent consideration liabilities are recorded ascomponents of our selling, general, and administrativeexpenses in the accompanying consolidated statements ofoperations in the period of adjustment. The fair value ofthe contingent consideration liabilities from theacquisition of RGP and Jhana changed as follows duringthe fiscal year ended August 31, 2019 (in thousands):
AUGUST 31, 2018
Increasein FairValue Payments 2019
RGP contingentliability $ 606 $1,155 $ – $1,761
Jhana contingentliability 3,942 179 (653) 3,468
$4,548 $1,334 $(653) $5,229
The fair values of contingent consideration liabilities arerecorded as components of accrued liabilities and otherlong-term liabilities based on expected payment dates.
Robert Gregory Partners – On May 15, 2017, we acquiredthe assets of RGP. The purchase price included contingentconsideration payments to the former owners of RGPof up to $4.5 million, based on the achievement ofspecified levels of earnings before interest, income taxes,depreciation, and amortization expense (EBITDA) andthe delivery of “add-on coaching services content” for ourAAP as set forth in the purchase agreement. Duringfiscal 2019, we amended the RGP acquisition agreementto reflect events and implementation issues that have
occurred since the acquisition date. The amended contractincreased the contingent consideration liability from theRGP acquisition by $1.1 million during the third quarter offiscal 2019, but did not increase the total amount ofcontingent consideration potentially payable to the formerowners of RGP. The specified levels of EBITDA includemeasures for RGP coaching services plus earnings fromadd-on coaching services sold through the AAP. The fairvalue of the RGP contingent liability is estimated usinga Monte Carlo simulation method, which considersnumerous potential financial outcomes using estimatedvariables such as expected revenues, growth rates, anda discount rate. This fair value measurement is considereda Level 3 measurement because we estimate revenuesand corresponding expected growth rates each period.The following range of growth rates were used to calculatethe initial fair value of the contingent consideration:
Likely Minimum MaximumRGP growth rate – Year 1 14.8% (12.0)% 35.0%RGP growth rate – Year 2 10.0% (12.0)% 35.0%RGP growth rate – Year 3 10.0% (12.0)% 35.0%
Add-on services growthrate – Year 1 60.0% (20.0)% 130.0%
Add-on services growthrate – Year 2 50.0% (20.0)% 130.0%
Add-on services growthrate – Year 3 40.0% (20.0)% 130.0%
Jhana Education – On July 11, 2017, we acquired thestock of Jhana Education. The purchase price includedpotential contingent consideration of $7.2 million throughthe measurement period, which ends in July 2026. Thefair value of the contingent consideration was calculatedusing a probability weighted expected return methodology,which is a Level 3 measurement because we estimateprojected consolidated Company and AAP sales over themeasurement period. Probabilities were applied toeach potential sales outcome and the resulting valueswere discounted using a rate that considered Jhana’sweighted average cost of capital and specific riskpremiums associated with the potential contingentconsideration.
12. Stock-Based Compensation PlansOverview
We utilize various stock-based compensation plans asintegral components of our overall compensation andassociate retention strategy. Our shareholders haveapproved various stock incentive plans that permit us to
117 Notes to Consolidated Financial Statements Franklin Covey 2019 Annual Report

grant performance awards, restricted stock awards, stockoptions, and employee stock purchase plan (ESPP)shares. In addition, our Board of Directors andshareholders may, from time to time, approve fully vestedstock awards. The Organization and CompensationCommittee of the Board of Directors (the CompensationCommittee) has responsibility for the approval andoversight of our stock-based compensation plans.
On January 25, 2019, our shareholders approved theFranklin Covey Co. 2019 Omnibus Incentive Plan (the2019 Plan), which authorized an additional 700,000 sharesof common stock for issuance to employees and membersof the Board of Directors as stock-based payments. Amore detailed description of the 2019 Plan is set forth inour Definitive Proxy Statement filed with the SEC onDecember 20, 2018. At August 31, 2019, the 2019 Planhad approximately 662,000 shares available for futuregrants.
At the annual meeting of shareholders held on January 26,2018, our shareholders approved the Franklin Covey Co.2017 Employee Stock Purchase Plan (the 2017 ESPP). The2017 ESPP replaced the Franklin Covey Co. 2004 EmployeeStock Purchase Plan, which previously expired. The2017 ESPP authorized an additional 1.0 million shares,subject to certain adjustments, of our common stock forpurchase by ESPP participants. For further informationregarding the 2017 ESPP, including the full text of the 2017ESPP, please refer to our definitive Proxy Statement asfiled with the SEC on December 22, 2017. At August 31,2019, the 2017 ESPP had approximately 903,000 sharesremaining for purchase by plan participants.
The total compensation expense of our stock-basedcompensation plans was as follows (in thousands):
YEAR ENDEDAUGUST 31, 2019 2018 2017Performance awards $3,853 $2,034 $2,902Restricted stock awards 700 642 500Fully vested stock awards 60 15 135Compensation cost of the
ESPP 176 155 121$4,789 $2,846 $3,658
The compensation expense of our stock-basedcompensation plans was included in selling, general, andadministrative expenses in the accompanying consolidatedstatements of operations, and no stock-basedcompensation was capitalized during the fiscal yearspresented in this report. We recognize forfeitures ofstock-based compensation instruments as they occur.
During fiscal 2019, we issued 72,787 shares of our commonstock from shares held in treasury for various stock-basedcompensation arrangements. Our stock-basedcompensation plans allow shares to be withheld from theaward to pay statutory income tax liabilities. We withheld561 shares of our common stock (Note 10) for statutoryincome taxes during fiscal 2019.
The following is a description of our stock-basedcompensation plans.
Performance Awards
The Compensation Committee has awarded variousperformance-based stock compensation awards tomembers of our senior management as long-termincentive plan (LTIP) compensation. These awards vestto the participants based upon the achievement ofspecified performance criteria. Compensation expense isrecognized as we determine it is probable that the shareswill vest. Adjustments to compensation expense to reflectthe timing of and the number of shares expected to beawarded are made on a cumulative basis at the date of theadjustment. We reevaluate the likelihood of sharesvesting under performance awards at each reportingdate.
Due to the significant change in our business resultingfrom sales of the All Access Pass, on October 18, 2016, theCompensation Committee approved a modification topreviously issued performance awards to include thechange in deferred revenue, less certain costs, in adjustedearnings before interest, taxes, depreciation, andamortization (Adjusted EBITDA) in the vestingcalculations. The incremental compensation expenserecorded in fiscal 2017 as a result of this modification wasapproximately $0.6 million.
No LTIP awards vested to participants during fiscal 2019.The following is a description of our performance-basedLTIP awards as of August 31, 2019.
Fiscal 2019 LTIP Award – On October 1, 2018, theCompensation Committee granted a newperformance-based LTIP award to our executive officersand members of senior management. The fiscal 2019 LTIPaward has three tranches, which consist of the following:1) shares that vest after three years of service; 2) theachievement of certain levels of fiscal 2021 qualifiedAdjusted EBITDA; and 3) fiscal 2021 subscription servicesales. Twenty-five percent of a participant’s award vestsafter three years of service, and the number of sharesawarded in this tranche will not fluctuate based on
Franklin Covey 2019 Annual Report Notes to Consolidated Financial Statements 118

financial measures. The number of shares granted in thistranche totals 36,470 shares. The remaining two tranchesof the award are divided between the achievement ofcertain levels of Adjusted EBITDA and subscription salesrecognized in fiscal 2021. The number of shares thatwill vest to participants for these two tranches is variableand may be 50 percent of the award (minimum awardthreshold) up to 200 percent of the participant’s award(maximum threshold). The maximum number of sharesthat may be awarded in connection with these tranchestotals 218,818 shares. The fiscal 2019 LTIP has a three-yearlife and expires on August 31, 2021.
Fiscal 2019 Time-Based Award – On January 25, 2019,the Compensation Committee approved a new incentiveplan award for the Chief Executive Officer, Chief FinancialOfficer, and Chief People Officer that has a two-yeartime-based vesting (service) condition. A total of 11,915shares were issued to the participants in connection withthis award. The fair value of this award was calculatedby multiplying the number of shares times the closingprice of the Company’s common stock on the grant date,which was $24.54 per share. The fair value of this awardtotals $0.3 million, which is being expensed evenly over thetwo-year service period.
Fiscal 2018 LTIP Award – On November 14, 2017, theCompensation Committee granted a performance-basedLTIP award to our executive officers and members ofsenior management similar to the fiscal 2019 LTIP awarddescribed above. The fiscal 2018 LTIP award has threetranches, which consist of the following: 1) shares that vestafter three years of service; 2) the achievement of certainlevels of fiscal 2020 qualified Adjusted EBITDA; and3) fiscal 2020 subscription service sales. Twenty-fivepercent of a participant’s award vests after three years ofservice, and the number of shares awarded in this tranchewill not fluctuate based on financial measures. Thenumber of shares granted in this tranche totals42,883 shares. The remaining two tranches of the awardare divided between the achievement of specified levels ofAdjusted EBITDA and subscription sales recognized infiscal 2020. The number of shares that will vest toparticipants for these two tranches is variable and may be50 percent of the award up to 200 percent of theparticipant’s award. The maximum number of shares thatmay be awarded in connection with these tranchestotals 257,300 shares. The fiscal 2018 LTIP has a three-yearlife and expires on August 31, 2020.
Fiscal 2017 LTIP Award – On October 18, 2016, theCompensation Committee granted performance-basedawards for our executive officers and members of seniormanagement. A total of 183,381 shares may be earned bythe participants based on six individual vesting conditionsthat are divided into two performance measures, trailingfour-quarter Adjusted EBITDA and trailing four-quartergross All Access Pass sales. As of August 31, 2019, fourtranches of this award have vested, totaling 97,803 shares.The 2017 LTIP has a six-year life and expires on August 31,2022.
Fiscal 2016 LTIP Award – The fiscal 2016 LTIP wasgranted on November 12, 2015, to our executive officersand members of senior management. A total of 231,276shares may be awarded to the participants based onsix individual vesting conditions that are divided into twoperformance measures, trailing four-quarter AdjustedEBITDA and increased sales of OrganizationalDevelopment Suite (OD Suite) offerings. The OD Suite isdefined as Leadership, Productivity, and Trust practicesales. As of August 31, 2019, four tranches of the fiscal2016 LTIP have vested to participants, totaling 123,348shares. The 2016 LTIP has a six-year life and expireson August 31, 2021.
Fiscal 2015 LTIP Award – During fiscal 2015, theCompensation Committee granted a performance-basedaward for our executive officers and certain membersof senior management. A total of 112,464 shares may beawarded to the participants based on six individual vestingconditions that are divided into two performancemeasures, trailing four-quarter Adjusted EBITDA andincreased sales of OD Suite sales. As of August 31, 2019,a total of 59,980 shares, or four tranches, of the fiscal 2015LTIP have vested to participants. The 2015 LTIP has asix-year life and expires on August 31, 2020.
Fiscal 2014 LTIP Award – During the first quarter offiscal 2014, the Compensation Committee grantedperformance-based equity awards to our executive officers.A total of 89,418 shares may have been awarded to theparticipants based on six individual vesting conditions thatare divided into two performance measures, trailingfour-quarter Adjusted EBITDA and trailing four-quarterincreased sales of courses related to The 7 Habits of HighlyEffective People. As of August 31, 2019, four tranches ofthe fiscal 2014 LTIP, totaling 47,690 shares, have vested toparticipants. The fiscal 2014 LTIP award had a six-yearlife that ended on August 31, 2019, and the remainingaward tranches, totaling 41,728 shares, expired unvestedto the participants.
119 Notes to Consolidated Financial Statements Franklin Covey 2019 Annual Report

Restricted Stock Awards
The annual Board of Director restricted stock award,which is administered under the terms of the FranklinCovey Co. 2019 Omnibus Incentive Plan, is designed toprovide our non-employee directors, who are not eligibleto participate in our employee stock purchase plan, anopportunity to obtain an interest in the Company throughthe acquisition of shares of our common stock. Eacheligible director is entitled to receive a whole-share grantequal to $100,000 with a one-year vesting period, whichis generally granted in January (following the AnnualShareholders’ Meeting) of each year. Shares granted underthe terms of this annual award may not be voted orparticipate in any common stock dividends until they arevested.
Under the terms of this program, we issued 28,525 shares,23,338 shares, and 29,834 shares of our common stockto eligible members of the Board of Directors during thefiscal years ended August 31, 2019, 2018, and 2017.The fair value of shares awarded to the directors was$0.7 million in each of fiscal 2019 and fiscal 2018 and$0.5 million in fiscal 2017 as calculated on the grant dateof the awards. The corresponding compensation cost isrecognized over the vesting period of the awards, which isone year. The cost of the common stock issued fromtreasury for these awards was $0.4 million in fiscal 2019,$0.3 million in fiscal 2018, and $0.4 million in fiscal 2017.The following information applies to our restrictedstock awards for the fiscal year ended August 31, 2019:
Number ofShares
Weighted-Average Grant-
Date FairValue Per
ShareRestricted stock awards at
August 31, 2018 23,338 $30.00Granted 28,525 24.54Forfeited – –Vested (23,338) 30.00Restricted stock awards at
August 31, 2019 28,525 $24.54
At August 31, 2019, there was $0.2 million of unrecognizedcompensation cost related to restricted stock awards,which is expected to be recognized over the remainingweighted-average vesting period of four months. The totalrecognized income tax benefit from restricted stockawards totaled $0.2 million for each of the years endedAugust 31, 2019, 2018, and 2017. The intrinsic value of ourrestricted stock awards at August 31, 2019 was $1.0 million.
Stock Options
We have an incentive stock option plan whereby optionsto purchase shares of our common stock may be issued tokey employees at an exercise price not less than the fairmarket value of the Company’s common stock on the dateof grant. Information related to our stock option activityduring the fiscal year ended August 31, 2019 is presentedbelow:
Number of StockOptions
Weighted Avg.ExercisePrice Per
Share
Weighted AverageRemaining Contractual
Life (Years)
AggregateIntrinsic Value
(thousands)Outstanding at August 31, 2018 568,750 $11.67Granted – –Exercised – –Forfeited – –Outstanding at August 31, 2019 568,750 $11.67 0.8 $14,287Options vested and exercisable at August 31,
2019 568,750 $11.67 0.8 $14,287
At August 31, 2019, there was no remaining unrecognizedcompensation expense related to our stock options andno options were exercised during either fiscal 2019 or2018. During fiscal 2017, we had 62,500 stock optionsexercised on a net share basis, which had an intrinsic valueof $0.5 million.
The following additional information applies to our stockoptions outstanding at August 31, 2019:
Franklin Covey 2019 Annual Report Notes to Consolidated Financial Statements 120

Exercise Prices
NumberOutstanding atAugust 31, 2019
Weighted AverageRemaining
Contractual Life(Years)
Weighted AverageExercise Price
OptionsExercisable at
August 31, 2019Weighted Average
Exercise Price$ 9.00 62,500 1.4 $ 9.00 62,500 $ 9.00$10.00 168,750 0.8 $10.00 168,750 $10.00$12.00 168,750 0.8 $12.00 168,750 $12.00$14.00 168,750 0.8 $14.00 168,750 $14.00
568,750 568,750
Fully Vested Stock Awards
We have a stock-based incentive program that is designedto reward our client partners and training consultantsfor exceptional long-term performance. The programgrants shares of our common stock with a total value of$15,000 to each client partner who has sold over$20.0 million in cumulative sales and to each trainingconsultant who has delivered over 1,500 days of trainingduring their career. During fiscal 2019, four individualsqualified for this award; one individual qualified for thisaward in fiscal 2018; and nine individuals qualified for thisaward in fiscal 2017.
Employee Stock Purchase Plan
We have an employee stock purchase plan that offersqualified employees the opportunity to purchase sharesof our common stock at a price equal to 85 percent of theaverage fair market value of our common stock on thelast trading day of each quarter. ESPP participantspurchased a total of 43,073 shares, 40,941 shares, and43,199 shares during the fiscal years ended August 31,2019, 2018, and 2017, which had a corresponding costbasis of $0.6 million each year. We received cash proceedsfor these shares from ESPP participants totaling$1.0 million during fiscal 2019; $0.8 million in fiscal 2018;and $0.7 million during fiscal 2017.
13. Contract Termination andRestructuring CostsContract Termination Costs
During fiscal 2017, we entered into a new 10-year licenseagreement for Education practice content in a foreigncountry, with minimum required royalties payable to ustotaling approximately $13 million over the life of thearrangement. Under a previously existing profit-sharingagreement, we would have been obligated to pay one-thirdof the new minimum royalty stream plus one-third of
any royalties in excess of the contractual minimums tothe licensee that owns the rights for that country. Inexchange for a $1.5 million cash payment, we terminatedthe previously existing profit-sharing agreement andwe will not owe any further profit sharing-payments tothe international licensee. Based on the guidance forcontract termination costs, we expensed the $1.5 millionpayment during fiscal 2017.
Restructuring Costs
During the third quarter of fiscal 2017, we determined toexit the publishing business in Japan and restructuredour U.S./Canada direct office operations in order tosupport new sales and renewals of the All Access Pass.We expensed $3.6 million related to these changes duringfiscal 2017 as described below. The majority of thesecosts were attributable to our Direct Offices segment.
Exit Japan Publishing Business
Due to a change in strategy designed to focus resourcesand efforts on sales of the All Access Pass in Japan,and declining sales and profitability of the publishingbusiness, we decided to exit the publishing business inJapan. As a result of this determination, we wrote off themajority of our book inventory located in Japan for$2.1 million, which was recorded as a component of costof sales in the accompanying consolidated statementsof operations for fiscal 2017.
U.S./Canada Direct Office Restructuring
We restructured the operations of our U.S/Canada directoffices to create new smaller regional teams which arefocused on selling the All Access Pass, helping clientsstrategically implement the AAP, and providing servicesto further develop long-term client relationships.Accordingly, we determined that our three remainingsales offices located in Atlanta, Georgia; Irvine, California;and Chicago, Illinois were unnecessary since most clientpartners work from home-based offices; restructured the
121 Notes to Consolidated Financial Statements Franklin Covey 2019 Annual Report

operations of the Sales Performance and WinningCustomer Loyalty Practices; and eliminated certainfunctions to reduce costs in future periods. The$1.5 million restructuring charge associated with theseoperational changes was comprised of the following(in thousands):
Description AmountSeverance costs $ 986Office closure costs 496
$1,482
At each of August 31, 2019, and August 31, 2018, we hadaccrued office closure costs totaling $0.1 million, whichare included as components of accrued liabilities onthe accompanying consolidated balance sheets. All of theseverance costs associated with this restructuring planwere paid as of August 31, 2017.
14. Employee Benefit PlansProfit Sharing Plans
We have defined contribution profit sharing plans for ouremployees that qualify under Section 401(k) of theInternal Revenue Code. These plans provide retirementbenefits for employees meeting minimum age and servicerequirements. Qualified participants may contribute upto 75 percent of their gross wages, subject to certainlimitations. These plans also provide for matchingcontributions to the participants that are paid by theCompany. The matching contributions, which wereexpensed as incurred, totaled $2.2 million, $2.1 million,and $1.9 million during the fiscal years ended August 31,2019, 2018, and 2017. We do not sponsor or participatein any defined-benefit pension plans.
Non-Qualified Deferred Compensation Plan
We had a non-qualified deferred compensation (NQDC)plan that provided certain key officers and employeesthe ability to defer a portion of their compensation until alater date. Deferred compensation amounts used to paybenefits were held in a “rabbi trust,” which invested ininsurance contracts, various mutual funds, and shares ofour common stock as directed by the plan participants.However, due to legal changes resulting from theAmerican Jobs Creation Act of 2004, we determined tocease compensation deferrals to the NQDC plan afterDecember 31, 2004. Following the cessation of deferralsto the NQDC plan, the number of participants remainingin the plan declined steadily, and our Board of Directors
decided to partially terminate the NQDC plan. Followingthis decision, all of the plan’s assets were liquidated, theplan’s liabilities were paid, and the only remaining items inthe NQDC plan are shares of our common stock ownedby the remaining plan participants. At August 31, 2019 and2018, the cost basis of the shares of our common stockheld by the rabbi trust was $0.2 million. Shares of ourcommon stock held in the rabbi trust are included ascomponents of treasury stock on the accompanyingconsolidated balance sheets.
15. Income Taxes
Our benefit (provision) for income taxes consisted of thefollowing (in thousands):
YEAR ENDEDAUGUST 31, 2019 2018 2017Current:
Federal $ 93 $ 29 $ 69State (14) 210 (71)Foreign (2,745) (2,947) (2,320)
(2,666) (2,708) (2,322)Deferred:
Federal 3,112 1,426 (1,227)State 102 (314) (17)Foreign (120) (281) 468Operating loss carryforward (1,625) 2,636 6,964Adjustment for changes in
U.S. income tax rates – 1,654 –Valuation allowance (418) (2,780) (129)
1,051 2,341 6,059$(1,615) $ (367) $ 3,737
The allocation of our total income tax benefit (provision)is as follows (in thousands):
YEAR ENDEDAUGUST 31, 2019 2018 2017Net income (loss) $(1,615) $(367) $3,737Other comprehensive income (5) (75) 37
$(1,620) $(442) $3,774
Income (loss) before income taxes consisted of thefollowing (in thousands):
YEAR ENDEDAUGUST 31, 2019 2018 2017United States $(1,910) $(8,960) $(10,126)Foreign 2,502 3,440 (783)
$ 592 $(5,520) $(10,909)
Franklin Covey 2019 Annual Report Notes to Consolidated Financial Statements 122

The differences between income taxes at the statutoryfederal income tax rate and the consolidated income taxrate reported in our consolidated statements of operationswere as follows:
YEAR ENDEDAUGUST 31, 2019 2018 2017Federal statutory income tax
rate (21.0)% 25.7% 35.0%State income taxes, net of
federal effect (5.4) 2.6 2.3Effect of change in U.S. federal
tax rate – 30.0 –Valuation allowance (70.8) (50.4) (1.2)Foreign jurisdictions tax
differential (72.8) (6.8) (1.9)Tax differential on income
subject to both U.S. andforeign taxes (64.7) 2.3 0.4
Uncertain tax positions 34.0 (5.1) 4.4Non-deductible executive
compensation (8.8) (2.7) (1.6)Non-deductible meals and
entertainment (52.9) (8.9) (2.2)Payout of deferred
compensation (NQDC) 0.3 4.4 –Other (10.7) 2.2 (0.9)
(272.8)% (6.7)% 34.3%
The Tax Cut and Jobs Act (the 2017 Tax Act) was signedinto law on December 22, 2017. The 2017 Tax Actsignificantly revises the U.S. corporate income tax codeby, among other things, lowering the statutory corporatetax rate from 35 percent to 21 percent; eliminatingcertain deductions; imposing a mandatory one-timetransition tax, or deemed repatriation tax, on accumulatedearnings of foreign subsidiaries as of 2017 that werepreviously tax deferred; introducing new tax regimes;and changing how foreign earnings are subject to U.S. tax.
Since we have an August 31 fiscal year end, the lowercorporate income tax rate was phased in, resulting in aU.S. statutory federal rate of 25.7 percent for fiscal 2018and 21 percent rate for fiscal 2019 and subsequent years.Other provisions of the 2017 Tax Act became effectivefor us in fiscal 2019, including limitations on thedeductibility of interest and executive compensation aswell as anti-deferral provisions on Global IntangibleLow-Taxed Income (GILTI). We have elected to treattaxes due on future U.S. inclusions in taxable incomerelated to GILTI as a current period expense whenincurred (the “period cost method”).
During fiscal 2019, we recorded income tax expense of$0.3 million under the GILTI provisions. We also recorded$0.1 million of tax expense resulting from limitationsadded by the 2017 Tax Act on the deductibility of executivecompensation.
In fiscal 2018, we recorded income tax benefits totaling$1.7 million, including a one-time income tax benefitof $0.9 million as of the date of enactment. We recognized$0.8 million of the one-time benefit from re-measuringour net deferred tax liabilities at the reduced U.S. federaltax rate and $0.2 million of the benefit from otherchanges enacted by the 2017 Tax Act. These benefitswere partially offset by $0.1 million of expense from thedeemed repatriation of accumulated earnings fromour foreign subsidiaries.
On September 1, 2017, we adopted the provisions ofASU 2016-09, which requires that the benefits ofdeductions resulting from stock-based compensation inexcess of the corresponding book expense be recorded asa component of our income tax provision or benefit forthe period, instead of being recorded to additional paid-incapital. We recorded income tax expense of $0.1 millionin fiscal 2019 and an immaterial amount of income taxexpense in fiscal 2018 for stock-based compensationdeductions that were less than the corresponding bookexpense. We recorded $0.2 million to paid-in capitalin fiscal 2017 for excess tax deductions.
The significant components of our deferred tax assetsand liabilities were as follows (in thousands):
AUGUST 31, 2019 2018Deferred income tax assets:Net operating loss carryforward $ 7,516 $ 9,039Foreign income tax credit carryforward 8,140 6,562Sale and financing of corporate
headquarters 4,431 4,919Stock-based compensation 1,973 1,174Bonus and other accruals 1,622 1,511Inventory and bad debt reserves 1,376 1,046Deferred revenue 829 236Other 264 323Total deferred income tax assets 26,151 24,810Less: valuation allowance (3,815) (3,397)Net deferred income tax assets 22,336 21,413
123 Notes to Consolidated Financial Statements Franklin Covey 2019 Annual Report

AUGUST 31, 2019 2018Deferred income tax liabilities:Intangibles step-ups – indefinite lived (5,424) (5,427)Intangibles step-ups – finite lived (3,406) (4,103)Intangible asset impairment and
amortization (2,906) (3,023)Property and equipment depreciation (2,880) (3,518)Deferred commissions (2,056) (1,596)Unremitted earnings of foreign
subsidiaries (456) (380)Other (343) (354)Total deferred income tax liabilities (17,471) (18,401)Net deferred income taxes $ 4,865 $ 3,012
Deferred income tax amounts are recorded as follows inour consolidated balance sheets (in thousands):
AUGUST 31, 2019 2018Long-term assets $5,045 $3,222Long-term liabilities (180) (210)
Net deferred income tax asset $4,865 $3,012
As of August 31, 2016, we had utilized all of our U.S.federal net operating loss carryforwards. However, weincurred a federal net operating loss of $16.4 million infiscal 2017 and acquired a federal net operating losscarryforward of $7.7 million in connection with thepurchase of the stock of Jhana Education (Note 3) in fiscal2017. During fiscal 2018, we incurred a federal netoperating loss of $9.7 million ($10.5 million after returnto provision adjustments). We utilized $8.6 million of ourU.S. federal net operating loss carryforward duringfiscal 2019. Our U.S. federal net operating losscarryforwards were comprised of the following atAugust 31, 2019 (in thousands):
Loss Carryforwardfor Year Ended
LossExpires
August 31, Amount
LossDeductions
in Prior Years
LossDeductions
in Current Year
OperatingLoss Carried
ForwardDecember 31, 2012 2031 $ 243 $ – $ (243) $ –December 31, 2013 2032 553 – (553) –December 31, 2014 2033 1,285 – (1,019) 266December 31, 2015 2034 1,491 – – 1,491December 31, 2016 2035 3,052 – – 3,052July 15, 2017 Acquired NOL 2036 1,117 – – 1,117
7,741 – (1,815) 5,926August 31, 2017 2037 16,361 – (6,834) 9,527August 31, 2018 No expiration 10,506 – – 10,506
$34,608 $ – $(8,649) $25,959
We have U.S. state net operating loss carryforwardsgenerated in fiscal 2009 and before in various jurisdictionsthat expire primarily between September 1, 2019 andAugust 31, 2029. The U.S. state net operating losscarryforwards generated in fiscal 2017 and fiscal 2018primarily expire on August 31, 2037 and 2038, respectively.The state net operating loss carryforwards acquired
through the purchase of Jhana Education stock expirebetween August 31, 2031 and August 31, 2036.
Our U.S. foreign income tax credit carryforwards werecomprised of the following at August 31, 2019 (inthousands):
Credit Generatedin Fiscal Year Ended August 31,
Credit ExpiresAugust 31,
CreditsGenerated
Credits Used inPrior Years
Credits Used inFiscal 2019
Credits CarriedForward
2011 2021 $ 3,445 $ (414) $ – $3,0312012 2022 2,563 (2,563) – –2013 2023 2,815 (2,815) – –2014 2024 1,378 (1,378) – –2015 2025 1,422 (1,422) – –2016 2026 1,569 (1,569) – –2017 2027 1,804 – – 1,8042018 2028 1,727 – – 1,7272019 2029 1,578 – – 1,578
$18,301 $(10,161) $ – $8,140
Franklin Covey 2019 Annual Report Notes to Consolidated Financial Statements 124

In fiscal 2018, we established a valuation allowance of$3.0 million against our foreign tax credit carryforwardfrom fiscal 2011, after concluding it is more likely than notthat the carryforward will expire unused at the end offiscal 2021. Our emphasis of the All Access Pass hasgenerated, and will likely continue to generate, substantialamounts of deferred revenue for both book and taxpurposes. This situation has produced U.S. domesticpre-tax losses for the past three fiscal years and amore-likely-than-not presumption that insufficient taxableincome will be available to realize the fiscal 2011 foreigntax carryforward, which expires at the end of fiscal 2021.
During a prior year, we determined it was more likelythan not that deferred tax assets of a foreign subsidiarywould not be realized. Accordingly, we recorded a$0.3 million valuation allowance against these deferredtax assets. During fiscal 2017, we increased this valuationallowance by $0.1 million to $0.4 million, which reducedour income tax benefit for the year by $0.1 million. Duringfiscal 2018, we reduced this valuation allowance by$0.2 million, which increased our income tax benefit forthe year by $0.2 million. During fiscal 2019, we concludedthat it was more likely than not that the subsidiary’sfuture taxable income would be sufficient to utilize theremaining deferred income tax assets, so we reversed thebalance of the valuation allowance, which resulted in anincome tax benefit of $0.2 million.
We acquired federal and state net operating losscarryforwards in connection with the purchase of JhanaEducation stock during fiscal 2017. Section 382 of theInternal Revenue Code limits our ability to use theseacquired losses. Accordingly, we recorded valuationallowances in the amount of $0.2 million against therelated deferred tax assets. Our income tax benefit forfiscal 2017 was unaffected by this valuation allowance. Thereduction of the federal income tax rate under the 2017Tax Act reduced this valuation allowance by $0.1 millionand resulted in a corresponding increase to our incometax benefit during fiscal 2018.
During fiscal 2019, we determined that it was more likelythan not that deferred income tax assets of certainforeign subsidiaries would not be realized. Accordingly,we recorded a $0.7 million valuation allowance againstthese deferred income tax assets.
We have determined that projected future taxable incomeis adequate to allow for realization of all deferred taxassets, except for the assets subject to valuationallowances. We considered sources of taxable income,including reversals of taxable temporary differences,
future taxable income exclusive of reversing temporarydifferences and carryforwards, and reasonable, practicaltax-planning strategies to generate additional taxableincome. Based on the factors described above, weconcluded that realization of our deferred tax assets,except those subject to the valuation allowances describedabove, is more likely than not at August 31, 2019.
A reconciliation of the beginning and ending amount ofgross unrecognized tax benefits is as follows (inthousands):YEAR ENDEDAUGUST 31, 2019 2018 2017Beginning balance $2,111 $2,359 $3,024Additions based on tax
positions related to thecurrent year 157 27 10
Additions for tax positions inprior years 7 367 85
Reductions for tax positions ofprior years resulting fromthe lapse of applicablestatute of limitations (370) (253) (634)
Other reductions for taxpositions of prior years (10) (389) (126)
Ending balance $1,895 $2,111 $2,359
The total amount of unrecognized tax benefits that, ifrecognized, would affect the effective tax rate is$1.6 million at August 31, 2019, and $1.8 million atAugust 31, 2018. Included in the ending balance of grossunrecognized tax benefits at August 31, 2019 is$1.7 million related to individual states’ net operatingloss carryforwards. Interest and penalties related touncertain tax positions are recognized as components ofincome tax expense. The net accruals and reversals ofinterest and penalties increased or decreased our incometax expense by an insignificant amount in each of fiscal2019, fiscal 2018 and fiscal 2017. The balance of interestand penalties included in other long-term liabilities on ourconsolidated balance sheets at each of August 31, 2019and 2018 was $0.2 million.
During the next 12 months, we expect a decrease inunrecognized tax benefits totaling $0.2 million relating tonon-deductible expenses and state net operating lossdeductions upon the lapse of the applicable statuteof limitations.
We file United States federal income tax returns as wellas income tax returns in various states and foreign
125 Notes to Consolidated Financial Statements Franklin Covey 2019 Annual Report

jurisdictions. The tax years that remain subject toexaminations for our major tax jurisdictions are shownbelow.
2012 – 2019 Canada and Australia2013 – 2019 Japan2014 – 2019 Germany, Switzerland, and Austria2015 – 2019 United Kingdom2015 – 2019 United States – state and local income tax2016 – 2019 United States – federal income tax2016 – 2019 China2017 – 2019 Singapore
16. Earnings (Loss) Per Share
The following schedule shows the calculation of loss pershare for the periods presented (in thousands, exceptper-share amounts).
YEAR ENDEDAUGUST 31, 2019 2018 2017Numerator for basic and
diluted earnings per share:Net loss $ (1,023) $ (5,887) $ (7,172)Denominator for basic and
diluted earnings per share:Basic weighted average shares
outstanding 13,948 13,849 13,819Effect of dilutive securities:Stock options and other stock-
based awards – – –Diluted weighted average
shares outstanding 13,948 13,849 13,819EPS Calculations:Net loss per share:
Basic and diluted $ (0.07) $ (0.43) $ (0.52)
Since we incurred a net loss for the fiscal year endedAugust 31, 2019, no potentially dilutive securities wereincluded in the calculation of our loss per share becausethe inclusion of these securities would be antidilutive. Thenumber of dilutive securities that would have beenincluded at August 31, 2019 was approximately 0.2 millionshares. Other securities, including performance stock-based compensation instruments, may have a dilutiveeffect on our future EPS calculations if our financial resultsreach specified targets (Note 12).
17. Segment InformationReportable SegmentsOur sales are primarily comprised of training andconsulting services and our internal reporting structure
is comprised of three reportable operating segments anda corporate services group. Our internal reportingstructure and reportable segments are organized primarilyaround the client channels which produce the Company’srevenues. The following is a brief description of ourreportable segments:
• Direct Offices – This segment includes our salespersonnel that serve the United States and Canada; ourinternational sales offices located in Japan, China, theUnited Kingdom, Australia, and Germany, Switzerland,and Austria; our governmental sales channel; and ourpublic program operations.
• International Licensees – This segment is primarilycomprised of our international licensees’ royaltyrevenues.
• Education Practice – This group includes our domesticand international Education practice operations,which are focused on sales to educational institutions.
• Corporate and Other – Our corporate and otherinformation includes leasing operations, shipping andhandling revenues, and certain corporate administrativeexpenses.
We have determined that the Company’s chief operatingdecision maker continues to be the CEO, and the primarymeasurement tool used in business unit performanceanalysis is Adjusted EBITDA, which may not be calculatedas similarly titled amounts calculated by other companies.For reporting purposes, our consolidated AdjustedEBITDA can be calculated as our income or loss fromoperations excluding stock-based compensation, contracttermination costs, restructuring charges, depreciationexpense, amortization expense, and certain other itemssuch as adjustments for changes in the fair value ofcontingent consideration liabilities from businessacquisitions.
Our operations are not capital intensive and we do notown any manufacturing facilities or equipment.Accordingly, we do not allocate assets to the divisions foranalysis purposes. Interest expense and interest incomeare primarily generated at the corporate level and are notallocated. Income taxes are likewise calculated and paidon a corporate level (except for entities that operate inforeign jurisdictions) and are not allocated for analysispurposes.
All prior period segment information has been revised toconform to our current organizational structure, assignedresponsibilities, and primary internal reports. We account
Franklin Covey 2019 Annual Report Notes to Consolidated Financial Statements 126

for our segment information on the same basis as theaccompanying consolidated financial statements (inthousands).
Fiscal Year EndedAugust 31, 2019
Sales toExternal
CustomersGrossProfit
AdjustedEBITDA
Enterprise Division:Direct offices $157,754 $116,755 $19,455International
licensees 12,896 10,231 6,072170,650 126,986 25,527
Education Division 48,880 30,373 3,553Corporate and
eliminations 5,826 1,955 (8,474)Consolidated $225,356 $159,314 $20,606
Fiscal Year EndedAugust 31, 2018Enterprise Division:
Direct offices $145,890 $108,140 $13,254International
licensees 13,226 10,031 5,081159,116 118,171 18,335
Education Division 45,272 28,654 2,710Corporate and
eliminations 5,370 1,464 (9,167)Consolidated $209,758 $148,289 $11,878
Fiscal Year EndedAugust 31, 2017Enterprise Division:
Direct offices $122,309 $ 81,700 $ 4,242International
licensees 13,571 10,483 6,415135,880 92,183 10,657
Education Division 44,122 27,916 7,195Corporate and
eliminations 5,254 2,568 (10,153)Consolidated $185,256 $122,667 $ 7,699
A reconciliation of Adjusted EBITDA to consolidated netloss is provided below (in thousands):
YEAR ENDEDAUGUST 31, 2019 2018 2017Segment Adjusted EBITDA $29,080 $21,045 $ 17,852Corporate expenses (8,474) (9,167) (10,153)Consolidated Adjusted
EBITDA 20,606 11,878 7,699Stock-based compensation (4,789) (2,846) (3,658)Reduction (increase) in
contingent considerationliabilities (1,334) (1,014) 1,936
Costs to exit Japan publishingbusiness – – (2,107)
Contract termination costs – – (1,500)Restructuring costs – – (1,482)ERP system implementation
costs – (855) (1,404)Licensee transition costs (488) – (505)Business acquisition costs – – (442)Depreciation (6,364) (5,161) (3,879)Amortization (4,976) (5,368) (3,538)
Income (loss) fromoperations 2,655 (3,366) (8,880)
Interest income 37 104 223Interest expense (2,358) (2,676) (2,408)Accretion of discount on
related party receivable 258 418 156Income (loss) before income
taxes 592 (5,520) (10,909)Benefit (provision) for income
taxes (1,615) (367) 3,737Net loss $ (1,023) $ (5,887) $ (7,172)
Disaggregated Revenue
Our revenues are derived primarily from the UnitedStates. However, we also operate wholly owned offices orcontract with licensees to provide our services in variouscountries throughout the world. Our consolidated
127 Notes to Consolidated Financial Statements Franklin Covey 2019 Annual Report

revenues were derived from the following countries/regions (in thousands):
YEAR ENDEDAUGUST 31, 2019 2018 2017United States $166,696 $151,022 $136,206Japan 14,227 15,670 14,482China 13,586 14,176 11,552United Kingdom 7,763 7,411 4,754Canada 5,424 4,722 4,372Australia 3,690 4,148 2,704Western Europe 3,211 2,016 1,679Thailand 1,340 1,219 1,147Brazil 1,141 1,285 1,423Middle East 951 840 723Singapore 877 865 722Mexico/Central America 842 872 751Denmark/Scandinavia 710 752 775India 707 647 701Indonesia 696 715 614Central/Eastern Europe 637 757 638The Philippines 401 353 324Malaysia 356 338 364Others 2,101 1,950 1,325
$225,356 $209,758 $185,256
The following table presents our revenue disaggregatedby our significant revenue generating activities. Salesof services and products include training and consultingservices and related products such as training manuals.Subscription sales include revenues from our subscriptionservices such as the All Access Pass and Leader in Memembership. We receive royalty revenue from ourinternational licensees and from other sources such asbook publishing arrangements. Leases and other revenueis primarily comprised of lease revenues from sub-leasesfor space at our corporate headquarters campus and fromshipping and handling revenues (in thousands).
Fiscal Year EndedAugust 31, 2019
Services andProducts Subscriptions Royalties
Leases andOther Consolidated
Enterprise Division:Direct offices $102,557 $52,536 $ 2,661 $ – $157,754International licensees 2,439 – 10,457 – 12,896
104,996 52,536 13,118 – 170,650Education Division 23,779 22,151 2,950 – 48,880Corporate and eliminations – – – 5,826 5,826Consolidated $128,775 $74,687 $16,068 $5,826 $225,356
Fiscal Year EndedAugust 31, 2018Enterprise Division:
Direct offices $100,730 $42,465 $ 2,695 $ – $145,890International licensees 2,484 – 10,742 – 13,226
103,214 42,465 13,437 – 159,116Education Division 26,061 15,587 3,624 – 45,272Corporate and eliminations – – – 5,370 5,370Consolidated $129,275 $58,052 $17,061 $5,370 $209,758
Fiscal Year EndedAugust 31, 2017Enterprise Division:
Direct offices $ 99,616 $20,452 $ 2,241 $ – $122,309International licensees 2,938 – 10,633 – 13,571
102,554 20,452 12,874 – 135,880Education Division 31,017 10,440 2,665 – 44,122Corporate and eliminations – – – 5,254 5,254Consolidated $133,571 $30,892 $15,539 $5,254 $185,256
Franklin Covey 2019 Annual Report Notes to Consolidated Financial Statements 128

Other Geographic Information
At August 31, 2019, we had wholly owned direct officesin Australia, China, Japan, the United Kingdom, Germany,Switzerland, and Austria. Our long-lived assets, excludingintangible assets, goodwill, and the long-term portionof the related party receivable were held in the followinglocations for the periods indicated (in thousands):
AUGUST 31, 2019 2018United States/Canada $31,129 $34,237Japan 1,456 1,450China 441 581Singapore 370 315United Kingdom 207 276Australia 164 250Germany, Switzerland, and Austria 10 –
$33,777 $37,109
Inter-segment sales were immaterial for the periodspresented and were eliminated in consolidation.
18. Related Party TransactionsKnowledge Capital Investment Group
At each of August 31, 2019 and 2018, Knowledge CapitalInvestment Group (Knowledge Capital) held 2.8 millionshares of our common stock. Two members of our Boardof Directors, including our CEO, have an equity interestin Knowledge Capital.
FC Organizational Products
We own a 19.5 percent interest in FC OrganizationalProducts, LLC, an entity that purchased substantially allof our consumer solution business unit assets in fiscal 2008for the purpose of selling planners and relatedorganizational products under a comprehensive licensingagreement. On the date of the sale closing, we investedapproximately $1.8 million to purchase a 19.5 percentvoting interest in FCOP, and made a $1.0 million prioritycapital contribution with a 10 percent return. At thetime of the transaction, we determined that FCOP wasnot a variable interest entity.
As a result of FCOP’s structure as a limited liabilitycompany with separate owner capital accounts, wedetermined that our investment in FCOP is more thanminor and we are required to account for our investmentin FCOP using the equity method of accounting. Wehave not recorded our share of FCOP’s losses in the
accompanying consolidated statements of operationsbecause we have impaired and written off investmentbalances, as defined within the applicable accountingguidance, in previous periods in excess of our share ofFCOP’s losses through August 31, 2019.
Due to significant operating losses incurred after theestablishment of FCOP, we reconsidered whether FCOPwas a variable interest entity as defined under ASC810, and determined that FCOP was a variable interestentity. We further determined that we are not the primarybeneficiary of FCOP because we do not have the abilityto direct the activities that most significantly impactFCOP’s economic performance, which primarily consistof the day-to-day sale of planning products and relatedaccessories, and we do not have an obligation to absorblosses or the right to receive benefits from FCOP thatcould potentially be significant.
The operations of FCOP are primarily financed by thesale of planning products and accessories, and our primaryexposure related to FCOP is from amounts owed to usby FCOP. We receive reimbursement from FCOP forcertain operating costs and rental payments for the officespace that FCOP occupies. We classify our receivablesfrom FCOP based upon expected payment. Receivablesfrom FCOP are reported as components of other currentand other long-term assets based on their expectedpayment dates and consisted of the following (inthousands):
AUGUST 31, 2019 2018Other current assets $999 $1,123Other long-term assets – 411
$999 $1,534
During the past few years, we received larger paymentsfrom FCOP on our receivables than previously anticipated.Based on the payments received during fiscal 2019 andamounts expected to be received during fiscal 2020,all remaining receivables from FCOP at August 31, 2019are now classified as current assets. Accordingly, weaccelerated the accretion of the remaining discount onthese receivables during fiscal 2019, which totaled$0.2 million. The amounts receivable from FCOP atAugust 31, 2018 are presented net of a $0.3 milliondiscount.
On November 4, 2019, FCOP sold substantially all of itsassets to Franklin Planner Corporation (FPC), a newunrelated entity. FPC is expected to continue FCOP’sbusiness of selling planners and other related consumerproducts. In connection with this transaction, we
129 Notes to Consolidated Financial Statements Franklin Covey 2019 Annual Report

exchanged approximately $3.2 million of receivables,including $2.6 million of cash used by the Company topurchase FCOP’s bank debt on the transaction date, for anamended 30-year license agreement. The amendedlicense agreement grants the right to use certain of ourtrademarks and other intellectual property in connectionwith certain consumer products and provides us withminimum royalties of approximately $1.3 million per year.FPC assumed the amended master license agreementfrom FCOP upon the purchase of FCOP assets.
CoveyLink Acquisition and Contractual Payments
During fiscal 2009, we acquired the assets of CoveyLinkWorldwide, LLC (CoveyLink). CoveyLink conductstraining and provides consulting based upon the bookThe Speed of Trust by Stephen M.R. Covey, who is thebrother of one of our executive officers.
Prior to the acquisition date, CoveyLink had granted us anon-exclusive license for content related to The Speedof Trust book and related training courses for which wepaid CoveyLink specified royalties. As part of theCoveyLink acquisition, an amended and restated licensefor intellectual property was signed that granted us anexclusive, perpetual, worldwide, transferable, royalty-bearing license to use, reproduce, display, distribute, sell,prepare derivative works of, and perform the licensedmaterial in any format or medium and through any marketor distribution channel. We are required to pay StephenM.R. Covey royalties for the use of certain intellectualproperty developed by him. The amount expensedfor these royalties totaled $1.7 million, $1.8 million, and$1.5 million during the fiscal years ended August 31, 2019,2018, and 2017. As part of the acquisition of CoveyLink,we signed an amended license agreement as well as aspeaker services agreement. Based on the provisions ofthe speakers’ services agreement, we pay Stephen M.R.Covey a portion of the speaking revenues received for hispresentations. We expensed $1.2 million, $0.9 million,and $1.2 million for payment on these presentations
during the fiscal years ended August 31, 2019, 2018 and2017. We had $0.6 million and $0.7 million accruedfor these royalties and speaking fees at August 31, 2019and 2018, respectively, which were included ascomponents of accrued liabilities on our consolidatedbalance sheets.
Acquired License Rights for Intellectual Property
During the third quarter of fiscal 2017, we acquired thelicense rights for certain intellectual property ownedby Higher Moment, LLC for $0.8 million. The intellectualproperty is in part based on works authored and developedby Dr. Clayton Christensen, a well-known author andlecturer, who is a member of our Board of Directors.However, Dr. Christensen does not have an ownershipinterest in Higher Moment, LLC. The initial license periodis five years and the agreement may be renewed forsuccessive five-year periods for $0.8 million at eachrenewal date. The agreement may be terminated by eitherparty at any time, but if we choose to terminate theagreement prior to the third renewal date, we are requiredto pay $0.3 million to Higher Moment, LLC.
Other Related Party Transactions
We pay an executive officer of the Company a percentageof the royalty proceeds received from the sales of certainbooks authored by him in addition to his annual salary.During the fiscal years ended August 31, 2019, 2018, and2017, we expensed $0.1 million, $0.2 million, and$0.2 million for these royalties, and we had $0.1 millionaccrued at each of August 31, 2019 and 2018 as payableunder the terms of these arrangements. These amountsare included as components of accrued liabilities inour consolidated balance sheets.
We pay a company owned by the brother of a member ofour executive management team for the production ofvideo segments used in our offerings. During fiscal 2019,we paid $0.8 million to this company for servicesprovided.
Franklin Covey 2019 Annual Report Notes to Consolidated Financial Statements 130

ITEM 9. CHANGES IN AND DISAGREEMENTSWITH ACCOUNTANTS ON ACCOUNTING ANDFINANCIAL DISCLOSURE
None.
ITEM 9A. CONTROLS AND PROCEDURESDisclosure Controls and Procedures
Disclosure controls and procedures are designed with theobjective of ensuring that information required to bedisclosed in the Company’s reports filed under theExchange Act, such as this report, is recorded, processed,summarized, and reported within the time periodsspecified in the SEC’s rules and forms. Disclosure controlsand procedures are also designed with the objective ofensuring that such information is accumulated andcommunicated to the Company’s management, includingthe Company’s Chief Executive Officer and ChiefFinancial Officer, as appropriate, to allow timely decisionsregarding required disclosure.
Evaluation of Disclosure Controls and Procedures
An evaluation was conducted under the supervision andwith the participation of our management, includingthe Chief Executive Officer and Chief Financial Officer,of the effectiveness of the design and operation of ourdisclosure controls and procedures, as defined in Rules13a-15(e) and 15d-15(e) of the Exchange Act, as of the endof the period covered by this report.
Based on this evaluation, our Chief Executive Officer andour Chief Financial Officer concluded that, as of theend of the period covered by this report, our disclosurecontrols and procedures were effective.
Management’s Report on Internal Control Over FinancialReporting
The management of Franklin Covey Co. is responsible forestablishing and maintaining adequate internal controlover financial reporting for the Company (includingits consolidated subsidiaries) and all related informationappearing in the Company’s Annual Report on Form 10-K.The Company’s internal control over financial reportingis designed to provide reasonable assurance regarding thereliability of financial reporting and the preparation offinancial statements for external purposes in accordance
with accounting principles generally accepted in theUnited States of America. Internal control over financialreporting includes those policies and procedures that:
1. pertain to the maintenance of records that in reasonabledetail accurately and fairly reflect the transactionsand dispositions of our assets;
2. provide reasonable assurance that the transactions arerecorded as necessary to permit preparation offinancial statements in accordance with generallyaccepted accounting principles, and that our receiptsand expenditures are being made only in accordancewith the authorization of management and/or ofour Board of Directors; and
3. provide reasonable assurance regarding the preventionor timely detection of any unauthorized acquisition,use, or disposition of our assets that could have amaterial effect on our financial statements.
Because of its inherent limitations, internal control overfinancial reporting may not prevent or detectmisstatements. Also, projections of any evaluation ofeffectiveness in future periods are subject to the risk thatcontrols may become inadequate because of changes inconditions, or that the degree of compliance with thepolicies or procedures may deteriorate.
Under the supervision and with the participation of ourmanagement, including our Chief Executive Officerand Chief Financial Officer, we conducted an evaluationof the effectiveness of our internal control over financialreporting using the criteria set forth in InternalControl – Integrated Framework as issued by theCommittee of Sponsoring Organizations of the TreadwayCommission (2013 COSO Framework). Based upon thisevaluation, our management concluded that our internalcontrol over financial reporting was effective as of the endof the period covered by this Annual Report on Form10-K.
Our independent registered public accounting firm,Deloitte & Touche LLP, has audited the consolidatedfinancial statements included in this annual report onForm 10-K and, as part of their audit, has issued an auditreport, included herein, on the effectiveness of ourinternal control over financial reporting. Their report isincluded in Item 8 of this Report on Form 10-K.
Changes in Internal Control Over Financial Reporting
There were no changes in our internal control overfinancial reporting (as defined in Rule 13a-15(f ) or15d-15(f )) during the fourth quarter ended August 31,
131 Controls and Procedures Franklin Covey 2019 Annual Report

2019 that materially affected, or are reasonably likely tomaterially affect, our internal controls over financialreporting.
ITEM 9B. OTHER INFORMATION
None.
PART IIIITEM 10. DIRECTORS, EXECUTIVE OFFICERS ANDCORPORATE GOVERNANCE
Certain information required by this Item is incorporatedby reference to the sections entitled “Nominees forElection to the Board of Directors,” “DelinquentSection 16(a) Reports,” “Corporate Governance,” and“Board of Director Committees and Meetings” in ourdefinitive Proxy Statement for the annual meeting ofshareholders, which is scheduled to be held on January 24,2020. The definitive Proxy Statement will be filed withthe Securities and Exchange Commission pursuantto Regulation 14A of the Securities Exchange Act of 1934,as amended. Executive officer biographies may be foundin Item 1, under the section entitled “Information AboutOur Executive Officers,” of this report on Form 10-K.
The Board of Directors has determined that one of theAudit Committee members, Mr. Michael Fung, is a“financial expert” as defined in Regulation S-K 407(d)(5)adopted under the Securities Exchange Act of 1934, asamended. Our Board of Directors has also determined thatMr. Fung is an “independent director” as defined by theNYSE.
We have adopted a code of ethics for our senior financialofficers that include the Chief Executive Officer, theChief Financial Officer, and other members of ourfinancial leadership team. This code of ethics is availableon our website at www.franklincovey.com. We intendto satisfy any disclosure requirements under Item 5.05 ofForm 8-K regarding amendment to, or waiver from, aprovision of this Code of Business Conduct and Ethics byposting such information on our web site at the addressand location specified above.
ITEM 11. EXECUTIVE COMPENSATION
The information required by this Item is incorporated byreference to the sections entitled “CompensationDiscussion and Analysis,” “Compensation CommitteeInterlocks and Insider Participation,” and “CompensationCommittee Report” in our definitive Proxy Statementfor the annual meeting of shareholders, which is scheduledto be held on January 24, 2020.
ITEM 12. SECURITY OWNERSHIP OF CERTAIN BENEFICIAL OWNERS AND MANAGEMENT ANDRELATED STOCKHOLDER MATTERSSecurities Authorized for Issuance Under Equity Compensation Plans
[a] [b] [c]
Plan Category
Number of securities to beissued upon exercise of
outstanding options,warrants, and rights
Weighted-averageexercise price of
outstanding options,warrants, and rights
Number of securities remainingavailable for future issuance under
equity compensation plans (excludingsecurities reflected in column [a])
(in thousands) (in thousands)Equity compensation plans
approved by securityholders 1,347(1)(2) $11.67 1,565(3)(4)
(1) Excludes 28,525 shares of unvested (restricted) stock awards that are subject to forfeiture.
(2) Amount includes 778,605 performance share awards that may be awarded under the terms of various long-term incentive plans. The numberof shares eventually awarded to participants through our long-term incentive plans is variable and based upon the achievement of specifiedfinancial goals. For performance-based compensation awards where the number of shares may fluctuate within a range based on the achievementof the specified goal, this amount includes the maximum number of shares that may be awarded to participants. The actual number of sharesissued to participants therefore, may be less than the amount disclosed. The weighted average exercise price of outstanding options, warrants,and rights does not include the impact of performance awards or restricted stock units. For further information on our stock-based compensationplans, refer to the notes to our financial statements as presented in Item 8 of this report.
(3) Amount is comprised of the remaining shares authorized under our 2019 Omnibus Incentive Plan and 2017 Employee Stock Purchase Plan.The number of performance-based plan shares expected to be awarded at August 31, 2019 may change in future periods based upon theachievement of specified goals and revisions to estimates.
Franklin Covey 2019 Annual Report Form 10-K 132

(4) At August 31, 2019, we had approximately 903,000 shares authorized for purchase by participants in our Employee Stock Purchase Plan.
Beneficial Ownership of Company Stock
The remaining information required by this Item isincorporated by reference to the section entitled “PrincipalHolders of Voting Securities” in our definitive ProxyStatement for the annual meeting of shareholders, whichis scheduled to be held on January 24, 2020.
ITEM 13. CERTAIN RELATIONSHIPS AND RELATEDTRANSACTIONS, AND DIRECTOR INDEPENDENCE
The information required by this Item is incorporated byreference to the section entitled “Certain Relationshipsand Related Transactions” and “Corporate Governance”
in our definitive Proxy Statement for the annual meetingof shareholders, which is scheduled to be held onJanuary 24, 2020.
ITEM 14. PRINCIPAL ACCOUNTANT FEES ANDSERVICES
The information required by this Item is incorporated byreference to the section entitled “Principal AccountantFees” in our definitive Proxy Statement for the annualmeeting of shareholders, which is scheduled to be heldon January 24, 2020.
PART IVITEM 15. EXHIBITS AND FINANCIAL STATEMENT SCHEDULES
(a) List of documents filed as part of this report:
1. Financial Statements. The consolidated financial statements of the Company and Report of Independent RegisteredPublic Accounting Firm thereon included in the Annual Report to Shareholders on Form 10-K for the year endedAugust 31, 2019, are as follows:
Report of Independent Registered Public Accounting Firm
Consolidated Balance Sheets at August 31, 2019 and 2018
Consolidated Statements of Operations and Statements of Comprehensive Loss for the fiscal years endedAugust 31, 2019, 2018, and 2017
Consolidated Statements of Cash Flows for the fiscal years ended August 31, 2019, 2018, and 2017
Consolidated Statements of Shareholders’ Equity for the fiscal years ended August 31, 2019, 2018, and 2017
Notes to Consolidated Financial Statements
2. Financial Statement Schedules.
Other financial statement schedules are omitted because they are not required or applicable, or the requiredinformation is shown in the financial statements or notes thereto, or contained in this report.
3. Exhibit List.
ExhibitNo. Exhibit
IncorporatedBy Reference
FiledHerewith
2.1 Master Asset Purchase Agreement between Franklin Covey Products,LLC and Franklin Covey Co. dated May 22, 2008
(8)
2.2 Amendment to Master Asset Purchase Agreement between FranklinCovey Products, LLC and Franklin Covey Co. dated May 22, 2008
(9)
133 Form 10-K Franklin Covey 2019 Annual Report

ExhibitNo. Exhibit
IncorporatedBy Reference
FiledHerewith
3.1 Articles of Restatement dated March 4, 2005 amending and restating theCompany’s Articles of Incorporation
(4)
3.2 Amendment to Amended and Restated Articles of Incorporation ofFranklin Covey (Appendix C)
(7)
3.3 Amended and Restated Bylaws of Franklin Covey Co. (15)
4.1 Specimen Certificate of the Registrant’s Common Stock, par value $.05per share
(2)
4.2 Stockholder Agreements, dated May 11, 1999 and June 2, 1999 (3)
4.3 Registration Rights Agreement, dated June 2, 1999 (3)
4.4 Amended and Restated Shareholders Agreement, dated as of March 8,2005, between the Company and Knowledge Capital Investment Group
(4)
4.5 Amended and Restated Registration Rights Agreement, dated as ofMarch 8, 2005, between the Company and Knowledge CapitalInvestment Group
(4)
4.6 Description of Securities Registered Under Section 12 of the ExchangeAct
(31)
10.1* Forms of Nonstatutory Stock Options (1)
10.2 Master Lease Agreement, dated June 17, 2005, between FranklinSaltLake LLC (Landlord) and Franklin Development Corporation(Tenant)
(5)
10.3 Purchase and Sale Agreement and Escrow Instructions between LevyAffiliated Holdings, LLC (Buyer) and Franklin DevelopmentCorporation (Seller) and Amendments
(5)
10.4 Redemption Extension Voting Agreement between Franklin Covey Co.and Knowledge Capital Investment Group, dated October 20, 2005
(6)
10.5 Master License Agreement between Franklin Covey Co. and FranklinCovey Products, LLC
(10)
10.6 Master Shared Services Agreement between The Franklin CoveyProducts Companies and the Shared Services Companies
(10)
10.7 Amended and Restated Operating Agreement of Franklin CoveyProducts, LLC
(10)
10.8 Sublease Agreement between Franklin Development Corporation andFranklin Covey Products, LLC
(10)
10.9 Sub-Sublease Agreement between Franklin Covey Co. and FranklinCovey Products, LLC
(10)
Franklin Covey 2019 Annual Report Form 10-K 134
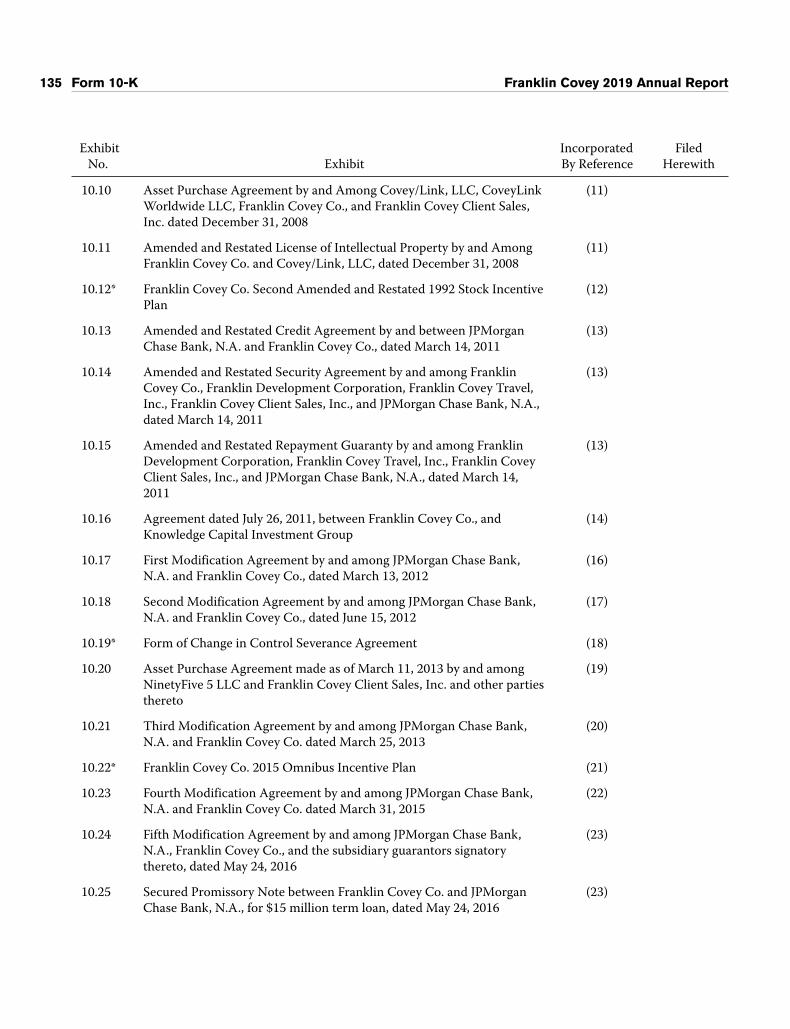
ExhibitNo. Exhibit
IncorporatedBy Reference
FiledHerewith
10.10 Asset Purchase Agreement by and Among Covey/Link, LLC, CoveyLinkWorldwide LLC, Franklin Covey Co., and Franklin Covey Client Sales,Inc. dated December 31, 2008
(11)
10.11 Amended and Restated License of Intellectual Property by and AmongFranklin Covey Co. and Covey/Link, LLC, dated December 31, 2008
(11)
10.12* Franklin Covey Co. Second Amended and Restated 1992 Stock IncentivePlan
(12)
10.13 Amended and Restated Credit Agreement by and between JPMorganChase Bank, N.A. and Franklin Covey Co., dated March 14, 2011
(13)
10.14 Amended and Restated Security Agreement by and among FranklinCovey Co., Franklin Development Corporation, Franklin Covey Travel,Inc., Franklin Covey Client Sales, Inc., and JPMorgan Chase Bank, N.A.,dated March 14, 2011
(13)
10.15 Amended and Restated Repayment Guaranty by and among FranklinDevelopment Corporation, Franklin Covey Travel, Inc., Franklin CoveyClient Sales, Inc., and JPMorgan Chase Bank, N.A., dated March 14,2011
(13)
10.16 Agreement dated July 26, 2011, between Franklin Covey Co., andKnowledge Capital Investment Group
(14)
10.17 First Modification Agreement by and among JPMorgan Chase Bank,N.A. and Franklin Covey Co., dated March 13, 2012
(16)
10.18 Second Modification Agreement by and among JPMorgan Chase Bank,N.A. and Franklin Covey Co., dated June 15, 2012
(17)
10.19* Form of Change in Control Severance Agreement (18)
10.20 Asset Purchase Agreement made as of March 11, 2013 by and amongNinetyFive 5 LLC and Franklin Covey Client Sales, Inc. and other partiesthereto
(19)
10.21 Third Modification Agreement by and among JPMorgan Chase Bank,N.A. and Franklin Covey Co. dated March 25, 2013
(20)
10.22* Franklin Covey Co. 2015 Omnibus Incentive Plan (21)
10.23 Fourth Modification Agreement by and among JPMorgan Chase Bank,N.A. and Franklin Covey Co. dated March 31, 2015
(22)
10.24 Fifth Modification Agreement by and among JPMorgan Chase Bank,N.A., Franklin Covey Co., and the subsidiary guarantors signatorythereto, dated May 24, 2016
(23)
10.25 Secured Promissory Note between Franklin Covey Co. and JPMorganChase Bank, N.A., for $15 million term loan, dated May 24, 2016
(23)
135 Form 10-K Franklin Covey 2019 Annual Report

ExhibitNo. Exhibit
IncorporatedBy Reference
FiledHerewith
10.26 Sixth Modification Agreement by and among JPMorgan Chase Bank,N.A., Franklin Covey Co., and the subsidiary guarantors signatorythereto, dated February 28, 2017
(24)
10.27 Seventh Modification Agreement by and among JPMorgan Chase Bank,N.A., Franklin Covey Co., and the subsidiary guarantors signatorythereto, dated May 31, 2017
(25)
10.28 Eighth Modification Agreement by and among JPMorgan Chase Bank,N.A., Franklin Covey Co., and the subsidiary guarantors signatorythereto, dated August 29, 2017
(26)
10.29 Consent and Agreement of Guarantor by and between JPMorgan ChaseBank, N.A., Franklin Covey Co., and the subsidiary guarantors signatorythereto, dated August 29, 2017
(26)
10.30* Franklin Covey Co. 2017 Employee Stock Purchase Plan (incorporatedby reference to Appendix A in the Company’s Proxy Statement (File No.001-11107) filed with the Securities and Exchange Commission onDecember 22, 2017)
(27)
10.31 Ninth Modification Agreement by and among JPMorgan Chase Bank,N.A., Franklin Covey Co., and the subsidiary guarantors signatorythereto, dated August 17, 2018
(28)
10.32* Franklin Covey Co. 2019 Omnibus Incentive Plan (29)
10.32 Credit Agreement by and among JPMorgan Chase Bank, N.A., FranklinCovey Co., and the subsidiary guarantors party thereto, dated August 7,2019
(30)
10.33 Pledge and Security Agreement by and between JPMorgan Chase Bank,N.A., Franklin Covey Co., and the subsidiary guarantors party thereto,dated August 7, 2019
(30)
21 Subsidiaries of the Registrant ★★
23 Consent of Independent Registered Public Accounting Firm ★★
31.1 Rule 13a-14(a) Certification of the Chief Executive Officer ★★
31.2 Rule 13a-14(a) Certification of the Chief Financial Officer ★★
32 Section 1350 Certifications ★★
101.INS XBRL Instance Document ★★
101.SCH XBRL Taxonomy Extension Schema ★★
101.CAL XBRL Taxonomy Extension Calculation Linkbase ★★
101.DEF XBRL Taxonomy Extension Definition Linkbase ★★
101.LAB XBRL Taxonomy Extension Label Linkbase ★★
101.PRE XBRL Extension Presentation Linkbase ★★
Franklin Covey 2019 Annual Report Form 10-K 136

(1) Incorporated by reference to Registration Statement on Form S-1 filed with the Commission on April 17, 1992, Registration No. 33-47283.(2) Incorporated by reference to Amendment No. 1 to Registration Statement on Form S-1 filed with the Commission on May 26, 1992, Registration
No. 33-47283.(3) Incorporated by reference to Schedule 13D (CUSIP No. 534691090 as filed with the Commission on June 14, 1999). Registration No. 005-43123.(4) Incorporated by reference to Report on Form 8-K filed with the Commission on March 10, 2005.**(5) Incorporated by reference to Report on Form 8-K filed with the Commission on June 27, 2005.**(6) Incorporated by reference to Report on Form 8-K filed with the Commission on October 24, 2005.**(7) Incorporated by reference to the Definitive Proxy Statement on Form DEF 14A filed with the Commission on December 12, 2005.**(8) Incorporated by reference to Report on Form 8-K/A filed with the Commission on May 29, 2008.**(9) Incorporated by reference to Report on Form 10-Q filed July 10, 2008, for the Quarter ended May 31, 2008.**(10) Incorporated by reference to Report on Form 8-K filed with the Commission on July 11, 2008.**(11) Incorporated by reference to Report on Form 10-Q filed with the Commission on April 9, 2009.**(12) Incorporated by reference to the Definitive Proxy Statement on Form DEF 14A (Appendix A) filed with the Commission on December 15,
2010.**(13) Incorporated by reference to Report on Form 8-K filed with the Commission on March 17, 2011.**(14) Incorporated by reference to Report on Form 8-K filed with the Commission on July 28, 2011.**(15) Incorporated by reference to Report on Form 8-K filed with the Commission on February 1, 2012.**(16) Incorporated by reference to Report on Form 8-K filed with the Commission on March 15, 2012.**(17) Incorporated by reference to Report on Form 8-K filed with the Commission on June 19, 2012.**(18) Incorporated by reference to Report on Form 8-K filed with the Commission on March 14, 2012.**(19) Incorporated by reference to Report on Form 8-K filed with the Commission on March 14, 2013.**(20) Incorporated by reference to Report on Form 8-K filed with the Commission on March 27, 2013.**(21) Incorporated by reference to the Definitive Proxy Statement on Form DEF 14A (Appendix A) filed with the Commission on December 22,
2014.**(22) Incorporated by reference to Report on Form 8-K filed with the Commission on April 2, 2015.**(23) Incorporated by reference to Report on Form 8-K filed with the Commission on May 24, 2016.**(24) Incorporated by reference to Report on Form 8-K filed with the Commission on March 3, 2017.**(25) Incorporated by reference to Report on Form 8-K filed with the Commission on June 1, 2017.**(26) Incorporated by reference to Report on Form 8-K filed with the Commission on August 29, 2017.**(27) Incorporated by reference to the Definitive Proxy Statement on Form DEF 14A (Appendix A) filed with the Commission on December 22,
2017.**(28) Incorporated by reference to Report on Form 8-K filed with the Commission on August 20, 2018.**(29) Incorporated by reference to the Definitive Proxy Statement on Form DEF 14A (Appendix A) filed with the Commission on December 20,
2018.**(30) Incorporated by reference to Report on Form 8-K filed with the Commission on August 8, 2019.**(31) Incorporated by reference to Report on Form 10-K/A filed with the Commission on December 2, 2019.**★★ Filed herewith and attached to this report.* Indicates a management contract or compensatory plan or agreement.** Registration No. 001-11107.
ITEM 16. FORM 10-K SUMMARY
None.
137 Form 10-K Franklin Covey 2019 Annual Report

SignaturesPursuant to the requirements of Section 13 or 15(d) of the Securities Exchange Act of 1934, the Registrant has dulycaused this report to be signed on its behalf by the undersigned, thereunto duly authorized, on November 14, 2019.
FRANKLIN COVEY CO. By: /s/ ROBERT A. WHITMANRobert A. WhitmanChairman and Chief Executive Officer
Pursuant to the requirements of the Securities Exchange Act of 1934, this report has been signed below by the followingpersons on behalf of the Registrant and in the capacities and on the dates indicated.
Signature Title Date
/s/ ROBERT A. WHITMANRobert A. Whitman
Chairman of the Board andChief Executive Officer
November 14, 2019
/s/ ANNE H. CHOWAnne H. Chow
Director November 14, 2019
/s/ CLAYTON M. CHRISTENSENClayton M. Christensen
Director November 14, 2019
/s/ MICHAEL FUNGMichael Fung
Director November 14, 2019
/s/ DENNIS G. HEINERDennis G. Heiner
Director November 14, 2019
/s/ DONALD J. MCNAMARADonald J. McNamara
Director November 14, 2019
/s/ JOEL C. PETERSONJoel C. Peterson
Director November 14, 2019
/s/ E. KAY STEPPE. Kay Stepp
Director November 14, 2019
/s/ STEPHEN D. YOUNGStephen D. Young
Chief Financial Officer andChief Accounting Officer
November 14, 2019
Franklin Covey 2019 Annual Report Form 10-K 138

Section 302 CertificationI, Robert A. Whitman, certify that:
1. I have reviewed this yearly report on Form 10-K of Franklin Covey Co.;
2. Based on my knowledge, this report does not contain any untrue statement of a material fact or omit to state amaterial fact necessary to make the statements made, in light of the circumstances under which such statementswere made, not misleading with respect to the period covered by this report;
3. Based on my knowledge, the financial statements, and other financial information included in this report, fairlypresent in all material respects the financial condition, results of operations and cash flows of the registrant as of,and for, the periods presented in this report;
4. The registrant’s other certifying officer and I are responsible for establishing and maintaining disclosure controlsand procedures (as defined in Exchange Act Rules 13a-15(e) and 15d-15(e)) and internal control over financialreporting (as defined in Exchange Act Rules 13a-15(f ) and 15d-15(f )) for the registrant and have:
a. Designed such disclosure controls and procedures, or caused such disclosure controls and procedures to bedesigned under our supervision, to ensure that material information relating to the registrant, including itsconsolidated subsidiaries, is made known to us by others within those entities, particularly during the period inwhich this report is being prepared;
b. Designed such internal control over financial reporting, or caused such internal control over financial reportingto be designed under our supervision, to provide reasonable assurance regarding the reliability of financialreporting and the preparation of financial statements for external purposes in accordance with generally acceptedaccounting principles;
c. Evaluated the effectiveness of the registrant’s disclosure controls and procedures and presented in this reportour conclusions about the effectiveness of the disclosure controls and procedures, as of the end of the periodcovered by this report based on such evaluation; and
d. Disclosed in this report any change in the registrant’s internal control over financial reporting that occurredduring the registrant’s most recent fiscal quarter (the registrant’s fourth fiscal quarter in the case of an annualreport) that has materially affected, or is reasonably likely to materially affect, the registrant’s internal control overfinancial reporting; and
5. The registrant’s other certifying officer and I have disclosed, based on our most recent evaluation of internal controlover financial reporting, to the registrant’s auditors and the audit committee of the registrant’s board of directors(or persons performing the equivalent functions):
a. All significant deficiencies and material weaknesses in the design or operation of internal control over financialreporting which are reasonably likely to adversely affect the registrant’s ability to record, process, summarizeand report financial information; and
b. Any fraud, whether or not material, that involves management or other employees who have a significant role inthe registrant’s internal control over financial reporting.
Date: November 14, 2019
/s/ ROBERT A. WHITMANRobert A. WhitmanChief Executive Officer
139 Section 302 Certification Franklin Covey 2019 Annual Report

Section 302 CertificationI, Stephen D. Young, certify that:
1. I have reviewed this yearly report on Form 10-K of Franklin Covey Co.;
2. Based on my knowledge, this report does not contain any untrue statement of a material fact or omit to state amaterial fact necessary to make the statements made, in light of the circumstances under which such statementswere made, not misleading with respect to the period covered by this report;
3. Based on my knowledge, the financial statements, and other financial information included in this report, fairlypresent in all material respects the financial condition, results of operations and cash flows of the registrant as of,and for, the periods presented in this report;
4. The registrant’s other certifying officer and I are responsible for establishing and maintaining disclosure controlsand procedures (as defined in Exchange Act Rules 13a-15(e) and 15d-15(e)) and internal control over financialreporting (as defined in Exchange Act Rules 13a-15(f ) and 15d-15(f )) for the registrant and have:
a. Designed such disclosure controls and procedures, or caused such disclosure controls and procedures to bedesigned under our supervision, to ensure that material information relating to the registrant, including itsconsolidated subsidiaries, is made known to us by others within those entities, particularly during the period inwhich this report is being prepared;
b. Designed such internal control over financial reporting, or caused such internal control over financial reportingto be designed under our supervision, to provide reasonable assurance regarding the reliability of financialreporting and the preparation of financial statements for external purposes in accordance with generally acceptedaccounting principles;
c. Evaluated the effectiveness of the registrant’s disclosure controls and procedures and presented in this reportour conclusions about the effectiveness of the disclosure controls and procedures, as of the end of the periodcovered by this report based on such evaluation; and
d. Disclosed in this report any change in the registrant’s internal control over financial reporting that occurredduring the registrant’s most recent fiscal quarter (the registrant’s fourth fiscal quarter in the case of an annualreport) that has materially affected, or is reasonably likely to materially affect, the registrant’s internal control overfinancial reporting; and
5. The registrant’s other certifying officer and I have disclosed, based on our most recent evaluation of internal controlover financial reporting, to the registrant’s auditors and the audit committee of the registrant’s board of directors(or persons performing the equivalent functions):
a. All significant deficiencies and material weaknesses in the design or operation of internal control over financialreporting which are reasonably likely to adversely affect the registrant’s ability to record, process, summarizeand report financial information; and
b. Any fraud, whether or not material, that involves management or other employees who have a significant role inthe registrant’s internal control over financial reporting.
Date: November 14, 2019
/s/ STEPHEN D. YOUNGStephen D. YoungChief Financial Officer
Franklin Covey 2019 Annual Report Section 302 Certification 140

CertificationIn connection with the yearly report of Franklin Covey Co. (the “Company”) on Form 10-K for the period endedAugust 31, 2019, as filed with the Securities and Exchange Commission (the “Report”), we, Robert A. Whitman, Presidentand Chief Executive Officer of the Company, and Stephen D. Young, Chief Financial Officer of the Company, herebycertify as of the date hereof, solely for purposes of Title 18, Chapter 63, Section 1350 of the United States Code, that tothe best of our knowledge:
1. The Report fully complies with the requirements of Section 13(a) or 15(d), as applicable, of the Securities ExchangeAct of 1934, and
2. The information contained in the Report fairly presents, in all material respects, the financial condition and resultsof operations of the Company at the dates and for the periods indicated.
This Certification has not been, and shall not be deemed, “filed” with the Securities and Exchange Commission.
/s/ ROBERT A. WHITMANRobert A. WhitmanChief Executive Officer
Date: November 14, 2019
/s/ STEPHEN D. YOUNGStephen D. YoungChief Financial Officer
Date: November 14, 2019
141 Form 10-K Franklin Covey 2019 Annual Report
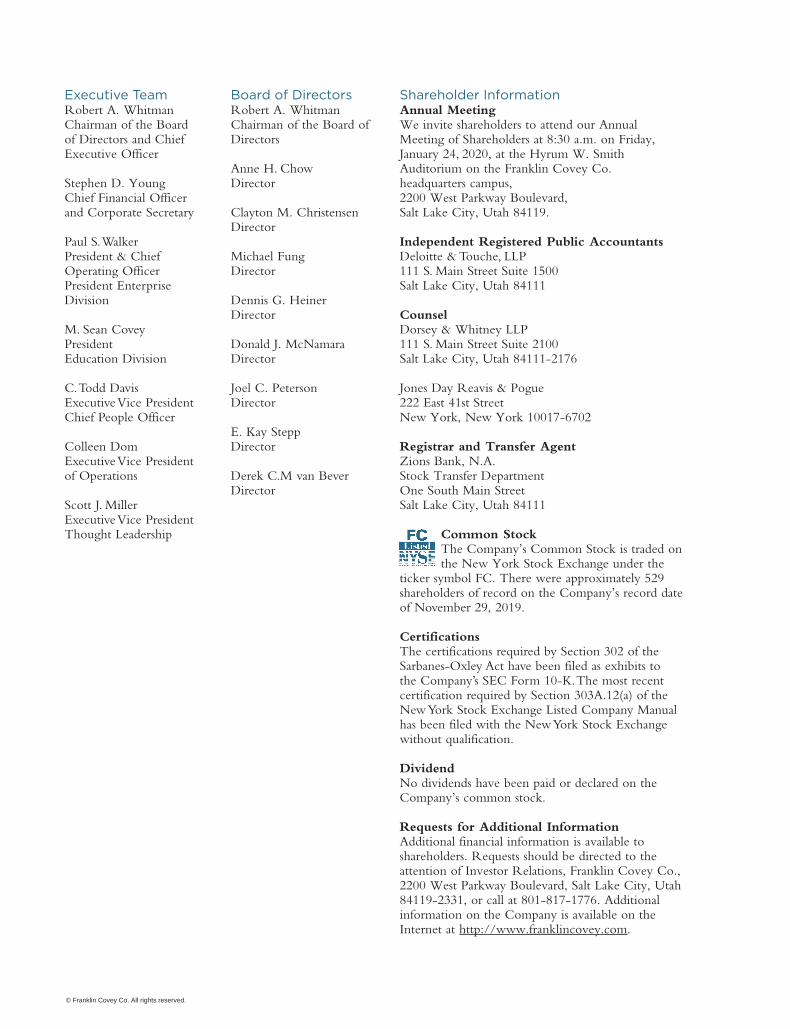
Executive TeamRobert A. WhitmanChairman of the Board of Directors and Chief Executive Officer
Stephen D. YoungChief Financial Officerand Corporate Secretary
Paul S. WalkerPresident & Chief Operating OfficerPresident Enterprise Division
M. Sean CoveyPresident Education Division
C. Todd DavisExecutive Vice PresidentChief People Officer
Colleen DomExecutive Vice Presidentof Operations
Scott J. MillerExecutive Vice PresidentThought Leadership
Board of DirectorsRobert A. WhitmanChairman of the Board of Directors
Anne H. Chow Director
Clayton M. ChristensenDirector
Michael FungDirector
Dennis G. HeinerDirector
Donald J. McNamaraDirector
Joel C. PetersonDirector
E. Kay SteppDirector
Derek C.M van BeverDirector
Shareholder InformationAnnual MeetingWe invite shareholders to attend our Annual Meeting of Share holders at 8:30 a.m. on Friday, January 24, 2020, at the Hyrum W. Smith Auditorium on the Franklin Covey Co. head quarters campus, 2200 West Parkway Boulevard, Salt Lake City, Utah 84119.
Independent Registered Public AccountantsDeloitte & Touche, LLP111 S. Main Street Suite 1500Salt Lake City, Utah 84111
CounselDorsey & Whitney LLP111 S. Main Street Suite 2100Salt Lake City, Utah 84111-2176
Jones Day Reavis & Pogue222 East 41st StreetNew York, New York 10017-6702
Registrar and Transfer AgentZions Bank, N.A.Stock Transfer DepartmentOne South Main StreetSalt Lake City, Utah 84111
Common StockThe Company’s Common Stock is traded on the New York Stock Exchange under the
ticker symbol FC. There were approximately 529 share holders of record on the Company’s record date of November 29, 2019.
CertificationsThe certifications required by Section 302 of the Sarbanes-Oxley Act have been filed as exhibits to the Company’s SEC Form 10-K. The most recent certification required by Section 303A.12(a) of the New York Stock Exchange Listed Company Manual has been filed with the New York Stock Exchange without qualification.
DividendNo dividends have been paid or declared on the Company’s common stock.
Requests for Additional InformationAdditional financial information is available to shareholders. Requests should be directed to the attention of Investor Relations, Franklin Covey Co., 2200 West Parkway Boulevard, Salt Lake City, Utah 84119-2331, or call at 801-817-1776. Additional information on the Company is available on the Internet at http://www.franklincovey.com.
© Franklin Covey Co. All rights reserved.

FRA1947316 Version 1.0.4© Franklin Covey Co. All rights reserved.

FranklinCovey
Annual R
epo
rt 2019