franklin resources, inc. clsa asiausa forum – march 1, 2010€¦ · franklin resources, inc. clsa...
TRANSCRIPT
FRANKLIN TEMPLETON INVESTMENTS
Franklin Resources, Inc.
CLSA AsiaUSA Forum – March 1, 2010
1
FRANKLIN TEMPLETON INVESTMENTS
The financial results in this presentation are preliminary. Statements in this presentation regarding Franklin Resources, Inc. (“Franklin”) and its subsidiaries, which are not historical facts, are "forward-looking statements" within the meaning of the U.S. Private Securities Litigation Reform Act of 1995. When used in this presentation, words or phrases generally written in the future tense and/or preceded by words such as “will”, “may”, “could”, “expect”, “believe”, “anticipate”, “intend”, “plan”, “seek”, “estimate” or other similar words are forward-looking statements. Forward-looking statements involve a number of known and unknown risks, uncertainties and other important factors, some of which are listed below, that could cause actual results and outcomes to differ materially from any future results or outcomes expressed or implied by such forward-looking statements. Forward-looking statements are based on our current expectations and assumptions regarding our business, the economy and other future conditions. Because forward-looking statements relate to the future, they are subject to inherent uncertainties, risks and changes in circumstances that are difficult to predict. We caution you therefore against relying on any of these forward-looking statements. They are neither statements of historical fact nor guarantees or assurances of future performance.
These and other risks, uncertainties and other important factors are described in more detail in Franklin’s recent filings with the U.S. Securities and Exchange Commission, including, without limitation, in Risk Factors and Management’s Discussion and Analysis of Financial Condition and Results of Operations in Franklin’s Annual Report on Form 10-K for the fiscal year ended September 30, 2009: (1) volatility and disruption of the capital and credit markets, and adverse changes in the global economy, may significantly affect our results of operations and may put pressure on our financial results; (2) the amount and mix of our assets under management are subject to significant fluctuations; (3) we are subject to extensive and complex, overlapping and frequently changing rules, regulations and legal interpretations; (4) regulatory and legislative actions and reforms have made the regulatory environment in which we operate more costly and future actions and reforms could adversely impact our assets under management, increase costs and negatively impact our profitability and future financial results; (5) changes in tax laws or exposure to additional income tax liabilities could have a material impact on our financial condition, results of operations and liquidity; (6) our ability to maintain the beneficial tax treatment we anticipate with respect to non-U.S. earnings we have repatriated is based on current interpretations of the American Jobs Creation Act of 2004 (the “Jobs Act”) and permitted use of such amounts in accordance with our domestic reinvestment plan and the Jobs Act; (7) any significant limitation or failure of our software applications, technology or other systems that are critical to our operations could constrain our operations; (8) our investment management business operations are complex and a failure to properly perform operational tasks or the misrepresentation of our products and services could have an adverse effect on our revenues and income; (9) we face risks, and corresponding potential costs and expenses, associated with conducting operations and growing our business in numerous countries; (10) we depend on key personnel and our financial performance could be negatively affected by the loss of their services; (11) strong competition from numerous and sometimes larger companies with competing offerings and products could limit or reduce sales of our products, potentially resulting in a decline in our market share, revenues and net income; (12) changes in the third-party distribution and sales channels on which we depend could reduce our revenues and hinder our growth; (13) our increasing focus on international markets as a source of investments and sales of investment products subjects us to increased exchange rate and other risks in connection with earnings and income generated overseas; (14) poor investment performance of our products could affect our sales or reduce the level of assets under management, potentially negatively impacting our revenues and income; (15) we could suffer losses in earnings or revenue if our reputation is harmed; (16) our future results are dependent upon maintaining an appropriate level of expenses, which is subject to fluctuation; (17) our ability to successfully integrate widely varied business lines can be impeded by systems and other technological limitations; (18) our inability to successfully recover should we experience a disaster or other business continuity problem could cause material financial loss, loss of human capital, regulatory actions, reputational harm or legal liability; (19) certain of the portfolios we manage, including our emerging market portfolios, are vulnerable to significant market-specific political, economic or other risks, any of which may negatively impact our revenues and income; (20) our revenues, earnings and income could be adversely affected if the terms of our management agreements are significantly altered or these agreements are terminated by the funds and other sponsored investment products we advise; (21) regulatory and governmental examinations and/or investigations, civil litigation relating to previously-settled regulatory and governmental investigations, and the legal risks associated with our business, could adversely impact our assets under management, increase costs and negatively impact our profitability and/or our future financial results; (22) our ability to meet cash needs depends upon certain factors, including the market value of our assets, operating cash flows and our perceived credit worthiness; (23) diverse and strong competition limits the interest rates that we can charge on consumer loans; (24) our business could be negatively affected if we or our banking subsidiaries fail to remain well capitalized, and liquidity needs could affect our banking business; and (25) we are dependent on the earnings of our subsidiaries.
Any forward-looking statement made by us in this presentation speaks only as of the date on which it is made. Factors or events that could cause our actual results to differ may emerge from time to time, and it is not possible for us to predict all of them. We undertake no obligation to publicly update any forward-looking statement, whether as a result of new information, future developments or otherwise, except as may be required by law.
Forward-Looking Statements
2
FRANKLIN TEMPLETON INVESTMENTS
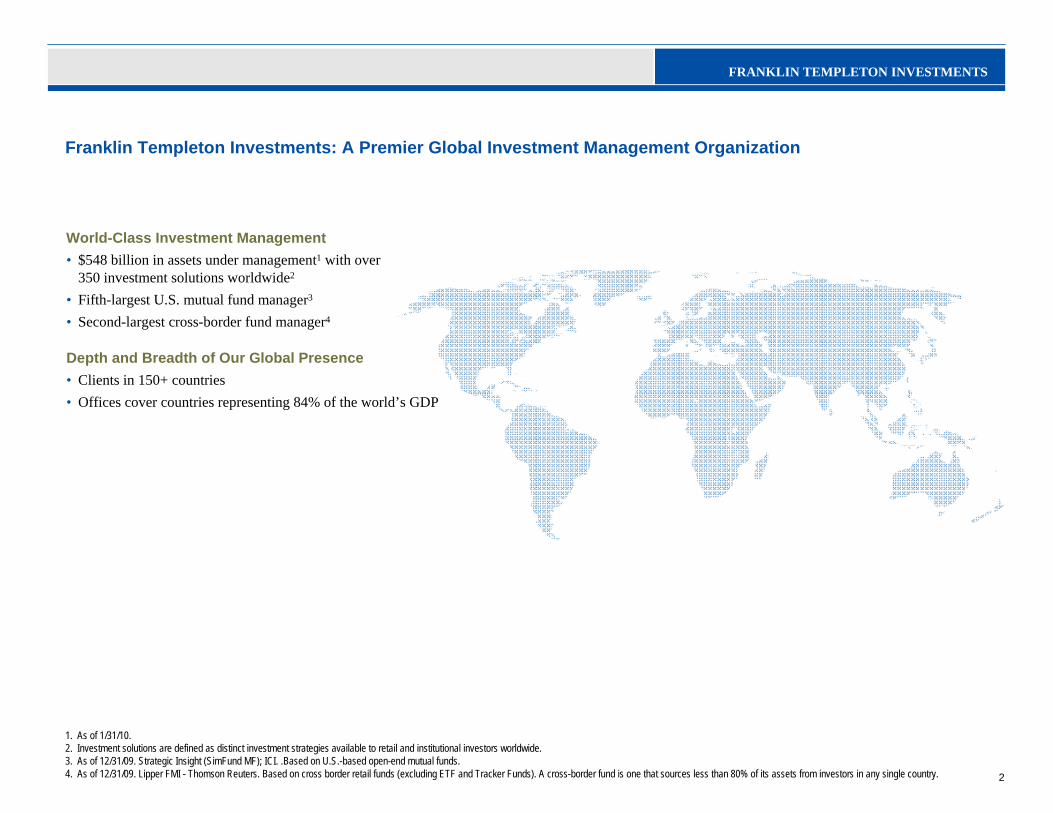
Franklin Templeton Investments: A Premier Global Investment Management Organization
World-Class Investment Management• $548 billion in assets under management1 with over
350 investment solutions worldwide2
• Fifth-largest U.S. mutual fund manager3
• Second-largest cross-border fund manager4
Depth and Breadth of Our Global Presence• Clients in 150+ countries• Offices cover countries representing 84% of the world’s GDP
1. As of 1/31/10.2. Investment solutions are defined as distinct investment strategies available to retail and institutional investors worldwide.3. As of 12/31/09. Strategic Insight (SimFund MF); ICI. .Based on U.S.-based open-end mutual funds. 4. As of 12/31/09. Lipper FMI - Thomson Reuters. Based on cross border retail funds (excluding ETF and Tracker Funds). A cross-border fund is one that sources less than 80% of its assets from investors in any single country.
3
FRANKLIN TEMPLETON INVESTMENTS
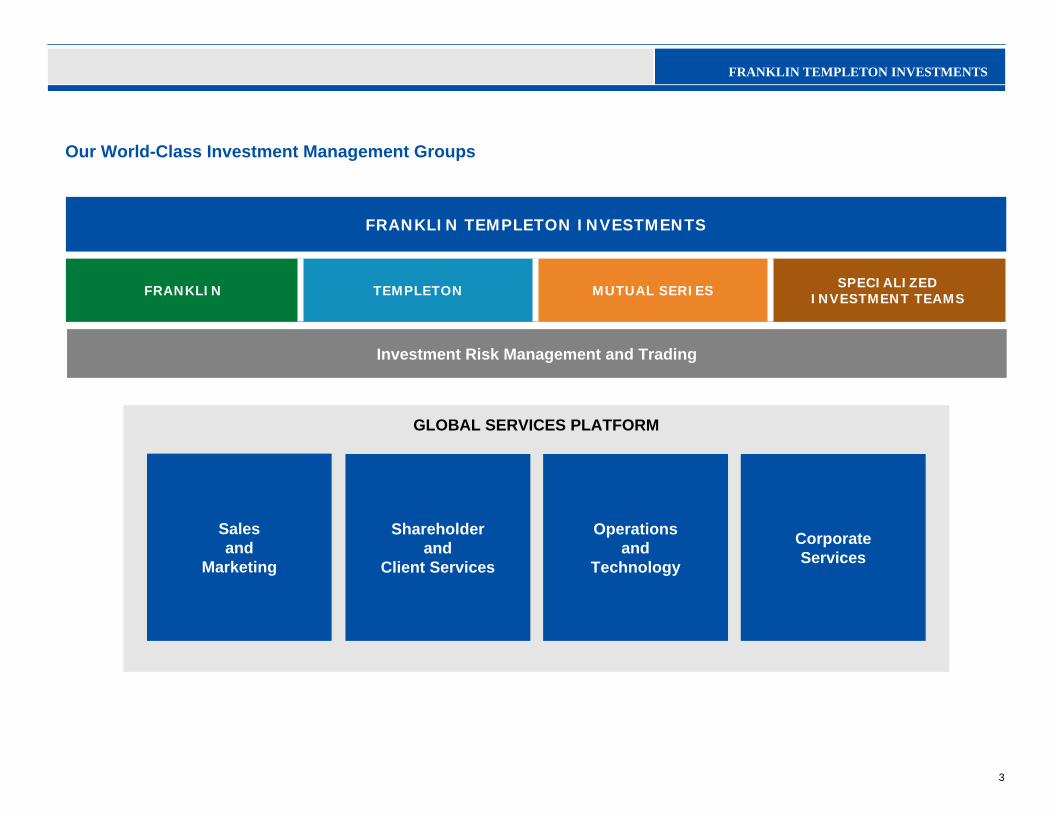
GLOBAL SERVICES PLATFORM
Our World-Class Investment Management Groups
SPECIALIZEDINVESTMENT TEAMSMUTUAL SERIESTEMPLETONFRANKLIN
FRANKLIN TEMPLETON INVESTMENTS
Shareholder and
Client Services
Operations and
Technology
Corporate Services
Sales and
Marketing
Investment Risk Management and Trading
4
FRANKLIN TEMPLETON INVESTMENTS
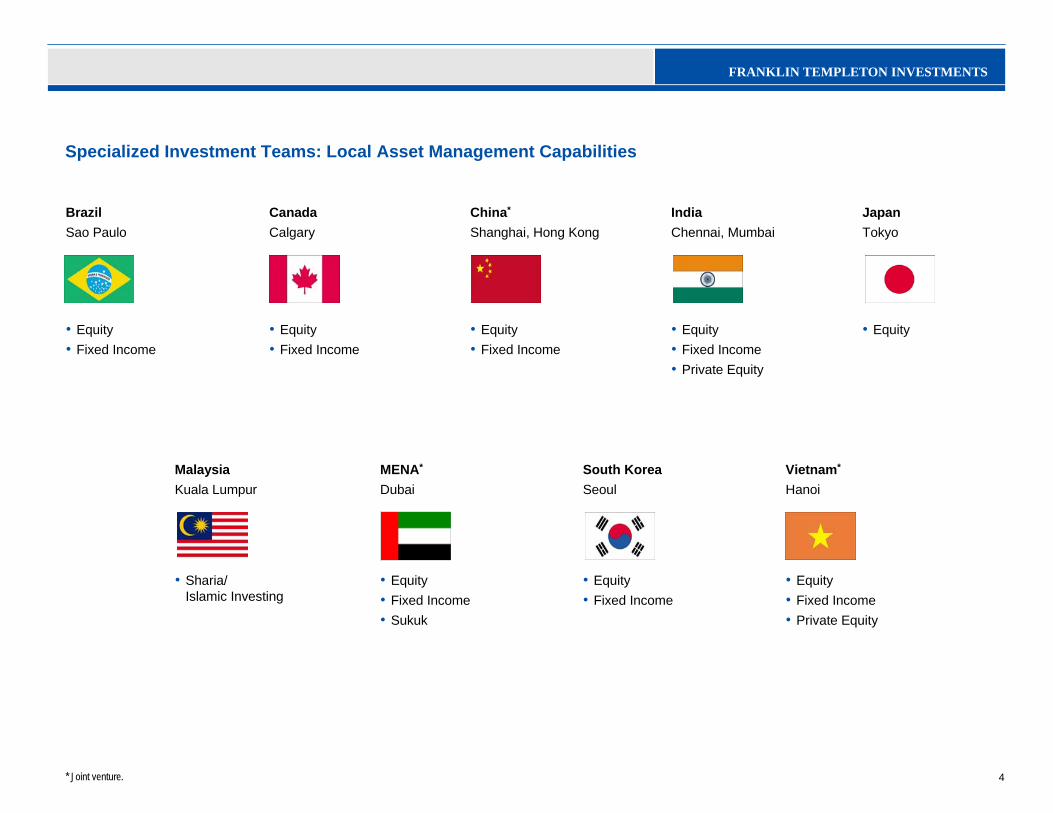
• Equity• Fixed Income• Private Equity
Vietnam*
Hanoi
• Equity• Fixed Income
• Equity• Fixed Income• Sukuk
• Sharia/Islamic Investing
South KoreaSeoul
MENA*
DubaiMalaysiaKuala Lumpur
• Equity• Fixed Income• Private Equity
IndiaChennai, Mumbai
• Equity• Equity• Fixed Income
• Equity• Fixed Income
• Equity• Fixed Income
JapanTokyo
China*
Shanghai, Hong KongCanadaCalgary
BrazilSao Paulo
Specialized Investment Teams: Local Asset Management Capabilities
1.1.3 GLOBAL DIVERSIFICATION/ACTIVE MANAGEMENT
* Joint venture.
5
FRANKLIN TEMPLETON INVESTMENTS
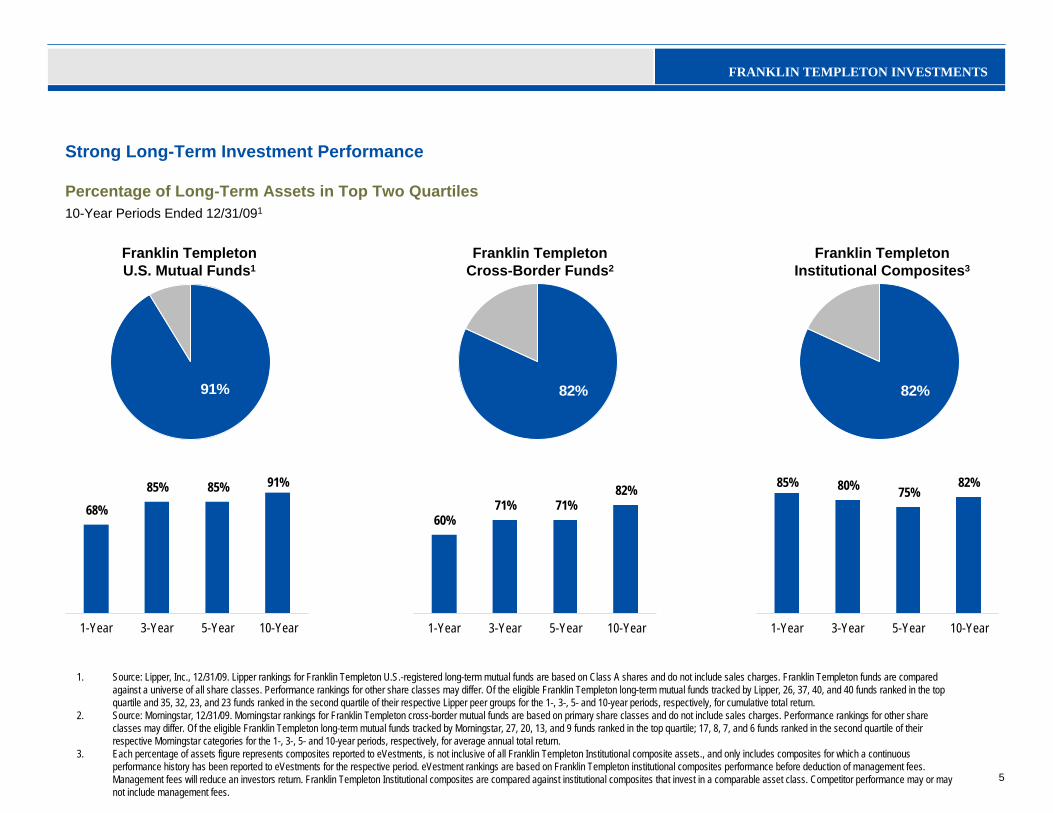
82%82%91%
1. Source: Lipper, Inc., 12/31/09. Lipper rankings for Franklin Templeton U.S.-registered long-term mutual funds are based on Class A shares and do not include sales charges. Franklin Templeton funds are compared against a universe of all share classes. Performance rankings for other share classes may differ. Of the eligible Franklin Templeton long-term mutual funds tracked by Lipper, 26, 37, 40, and 40 funds ranked in the top quartile and 35, 32, 23, and 23 funds ranked in the second quartile of their respective Lipper peer groups for the 1-, 3-, 5- and 10-year periods, respectively, for cumulative total return.
2. Source: Morningstar, 12/31/09. Morningstar rankings for Franklin Templeton cross-border mutual funds are based on primary share classes and do not include sales charges. Performance rankings for other share classes may differ. Of the eligible Franklin Templeton long-term mutual funds tracked by Morningstar, 27, 20, 13, and 9 funds ranked in the top quartile; 17, 8, 7, and 6 funds ranked in the second quartile of their respective Morningstar categories for the 1-, 3-, 5- and 10-year periods, respectively, for average annual total return.
3. Each percentage of assets figure represents composites reported to eVestments, is not inclusive of all Franklin Templeton Institutional composite assets., and only includes composites for which a continuous performance history has been reported to eVestments for the respective period. eVestment rankings are based on Franklin Templeton institutional composites performance before deduction of management fees. Management fees will reduce an investors return. Franklin Templeton Institutional composites are compared against institutional composites that invest in a comparable asset class. Competitor performance may or may not include management fees.
Franklin TempletonU.S. Mutual Funds1
Franklin TempletonInstitutional Composites3
Percentage of Long-Term Assets in Top Two Quartiles10-Year Periods Ended 12/31/091
Franklin TempletonCross-Border Funds2
1.3 ACCOLADES
Strong Long-Term Investment Performance
68%
85% 85% 91%
1-Year 3-Year 5-Year 10-Year
60%71% 71%
82%
1-Year 3-Year 5-Year 10-Year
85% 80% 75%82%
1-Year 3-Year 5-Year 10-Year
6
FRANKLIN TEMPLETON INVESTMENTS
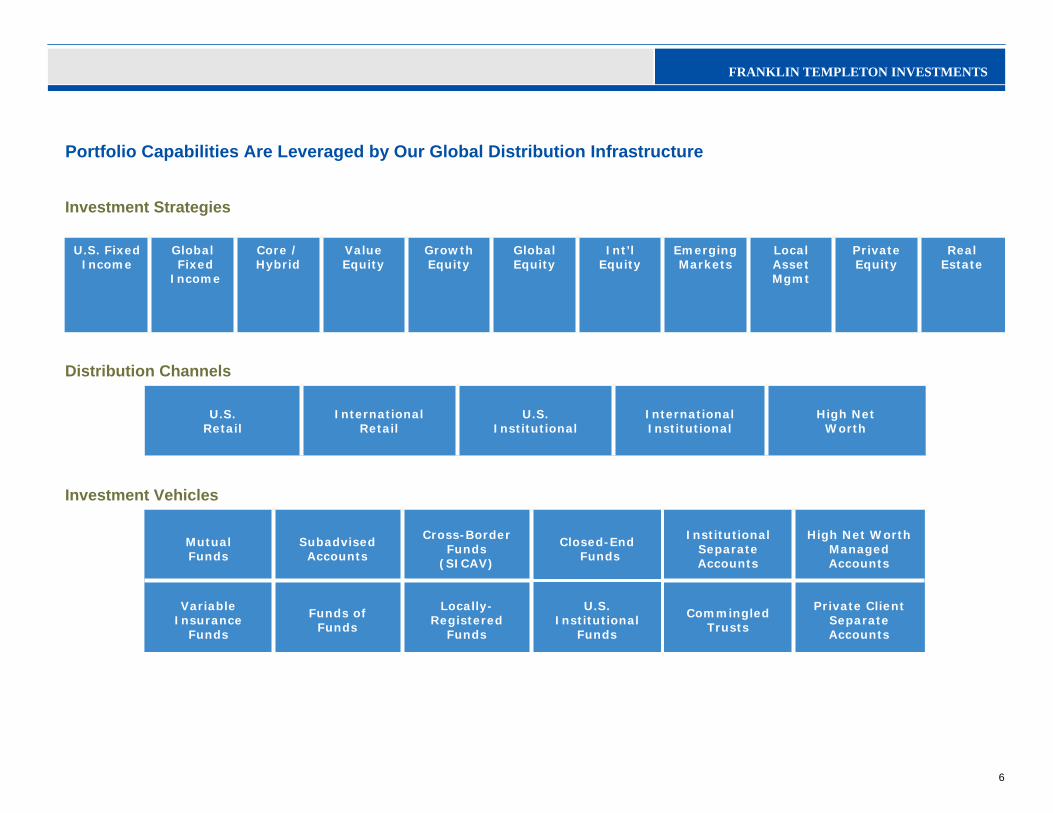
Portfolio Capabilities Are Leveraged by Our Global Distribution Infrastructure
Variable Insurance
Funds
Mutual Funds
Funds of Funds
Subadvised Accounts
Private Client Separate Accounts
High Net Worth Managed Accounts
Institutional Separate Accounts
Closed-End Funds
Cross-Border Funds
(SICAV)
Commingled Trusts
U.S. Institutional
Funds
Locally-Registered
Funds
High Net Worth
International Institutional
U.S. Institutional
International Retail
U.S.Retail
Real Estate
Private Equity
Local Asset Mgmt
EmergingMarkets
Int’l Equity
GlobalEquity
GrowthEquity
ValueEquity
Core / Hybrid
Global Fixed
Income
U.S. FixedIncome
Investment Strategies
Distribution Channels
Investment Vehicles
7
FRANKLIN TEMPLETON INVESTMENTS
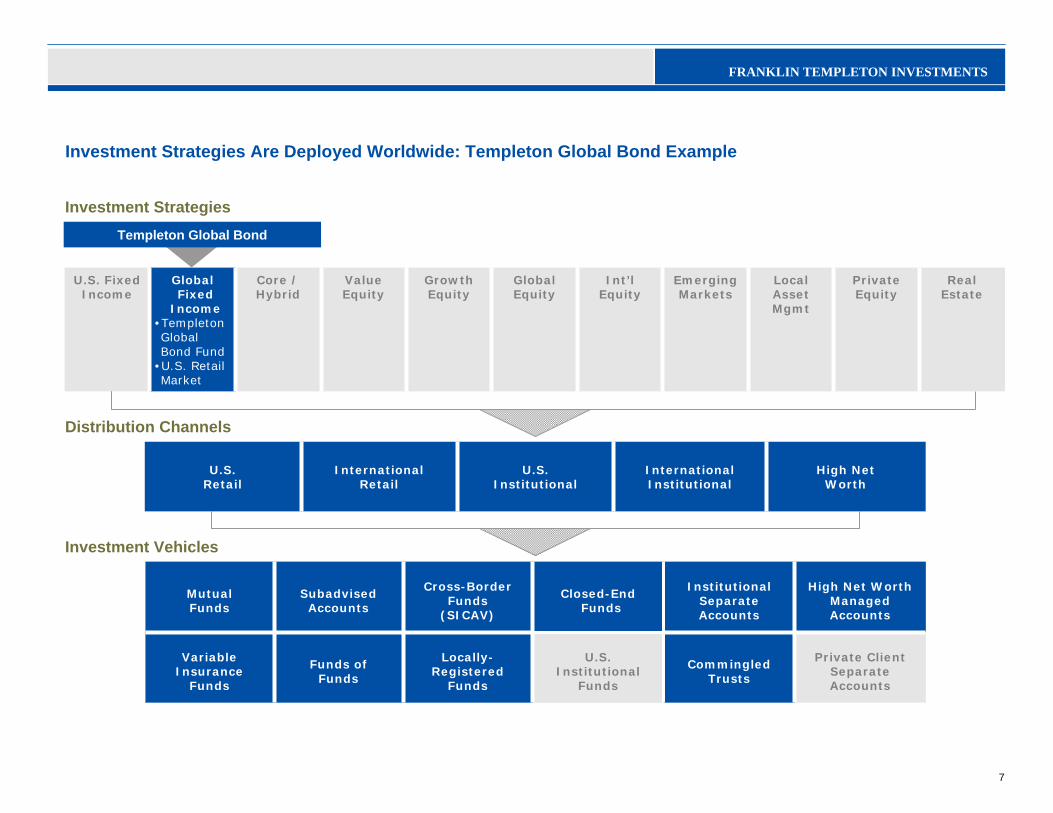
Investment Strategies Are Deployed Worldwide: Templeton Global Bond Example
Variable Insurance
Funds
Mutual Funds
Funds of Funds
Subadvised Accounts
Private Client Separate Accounts
High Net Worth Managed Accounts
Institutional Separate Accounts
Closed-End Funds
Cross-Border Funds
(SICAV)
Commingled Trusts
U.S. Institutional
Funds
Locally-Registered
Funds
High Net Worth
International Institutional
U.S. Institutional
International Retail
U.S. Retail
Real Estate
Private Equity
Local Asset Mgmt
EmergingMarkets
Int’l Equity
GlobalEquity
GrowthEquity
ValueEquity
Core / Hybrid
Global Fixed
Income•Templeton Global Bond Fund
•U.S. Retail Market
U.S. FixedIncome
Templeton Global Bond
Investment Strategies
Distribution Channels
Investment Vehicles
8
FRANKLIN TEMPLETON INVESTMENTS
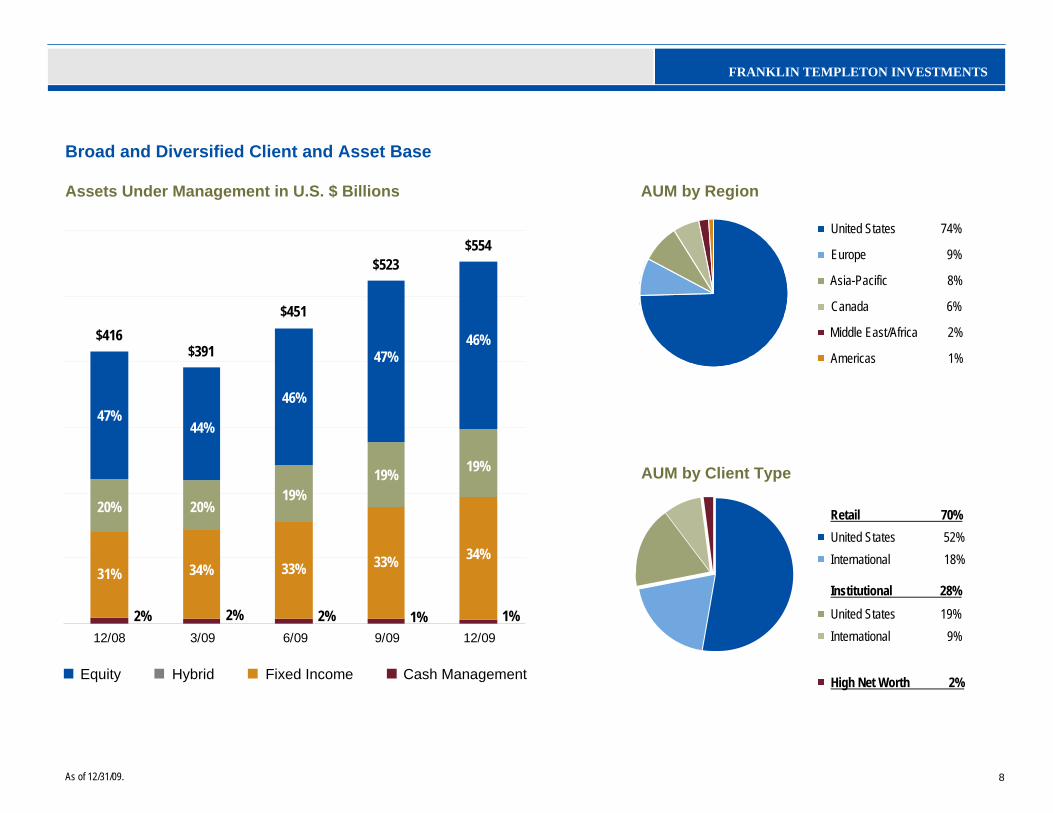
Broad and Diversified Client and Asset Base
3
As of 12/31/09.
12/08 3/09 6/09 9/09 12/09
AUM by Region
AUM by Client Type
Equity Hybrid Fixed Income Cash Management
$554
1%
34%
19%
46%$416$391
$451
$523
2% 2% 2% 1%
31% 34% 33% 33%
20% 20%19%
47%44%
46%
47%
United States 74%
Europe 9%
Asia-Pacific 8%
Canada 6%
Middle East/Africa 2%
Americas 1%
United States 52%International 18%
United States 19%International 9%
High Net Worth 2%
Retail 70%
Institutional 28%
19%
Assets Under Management in U.S. $ Billions
9
FRANKLIN TEMPLETON INVESTMENTS
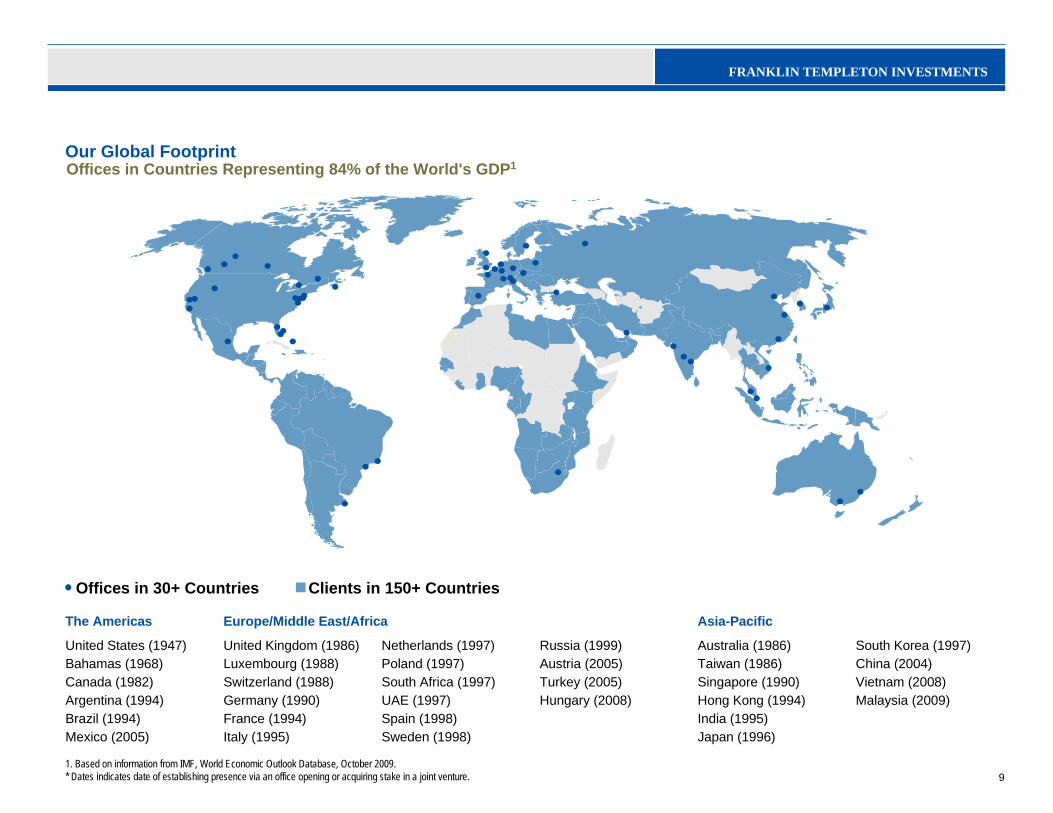
Our Global Footprint
Offices in 30+ Countries Clients in 150+ Countries
Offices in Countries Representing 84% of the World's GDP1
1. Based on information from IMF, World Economic Outlook Database, October 2009.* Dates indicates date of establishing presence via an office opening or acquiring stake in a joint venture.
South Korea (1997)China (2004)Vietnam (2008)Malaysia (2009)
Australia (1986)Taiwan (1986)Singapore (1990)Hong Kong (1994) India (1995)Japan (1996)
Russia (1999)Austria (2005)Turkey (2005)Hungary (2008)
Netherlands (1997) Poland (1997) South Africa (1997) UAE (1997) Spain (1998) Sweden (1998)
United Kingdom (1986)Luxembourg (1988) Switzerland (1988) Germany (1990)France (1994) Italy (1995)
United States (1947)Bahamas (1968)Canada (1982)Argentina (1994)Brazil (1994)Mexico (2005)
Asia-PacificEurope/Middle East/AfricaThe Americas
10
FRANKLIN TEMPLETON INVESTMENTS
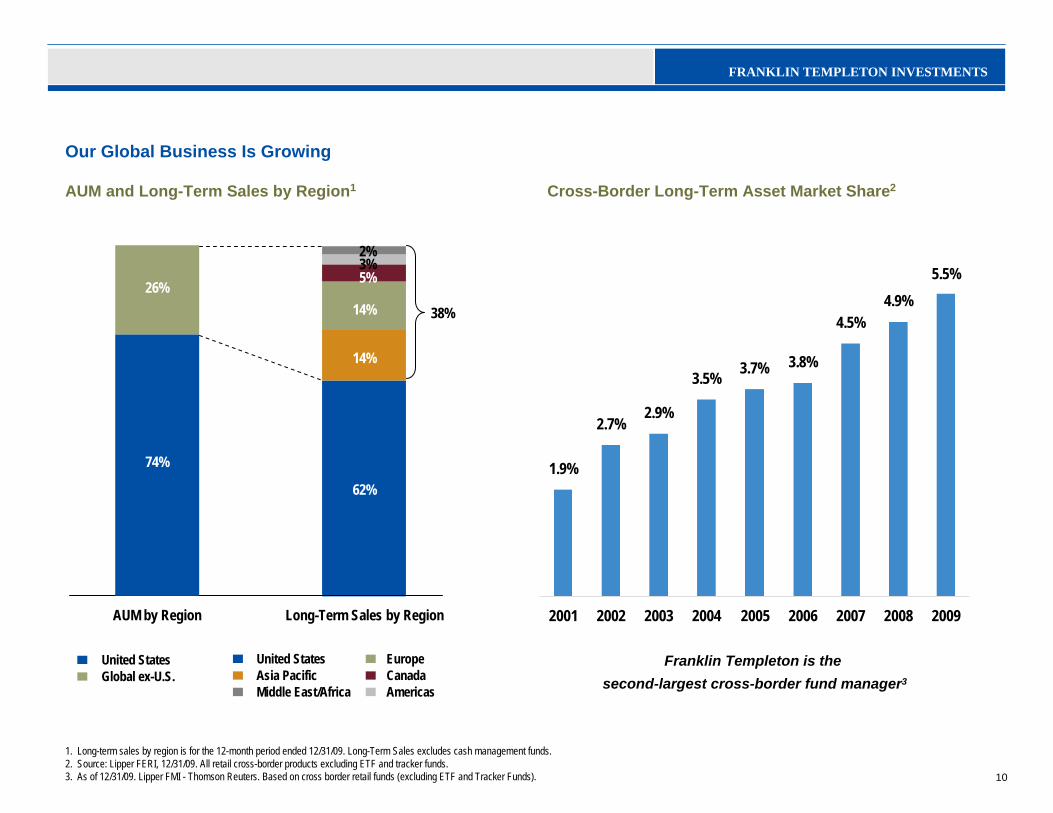
Our Global Business Is Growing
Cross-Border Long-Term Asset Market Share2
1. Long-term sales by region is for the 12-month period ended 12/31/09. Long-Term Sales excludes cash management funds.2. Source: Lipper FERI, 12/31/09. All retail cross-border products excluding ETF and tracker funds.3. As of 12/31/09. Lipper FMI - Thomson Reuters. Based on cross border retail funds (excluding ETF and Tracker Funds).
United States EuropeAsia Pacific CanadaMiddle East/Africa Americas
United StatesGlobal ex-U.S.
74%
62%
26% 5%
2%3%
AUM by Region Long-Term Sales by Region
38%
14%
14%
1.9%
2.7%2.9%
3.5% 3.7% 3.8%
4.5%4.9%
5.5%
2001 2002 2003 2004 2005 2006 2007 2008 2009
AUM and Long-Term Sales by Region1
Franklin Templeton is the second-largest cross-border fund manager3
11
FRANKLIN TEMPLETON INVESTMENTS
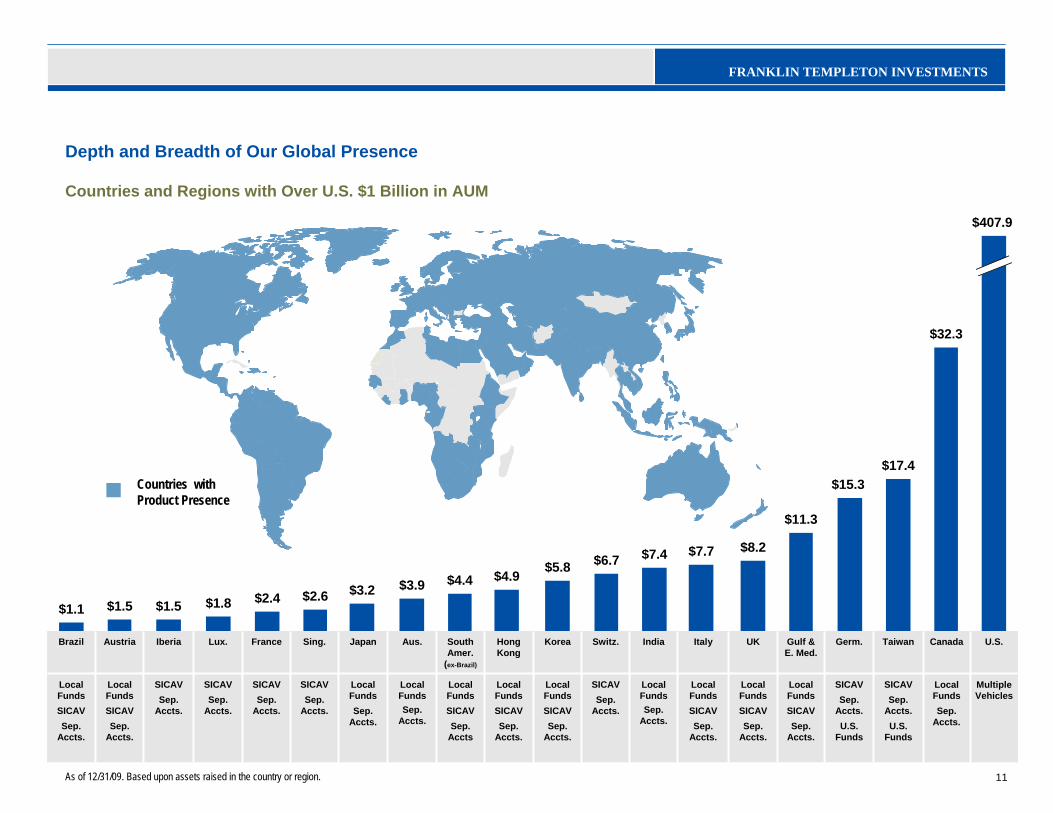
Depth and Breadth of Our Global Presence
Countries and Regions with Over U.S. $1 Billion in AUM
As of 12/31/09. Based upon assets raised in the country or region.
Countries with Product Presence
$1.1 $1.5 $1.5 $1.8 $2.4 $2.6 $3.2 $3.9 $4.4 $4.9 $5.8 $6.7 $7.4 $7.7 $8.2
$11.3
$17.4
$32.3
$15.3
$407.9
Local FundsSICAVSep.
Accts.
Gulf &E. Med.
Local Funds SICAVSep.
Accts
South Amer.
(ex-Brazil)
SICAVSep.
Accts.
Iberia
Local FundsSICAVSep.
Accts.
Italy
Local FundsSICAVSep.
Accts.
Hong Kong
Local FundsSICAVSep.
Accts.
Brazil
Local FundsSep.
Accts.
Canada
Local FundsSep.
Accts.
Aus.
Local FundsSICAVSep.
Accts.
Austria
Local FundsSep.
Accts.
Japan
Local FundsSICAVSep.
Accts.
UK
SICAVSep.
Accts.
Switz.
Multiple Vehicles
SICAVSep.
Accts.U.S.
Funds
SICAVSep.
Accts.U.S.
Funds
Local FundsSep.
Accts.
Local FundsSICAVSep.
Accts.
SICAVSep.
Accts.
SICAVSep.
Accts.
SICAVSep.
Accts.
U.S.Taiwan Germ.IndiaKoreaSing.FranceLux.
12
FRANKLIN TEMPLETON INVESTMENTS
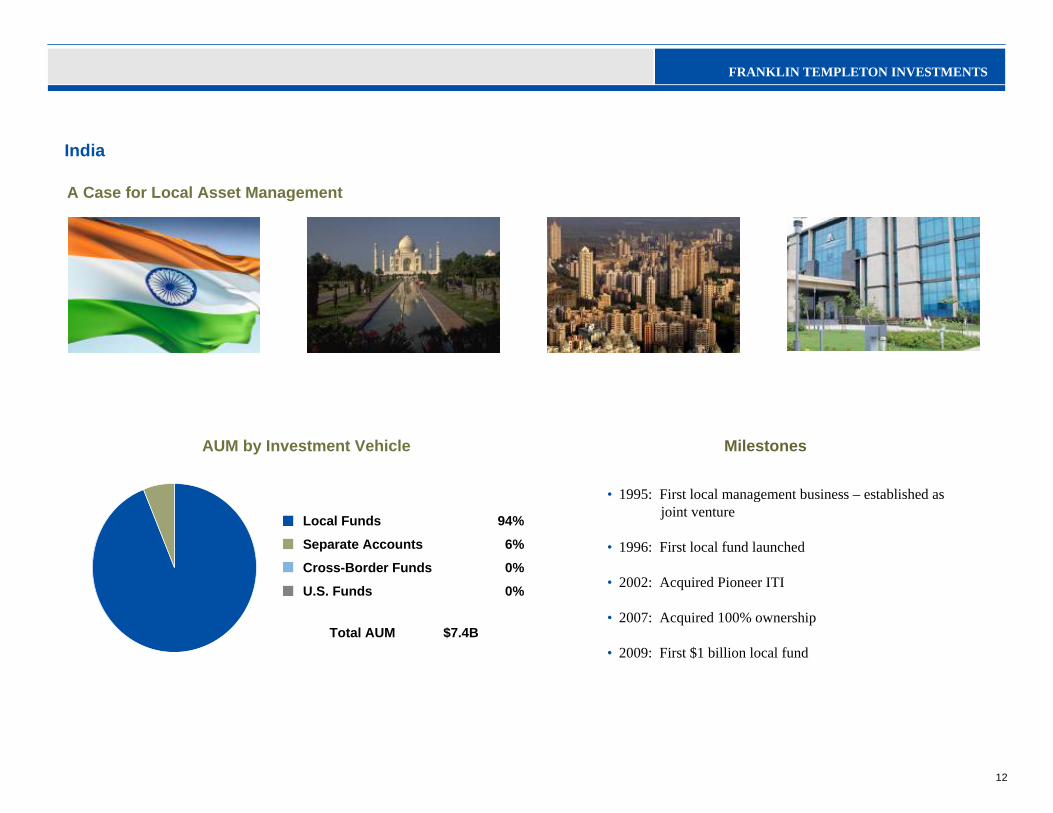
A Case for Local Asset Management
India
Milestones
• 1995: First local management business – established as joint venture
• 1996: First local fund launched
• 2002: Acquired Pioneer ITI
• 2007: Acquired 100% ownership
• 2009: First $1 billion local fund
0%U.S. Funds
0%Cross-Border Funds
6%Separate Accounts
94%Local Funds
AUM by Investment Vehicle
$7.4BTotal AUM
13
FRANKLIN TEMPLETON INVESTMENTS
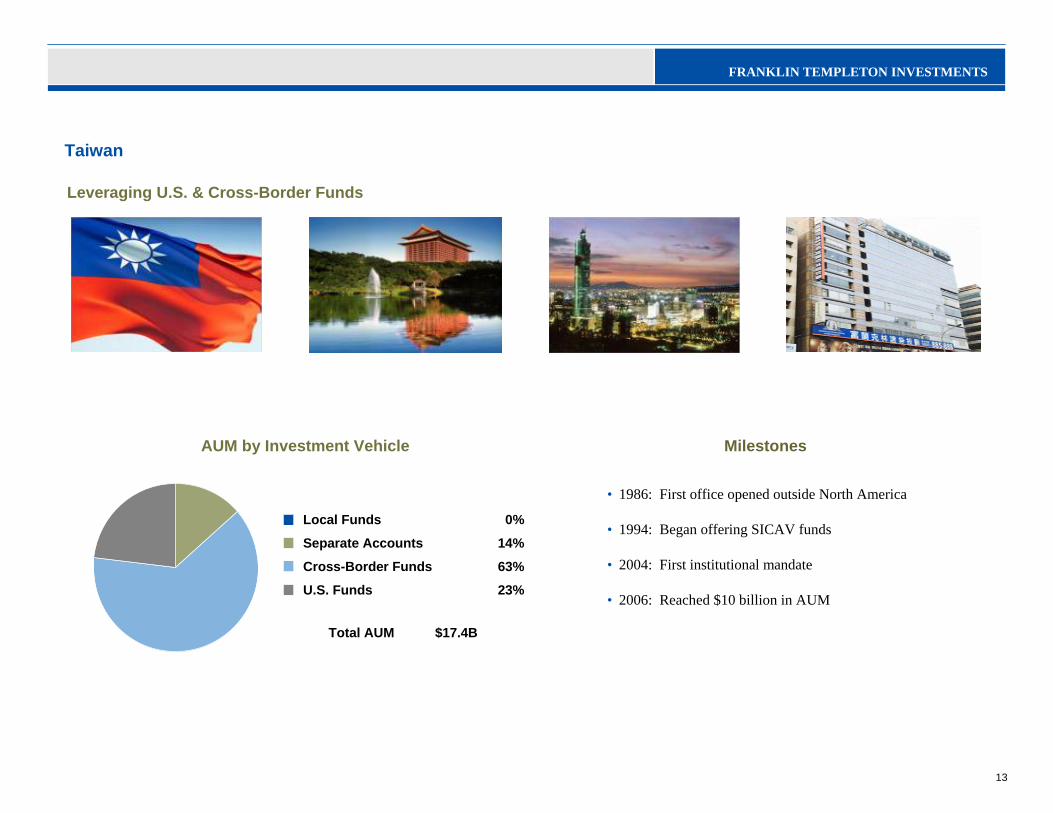
Leveraging U.S. & Cross-Border Funds
Taiwan
Milestones
• 1986: First office opened outside North America
• 1994: Began offering SICAV funds
• 2004: First institutional mandate
• 2006: Reached $10 billion in AUM 23%U.S. Funds
63%Cross-Border Funds
14%Separate Accounts
0%Local Funds
AUM by Investment Vehicle
$17.4BTotal AUM
14
FRANKLIN TEMPLETON INVESTMENTS
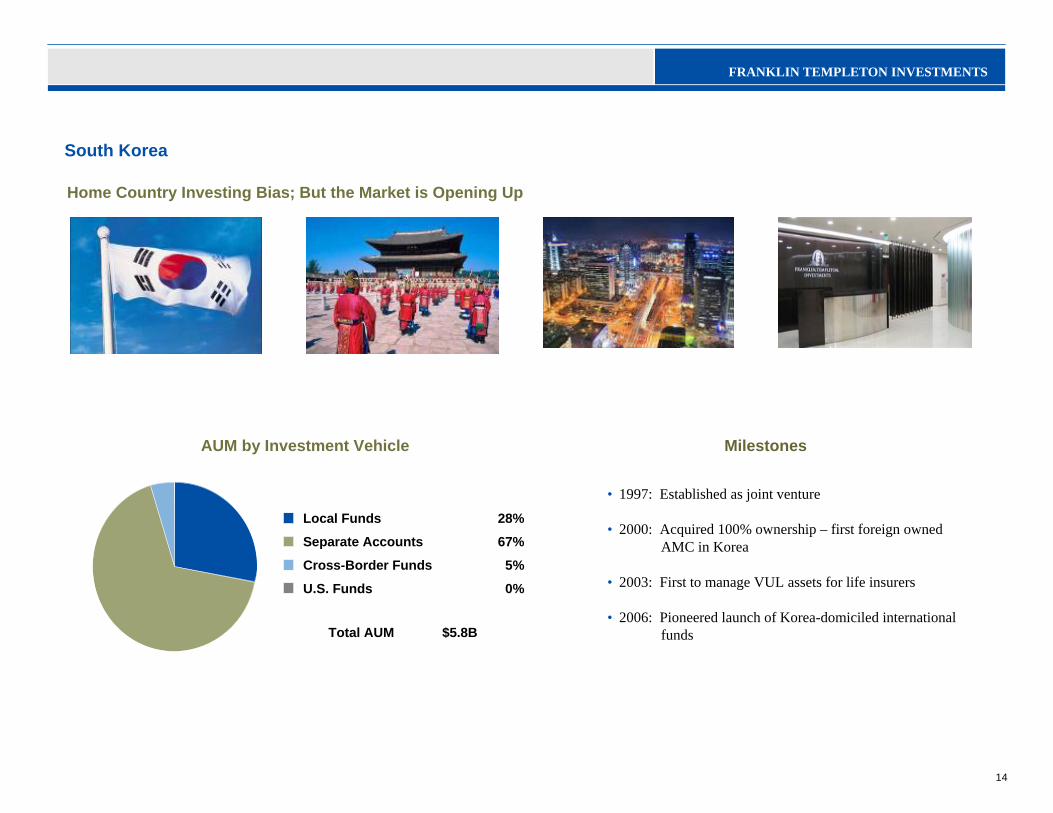
Home Country Investing Bias; But the Market is Opening Up
South Korea
Milestones
• 1997: Established as joint venture
• 2000: Acquired 100% ownership – first foreign owned AMC in Korea
• 2003: First to manage VUL assets for life insurers
• 2006: Pioneered launch of Korea-domiciled international funds
0%U.S. Funds
5%Cross-Border Funds
67%Separate Accounts
28%Local Funds
AUM by Investment Vehicle
$5.8BTotal AUM
15
FRANKLIN TEMPLETON INVESTMENTS
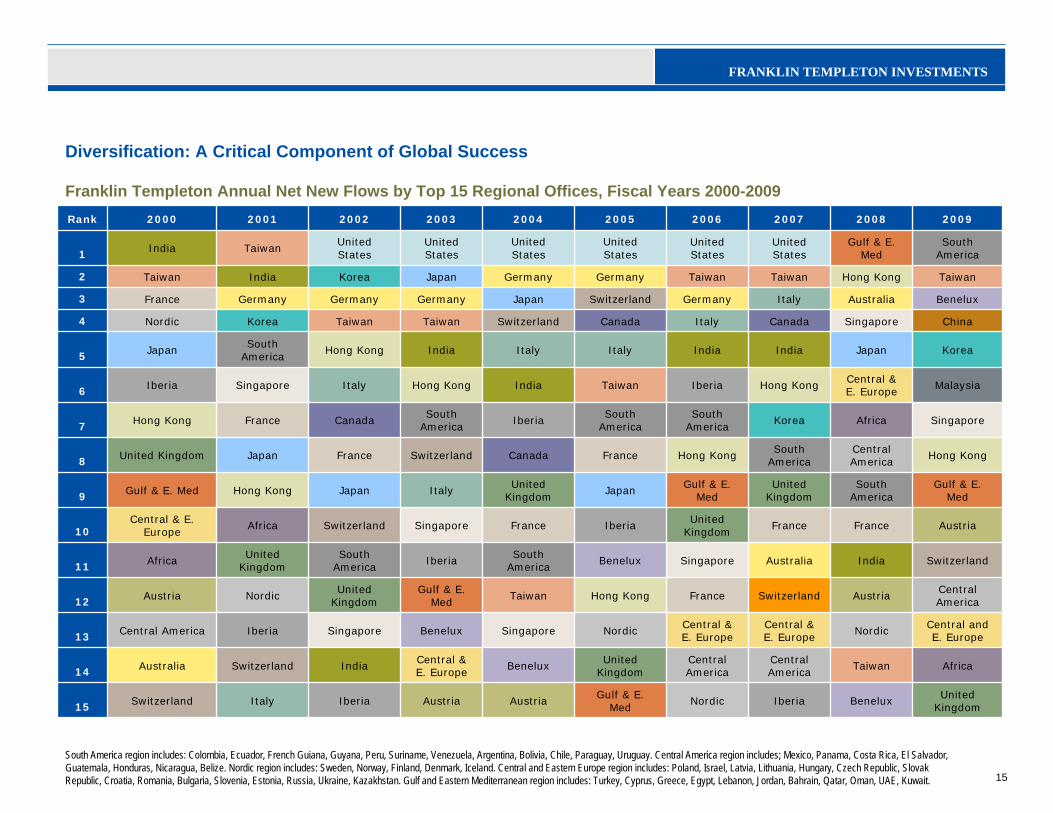
Franklin Templeton Annual Net New Flows by Top 15 Regional Offices, Fiscal Years 2000-2009
Diversification: A Critical Component of Global Success
South America region includes: Colombia, Ecuador, French Guiana, Guyana, Peru, Suriname, Venezuela, Argentina, Bolivia, Chile, Paraguay, Uruguay. Central America region includes; Mexico, Panama, Costa Rica, El Salvador, Guatemala, Honduras, Nicaragua, Belize. Nordic region includes: Sweden, Norway, Finland, Denmark, Iceland. Central and Eastern Europe region includes: Poland, Israel, Latvia, Lithuania, Hungary, Czech Republic, Slovak Republic, Croatia, Romania, Bulgaria, Slovenia, Estonia, Russia, Ukraine, Kazakhstan. Gulf and Eastern Mediterranean region includes: Turkey, Cyprus, Greece, Egypt, Lebanon, Jordan, Bahrain, Qatar, Oman, UAE, Kuwait.
United Kingdom
BeneluxIberiaNordicGulf & E. Med
AustriaAustriaIberiaItalySwitzerland15
AfricaTaiwanCentral America
Central America
United Kingdom
BeneluxCentral & E. Europe
IndiaSwitzerlandAustralia14
Central and E. Europe
NordicCentral & E. Europe
Central & E. Europe
NordicSingaporeBeneluxSingaporeIberiaCentral America13
Central America
AustriaSwitzerlandFranceHong KongTaiwanGulf & E. Med
United Kingdom
NordicAustria12
SwitzerlandIndiaAustraliaSingaporeBeneluxSouth America
IberiaSouth America
United Kingdom
Africa11
AustriaFranceFranceUnited Kingdom
IberiaFranceSingaporeSwitzerlandAfricaCentral & E. Europe10
Gulf & E. Med
South America
United Kingdom
Gulf & E. Med
JapanUnited Kingdom
ItalyJapanHong KongGulf & E. Med9
Hong KongCentral America
South America
Hong KongFranceCanadaSwitzerlandFranceJapanUnited Kingdom8
SingaporeAfricaKoreaSouth America
South America
IberiaSouth America
CanadaFranceHong Kong7
MalaysiaCentral & E. Europe
Hong KongIberiaTaiwanIndiaHong KongItalySingaporeIberia6
KoreaJapanIndiaIndiaItalyItalyIndiaHong KongSouth America
Japan5
ChinaSingaporeCanadaItalyCanadaSwitzerlandTaiwanTaiwanKoreaNordic4
BeneluxAustraliaItalyGermanySwitzerlandJapanGermanyGermanyGermanyFrance3
TaiwanHong KongTaiwanTaiwanGermanyGermanyJapanKoreaIndiaTaiwan2
South America
Gulf & E. Med
United States
United States
United States
United States
United States
United States
TaiwanIndia1
2009200820072006200520042003200220012000Rank
16
FRANKLIN TEMPLETON INVESTMENTS
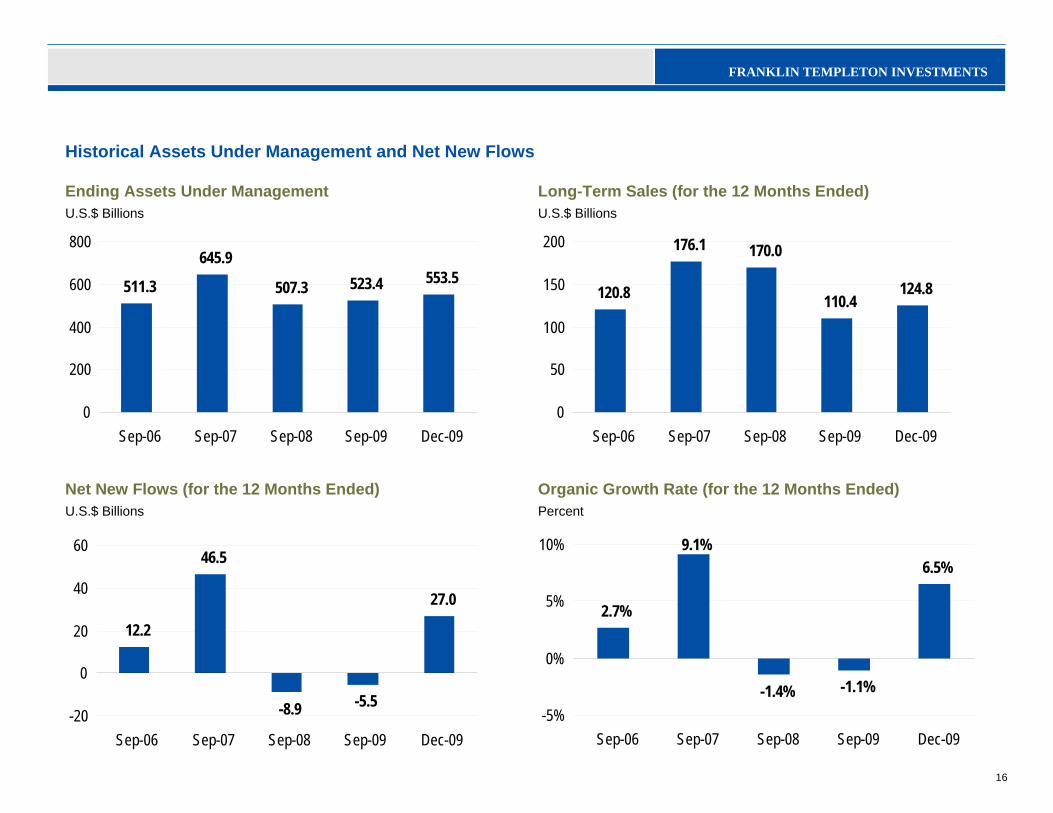
Historical Assets Under Management and Net New Flows
3
Ending Assets Under ManagementU.S.$ Billions
Long-Term Sales (for the 12 Months Ended)U.S.$ Billions
Net New Flows (for the 12 Months Ended)U.S.$ Billions
Organic Growth Rate (for the 12 Months Ended)Percent
511.3
645.9523.4 553.5507.3
0
200
400
600
800
Sep-06 Sep-07 Sep-08 Sep-09 Dec-09
120.8
176.1
110.4124.8
170.0
0
50
100
150
200
Sep-06 Sep-07 Sep-08 Sep-09 Dec-09
12.2
46.5
-5.5
27.0
-8.9-20
0
20
40
60
Sep-06 Sep-07 Sep-08 Sep-09 Dec-09
2.7%
9.1%
-1.1%
6.5%
-1.4%-5%
0%
5%
10%
Sep-06 Sep-07 Sep-08 Sep-09 Dec-09
17
FRANKLIN TEMPLETON INVESTMENTS
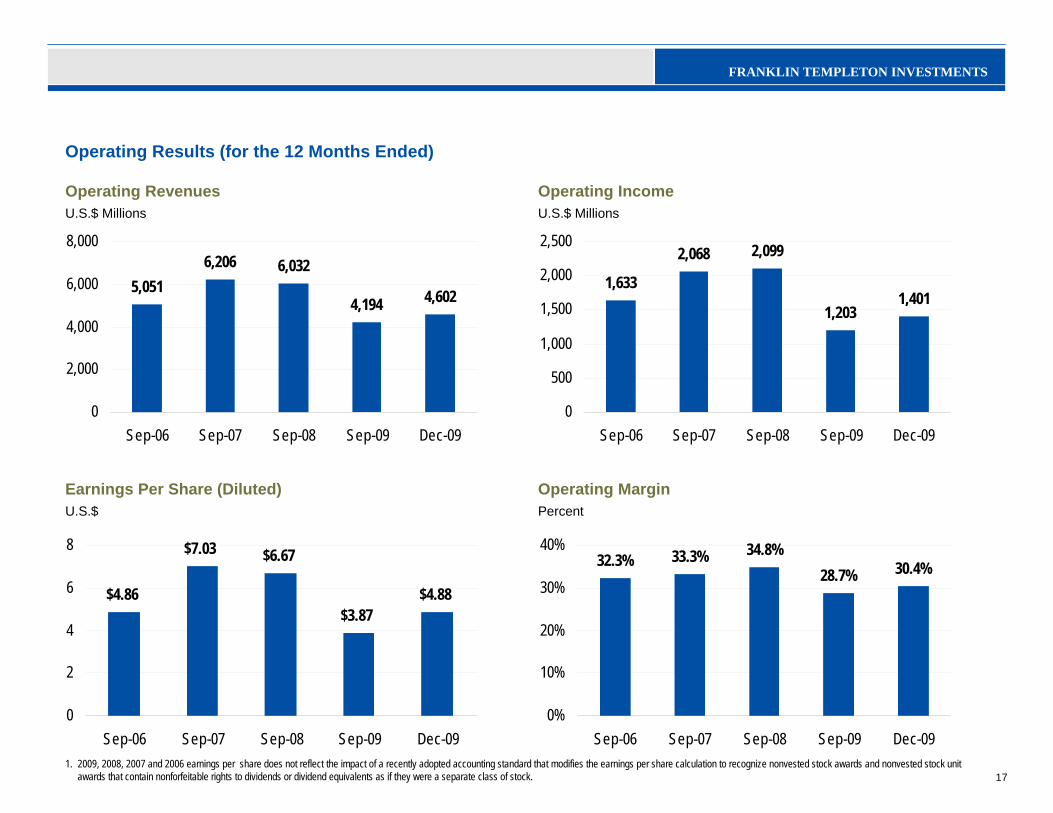
Operating Results (for the 12 Months Ended)
Operating RevenuesU.S.$ Millions
3.4
Operating IncomeU.S.$ Millions
1,633
2,068
1,2031,401
2,099
0
500
1,000
1,500
2,000
2,500
Sep-06 Sep-07 Sep-08 Sep-09 Dec-09
32.3% 33.3%28.7% 30.4%
34.8%
0%
10%
20%
30%
40%
Sep-06 Sep-07 Sep-08 Sep-09 Dec-09
$4.86
$7.03
$3.87$4.88
$6.67
0
2
4
6
8
Sep-06 Sep-07 Sep-08 Sep-09 Dec-09
Operating MarginPercent
Earnings Per Share (Diluted)U.S.$
5,0516,206
4,194 4,602
6,032
0
2,000
4,000
6,000
8,000
Sep-06 Sep-07 Sep-08 Sep-09 Dec-09
1. 2009, 2008, 2007 and 2006 earnings per share does not reflect the impact of a recently adopted accounting standard that modifies the earnings per share calculation to recognize nonvested stock awards and nonvested stock unit awards that contain nonforfeitable rights to dividends or dividend equivalents as if they were a separate class of stock.
18
FRANKLIN TEMPLETON INVESTMENTS
3.4
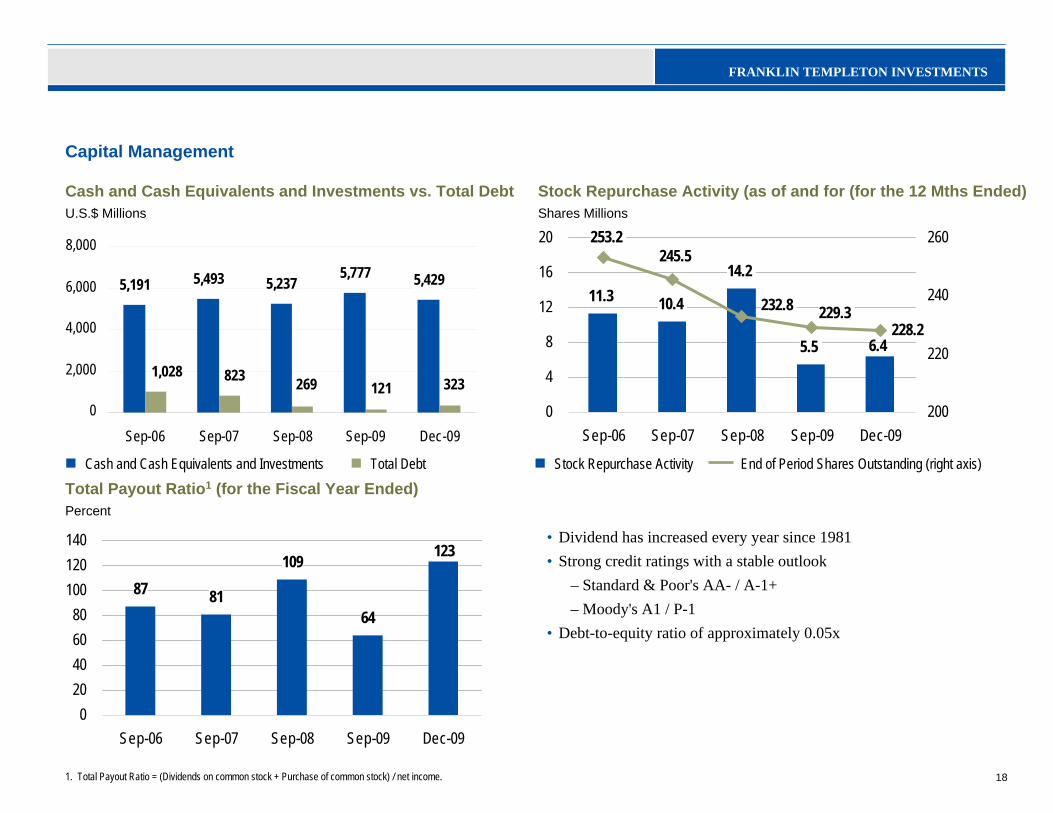
1. Total Payout Ratio = (Dividends on common stock + Purchase of common stock) / net income.
Cash and Cash Equivalents and Investments vs. Total DebtU.S.$ Millions
Stock Repurchase Activity (as of and for (for the 12 Mths Ended)Shares Millions
Capital Management
87 81
109
64
123
020406080
100120140
Sep-06 Sep-07 Sep-08 Sep-09 Dec-09
11.3 10.4
14.2
5.5 6.4228.2
232.8 229.3
245.5253.2
0
4
8
12
16
20
Sep-06 Sep-07 Sep-08 Sep-09 Dec-09200
220
240
260
5,191 5,493 5,777 5,4295,237
1,028 823 269 121 3230
2,000
4,000
6,000
8,000
Sep-06 Sep-07 Sep-08 Sep-09 Dec-09
Cash and Cash Equivalents and Investments Total Debt
• Dividend has increased every year since 1981 • Strong credit ratings with a stable outlook
– Standard & Poor's AA- / A-1+ – Moody's A1 / P-1
• Debt-to-equity ratio of approximately 0.05x
Total Payout Ratio1 (for the Fiscal Year Ended)Percent
End of Period Shares Outstanding (right axis)Stock Repurchase Activity
19
FRANKLIN TEMPLETON INVESTMENTS
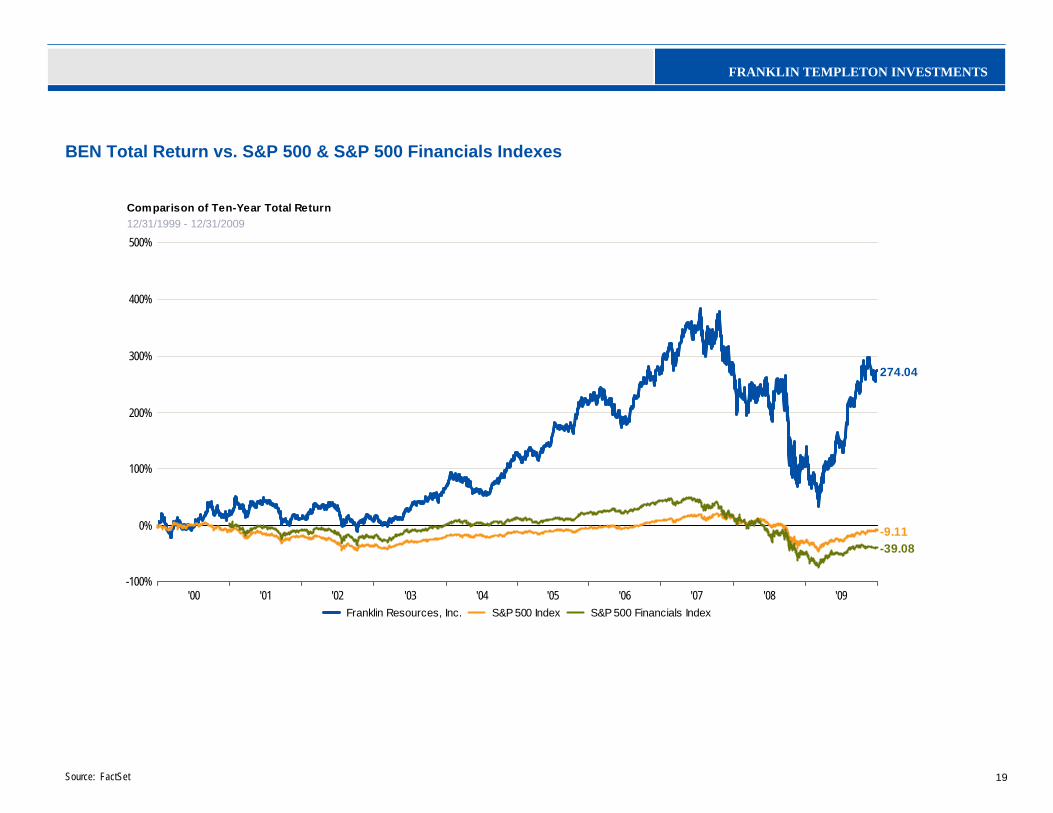
BEN Total Return vs. S&P 500 & S&P 500 Financials Indexes
Source: FactSet
'00 '01 '02 '03 '04 '05 '06 '07 '08 '09-100%
0%
100%
200%
300%
400%
500%
-39.08-9.11
274.04
Comparison of Ten-Year Total Return12/31/1999 - 12/31/2009
Franklin Resources, Inc. S&P 500 Index S&P 500 Financials Index
20
FRANKLIN TEMPLETON INVESTMENTS
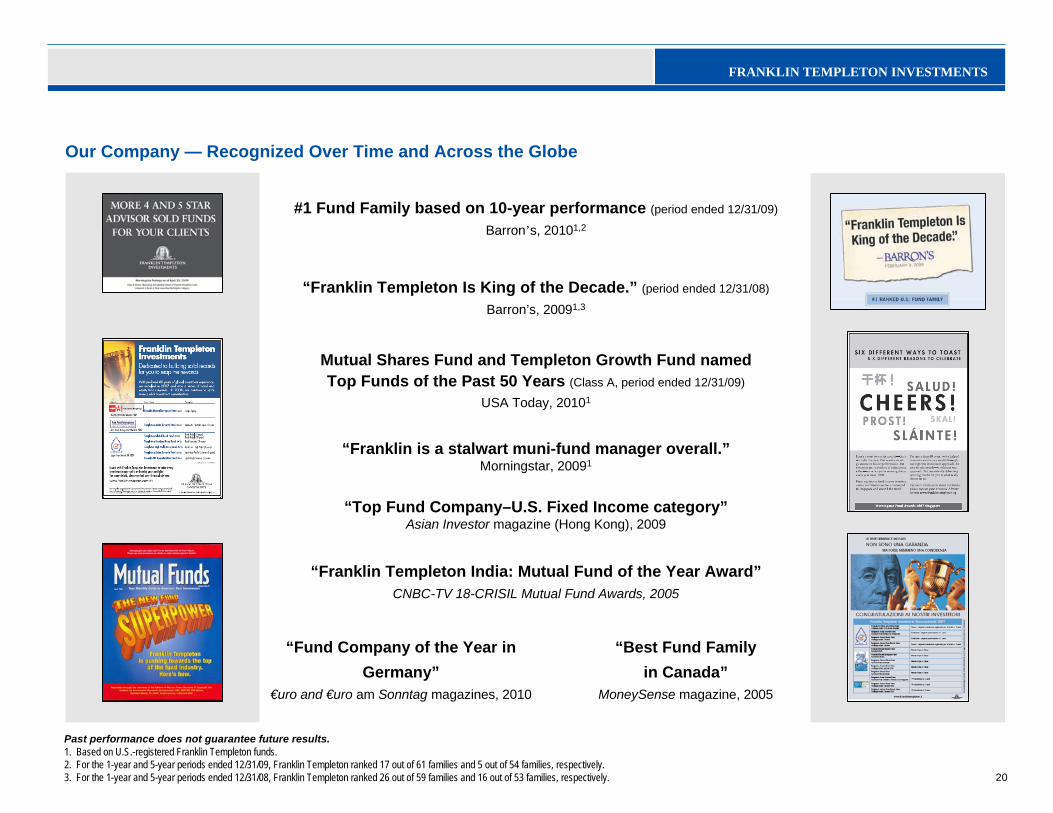
Our Company — Recognized Over Time and Across the Globe
Mutual Shares Fund and Templeton Growth Fund named Top Funds of the Past 50 Years (Class A, period ended 12/31/09)
USA Today, 20101
#1 Fund Family based on 10-year performance (period ended 12/31/09)
Barron’s, 20101,2
“Best Fund Family in Canada”
MoneySense magazine, 2005
“Fund Company of the Year in Germany”
€uro and €uro am Sonntag magazines, 2010
“Franklin Templeton India: Mutual Fund of the Year Award”CNBC-TV 18-CRISIL Mutual Fund Awards, 2005
“Top Fund Company–U.S. Fixed Income category”Asian Investor magazine (Hong Kong), 2009
“Franklin is a stalwart muni-fund manager overall.”Morningstar, 20091
“Franklin Templeton Is King of the Decade.” (period ended 12/31/08)
Barron’s, 20091,3
Past performance does not guarantee future results.1. Based on U.S.-registered Franklin Templeton funds.2. For the 1-year and 5-year periods ended 12/31/09, Franklin Templeton ranked 17 out of 61 families and 5 out of 54 families, respectively. 3. For the 1-year and 5-year periods ended 12/31/08, Franklin Templeton ranked 26 out of 59 families and 16 out of 53 families, respectively.