frank rambo & frank bannert, customer solution adoption ... · frank rambo & frank bannert,...
TRANSCRIPT

Frank Rambo & Frank Bannert, Customer Solution Adoption (CSA)
September 2012
SAP Visual Intelligence Learn how to use SAP's ultimate solution for self-service BI!

Agenda Overview Data Discover Market Segment (aka Self-Service BI)
What is SAP Visual Intelligence?
Demo 1 : SAP Visual Intelligence on HANA
Demo 2: SAP Visual Intelligence on BI Universes
SAP Visual Intelligence vs BO Explorer
Q&A

© 2012 SAP AG. All rights reserved. 3
The Data Discovery Market Segment
What is Self-Service BI?
With their focus on IT driven standards and control, traditional Enterprise BI Platforms fail at delivering business users with
the ease of use and flexibility they require. In addition, the shift from measurement to analysis, forecasting and optimization
is in favor of the new Data Discovery (aka Self-Service BI) tools.
Traditional Enterprise BI Platforms Data Discovery Platforms
Key buyers* IT Business
Approach* Top down, IT modeled (semantic layers),
query existing repositories
Bottom up, business user driven, move
data into dedicated repository
User
interface*
Report/key performance indicator (KPI),
dashboard/grid
Visualization & data exploration
Use case* Monitoring, reporting Analysis
Deployment* Consultants Business users
Focus Standards and control, several tools
(separate design-time/run-time
experience)
Ease of use and flexibility, one tool
(merged design-time/run-time experience),
shorter time to value
*Source: Gartner Magic Quadrant for Business Intelligence Platforms (January 27, 2011)

© 2012 SAP AG. All rights reserved. 4
Value Proposition 1
Discover departmental
data and share insights
Value Proposition 2
Deploy this content into
the enterprise
Value Proposition 3
Consume SAP HANA
enterprise content
online
Acquire data from different
sources and combine it
Cleanse and manipulate the
data
Explore and visualize the
data and share the results
Publish SAP Visual
Intelligence output models into
SAP HANA
Consume resulting HANA
views with BI clients and SAP
BO Mobile
Explore & visualize SAP
HANA views online
Extract SAP HANA content
locally and merge with
personal data sources
What is SAP Visual Intelligence?
Self-Service BI for Business Analysts
SAP Visual
Intelligence
CSV XL SQL UNV
IQ
UNX
SAP Visual
Intelligence
Information
Models SAP HANA
Publish
SAP Visual
Intelligence
Information
Models SAP HANA
Explore & Visualize

© 2012 SAP AG. All rights reserved. 5
SAP Visual Intelligence
Key Benefits
Near-instant value for business user
Ability to access and manipulate
heterogeneous data sources
High performance on big data
Powerful visualizations for interactive
analysis
No IT or developer dependency and no
scripting required
Ability to leverage existing
investments in SAP HANA or
SAP BO Business Intelligence

© 2012 SAP AG. All rights reserved. 6
SAP Visual Intelligence
2012 Roadmap
Directly connect to HANA
data
Easy to use and quick to
install
Create interactive
visualizations on top of
HANA
Expanded data sources (HANA, Excel, Csv)
Data merge and manipulation without scripting Visualize data via Explorer web and mobile SAP StreamWork integration
1.0.1 1.0
Visualization improvements Further integration with Explorer web and mobile Tier 1 Language support
1.05*
Expanded data sources (HANA, Excel, Csv, Freehand SQL)
Non SMP auto update
Add enterprise data
acquisition: UNV, UNX
1.0.2 / 1.0.3/ 1.0.4*
*Planned and subject to change!
© 2012 SAP AG. All rights reserved. 7
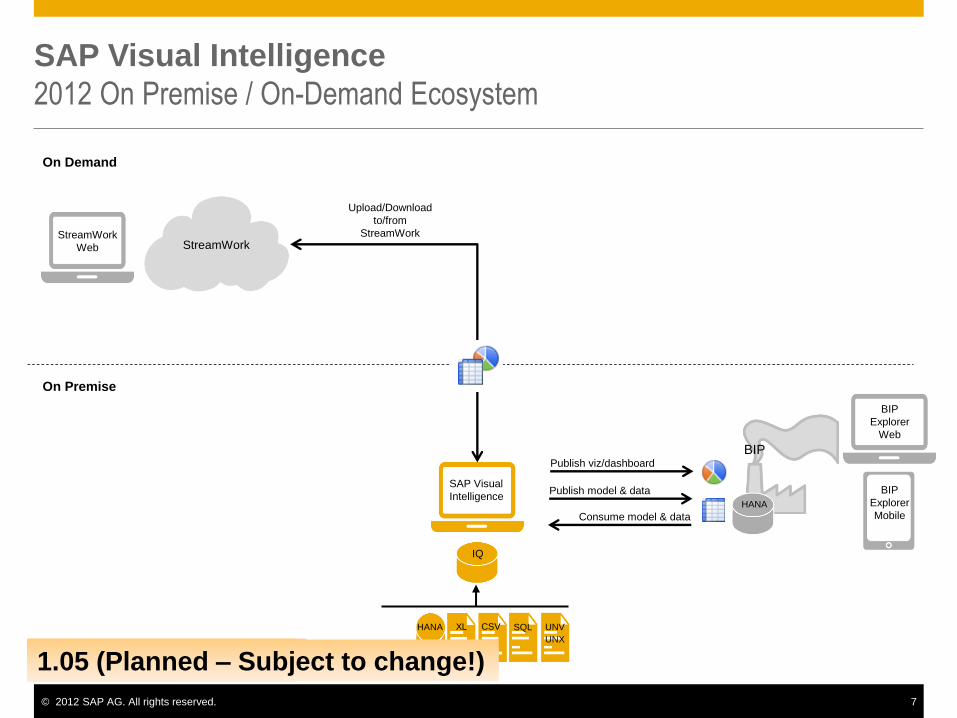
SAP Visual Intelligence
2012 On Premise / On-Demand Ecosystem
SAP Visual
Intelligence
CSV HANA XL SQL UNV
IQ
StreamWork
Web StreamWork
BIP
Explorer
Web
BIP
Explorer
Mobile HANA
BIP
Publish model & data
Consume model & data
Upload/Download
to/from
StreamWork
Publish viz/dashboard
1.0.0 (May 15, 2012) 1.0.1 (June 27, 2012) 1.0.2 (July 27, 2012) 1.0.3/1.0.4
On Demand
On Premise
1.05 (Planned – Subject to change!) UNX

© 2012 SAP AG. All rights reserved. 8
DEMO 1
© 2012 SAP AG. All rights reserved. 9
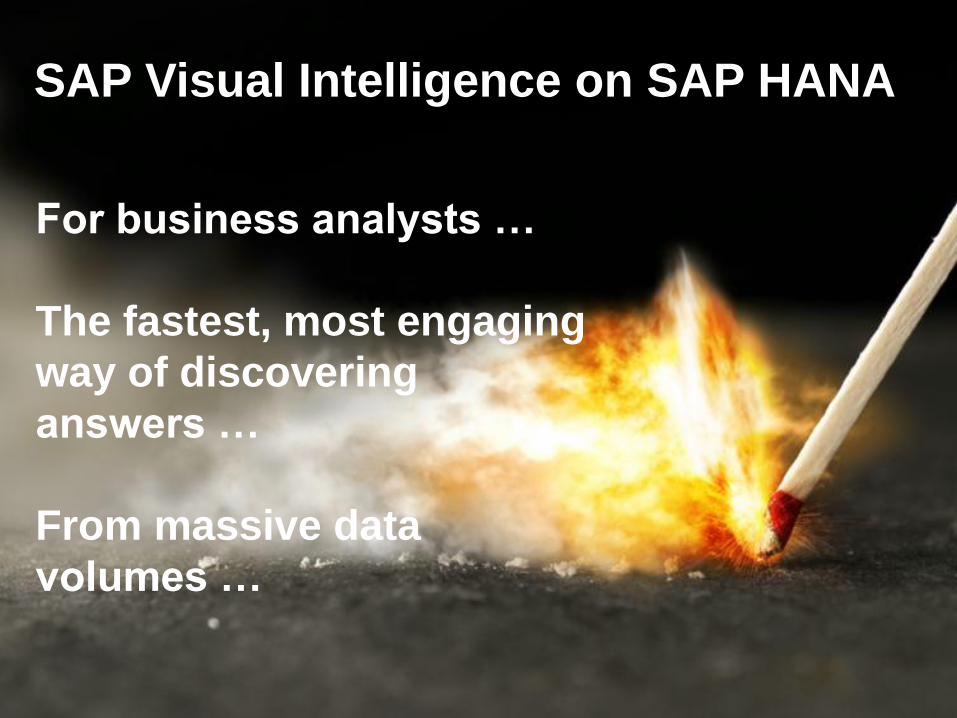
SAP Visual Intelligence on SAP HANA
For business analysts …
The fastest, most engaging
way of discovering
answers …
From massive data
volumes …
© 2012 SAP AG. All rights reserved. 10
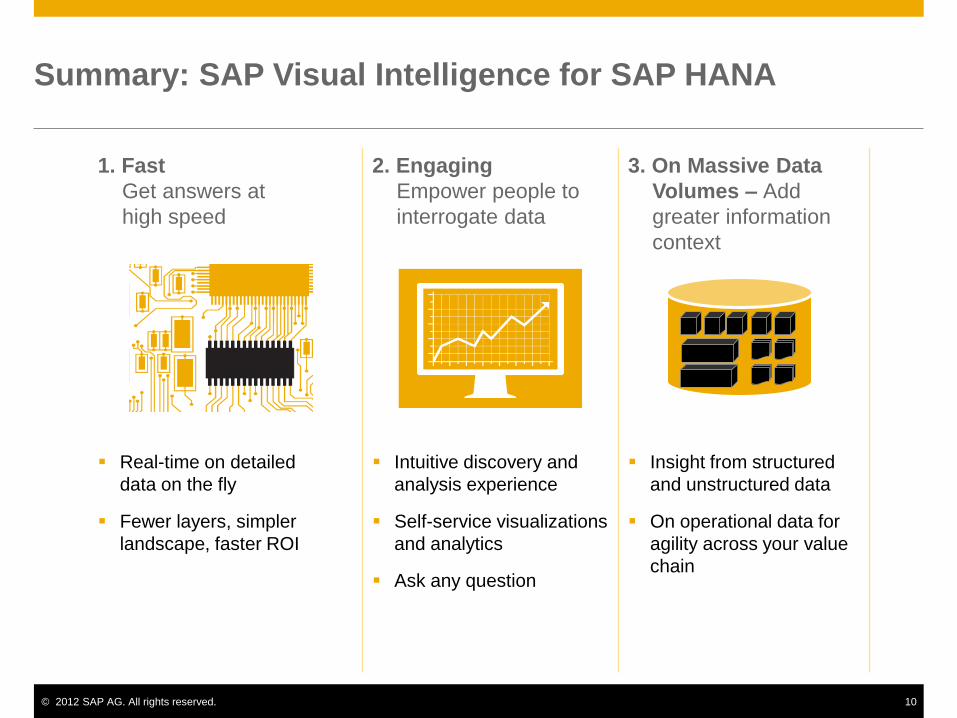
Summary: SAP Visual Intelligence for SAP HANA
1. Fast
Get answers at
high speed
2. Engaging
Empower people to
interrogate data
3. On Massive Data
Volumes – Add
greater information
context
Real-time on detailed
data on the fly
Fewer layers, simpler
landscape, faster ROI
Intuitive discovery and
analysis experience
Self-service visualizations
and analytics
Ask any question
Insight from structured
and unstructured data
On operational data for
agility across your value
chain

© 2012 SAP AG. All rights reserved. 11
DEMO 2
Access multiple data sources (CSV file and BusinessObjects Universe)
Data manipulation and merge
Group data and visualize
Publish data to HANA and StreamWork

© 2012 SAP AG. All rights reserved. 12
Benefits – SAP Visual Intelligence
For the Business For IT
Self-Service
Ability for end-users to create and
visualize their own analytics
without engaging IT
Increased User Adoption
of Analytics
Intuitive interface requiring minimal
user training
Faster Time to Analysis
Achieve faster response time and
better understanding with insight in
visual form from diverse data sources
Total Cost of Ownership
Leverage existing SAP HANA
investment ● 1 unified platform
to deploy and administer
Connected to the Enterprise
Leverage existing data, security,
and administrative services
Secure
One IT-sanctioned security
model

VISUAL
INTELLIGENCE
VS. EXPLORER:
WHAT ARE THE
DIFFERENCES?

© 2012 SAP AG. All rights reserved. 14
Visual Intelligence vs. Explorer: 3 Differences
Build Your
Own
Visualizations
Transform
Data The Way
You Want It
Acquire
Your Own
Data

© 2012 SAP AG. All rights reserved. 15
Visual Intelligence vs. Explorer: 3 Differences
1. Data Acquisition 2. Data Transformation 3. Data Visualizations
Acquire your own data
from different sources
Combine multiple
data sources
Transform data the way
you want it
Make data better suited for
discovery and analysis
Build your own
visualizations
More granular control and
advanced options
© 2012 SAP AG. All rights reserved. 16
SAP Visual Intelligence
Information Resources
Get your free trial on www.sap.com/trysapvisualintelligence
Link collection of all available material http://scn.sap.com/docs/DOC-29107
SCN Community http://scn.sap.com/community/visual-intelligence
Visual Intelligence on YouTube
http://www.youtube.com/playlist?list=PL8FF03148AD0742B1
End User Help http://help.sap.com/vi
Webinars on SCN http://scn.sap.com/community/webinars/business-analytics
Thank You!
Contact information:
Frank Rambo, Frank Bannert
blogs.sap.com/analytics
facebook.com/sapanalytics
twitter.com/#!/@businessobjects

© 2012 SAP AG. All rights reserved. 18
No part of this publication may be reproduced or transmitted in any form or for any
purpose without the express permission of SAP AG. The information contained
herein may be changed without prior notice.
Some software products marketed by SAP AG and its distributors contain
proprietary software components of other software vendors.
Microsoft, Windows, Excel, Outlook, and PowerPoint are registered trademarks of
Microsoft Corporation.
IBM, DB2, DB2 Universal Database, System i, System i5, System p, System p5,
System x, System z, System z10, System z9, z10, z9, iSeries, pSeries, xSeries,
zSeries, eServer, z/VM, z/OS, i5/OS, S/390, OS/390, OS/400, AS/400, S/390
Parallel Enterprise Server, PowerVM, Power Architecture, POWER6+, POWER6,
POWER5+, POWER5, POWER, OpenPower, PowerPC, BatchPipes,
BladeCenter, System Storage, GPFS, HACMP, RETAIN, DB2 Connect, RACF,
Redbooks, OS/2, Parallel Sysplex, MVS/ESA, AIX, Intelligent Miner, WebSphere,
Netfinity, Tivoli and Informix are trademarks or registered trademarks of IBM
Corporation.
Linux is the registered trademark of Linus Torvalds in the U.S. and other
countries.
Adobe, the Adobe logo, Acrobat, PostScript, and Reader are either trademarks or
registered trademarks of Adobe Systems Incorporated in the United States and/or
other countries.
Oracle and Java are registered trademarks of Oracle and/or its affiliates.
UNIX, X/Open, OSF/1, and Motif are registered trademarks of the Open Group.
Citrix, ICA, Program Neighborhood, MetaFrame, WinFrame, VideoFrame, and
MultiWin are trademarks or registered trademarks of Citrix Systems, Inc.
HTML, XML, XHTML and W3C are trademarks or registered trademarks of W3C®,
World Wide Web Consortium, Massachusetts Institute of Technology.
© 2011 SAP AG. All rights reserved.
SAP, R/3, SAP NetWeaver, Duet, PartnerEdge, ByDesign, SAP BusinessObjects
Explorer, StreamWork, and other SAP products and services mentioned herein as
well as their respective logos are trademarks or registered trademarks of SAP AG
in Germany and other countries.
Business Objects and the Business Objects logo, BusinessObjects, Crystal
Reports, Crystal Decisions, Web Intelligence, Xcelsius, and other Business
Objects products and services mentioned herein as well as their respective logos
are trademarks or registered trademarks of Business Objects Software Ltd.
Business Objects is an
SAP company.
Sybase and Adaptive Server, iAnywhere, Sybase 365, SQL Anywhere, and other
Sybase products and services mentioned herein as well as their respective logos
are trademarks or registered trademarks of Sybase, Inc. Sybase is an SAP
company.
All other product and service names mentioned are the trademarks of their
respective companies. Data contained in this document serves informational
purposes only. National product specifications may vary.
The information in this document is proprietary to SAP. No part of this document
may be reproduced, copied, or transmitted in any form or for any purpose without
the express prior written permission of SAP AG.