francisco sá head of soft drinks - ambevri.ambev.com.br/arquivos/ambev_apr_20050929m_eng.pdf ·...
TRANSCRIPT

Francisco Sá
Head of Soft Drinks
AgendaSoft Drinks
The Brazilian Soft Drinks Market
Profitability Evolution
AmBev’s Soft Drink Strategy

75
189
246
429
2001 2002 2003 2004
Profitability Evolution
15.4% 29.4%18.5%7.3%EBITDA MarginEBITDA Margin
EBITDACAGR = 79%
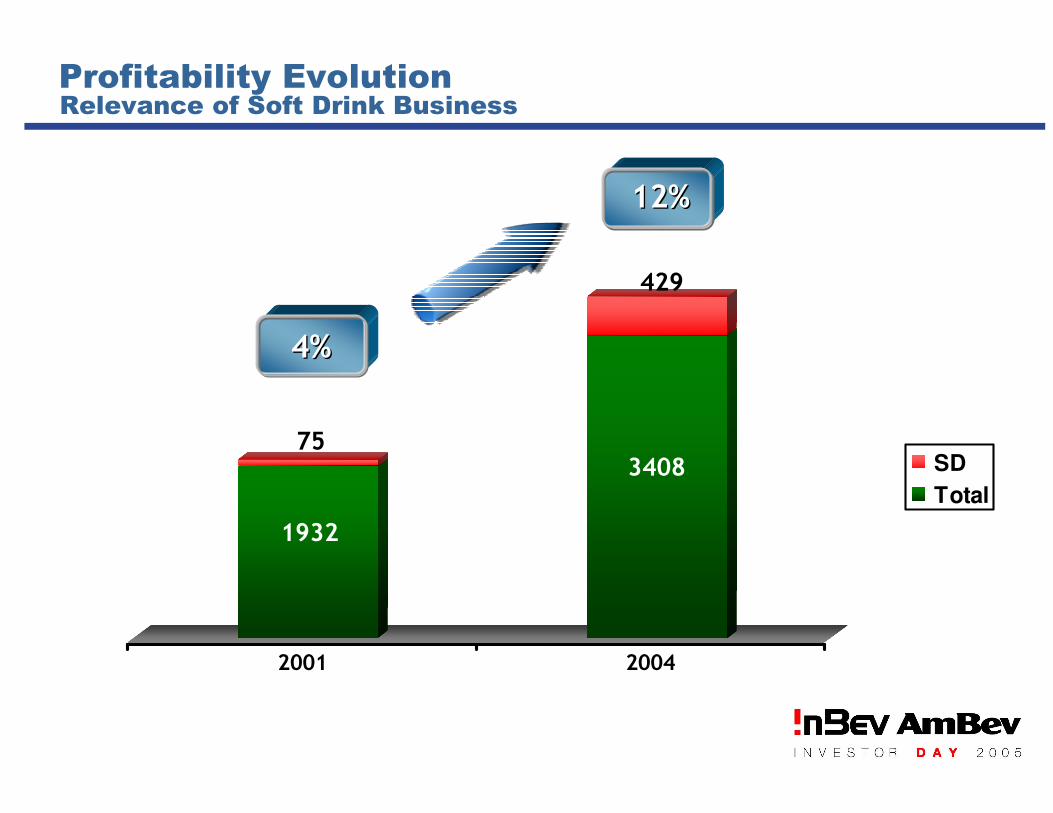
Relevance of Soft Drink Business
1932
753408
429
2001 2004
SD
Total
4%4%
12%12%
Profitability Evolution
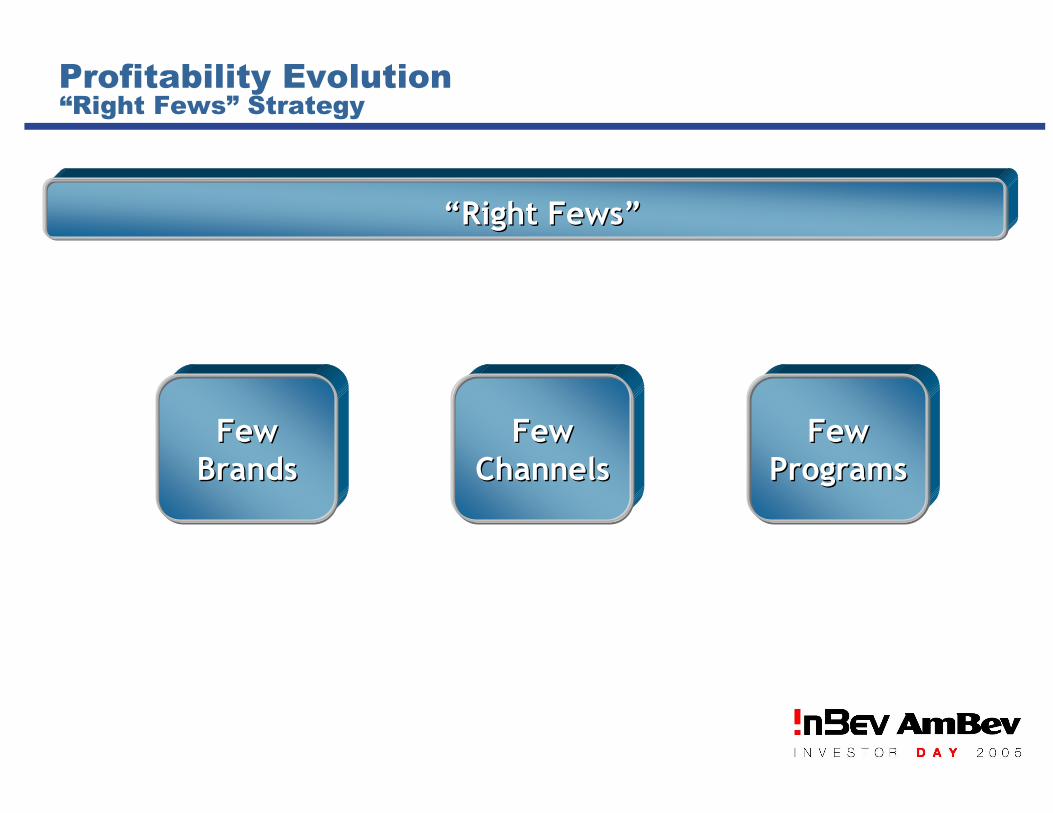
“Right Fews” Strategy
“Right Fews”“Right Fews”
FewBrandsFew
BrandsFew
ChannelsFew
ChannelsFew
ProgramsFew
Programs
Profitability Evolution
The “Right Fews” StrategyProfitability Evolution
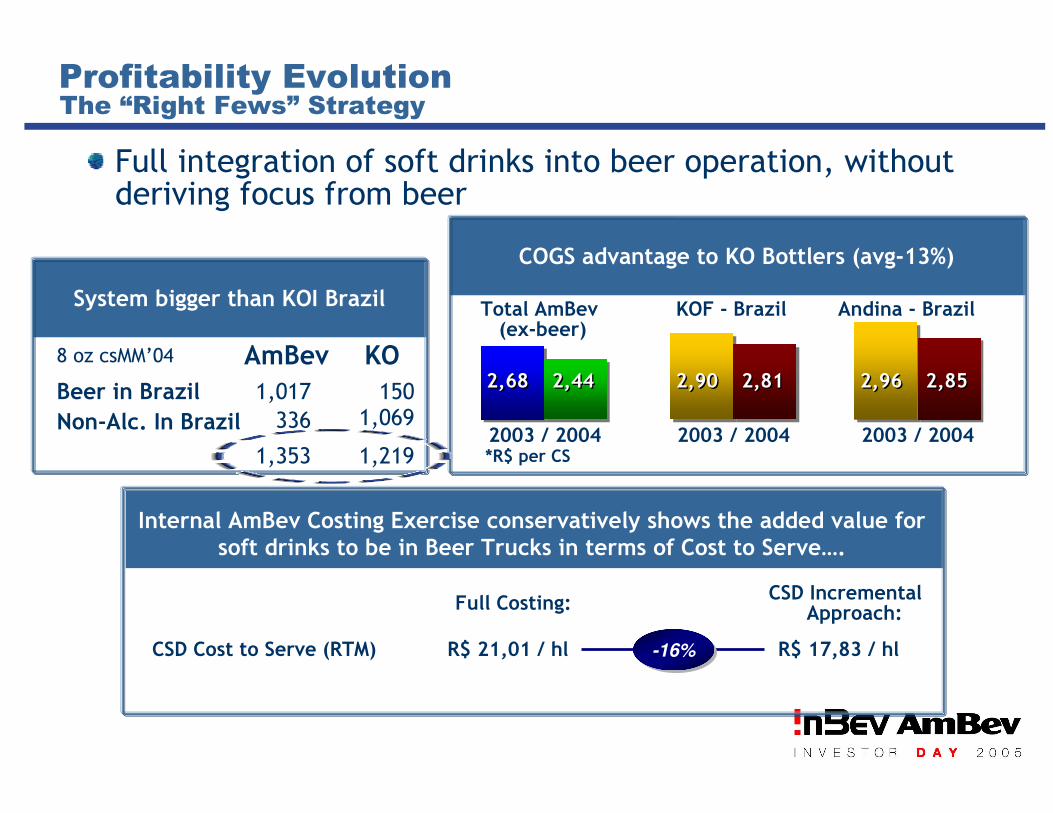
Full integration of soft drinks into beer operation, without deriving focus from beer
COGS advantage to KO Bottlers (avg-13%)
Internal AmBev Costing Exercise conservatively shows the added value for soft drinks to be in Beer Trucks in terms of Cost to Serve….
-16%-16%CSD Cost to Serve (RTM) R$ 17,83 / hlR$ 21,01 / hl
Full Costing: CSD Incremental Approach:
COGS advantage to KO Bottlers (avg-13%)
Total AmBev (ex-beer)
KOF - Brazil Andina - Brazil
2,682,68 2,442,44
2003 / 2004
2,902,90 2,812,81
2003 / 2004
2,962,96 2,852,85
2003 / 2004*R$ per CS
System bigger than KOI Brazil
8 oz csMM’04 AmBev KO
Beer in Brazil
Non-Alc. In Brazil
1,017
336
1501,069
1,353 1,219
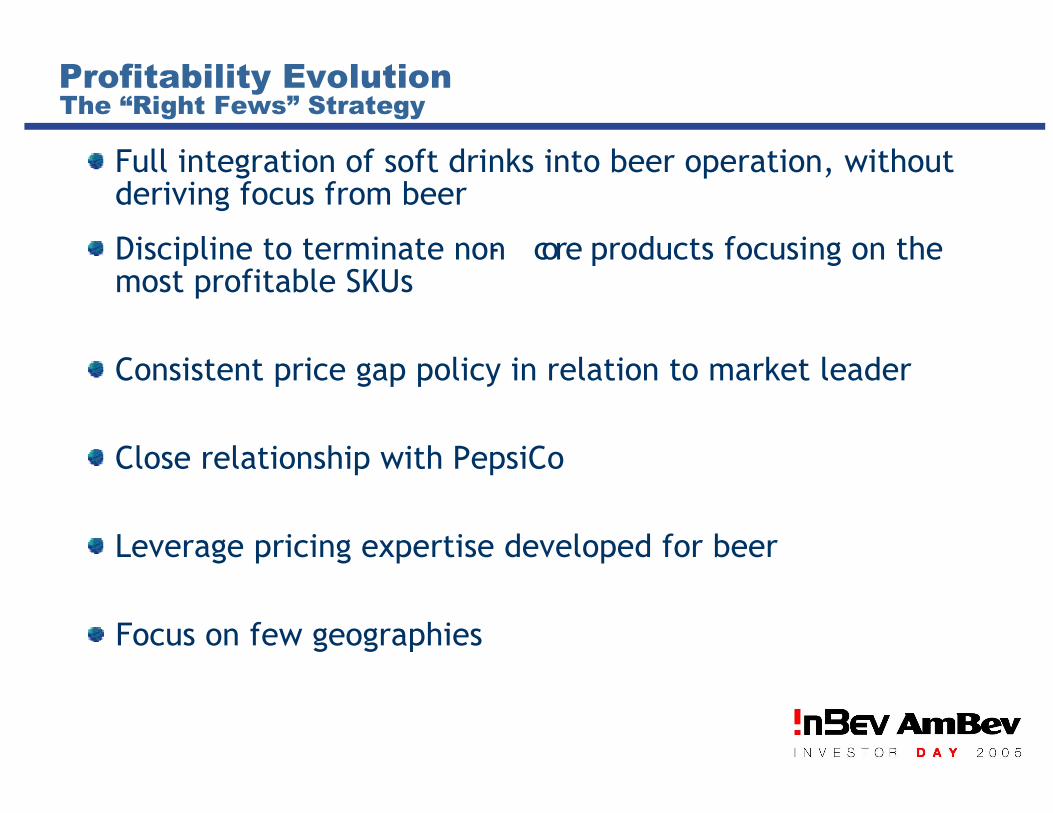
The “Right Fews” StrategyProfitability Evolution
Discipline to terminate non- core products focusing on the most profitable SKUs
Consistent price gap policy in relation to market leader
Close relationship with PepsiCo
Leverage pricing expertise developed for beer
Focus on few geographies
Full integration of soft drinks into beer operation, without deriving focus from beer
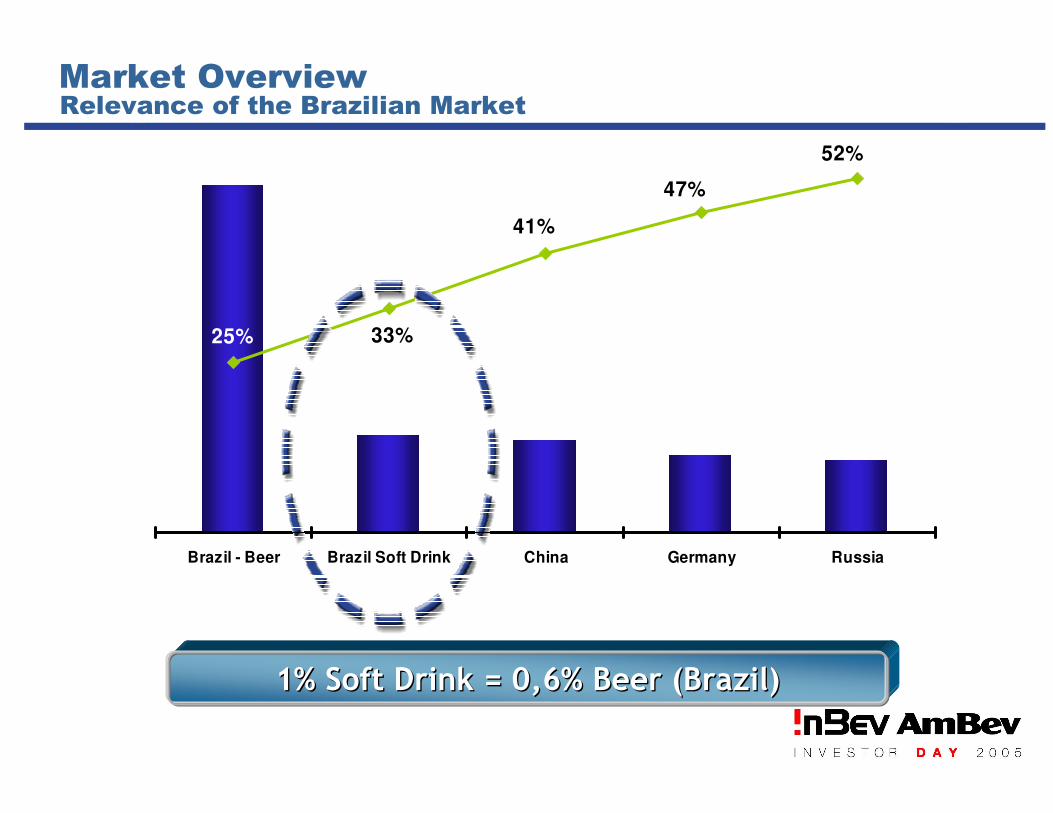
1% Soft Drink = 0,6% Beer (Brazil)1% Soft Drink = 0,6% Beer (Brazil)
52%
47%
41%
33%25%
0
10
20
30
40
50
60
70
80
Brazil - Beer Brazil Soft Drink China Germany Russia
0%
10%
20%
30%
40%
50%
60%
Market OverviewRelevance of the Brazilian Market

50%
16%
12%
22%51%
49%
2005 YTD
Market Overview
Flavors
Cola
Guaraná
Orange
Lemon
Others
Flavor Segmentation
AmBev’s Guaraná Antarctica is the#1 Guarana Brand
Market Overview
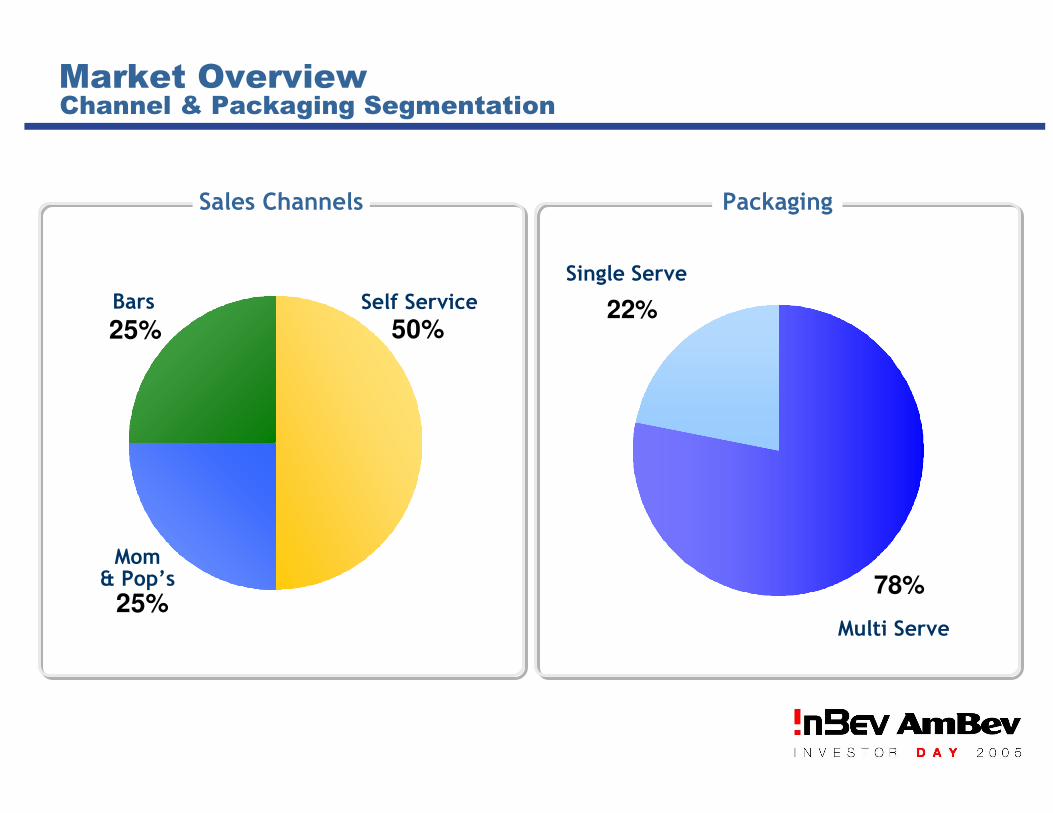
25%
25% 50%22%
78%
Sales Channels Packaging
Channel & Packaging Segmentation
Self Service
Mom& Pop’s
Bars
Single Serve
Multi Serve
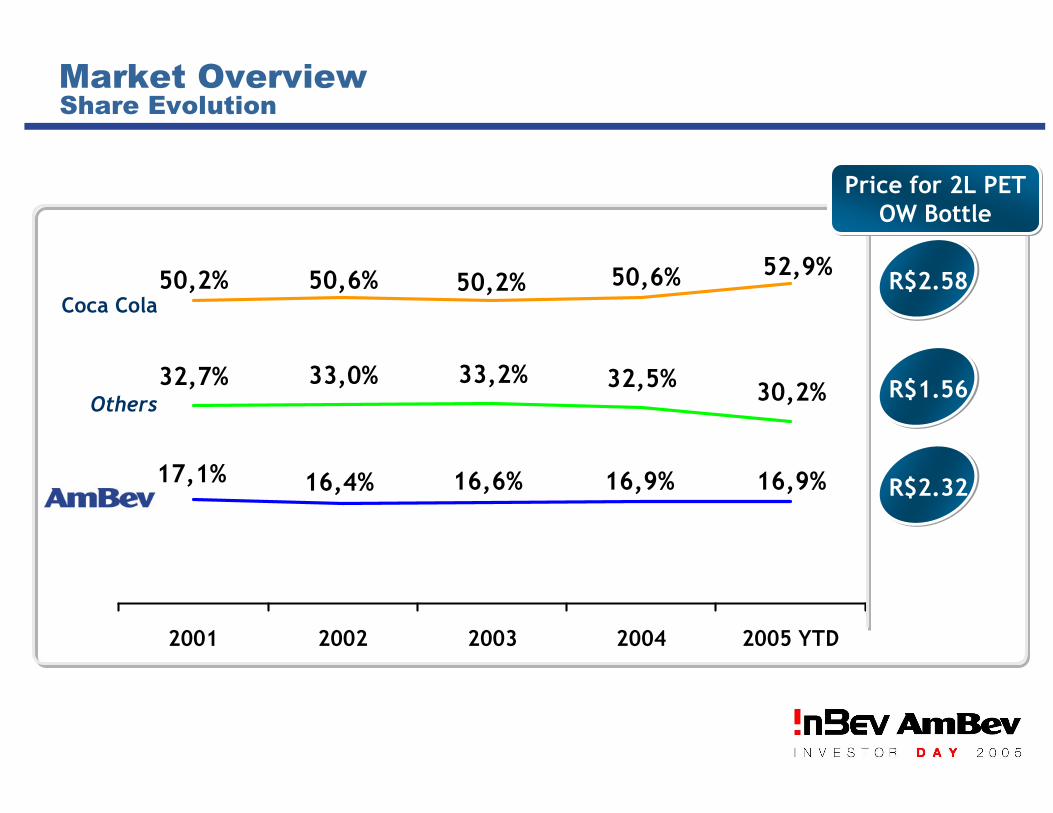
32,7% 33,0% 33,2% 32,5%30,2%
50,2% 50,6% 50,2% 50,6% 52,9%
16,9%16,9%16,6%16,4%17,1%
2001 2002 2003 2004 2005 YTD
Coca Cola
Others
Market OverviewShare Evolution
R$2.58
R$1.56
R$2.32
Price for 2L PET OW Bottle
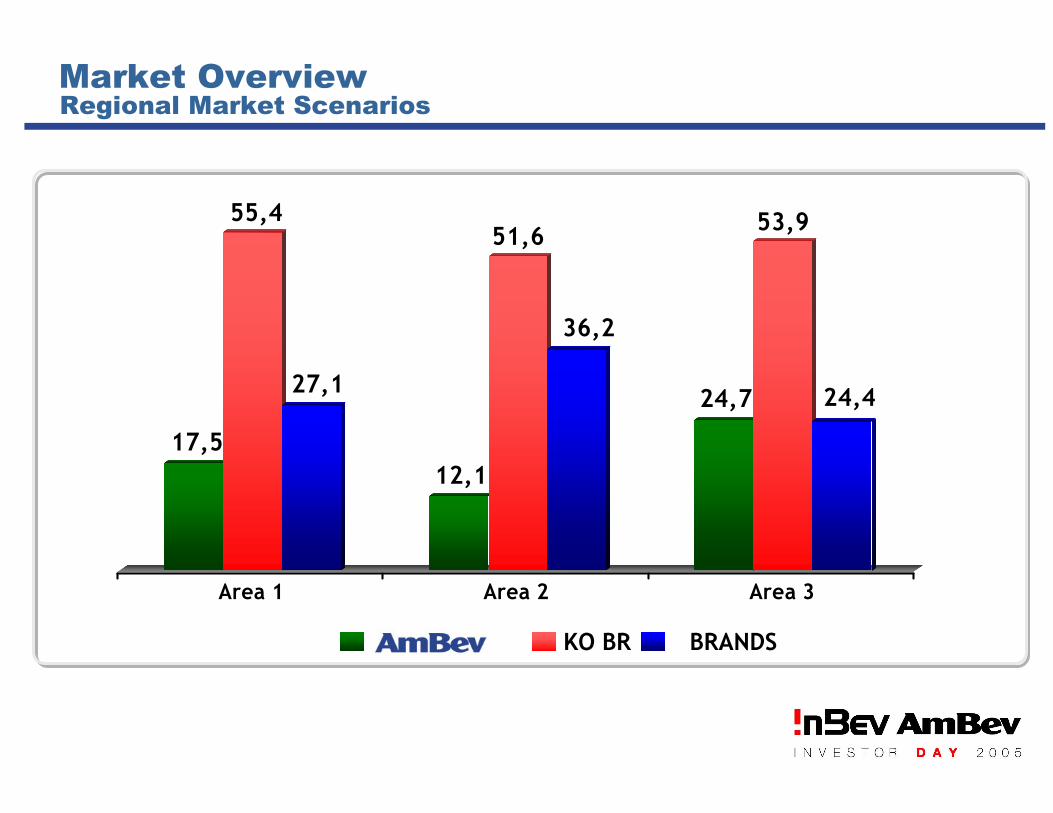
17,5
55,4
27,1
12,1
51,6
36,2
24,7
53,9
24,4
Area 1 Area 2 Area 3
Market OverviewRegional Market Scenarios
AMBEV KO BR BRANDS
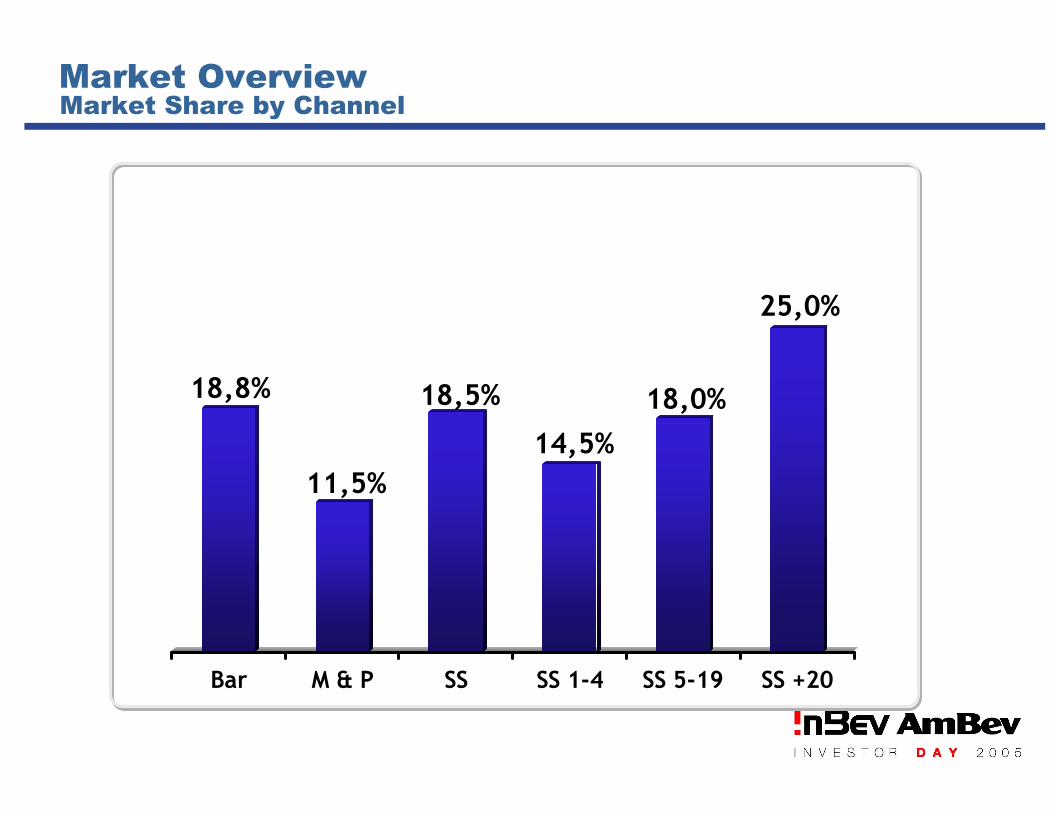
18,8%
11,5%
18,5%
14,5%
18,0%
25,0%
Bar M & P SS SS 1-4 SS 5-19 SS +20
Market Share by ChannelMarket Overview
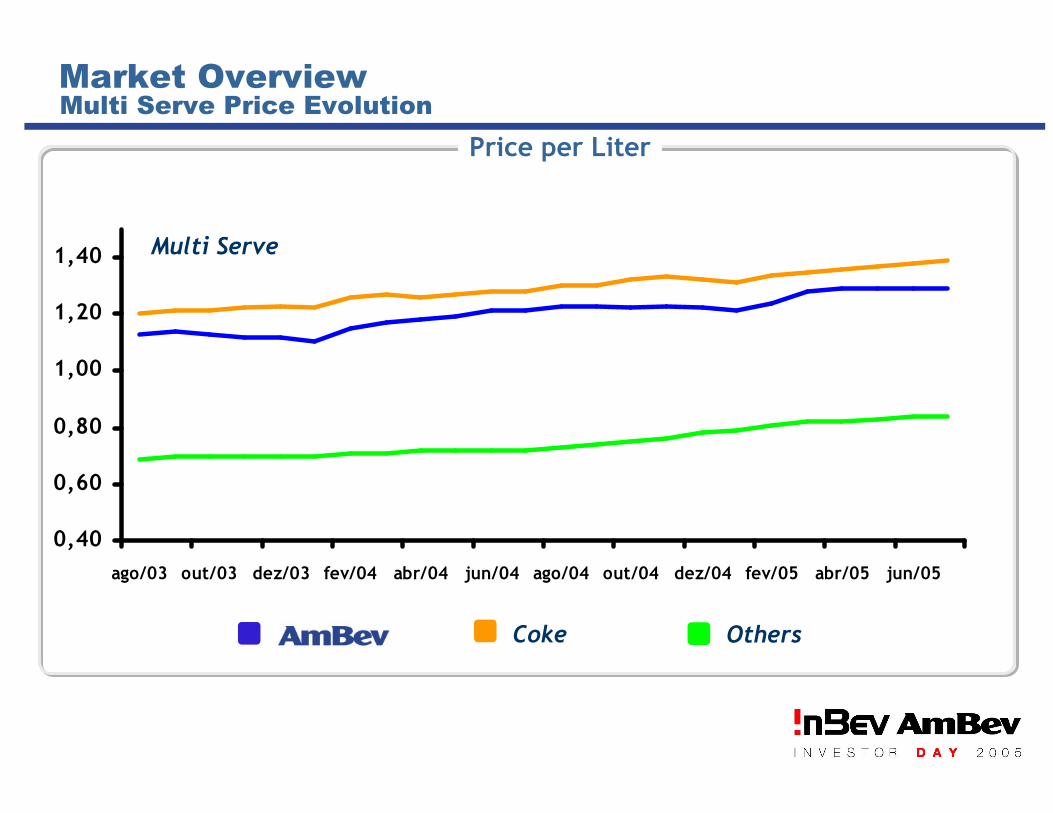
Market OverviewMulti Serve Price Evolution
Price per Liter
0,40
0,60
0,80
1,00
1,20
1,40
ago/03 out/03 dez/03 fev/04 abr/04 jun/04 ago/04 out/04 dez/04 fev/05 abr/05 jun/05
Multi Serve
AmBev Coke Others

93
95
97
99
101
103
105
jul/00 jan/01 jul/01 jan/02 jul/02 jan/03 jul/03 jan/04 jul/04 jan/05
2L OW PET
Market OverviewOW 2L Pet Real Price Evolution
Real Price Index
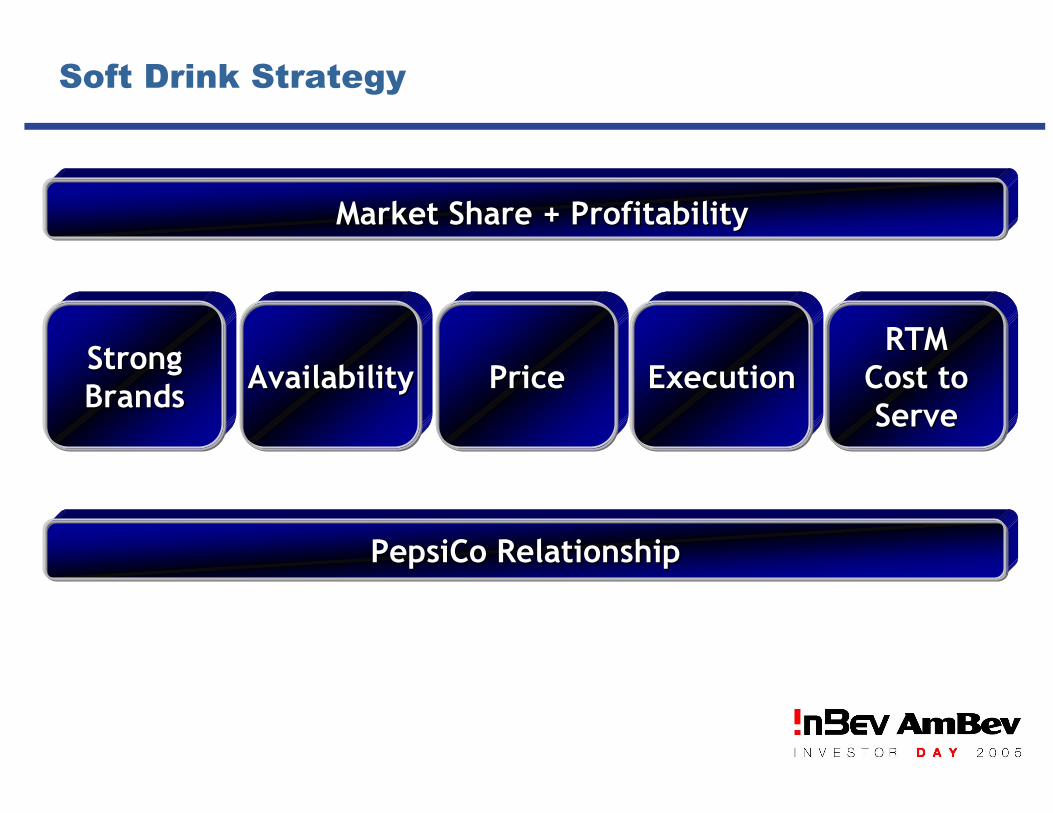
Soft Drink Strategy
Market Share + ProfitabilityMarket Share + Profitability
StrongBrandsStrongBrands
AvailabilityAvailability PricePrice ExecutionExecutionRTM
Cost to Serve
RTMCost to Serve
PepsiCo RelationshipPepsiCo Relationship
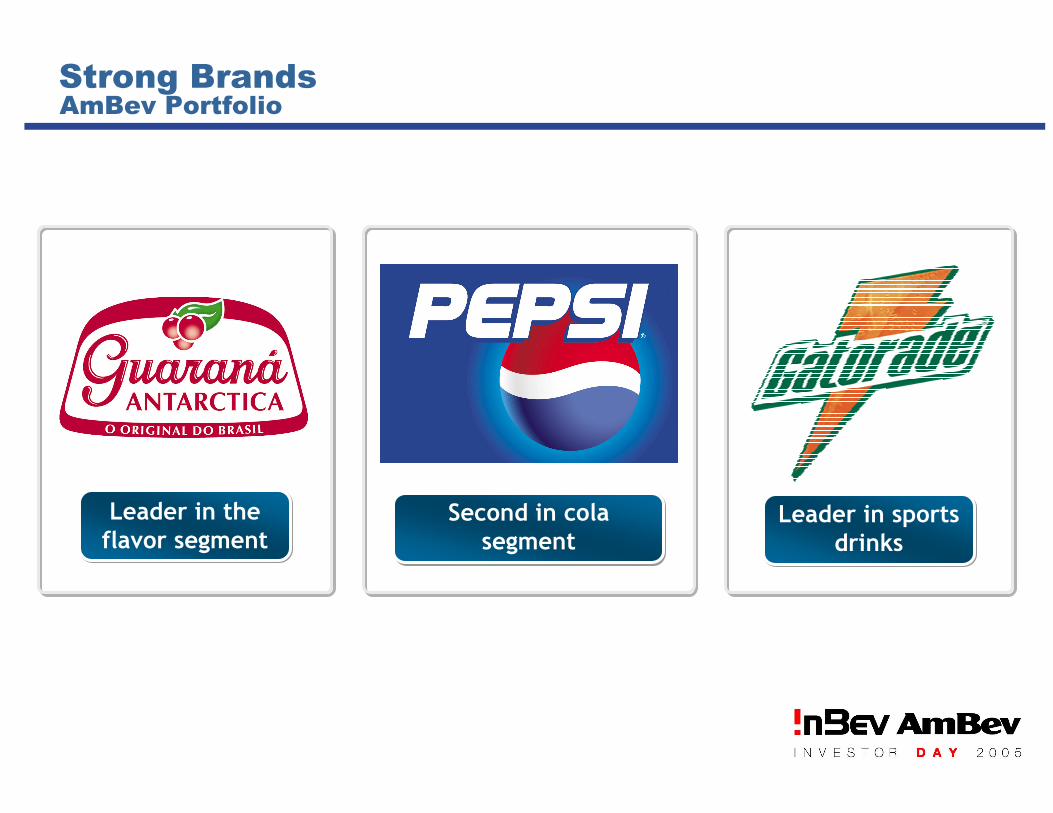
Strong BrandsAmBev Portfolio
Leader in theflavor segment
Second in cola segment
Leader in sportsdrinks

36%
92,0%
8,0%
91,6%
8,4%
2000 2005
DevelopmentAmBev Share
Strong BrandsOpportunity in the Diet / Light Segment
AmBev Diet/LightBrand Equity
A B C D E F G
CC LCC LCC L
CC L
CC LCC LCC L
GA D
GA D
GA DGA DGA D
GA DGA D
K L
PC LPC L
PC L
PC L
PC LCC L LCC L L
CC L L
CC L L
CC L LCC L L
CC L L
PT L
PT LPT L
PT L
PT LPT L
PT L

Strong BrandsKey Brand Indicators
Preference
Consideration
Awareness 100
76
17
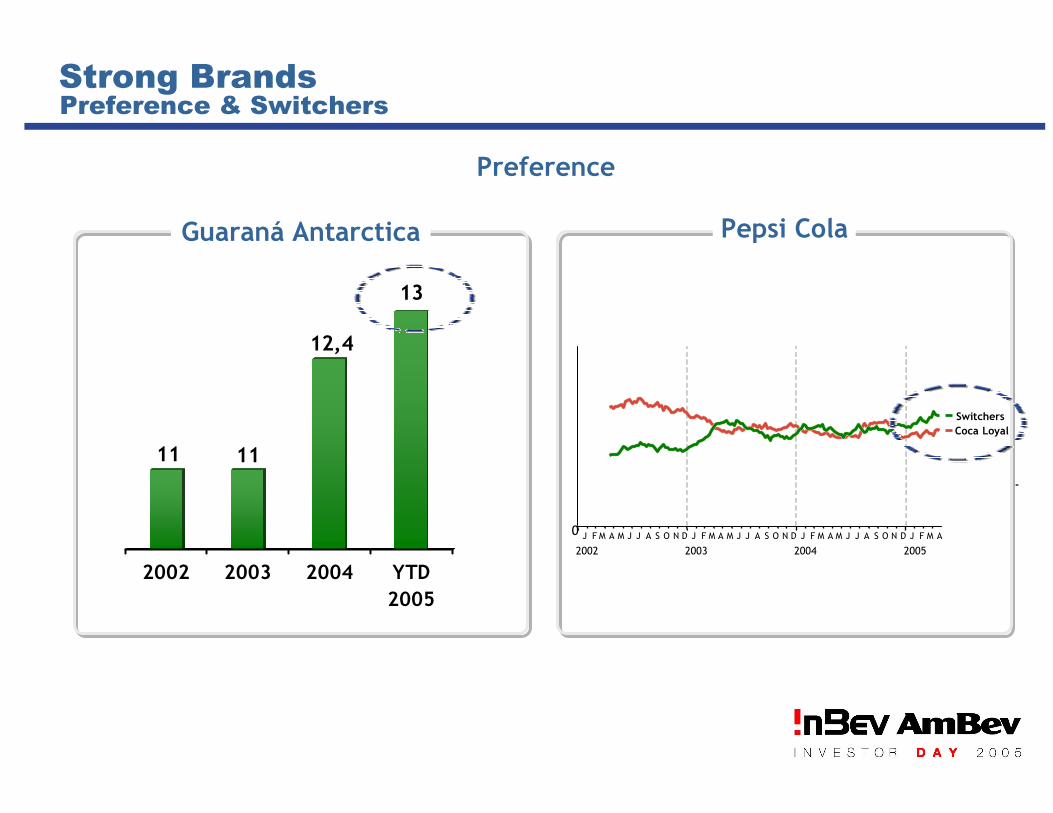
11 11
12,4
13
2002 2003 2004 YTD
2005
Strong Brands
Preference
Guaraná Antarctica Pepsi Cola
Preference & Switchers
0
2002
J F M A M J J A S O N D
2003
J F M A M J J A S O N D
2004
J F M A M J J A S O N D
2005
J F M A
Coca Loyal
-
Switchers
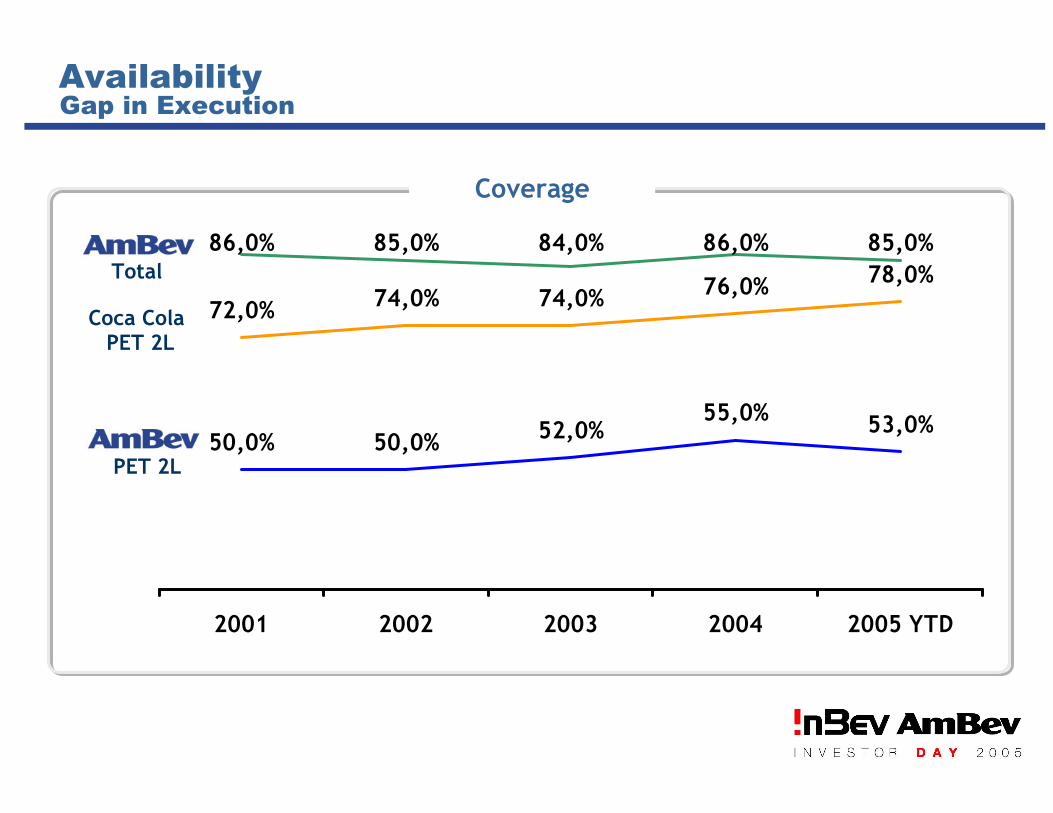
AvailabilityGap in Execution
72,0% 74,0% 74,0% 76,0% 78,0%
50,0% 50,0% 52,0%55,0% 53,0%
86,0% 85,0% 84,0% 86,0% 85,0%
2001 2002 2003 2004 2005 YTD
Coverage
Coca Cola
PET 2L
Total
PET 2L
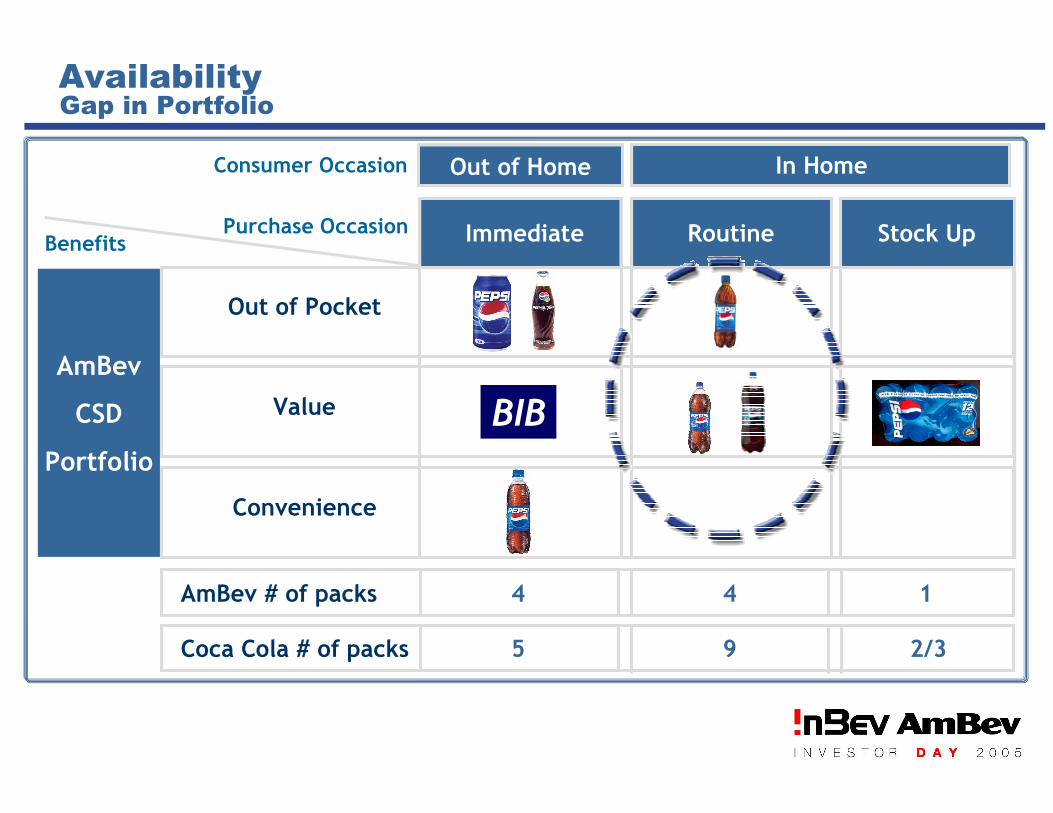
44AmBev # of packs
95Coca Cola # of packs
Convenience
Value
Out of Pocket
Out of Home
BIB
AvailabilityGap in Portfolio
AmBev
CSD
Portfolio
In Home
Stock Up
1
2/3
RoutineImmediate
Consumer Occasion
Purchase OccasionBenefits
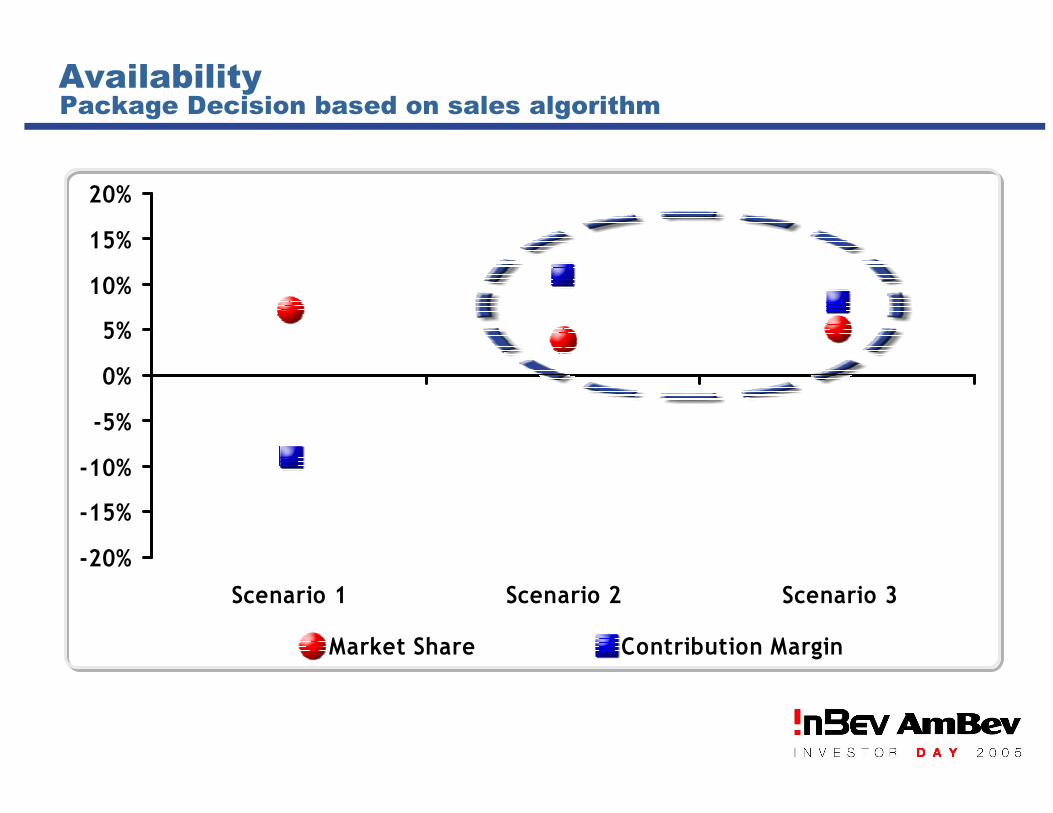
-20%
-15%
-10%
-5%
0%
5%
10%
15%
20%
Scenario 1 Scenario 2 Scenario 3
Market Share Contribution Margin
Package Decision based on sales algorithmAvailability
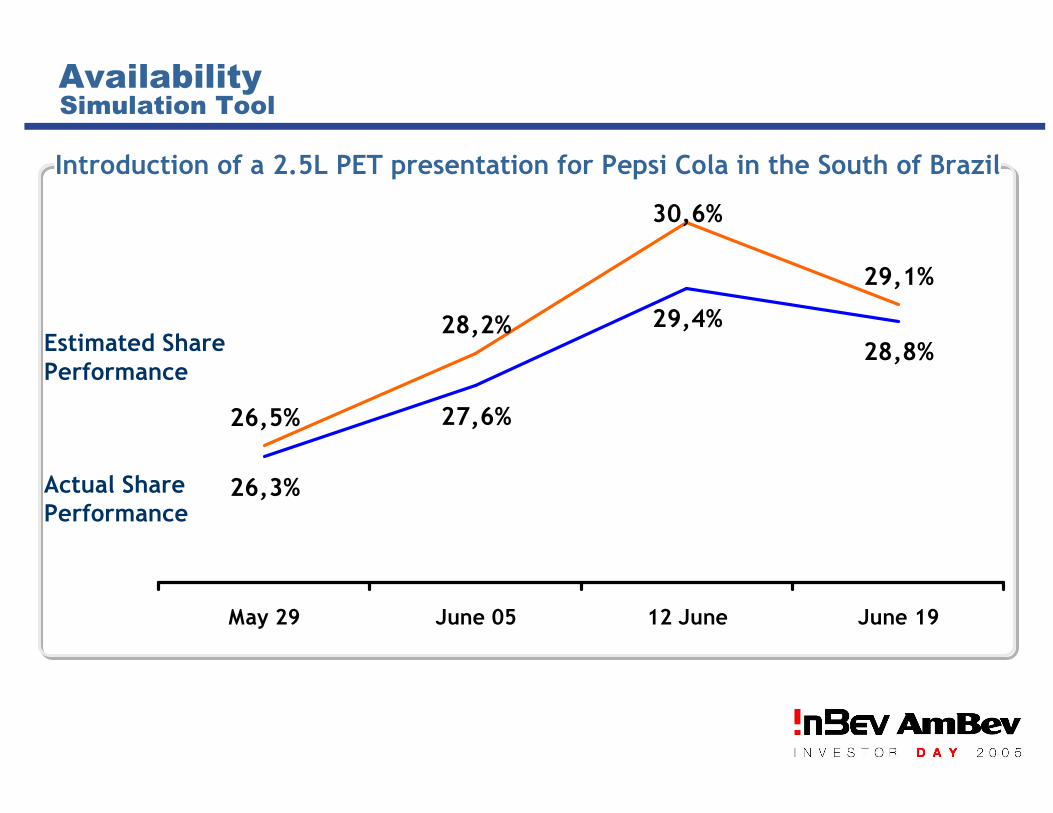
28,2%
27,6%
28,8%
26,5%
29,1%
30,6%
26,3%
29,4%
May 29 June 05 12 June June 19
Simulation Tool
Actual SharePerformance
Estimated SharePerformance
Introduction of a 2.5L PET presentation for Pepsi Cola in the South of Brazil
Availability
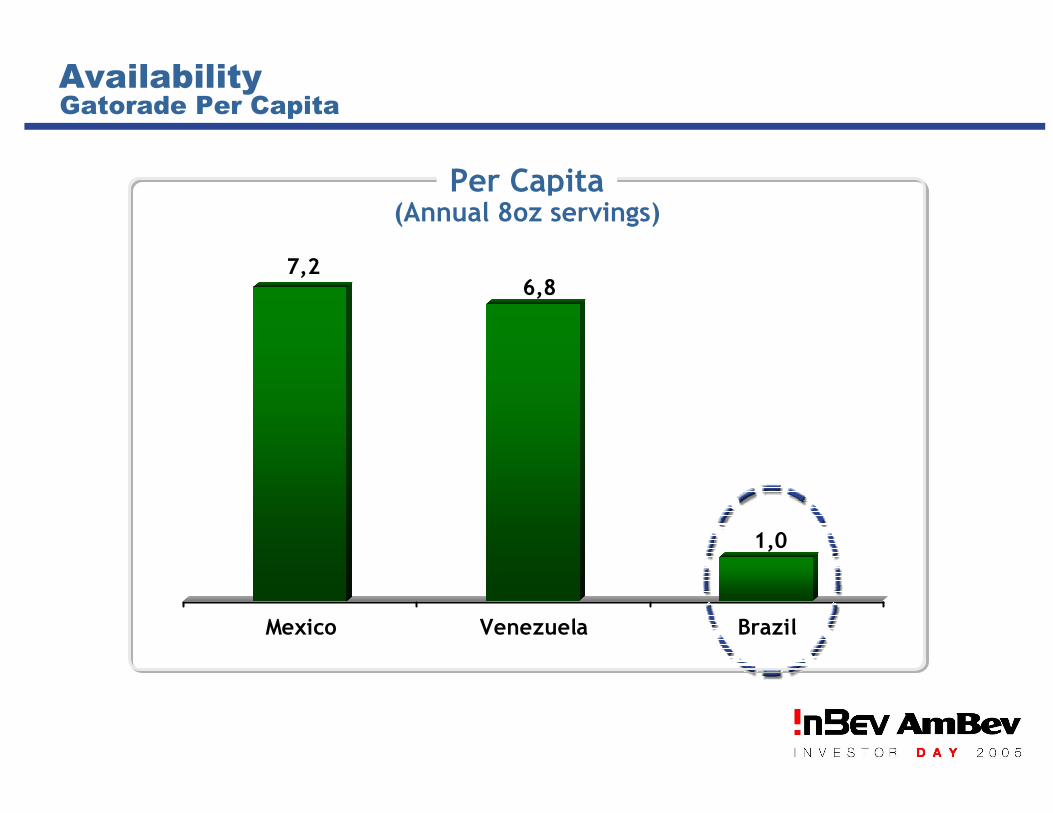
Per Capita
Availability
7,26,8
1,0
Mexico Venezuela Brazil
(Annual 8oz servings)
Gatorade Per Capita
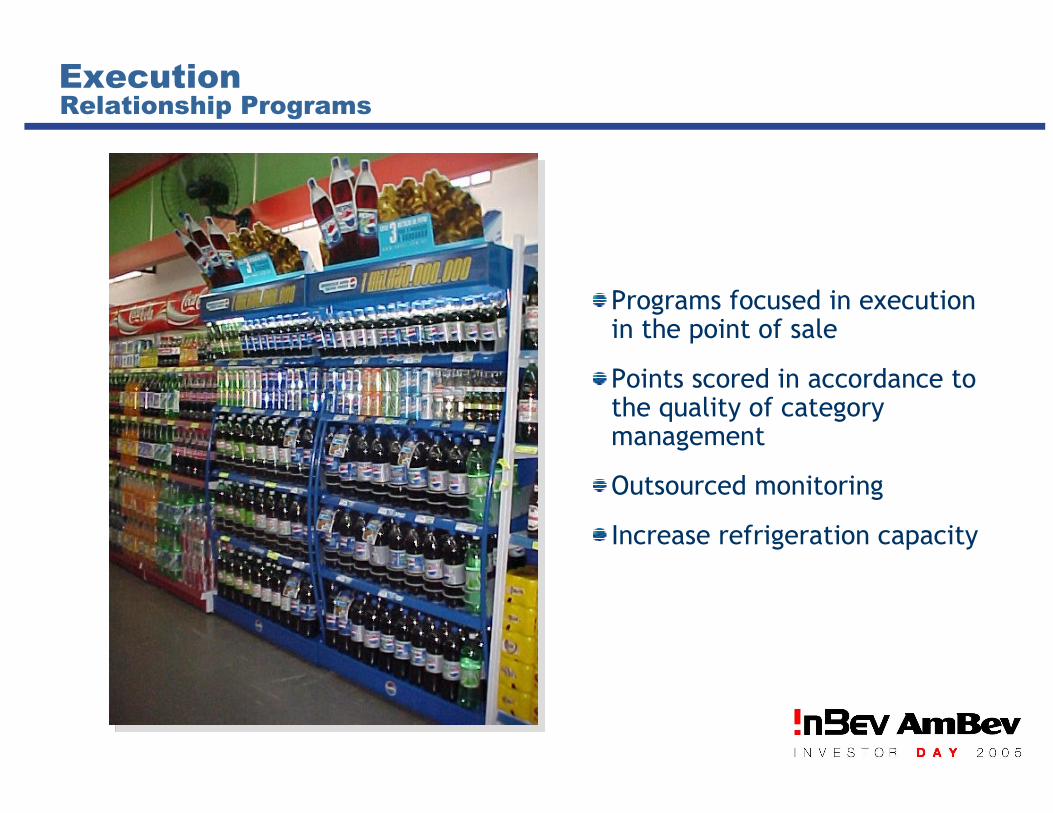
Programs focused in executionin the point of sale
Points scored in accordance to the quality of categorymanagement
Outsourced monitoring
Increase refrigeration capacity
ExecutionRelationship Programs
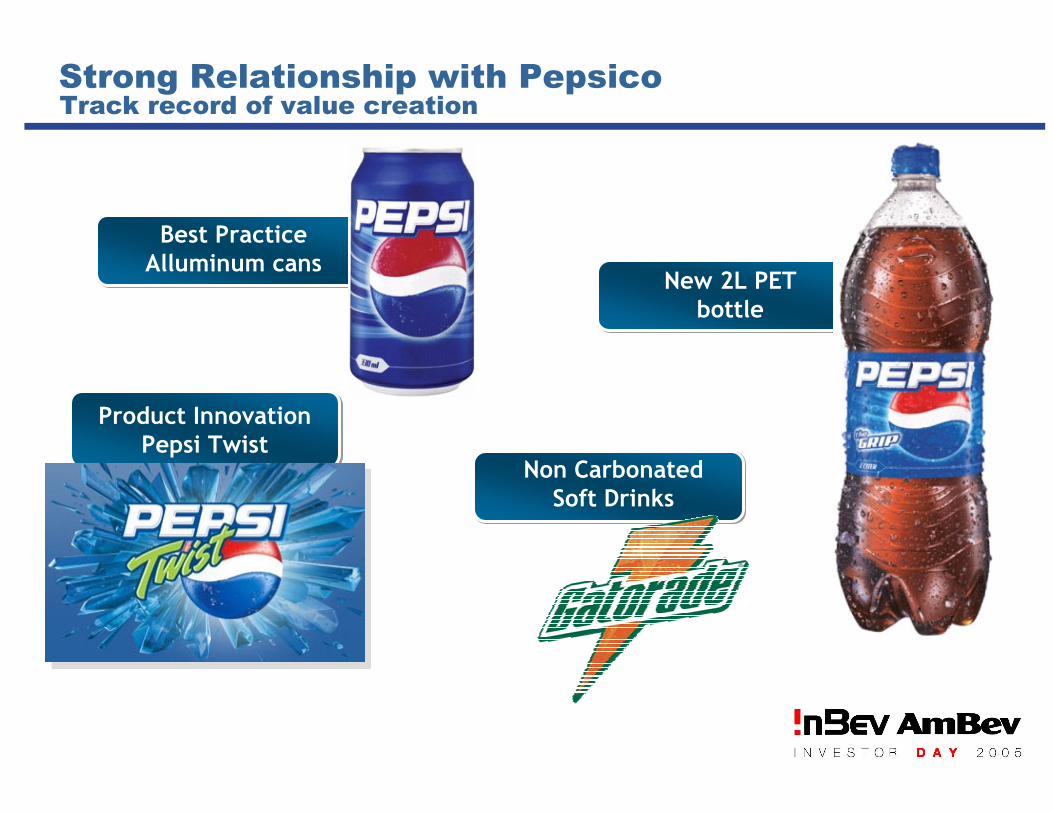
New 2L PET bottle
Best PracticeAlluminum cans
Strong Relationship with PepsicoTrack record of value creation
Non CarbonatedSoft Drinks
Product InnovationPepsi Twist
Strong Relationship with PepsicoTrack record of value creation
Brand innovations adapted to local consumers to boost share with profitability
Improved brand equity indicators with the correct mix of local/global initiatives
Stronger local team structure to support the business
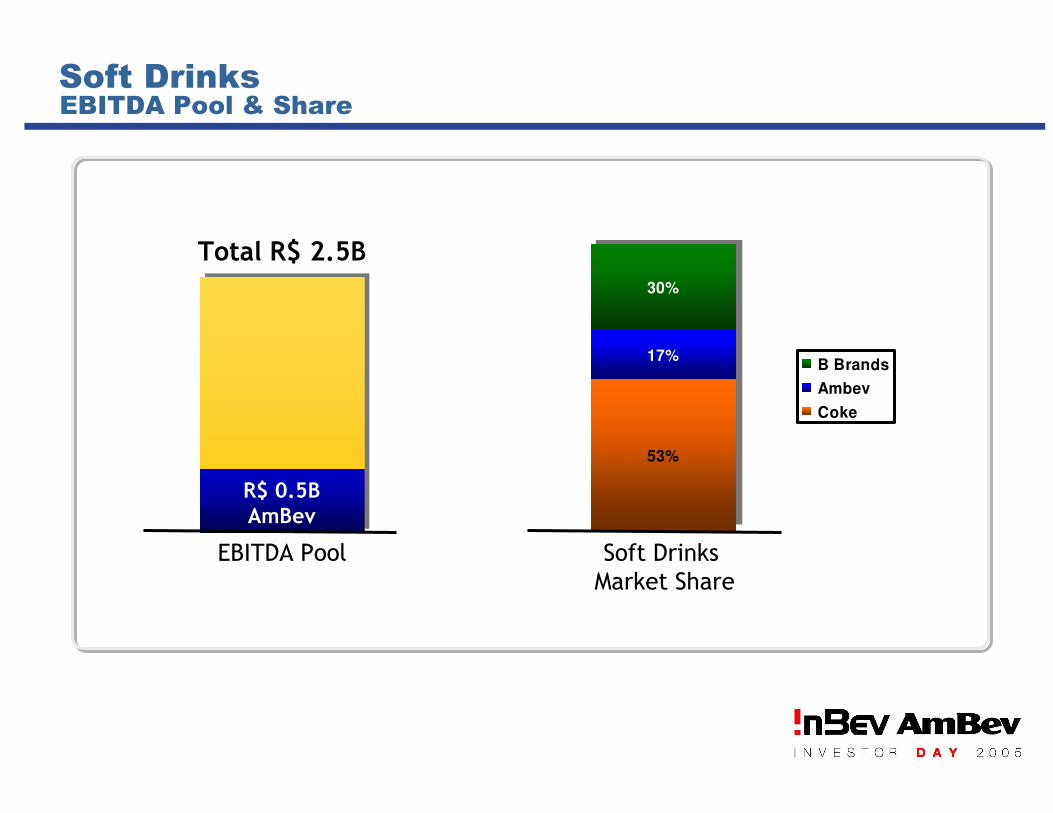
Soft DrinksEBITDA Pool & Share
Total R$ 2.5B
R$ 0.5BAmBev
EBITDA Pool
53%
17%
30%
B Brands
Ambev
Coke
Soft Drinks Market Share