france - elibrary.imf.org...clude that the positive response of saving to interest rate increases...
TRANSCRIPT


©International Monetary Fund. Not for Redistribution
France
Financial and Real Sector Issues

©International Monetary Fund. Not for Redistribution
lhispage intentionally left hlank

©International Monetary Fund. Not for Redistribution
France
Financial and Real Sector Issues
Edited by Paul R. Masson
International Monetary Fund Washington • 1995

©International Monetary Fund. Not for Redistribution
© 1995 International Monetary Fund
Book design and production by IMF Graphics Section
Library of Congress Cataloging-in-Publication Data
France, financial and real sector issues I edited by Paul R. Masson. p. em.
Includes bilbiographical references. ISBN 1-55775-491-8 I. France-Economic policy-1981- 2. Finance, Public-France.
I. Masson, Paul R. HC276.3.F735 1995 330.994'0839-dc20
Price: US$24.00
Please send orders to: International Monetary Fund, Publication Services
700 19th Street, N.W., Washington, D.C. 20431 U.S.A. Tel.: (202) 623-7430 Telefax: (202) 623-7201
Internet: [email protected]
95-40587 CIP

©International Monetary Fund. Not for Redistribution
Contents
Acknowledgments . . . . ." . . . . . . . . . . . . . . . . . . . . . . . . . . . . . . . . . . . . . . . vii
Introduction . . . . . . . . . . . . . . . . . . . . . . . . . . . . . . . . . . . . . . . . . . . . . . . . . 1
1. Why Is Unemployment in France So High? 6 Rezo Moghodom
2. Household Saving in France: Stochastic Income and Financial Deregulation . . . . . . . . . . . . . . . . . . . . . . . . . . 65 Jonotho11 D. Ostry and Jooquim Levy
3. The Link Between Real Interest Rates and French Aggregate Private Investment. . . . . . . . . . . . . . . . . . . . . 88 Mark Toy/or
4. ERM Money Supplies and the Transition to EMU . . . . . . . . . . . . . . . . . . . . . . . . . . . . . . . . . . . . . . . . 112 Moree/ Cossord, Timothy Ltmc, and Paul R. Masson
5. The Taxation of Returns from Personal Savings in France . . . . . . . . . . . . . . . . . . . . . . . . . . . . . . . . . . 146 Gory O'Collaghan
6. Some Considerations Relevant to Prefunded Pensions in France . . . . . . . . . . . . . . . . . . . . . . . . . . . . . . . 173 Joaquim Levy
Glossary . . . . . . . . . . . . . . . . . . . . . . . . . . . . . . . . . . . . . . . . . . . . . . . . . . . 207
v

©International Monetary Fund. Not for Redistribution
lhispage intentionally left hlank

©International Monetary Fund. Not for Redistribution
Acknowledgments
D he work undertaken here was the result of a joint effort of the mission teams working on France, and the authors of these studies are
graceful for the advice and encouragement of their colleagues. First and foremost, thanks are due to Massimo Russo, Director of the European I Department, who influenced the topics undertaken, headed the missions to France in 1993-94, and supported the initiative of publishing these studies in a book. Michael Deppler also had many useful comments in the light of his past responsibility for work on France. Claude Bismut contributed to these studies with numerous comments and suggestions, as did various officials in Paris. However, the analysis reported here is the responsibility of the authors themselves, and does not necessarily represent the views of the Fund or other official institUtions. Simon Willson of the External Relations Department of the IMF edited the manuscript for publication and coordinated production.
We are also grateful to Aline Clark, Nahid Mejib, and Rosalind Oliver for their conscientious and good-nacured preparation of the texts, and to Susan Becker and Kote Nikoi for statistical assistance.
Paul R. Masson
vii

©International Monetary Fund. Not for Redistribution
lhispage intentionally left hlank

©International Monetary Fund. Not for Redistribution
Introduction
1':1 ranee has undergone major transformations over the past decade . .. The French economy, formerly plagued by persistent inflation and frequent devaluations, has achieved a degree of price and exchange rate stability similar to Germany's. The past decade has, in general, also been characterized by a return to fiscal rectitude in France, after the expansionary policies of the early 1980s. However, the recent recession has highlighted some severe structural problems. Most seriously, the unemployment rate has risen co levels that were previously unknown in postwar France. Moreover, the decline in real growth from the abnormally high levels of the lace 1980s revealed serious fiscal imbalances chat go beyond merely cyclical deficits.
Clearly, France faces major challenges as it enters the second half of chis decade. One is the integration of the French economy with chose of its European Union (EU) neighbors. To some extent, it is appropriate co sec this as a continuation of a long-term trend that began soon after the Second World War with the formation of the European Payments Union and the European Coal and Steel Community, and the subsequent signing of the Treaty of Rome. However, it must also be recognized that the next major step envisaged, full economic and monetary union (EMU), would represent a dramatic break with the existing regime, in which EU members retain primary control over the levers of macroeconomic policy. A successful transition to a European monetary policy will require that the economies of the member countries develop increased flexibility co substitUte for the ability to run a national monetary policy-notwithstanding the fact that this degree of freedom has not always been used co good effect.
The need for structural changes to enhance the economy's flexibility is made more pressing by not only the starting point of high unemployment, but also by constraints on the possibility of providing further subsidies or tax incentives for employment. The situation of the public finances-a general government deficit equal ro 6 percent of GOP in 1994, and a debt-to-GOP ratio that, though lower than in many of France's partners,

©International Monetary Fund. Not for Redistribution
2 FRANCE: FINANCIAL AND REAL SECTOR ISSUES
has risen alarmingly in recent years-precludes measures that would further widen the deficit. This is especially so given the context of the Maastricht Treacy: to qualify for EMU, a country must reduce its deficit below 3 percent of GOP (barring exceptional circumstances) and keep it under that ceiling thereafter. From a medium- to long-term perspective, moreover, there are worrisome tendencies related co demographic trends chat will tend to widen deficits, especially those of the social security accounts.
Unemployment is the most serious symptom of France's structural problems. l t is clear chat the high level of social chatges provides a disincentive to hiring workers, especially at low skill levels. It is also widely accepted among economists chat the relatively high minimum wage discourages hiring of some workers. To some extent, the French Government has begun co replace social charges on labor income with a broader tax on all incomes. However, the scope for reducing the tax wedge on labor income is constrained by the fact chat labor income is such a large fraction of national income, and because capital, being mobile, is difficult to tax. Given budgetary constraints, France will therefore have to build a consensus in favor of addressing structural problems by reducing social benefits and cutting back on government expenditures generally, while at the same time creating room for maneuver to reduce tax disincentives. As for the minimum wage, an attempt co reduce it for younger workers ran into widespread opposition, and this issue has become highly politicized.
The chapters that follow attempt to shed some light on these policy challenges. They were prepared as background for the 1993 and 1994 Article IV consultations with France, and have not been updated with the most recent data. However, the issues considered are still important to French policy, and the analysis contained in the studies remains valid .
•••
The first chapter, by Reza Moghadam, is an in-depth study of the causes of French unemployment and its possible remedies. The fact chat unemployment has ratcheted up over the past decade, not falling much below 9 percent even in the boom years of 1988-89, argues that high unemployment in France is a structural, not a cyclical, phenomenon. Moghadam presents evidence on the contributions of French employers to social charges-which constitute part of the tax wedge making the cost to the employer greater than the employee's remuneration; these are very high, even compared with other European countries. Empirical relationships linking long-run or structural unemployment to the employers' tax wedge and the real value of the minimum wage are presented.

©International Monetary Fund. Not for Redistribution
171trotlucrion 3
Moghadam concludes that these factors must be addressed in order to achieve a durable solution to France's unemployment problem.
The second chapter, by Jonathan Osrry and joaquim Levy, anempts to explain trends in household saving; as a ratio co disposable income, it exhibited a steady decline over the 1980s, and then rose by 4 percentage points, reaching 14 percent in 1993. Since weak consumer demand was one of the causes of the 1993 recession, discovering its causes was important ro assess the prospects for recovery. From a longer-term perspective, household saving provides a large source of funds for domestic investment, and hence will influence the economy's ability to invest profitably withour resort to foreign saving.
The authors first examine whether the fall in consumption in the early 1990s reflected precautionary saving resulting from the greater perceived riskines,; of future income. While they find some evidence that the variance of innovations to income affects saving, the impact is much smaller than rhc traditional effect of expected future income. The authors proceed ro rest a broader set of explanations of saving behavior. The most striking finding is the important role of financial deregulation during the 1980s, which encouraged household borrowing. The aurhors also conclude that the positive response of saving to interest rate increases has been permanently enhanced as a result.
The interest elasticity of investment is the subject of the next chapter, by Mark Taylor. In France, researchers have long found it difficult ro identify any separate effect of interest rates on the level of investment, which seemed to follow changes in income as predicted by the accelerator model of investment. Such a result was justified by appeal to a zero elasticity of substitution between the factors of production, which would leave no room for relative factor prices (the ratio of wages to the cost of capital) to affect employment or investment. Not only is a zero elasticity in sharp contrast with estimates for other countries, it also throws inro question the linkages through which monetary policy affects the real economy and the virtues of wage restraint in stimulating employment.
It is therefore reassuring that, using modern econometric techniques, Taylor finds a statistically significant and economically important effect of expected future real shore-term interest rates on business investmenc (through their effect on relative factor prices). Moreover, these results suggest that an important part of the slowdown of activity in 1992-93 can be attributed to high real interest rates in Europe. Indeed, gross fixed capital formation in France declined in each of the three years 1991-93, by a cumulative 1 5 percent.
The existing regime, with the objective of maimaining the French franc within rhe exchange rare mechanism (ERM) margins of fluctuation (now

©International Monetary Fund. Not for Redistribution
4 FRANCE: FINANCIAL AND REAL SECTOR ISSUES
widened to I 5 percent) has at rimes strongly constrained the room for maneuver of French monetary policy. Not only was France obliged ro match German interest rates, but, at times of srrong speculative pressure-September-November 1992 and January-March 1993-French short-term rates were raised far above German rates in order to defend the franc. These episodes illustrate the pitfalls of an incompletely credible pegged exchange rate arrangement and the advantage of full monetary union where fears of exchange rate realignment would be absent. The next swdy, by Marcel Cassard, Timothy Lane, and Paul Masson, explores ways of facilitating a smooth transition co monetary union, and, in particular, the use that could be made of a cross-country monetary aggregate. The authors point out that, given the extent of integration of financial markets that already exists among a core group of ERM countries, it is possible that shifts between currencies would lead to national demands for money being unstable. In contrast, an aggregate of those countries' money supplies might have a more stable demand funcrion. This result seems ro emerge from the data on the basis of their econometric estimates; it might therefore be desirable to give increasing weight co a coreERM monetary aggregate, relative to purely national money targets. Two other arguments reinforce this recommendation: if implemented in the anchor country (Germany) it would represent a more European approach tO monetary policy, consistent with the eventual goal of monetary union, under which policy would be guided by monetary conditions in all member countries. Empirical evidence in the form of causality tests also suggests that core-ERM money is a becrer predictor of German prices in the post-1983 period than German M3 alone, suggesting that greater attention ro a core-ERM monetary aggregate would also be in Germany's narrow interest.
The next study, by Gary O'Callaghan, considers how tax policy affects the allocation of saving and investment. In particular, he examines how differences in the taxation of various instruments in France can lead to distortions favoring one type of investment over another-often for no good economic reason. Indeed, changes co taxation in this area have often involved correcting inequities by creating a new tax-favored instrument, which then creates distortions of its own. The author argues convincingly that a level playing field in which similar instruments are taxed in the same way would increase economic efficiency.
A significant feature of the French financial system is the tax advantage granted to insurance policies, which are an important vehicle for saving. In contrast, there is little saving in the form of private (prefunded) pensions, which are very prominent in several other countries, such as the United States and the United Kingdom. Interest in private pensions has increased

©International Monetary Fund. Not for Redistribution
l11troduction 5
with the widespread recognition that the public pension system, which is financed on a pay-as-you-go basis, will not be able co maintain generous benefit levels without very large increases in contribution rates, given that in France, as in many other industrial countries, the average age of the population is projected to rise dramatically in coming decades.
The final paper, by ]oaquim Levy, considers how private pensions could be encouraged, what form they might take, and what their effect might be in stimulating the development of the French financial system. Though private pensions cannot make up for the fact that the public system is unfunded, the author argues that a transition to a system with both public pensions (somewhat reduced in generosity) and funded private pensions might minimize the welfare losses associated with the higher contributions that will be needed. Moreover, these pension plans could be managed by existing financial institutions, on the model of those in the United Kingdom or the United States, rather than involving book entries by the companies themselves, as in the German model. The resulting pool of capital might favor private ownership of France's enterprises and permit a more competitive business environment .
•• •
In conclusion, the studies in this book treat issues of central concern to the French economy's prospects until the end of the century and beyond. They are presented in the hope that they will add co the fund of economic knowledge and contribute co an informed debate of the policy issues.

©International Monetary Fund. Not for Redistribution
IGIJliii¥1ii•1@1W
Why Is Unemployment tn France So High?
REZA MOGHADAM
Gl igh unemployment in France has persisted despite the fact that in
recent years France's macroeconomic performance has compared favorably with the other major industrial or EU countries in other respects. Since 1987, growth has been in line with EU and major industrial-country averages while inflation has been below both. Low inflation has contributed to improved competitiveness and, recently, tO trade surpluses. However, employment creation was disappointing even in times of strong growth and the recent recession has led to a sharp fall in employment.
Unemployment not only puts pressure on government finances and inflicts a heavy social cost; it also has more wide-ranging economic consequences. The higher the structural unemployment in an economy, the lower its potential output, and hence the average standard of living, will bt.:. Furthermore, high unemployment can endanger the credibility of monetary policy. For example, a rise in interest rates-for instance, to protect the level of the exchange rate-may be viewed as unsustainable by the financial markets and have a perverse impact. The crises in the European ERM during 1992 and 1993 are testimony tO this. 1 There are, therefore, many rcasons to seek a better understanding of the problem of high unemploymen t.
This chapter investigates the causes of unemployment in 17ram:t.: and assesses the effectiveness of potential policy responses aimed at reducing it. The chapter is organized as follows: Section I examines the nawrc of unemployment in France; Section II identifies some of the potential facrors contributing to unemployment by comparing France with other industrial nations and by using cross-section regressions; Section Ill
1 Drazen and Masson ( 1994) find suppon for the hypothesis that persistence in unemployment can undermine the credibility of monetary policy.
6

©International Monetary Fund. Not for Redistribution
Why Is U11cmploymenl i11 Frn11ce So High? 7
provides some £ime-series evidence on the long-run and short-run causes of unemployment; Sections IV and V examine recent labor marker measures; and Section VI assesses these measures and considers other potential policy responses to structural unemployment.
I. History and Composition of French Unemployment
The Rise and Rise of U nemployment
Following the first oil shock and the onset of recession in 1974-75, unemployment in France rose continuously from just under 3 percent in 1973 co a peak of 10.7 percent in 1987. It then declined gradually to 8.8 percent in 1 990 before resuming its ascent (Chart I ).
Both labor supply and demand facrors appear to have contributed to the rise in unemployment. Between 19'70 and 1 992, the labor force grew by about 16 percent, equivalent tC' 3 .. \ million people (Chart 2). This growth came about in spite of a fall in rhc aggregate participation raceZ during the 1 980s-the increase in female participation was more than offset by a decline in male participation (Chart 2):1 The growth in the labor force was thus concurrent with an even larger increase in the population of working age, conventionally defined as those aged between 15 and 64.
During the same period, employment growth has been disappointing: there was no net increase in employment between the mid-J970s and the late 1 980s. Male employment dropped almost continuously between 1973 and 1987 as employment in the uaditionally male-dominated industrial sectors such as mining, chemicals, and metals declined. Growth in the ser .. vice sector and opportunities for part-time work boosted female employment, which has grown continuously since the early 1 970s, albeit nm as fast as the increase in the female labor force (Chart 3).
Why has the high growth of the labor force not been accompanied by an equivalent increase in employment? An increase in the labor supply should, in theory, lead to higher output through lower real wages, increased competitiveness, and increases in production capacity unless the labor market is inflexible. Besides, there have been similar demographic developments in other industrial countries: in both Canada and the United States the average rate of growth of rhe labor force since 1 970
1Defined as LF!f'W = (£ + U)IPW. where LF is the labor force, E employment. U unemployment. and PW is the population of working age.
JThe fall in the male participation rate is not independent of the rise in unemployment and is panly due to the early retirement of the old unemployed: see discussion of participation ratr by age below.

©International Monetary Fund. Not for Redistribution
8 fRANCE: FINANCIAL AND REAL SECJ'OR ISSUES
Chart 1 . France: Unemployment, Growth, and Inflation
12 .------------------------------------------------.
10
8
6
4
Total Unemployment (In percent)
.. .. .. .. ..
.. .. .. .. .. .. .. ..
· - - ..
2 �����������--�����- �������� 1971 1973 1975 1977 1979 1981 1983 1985 1987 1989 1991 1993 7 .-----------------------------------------------------. 6 5
Annual percentage change
4 3 2
0
_, 1971
CPI growth (right scale)
.......... .·
Real GOP growth (left scale)
1973 1975 1977 1979 1981
·.
1983 1985 1987 1989 1991 1993
18 16 14 12 10 8 6 4 2 0
Sources: lnstitut National de Ia Statistique et des Etudes Economiques (INSEE), National Accounts; and IMF World Economic Outlook.
'To April 1993.
has been more than twice that in France, yet the average rate of growth of employment in the United States and Canada has been over four times that in France.
Over the last two decades the average rates of growth of the population of working age and of the labor force in France have been below the OECD average, though more or less in line with the EU average (Table 1). It is the rate of growth of employment in France that has been disappointing, particularly when compared with the OECD average in the 1980s.

©International Monetary Fund. Not for Redistribution
Why Is Unemployment i11 Fro11ce So High? 9
Chart 2. France: Labor Force, Population, and Participation
(1970 = 100) 114
112
110 .·
108
106 •• /Population
104
102
100UWWWWWWWWWWWWWWWWWWWWWW 70 72 74 76 78 80 82 84 86 88 90 92
65·0
70 72 74 76 78 80 82 84 86 88 90 92
.-------------------�120 (1970 = 100)
Population • • • • aged 1�4:'
115
110
105
UL�����������1oo 70 72 74 76 78 80 82 84 86 88 90 92
Participati on (In percent)
·-. ......... •• Male ·.
. . .
95
85
.. .. ... .. 75
65
- � �
55
70 72 74 76 78 80 82 84 86 88 90 92 45
Source: Organization for Economic Cooperation and Development (OECO), Historical Statistics.
Composition of Unemployment
Although the uend rise in unemployment can be observed in many other industrial countries, two factors characterize the French experience: unemployment peaked somewhat later than in the other major industrial countries, and the subsequent decline was not as sharp (Chart 1). This persistence suggests structural imbalances in the labor market that are also reflected in the composition of unemployment.

©International Monetary Fund. Not for Redistribution
10 FRANCE: FINANCIAL AND REAL SECTOR ISSUES
Chart 3. France: Labor Force, Employment, and Unemployment (In millions of persons)
25.-------------------------------------------------�
24
23
22
21 - ·· . ·· . . .
......... .. .. · · ..
Unemployment
.. ... .. . .. -·· .. .. ... . .. .. ... . ··. ... Total employment
..· .......... ..
11.-------------------------------------------------�
10
9
8
.. .. · 7 19;0
·. 1972
.. . .... - ··
- ·· .. · .. . .. .. .. -- ··
Unemployment
. .. . . .
Female employment
1974 1976 1978 1980 1982 1984 1986 1988 1990 1992
14.5.-------------------------------------------------,
14.0 .. ..... .. .... .... .. .. .. .. .. . .. .. ..
Unemployment 13.5 .... .. .... . .. .
13.0 Male employment
.· ... 12'5
1970 1972 1974 1976 1978 1980 1982 1984 1986 1988 1990 1992
Source: OECD. Histories/ Statistics.

©International Monetary Fund. Not for Redistribution
Why Is U11employmen1 in France So High? 11
Table 1 . Key Labor Market Indicators (Average annual percentage growth rates)
1974-79 1980-90 1990 1991 1992
Population of France 0.7 0.8 0.3 0 3 0.3 working age EU 0.7 0.7 0.3 0.2 0.2
OECD 1.2 1.0 0.7 0.6 0.5
Labor force France 0.9 0.5 0.4 0.7 0.4
EU 0.7 0.8 0.9 0.7 - 0 .2
OECD 1 . 3 1.3 1.1 0.8 0.7
Employment France 0.3 0.2 1.0 0.1 - 0.5
EU 0.2 0.6 1 . 6 0.3 - 1 .2
OECD 1.1 1.2 1.3 - 0.1
GOP growth France 2.8 2.1 2.2 0.7 1.3
EU 2.5 2.2 2.9 1.4 1 .1
OECD 2.7 2.7 2.5 0.7 1.5
Source: OECD, H•stoncal Statistics.
Youth Unemployment
The youch uncmploymcnc race has been consiscendy higher chan che roral unemployment rate and more scnsicivc co economic downcurn (Chart 4). In general, one would expect che youth unemployment rate to be above che toea! unemployment rate as the young have lower human capital. Labor market practices such as "last in, firsc our" also reinforce youth unemployment and explain irs sensitivity co economic conditions. Furthermore, there is some evidence that wage bargainers are primarily concerned wirh rhe interests of those who are employed, thar is, the "insiders," racher chan chose who seek cmploymenc, the "outsiders." For example, the insiders may rake advanragc of high wrnover costs or the uncertainties associated with employing an oursider to demand higher wages than are justified by productivi ry or inflation. This theory also helps co elucidate the persistence in youth unemployment. However, labor market features such as "last in, first our" or "insider-outsider" are not unique ro France, yet youth unemployment in France is high compared with other industrial nations (Chart 5). This suggesrs char ocher more specific factors are also at work. The minimum wage and high employer payroll taxes could have a more pronounced impact on rhe employment of the young (sec Section II below). Furthermore, many young people are poorly qualified or lack the skills sought by employers. In 1991, rhe we of

©International Monetary Fund. Not for Redistribution
12 FRANCE: FINANCIAL AND REAL SECTOR ISSUES
Chart 4. France: Unemployment-Youth, Female, and Male
25
20
15 , .
.. ... . . . 10 .. ·
01974 1976 1978 1980
14
(In percent)
, ...........
. . .. . .
.
Total unemployment1
Youth unemployment1
1982 1984 1986 1988
.... ......... .. ..... ..... 12 Female unemployment1 ,
. ·
. · . ·
__ / ----
-----
........ ...
/ ,,.,.,.---- .......
/ ...........
_,., .-"'
/" Male unemployment1
. --2 1974 1976 1978 1980 1982 1984 1986 1988
Source: INSEE. 'To April 1993.
.. ..........
1990
, . ..........
1990
'
.
1992
.·
1992
unemployment among 15-24-year-olds with only the certificot detudes pri
moires (CEP) was twice as high as for those with the boccolourlot-level diploma.
Female Unemployment
Unemployment among women has been consistently above the average unemployment rate (Chart 4). There are a number of potential causes. Part-time working, especially among women, remains less developed 1n France than in the other major industrial countries (Table 2).

©International Monetary Fund. Not for Redistribution
Why Is Unemploymmt iti France So High?
Chart 5. France: Relative Unemployment Rates, 1992 (In percent)
� Japan iiiiiiiia.. Germany I
0 5 10
Source: OECD.
France Australia
EU
Canada
New Zealand
Belgium
United Kingdom
United States
Norway
I Italy
Ireland
Finland
Sweden
Netherlands
Portugal
0 Youth unemployment
• Total unemployment
I I I I 15 20 25 30
13
Although jobs in the service sector-which provides substantial female employment-have grown faster than the average rate of increase in employment, this rate of growth has been lower than that achieved in the United States, the United Kingdom, Italy, and japan.4 There is also some evidence that, for women in particular, the probability of finding a job rises as the maximum duration of benefits draws near (see Section II below). In France, benefits are available for a longer duration than in most other industrial nations and the ratio of long-term to short-term replacement rates for women was high until January 1993, when the Government introduced a new system whereby unemployment benefits decrease more rapidly over time (see Sections II and III below).
•Commissariat general du Plan ( 1993). pp. 128-30.

©International Monetary Fund. Not for Redistribution
1 4 FRANCE: FINANCIAL AND REAL SECTOR ISSUES
Table 2. Size and Composition of Part-Time Employment (In percent)
United United Canada France Germany Italy Japan Kingdom States
(Part-time employment as a proportion of employment)
1 973
Men 4.7 1.7 1 8 3 7 6 8 2 3 8.6
Women 19.4 12.9 24.4 14 0 25.1 39 1 26.8
1992
Men 9.3 3.6 2.7 2.7 10.6 6.1 1 0.8
Women 25.9 24.5 3 4 3 10.5 34.8 44.6 25.4
(Women's share in part-time employment)
1973 68.4 82.3 89.0 58.3 70.0 90.9 66.0
1992 70.0 83.7 89.6 67.9 69.3 85.4 66.4
Souroe: OECD, Employment Outlook. 1993.
Long-Term Unemployment
About 40 percent of those who are unemployed have been out of a job for at least one year. Although this is nor exceptionally high when compared with other industrial economies (Chart 6), it is high in absolute terms. There is considerable evidence that the long-term unemployed exert no pressure on wage inflation (Layard, Nickell, and jackman (1991)). Therefore, long-term unemployment could reduce the potential output of the economy through a higher natural rate of unemployment. Pissarides ( 1982) illustrates that human capital depreciates as the duration of unemployment increases, leading to a lower probability of finding a job.
With regard to the demand-side causes of long-term unemployment, employers faced with continued uncertainty about future orders may refrain from recruitment for long periods of rime, causing the persistence of both unemployment and long-term unemployment, particularly if wages are not flexible. Labor market rigidities, such as the relative generosity of long-term benefits, employment protection legislation, the minimum wage, and high employer costs are other potential contributory factors. These factors are investigated further below. The adoption of a number of job creation and training programs makes the study of longterm unemployment even more complex. Cases and Lollivier ( 1993) characterize the French labor market as being divided into three segments: unemployment, regular employment, and marginal employment. Many job schemes fall into the last category, and there are flows between all

©International Monetary Fund. Not for Redistribution
0
0
0
Why Is Utmnploymmt in F ranee So High? 15
Chart 6. France: Relative Unemployment Rates, 1991
Total Long-Term Unemployment (As e percentage of totel unemployment)
10 20 30 40 50 60 70 80
S.lglum
S�ln lt•ly
lrel.nd GrHCe
Porru�l
United Kingdom Norw•y
Lux•mboufl/ Aultr•ll•
NewZHI•nd
Female Long-Term Unemployment (As a percentage of female unemployment)
10 20 30 40
10 20 30 40
Source: OECD, Employment Outlook. 1992.
50 60 70
Male Long-Term Unemployment (As a percentage of male unemployment)
50 60 70
80
80

©International Monetary Fund. Not for Redistribution
16 FRANCE: FINANCIAL AND REAL SECTOR ISSUES
three segments. Transition from long-term unemployment to labor market schemes and vice versa could lead to recurrent spells of unemployment rather than to long-term unemployment.
Nonemployment Rate
Another useful concept in comparing the labor market experience of different countries is the nonemployment rate,5 which combines the effects of high unemployment and low participation in the labor force. In addition to the high rate of unemployment, France has a low participation rare, particularly among men (Chart 7). The participation rate in France drops dramatically for those aged 56 and above when compared with the average of EU countries (Table 3), as a consequence of generous early retirement schemes.6
The high nonemployment rare in France is more comparable with the southern European and the Benelux countries than with the other industrial countries (Chart 8). This underutilization of labor imposes a heavy burden on government finances, through both lost tax revenue and increased social security expenditure. This burden will become increasingly serious as the proportion of the elderly in the population rises, given the need to finance pension expenditures, which operate on a pay-as-yougo basis in France. Not surprisingly, cross-country evidence suggests that the higher the nonemployment rate, the higher the budgetary expenditure on the labor market (Chart 9).
II. Causes of Unemployment
Employers' Taxes
Social security contributions in France, particularly for employers, are very high. Total employee and employer contributions as a ratio to income are higher than in all other industrial countries except Italy (Chart 9, lower
sThe nonemployment rate is defined as
where£ is employment and PW is population of working age.
"Those aged over 56 can obtain unemployment benefits without looking for work. If someone over 56 becomes unemployed as a result of company restructuring. he will be entitled to 65 percent of previous income or a maximum ofF 12,000 per month. with the employer paying I 0 percent of the cost.

©International Monetary Fund. Not for Redistribution
0
0
0
Why Is Unemployment i11 F ranee So High P 17
Chart 7. France: Relative Participation Rates, 1991
15 30 45 60
15 30 45 60
15
Source: OECO, Employment Outlook, 1992.
75
Total Participation
(In percent)
105
i..taium I Male l lnnce
���:� Participation Greece (In percent)
l��:,�� l New Ze•t•nd ���:��y
�lJ,7,�·�, "''" ; Kir,11uu•" J�fS!�msrk
75 90 105
Female Participation
(In percent)
105

©International Monetary Fund. Not for Redistribution
18 FRANCE: FINANCIAL AND REAL SECTOR ISSUES
Table 3. Participation Rates by Age Group, 1991 (In percentages)
France EU Average
Age (in years) Males Females Total Males Females Total
14-19 13.2 10.1 1 1 .7 28.5 24.3 26.4
20-24 69.8 62.9 66.2 76.3 66.5 71.4
25-29 94.9 78.0 86.3 92.0 70.3 81.2
30-34 97.1 75.1 86.0 96.2 66.8 81.5
35-39 97.3 74.5 85.9 96.8 66.6 81.6
40-44 96.8 76.0 86.4 96.2 65.7 81.0
45-49 95.3 70.4 82.9 94.3 59.5 77.0
50-54 88.4 62.1 75.2 88.9 50.6 69.6
55-59 61.9 42.4 51.8 72.7 35.9 53.8
60-64 14.6 12.4 13.4 37.1 14.6 25.3
65-69 5.3 2.4 3.7 11.3 4.4 7.5
70 and above 1.8 0.6 1.0 3.8 1.2 2.2
Total 63.7 46.2 54.5 67.5 42.6 54.6 Source: Eurostat, Labour Force Survey Results. 1991.
panel). Personal income taxes, on che ocher hand, are lower than in most ocher countries. Table 4 provides a more detailed comparison of labor costs in France and ocher major European countries for an unmarried worker. Gross labor costs in France, although below those in Italy, are substantially higher as a proportion of net earnings than in Germany and the United Kingdom. In fact, the gap with the latter two countries widened in the 1980s. The main contributor to this differential is employers' social security contributions, which are not only substantially higher than in Germany and the United Kingdom, but also increased significantly during the 1980s.
Table 4 also shows that the contribution rates of employees are noticeably higher in France than in Italy and che United Kingdom, but marginally below those in Germany. Furthermore, contributions as a ratio w nee earnings increased by some 50 percent during the 1980s. Income taxes in France, on the ocher hand, are about one third of those in the other three countries as a proportion of net earnings, and they declined marginally during che 1980s.
From a theoretical perspective, the invariance of incidence proposition (liP) implies chat the replacement of an employer tax by an equal

©International Monetary Fund. Not for Redistribution
0
0
0
Why Is U11employment i11 Fro nee So High?
Chart 8. France: Relative Nonemployment Rates, 1991
Sweden
Spain Ire land
ltsly Greece
BIJigium France
Netherlands Germany
Austria Australia Porrugal
Canada United Kingdom
United States Luxembourg
Norway Japan
Finland Denmarlr. Switzerland
Total Nonemployment (In percent)
19
10 20 30 40 50 60 70
10
Spain GretiCtt
Italy Ireland
Belgium Netherlonds
Luxembourg F111nce
Germany AustriB
Portugal Australia
Sw itzerland Japan
Canada United Kingdom
United States Norway
Finland Denmarlr.
Sweden
Female Nonemployment (In percent)
20
Switzerland Luxembourg
10
30 40 50
Italy Germany
Greece Netherlands
Finland Norway
Canada Austria
United States United Kingdom
Australia Portugal Denmarlr.
Sweden Japan
20 30
60 70
Ireland Spain
Frt1nc. 88/gium
80
Male Nonemployment (In percent)
40
Source: OECD, Employment Outlook, 1992.
90
50

©International Monetary Fund. Not for Redistribution
20 FRANCE: FINANCIAL AND REAL SECTOR ISSUES
Chart 9. Labor Market Expenditure and Social Security Contributions
Nonemployment and Labor Market Expenditure, 1990 � 6.------------------------------------------------------, C) '0 ;:5r-� 8. 4 r-
• Denmark
Ireland •
= I) 331-:6
Netherlands •
• Belgium
• Spain
c NewZe�tlltnd
• Sweden Norway • • Finland
� 21- G=many ., • United Kingdom
� 1 r-"' United States • •Portugltl
• Fr�tnce
-
-
-
-
-E Japan • � o �--��- ---�-��--��----�'----- �'--�' -----�' --� j 15 20 25 30 35 40 45 50 55
Nonemployment, percent
Social Security Contributions, 1990 (As a proportion of pretax income)
20 30 40
Source: OECO, Employment Outlook, 1992
• Employer contributions
0 Employee contributions
50 60 70
employee tax has no effect on the real economy; that is, the product wage, the consumption wage, and the level of employment will be unaffected (Layard, Nickell, and jackman (1991); Newell and Symons (1986); and OECD (1990)). However, this result may not apply-at least in the short run-if there are market imperfections; for instance, if wages are above market-clearing values and adjust slowly, or wage negotiators care only about the "insiders." Even if the liP holds, differences in tax liability

©International Monetary Fund. Not for Redistribution
Why Is Unemploymml in F ranee So High? 2 1
Table 4. Comparison of Earnings, Direct Taxes, and Social Security Contributions
(As a percentage of net earn ings for a single worker))
United Year Italy France Germany Kingdom
1 . Gross earnings 1979 1 25 125 146 142
1989 138 132 155 139
2. Employees' contribution 1979 1 1 1 5 23 9
1 989 1 2 23 27 1 3
3 . Personal income taxes 1979 14 1 0 23 33
1989 26 9 28 26
4. Net earnings (1-2-3) 1979 100 100 100 100
1989 100 100 100 100
5. Employers' contribution 1979 58 47 23 14
1989 67 59 27 14
6. Total labor cost 1979 183 172 1 69 156
1989 205 191 182 153
Source: Commissariat general du Plan (1993).
could alter the allocation of resources. For example, employer taxes apply only to the wage whereas personal or corporate income taxes also apply to income from capital. A switch from income taxes co employer taxes implies an increase in the overall rate of taxation on employment and a decrease in capital taxation, which may lead ro a substiwrion of capital for labor. Similarly, personal income taxes are usually progressive whereas social security taxes are nor. A switch from one ro the ocher could lead ro changes in the coral tax bill for many individuals and firms and affect labor supply or demand decisions.
Empirical studies (Newell and Symons (1986); and OECD (1990)) suggest that, even when using a model where the liP holds in the long run, a cut in employer taxes and an equivalent rise in employee taxes could reduce unemployment in the short run. The short-run effects may last for several years because of lags in the adjustment process (0 ECD (1988)). Cotis and Loufir (1990) find suppon for the liP in France (see below). Other authors have found that the tax wedge has a long-run effect on unemployment in France (Bean, Layard, and Nickell (1987)). We investigate this issue further in Section III using time-series data for France.

©International Monetary Fund. Not for Redistribution
22 FRANCE: FINANCIAL AND REAL SECI'OR ISSUES
Table 5. Employer Taxes, Youth and Long-Term Unemployment
where
Ordinary Least Squares Cross-Section Regressions for 15 OECD Countries'
(t-ratios in parentheses)
(UY!U! = 1 . 7 + O.Q1 CSE (2.03)
R2 = 0.27
LTU= 17.5+ 0.97 CSE (2.14)
R2= 0.26,
UY/U = ratio of youth to total unemployment rate; CSE = employers' social security contributions; and LTU = percentage of unemployed who have been unemployed for more than a year. 'Organization for Economic Cooperation and Development members Belgium. Canada, Denmark,
Finland, France. Germany, Ireland, Japan, the Netherlands. Norway. Portugal. Spa1n. Sweden, the
Un1ted Kingdom. and the United States.
Table 5 provides some cross-section evidence on the impact of employer taxes on the composition ofunemploymem in the industrial coumries.
The first equation gives the resu It of regressing the ratio of youth to total unemployment on the rate of employers' social security comriburions using cross-section data for 15 OECD countries. The results indicate a significant positive correlation between the two variables. The coefficient on employers' comriburions indicates that if they are l percentage point higher in one country than in another, then the ratio of youth to total unemployment is likely to be l percentage poim higher. In France, employer contributions are about 20 percentage points higher than the sample average, implying a similar gap for the percentage of youth unemployment. The second regression presents results for long-term unemployment that are very similar; they indicate that higher employer comributions are associated with higher long-term unemployment. When the same regressions were performed for men and women separately, the coefficients were higher in the case of women.
Admittedly, these results do not capture any theoretical relationship. However, they do suggest that high employer taxes are associated with a high incidence of youth and long-term unemployment, which are symptoms of strucrural unemployment. The resu Irs imply that increases in employers' contributions have not been passed on to employees through wage reductions.

©International Monetary Fund. Not for Redistribution
Why Is Unemploymetrt in France So High? 23
Table 6. Proportion of Employees Covered by the SMIC1 (In percent)
Males Females Total
1972 1 .8 4.6 2.7
1976 3.6 8.4 5.1
1979 3.0 6.2 4.0
1981 5.1 13.9 8.0
19832 4.6 10.4 6.6
1985 6.2 16.2 9.7
1987 5.1 12.6 7.8
1989 5.2 13.9 8.2
1992 5.1 14.1 8.6
Sources: Bazan and Martin (1991); and Ministere du Travail, de I'Emploi, et de Ia Formation Professionnelle.
'The data refer to July of each year and cover wage and salary earners in businesses employing more than ten workers in industry, commerce, and services. They cover all workers whose hourly wage is less than the new hourly SMIC rate that applies from July 1 of each year.
2New series.
The Minimum Wage
France has had an institutional minimum wage since 1950; the current SMIC (solaire minimum interprofessionne/ de croissance) was introduced in 1970. There are three mechanisms for revising the SMIC: (1) a rise of 2 percent or more in the consumer price index (CPI) automatically triggers an equivalent rise in the SMIC; (2) on july 1 every year che SMIC is revised by at least half of the increase in the real hourly wages in industry; and (3) the Government can raise the SMIC at its discretion.' These mechanisms have led to a steady rise in the real value of che SMIC.
The latest report on the SMIC by the Miniscere du Travail shows chat the number of people being paid the SMIC has risen over the last five years.s In 1992, 8.6 percent of workers or just under 2 million people received the minimum wage, with the percentage among women being much higher (Table 6). The proportion of individuals earning the SMIC is particularly high for chose who are under 26 years old: 35.5 percent of wage earners under 26 were paid the SM IC in 1992. The fact that a large
1following the election of President Mitterand, the SMIC was raised by 10 percent in May 1981.
"In fact these numbers are an underestimate since the survey carried out by the Ministc�re du Travail does n01 cover firms with less than ten employees. nor those in agriculture, coal, public transpon, and utilities.

©International Monetary Fund. Not for Redistribution
2 4 FRANCE: FINANCIAL AND REAl. SECTOR ISSUES
Chart 10. France: Youth Unemployment, Relative Minimum Wage, and Labor Market Programs
24 .----------------------------------------------. 0.52
22 20 18
16
14 12 10 .. ... ... ... .. .. .. 8
: :
/ SMIC/average wage : (right scale)
0.51 0.50 0.49 0.48 0.47 0.46 0.45 0.44
6 1974 1976 L...:.....l....---l....,...--.l._....Ll9-7..J8'---...l,-9-80..__....L19...,.8..J2_.J.1.,-98-4.L.._....I....19...,.8...l6_.J.1_988....L---','-9-90
...J..._--L19.,..9-'
2 o. 43
1000
800
600
400
200
Employment In Labor Market Programs (In thousands of persons)
o L-�,-9�7..J6-...l1-9-78...J...__.J.1_9_80�--'-,...,.98...,.2L-....L19�8..J4L-..J1-9...,.8...l6-...l1.,-98...,.8�--'-,-99...,.0L-....L19-9
�2
Sources: IN SEE; OECD; and IMF staff estimates.
number of young workers, and a growing number of people in general, are paid the SMIC suggests that it is a significant labor market factOr that may have an impact on employment.
Empirical studies on the effect of the SMIC on employment have not been conclusive. Bazen and Marrin (1991) find that "increases in the real value of the SMIC have exerted significant upward pressure on real youth earnings." However, they are unable to show conclusively that increases in real labor costs have had a negative impact on youth employment, although they believe this to be the case. Their results do suggest that

©International Monetary Fund. Not for Redistribution
Why Is Unemployment i11 France So High?
Table 7. Minimum Wage i n France and
the United States, July 1992 lin francs)
Monthly' Minimum Wage' Cost to Employer
France
United States 5,7'56 3,950
Sources: Bulletin Mensuel de Statistique; and U.S. Employment and Earnings. 'On the basis of worl<ong 169 hours a month. 2Usong an exchange rate of $1 = F 5.5.
7,943 4.254
25
moderating the relative rare of increase in the SMIC would have a favorable impact on youth employment. Chart 10 also suggests a correlation between the relative minimum wage and youth unemployment. In response to high youth unemployment, the Government has introduced a number of labor market measures (Chart 10, lower panel). Many labor market schemes are targeted at the young (see Section IV below). Given the large increase in the number of places on employment programs between 1984 and 1987, it is difficul t ro assess whether the fall in youth unemployment after 1984 was due to the fall in the relative value of the SMIC or an increase in labor market programs. It is likely that both played a role.
By adding to wage rigidity-in particular, the rigidity of relative wages by limiting wage differentials-the SMIC has several implicarions.9 To the extent that the productivity of the less skilled and less qualified is below that justified by the SMIC, they are likely to suffer unemployment. This no doubt helps explain France's high rate of youth unemployment, and also the persistence of unemploymem. The SMIC may also be an obstacle ro regional labor mobility, as it is uniform across the country and thus does not reflect regional differences in the cost of living that imply different real values for the SMIC.
The experience of other industrial counuies with a starurory minimum wage is also relevant. Empirical work in the United Stares and Canada has concluded that the minimum wage has had a negative impact on youth
9In addition 10 the SMIC, there is evidence of other types of wage rigidity that could also lead to higher unemployment. For example. there is evidence of "insider power" (Cahuc. Sevestre, and Zajdela ( 1990); Plassard and Tahar ( 1990)).

©International Monetary Fund. Not for Redistribution
26 FRANCE: FINANCIAL AND REAL SECTOR ISSUI<:S
Table 8. Minimum Wage for an 18-Year-Oid, July 1992 (In francs)
France United States2 Belgium Netherlands
Monthly Full Minimum Wage'
5,756 3,950 6.743 6,476
Monthly Minimum Wage for an 18-Year·Oid
5,756 3,365 5,226 2.947
Cost to Employer of 18-Year-Oid
7,943 3,624 7,405 3,286
Sources: Bulletin Mensuel de StatJsttque: U S. Employment and Earnmgs: and Van den Heuvel (1992).
'Using $1 = F 5.5. and July 1992 exchange rates for other currencies. 2Jn the United States there is a reduced minimum wage for 16-19-year-<>lds that is 85 percent of
the full minimum wage.
employment. 10 It is therefore instructive co compare the level of the minimum wage in France with that in other industrial countries.
The cost of employing someone at the minimum wage in France is about rwice that in the United Stares. This is due ro rwo facrors. First, the minimum wage in France is about 1 .5 rimes that in the United Stares, and, second, employers' social security contribution rates are 38 percent in France bur only 7. 7 percent in the United Stares11 (Table 7 on previous page).
A comparison with Belgium and the Netherlands is interesting because, unlike France, these countries have a lower minimum wage for the young than for ocher workers (Table 8). In France the minimum wage, ar lease in theory, applies ro anyone aged 18 or above. 12 In the Netherlands the full minimum wage applies ro those aged 23 and above. For those under 23, the minimum wage is reduced sharply.l3 In Belgium the full minimum
10See Brown (1988) for a survey of the U.S. evidence and Coe (1990) on evidence for Canada. 11 Based on internationally comparable figures compiled by the OECD ( 1992a). 12In recent years the Government has introduced a number of measures that reduced employers'
contributions and the minimum wage for young people participating in employment schemes. These measures were reinforced in June 1993, reducing the effective minimum wage substantially when participating in special schemes (see Section IV below).
13The minimum wage in the Netherlands is reduced according to the following schedule: Age Percent of minimum wage
n �o 21 72.6 20 61.5 19 52.5 18 45.5
17 39.5 16 34.5 15 30.0

©International Monetary Fund. Not for Redistribution
Why Is U11employment itJ F ranee So High?
Chart 1 1 . Ratios of Youth to Total Unemployment, 1992
·:� _,.-... •Y· Germany -�. . ..... ··"1-� -� ,., ..... _.,._'"
,,. · '" -�-., .. � .. � . . . ... . ,., I· .. -.... "'� -··
.• ;s:·� .. -...... � � "' :>. ,-, ,,.; ,.. . •Iii• q.•.•<'..tT l' ·"'" ; .. . ... ��:,;,. .... ..,,,,.. ....... !i. ,..,.,, -1 ' 4..;JI:A'! ... .... · �
V:c ,; .. ,.
' <.:,.-.!'>. ;•. . ,; ... ....
�'<'".:·� .... ., =·�· \'\.!"�). • '"'<":";•• .. 'r"' "'' :·;<;r ''if'··�
0 0.5 1.0
Source: OECD.
· � ., ,
� ,.
Netherlands
Canada
United Kingdom
:·· . . . Ireland
Spain . .,� 1 Finland
. • ' " �- ?--1'o United States � - '·''* -"(. .. Japan
France
... · -··"' '• . Belgium ·'�� ·_.' :' L_ Norway
'•"' '· Portugal ;_ Italy
1.5 2.0 2.5
27
3.0
wage applies to those aged 21 and above and there are lower rates for those under 21, although the reduction is not as sharp as in the Netherlands.'4
The existence of the youth minimum wage means that, in absolute terms, it is cheaper for an employer to employ an 18-year-old in the Netherlands or Belgium than in France, although the full minimum wage is higher in the former countries. Interestingly, the ratio of youth to coral unemployment in the Netherlands is among the lowest in the industrial countries (Charts 5 and 1 1).
There is, therefore, considerable evidence that the minimum wage in France is high by international standards, especially for rhe young. There is also some evidence thar the minimum wage affects youth, if not total, unemployment. We will pursue this issue further by doing some timeseries analysis of data for France in Section III, after we have briefly considered the other potential causes of unemployment.
14The minimum wage in Belgium is reduced according 10 the following schedule: Age Percent of minimum wage 20 92.5 19 85.0 18 17 16
77.5 70.0 62.5.

©International Monetary Fund. Not for Redistribution
28
Women
Men
where
FRANCE: FINANCIAl. AND REAL SECTOR ISSUES
Table 9. Long-Term Unemployment and Relative Generosity of Benefits
Ordinary Least Squares Cross-Section Regressions for 15 OECD Countries'
{t-ratios in parentheses)
LTU = 7.10 + 0.60 RATIO (2.47)
R2 = 0.32
LTU = 4.80 + 0.46 RATIO (2.59)
R2 = 0.34.
LTU = percentage of unemployed who have been unemployed for more than a year; and RATIO = the ratio of long-term to short-term replacement rates times 100.
•Orgamzatton for Eoonomtc Cooperation and Development members Belgium. Canada. Denmark. Finland, France. Germany, Ireland. Japan, the Netherlands. Norway. Portugal. Spain, Sweden. the Umted Kingdom, and the Untted States.
Generosity of Benefits
Most models of wage determination imply that benefits have a significant effect on wages (La yard and Jackman (1991 )). The impact of the replacement rate (i.e., the ratio of unemployment benefits to wages) on the decision to seek employment very much depends on the individual's circumstances and is difficult to measure at an aggregate level. Besides, some countries with a high replacement rate, such as Sweden and Norway, have low unemployment and a high participation rate. The important issue is not so much the absolute level of benefits, or even the replacement ratio, but the incentive structure of the benefit system and the characteristics of the individual (see, for example, Schmitt and Wadsworth (1993)).
One aspect of this is the duration structure of benefits. Table 9 gives the result of regressing the proportion of long-term unemployed on the ratio of the long-term to short-term replacement rate using cross-section data for 15 OECD countries. Separate regressions were performed for men and women.
Table 9 shows that there is a significant positive relationship between long-term unemployment and the generosity of long-term relative to shortterm unemployment benefits for both men and women. The equation for men suggests that if the ratio of long-term ro short-term uncmploymem benefits is 1 percentage point higher, then long-term unemployment will be 0.46 percentage points higher. Interestingly, the corresponding figure for

©International Monetary Fund. Not for Redistribution
Why Is Utumployment i11 France So High?
Table 1 0. Maximum Duration of Unemployment Benefits and Replacement Rates
{In weeks)
1981 1989
EU countries
Belgium Indefinite Indefinite
Denmark 130 130
France 156 130
Germany 52 52
Ireland 65 65
Italy 26 26
Netherlands 156
Spain 104 1 04
United Kingdom 52 52
Non-EU European countries
Austria 30 30
Finland 100 1 00
Norway 40 80
Sweden 60 60
Switzerland 36 50
Non-European OECD countries
Canada 50 50
Japan 26 30
United States 39 26
Source: OECD. Employment Outlook. 1993.
29
women is 0.60 percentage points. In the data set, which corresponds to 1991, the ratio of short-term to long-term replacement rates for France is 17 percentage points higher than the sample average for men, and 22 percentage points higher for women. The introduction of the new unemployment benefits system will reduce these ratios (see Section IV).
There are other features of the benefits system that may also have an impact on unemployment. According to the EU Commission, unemployment benefits were paid to 43 percent of those without work in France in 1989, which is substantially above the EU average of 30 percent. One cause of this phenomenon could be the duration unemployment benefits are available in France. Table 10 provides data on the maximum duration of benefits for the OECD countries. Benefit duration in France is among the longest in the OECD countries. Only in Belgium, Denmark, and the Netherlands are benefits available for a longer period.

©International Monetary Fund. Not for Redistribution
30 FRANCE: FINANCIAl, AND REAL SECTOR ISSUES
Table 1 1 . Periods for Which No Insurance Benefits Are Paid at the Start of an Unemployment Spell
Minimum Waiting Period Waiting Period if Last Job Was (for All Claims) Quit Voluntarily
Australia 7 days 2-12 weeks
Austria none 4 weeks
Belgium none 1-26 weeks
Canada 2 weeks 6 weeks Den mark none 5 weeks
Finland 5 days 6 weeks
France none complete disqualification
Germany none 12 weeks
Greece 6 days complete disqualification
Ireland 3 days 6 weeks
Japan 7 days 1-3 months
Netherlands none none
New Zealand 7-14 days 6 weeks
Norway 3 days 4 weeks
Portugal none complete disqualification
Spain none complete disqualification
Sweden none 4-10 weeks
Switzerland 5-20 days
United Kingdom 3 days 1-26 weeks
United States 1 week complete disqualification
Source: OECD. Employmenr Outlook. 1991.
Institutional Factors
Structural unemployment is also affected by the benefits administration system, hiring and firing regulations, and other institmional factors that could discourage employers from taking on new workers or the unemployed from searching for jobs. A few of these factors are examined in this section.
Unemployment Benefit Administration
France does not seem our of line with regard ro the minimum waiting period before the receipt of benefits; as in many other industrial countries, there is no minimum period. A number of countries have a minimum waiting period of a few days. However, if a person has left his job voluntarily, he would be completely disqualified from receiving benefits in France, whereas in many countries there is a waiting period of several weeks, but not a complete disqualification (Table 1 1 ).

©International Monetary Fund. Not for Redistribution
Why Is Urmnployment i11 France So HighP 31
Table 1 2 . Signing On and Other Regular Reporting by Benefit Claimants
Signing On in Person
Australia Every 2 weeks
Belgium Every day
Denmark Every 2-3 months
Japan Every 4 weeks
Portugal Monthly
Spain Every 3 months
Switzerland 3 times a week
Source: OECD. Employment Outlook. 1991.
Confirmation of Unemployed Status by Post
France
Greece
Netherlands
Monthly
Monthly
Maximum 3 months
United States Every week or 2 weeks
No Regular Procedure
Finland Germany
Sweden
Regulations concerning signing on in France are rather liberal: confirmation of unemployment status is done on a monthly basis by post (Table 12). However, France does have a system of intensified interviews by the placement and benefit administration services (Table 13).
Hiring and Firing Legislation
The 1986 work dismissal legislation in France requires that those being dismissed are given one to two months' written notice of dismissal and informed in writing of the reasons for their dismissal. At the same time this legislation removed the need co seek the permission of the Labor Ministry for collective dismissals. Other legislation in 1989 obliged companies co prove the cause of dismissal. The law in France also requires that workers be paid up to a maximum of one and a half months' salary as severance pay. Though the legal restrictions on dismissal in France are less strict than those in the southern European countries, they are more strict than those outside Europe, particularly in the United States.
Barriers to nontraditional forms of work such as pare-time or temporary work are often viewed as a form of rigidity in the labor market. We noted above that part-time working is less developed in France than in many other industrial countries (Table 2). In order to assist part-time working, the Government passed legislation in December 1992 exempting employers from SO percent of social security contributions if they took on parttime workers.

©International Monetary Fund. Not for Redistribution
32 FRANCE: FINANCIAL AND REAL SECTOR ISSUES
Table 13. Scheduling of Intensified Interviews by Unemployment Duration
Australia
Denmark
France
Germany
Netherlands
Sweden
United Kingdom
New Zealand
Source: OECD. Employment Outlook. 1991.
Scheduling of Intensified Interviews
Duration of more than 2 years
Every 3 months
4th and 13th month of unemployment (employment placement); 14th month (benefit administration)
After at least a year
Reorientation interviews after 3 years of unemployment
Unemployed over 6 months given priority
At 6 months and every 6 months thereafter
At 6 months
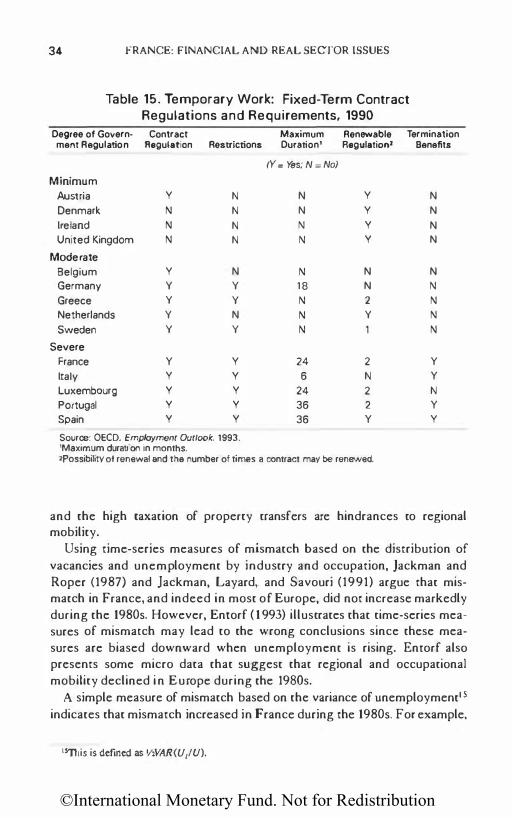
The proportion of people working on temporary contracts in France has risen continuously over the last decade from 3.3 percent of employment in 1983 to 10.2 percent in 1991 (Table 14). However, the regulations governing fixed-term contracts remain more strict in France than in most other industrial countries (Table 15). For example, in some circumstances the use of temporary contracts is restricted; there is a legal maximum duration for fixed-term contracts; and employees are entitled to termination benefits. The barriers to temporary work have to be considered in conjunction with the constraints on permanent employment such as employer taxes or hiring and firing regulations. If the regulations governing permanent employment were not rigid then employers would make use of temporary contracts only to the extent that they help in adjusting ro changes in demand. However, the existence of barriers to permanent employment would encourage greater use of temporary contracts. Therefore, given the existence of barriers to permanent employment in France and the fact that the regulations governing temporary work are more strict than in most other countries, it is difficult to argue that the rise in the proportion of temporary workers in France is a sign of enhanced labor market flexibility.
Another potential constraint on hiring nontemporary staff in France is that the employment agency, ANPE (Agence Nationale pour I'Emploi), currently has a monopoly in placing nontemporary staff. This was originally enacted ro prevent the exploitation of the unemployed, but it is no

©International Monetary Fund. Not for Redistribution
Why Is Unemp/oymmt itr Fra11ce So High? 33
Table 14. Temporary Workers (As a percentage of total employment)
1983 1988 1991
Australia 18.7 19.7
Belgium 5.4 5.0 5.1
Denmark 1 1 .5 1 1 .9
Finland 1 1 .1 13.1
France 3.3 7.8 10.2
Germany 1 1 .4 9 5
Greece 16.3 1 7 .6 14.7
Ireland 6.2 9.1 8.3
Italy 6.6 5.8 5.4
Japan 10.3 10.7 10.5
Luxembourg 3.2 3.7 3.3
Netherlands 5.8 8.7 7.7
Portugal 18.5 16.5
Spain 22.4 32.2
Turkey 7.2 6.6
United Kingdom 5.5 6.0 5.3
Source: OECD, Employment Outlook, 1993.
longer enforced. Firms regularly employ outside the ANPE. Such legal restrictions also exist in a number of other European countries (Table 16). Even though this legislation is not currently enforced, it could act as a disincentive to private firms considering entering the placement market if they fear that the legislation may be invoked in the future.
Mismatch
Evidence on the mismatch between the skills held by workers and those demanded by employers is rather difficult tO assemble. For example, indicators based on unemployment by occupation consider only the supply side of the market, and, since skills are defined on the basis of the last job held, they exclude all the unemployed without previous experience.
Data on the characteristics of the unemployed suggest some degree of mismatch. Youth unemployment is highest among those with the least qualifications (OECD (1 992b)). The long-term unemployed tend to have lower educational attainment than average and are concentrated in the least-qualified occupations (Caracosta, Fleurbaey, and Leroy (1991 )). As for regional mismatch, both the uniformity of the SMIC across the country
©International Monetary Fund. Not for Redistribution
34 FRANCE: FINANCIAL AND REAL SECTOR ISSUES
Table 15. Temporary Work: Fixed-Term Contract Regulations and Requirements, 1990
Degree of Govern· Contract Maximum Renewable Termination ment Regulation Regulation Restrictions Duration' Regulation• Benefits
IY = Yes: N = No) Minimum
Austria y N N y N Denmark N N N y N Ireland N N N y N United Kingdom N N N y N
Moderate Belgium y N N N N Germany y y 18 N N Greece y y N 2 N Netherlands y N N y N Sweden y y N N
Severe France y y 24 2 y
Italy y y 6 N y
Luxembourg y y 24 2 N Portugal y y 36 2 y
Spain y y 36 y y
Source: OECD. Employment Outlook, 1993. 'Maximum duration in months. 2Possibility of renewal and the number of times a contract may be renewed.
and the high taxation of property transfers are hindrances to regional mobility.
Using time-series measures of mismatch based on the distribution of vacancies and unemployment by industry and occupation, Jackman and Roper (1987) and Jackman, Layard. and Savouri (1991) argue that mismatch in France, and indeed in most of Europe, did not increase markedly during the 1980s. However, Encorf ( 1993) illustrates that time-series measures of mismatch may lead to the wrong conclusions since these measures are biased downward when unemployment is rising. Enrorf also presents some micro data that suggest that regional and occupational mobility declined in Europe during the 1980s.
A simple measure of mismatch based on the variance of unemployment15 indicates that mismatch increased in France during the 1980s. For example,
1SJllis is defined as Y>VAR(U11U).

©International Monetary Fund. Not for Redistribution
Why Is Unemployment in France So High? 35
Table 16. Legal Constraints on Methods of Filling Vacancies
Requirements for Notification Legality of Profit·Making of Vacancies to the Public Employment Placement
Employment Service Agencies
Australia No requirement Permitted
Austria No requirement Banned
Belgium All vacancies for Temporary work agencies external candidates only are permitted
Canada No requirement Permitted
Denmark No requirement Banned
Finland All vacancies Banned
France All vacancies for external Temporary work agencies candidates only are permitted
Germany No requirement Temporary work agencies only are permitted
Greece All vacancies Banned
Ireland No requirement Permitted
Italy Banned
Netherlands No requirement Permitted
Norway All vacancies Temporary work agencies are often permitted
Portugal No requirement Permitted
Spain All vacancies Banned
Sweden All vacancies for external Banned candidates
Switzerland No requirement Permitted
United Kingdom No requirement Permitted
United States No requirement Permitted
Source: OECD. Employment Outlook, 1991.
regional mismarch increased from 1.27 percent in 1982 ro 1.88 percent in 1990. However, regional mismatch fell ro 1.48 percent in 1992 because rhe rare of increase in unemployment was higher in regions wirh lower unemployment.t6 The same picrure emerges when considering unemployment by professional srarus; because unemployment has risen sharply among whire-collar workers (who had a relatively low unemployment rare), mismatch falls from 12.5 percent in 1990 ro 1 1 .9 percent in 1992.
16For example. the unemployment rate in Yvelines (lie de France) rose from 4.9 to 6.2 percent. a rise of 27 percent. whereas it rose from 13.5 percent to 15.5 percent in Ht!raull in Languedoc
Roussillon, a rise of 15 percent.

©International Monetary Fund. Not for Redistribution
36 FRANCE: FINANCIAL AND REAL SECTOR ISSUES
Chart 12. France: Vacancies and Labor Market Expenditure
1.0�-----------------------------------------------.
4
0 10
Vacancies and Unemployment, 1974-92 (In percent of the labor force)
5 6 7 Unemployment
8 9
Share of Active Labor Market Expenditure, 1990 (As a percentage of total labor market expenditure)
20
Spsin
Denmsrlr
Csnsdo
lrelond
Germany
Norway
Finland
United Kingdom
United States
Netherlands
Fnnce Jspsn
Belgium
30 40 50
Source: OECD, Employment Outlook, 1992.
10
60
1 1
Sweclttn Porrugsl
70
Chart 12 depicts a more formal measure of mismatch, the unem ployment-vacancy (UV) ratio (or Beveridge curve), for the period 1974-92. An
outward shift of the curve seems to have occurred: between 1978 and 1983 the same ratio of vacancies co the labor force was coupled with a higher unemployment rate than before. During the period 1984-87,

©International Monetary Fund. Not for Redistribution
Why Is Unemployment itt France So High? 37
unemployment rose while vacancies were on the rise, albeit modestly. This behavior is indicative of a small increase in mismatch.17
France spends 2.7 percent of its GOP on the labor marker; the average for the OECD is 2 percent, and for the major industrial countries excluding France, 1 . 1 percent. However, France spends much less than most other industrial countries on active labor market measures such as training, and more on passive measures such as unemployment compensation (Chart 12, lower panel). Only the former are likely to alleviate labor market mismatch.
I l l . Causes of Unemployment-Time-Series Evidence
This section presents a time-series econometric model of the determinants of the NAIRU (non-accelerating-inflation rate of unemployment) or rhe narural rate of unemploymenc The primary interest here is not to estimate a numerical value for the NAIRU but to identify a set of policy instruments that could be used co reduce it.
The Model
To understand the causes of unemployment in Britain, Layard and Nickell (1986), in an influential study, constructed an empirical model consisting of equations for prices, wages, employment, and the trade balance. Here we estimate a simplified version of their model that consists of two equations: a price equation and a wage equation. In this model, firms are assumed to operate in an imperfectly competitive environment, setting their prices on the basis of cost and demand. A key feature of the model is that wages are influenced by pressure variables such as those reviewed in the last section, for example, mismatch, the minimum wage, generosity of benefits, or import prices. If increases in the wage pressure variables lead to higher real wages, then unemployment would have to rise for price inflation to be kept in check. More formally, the model assumes that stable inflation requires consistency between two concepts:
(i) the target real wage-firms and workers bargain about nominal wages as a markup on expected value-added prices
w • = target(w- p);18 and
17Bismut (1982) illustrates that there was a significant shift of the Beveridge curve after the two oil shocks. There is n o evidence of such instability during the 1980s. However. the natness of the UV curve during the 1974-92 period and its upward slope during 1984-87 point to a small increase in mismatch.
18w and p are in logs.

©International Monetary Fund. Not for Redistribution
38 FRANCE: FINANCIAL AND REAL SECr0R ISSUES
(ii) the feasible real wage-in an imperfectly competitive market the firms are thought of as setting value-added prices as a markup on wages
p • = feasible(p - w).
The economic variable chat brings about this consistency in the long run is unemployment (Layard, Nickell, and Jackman (1991)).
The model is given below in equations (1)-(4). Since we are interested in the NAIRU, which is the long-run equilibrium concept for the unemployment rate, we have separated the long-run relationships from the dynamic ones. This is also desirable from an estimation point of view (Wren-Lewis (1990)). Equations (1) and (2) give the long-run wage and price equations; equations (3) and (4) give the dynamic framework for wages and prices.
w• = pr + a. u + azz ... + (l3 (pm -p),
p• = �.(yd - y) + �zZ-pr,
w = w• + p + 91(L) 1:! w - 92 (L) l:ip + 93(L)D.,.
p = p• + w + cp1(L)!:i p - cp2 (L) l:iw + cp3(L)DP
(1)
(2)
(3)
(4)
where w• = target real wage (i.e., target (w - p)), p• = feasible real wage (i.e., feasible (p - w)), w = nominal hourly earnings, pr = productivity or unit labor costs, p = output prices, U = unemployment rate, Pm = import prices, (yd - y ) = actual demand relative to potential outpm, z ... = ocher wage pressure variables, ZP = other variables affecting firms' margin, D..,, DP = other factOrs affecting the dynamics of wages and prices, and !!. is the difference operator. All lower-case variables are logged. 9 and cp are polynomials in the lag operatOr L and have both positive and negative powers of L, with forward terms appearing as expectations. It is also assumed that polynomials are such that the target real wage is independent of the rate of inflation, chat is, dynamic homogeneity holds.
Combining equations (3) and (4) gives
The left-hand side of equation (5) is a polynomial in changes in prices. The right-hand side of equation (5) can be regarded as a measure of inflationary pressure, which is made up of three elements: (i) w• + p•, the difference between the target real wage and the feasible real wage; (ii) a

©International Monetary Fund. Not for Redistribution
Why Is Unemployment i11 France So High? 39
polynomial in the dynamics of wage contracts; and (iii) other short-run influences on wages and prices. The first element, w• + p•, can be derived from combining equations (1) and (2):
In a steady state where inflation is constant, equation (5) implies that w• + p• = 0. Therefore equation (6) becomes a long-run relationship between the NAIRU, the level of actual demand relative to potential, (y4- y), Z,.., ZP, and import prices. For a given level of demand, equation (6) would determine the long-run influences on the NAIRU.
The Results
Because we are interested in estimating long-run relationships, an obvious way forward is to employ coincegration techniques. 19 The basic idea of cointegration is that two or more variables may be regarded as defining a long-run equilibrium relationship if they move closely together in the long run, even though they may drift apart in the short run. This long-run relationship is referred to as a coimegrating vector. Because there is a long-run relationship between the variables, a regression containing all the variables of a cointegrating vector will have a stationary error term, even if none of the variables taken alone is stationary.
We have directly estimated the long-run relationships in equations (1) and (2) above using the Johansen procedure and quarterly data for the period 1971:1-1992:IV.20 The test statistics and the estimated cointegrating vectors from the Johansen procedure are reported in Appendix I. The cointegration tests reveal the following unique wage and price equations:
w -p = pr + 0.59 smic - 0.07 U + 0.15 SK + 0.12 (pm -p), and (7)
19Culhbenson, Hall, and Taylor ( 1992) presem a survey of coimegra1ion. 20Johansen ( 1988) and Johansen and Juselius (1990) presenl a coimegralion estimation method·
ology that is based on maximum likelihood estimates of all the cointegrating vectors in a given set of variables, and provide two likelihood ratio tests for the number of cointegrating vectors.
Johansen ( 1988) demonstrates that the likelihood ratio tests have asymptotic distributions that are a function only of the difference between the number of variables and the number of coimegrating vectors. Therefore, in contrast with the DF and ADF tests, the Johansen likelihood ratio tests have well-defined limiting distributions. Johansen and Juselius also provide a methodology for testing hypOiheses about the estimated coefficients of the coimegrating vectors based on likelihood ratio tests with standard chi-squared distributions.

©International Monetary Fund. Not for Redistribution
40 FRANCE: FINANCIAL AND REAL SECrQR ISSUES
p - w = -pr + 0.02 CU + 0.26 p + 0.43 tl. (8)
The wage equation contains U and pm -p as suggested by equation ( 1 ) as well as the log of the real value of the SMIC (denoted as smic) and an index of skill shortages, SK, from the EU Commission's quarterly survey of employers.21 The latter two represent wage pressure variables Zw in equation (1). The price equation contains capacity utilization, CU, the cost of capital, p, and the employers' tax wedge, tl. The capacity utilization variable is a proxy for demand relative to potential outpur, (yd - y ). This variable is available from business survey data. The cost of capital, p, and the employers' tax wedge, tl, represent zp in equation (2) and are discussed further below. A unit coefficient on the productivity term, pr, is imposed in both equations as suggested by equations ( 1) and (2). A number of other specifications for both the target real wage and the target price markup were also tried (see below).
In the cointegrating vector for the real wage, all of the estimated coefficients have the expected signs and are of plausible magnitudes. Two of the variables, U and SK, enter not as logs but as levels. Unemployment has the expected negative effect on wages. The equation indicates that if the import price wedge rises, wage earners would resist a fall in the real consumption wage (i.e., deflated by consumer prices) by pushing up the real product wage. The other two variables, smic and SK, are of policy interest. The minimum wage variable captures the downward rigidity of wages and the index of skill shortages can be viewed as a proxy for mismatch.22 The wage equation here is similar to that used in a paper by Blanchard and Muet ( 1993); however, instead of the smic and the SK variables, they used a price inflation variable in the wage equation. We were unable tO obtain cointegration using this formulation. The approach here has the advantage of directly identifying wage pressure variables; besides, conceptually it would be unusual tO have inflation in a long-run vectOr.
In the cointegrating vecror for prices, the estimated coefficients again have the expected signs and are of reasonable magnitudes. The coefficient of the cost of capital, p, and the employers' tax wedge, !1, imply that, in the long run, employers pass on some of the increase in their costs by reducing earnings. Both of these variables are strongly influenced by economic policy choices. We find that tax wedges have no long-run effect in the wage equation, a result similar tO that obtained by Cotis and Loufir
21This is defined as the percentage of firms in the survey whose output is constrained by a lack of labor.
22We tried the ratio of minimum wage to average wage instead of the smic variable but we were unable to obtain a cointegrating vector with the variables correctly signed.

©International Monetary Fund. Not for Redistribution
Why Is Unemployment in France So High? 41
( 1990). However, in our formulation the employers' tax wedge has a longrun effect on unemployment through the price equation.
A number of other variables and formulations were also tried but with no success. In the wage equation we rried other forms of mismatch; direct, indirect, and the employers' tax wedge; unemployment in logs rather than as a rate; and an aggregate measure of benefits. In the price equation we also tried tax wedges and changes in consumer expenditure. However, none produced plausible results.
Since our primary interest is in the long-run determinants of unemployment, we shall nor dwell any further on the long-run wage and price equations and shall proceed to obtain a long-run equation of the form given by equation (6) above. This can be done in rhe steady stare by simply adding the vectors in equations (7) and (8) and eliminating wages and prices to obtain
U- 0.3CU = 8.4 smic + 3. 7 p + 6.1 /1 + 2.1 SK + 1 . 7 (pm -p). (9)
Equation (9) is nor, strictly speaking, a NAIRU equation because it has a term in capacity utilization, CUP This can be illustrated using Chart 13 below. Equation (9) is represented by the lines AA' and BB'. The right-hand side variables in equation (9) will determine a schedule of values for unemployment and capacity utilization. A cur, for instance, in the real value of the SMIC would shift AA' to, perhaps, BB' so that, for a given level of capacity utilization, employment would be higher and unemployment lower.
To obtain an equation for NAIRU it is necessary ro eliminate CU from equation (9). This can be done by estimating an upward-sloping schedule, such as CC', between unemployment and capacity utilization that reflects a linkage through aggregate demand: a rise in capacity utilization would increase the demand for labor and reduce unemployment. Here we have estimated a very simple coinregraring relationship between CU and U using rhe johansen procedure:
0 = cu + 0.25 u. ( 10)
Substituting for CU from equation (I 0) into equation (9) gives
U = 7.8 smic + 3.4 p + 5. 7 tl + 2.0 SK + 1.6 (pm -p). ( I t )
2·1See Wren-Lewis ( 1990) and Joyce and Wren-Lewis ( 1991) for a fuller discussion in the context of a large macroeconomic model.
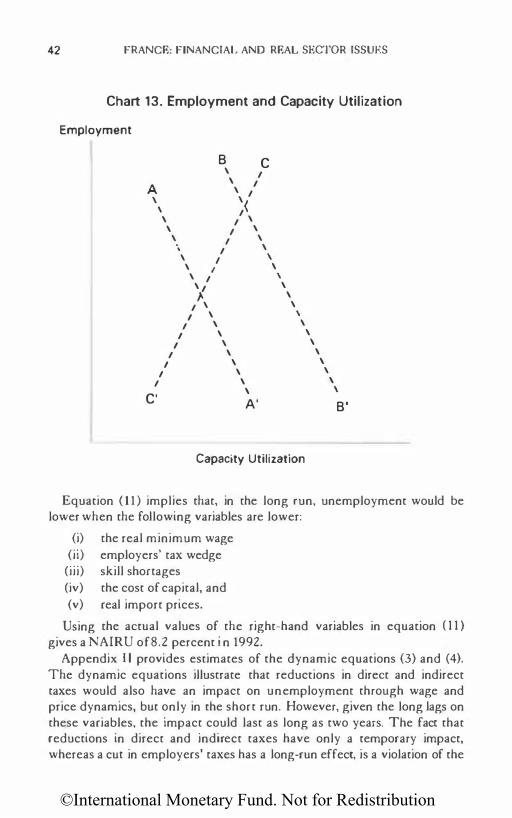
©International Monetary Fund. Not for Redistribution
42 FRANCE: FINANCIAL AND REAL SECTOR ISSUES
Chart 13. Employment and Capacity Utilization
Employment
B C \ I A
\ I \ I ', '< \ I \ \ I \ \ I \
\ I \ \ I \ \ / \ \ I \ \ I \ " \
I \ \ I \ \
I \ \ I \ \
I \ \ I \ \
I \ \ I \ \
I \ \ \ '
C' A' B'
Capacity Utilization
Equation ( 1 1 ) implies that, in the long run, unemployment would be lower when the following variables are lower:
(i) the real minimum wage (ii) employers' tax wedge
(iii) skill shonages (iv) the cost of capital, and (v) real import prices.
Using the actual values of the right-hand variables in equation ( I I )
gives a NAIRU of8.2 percent i n 1992. Appendix I I provides estimates of the dynamic equations (3) and (4).
The dynamic equations illustrate that reductions in direct and indirect taxes would also have an impact on unemployment through wage and price dynamics, but only in the short run. However, given the long lags on these variables, the impact could last as long as two years. The face that reductions in direct and indirect taxes have only a temporary impact, whereas a cue in employers' taxes has a long-run effect, is a violation of the

©International Monetary Fund. Not for Redistribution
Why Is U11emplo-yment i11 Fra11ceSo High? 43
liP. However, this could be because the cost to the employer of employing someone at a wage of the SMIC plus employers' taxes is well above rhe market-clearing rare. In these circumstances, reductions in employer taxes and in the real value of the SMIC could help generate new jobs.
IV. Recent Labor Market Measures
Sections II and III identified some of the causes of unemployment in France; in this and the next section we examine the recent policy responses. The most notable recent labor marker initiative is rhe five-year employment plan that was approved by parliament in November 1993. Prior ro char, four principal labor market measures had been implemented: a new unemployment benefit system was puc in place in January 1993; an action plan for the long-term unemployed was introduced; a number of labor marker programs, particularly those aimed at the young, were expanded; and payroll taxes for the low paid were reduced. These four measures are reviewed below; a more detailed analysis of the five-year employment plan follows in the next section.
The Unemployment Benefit System
The new benefit system, the allocation 1111ique digressive (AUD), came into effect in january 1993. The benefits are financed by social security contributions, as before. The novel feature of the new system is that, after an initial period, benefits are progressively reduced every four months. The previous salary and the period of contribution to the system determine the initial level of the benefit. For someone who has worked for at least six months earning the SMIC, the initial replacement rate would be 75 percent gross or 83.8 percent net of contributions (Table 17); it would then decline over time. For someone earning F 20,000 per month, the initial replacement rate is equal to 57.4 percent gross or 67 percent net (Table 17).
The initial period for which benefits are paid at the maximum level and the subsequent four-monthly reductions in the benefit are determined by the age of the claimant and the period of contribution to the system (Table 18). For example, someone earning F 9,000 per month who is less than 25 years old and has paid 1 4 months' contributions in the last two years would receive the maximum level of benefit for nine months. Thereafter, benefits would be reduced by 1 7 percent every four months, and the person would receive benefits for a maximum of 30 months (Table 18).
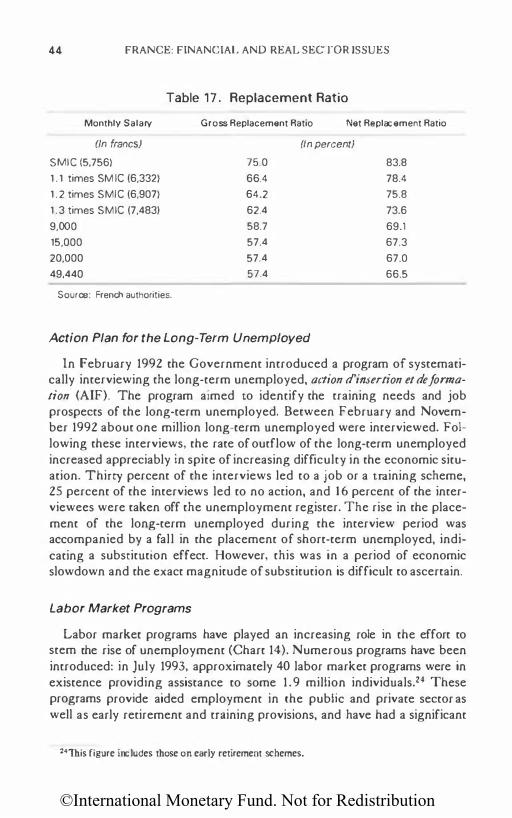
©International Monetary Fund. Not for Redistribution
44 FRANCE: FINANCIAL AND REAL SEC"rOR ISSUES
Table 17. Replacement Ratio
Monthly Salary Gross Replacement Ratio Net Replacement Ratio
(In francs)
SMIC (5,756)
1 . 1 times SM IC (6,332)
1 . 2 times SMIC (6,907)
1 .3 times SM IC (7,483)
9,000
15,000
20,000
49.440
Source: French authorities.
(In percent)
75.0
66.4
64.2
62.4
58.7
57.4
57.4
57.4
Action Plan for the Long-Term Unemployed
83.8
78.4
75.8
73.6
69.1
67.3
67.0
66.5
In February 1992 the Government introduced a program of systematically interviewing the long-term unemployed, action d'insertion et de formation (AIF). The program aimed to identify the training needs and job prospects of the long-term unemployed. Between February and November 1992 about one million long-term unemployed were interviewed. Following these interviews, the rate of outflow of the long-term unemployed increased appreciably in spite of increasing difficulty in the economic situation. Thirty percent of the interviews led to a job or a training scheme, 25 percent of the interviews led to no action, and 16 percent of the interviewees were taken off the unemployment register. The rise in the placement of the long-term unemployed during the interview period was accompanied by a fall in the placement of short-term unemployed, indicating a substitution effect. However, this was in a period of economic slowdown and the exact magnitude of substitution is difficult to ascertain.
Labor Market Programs
Labor market programs have played an increasing role in the effort to stem the rise of unemployment (Chart 14). Numerous programs have been introduced: in July 1993, approximately 40 labor market programs were in existence providing assistance to some 1 .9 million individuals.24 These programs provide aided employment in the public and private sector as well as early retirement and training provisions, and have had a significant
24This figure includes those on early retirement schemes.

©International Monetary Fund. Not for Redistribution
Why Is Ut1employmem in Frrmce So High? 45
Table 18. Duration of Benefits
Benefit Duration Duration of Period of maxi- Period of Reduction every
Contributions mum benefit reduced benefit Total 4 months
(In months) (In percenV
4 out of last 8 months' 4 4 -25
6 out of last 1 2 months 4 3 7 -15
8 out of last 1 2 months
< 50 years old 5 1 0 1 5 -17 50 plus 8 1 3 2 1 -15
14 out of last 24 months
< 25 years old 9 21 30 -17 25-49 1 2 1 8 30 -17 50 plus 1 7 28 45 -15
27 out of last 36 months
50-54 20 25 45 -15 55 plus 27 33 50 -8
Source: French authonties. 'For this category, benefits are reduced by 25 percent at commencement.
impact on the labor market (Chart 14). The Observaroire Fran�ais des Conjonctures Economiques (OFCE) estimates that between 1985 and 1987, when observed employment fell by 60,000 and unemployment rose by 170,000, labor market programs provided 370,000 jobs. Therefore, unemployment would have been higher in the absence of labor market programs.
Many programs are targeted at those facing the greatest difficulty: the young, the long-term unemployed, and those on the minimum social security benefit revenu minimum d'insertion (RMI). In 1992 about half of the participants on employment and training schemes were under 26 years old. Table 19 provides a brief description of the schemes aimed at the young. Similar programs have been initiated for the long-term unemployed and those on minimum benefits. The most prominent are control emploi-so/idariti(CES), which creates jobs deemed to be of public value in the noncommercial sector for the long-term unemployed and those on

©International Monetary Fund. Not for Redistribution
46 fRANCE: FINANCIAL AND REAL SECTOR ISSUES
Chart 14. France: Employment, Unemployment, and Labor Market Programs
CJ Early rBt•'rBrnBtlt � Unemployment
(In millions of persons)
25 CJ Public sector aided employment • Private sector aided employment • Employment
24
23
22
21
20 1973 1975 1977 1979 1981 1983 1985
Sources: French authorities; and IMF staff estimates. 'Including those no longer seeking employment.
1987 1989 1991
minimum benefits; and contrat de retour o /'emp/oi (CRE), which subsidizes the hiring of those who have been out of a job for over a year.
In June 1993, the new Government announced a number of emergency measures to encourage employment. These measures essentially increased the level of the subsidies and the total funding of a number of existing programs, including
• Increased funding for contra! d'orie11tation: the state will provide a subsidy of F' 2,000 for the first three momhs and F' 3,000 for the subsequent three months to an employer taking on a poorly qualified under-23-yearold for six months. The wage need be no higher than 30-65 percent of the SMIC. • Under CO !I trot de qualification the Government will waive all social security contributions and provide up to F 10,000 to enterprises taking on an unqualified young person. The young person will be paid 35-75 percent of the SMIC and benefit from a training program that will lead to professional qualifications. • The state will pay F 5,000 for taking on apprentices under co11trat d'apprentissoge, and social security contributions will be waived. The

©International Monetary Fund. Not for Redistribution
Why Is U11emp/oyment i11 F ranee So High? 47
Table 19. Labor Market Programs for the Young
Program
Contrat d'orientation
Contrat de qualification
Contrat d'apprentissage
Contrat d'adaptation
Contrat emploi-solidarite
Exojeunes
Credit formation
PAQUE
Contrat local d'orientation
Actions de formation alternee
Source: French authorities.
Objective
Aid the poorly qualified under 23 who have encountered difficulty finding a job.
Help to acquire professional qualifications.
Assist in the gaining of experience and qualifications through formal schemes.
Encourage the hiring of qualified young people under 26.
Provide experience through socially valuable work.
Help employment of those with no qualifications.
Encourage acquisition of qualifications.
Provide access to apprenticeship or qualifications
Short-term work experience for 16-1 8-year-olds.
Provide individually designed action plans.
Means
32 hours of training per month in training centers. waived social security contributions, reduced SMIC.
One quarter of work time in training, exempt from social security contributions. reduced SMIC.
Sharply reduced SMIC, waived social security contributions, 400 hours of training in special centers.
Reduced contributions and reductions in SMIC. 200 hours of on-the-job training.
Salaries paid by the state and waived contributions.
Waived social security contributions.
Through other measures.
Through other measures.
Wage subsidies. reduced SMIC. and waived contributions.
Individual training and short work experience.
apprentices would be entitled tO 400 hours of training and be paid 25-78 percent of the SMIC. • Increased funding for cot1trot d'adoptotion ro enable young people with qualifications to gain experience. Social security contributions are reduced and employers will be paid F 2,000 for taking on a qualified under-25-year-old who will be paid less than 80 percent of the SMIC.

©International Monetary Fund. Not for Redistribution
48 FRANCE: FINANCIAL AND REAL SECTOR ISSUES
• Finally, the number of places on CES were increased to 650,000 and the state aid to employers for taking on someone on CRE was raised from F 10,000 to F 20,000.
Introducing Payroll Tax Exemptions
In order to reduce the cost of hiring people at the bottom end of the pay scale, the Government exempted employers from paying family allowance contributions for workers earning up ro 10 percent above the minimum wage in july 1993. The conuibmion for those paid between 10 and 20 percent above the SMIC was cut in half. This was financed by an increase in a more broadly based tax, contribution sodole gentrolisee (CSG). This measure is to be expanded under the five-year employment plan (see below).
V. The Five-Year Em ployment and Training Law
In August 1993, the Government unveiled a five-year employment and training plan aimed at addressing the strucrural problems of the labor market. The plan, which contains over 50 measures, was approved by parliament in November 1993. The following are some of the major initiatives contained in the plan:
Reductions in Employers' Contributions
To build on the initiative introduced in july 1993 (see above} and further reduce the cost of employing low-skilled workers, the plan proposes that by 1998 employers will be exempt from making family allowance contributions for those paid less than 1.5 times the SMIC, and will contribute half the usual amount for those paid between 1.5 and 1.6 times the SMIC. This measure will be phased in gradually over the 1994-98 period, although it is immediately effective (as from january 1 , 1994) for newly created firms (Table 20). In addition to this measure, until December 31 , 1995, employers taking on up ro three new employees will be exempt from paying employers' contributions for two years. Furthermore, other employers' social security contribution rates, except those for unemployment insurance and pensions, will be frozen until 1998.
Measures Aimed at the Young
As regards youth training, the plan envisages that the responsibility for training all under-26-year-olds will be devolved to the regions by the end

©International Monetary Fund. Not for Redistribution
Why Is U11employme11t itt Frottce So High?
Table 20. Five-Year Employment Plan: Employers' Family Allowance Contributions
Contribution Rate
(In percent)
0
2.7
5.4
Contribution Rate
(In percent)
0
2.7
5.4
From January 1, 1996
< 1.3 SMIC
1.3 - 1.4 SMIC
> 1.4 SMIC
Source: French authorities.
Earnings (New Enterprises)
Since July 1, 1993
< 1 . 1 SMIC
1 . 1 -1.2SMIC
> 1.2 SMIC
From January 1, 1994
< 1 . 5 SMIC
1 . 5 - 1 .6 SMIC
> 1.6 SMIC
Earnings (Other Enterprises)
Since From July 1 , 1993 January 1, 1995
< 1 . 1 SMIC < 1 .2 SMIC
1 .1 - 1 .2 SMIC 1 . 2 - 1.3 SMIC
> 1 . 2 SMIC > 1 .3 SMIC
Earnings (Other Enterprises)
From From January 1, 1997 January 1, 1998
< 1 .4 SMIC < 1 .5 SMIC
1 .4 - 1 .5 SMIC 1 . 4 - 1.5 SMIC
> 1 .5 SMIC > 1 .6 SMIC
49
of 1998. The Government also intends to double the number of places on apprenticeship programs and to reduce the qualifying age from 16 to 14. In each employment office a section dedicated to providing information and guidance to the young is to be set up, and a national committee will monitor progress on youth training and apprenticeship and publish a triennial report on the subject.
To promote youth employment, a wage subsidy of F 1,000 per head per month for nine months is to be paid to employers taking on a first-time young worker for at least 18 months. This measure will be in place until 1998, but the subsidy will be doubled for any young workers taken on before October 1994. This subsidy will be available tO young workers irrespective of their qualifications, as long as they are not participating in

©International Monetary Fund. Not for Redistribution
50 FRANCE: FINANCIAl. AND REAL SECTOR ISSUES
another government program. Also, all private sector employers can take advancageof this subsidy as long as they have not announced any redundancies in the previous six months.25
Work-Time Flexibility and Reductions in Work Time
To enhance work-time flexibility, the 39-hour working week is to be replaced with an annual equivalent for an experimental period of two years.26 Part-time workers will be able tO work up to 1,200 hours during an 1 8-month period and still receive unemployment benefits. Also, to encourage companies facing financial difficulties to switch from full-time to part-time work, rather than make people redundant, the law proposes ro subsidize employers' social security contributions and extend unemployment benefit coverage for workers making the transition from fulltime to part-time work.
The tight regulations on Sunday working are to be eased. Shops in tourist areas will be able ro open, and the local authorities will have greater freedom to gram local shops permission to open on Sundays.
As regards reductions in the hours of work, for an experimental period of three years any company that achieves a 15 percent reduction in work time, accompanied by at least a 10 percent increase in employment, will be eligible for a 40 percent reduction in employers' contributions in the first year and 30 percent in the subsequent two years.27 The law also allows changes in working time to be made through direct negotiations between the employers and the employees at enterprise, industry, or sectoral level. In the absence of an agreement, the legal duration of full-time work remains at 39 hours per week.28
Other Initiatives
A number of existing training programs will be expanded. For example, the maximum duration of the CES will be doubled from 1 2 to 24 months and will be renewable up to three times, with state subsidies available for
2SThis measure replaced an earlier initiative, coni rat d' insertion professionnelle (CIP), a youth training program aimed at the private sector. The CfP was withdrawn after strong protest by student organizations and the trade unions. Those participating in the scheme would have been paid below the minimum wage provided they received training.
26Social partners are invited to work out how this measure could be put into effect.
27This covers employers' contributions to social insurance, family allowances. and work accidents. The exact application of this measure will be determined br government decree.
28The mallimum duration is 10 hours per day or 48 per week.

©International Monetary Fund. Not for Redistribution
Why Is U11emp/oymmt i11 Fro11ce So High? 51
up to five years. In addition, employers will be exempt from social security contributions for up to five years if they hire someone on a CES.
To encourage people to provide part-time services such as running errands for the elderly, the government is to introduce a cheque service whereby individuals will be paid for these services in vouchers bought at the post office. Those paid in vouchers will be exempt from social security contributions. This is also seen as a way of discouraging black market work.
To promote entrepreneurship, the aid for setting up new businesses will be increased to F 32,000 and will be available not only to those who receive benefits but also those who are registered as seeking employment.
The law also requires the creation of enterprise committees consisting of elected members of the personnel in each company. The management has to submit to the enterprise committee an annual report covering the financial state of the company, training, parr-time work, and related issues.
VI. Assessment and Conclusion
The slowdown in economic activi·ty in France and in her trading partners in the early 1990s has undoubtedly contributed to higher unemployment. However, the persistence and the composition of unemployment suggest that it is necessary to address the structural imbalances in the labor market in order to ensure a substantial decline in unemployment when the recovery takes hold.29
The Government has taken a number of welcome measures in this regard. Table 21 attempts to assess the potential impact of the recent measures. The introduction of progressive reductions of unemployment benefits as the spell of unemployment lengthens (AUD) should, by lowering the ratio of the long-term to short-term replacement rate, reduce long-term unemployment (see Section II above). The initial replacement ratio, however, will remain rather high.
Evaluation of job and training prospects by means of individual interviews through AIF should assist the long-term unemployed in finding suitable jobs or training, thereby reducing mismatch as well as excessive
290ver the coming years the labor force in France is unlikely to witness an expansion such as
that seen in the last 20 years unless the panicipMion rate rises significantly. Demographic projec
tions made by the World Bank (Bos and Bulatao ( 1990)) imply that the population of working age in France-for both males and females-will fall slightly over the next ten years before stabiliz
ing during the following ten years. After the year 2010, when the postwar "baby boom" genera
tion stans to retire from the labor market, the population of working age should decline gradually
for the following 30 years.

©International Monetary Fund. Not for Redistribution
52 FRANCE: FINANCIAL AND REAL SECTOR ISSUES
Table 21. Potential Impact of Government Measures on Causes of Structural Unemployment
Causes of Structural Unemployment
Employers' Minimum wage Generosity of taxes (SMIC) benefits Mismatch
Reductions in unemployment benefits through time lAUD) X X " X
Action plan for the long-term unemployed X X " "
Labor market programs
Contrat d'orientation " " X " Contrat de qualification " " X " Contrat
d'apprentissage " " X " Contrat d'adaptation " " X " CES " X X X CRE " X X "
Payroll tax exemptions " X X X Source: IMF staff assessment.
reliance on unemployment benefits. The array of reinforced labor market measures for the young (control d'orientotion, control de qualificotiotl, cOt/Ira/ d'opprmtissoge, co11trot d'odoptatio11) has the effect of reducing the cost of hiring young people through reductions in employers' taxes and the SMIC. The CES and CRE reduce the cost of employment through wage subsidies and contribution exemptions. The latter, in common with most youth programs, also has an element of training and should help reduce mismatch. There remains, however, a multitude of training programs with overlapping aims and complicated eligibility criteria.
The five-year employment plan has provided the opportunity to formulate a medium-term strategy to address the structural issues in the labor market. The plan contains a number of very positive measures. For example, the gradual reduction in employers' family allowance contributions over the next five years will progressively reduce employment costs for the low paid. The plan also contains many beneficial training initiatives, notably the expansion of the apprenticeship programs. However, following the withdrawal of the CIP, the plan does not really address the minimum wage

©International Monetary Fund. Not for Redistribution
Why Is Unemployment it/ France So High? 53
problem. Furthermore, some elements of the plan are unlikely to enhance labor market flexibility and reduce structural unemployment. For instance, although easing the regulation regarding working on Sunday and annualizing the 39-hour week will enhance work-time flexibility, reductions in hours of work will, at best, have no impact on unemployment. Reducing working time would lower unemployment if output were unaffected. If output were affected then such a policy might either be inflationary or leave unemployment unchanged. The alternative is to have an equivalent reduction in earnings, which is difficult co bring about. Not surprisingly, therefore, empirical evidence casts doubt on the effectiveness of this policy in reducing unemployment.30 Reductions in working time are best left to individual negotiations between employees and employers.
On the whole, most of the initiatives taken by the Government over the lase few years are seeps in the right direction. However, given the scale of unemploymem in France, more ambitious measures are needed to ensure a substantial and rapid decline in structural unemployment when the recovery gathers pace. A few potencial measures are given below; some could facilitate reductions in unemployment in the short term while others would only bear fruit in the long run.
Reduce the Duration and Generosity of Benefits
In spite of the recent reform of the benefits system, Table 1 7 shows chat the initial net replacement ratio in France remains high. Tables 10 and 1 8 indicate that unemployment benefits are available for longer in France than in most other industrial countries: benefits are available for up co two and a half years for those under 45 and for just over four years for chose over 45. Florens, Fougere, and Werguin ( 1990) show that there is a significant correlation between the expiry date of benefits and the probability of finding a job. This suggests that reducing both the duration of benefits and their initial level could help to encourage search effort and to reduce unemployment duration, and hence the total number of unemployed. Distributional objectives can be achieved more efficiently through taxation rather than through the benefits system. Furthermore, any savings from reductions in benefits and from other passive measures such as early retirement could be transferred to reduce labor costs (through a further reduction in contributions) and fund more active measures (such as training programs) to enhance the skills of those searching for jobs.
30See OECD ( 1990) and Layard, Nickell, and Jackman (1991).

©International Monetary Fund. Not for Redistribution
54 FRANCE: FINANCIAL AND REAL SECTOR ISSUES
Reduce Employers' Taxes Further
The recent government decision to waive employers' family allowance contributions for those being paid up to 20 percent above the minimum wage and gradually ro extend this to those earning up to 1.5 times the SMIC by 1998 is likely to help job creation by reducing employers' labor costs. However, at most, it will reduce labor costs by 5.4 percent of the net wage for the low paid (Table 20). Total employee and employer contributions as a ratio to income will still be higher than all ocher industrial countries except Italy and Belgium (Chart 9, lower panel).
Therefore, it is necessary to take further measures in this area in order to boost employment generation. The planned exemption schedule for employers' family allowance contributions to 1 .5 times contributions by 1998 could be extended and accelerated. If exemptions are not extended to all employees, then they may act as a disincentive ro employ workers at wages just above the ceiling. They could also discourage training, because those with training could exact wages above the exemption chreshold.3t Cuts in benefits and budgetary expenditure are the most efficient means of financing an extension or acceleration of exemptions. However, in the long run, it is desirable completely to del ink the financing of family allowances from employers' taxes; they could be financed through more broadly based income caxes.3Z
There have been suggestions for levying environmental (e.g., carbon) taxes at a European level and using the income generated to reduce employers' contributions. This proposal has to be created with caution as it would not be a neutral measure: it would discriminate against energyintensive sectors and in favor of those that are labor intensive. Besides, previous recessions have been associated with large oil price shocks. Therefore, any increases in environmental taxes should be made in small steps and on an experimental basis.33
Reform the Minimum Wage Legislation
The analysis in this chapter suggests chat the minimum wage has a significant adverse impact on unemployment in general and on youth
31Further exemptions could be made conditional on some form of training to avoid this problem.
32The econometric results given in Section Ill suggest that if the employer's tax wedge is lowered by I percentage point and employee taxes are raised by I percentage point. then for a given level of capacity utilization the unemployment rate would fall by about 0.1 percentage points in the long run.
331 am grateful to Dennis Snower for drawing my auention to this.

©International Monetary Fund. Not for Redistribution
Why Is Unemployment in France So High? 55
unemployment in particular. Reducing the real value of the SMIC relative to average earnings will help to lower unemployment. However, under the current mechanism for revising the SMIC, a rise of 2 percent or more in the CPI automatically triggers an equivalent rise in the SMIC. Furthermore, the SMIC is raised by at least half the increase in real hourly wages in industry every year. It would be desirable to have a reappraisal of the legal framework for revising the SM IC to ensure that it will not rise by more than the increase in CPl. At a minimum, the SMIC should not be increased by more than the current minimum legal requirement:H
In spite of the withdrawal of the CIP, many existing employment schemes facilitate a reduction in the SMIC for the young. 35 However, as an indirect mechanism these remain a second-best solution. A better option is to introduce a reduced minimum wage for the young as this would be transparent, permanent, and easy to apply. The introduction of a youth minimum wage in the Netherlands has had a positive impact on employment, and the analysis in this chapter suggests that it could help reduce youth unemployment in France. Failing this, the existing youth training programs, with remuneration below the minimum wage, could be simplified and the conditions for participating in them eased to ensure that they are easy to understand, targeted at the long-term unemployed and those with inadequate qualifications, and widely available.
Convert Unemployment Benefits into E mployment Subsidies
The employment subsidy that replaced the CIP (see above) should have a positive impact on youth employment because it reduces the cost of employing young people. However, this subsidy is not targeted, as it applies to all under-26-year-olds and is not conditional on any kind of training. It would be more efficient to have any subsidies targeted at those with greatest needs, for example the young unskilled or poorly qualified workers who have difficulty finding a job or training.
An interesting variant of employment subsidies is the idea put forward by Snower ( 1 994a, b) that links subsidies to unemployment duration and training. Under this proposition the unemployed, particularly the longterm unemployed, can use part of their unemployment benefits tO provide vouchers to the firms that hire them. The longer someone has been
34ln the long run de indexation could also reduce the relative real value of the minimum wage,
as it did in the United States during the 1980s.
3�Those participating in contra/ d'adaptation. contra/ d'orientation and contra/ d'apprentis· sage may be paid below the SMIC.

©International Monetary Fund. Not for Redistribution
56 FRANCE: FINANCIAL AND REAL SECTOR ISSUES
unemployed, the more vouchers they will be given to use. To cash the vouchers, the employer has to provide training that leads to nationally recognized qualifications, and, the more training an employer offers, the higher will be the value of the vouchers when they are cashed. Subsequent to finding a job, the monthly value of the voucher declines as the period of employment lengthens. This scheme is not inflationary, since the long-term unemployed exert little pressure on wage inflation; its cost is minimal because the funds would have been spent on unemployment benefits; and it encourages training for those who are most in need of it.
Improve the Effectiveness of Labor Market Programs
As explained in Section IV, there are a large number of active labor market programs already in existence in France. Many are well targeted and some have been reinvigorated recently. However, if anything, there are too many programs-some 40 in total, and about ten aimed solely at the young. Simplifying the multitude of programs, many of which share objectives as well as means, would make them more transparent and more easily understandable by employers and the unemployed, and thereby improve their effectiveness.
Furthermore, experience so far suggests that measures that help create jobs in the private sector are more likely to lead to permanent jobs; a shift of resources to private sector job subsidies is likely to be beneficial. According to a recent survey, 58 percent of those participating in the CRE and 67 percent of those taking on a contrtll de qualification held a job a few months after the program.36 However, only 50 percent of those participating in the CES in the noncommercial sector were in employment subsequent to the program and one fifth of those were on another CES program. The survey also found that in many cases the CES did not have a training element. In this regard it is regrettable that the CES is expected to expand more than the other labor market programs.
Given that signing on for benefits in France is done monthly by mail, there is little contact with the unemployed. However, the intensive interviewing program for the long-term unemployed, AIF, has produced some encouraging results and its expansion would be helpful.
Targeted labor market programs, such as those aimed at the young or the long-term unemployed, will help to create employment in the long run only if they enhance the skills of the individuals who participate in
36Survey by the Centre d'Etudes de I'Emploi.

©International Monetary Fund. Not for Redistribution
Why Is Unemployment in France So High? 57
themY It is, therefore, necessary to have a well-defined, nationally recognized system of qualifications for any such programs and to encourage employers to participate in the training schemes in order to ensure that the skills gained by the participants correspond to those that employers demand.
Introduce Incentives for Profit Sharing
Firms that practice profit sharing in France appear to enjoy higher profitability and productivity, as well as higher employment growth, than those that do not have any method of profit sharing (Commissariat general du Plan ( 1993)). Tax incentives for profit sharing would be particularly effective if they were aimed at new firms, because they do not face the problem of replacing a part of existing wages with performance-related pay. Profit sharing may not reduce unemployment if it results in strong productivity gains; however, i t would introduce an element of wage flexibility and hence help to smooth the variation of employment over the cycle.
Appendix I
Econometric Results
In Table Al, panel (a) reports the maximal eigenvalue test of the null hypothesis that there are at most r cointegrating vectors against the alternative of r + 1 coinregrating vectors.38 Starting with the null hypothesis that there are no cointegrating vectors (r = 0) against the alternative of one (r = 1 ), the rest statistic (36. 7) is greater than the 95 percent critical value (33.3), rejecting the null hypothesis and indicating that there is at least one cointegrating vector. The null hypothesis of r $ 1 against r = 2, however, cannot be rejected, suggesting that there is a unique cointegrating vector. Panel (b) reports the trace test of the null hypothesis that there are
37Layard, Nickell, and Jackman (1991) illustrate that nontargeted public employment would increase net employment in the long run only under very restrictive conditions. For example, taxes needed to finance public employment would have to be fully absorbed by labor.
38The Johansen procedure involves the simultaneous estimation of dynamic vector autoregressive (VAR) equations, for which founh-order lags were included. It is assumed that the variables have linear deterministic trends. Estimation has been done on Microfit 3.0; see Pesaran and Pesaran (1991).

©International Monetary Fund. Not for Redistribution
58 FRANCE: FINANCIAL AND REAL SECTOR ISSUES
Table A 1 . Johansen Maximum Likelihood Tests and Parameter Estimates
(Long-run vector for real wages; 1971:1 to 1992:1V (84 observations), maximum lag in
VAR = 4. Eigenvalues in descending order: 0.33, 0.18. 0.14. 0.12. 0.05)
(a). Co integration likelihood ratio test based on maximal eigenvalue of the stochastic matrix.
Hypothesis' 95o/o Critical 90o/o Critical
Null Alternative Statistic Value Value
r = 0 r = 1 36.7 33.3 30.8
rs 1 r = 2 18.6 27.1 24.8
rs 2 r = 3 13.1 21.1 18.9
rs 3 r = 4 1 1 .4 1 4.9 1 2.9
rs 4 r = 5 5.0 8.2 6.5
(b). Co integration likelihood ratio test based on trace of the stochastic matrix.
Hypothesis'
95 o/o Critical 90o/o Critical Null Alternative Statistic Value Value
r = 0 r<! 1 84.8 70.6 86.5
r s 1 r <! 2 48.1 48.3 45.2
rs 2 r<! 3 29.5 31 .5 28.7
rs 3 r<! 4 1 6.4 18.0 15.7
r s 4 r = 5 5.0 8.2 6.5
(c). Estimated cointegrating vectors; coefficients normalized on w- p - pr i n parentheses.
Vector w - p - pr
1 .98 (-1 .00)
u 0.13
(-0.07)
1 r denotes the number of cointegrating vectors.
smic
-1.17 (0.59)
SK
-0.30 (0.15)
pm - p
-{).24 (0.12)
at most r cointegrating vectors against the alternative that there are more than r. Again, the null of r = 0 against r?: 1 is rejected. However, the null of r::; 1 against r?: 2 cannot be rejected, indicating that there is at most one cointegrating vector. The two tests, therefore, indicate the existence of a unique cointegrating vector. Panel (c) of the table presents the estimated cointegrating vectors. The coefficients in parentheses are normalized on w - p - pr.
Turning to Table AZ, in panel (a) the maximal eigenvalue test of the null hypothesis that there are no coin regrating vectors (r = 0) against the alternative of one (r = 1 ) is rejected, indicating that there is at least one

©International Monetary Fund. Not for Redistribution
Why Is Urumployment in France So High?
Table A2. Johansen Maximum Likelihood Tests and Parameter Estimates
(Long-run vector for markup of prices over wages; 1971:1 to 1992:1V
(84 observations), maximum lag in VAR = 4. Eigenvalues in descending order: 0.28, 0.12, 0.10, 0.04)
(a). Co integration likelihood ratio test based on maximal eigenvalue of the stochastic matrix.
Hypothesis'
59
95% Critical 90% Critical Null Alternative Statistic Value Value
r = 0 r = 1 27.7 27.1 24.7
r$ 1 f= 2 1 1 .0 21.0 18.6
($ 2 f= 3 8.5 14.1 12.1
($ 3 r= 4 3.0 3.8 2.7
(b). Cointegration likelihood ratio test based on trace of the stochastic matrix.
Hypothesis'
95% Critical 90% Critical Null Alternative Statistic Value Value
f = 0 r 2: 1 50.2 47.2 43.9
r s: 1 f 2: 2 22.4 29.7 26.8
r s 2 r 2: 3 1 1 .4 1 5.4 13.3
r$ 3 r2: 4 3.0 3.8 2.7
(c). Estimated cointegrating vectors; coefficients normalized on p - w + pr in parentheses.
Vector p - w + pr
-2.59 (-1.00)
cu 0.07
(0.02)
'r denotes the number of cointegrating vectors.
p 0.67 (0.26)
t1
1 . 13 (0.43)
cointegrating vector. The null hypothesis of r � 1 against r = 2, however, cannot be rejected, suggesting that there is a unique cointegrating vector. In panel (b), the trace test of the null hypothesis of r = 0 against r 2: 1 is rejected. However, the null of r � 1 against r 2: 2 cannot be rejected, indicating that there is at most one cointegrating vector. The two tests together indicate the existence of a unique coincegrating vector. Panel (c) of the table presents the estimated cointegrating vectors. The coefficients in parentheses are normalized on p - w + pr:

©International Monetary Fund. Not for Redistribution
60 FRANCE: FINANCIAL AND REAL SECTOR ISSUES
Appendix II
Dynamic Models
Table A3. Dynamic Model for Real Wages (Sample period 1971:1-1992:1V)
ll (w - p -pr) = 0.30 -0.19 /l (w -p -pr}_1 - 0.29 1l2 p_1 (6.09) ( 1 . 96) (2.28)
+ 0.46 M2_3 + 0.05 M3_3 (2.00) ( 1.79)
+ 0.30 ll (pm -p)_3 (2.24)
- 0.08 rw_., (6. 1 1 )
where rw = residuals from the coimegrating vector in equation (7),
R-2 = 0.38, SE = 0.007, OW= 1.86
LM(4) = 2.26, Ramsey's RESET x2(l) = 2.75
Normality x2(2) = 0.57, heteroscedasticity x2(1) = 0.23
Chow test X2(4) = 3.97.
Table A4. Dynamic Model for the Markup of Prices Over Wages (Sample period 1973:1-1992:/V)
ll (p - w + pr) = 0.28 - 0.32 /l (p - w + pr)_1 (3.71) (2.25)
+ 0.002 /l cu + 0.32 /l !3_3 (2.81) (2.00)
- 0.52 /l(w -p}_1 -0.05 rp_1, (3.12) (3.67)
where rp = residuals from the coimegrating vector in equation (8),
R-2 = 0.26, SE = 0.007, OW = 1.84
LM(4) = 5.50, Ramsey's RESET X 2(1) = 3.80
Normality X 2(2) = 0.85, heteroscedasticiryx 2(1) = 2.39
Chow resrx 2(4) = 4.18.

©International Monetary Fund. Not for Redistribution
Why Is Unemploymellt in France So High? 61
Data Sources
All the data have been obtained from lnstitut National de Ia Statistique et des Etudes Economiques Quarterly National Accounts, Informations Rapides, and Bulletin Mensuel de Statistique unless indicated otherwise.
p market GOP price deflaror pm = import price deflator pr real GOP per man-hour w average hourly earnings in the market sector t 1 employer's tax wedge, defined as rota! contributions by the
employers over gross wages t2 employee's mx wedge, defined as total contributions paid by
employees over income from employment t3 indirect tax wedge, defined as indirect taxes over consumer
expenditure U unemployment rate SK = the percenmge of firms reporting general or skilled labor shore
age, obtained from E U Quarterly Business Survey CU = index of capacity utilization p = cost of capital, taken from Taylor ( 1993).
References
Bazen, Stephen, and john Marcin, "The Impact of the Minimum Wage on Earnings and Employment in France," OECD Economic Studies, No. 1 6 (Spring 1991), pp. 199-221 .
Bean, Charles R., P. Richard Layard, and Stephen j. Nickell, eds., The Rise in Unemployment (New York: Basil Blackwell, 1987).
Bismut, C., "La France et Ia RFA avant et a pres le premier choc petrolier," EconomieetStatistique, No. 148 (1982), pp. 57-74.
Blanchard, Olivier, and Pierre-Alain Muet, "Competitiveness Through Disinflation: an Assessment of the French Macroeconomic Strategy," Economic Policy, Vol. 16 (April 1 993), pp. 1 2-56.
Bos, Eduardo, and Rodolfo Bulatao. "Projecting Fertility for All Countries," Policy, Research, and External Affairs Working Paper: WPS 500 (Washington: World Bank, September 1990).
Brown, Charles, "Minimum Wage Laws: Are They Overrated?" Journal of Economic Perspectives, Vol. 2 (Summer 1988), pp. 133-45.

©International Monetary Fund. Not for Redistribution
62 FRANCE: FINANCIAL AND REAL SECTOR ISSUES
Cahuc, Pierre, Patrick Sevesrre, and Helene Zajdela, " egociations salariales et segmentation du marche du travail," Economic et Prevision, No. 92-93 ( 1990), pp. 43-50.
Caracosta, L., M. Fleurbaey, and C. Leroy, "Competitivite, croissance et emploi: Ia France de l'an 2000 en perspective," Economic et Statisque, No. 243 (1991), pp. 69-87.
Cases, C., and S. Lollivier, "Estimation d'un modele de sortie de chomage a destinations multiples," INSEE Serie des Documents de Travail No. 9327 (Paris: lnstitut National de Ia Statistique et des Etudes Economiques, May 1993).
Coe, David, "Structural Determinants of the Natural Rate of Unemployment in Canada," Stoff Papers, International Monetary Fund, Vol. 37 (March 1990), pp. 94-1 15.
Commissariat general du Plan, L'ecot10mie franfaise en perspective (Paris: Editions La Decouverte et La Documentation fran9aise, 1993).
Cotis, Jean-Philippe, and Abderrahim Loufir, "Formation des salaires, chomage 'd'equilibre,' et incidence des cotisations sur le coOt du rcavail," Economieet Prevision, No. 92-93 (1990), pp. 97-110.
Cuthbertson, Keith, Stephen G. Hall, and Mark P. Taylor, Applied Econometric Techniques (Ann Arbor: University of Michigan Press, 1992).
Drazen, Allan, and Paul R. Masson, "Credibility of Policies versus Credibility of Policymakers," Quarterly Joumal of Economics, Vol. 109 (August 1994), pp. 735-54.
Dreze, Jacques, and Charles R. Bean, eds., Europe's Unemployment Problem (Cambridge, Massachussetts: MIT Press, 1990).
Entorf, Horst, "Do Aggregate Measures of Mismatch Measure Mismatch? A Time Series Analysis of Existing Concepts," INSEE Serie des Documents de Travail No. 9318 (Paris: Institut National de Ia Sratistique et des Etudes Economiques, February 1993).
Florens, J.P., D. Fougere, and P. Werguin, "Duree de chomage et transitions sur le marc he du travail," Sociologic du travail, No. 4 (1990).
Jackman, Richard, and S. Roper, "Structural Unemployment," Oxford Bulletin of Ecotromics and Statistics, Vol. 49 (February 1987), pp. 9-36.
Jackman, Richard, P. Richard Layard, and S. Savouri, "Mismatch: A Framework for Thought," in Mismatch and Labour Mobility, ed. by Fiorella Padoa Schioppa (Cambridge, England: Cambridge University Press, 1991 ), pp. 44-1 01 .
Johansen, Soren, "Statistical Analysis of Cointegration Vectors," Joumal of Econom ic Dynamics and Control, Vol. 12 (] u ne-Septem ber 1988), pp. 231-54.
__ , and Katarina Juselius, "Maximum Likelihood Estimation and Inference on Cointegration, with Applications to the Demand for

©International Monetary Fund. Not for Redistribution
Why Is Uttemploymmt i11 France So High.? 63
Money," Oxford Bulletin of Ecot1omie:; and Statistics, Vol. 52 (May 1990), pp. 169-210.
Joyce, Michael, and Simon Wren-Lewis, "The Role of the Real Exchange Rate and Capacity Utilization in Convergence to the NAIRU," Economicloumal, Vol. 101 (May 1991), pp. 497-507.
Layard, P. Richard, and Stephen J. Nickell, "Unemployment in Britain," Economica, Vol. 53 Supplement ( 1986), pp. S121-69.
_, and Richard Jackman, Unemployment: Macroeconomic Perfor7!1ance a11d the Labour Market (Oxford, England: Oxford University Press, 1991).
Newell, A., and ].S. Symons, "Corporatism, the Laissez-Faire and the Rise in Unemployment," Centre for Labour Economics Discussion Paper No. 260: 1-62 (London: London School of Economics and Political Science, November 1986).
Organization for Economic Cooperation and Development, Measures to Assist the Long-Term Unemployed: Rece11t Experimce ttl Some OECD Countries (Paris: OECD, 1988).
__ ( I 992a), Employmmt Outlook (Paris: OECD, 1990, 1991, 1992, 1993). __ ( 1992b), Economic Survey France (Paris: OECD, 1 992). Pesaran, M., and Bahram Pesaran, "Microfit 3.0: An Interactive Econo
metric Software Package" (Oxford, England: Oxford University Press, 3rd ed., 1991 ).
Pissarides, Christopher, "From School to University: The Demand for Pose-Compulsory Education in Britain," Economic Joumal, Vol. 92 (September 1982), pp. 654-67.
Plassard, Jean-Michel, and Gabriel Tahar, "Theorie du salaire d'efficience et disparites non compensatrices: evaluation a partir de l'enquete Fqp," Economie et Prtfvision, No. 92-93 ( 1990), pp. 67-76.
Schmitt, John, and jonathan Wadsworth, "Unemployment Benefit Levels and Search Activity," Oxford Bulletin of Economics and Statistics, Vol. 55 (February 1993), pp. 1-24.
Snower, Dennis (1994a), "The Simple Economics of Benefit Transfers" (mimeographed, London: Department of Economics, Birkbeck College, London University, 1994).
__ (1994b), "Converting Unemployment Benefits into Employment Subsidies," CEPR Discussion Paper No. 930 (London: Centre for Economic Policy Research, May 1994).
Taylor, Mark P., "The Link Between Real Interest Races and French Aggregate Private Investment" (mimeographed, Washington: International Monetary Fund, 1993).
Van den Heuvel, K., Minimumbeloningetl i11 de Europese Gemeenschap (Amsterdam: Ministerie van Sociale Zaken en Werkgelegnheid, 1992).

©International Monetary Fund. Not for Redistribution
64 FRANCE: FINANCIAL AND REAL SECTOR ISSUES
Wren-Lewis, Simon, "Nominal Inertia and Keynesian Effects," NIESR Discussion Paper No. 174 (London: National Institute of Economic and Social Research, 1990).

©International Monetary Fund. Not for Redistribution
Mlfuflii:l;lifjleM
Household Saving in France: Stochastic Income and Financial
Deregulation
JONATHAN D. 0STRY AND JOAOUIM LEVY
Dfter remaining stable for most of the 1970s, the household saving ratio lliJ in France began a steep decline at the beginning of the 1980s (see Chart I). While a complete understanding of the factors underlying this decline is not yet available, a number of reasons have been put forward that are at least consistent with the observation of reduced saving. These include, among others, reductions in inflation, strong growth in household incomes, significant run-ups in asset prices (stock and house prices), and the process of financial deregulation and liberalization, which may have permitted households that had been liquidity constrained prior to deregulation ro engage in consumer borrowing.
The negative trend in household saving that characterized most of the 1980s bottomed out by the end of 1987, by which time the household saving ratio had declined from about 19 percent of disposable income (its approximate level for most of the 1970s) co about 10 percent (Chart 1). Subsequently, the saving ratio began to increase steadily, reaching about 14 percent of disposable income by 1993. In the four-year period since 1989, the saving ratio increased by over 2 percenrage points, a period during which inflation was subdued and income growth was relatively weak. Since these latter variables have tended to figure prominently in consumption/saving equations using French data, the rise in household saving over the past four years is something of a puzzle. 1 Moreover, rhe issue is nor merely of concern co forecasters. Given rhe importance of household consumption in total demand, the increase in household saving
N01e: this chapter was also published in lMF Staff Papers, Vol. 42 (June 1995). 1For previous empirical studies of household saving behavior in France, see, for example.
Sterdyniak (1987). Artus and others ( 1991), and France (1993).
65

©International Monetary Fund. Not for Redistribution
66 FRANCE: FINANCIAL AND REAL SECTOR ISSUES
Chart 1. France: Household Saving Ratio
0.22 r----------------------------,
0.08 .__..__...__...._......._.....__.__.__.__._--L.__,.___.___...___....._..__...__...._......._.....__.__.__.__.___. 1970 1972 1974 1976 1978 1980 1982 1984 1986 1988 1990 1992
Source: INSEE. Quarterly National Accounts database.
during a period of weak activity is also an issue of considerable policy relevance.
A number of different hypotheses have been put fol"\vard to explain the recent behavior of household saving in France. One possibility is that the high real interest rates that have been associated with the disinflation process may have stimulated household saving. One problem with this explanation is that it has proved difficult co identify a significant and sufficiently large effect of interest rates on saving behavior using either French data or data for other OECD countries.2 Nevertheless, it is possible that higher real interest rates may have elicited some increase in saving, but that such effects cannot be identified by estimating standard equations using historical data. This might reflect the fact that it is only in the relatively recent period-that is, after financial deregulation-that the interest elasticity of saving has turned significantly positive.3
2Sce Allard ( 1992) and the references therein for the French case, and Hall ( 1988). for example, for the United States.
3Such a view might be rationalized by a model in which. prior to deregulation. consumption growth matched income growth because consumers were liquidity constrained, but, following deregulation. the share of liquidity-eonstrained consumers fell, increasing the sensitivity of con
sumption and saving to changes in the interest rate (see, for example, Campbell and Mankiw
(1989)).

©International Monetary Fund. Not for Redistribution
Household SaviTJg: Stochastic lt1come aTJd Fit10t1cial Deregulatio11 61
A second possible explanation for the recent increase in saving might be wealth effects associated with asset price deflation. Indeed, the decline in saving during much of the 1980s was associated with a run-up in asset prices, suggesting that wealth effects could have a role in explaining the more recent behavior of saving. In addition, there is some evidence that housing prices (at least in Paris) have dropped considerably since their peak in 1990, and real stock prices have also been relatively flat over this period. Thus, wealth effects may have played some role in accounting for the increase in saving over the past several years. However, an investigation of the importance of wealth effects in consumption has been hampered by a general paucity of data. While annual data on net wealth of households are available, the only wealth data available at a higher frequency appear to be stock prices.4
A third hypothesis that has been proposed to explain recent saving behavior relates to an increase in uncertainty that may have created a precautionary demand for saving. It has been argued that the main proximate cause of the increase in uncertainty is the sharp deterioration in labor market conditions in France.5 The importance of this explanation is difficult to gauge. In otherwise standard consumption equations, the unemployment rate (or rather its rate of change) has been found to have a statistically significant impact, which is consistent with the view that increases in uncertainty (proxied by the unemployment rate) lead to more saving. However, the empirical results from such regressions tend to suggest that the magnitude of the effect of this proxy for uncertainty on saving is too small to explain a sizable proportion of the observed increase in saving in recent years.
More fundamentally, in order to investigate whether uncertainty about future income prospects has been a significant and quantitatively important factor in accounting for saving behavior, it is obviously important to control for other relevant factors. This is especially important because unemployment-the chosen proxy in previous empirical investigationsmay affect both expectations about the variability of future income (which determines the precautionary demand for saving) as well as expectations about the future level (or growth rate) of income. Controlling for expected future income growth is thus of primary importance in judging the importance of precautionary saving.
•As mentioned previously, a housing price index for Paris exists, but its reliability as a proxy for house prices in France remains in doubt.
5Uncenainty about whether the generosity of public pensions would be reduced may also have contributed to a precautionary demand for saving.

©International Monetary Fund. Not for Redistribution
68 FRANCE: FINANCIAL AND REAL SECTOR ISSUES
In this chapter, a simple model of saving behavior is proposed that allows one co measure households' expectations about future income growth. The basic idea of the model is that forward-looking agents save whenever they expect their income to decline (or not grow as quickly) in the future. In other words, households save for a rainy day. If income tomorrow is expected to be much lower than today (because, for example, there exists a significam probability of becoming unemployed) then saving rises today in order to maintain consumption when income drops.
An issue that is central to testing the validity of the "saving for a rainy day" hypothesis is how to capture households' expectations about future income growth. In general, i t is not enough simply to project current income growth on its past values and use the resulting coefficients to forecast the future course of income. This is because households will generally have more information about the future behavior of their incomes than is contained in their own past behavior, because, for example, they have specific information about their future employment or income prospects.
Campbell (1987) has proposed a simple way to extract a measure of the future income growth expected by households, based on the notion that households save for a rainy day. Applying this methodology tO French data, it is possible to recover an actual time series of expected future income growth, which can then be compared with actual data on household saving. Plotting this expectations variable over rime, one can appreciate how well it tracks actual saving behavior. In addition, one can see how correlated the two time series (actual saving on the one hand and expected future income growth on the other) are.
The results suggest that actual saving in France over the period 1970-93 has moved very closely with the expected future income growth variable generated by the model. Over the entire sample, the correlation between saving and expected future income growth is about 0.99. Moreover, a simple time-series plot of the two variables shows that the expectations variable tracks saving well, even in the more recent period (since 1989) during which alternative models appear to have gone off track.
One problem with the approach advocated by Campbell and ochers is that it assumes certainty equivalence. This means that expectations about unemployment, for example, will affect saving only by changing the expected time profile of incomes, but not by changing the expected variability of incomes. Ic is changes in this expected variance that generate a precautionary demand for saving. This demand arises because risk-averse individuals who expect greater variance in their income streams wish to accumulate assets (save) as a means of insuring their consumption against adverse shocks (for example, becoming unemployed).

©International Monetary Fund. Not for Redistribution
Household Sovi11g: Stochastic lt1come o11d Fi11o11ciol Deregu/otio11 69
To allow for this possibility, the model proposed below considers effects on saving coming both from expectations about the level (or growth race) of future income, and expectations about the future variability of income. The results suggest that while increases in this expected variance have generated some increase in saving over the past few years, the increase in precautionary saving has been small and scaciscically insignificant. For example, taking the lase four years of our sample (the period during which questions have been raised as to the reasons for the increase in saving), about 95 percent of the change in saving accounted for by the model is explained by changes in the expected growth rare of income, with only 5 percent being accounted for by expected changes in the variability of income.
The remainder of this chapter is organized as follows: In the next section, a simple model of household saving behavior based on utility maximization under uncertainty is presented, and the testable implications of the model are spelled out. Empirical results applying chis approach (referred to below as the "augmented" Campbell model-augmented to include the effects of precautionary saving) to French household saving data arc given in Section II. In view of the restrictiveness of the augmented Campbell model-according to which only the properties of the stochastic process followed by household labor income determine saving behavior-we consider in Section III more conventional saving equations where the explanacory variables include income, proxies for household wealth, real interest rates, inflation, and suchlike. In presenting these results, effects of financial deregulation-which may have altered saving behavior in France over the past 10-15 years-are also considered. It is found that deregulation of financial markets has increased the sensitivity of household saving co changes in real interest rates. In the future, therefore, reductions in real interest rates are likely to elicit larger declines in the saving race chan they would have in the past, and vice versa.
The main conclusions of this chapter are presented in Section IV. The technical aspects of the discussion are included in Appendix I . Data sources are provided in Appendix II.
I. Analytical Framework
The assumed framework involves a representative household that maximizes the discounted sum of current and expected future utilities over an infinite horizon, subject co a sequence of budget constraints (one corresponding to each time period) and a transversality condition that rules out Ponzi-type schemes. Under certainty equivalence, consumption is proportional to permanent income. Saving, in such a world, will equal the expected present value of future declines in labor income. A shock that is

©International Monetary Fund. Not for Redistribution
70 FRANCE: FINANCIAL AND REAL SECTOR ISSUES
expected to lower future income relative to current income raises saving, and vice versa.
When the assumption of certainty equivalence is abandoned, the riskiness of future income has an additional and distinct effect on saving over and above the effect of shocks to the level of future income. To see this, recall that from Hall (1978), who assumed certainty equivalence, consumption follows a process such that its first difference equals the innovation to lifetime income,;, given by
r "" 1 ;, - ( 1 + r) f-:o ( l + r)i (E,yr+J- E,_ tYr+J) ' ( 1)
where y denotes real household labor income, r is the real interest rate (assumed fixed and known), and E, denotes the expectations operator conditional on information at time t. With precautionary saving, however, the first difference of consumption will also depend on the variance of ;,, denoted og, . Specifically, an increase in the variance of the innovation in lifetime income creates a precautionary demand for saving. This reflects the fact that households wish to accumulate assets as a means of insuring their consumption streams against potentially large adverse shocks. As shown in Appendix I, the solution for the saving function under the assumption of a constant-absolute-risk-aversion (CARA) utility function is
• � 1 a.pot, s, - -1L:,_ ( l + r)i (E,I:l.y,+) + 2 [r + ( I - p) ] ' (2)
where s� denotes real household saving at time 1; 6. denotes the (backward) difference operator; a denotes the degree of risk aversion; and p denotes the degree of persistence of the shocks to the variance of lifetime labor income.
The first term in equation (2) is the certainty-equivalent portion of saving, which is equal to the expected present value of future declines in labor income. Intuitively, if some shock causes expected future income to decline (relative to its current level), then saving increases today so that consumption can be maintained in the future. The second term in equation (2), which is absent from models which impose certainty equivalence, captures the precautionary saving motive. When there is a shock tQ the variance of;, precautionary saving increases in line with both the degree of risk aversion (a.) and the persistence of the shock (summarized in the parameter p).6 The
61nnovations to t.he variance process that die out quickly (low value of p) will have linle effect on precautionary saving, while shocks to the variance that are pennanent (as in the random walk case of p - I) will have larger effects on saving.

©International Monetary Fund. Not for Redistribution
Household Sovi11g: Stochastic f11come o11d Fi11o11ciol Deregulotio11 7 1
intuition i s that an increase i n the variability o f income creates a demand by risk-averse consumers to accumulate assets as a means of insuring themselves against potentially adverse shocks in the future.
To implement the model empirically, it is necessary to estimate the expected present value of future declines in labor income (the first term in equation (2), which is denoted by pdv, below) as well as the variance of the innovation in lifetime income, denoted o€, . One way of doing this would be to estimate a univariate process for labor income and obtain pdv, and o€1 from the resulting parameters. One problem with forecasting future income based solely on its own past history is that households may use other information in making such forecasts.7 In particular, as Campbell ( 1987) showed, saving itself should be a useful predictor of the future course of income if individuals in fact "save for a rainy day."
In line with Campbell's work, the procedure followed here is to estimate a first-order bivariate vector autoregression (VAR) in the first difference of labor income and the level of saving8
(3)
In equation (3), a deterministic (linear) trend is removed from the saving data to allow for "consumption-tilting" behavior in response to differences between the rare of interest and the rare of rime preference.9 The parameter estimates from the VAR allow us to retrieve an estimate of the present discounted value offuture declines in labor income (the first term in equation (2)). In addition, an estimate of the variance of the innovation co lifetime labor income (second term in equation (2)) can be obtained from the VAR residuals.
70ne consequence of this would be that the extent of uncenainty (captured by o�,) would tend
to be overestimated relative to the case in which forecasts were based on the complete informa
tion set of households.
3The Schwanz-Bayes information criterion (SBIC) was used to determine the order of the
VAR.
9As pointed out by Caballero (1990). any divergence between the interest rate and the subjec
tive rate of time preference will introduce a trend into the saving function. This deterministic
trend in saving is removed prior to estimation of the VAR. Although the model identifies the trend
in saving with consumption-tilting dynamics related to divergences between the interest and time
preference rates. more generally it could capture other deterministic factors as well.

©International Monetary Fund. Not for Redistribution
72 FRANCE: FINANCIAL AND REAL SECTOR ISSUES
II. Empi rical Results for the Augmented Campbell Model
This section considers the role of expected future income growth in accounting for household saving behavior in France, abstracting in the first instance from the precautionary saving motive. A second part considers the empirical results for the full augmented model that includes precautionary saving.
Saving and Expected Future Income
Abstracting from the precautionary motive, equation (2) shows char saving should be equal to the expected present value of future declines in labor income, which is denoted by pdv,. Since, by definition,
00 1 pdv, - -L j <E,t:.y,+)'
i - t ( l +r) (4)
the parameters of the VAR defined by equation (3) may be used co obrain an estimate of pdv,. Specifically, denoting rhe matrix of coefficients in equation (3) by '1', and defining the veccor x, = (t:.y,. s, ), the matrix equation (3) may be written more compactly as
The k-step ahead expectation is simply
so that
pdv, = - ( 1 0)['1' /(I +r))[l - 'I' /{I + r)]-1x, = rx,, (5)
where r is rhus a (nonlinear) function of the VAR parameters. to The time series of pdv, obtained in this manner can chen be compared wirh actual data on saving to determine whether expectations of future income growth are indeed an important determinant of household saving behavior, as implied by the model.
Table 1 presents the coefficient estimates for the VAR. The main coefficient of interest in this table is the effect of lagged saving on (the first
10f also depends on the interest rate, r. In all calculations, an annual real interest
rate of 4 percent was assumed. The results are insensitive to annual interest rates in the range
2� percent.

©International Monetary Fund. Not for Redistribution
ll.y,
s,
Household Snvi11g: Stochastic !tJcome and FitJOtJciol Deregulation 73
Table 1 . VAR Parameters and Implications for r Vector VAR Parameters
(Row variable regressed on column variable)
6y,.., S E s,_, SE
0.17 0 . 1 0 -0.046. -0.025
0.07 0.17 0.91 ... 0.04
Implications for r Vector
rr SE(r) r. SE(r,)
-0. 1 5 .. 0.075 0.53 •• 0.20
Notes: sample: 1970:111-1993:1V; • 1••) denotes Significance of the coefftctent at the 10 percent (5 percent) level.
difference of) labor income.11 As long as households have more information about the future course of income than is contained in irs pasr hiscory, this coefficient should be negative and statistically significant. In other words, saving should anticipate future declines in labor income. As can be seen, the coefficient is esrimated at -0.046, and thus has the sign predicted by theory. Moreover, at the 1 0 percent level, the coefficient is significantly different from zero. Thus, saving indeed appears ro Grangercause subsequent declines in household labor income.
Using the formula given in equation (5), one can compute the entire time series of pdv,. Chart 2 plots both the time series of the expected present value of future declines in labor income (pdv,) and the detrended level of saving over the period 1970: I-1993:Il. tz As can be seen, overall the series labeled pdv cracks household saving reasonably well throughout the period. Indeed, the correlation between the two time series-at about 0.99-is very high, suggesting that even this simple model provides a reasonable starting point for describing household saving behavior in France. Perhaps more interesting is the fact that the expected present value term picks up the increase in saving since 1987, and tracks the actual variable very well during the last few years, a period during which traditional saving regressions have apparently performed poorly. 13
liAs described in Appendix II. the saving data used in this paper are calculated as household disposable income minus household consump1ion. Labor income, however, is only available on a gross basis. See Bloch and Maurel ( 199 1) for previous estimation of Campbell's model using similar data.
12TI!e time series on pdv is obtained according to the formula given in equation (4) above. The results forthe r vector are presented in Table I .
13Saving began to tum down i n the second quarter of 1993. This turning point i s also cap1ured by the model. and suggests thai part of the reason for reduced household saving is related to an
improvement in the outlook for future income, and thus to a reduction in the extent to which households are saving for a rainy day.
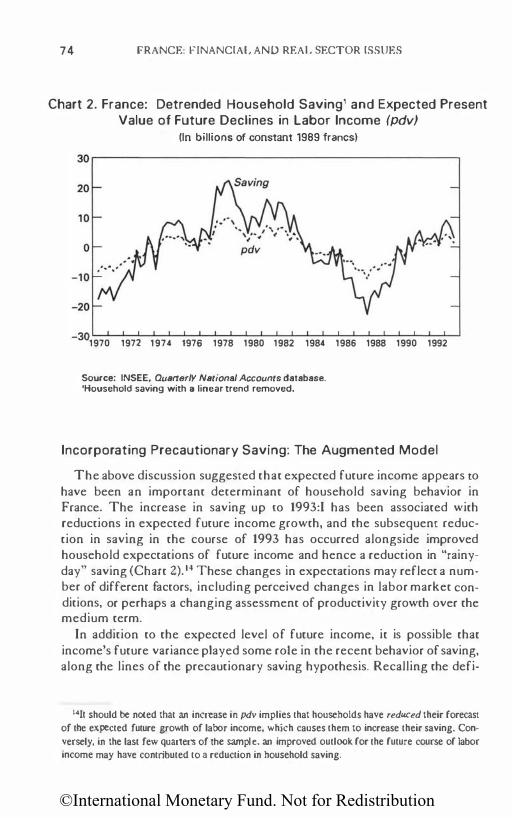
©International Monetary Fund. Not for Redistribution
74 FRANCE: FINANCIAL AND REAL SECTOR ISSUES
Chart 2. France: Detrended Household Saving1 and Expected Present Value of Future Declines in Labor Income (pdv)
(In billions of constant 1989 francs)
30r-------------------------------------------�
-30
1970 1972 1974 1976 1978 1980 1982 1984 1986 1988 1990 1992
Source: INSEE, Quarterly National Accounts database. 'Household saving with a linear trend removed.
Incorporating Precautionary Saving: The Augmented Model
The above discussion suggested that expected future income appears co have been an important determinant of household saving behavior in France. The increase in saving up to 1993:1 has been associated with reductions in expected future income growth, and the subsequent reduction in saving in the course of 1993 has occurred alongside improved household expectations of furure income and hence a reduction in "rainyday" saving (Chart 2). 14 These changes in expectations may reflect a number of different factors, including perceived changes in labor market conditions, or perhaps a changing assessment of productivity growth over the medium term.
In addition to the expected level of future income, it is possible that income's future variance played some role in the recent behavior of saving, along the lines of the precautionary saving hypothesis. Recalling the defi-
1411 should be noted that an increase in pdv implies that households have reduced their forecast of the expected future growth of labor income, which causes them to increase their saving. Conversely. in the last few quarters of the sample, an improved outlook for the future course of labor income may have contributed to a reduction in household saving.

©International Monetary Fund. Not for Redistribution
Household Savit1g: Stochastic f11come a11d Fi11atuial Deregulatio11 75
nition of the innovation to lifetime income (s) given previously in equation (1 ), we have
( I 0) [ I - 'I' I ( I + r) ] -1 ett
(6)
where the second equality follows from the VAR. Given s. its instantaneous variance, period by period, may be calculated by simply squaring the expression in equation (6), yielding a time series o�, .15 Once this is done, one can run (following equation (2)) a regression of the form
(7)
where, under the null, a1 = 1 and a2 = 2[r+�f_p)J>0. 16 Thus, saving should be equal to a term that depends on expected fu�ure income growth, and a term that depends on the variability of the innovation to lifetime income, where the importance of the latter depends on the degree of risk aversion and on the persistence of the shocks to the variance.
In equation (7), the pdv variable will be correlated with the error term u,, indicating that ordinary least squares is inappropriate. To overcome this problem, an instrumental variables procedure is used, where the instruments consist of two lags each of saving and the variance, as well as the first difference of income. The following results were obtained:
s, = 1 1 8.82 + l.85pdv, + 0.000071 o�,, (524.76) (0.023•) (0.000047)
R2 = 0.98, SER = 1320.94, sample: 1970:III-1993:IV
(8)
l)An allemative way of obtaining o(, would have been to estimate the VAR using an ARCH
procedure. The problem with implementing this approach was that the numerical algorithm used to calculate the time-varying component of the variance did not converge.
16'fhe constructed regressor, o�, . depends on the coefficient estimates obtained from the VAR,
which are consistently estimated even in the presence of heteroscedasticity.

©International Monetary Fund. Not for Redistribution
76 FRANCE: FINANCIAL AND REAL SECTOR ISSUES
where the numbers below the coefficient estimates are the heteroscedastic-consistent (White) standard errors, and • denotes significance of the coefficient at the 5 percent level.
As can be seen, both coefficients have their theoretically predicted signs, although only the pdv variable is significantly different from zeroY Nevertheless, the explanatory power of the regression is high, with the regressors explaining about 98 percent of the variance in saving. It is also clear that the coefficient on pdv is significantly above unity (its value under the null), suggesting that there is some excess sensitivity of household saving to movements in expected changes in labor income.18 In contrast, the coefficient on the variabiljty of income, ahhough correctly signed, is small.19
To indicate the relative importance of the two variables, one can decompose the movement in saving into a proportion due tO changes in the pdv variable and another due tO changes in the variance. Considering the last four years of the sample as the period to be explained,zo equation (9) reveals that about 5 percent of the explained change is accounted for by the precautionary saving term, and the balance (95 percent) is accounted for by changes in the expected growth of household income (the pdv term in equation (8)).
I l l . Other Determinants of Saving Behavior
The previous section has sought to address the importance of expected income growth and variability within the context of an augmented permanent income model of consumption and saving. In such a model, saving
17The interpretation would be that the role of our proxy for time-varying uncenainty in generating a precautionary demand for saving is small, possibly reflecting low persistence of variance shocks. In contrast. the role of the saving for a "rainy-day" term-captured by pdv-is highly significant.
18The excessive variability of saving (excessive, that is. in light of actual shocks to pdv) may reflect an omiued variable. It is possible, for example, that. in addition to the stochastic process for labor income. saving behavior in France may have been influenced by a number of different factors. including institutional changes relating to the deregulation of the financial sector. which cannot easily be accommodated within the formal permanent income model developed in this section. This issue is investigated below in Section Ill.
19'fo the extent that time-varying uncenainty has played only a limited role in saving behavior in France, the relevant model would be Campbell's unaugmented version, as reponed in Table I. It may be noted that the )(2 test for the strong implications of the model (essentially the restrictions on the r vector reponed in Table I) is equal to 8.23, which does not reject the model at the I percent level.
20All changes are relative to the average value of the variables during the entire sample excluding the last four years.

©International Monetary Fund. Not for Redistribution
Household Saving: Stochastic Income and Financial Deregulation 77
depends exclusively on the stochastic properties of the underlying process for labor income. In alternative models, however, there is room for other variables to affect consumption and saving behavior. In this section, the effects on saving of some of these ocher variables are considered.
The model of the previous section assumed an infinite horizon, in line with permanent income (PI) theory. In a life-cycle, overlapping generations (OLG) model, however, saving, in addition to its dependence on income growth and wealth, may be related to demographic factors. Further, the model of Section II assumed a constant real interest rate. This assumption was necessary in order to obtain a closed-form solution for the saving function (see Caballero (1990)). More generally, however, one may wish to allow for an effect of interest rate changes on saving, although the sign of this effect is ambiguous a priori since it depends on the interaction between an income and a substitution effect. Finally, inflation is often thought to be an important determinant of household saving because households need to put aside part of their income to maintain the real value of imperfectly indexed financial assets whenever there are price increases.
In addition to income growth, wealth, the real interest rate, inflation, and demographic factors, it is plausible to argue that the behavior of saving has been influenced by the process of financial deregulation that many industrial countries undertook during the 1980s. According to one view, financial deregulation may have reduced the incidence of liquidity constraints in the economy, and hence may have contributed ro an autonomous reduction in saving as previously liquidity-constrained households were able to borrow against their furore labor income. In addition, as the proportion of liquidity-constrained households declines, one might expect to see an increase in the sensitivity of aggregate saving to changes in the real interest rate, since a greater proportion of households would be in a position to optimize intenemporally.2t
Indeed, during the 1980s, France, like some other industrialized countries, undertook a number of significant reforms of its financial sector. Liberalization took place along three main tracks. The first involved the establishment and regulation of markets for new products such as futures, options, and commercial paper, the overhaul of stock exchange regulations, and the progressive liberalization of foreign exchange markets. The second track sought to modernize public debt management in order to increase the liquidity of government paper and foster the expansion of financial markets. The final track-which is perhaps the most relevant for
21For a justification of this view. see. for example, Campbell and Mankiw (1989).

©International Monetary Fund. Not for Redistribution
78 FRANCE: FINANCIAL AND REAL SECTOR ISSUES
the purpose of this chapter-was aimed at households and involved the regulation of mutual funds and other saving instruments, as well as the liberalization of banking credit.22• Z3
In line with other life-cycle OLG models, therefore, the specification proposed in what follows allows for the traditional effects of income growth, wealth, interest and inflation rates, and demographic faccors, as well as the less standard-buc potentially no less important- effects coming from the financial deregulation side.Z4 Following a number of authors (see, for example, jappelli and Pagano ( 1994)), the proxy for financial deregulation used here is the outstanding stock of consumer credit. The hypothesis is that increases in this proxy for deregulation should be associated with decreases in saving. In addition, the possibility that financial deregulation increases the sensitivity of saving co changes in the real interest rate is also allowed for in the specification.
The proposed saving model may be written as follows:25
where sratio is the household saving rario;26 y denottes the growth of real household disposable income; dem are demographic factors measured as the sum of the population aged under 20 and over 60 to the total population; ap represents asset prices that are proxied by the stock index divided by the consumption deflator;27 r is the real (short-term) interest rare; p is
22Changes in public debt management-particularly the practice (adopted after 1985) of auctioning public debt-also affected hoosehold saving behavior by contributing to the market determination of interest rates.
23The growth of mutual funds in France dates from the early 1980s and was initially due to interest rate ceilings, imposed in 1981, being strengthened over the past decade by a series offiscal incentives (Zerah and Aucoin ( 1993)). As regards liberalization of banking, the Banking Law of 1984 removed most of the distinctions between commercial and merchant banks and was followed by the abandonment of direct credit controls (encadrement) in 1986. This liberalization had a particularly strong effect on consumer credit (credit de rresorerie). the stock of which doubled between 1986 and 1989. For details of the financial deregulation process in France, see PilverdierLatreyte ( 1988), Vincent ( 1993), and Zerah and Aucoin ( 1993 ).
14For a succinct exposition of the life-cycle OLG model. see Modigliani {1986).
25The specification is a simplified version of that applied to United Kingdom data by Bayoumi (1993).
26The dependent variable in the model of Section II was the level of saving, rather than the saving ratio. This reflected mainly analytical tractability since, in the model of Section Ill. saving (rather than the saving ratio) could be shown to be a function of tlile expected present value of future declines in labor income. The solution for the saving ratio in the PI model as a function of the expected present value of future declines in the log of labor income is only an approximation (see Campbell and Deaton (1987)).
27 Asset prices are included here as a proxy for household wealth.

©International Monetary Fund. Not for Redistribution
Household Saving: Stochastic ft1come a11d FitJo11dal Deregulatio11 79
the inflation rate; d is the proxy for financial deregulation-it is equal co the ratio of the outstanding stock of consumer credit to gross domestic produce (GOP) rescaled to vary between zero and unity;28 and 11 is a stochastic disturbance.
Given the previous discussion, our priors are that B., B5, B7 > 0, and 82, 83, 86 < 0. The sign of 84 depends on the interaction between an income and a substitution effect, and is therefore unknown a priori. Because a number of the variables on the right-hand side of equation (9) are likely co be endogenous, it is necessary co use an instrumental variables procedure. The instrument sec consisted of a constant, the demographic variable (assumed exogenous), the lagged stock price index, the lagged value of the proxy for financial deregulation (the rescaled consumer credit to GDP ratio), and six lags each of income growth, inflation, and the proxy for financial deregulation times the real interest rate (the interactive dummy variable appearing as the last argument in equation (9)).29 The following results were obrained:30
sratio, = 0.29 + 0.15y, - 0.20dem1- 0.00040op1- 0.76r, (10) (0.21) (o.os•) (0.42) (0.00016•) (0.21••)
+ 0.19p, -0.13d, + Z.Zld,•r,, (0.09•) (0.031 ••)(0.39 ••)
R2 = 0.80, SER = 0.017, sample: 1971:IV-1993:lll
x2(insrruments) = 6.56 -x2(14) x2(auto) = 3.29 -x2(4),
where standard errors (in parentheses below the corresponding coefficients) are (Wh ice) heteroscedastic-consistent, and • (••) denotes significance of the coefficient at the 5 percent (1 percent) level. As can be seen, all of the parameter estimates have their theoretical signs. In particular, an increase in the growth race of real household disposable income, an increase in the ratio of the active to the total population, a decrease in
28The value of the proxy for deregulation peaks in 1990:1V. It is assumed to be equal to its maximum value (unity) in the remaining two years of the estimation. This assumption has no significant effect on any of the results reponed below. Finally. an alternative proxy for financial deregulation would be the ratio of consumer credit to total bank credit. Using this alternative proxy produced results that are vinually identical to those reponed below.
29The adequacy of the instrument set is discussed below.
10Aithough the estimation was conducted using quanerly data, the magnitude of the coefficients
on income growth. inflation, and the real interest rate reflects the fact that these variables were expressed at annual rates.

©International Monetary Fund. Not for Redistribution
80 FRANCE: FINANCIAL AND REAL SECTOR ISSUES
asset prices, and an increase in inflation all contribute to an increase in the saving ratio. Moreover, wich che exception of the demographic variable, all the effects are statistically significant at standard levels.3t Further, che data suggest that an increase in the real interest rate in the period before deregulation lowers saving, that is, that the income effect outweighs the substitution effect, a finding that is ac lease consistent with ocher studies using French daca.·�2
The regression results also shed light on che impact of financial deregulation on saving. First, as financial deregulation (proxied by the consumer credit-to-GOP ratio) progressed, the autonomous component of saving fell, as shown by the negative coefficient on d, in equation (10). In addition, financial deregulation also appears to have increased the interest sensitivity of saving. This can be seen by che fact that 67 in equation (1 0) is significantly positive. Specifically, by the early 1990s, when the proxy for financial deregulation reaches its maximum value (unity), the interest (semi-) elasticity of saving rises to 1.45 (i.e., 2.21 - 0.76). One possible interpretation is chat financial deregulation reduced the prevalence of liquidity constraints among French households, which resulted in an increase in the responsiveness of saving to interest rate changes.33
Together, the determinants of saving captured in equation (10) account for about 80 percent of the variation in the dependent variable over the sample. Furthermore, a x2 test for (up to) fourth-order serial correlation fails to reject the null of serially uncorrelated residuals. In addition, a Sargan cesc for the adequacy of che instruments (referred co above as x2(instruments)) does not reject the null that the chosen instruments are indeed independent of the structural error term. Both of these results indicate that the simple static specification adopted in equation (10) is indeed sufficient to account for saving behavior over the sample.
Using the coefficient estimates, it is possible to give an indication of che relative importance of the various independent variables in accounting for changes in the saving ratio. The equation should be particularly useful in quantifying the effects of financial deregulation, which have been emphasized in explanations of developments during the 1980s. To take an example, during the 1980s the household saving ratio fell by about
3'The insignificance of the demographic variable was not altered by introducing its two components as separate regressors.
31See, for example, Bloch and Maurel ( I 99 I). who repon results on the effects of interest rate changes on saving in a model that abstracts from the effects of financial deregulation.
33Bayoumi (1993) also finds that financial deregulation in the United Kingdom raised the interest sensitivity of saving. His results suggest an interest semi-elasticity of saving above 4.0 in the period after deregulation.

©International Monetary Fund. Not for Redistribution
Household Saving: Stochastic Income and Financial Deregulation 81
6 percentage points, from about 1 71fz percent in 1980 to about l l lh percent in 1989. Decomposing this change into its various components reveals that demographic changes contributed virtually nothing tO the change in saving over this period. Much more important were wealth effectS-there was a substantial run-up in stock and other asset priceswhich contributed about 3 percentage points of the observed decline in saving, and the decline in inflation (which contributed about 1lh percentage points of the observed decline). In addition, there was � small effect, in the opposite direction, of income growth, which contributed positively to saving over the period, increasing the saving ratio by about 1h percentage point. The remainder of the change in the saving ratio was captured by increases in real interest rates and the financial deregulation variable, both directly and via its effect in boosting the interest sensitivity of saving.34 Together, the interest rate and financial deregulation variables explain about 3 percentage points of the decline in the saving ratio35.
V. Conclusions
This chapter has attempted ro assess the relative importance of a number of factors in the recent behavior of household saving in France. In the first part, an attempt was made ro determine how household expectations about the future course of income-both its level and its variability-have influenced consumption/saving decisions. Under the permanent income theory modified to include the effects of precautionary saving, it was argued that saving should depend negatively on the expected future growth rate of labor income-the "saving for a rainy day" hypothesis-and positively on the variance of the innovation to lifetime income-the precautionary saving motive. Thus saving should increase whenever households receive information that causes them to revise downwards their view of future income growth, or when they perceive an increase in uncertainty about their future income prospects.
The resulting model of household saving was estimated using quarterly data over the period 1970-1993 and was found ro fit the data reasonably well. In particular, the role of expected future income growth was emphasized, as it was shown to be highly correlated with actual saving develop-
34Recall that, once the effect of financial deregulation on the interest sensitivity of saving is allowed for, the estimated effect of an increase in the real interest rate on saving is positive.
35As can be seen, the sum of these changes exceeds (by about I percentage point) the actual decline in saving observed over the period. Obviously, this reflects the fact that the fit of the regression is not perfect. so that the predicted decline in saving was larger than the actual decline.

©International Monetary Fund. Not for Redistribution
82 FRANCE: FINANCIAL AND REAL SECTOR ISSUES
ments over the entire sample. Thus, the model suggested that the increase in saving observed over the past few years may be due to a less optimistic outlook for expected future income, which in turn may be related to developments in the labor market. As the outlook improves, "rainy-day" saving should begin to decline, something that already appears to be occurring according to the most recent saving data for the second half of 1993. Finally, although the variability of future income (the precautionary saving effect) was found tO enrer the augmented saving model with the correct sign, it was not statistically significant, suggesting perhaps that the standard (unaugmented) PI model may be just as valid as the augmented model in accounting for saving behavior in the French case.
Although PI models of consumption emphasize the role of the stochastic process for labor income in saving determination, it may be unduly restrictive to ignore the effects of institutional changes-including the important effects of financial deregulation-that are difficult to accommodate within the formal PI approach. In the second part of this chapter, therefore, the role of a number of additional variables was investigated. Perhaps the most significant finding to emerge from this analysis is the important role of financial deregulation in household saving, particularly during the 1980s. It would appear that such deregulation not only directly encouraged proborrowing activity by French households, but also increased the sensitivity of household saving to interest rate changes, perhaps reflecting the reduced incidence of liquidity constraints in the general population. Thus, while the consensus from previous studies using historical data has been that an increase in interest rates will have a negligible-or even perverse36--effect on saving, the results here suggest that these studies may have been flawed to the extent that they ignored the potential effects of financial deregulation. The decline in real interest races that has occurred since early 1993 may therefore help to explain the fall in the saving rate that has recently occurred. In the fucure, reductions (increases) in real interest rates are likely to bring forth a larger drop (rise) in the saving rate than they would have in the past.
Appendix I
The analytical framework on which the discussion in Sections I and II is based assumes a representative agent who maximizes the expected value
36TI!at is, the income effect outweighs the substitution effect.

©International Monetary Fund. Not for Redistribution
Household Saving: Stochastic Income and Financial Deregulation 83
of the discounted sum of current and future utilities subject to a series of dynamic budget constraints and a transversality condition that rules out Ponzi-type schemes. Thus, the agent maximizes
L �� E[u(c,)], (Al) I - 0
where 13 i s the subjective discount factor, u(.) is the instantaneous utility function, and c, denotes consumption. In addition to the transversality condition, consumers' decisions must satisfy their dynamic budget constraints, which hold that in any period 1
b,.t = (1 +r)b, + y,- c,, (AZ)
where b, denotes financial assets at time t, y, denotes real labor income, and r denotes the exogenous real interest rate. For the purpose of empirical implementation, a CARA form of the instantaneous utility function is adopted:
u(c,) = -(1/a.)e-«tt, (A3)
where a. > 0 denotes the Arrow-Pratt measure of (absolute) risk aversion. Under the simplifying assumption that the interest rate is equal to the
rate of time preference,37 the first-order necessary condition is given by
(A4)
This condition states that the marginal utility cost of giving up one unit of consumption at time 1 should be equated to the expected utility gain from consuming one more unit at /+1. Alternatively, dividing the left-hand side of equation (A4) by the right-hand side, the condition states that the intertemporal marginal rate of substitution should equal the ratio of the prices of present and future consumption, which is unity here.
31Th is assumption is not restrictive, since, as indicated in the text. the effect of any difference between the rate of interest and the rate of time preference is taken into account in the estimation. Specifically, as explained in Caballero ( 1990). if the interest rate differs from the rate of time preference, there will be a deterministic trend in the saving function. Such a trend is taken into account in the empirical work by removing a deterministic (linear) trend from the saving data prior to estimation of the VAR.

©International Monetary Fund. Not for Redistribution
84 FRANCE: FINANCIAL AND REAL SECTOR ISSUES
It is assumed that the variance referred to in equation (Al) follows an AR(l) process with parameter p.38 To solve for the consumption function, a "guess and verify" method is used. Our guess for the consumption process ts
(AS)
where s, is the innovation in lifetime labor income,
(A6)
A,_1 is the stochastic slope of the consumption path between periods t - 1 and I, which depends on the variance oflf,,_1, denoted o€,_1 ; and w, is the innovation to A,.39 Intuitively, under certainty equivalence, the first difference of consumption would just be equal to s,. When certainty equivalence is not imposed, however, there are two additional terms, which reflect precautionary saving behavior. A high value of the variance in the last period raises A,_1, which increases the growth race of consumption (lowers c,_1), in line with the precautionary saving hypothesis. A positive innovation ro the variance today-which implies a positive drawing for the shock w,-lowers consumption today c,, thereby reducing the growth rate of consumption. If p = 1 , so that the innovation co coday's variance is permanent, agents revise upward their estimate of the future variance by the full amount of the shock and, therefore, the effect on consumption growth is equal to the annuity value of the innovation w,/r. If p < 1 , the shock is reversed in the future, and the effect of the innovation on consumption is accordingly smaller.
Substituting equation (AS) inco equation (A4) yields40
[f the innovations to labor income have a normal distribution (with mean zero), chen so will S· If, moreover, the innovations ro the variance
38The variance at time t is assumed to be in 1he 1ime-t information set of the representative household.
39Jt is straightforward to verify that the innovation to the I\ process. w,. is proponional to the
innovation to the variance process. Also. it is clear that if the variance process is an AR(l) with parameter p, then the I\ process will also be an AR( I ) with parameter p; see Caballero ( 1990).
<OWe assume that s and w are independent stochastic processes.

©International Monetary Fund. Not for Redistribution
Household Saving: Stochastic Income and Financial Deregulatiotl 85
process follow a normal distribution, then the expectations in equation (A7) can be evaluated co yield
apcri, acr; A, = -2- + 2 [ r + ( l - p) ) 2
' (A8)
where cr� is the (known and constant) variance of w. Clearly, with A, as defined in equation (A8), the guess for the consumption process in equation (AS) satisfies the first-order condition in equation (A4).
Once A, has been obtained, a final form of the consumption function may be guessed as follows:
(A9)
Thus, according to equation (A9), consumption in any period is equal to permanent income minus a term in the variance of labor income. To check the guess for the consumption function, it must be shown that equation (A9) satisfies equation (AS).41 Note from equation (A9):
r oo I - ( 1 + r)f-:0 ( 1 + r)i [E,(yy+J) - E,_ l (y,+ ) J
(AlO)
A, + ( l + r) A,_ 1 + r [b, - ( I + r) b,_ l + c;_ l - y,_ l ] - [ r + ( 1 - p) ]
But from the budget constraint in equation (A2):
b,- (1 + r)b,_ 1 + c;_ 1 - y,_1 = 0. (Al l )
Substituting the process for A, gives:
c,• - c,•_ 1 = !;, + A,_1 - w,/(r + (1 - p)], (Al2)
which is equation (AS), as was to be verified. By definition, saving is equal to the change in financial assets. Using the
budget constraint equation (A2), together with the solution for the consumption function given in equation (A9), gives a simple expression for saving as the present value of expected changes in labor income plus a term in the variance of the innovations to labor income
41Recall that equation (AS) itself satisfies the Euler condition equation (A4), given equation (A 7).

©International Monetary Fund. Not for Redistribution
86 FRANCE: FINANCIAL AND REAL SECTOR ISSUES
.. 1 apo�, s· - - ""
( I ) ' ( £ fly .) + + constant, (A13) , � + r J ' t +; 2 [r + ( l - p ) ]
where fl. is the (backward) difference operator, flx, = x, - x, _ " and where, from equation (A8), the constant depends on the (known) variance of the shocks to the A process. Equation (A13) clearly illustrates the implications of precautionary saving for saving behavior, revealing that both risk aversion (a) and the persistence of the shocks to the variance process (p) magnify the effect of the precautionary saving motive on saving.
Appendix I I
The main sources of data were INSEE and Wharton Econometrics Forecasting Associates (WEFA). A deflator for all nominal variables was obtained by dividing INSEE's measure of nominal household consumption by household consumption at 1980 prices. Other series obtained from INSEE were labor income, household disposable income, and household saving, the latter being the difference between household disposable income and consumption. The saving ratio is household saving divided by household disposable income. Population data were obtained from several issues of I'Annuaire Statistique de Ia France, table B-01-1. Three-month bank deposit rates and stock prices were obtained from WEFA. Data on the srock of consumer credit were provided by the French authorities, and prices of apartments in Paris were taken from Taffin ( 1 993).
References
Allard, Patrick, "La modelisation de Ia consommation des menages en France," Revue d'iconomie politique, Vol. 102 (September/ October 1992), pp. 728-68.
Artus, Patrick, Eric Bleuze, Florence Legros, and Jean-Paul NicolaY, "Epargne des menages, choix de portefeuille et fiscalite en France," Rcuuelconomique, Vol. 42 (July 1991), pp. 663-700.
Bayoumi, Tamim, "Financial Deregulation and Household Saving," Economic Journal, Vol. 1 03 (November 1993), pp. 1432-43.

©International Monetary Fund. Not for Redistribution
Household Saving: Stochastic Income and Financial Deregulation 87
Bloch, Laurence, and F. Maurel, "Consommation-revenue permanent: un regard d'econometre," Economie et Prlfvision, Vol. 99 (March 1991), pp. 1 13-44.
Caballero, Ricardo, "Consumption Puzzles and Precautionary Savings," Journal of Monetary Economics, Vol. 25 (January 1990), pp. 1 1 3-36.
Campbell, John, "Does Saving Anticipate Declining Labor Income? An Alternative Test of the Permanent Income Hypothesis," Econometrica, Vol. 55 (November 1 987), pp. 1249-73.
__ , and Angus Deacon, "Is Consumption Too Smooth?" NBER Working Paper No. 2134 (Cambridge, Massachusetts: National Bureau of Economic Research, January 1987).
Campbell, john, and Gregory Mankiw, "Consumption, Income, and Interest Races: Reinterpreting the Time Series Evidence," HIER Discussion Paper No. 1435 (Cambridge, Massachusetts: Harvard Institute of Economic Research, April 1989).
France, Finance Ministry, Direction de Ia Prevision, "Peut-on expliquer l'evolucion recente du caux d'epargne des menages?" (mimeographed, Paris: Direction de Ia Prevision, 1993).
Hall, Robert E., "Stochastic Implications of che Life Cycle-Permanent Income Hypothesis: Theory and Evidence," Journal of Political EcotJomy, Vol. 86 (December 1 978), pp. 971-88.
__ , "Inrertemporal Substitution in Consumption," Journal of Political Economy, Vol. 96 (April 1988), pp. 339-57.
jappelli, Tullio, and Marco Pagano, "Saving, Growth, and Liquidity Constraints," Quarterly Joumal of Ecor1omics, Vol. 109 (February 1994), pp. 83-109.
Modigliani, Franco, "Life Cycle, Individual Thrift, and the Wealth of Nations," American Economic Review, Vol. 76 (June 1986), pp. 297-313.
Pilverdier-Lacreyte, ]., Le march! financier fratJ{a is (Paris: Economica, 1 988).
Sterdyniak, Henri, "Le choix des menages enue consommation et epargne en France de 1966 a 1986," Observations et diagnostics iconomiques, Vol. 21 (Occober 1987), pp. 191-210.
Taffin, C., "Crise immobiliere: une le�on a retenir," Revue d'Ecor1omie Financiere (special issue on La crise financiere de l'immobilier, 1993), pp. 151-64.
Vincent, D., "L'evolution du credit a Ia consommation," Problemes Economiques, No. 2316 (March 1993), pp. 1-4.
Zerah, Dov, and Olivier-Alban Aucoin, Le systeme fintmcier fran{ais: dix ans de mutations (Paris: La Documentation fran�aise, 1993).

©International Monetary Fund. Not for Redistribution
The Link Between Rea l Interest Rates and French Aggregate Private
Investment
MARK TAYLOR
Dhe effect of movements in real interest rates on aggregate investment expenditure has traditionally been considered an important element
of the monetary transmission mechanism (see, for instance, Miles and Wilcox (1991 )). In France, the issue of the existence and strength of the link between real interest rates and real aggregate expenditure forms a crucial element of the current policy debate, given the tensions inherent in pursuing a firm nominal exchange rate policy in the face of high unemployment and weak macroeconomic activity.
This chapter is concerned with developing and estimating an empirical investment equation for France, using quarterly data for the period 1970-92. In particular, we search for the link between the real interest rate and the level of real aggregate private investment expenditure. We then use our empirical results to examine tO what extent high real interest rates were responsible for the stagnation in French investment over the 1990-92 period, and whether reductions in real interest rates will significantly stimulate investment expenditure and so help lead the economy out of recession.
In contrast with much of the empirical evidence available on this issue, the results of our empirical investigation reveal the presence of statistically significant short-run and long-run effects of the real interest rate on French investment demand. The key to unearthing this relationship (and explaining why previous researchers have not detected it) appears to lie in the use of a methodological approach that is novel in empirical investment demand studies. This approach involves deriving an empirical model whose longrun solution is consistent with multiperiod optimizing behavior on the parr of firms, but for which the short-run dynamics are largely determined by
88

©International Monetary Fund. Not for Redistribution
Rea/ Interest Rates and Aggregate Private Investment 89
the data. While the resulting short-run investment function can be interpreted as deriving from dynamic optimization of firms in the presence of adjustment costs, it is capable of allowing for very rich short-run dynamics. In particular, there is a distinction made between the short-run and longrun elasticities of substitution berween capital and labor. In the short run, we find that this elasticity is relatively low-which explains why simple accelerator models of investment have in the past been successful when estimated on French data-bur in the long run the elasticity tends toward unity. 1 The increased opportunity for substitution between capital and labor in the long run makes the implicit rental cost of capital goods, relative to the wage rate, increasingly important for investment decisions as time passes.
In the next section we motivate the analysis through a discussion of the relevance of the investment-interest rate nexus for the current policy debate. In Section II we give a very brief survey of previous empirical studies of aggregate investment on French data. In Section III we summarize our theoretical and empirical framework, the technical details of which are given more fully in Appendix I. The data are described in Section IV and our empirical results are summarized in Section V (and given in detail in Appendix II). In Section VI we use the estimated equation tO carry out some counterfactual simulations assuming a higher growth of aggregate demand or lower real interest rates over the 1990-92 period. In Section VII we carry out some forecast simulation exercises, assuming alternative paths for real interest rates and output over the 1993-94 period. A final section concludes.
I. I nvestment and Interest Rates i n France
For the ten years following the first Organization of Petroleum Exporting Countries (OPEC) oil price shock of 1974, the French investment-output ratio (gross fixed investment as a proportion of GOP) showed a more or less continuous decline, from close to 27 percent at the end of 1974 to less than 20 percent in 1984 (Chart 1). Although there was some reversal of this trend over the ensuing five years, investment again stagnated during the 1990-92 period. A prime suspect for one of the underlying causes of the recent stagnation in investment expenditure has been the very high level of real short-term interest rates.
'Technically. the shon-run production technology appears to be closer to the Leontief or fixed factOr proponions type. while the long-run production function appears well approximated by a Cobb-Douglas function.

©International Monetary Fund. Not for Redistribution
90 FRANCE: FINANCIAL AND REAL SECTOR ISSUES
Chart 1 . France: Investment and Interest Rates
27�------�--------------------------------------�
26
25
19
1 5 1970 1972 1974
Investment-Output Ratio 1 (in percent)
1976 1978 1980 1982
Ex Post Short-Term Real
10 Interest Rate2
5
0
-5
-10 1970 1972 1974 1976 1978 1980 1982
Source: INSEE; IMF Treasurer's Department.
1984 1986 1988
1984 1986 1988
'Ratio of real investment expenditure of the secteur marchand to real GOP.
1990 1992
1990 1992
'Three-month money marlcet rate less annualized growth in the GOP deflator in the following quarter.
During 1992-93, high nominal interest races were needed in order to defend the franc's parity against the deutsche mark, in the face of mounting speculative pressures and considerable turbulence within the European Monetary System (EMS) as well as a tight anti-inflationary stance of monetary policy in Germany. In the absence of strong French inflationary pressures, these high nominal rates translated into high real imerest rates, despite the weakness of French economic activity and the clear desirability of easing monetary conditions. An apparent rise in market confidence in the franc, following the formation of the new Government in March 1993 and the announcement of new policy measures the following month,
©International Monetary Fund. Not for Redistribution
Real lr1terest Rates a11d Aggregate Private b1vestment 91
eased downward pressure on the franc somewhat, however, and German nominal interest rates also saw some slight reduction. The franc again came under strong speculative attack, exacerbating the policy dilemma over whether interest rate cuts should be reversed in the face of macroeconomic weakness. Even if this round of speculative attacks on the franc had not occurred, the link between interest rates and investment would still be an important policy issue for France.
A traditional view among French economists, presumably derived from the empirical evidence discussed in the next section, is that real interest rates have little or no effect on investment expenditure. Certainly, any link that does exist between real interest rates and investment is likely to be complex, and interest rates clearly cannot explain all of the variation in investment. As Chart I shows, for example, the great decline in the aggregate investment-output ratio over the decade following the first OPEC oil price shock coincided with a sustained period of low and often negative ex post short-term real interest rates.
Nevertheless, economic theory does suggest that the real interest rate, operating through the implicit rental price of capital goods and in combination with other variables such as the relative price of labor and aggregate demand, should have some effect on real investment expenditure. In practice, however, empirical work on French aggregate investment has found little evidence of a link with the real interest rate. Rather, applied researchers have tended to favor the use of simple flexible accelerator-type models, where investment is explained solely by movements in aggregate output. Such a model would be implied by a fixed-coefficients production technology under a demand constraint: if a given amount of capital is required for producing a given amount of output, with no possibility of substituting between capital and labor, chen the demand for new capital will depend on the expected level of output demand and will be largely insensitive to movements in the rental price of capital goods, and hence real interest rates.
We now curn to a discussion of existing empirical literature on this issue.
I I . Empirical I nvestment Studies on French Data
Empirical investment scudies,2 in France and elsewhere, may be classified into three broad categories: true neoclassical, competitive equilibrium models; quasi-neoclassical models; and accelerator models.
2This survey is highly selective. A more thorough and comprehensive survey of the theory and evidence relating to the French investment function can be found in Artus and Muet (1990).

©International Monetary Fund. Not for Redistribution
92 FRANCE: FINANCIAL AND REAL SECTOR ISSUES
The uue neoclassical model assumes perfectly elastic supplies of facrors and perfectly elastic demand for output. The result is an investment function that, in the absence of adjustment costs or price uncertainty, is defined only for decreasing returns to scale (Jorgenson ( 1967), Coen ( 1969)). This is because with constant returns to scale the desired capital stock of the representative firm is infinitely large, while with increasing returns to scale the revenue function does not have a maximum. These problems illustrate the dangers of applying what is an essentially microeconomic theory of optimal capital accumulation at the aggregate level without allowing for the relevant feacures of aggregation, such as imperfectly elastic output demand.
Nevertheless, a number of researchers have estimated the true neoclassical model-in which investment is a function of relative factor rentals only-on aggregate French data (Schramm ( 1 972), Muet ( l 979a, b), Villa, Muet, and Boutillier ( 1980), Artus and M igus ( 1 986)).3 Nearly all of these studies have reported disappointing results and have concluded that the true neoclassical model of investment is unrealistic at the aggregate level.
In a number of influential studies published during the 1960s,4 jorgenson developed what became known as the neoclassical model of capital accumulation, but which we shall refer to as quasi-neoclassical. jorgenson derives the desired level of the capital stock by equating the marginal product of capital with the user cost of capital, and then assumes lagged adjustment of the actual capital stock roward this desired level. The net result is an investment equation conditioned on output and the real user cost of capital. The problem with this approach is that only one of the first-order conditions for profit maximization is utilized; setting the marginal product of labor equal ro the real wage rate and substituting into the jorgenson model would yield the true neoclassical model where investment is conditioned only on relative factor rentals. Thus, the jorgenson model is quasi-neoclassical. Muet ( 1979a) has estimated quasi-neoclassical models of investment for France, and reports largely disappointing results.
A close relative of the quasi-neoclassical model, but with a sounder theoretical footing, is the effective-demand investment model. This model explicitly recognizes an aggregate demand constraint, and so aggregate output (equal to demand if demand is less than notional supply) enters the investment function in addition to relative factor rentals.5
3See Schramm (1970) and Jorgenson (1967) for applications to U.S. data.
•For instance, Jorgenson ( 1967), Jorgenson and Stephenson ( 1967a, 1967b, 1969a, 1969b), and Hall and Jorgenson ( 1971 ).
51n the Jorgenson model. investment is conditioned on output and the real user cost of capital rather than relative factor rentals alone or relative factor rentals and output. It really is, therefore, "neither fish nor fowl."

©International Monetary Fund. Not for Redistribution
Real Interest Rates and Aggregate Private Investment 93
Output may also enter the investment function even in the absence of demand constraints if the production technology is assumed ro be of the fixed-factor proportions, or Leontief, type. In the absence of a labor constraint, the desired capital stock will be directly proportional ro ompur. Assuming a distributed lag adjustment of acrual roward desired capital srock then results in the traditional flexible accelerator investment model, where investment is a function only of the change in output, with no effect of relative factor prices on the investment decision.
Demand-constrained investment models have been estimated for France, with some degree of success, by Anus and Muet (1980, 1981). These authors find, however, that the influence of relative factor rentals on investment "is weak compared to the acceleration effect of demand" (Artus and M uet ( 1980)). They also find that the elasticity of investment with respect to output demand-in theoretical terms, the inverse of the production function's returns to scale-is insignificantly different from unity.
Simple flexible acceleraror models of investment have been estimated for France by a number of researchers (e.g., Oudiz (1978), Muet ( 1978)see Artus and M uet (1990) for a survey). These equations perforr:' reasonably well and again provide evidence of constant returns to scale in production.
More recent work on the French aggregate private investment function includes Anus and Sicsic (1990) and Muet and Veganzones (1992), who fit a range of models ro 1980s data. A major finding of these authors is that, while the effect of the real interest rate on investment, operating through the user cost of capital, was significant during the 1960s and 1 970s, it becomes insignificant when the sample is extended ro include the 1980s.
I l l . Theoretical and Empirical Framework
In Appendix I, we consider the investment decision of a representative firm facing a demand constraint on its output and producing according ro a production function which is, at least in a long-run sense, of the traditional constant-rerurns Cobb-Douglas variety. We demonstrate that the solution ro the firm's optimization problem is a long-run investment demand function of the form
logl(t) = n-yt + logY (t) - cLiog [p (t) /w (l) ] + v (t), (l)
where /(!) is aggregate investment at time 1, Y(t) is aggregate output, p(t) is the real user cost of capital, w(t) is the real wage rate, v(t) is a stationary

©International Monetary Fund. Not for Redistribution
94 FRANCE: FINANCIAL AND REAL SECTOR ISSUES
disturbance term, 1t is a constant term, yt is a time trend that captures the effects of technical progress, and a. is the share of labor in aggregate output (approximately 0.6 for France). The rwo noteworthy features of equation (1) are a long-run output elasticity of investmem demand of unity and a negative investment demand elasticity with respect to relative factor rentals.
In Appendix I we also show that, given the existence of a long-run investment demand equation of the form (1), both dynamic optimization theory and certain statistical theorems can be employed to derive a shorerun investment demand function of the form
n �logl(t) - y0 + � 'Yu�log l ( t - i)
I - I (2)
+ I "{2;�logY ( t - i) + f y3;�1og [p ( t - i) /w ( t - i) ] i - 0 • - 0
where v(t) is the error correction or equilibrium error implicitly defined in equation (1), �(t) is a stochastic disturbance term, and "{4< 0. The main interest of chis equation is that it nests a flexible accelerator-type investmem function (i.e., where investment is a function of lagged changes in output),6 bur has a long-run solution that is of the form (1). In the short run, we expect y. and rhe y3,s to be small, reflecting limited shore-run opportunities for capital-labor substitUtion. We expect y. co be negative and statistically significam, however, reflecting increased capital-labor substitution opportunities as time passes, with eventual steady-state convergence on the long-run investment demand function in equation (I).
Equations (I) and (2) are the cwo main equations estimated, although in Appendix II we also report estimates of a long-run aggregate production function for France, since the analysis is predicated on the assumption that this is approximately Cobb-Douglas-an assumption we rest.
IV. Data
Quarterly data for the period 1970:I-199Z:IV were obtained from the IN SEE database on the following series for the secteur marchand (i.e., for
"The usual accelera10r model explains investment or the investment-output ratio as a function of changes in output. rather than having changes in investment as the dependent variable. In this
chapter, however. we shall speak of the whole class of investment functions in which investment is explained solely by a distributed lag of changes in output as nexible accelerator-type models.
©International Monetary Fund. Not for Redistribution
Reo/Interest Rates and Aggregate Private Investment 95
the economy excluding public administration): real output (Y) and the output deflator (p), real gross investment expenditure (I) and the investment deflator (Q), total hours worked (L), the nominal hourly wage rate (W), and the nominal three-month money market interest rate (i). A corresponding real capital stock series was taken from OECD sourcesJ
Real wage (w) and real capital goods price (q) series were computed by deflating by the output deflator (i.e., w = W/p and q = Q/p). An ex post measure of the user cost of capital was constructed as
p (r) � q (t) { [ ( i (t) /400) - D.p (t + 1 ) /p (r) ) + 8/400}, (3)
that is, the real price of capital goods multiplied by the opportunity cost of funds (real interest rate) and the quarterly depreciation rate, where the annual depreciation rate 8 was set at 6 percenr.S
V. Summary of the Empirical Results
Using very recent applied econometric techniques on the estimation of long-run economic relationships (Engle and Granger (1987), Johansen ( 1988), Phillips and Loretan (1991)), we obtained the following constrained estimate of equation (1 ):
log/ (r) - logY (r) - 0.61og [ p ( t) /w (r) ] + v (r). (4)
This estimated equation is extremely encouraging in that the long-run coefficient constraints of a unit output elasticity, and of a negative relative factor rental elasticity equal in magnitude to the share of labor in aggregate output, are not rejected by the data (see Appendix I I for further details).
The deviations from long-run equilibrium from this equation, that is, the fitted values of v(t), were then used co estimate a dynamic short-run investment function of the form in equation (2). This resulted in a highly stable estimated equation that fitted the data well, explaining some 55 percent of the quarterly percentage change in aggregate investment, and that passed a whole range of modern regression diagnostic tests. The stability of the estimated coefficients is particularly impressive. The
7 Flux et Stocks de Capital Fixe. OECD. Paris.
8This value was suggested by economists at the French Direction de Ia Prevision. Selling o as low as 2 percent per annum or as high as 1 5 percent per annum made no qualitative differenceand slight quantitative difference-to the results reponed below.
©International Monetary Fund. Not for Redistribution
96 FRANCE: FINANCIAL AND REAL SECTOR ISSUES
short-run elasticity of investment demand with respect to relative factor rentals was estimated to be about �.37, or roughly half the long-run elasticity of around �.6, and to operate with a six-month lag. The estimated value of the adjustment coefficient, y. in equation (2), was approximately �.02, implying a very slow adjustment roward the long-run or equilibrium level of investment demand: a 10 percent deviation from the long-run equilibrium level of investment generates an adjustment of only 0.2 percent in the current quarter.
Thus, although we have found an effect of real interest rates on investment that is statistically significant and consistent with optimizing economic theory, the small magnitUde of the relevant estimated coefficients and the extremely slow implied speed of adjustment roward long-run equilibrium (and increased capital-labor substitution possibilities) suggest that this link may not be economically important for practical policy purposes. This issue is explored in the following two sections.
VI. What Caused the Recent Decline in Investment?
The marked slowdown in French private investment over the 1990-92 period has been variously explained as due to the effect of high real interest rates opera£ing through the user cost of capital, or the recession itself operating through a decline in output and an accelerator effect on investment. In an attempt to shed some light on this issue, we carried out three counterfactual experiments using our estimated investment equation.
In the first experiment, we held the short-term real interest rate constant, over the period 1990-92, at its 1989 average level of 6.3 percenr per annum, as opposed to an actual path of the ex post real interest rate of between 6. 7 and 8.2 percent over this period. Assuming no feedback effect on output, prices, or the wage level, we then used the equation to forecast investment dynamically over this three-year period. The percentage deviation of the forecast level of investment from the level predicted by the model with the real interest rate at its actual historical values was then computed.
In the second counterfactual exercise, the real interest rate was held at 5 percent per annum from 1990:1, and, in the third exercise, real output was assumed to grow at 2.5 percent per annum from 1990:1 (with the real interest rate at its actual historical values). This growth rate, corresponding to the growth of output in 1990, is a somewhat higher growth path than was actually experienced, since aggregate output actually grew at some 0. 7 percent in 1991 and 1.3 percent in 1992.
The results of these exercises, expressed as the percentage difference in the value of the simulated level of investment from the base simulation

©International Monetary Fund. Not for Redistribution
Real i11terest Rates rmd Aggregate Private lnvestmmt 97
Year and Quarter 1990:1
:II
:Ill
:IV
1991 :I
:II
:Ill
:IV
1992:1
:II
:Ill
:IV
Table 1 . Simulated Paths for I nvestment (Percentage deviations from base simulation)
Real Interest Real Interest Annual Growth of Rate = 6 .3 percent Rate = 5 percent Output = 2 .5 percent
-0.67
0.13 -0.31
0.47 4.84 -0.49
4.20 8.64 1.31
6.16 1 1 .32 1.96
1.30 6.52 2.49
1 . 1 4 7.19 2.42
3.93 10.00 3.65
5.50 1 1 .84 3.47
5.24 1 1 .61 4.33
8.54 1 5.08 4.91
9.25 1 5.81 6.75
Source: IMF staff calculations using equat1on (A 16).
level, are given in Table I . Ir appears that increases in the real interest rate may have had a significant negative impact on investment over the 1 990-92 period. Indeed, the equation implies that holding the real rate at its average 1989 level would have led tO real investment expenditures that were 9.25 percent higher by the end of 1992. This compares with a 6. 75 percent simulated increase in real investment that follows when the 1990 average growth rate of output is projected over the period.
Overall, these counterfacrual exercises suggest that high real interest rates, as well as the decline in aggregate demand, may have played a significant role in the fall in the investment-output ratio over the 1990-92 period.
VII. Will Lower Real I nterest Rates Stimulate Recovery Through Increased I nvestment?
The final question that we address is whether the prospective decline in real interest rates, as forecast in the September 1 993 World Eco11omic Outlook (WEO), could be expected to have a significant impact on investment expenditure. In examining this issue, we used our estimated equation to carry out three forecast simulation exercises.
In the first exercise, we forecast the growth path of real investment over the period 1 993:ITI through 1 994:IV, using values of all of the exogenous variables consistent with the September 1993 WEO forecast.

©International Monetary Fund. Not for Redistribution
98 FRANCE: FINANCIAL AND REAL SECTOR ISSUES
Table 2. Simulated Effects on Investment of Alternative Assumptions, 1993:111-1994:1V
Cumulative percentage increase in investment over base simulation
(Assumptions)
Real Interest Rate Unchanged Quarterly Growth Rate of Man· from 1993:11 Level ufacturing Output ; 1 percent ( ; 5.9 percent p.a.) from 1993:111
-10.00 5.04
Note: The simulations assume paths for the exogenous variables consistent with the WEO forecast, except those indicated.
Source: IMF staff calculations using equation (A16).
In the second exercise, we performed the same forecast simulation with the same WEO assumptions except that the real interest rate was held constant at irs 1993:II level of 5.9 percent, rather than declining as foreseen in the WEO forecast to some 2.8 percent in 1994.
In the final forecast simulation, we used the WEO assumptions for real interest rates but assumed a higher growth rate for manufacturing output, equal to 1 percent per quarter.
The resultS of these exercises, expressed as the difference in the forecast level of investment at the end of 1994 from the level of investment produced by using the WEO forecast as assumptions, are given in Table 2. As the table shows, the interest rate effects on investment are again significant: failure to reduce the real interest rate by about 2 percentage points (to some 2.8 percent) by the end of 1994, leads to a simulated 10 percent fall in investment over the simulation period. On the other hand, increasing output growth to some 4 percent per annum (from the WEO forecast of -1 percent for 1993 and +1 . 1 percent for 1994) would increase real investment by 5 percent over the WEO base forecast by the end of 1994.
It should also be noted that these single-equation simulation results are not dissimilar from those obtained from simulations of the IMF's multiregion econometric model, MULTIMOD. In particular, MULTIMOD simulations for France suggest that a movement of 100 basis points in the real interest rate will move real investment by some 5 percent in the opposite direction over a one- ro two-year period.9
9Al!hough, in MULTIMOD, some of the effect on investment comes indirectly through the effect on output. See Masson, Symansky, and Meredith ( 1990).
©International Monetary Fund. Not for Redistribution
Reo/Interest Rates tmd AggregtJte Private Investment 99
VII I . Conclusion
In rhe appendices we have combined recent econometric techniques on rhe long-run properties of economic time series and economic theory to derive and estimate an empirical investment equation for France that is both consistent with economic theory and empirically tractable. The resulting equation, estimated on French quarterly dara for the period 1970-92, performed well empirically, and suggested a statistically significant effect of real interest rates on aggregate investment demand, operating through the user cost of capital.
Simulations using the estimated equation suggested that the high level of real interest rates over the 1990-92 period may have been an important contributory factor in the decline in the investment-output ratio over the same period. Similarly, further forecast simulations suggested that failure tO reduce real interest rates in the furure may have important negative effects on aggregate investment.
As wirh all applied econometric studies, the results reported in rhis chapter should be interpreted with caution, and the reader may wish ro consider the following points: It is clear that new econometric esrimares do nor have quire the same scientific authority as, for instance, new esrima res of rhe speed of sound or of the gravita tiona I cons rant. Thus, the forecast simulations reported above can only be taken as illustrative and indicative of the effects of real interest rate movements on real investment, rather rhan as definitive measures of these effects. In addition, the estimated effects of shorr rates on investment were obtained using a sample period during which short and long rates tended to move together. They may not give very accurate predictions for the last year, when the rwo rates have diverged considerably due ro a sharply downward-sloping yield curve. As well as considering the reliability of a single estimate of the investment-interest rare nexus, one should also consider the implications of basing simulations on a single equation rather than on a full, general equilibrium model, although simulations using MULTIMOD do yield broadly similar results. On rhe other hand, our econometric results do provide a synthesis of received economic theory and rhe very latest econometric techniques, and rhey do in some sense encompass previous estimates of the French investment function.
Thus, rhe major conclusion rhar should be drawn from rhis study is really that the debate on the transmission mechanism of monetary policy in France should nor be closed; in particular, ir cannot be simply assumed or asserted that real interest rates will not affect aggregate investment expenditure.

©International Monetary Fund. Not for Redistribution
100 FRANCE: FINANCIAL AND REAL SECTOR ISSUES
Appendix I
Theoretical and Empirical Framework
Consider a representative firm producing according to a constantreturns Cobb-Douglas technology and facing a demand constraint. Its optimization problem is therefore one of cost minimization subject to a given level of output. Consider first the one-period static optimization problem
Minimize [w(t) L{t) + p(t) K(t)] (Al)
subject to
(A2)
where w(t) and p(t) denote, respectively, the real wage and real user cost of capital at time t, L(t) and K(t) measure inputs of labor and capital at time t, and A(t) denotes total factor productivity at timet.
The solution to this problem can be expressed as a cost function of the form
c(w(t),p(t),Y(t)) - pA(t)-1 w(t)«p(t)l-aY(t), (A3)
where
P = a-«(1 - a)«-I.
By Shephard's lemma, the factor demand schedules are given by the derivatives of the cost function with respect to the relevant factor price.10 Thus, we have the demand for the capital stock at time 1 given by
where
de K (t) - ()p
- Jl*A (t)-1 [p (t)/w(t) ] -<t Y ( t), (A4)
(AS)
10A proof of Shephard's lemma can be found in Varian (1978), chap. I .
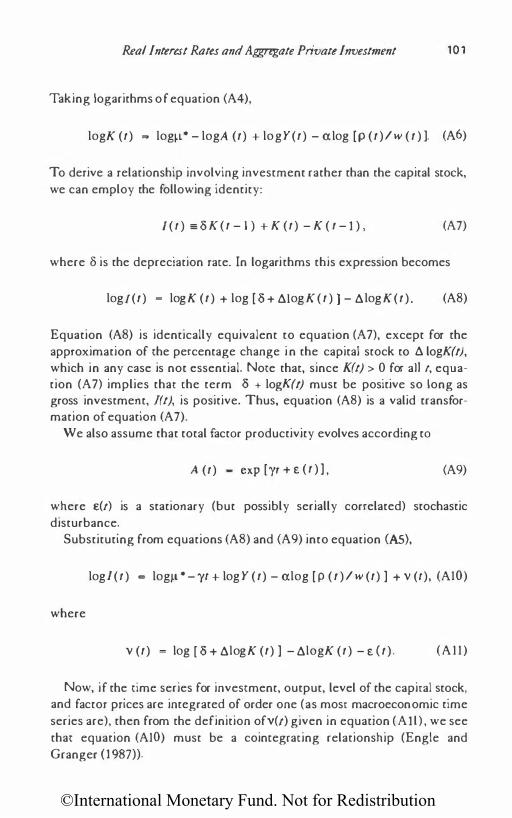
©International Monetary Fund. Not for Redistribution
Rea/Interest Rates and Aggregate Private Investment 101
Taking logarithms of equation (A4),
logK (t) - logJl• - logA (t) + logY(t) - alog [p (t)/w ( t ) ]. (A6)
To derive a relationship involving investment rather than the capital srock, we can employ the following identity:
l(t) = 8 K (t - l ) + K (t) - K ( t - 1 ) , (A7)
where 8 is the depreciation rate. In logarithms this expression becomes
logl(t) � logK (t) + log [ 8 + AiogK(t) ) - AlogK(t). (A8)
Equation (A8) is identically equivalent to equation (A7), except for the approximation of the percentage change in the capital stock to A logK(t), which in any case is not essential. Note that, since K(t) > 0 for ali t, equation (A7) implies that the term 8 + logK(t) must be positive so long as gross investment, l(t), is positive. Thus, equation (A8) is a valid transformation of equation (A7).
We also assume that total factOr productivity evolves according tO
A (t) - exp (')'t + E (t ) ) , (A9)
where e(t) is a stationary (but possibly serially correlated) stochastic disturbance.
Substituting from equations (A8) and (A9) into equation (AS),
where
log/(t) - logJl • - yr + logY (t) - alog [ p ( t )/w (t) ) + v (r), (AIO)
V (t) � log ( 8 + AlogK (t) ) - AlogK (t) - E {t). (All)
Now, if the time series for investment, output, level of the capital stock, and factor prices are integrated of order one (as most macroeconomic time series are), then from the definition ofv(t) given in equation (All), we see that equation (AlO) must be a coinregrating relationship (Engle and Granger (1987)).

©International Monetary Fund. Not for Redistribution
102 FRANCE: FINANCIAL AND REAL SECTOR ISSUES
The analysis can be generalized to a multiperiod optimization problem as follows: note that unless there are costs of adjustment in the capital stock, the multiperiod optimization solution is equivalent to the static one-period solution just outlined. Thus, introducing costs of adjustment of the capital stOck, the representative firm's optimization problem can be represented as1 1
� Minimize V(t) � L �i [c(w(t + j), p(t + j), I) Y(t + j)
J- 0 (A 12)
+ p(r + j)(lllogK(t + j))l]
subject to equation (AZ), where 13 is a discount faccor. From the Hamiltonian conditions for the solution of this problem, an expression can be derived that is identical to equation (AlO) except for additional l(O) terms in the composite error term v(t), which nevertheless remains I(O). Thus, equation (AlO) again emerges as a cointegrating relationship. This is the justification for equation ( l ), the long-run investment demand function used in the text.
An interesting implication of cointegration is that, by the Granger Representation Theorem (Engle and Granger (1987)), if investment is cointegrated with the right-hand-side variables in equation (AlO), there must exist a dynamic error correction representation of the form
n lllog/(r) � y0 + _L ylilllog/ ( r-i)
, _ I n n
+ L Y2; l11ogY(t- i) + L y3;l11og [p ( t- i) /w ( t - i) ) ; - 0 ; - 0
(A13)
where v(t) is the error correction or equilibrium error implicitly defined in equation (A 1 0), s(t) is a disturbance term, and y. < 0.
In the static, one-period case, the error correction form is hard tO interpret. In the case of dynamic, multiperiod optimization, however, equation (A13) can be interpreted as the solution to the optimization problem in equation (AlZ), since it is well known that solutions co multiperiod quadratic costs of adjustment problems can be expressed as error correction equations (Nickell ( 1985), Taylor (1987)). This is the
11Note that. for simplicity, we assume cenainty equivalence.

©International Monetary Fund. Not for Redistribution
Real l11terest Rates a11d Aggregate Private lnvestmeflt 103
justification for equation (2), the short-run investment demand function used in the text.
Note that we could equally well have used equation (A6) as our cointegrating relationship, and derived an error correction equation analogous to equation (Al3) in terms of �logK rather than �log/. The advantage of working with the latter is that this is the series in which we are primarily interested. Although, asymptOtically, it should make no difference whatsoever which of these two forms the estimated error correction equation takes, the actual short-run dynamics may differ slightly between the two equations in small samples.
Appendix I I
Detailed Empirical Results
I. Unit Root Tests
Table 3 lists the results of unit root tests applied to the logarithmic transformations of investment, output, hours worked, the capital stock, real wages, and the real user cost of capital. In every case, we cannot reject the hypothesis that the series are stationary in first differences, or integrated of order one (Engle and Granger (1987)).
II. The Long-Run Production Function
The theoretical and empirical framework outlined in Appendix I is predicated on the assumption that output, at least in the long run, is governed by a Cobb-Douglas technology in labor and ,capital. Thus our first task was to investigate whether or not a cointegrating relationship exists that approximates a Cobb-Douglas production function.
Table 4 reports results of estimating the long-run relationship between logY(t), logK(t), and logL(t) by ordinary least squares, johansen (1988) maximum likelihood estimation, and Phillips-Lore1tan (1991) estimation. In each estimation method, allowance was made for a linear trend to enter the long-run relationship, capturing the assumption of an exponential trend in total factor productivity (equation (A9)).
The results reported in Table 4 are reassuring in the sense that the three methods produce quite similar results. We are unable to reject the null hypothesis of noncointegration using an augmenred Dickey-Fuller test applied to the cointegrating regression residuals. However, the poor power characteristics of the ADF test are well known and, using the johansen techniques, we find strong evidence of a unique coirnegrating vector.

©International Monetary Fund. Not for Redistribution
104 FRANCE: FINANCIAL AND REAL SECTOR ISSUES
Table 4. Cointegration Estimates of the Long-Run
Production Function
(a). Ordinary least squares log 'rttl = 0.637 logl(t) + 0.447 1ogK(t) R2 = 0.99. ADF = -2.816
(b). Johansen maximum likelihood i) Cointegration tests (r = number of cointegrating vectors)
Null TRACE 5% critical Null hypothesis statistic value hypothesis
($ 2 1 .462 3.762 r = 2 vs. r = 3 r$ 1 9.21 1 1 5.4 1 0 r= 1 vs. r = 2 r = 0 35.413 29.680 r = 0 vs. r = 1
ii) Estimated cointegrating vector log Yttl = 0.291 logL(t) + 0.886 1ogK(tl
(c). Phillips-Loretan (i) Estimated cointegrating vector
log 'rtrl = 0.579 logL(t) + 0.523 logK( tl (ii) Restricted cointegrating vector
log Y(t) = 0 6 logl(t) + 0.4 logK(tl WALD(2) = 0.983
(0.61)
A.-max statistic
1 .462 7.750
26.202
5% critical value
3.762 1 4.069 20.967
Notes: Allowance was made for a trend in the cointegrating equation in each case. Four lags were used in the VAR estimation for the Johansen method. For the Phillips-Loretan method, two lags of the cointegrating vector and two leads and lags of changes in investment and man-hours were used. In panel (c). WALD denotes a Wald test statistic for the restrictions. with marginal significance level in parentheses. The cnucal values for the ADF test in panel (a) are from MacKinnon (1991). The critical values in panel (b) are from Osterwald-Lenum (1992).
The least squares results are also noteworthy in that the estimated coefficients are close to the values suggested by economic theory-that is, the sample factor shares in output of 0.6 and 0.4 for labor and capital, respectively. The Phillips-Lorecan method, which has been shown to have superior small-sample performance (Phillips and Loretan (1991)), also produces coefficient estimates that are insignificantly different from their theoretical values.
Although we would not wish co claim that French manufacturing and business output can be completely explained by a simple Cobb-Douglas production function (see, e.g., Coe and Moghadam (1993)), these results nevertheless imply that the salient long-run characteristics can be captured by such a model. This at least allows us co investigate the existence of the implied long-run investment function.
Ill. The Long-Run Investment Function
The results of applying the various cointegration estimation methods co investment, output, the user cost of capital, and the wage rate, are given in

©International Monetary Fund. Not for Redistribution
Real l11terest Rates a11d Aggregate Private f11Vestme11t 105
Table 5. Cointegration Estimates of the Long-Run Investment Function
(a). Ordinary least squares log/{t) = 2.138 1ogYlt)- 0.293 1ogp(t) + 0.417 1ogw(t) R2 = 0.96 ADF = -3.165
(b). Johansen maximum likelihood (i) Cointegration tests (r = number of cointegrating vectors)
Null TRACE 5% critical hypothesis statistic value
r S 3 2.636 3.762 r S 2 22.536 15.410 rs 1 45.224 29.680 r = 0 81.017 47.210
Null hypothesis
r= 3 vs. r= 4 r = 2 vs. r = 3 r= 1 vs. r= 2 f = 0 vs. f= 1
A-max statistic
2.636 1 9.900 22.688 35.793
5% critical value
3.762 1 4.069 20.967 27.067
(ii) Estimated cointegrating vector (corresponding to largest eigenvalue) log/(t) = 0.960 logY(t)- 0.719 logp(t) + 0.124 logw(t)
(c). Phillips-Loretan (i) Estimated cointegrating vector
log/{t) = 1 . 1 96 logY(t)- 0.199 loglp(t)/w(tll (ii) Restricted cointegrating vector
log/(t) = 1.0 log Y(t)- 0.6 loglp(t) /w(t)l WALD(2) = 0.074
(0.96)
Notes: Allowance was made for a trend in the cointegrating equation in each case. Four lags were used in the VAR estimation for the Johansen method. For the Phillips·Loretan method. two lags of the cointegrating vector and two leads and lags of changes in investment and man-hours were used. In panel (cl. WALD denotes a Wald test statistic for the restrictions. with marginal significance level in parentheses. The critical values for the ADF test in panel (a) are from MacKinnon (1991). The critical values in panel (b) are from Osterwald-Lenum (1992).
Table 5. Note that, because of the difficulties in estimating nonlinear models with a very large number of parameters, we constrained factor rentals to enter in relative terms in the Phillips-Loretan estimation, thereby substantially reducing the dimensions of the parameter space.
Again, the results are encouraging in that broadly similar results are obtained using any of the three methods. We are again unable to reject, at the 5 percent level, noncointegration on the basis of a coincegrating regression ADF test, but find evidence of up to three cointegrating vectors using the Johansen method.
For all three methods, the estimated coefficients are correctly signed and, for the johansen and Phillips-Loretan results, the output coefficients are close to unity. A Wald test of the restrictions that the output coefficient is unity and the coefficient on relative factor rentals is -0.6 is not rejected (panel (c)).
Overall, therefore, these results were very encouraging indeed, and strongly implied that a search for a stable, dynamic shore-run investment function incorporating these long-run results would be fruitful.

©International Monetary Fund. Not for Redistribution
106 FRANCE: FINANCIAL AND REAL SECTOR ISSUES
IV. The Short-Run Investment Function
The next step was to estimate a short-run, dynamic error correction equation which could be interpreted as a short-run investment function. Since, in the previous section, we could not reject the theoretical restrictions on the long-run investment function, our error correction or equilibrium error term was defined as follows:
v ( t) = log/(t) - logY(t) + 0.61og [ p (t)/w (t) ]. (A14)
Starting with a general dynamic form corresponding to equation (A13) with n = 4 lags, we sequentially imposed statistically insignificant zero restrictions unci! a final parsimonious specification remained upon which no further statistically insignificant restrictions could be placed.
The resulting parsimonious specification was as follows:
lllog/(t) = -0.018 v(t- 1) + 0.161 [lllog/( t - 2) + ll!ogl( t- 4)) + 1 .203/llogY( t) (0.008) (0.047) (0.194)
(A15) -0.372/llog [p(t- 2)/w{t- 2)], (0.135)
T = 1971 :II-J992:1Il, R2 = 0.55, 1\ a = 1 . 12%, AR(4, 75) = 0.16 ,
(0.96)
ARCH(l, 77) = 0.45 , ARCH(4, 7 1 ) = 0.26, WHITE(18, 60) = 1.25, (0.50) (0. 90) (0.25)
HETX2(10, 68) = 1.27, (0.26)
RESET(3, 76) = 1.43. (0.24)
The estimated short-run equation is quite encouraging in that a reasonable fit is obtained with well-determined coefficients chat are intuitively of the correct sign, and the equation also passes a battery of regression diagnostics. 12
11AR(4, 75) is a test for up 10 fourth-order residual serial correlation; ARCH(I. 77) and
ARCH(4. 7 I) are tests for first-order and up to fourth-order autoregressive conditional heterosce
dasticity in the residuals: WHITE(I8. 60) is White's (1980) test for general heteroscedasticity or
functional misspecification: HETX2(10. 68) is a test for heteroscedasticily based on the squares of
the regressors; RESET(3. 76) is a test for nonlinear specification, based upon adding powers of
the fitted values to the regression. All test statistics are distributed as F under the null hypothesis
with the indicated degrees of freedom. A discussion of the diagnostic Jests can be found in Cuth
bertson. Hall, and Taylor ( 1992).

©International Monetary Fund. Not for Redistribution
Reallr1terest Rates and Aggregate Private /nvestmerll 107
When the model is estimated retaining the last five years of data for postsample forecasting tests, we obtain
!!.logl(t} = -0.016v(t- l } + 0.1 38[!!.1og/(t -2) + l!.logl(t- 4)) (0.009) (0.060)
+ 1.098l!.logY(t) - 0.3716log [p(t - 2)/w(t- 2)], (0.242) (0.152)
(A16)
T = 1 97 l : li-1987:III, A
R2 = 0.51, (J = 1 .23%, AR(4, 55) = 0.18 (0.95)
ARCH ( 1 , 57) = 0.18, ARCH (4, 51) = 0.32, (0.67) (0.86)
H ETX2 ( 1 0, 48) = 1.13, (0.36)
RESET (3, 56) = 0.46, CHOW (20, 59) = 0.31 , (0.71) (0.99)
HF(20) = 6.8. (0.99)
Clearly, the equadon parameters appear to be stable and the fit and regression diagnostics are again satisfactory. Particularly impressive are the results of the Chow (1960) and the Hendry ( 1 979) tests for predictive failure over the last five years of the sample (CHOW and HF respectively): they are both highly insignificant.
As a comparison, we also estimated an accelerator model of investment of the kind estimated by Muet and Veganzones ( 1992):
10 [I (t) IY (t) ) - a0 + L a;l!.logY (t) + s (t). (Al7)
i - 1
This resulted in an estimated equation with an R2 of 0.47 and a DurbinWatson statistic of 0.28 (suggesting dynamic misspecificacion). We then carried out formal tests of the two estimated equations as alternative models of investment. First, we multiplied the fitted values from equation (Al7) by Y(t) and took logarithms and then first differences of the resulting series, to obtain implied fitted values of ll.log/(t}. Regressing the actual values of 6log/(t) onto the fitted values of ll.log/(t) from the estimated error correction model and the implied fitted values from the accelerator model (using superscripts ecm and ace to denote fitted values from the error correction and accelerator models respectively), we obtained
Alog / ( t) _ 0.895 AI / (t) um 0 048 AI I ( t) acc u (0.117} u og + (0:049) u og '
(Al8)

©International Monetary Fund. Not for Redistribution
108 FRANCE: FINANCIAL AND REAL SECTOR ISSUES
where standard errors are given in parentheses. Clearly, the implied fitted values of the accelerator model contain no extra information with respect co the growth of investment over the information supplied by the error correction model. In that sense, the error correction model encompasses the accelerator model (Mizon (1984)).
To avoid the charge of unduly biasing the test against the pure accelerator model, we also carried out the converse exercise of calculating the implied fitted values of [l(t)/Y(t)] from the estimated error correction model [f(t)/Y(t)]t't111, and regressed the actual values of [/(t)/Y(t)] onto these and the fitted values from the accelerator model [l(t)/Y(tW", obtaining
0.945 [l(t)/Y(t)] � (0.023) [l(t)/Y(t) ]um
0.049 + (0.034) [l(t)/Y(t) ] acc.
(Al9)
Again, the pure accelerator model provides no additional information and is encompassed by the error correction equation.
References
Artus, Patrick, and Bernard Migus, "Dynamique de l'investissement et de l'emploi avec coOts d'ajusrement sur le capital et le travail," Am1oles
d'Economie et de Statistique Vol. 2 (April/June 1986), pp. 75-99. Artus, Patrick, and Pierre-Alain Muet, "Une Etude de l'lnfluence de Ia
Demande des Couts de Facteurs et des Conuaintes Financieres sur l'lnvestissement" (mimeographed, Paper No. 8015, Paris: Centre d'Ecudes Prospectives d'Economie Mathematique Appliquees a Ia Planification, 1980).
__ , "Fiscal Policy and Private Investment in France in the 1970s: An Econometric Study," Paper No. 81 17, Centre National de Ia Recherche Scientifique-Instituto Studi Programmazione Economica-National Bureau of Economic Research Conference on the Taxation of Capital (Paris: Centre d'Etudes Prospectives d'Economie Mathematique Appliquees a Ia Planification, June 1981).
__ , lt1Vestme111 and Foetor Demond (Amsterdam: North-Holland, I 990). Artus, Patrick, and P. Sicsic, "Conventional and New Economeuic Models
of Investment in France: Do They Fit the 80s?" essay in honor of

©International Monetary Fund. Not for Redistribution
Rea/Interest Rates and Aggregate Private lnvestmmt 109
Edmond Malinvaud, Vol. 2 (Cambridge, Massachusetts: MIT Press, 1990), pp. 159-88.
Chow, Gregory C., "Tests of Equality Between Sets of Coefficients in Two Linear Regressions," Econometrica, Vol. 28 (July 1960), pp. 591-605.
Coe, David, and Reza Moghadam, "Capital and Trade as Engines of Growth in France: An Application of Johansen's Cointegration Methodology," IMF Working Paper, WP/93/1 1 (Washington: International Monetary Fund, 1993).
Coen, Robert M., "Tax Policy and Investment Behavior: Comment," America11 Economic Review, Vol. 59 (June 1969), pp. 370-79.
Cuthbertson, Keith, Stephen G. Hall, and Mark P. Taylor, Applied Econometric Tec/miques (Ann Arbor, Michigan: University of Michigan Press, 1992).
Engle, Robert F., and Clive W. Granger, "Cointegration and Error Correction: Representation, Estimation, and Testing," Econometrica, Vol. 55 (March 1987), pp. 251-76.
Hall, Robert E., and Dale W. Jorgenson, "Application of the Theory of Optimal Capital Accumulation," in Tax l11cC11tives 011d Capitol Spe11ding, ed. by Gary Fromm (Washington: Brookings Institution, 1971), pp. 9-60.
Hendry, David, "Predictive Failure and Econometric Modelling in Macroeconomics: The Transactions Demand for Money," in Econometric Modelling, ed. by Paul Ormerod (London: Heinemann, 1979), pp. 2 1 7-42.
Johansen, Soren, "Statistical Analysis of Cointegration Vectors," Journal of Ecoflomic Dynamics 011d Control, Vol. 1 2 (June-September 1988), pp. 231-54.
Jorgenson, Dale W., "The Theory of Investment Behavior," in Determino111s of !troestmmt Behavior, ed. by Robert Ferber (New York: Columbia University Press, 1967).
__ , and James A. Stephenson (1967a), "The Time Structure of Investment Behavior in United States Manufacturing, 1947-1960," Review of Economics and Statistics, Vol. 49 (February 1967), pp. 16-27.
__ (1967b), "Investment Behavior in U.S. Manufacruring, 1947-1960," EcotJOmetrica, Vol. 35 (April 1967), pp. 169-220.
__ (1969a), "Anticipations and Investment Behavior in U.S. ManufactUring, 1947-1960," American Statistician, Vol. 64 (1969), pp. 67-89.
__ (1969b), "Issues in the Development of the Neoclassical Theory of Investment Behavior," Review of Economics and Statistics, Vol. 5 1 (August 1969), pp. 346-53.

©International Monetary Fund. Not for Redistribution
1 10 FRANCE: FINANCIAL AND REAL SECTOR ISSUES
MacKinnon, ]., "Critical Values for Cointegration Tests," in Long-Run Economic Relationships: Readings in Coit�tegrotiotl, ed. by Robert F. Engle and Clive W. Granger (Oxford: Oxford University Press, 1991).
Masson, Paul R., Steven Symansky, and Guy Meredith, MULTIMOD Mark II: A Revised a11d Extmded Model, Occasional Paper 71 (Washingron: International Monetary Fund, july 1990).
Miles, David K., and Joe B. Wilcox, "The Money Transmission Mechanism," in Surveys itl MotJetary Economics, Vol. 1, ed. by Christopher ]. Green and David T. Llewellyn (Oxford: Blackwell, 1991), pp. 225-62.
Mizon, Grayham E., "The Encompassing Approach in Econometrics," in EcotJOmetrics and Qua11titative Eco110mics, ed. by David F. Hendry and Kenneth F. Wallis (Oxford: Blackwell, 1984), pp. 135-72.
Muet, Pierre-Alain, "Croissance, Profits et lnvestissement: Une Etude Econometrique" (mimeographed, Paris: Universite de Paris, lnstitut National de Ia Statistique et des Etudes Economiques-Centre d'Etudes Prospectives d'Economie Mathematique Appliquees a Ia Planification, 1978).
__ (1979a), "Les modeles 'neoclassiques' et !'impact du taux d'interet sur l'investissement, un essai de synthese," Revue Economique (March 1979), pp. 244-80.
__ (1979b), "Les Modeles a Retards Echelonnes: Fondements Theoretiques, Specifications er Methodes d'Estimation," Cahier du Group de MatMmatiques Economiques, Vol. 2 (Paris: Universite de Paris, September 1979).
Muet, Pierre-Alain, and M-A. Veganzones, "lnvestissement, Profirabilite et Croissance dans les Annees Quacre-Vingt," Revue de I'OFCE. No. 41 Ouly 1992), pp. 1 19-50.
Nickell, Stephen ]., "Error Correction, Partial Adjustment and All That: An Expository Note," Oxford Bulletin of Economics and Statistics, Vol. 47 (May 1985), pp. 1 19-29.
Osterwald-Lenum, Michael, "A Note with Quantiles of the Asymprotic Distribution of the Maximum Likelihood Cointegration Rank Test Statistics," Oxford Bulletin of Economics 011d Statistics, Vol. 54 (August 1992), pp. 461-72.
Oudiz, G., "Investment Behavior of French Industrial Firms: A Study on Longitudinal Data," Annales de 1'/NSEE, Vol. 30-31 (1978).
Phillips, Peter C., and Mico Loreran, "Estimating Long-Run Economic Equilibria," Review of Economic Studies, Vol. 58 (May 1991), pp. 407-36.
Schramm, Richard, "The Influence of Relative Prices, Production Conditions and Adjustment Costs on Investment Behavior," Review of Ecotlomic Studies, Vol. 37 (July 1 970), pp. 361-76.

©International Monetary Fund. Not for Redistribution
Real Interest Rates and Aggregate Private Investment 1 1 1
_, "Neoclassical Investment Models and French Private Manufacturing Investment," American Economic Review, Vol. 62 (September 1972), pp. 553-63.
Taylor, Mark P., "On Long-Run Solutions to Dynamic Econometric Equations Under Rational Expectations," Economic Journal, Vol. 97 (March 1987), pp. 215-18.
Varian, Hal R., Microeconomic Analysis (New York: Norton, 1978). Villa, Pierre, Pierre-Alain Muet, and Michel Bourillier, "Une estimation
simultanee des demandes d'investissement et de travail," Annales de /'INSEE, Vol. 38-39 (April-September 1980), pp. 237-58.
White, Halbert, "A Heteroskedasticiry-Consistent Covariance Matrix Estimator and a Direct Test for Heteroskedasticity," Econometrica, Vol. 48 (May 1 980), pp. 8 17-38.

©International Monetary Fund. Not for Redistribution
ERM Money Supplies and the Transition to EMU
MARCEL CASSARO, TIMOTHY lANE, AND PAUL R. MASSON
Dnterest in monetary aggregates extending beyond national borders has been stimulated by the agreement reached by EU countries at
Maastricht in December 1991 to proceed to monetary union, and by recent tensions within the EMS, caused in part by the fact that short-term interest rates have remained high in Germany in order tO curb excessive German money growth and combat German inflation, while inflation has been more moderate in neighboring countries such as France, Belgium, and the Netherlands. The eventual achievement of EMU would naturally lead to the use of monetary indicatOrs for the monetary union as a whole; the properties of EU money demand are therefore of interest. A European central bank (ECB) would need credible targets, and it is possible that cross-country monetary aggregates could provide the basis for monetary targeting. Moreover, even at the present time, the presumption that money demand in EU countries may be affected by currency substitution as financial integration with other EU countries proceeds, and the likelihood that economic activity and inflation are affected by monetary conditions in other countries, also make it natural to consider cross-country monetary aggregates.
Cross-country monetary aggregates may become increasingly relevant in stage 2 of the transition to EMU-which began on January 1 , 1994 and is tO end with the beginning of stage 3 in 1997 or 1999. For instance, the transition could be smoothed by devoting increasing attention tO foreign monetary indicators. At one end of the spectrum is an asymmetric system in which developments in the anchor country-Germany-largely determine monetary policy for the ERM based on domestic economic conditions; at the other end is the symmetric system that is planned for EMU, in which the policy of the ECB will be guided by Europe-wide monetary
112

©International Monetary Fund. Not for Redistribution
ERM Mo11ey Supplies 011d the Tratrsitiotr to EMU 1 1 3
developments. Giving gradually increasing importance co other ERM countries' monetary variables in the formulation of monetary policy might permit a smoother transition ro an eventual target for the joint money supply of all participating EMU countries.
It is of course an empirical question whether ERM monetary variables are more stable and predictable than national ones, and whether monetary aggregates in other countries are useful indicatOrs of future trends in inflation. With increasing integration in goods markets and possibly heightened currency substitution-both furthered by the creation of the single market as of January 1 , 1993-and in the absence of currency realignments, developments that affect aggregate demand in one country will increasingly spill over into other countries. For instance, to the extent that French M3 is an indicator of French aggregate demand conditions, it may also be a useful indicator for Germany. If so, it might be appropriate to give some importance ro French M3 as an indicator in formulating German monetary policy. There is also the possibility that, during the transition to EMU, cross-country monetary aggregates could provide a focal point for monetary cooperation among national central banks.
In assessing monetary indicators, it is important to consider the role of the exchange rate. For countries whose exchange rates are free to fluctuate substantially against the deutsche mark-either within wide bands, as a result of realignments, or because they have freely floating exchange rates-there is much less of a presumption that their money supplies should be relevant for Germany. If such countries run divergent monetary policies relative to the anchor country's, the inflationary effects on Germany will be at least partly neutralized by exchange rate movements.1
In this study2 we therefore focus on a core group of countries that have maintained their parities against the deutsche mark in the recent period of turbulence-in particular France, Belgium, Luxembourg, the etherlands, and Denmark. These countries have not realigned relative to the deutsche mark since at least january 1987; in the case of the Netherlands, since March 1983. The Belgium-Luxembourg monetary union and the Netherlands have also limited fluctuations of their currencies relative to the deutsche mark to a greater extent than required by the narrow ERM band. Hence, until the suspension of the narrow band on August 2, 1993, and its replacement by intervention thresholds of plus or minus
1lndeed. if there is overshooting of the exchange rate-as implied by the model of Dornbusch ( 1976)-Germany would initially impon not inflation but rather deflation, as the dcutsche mark would appreciate in real terms vis-A-vis the country undertaking monetary expansion.
2The authors wish to thank Michael An is, Carlo Monticelli, and Marc-Oiivier Strauss-Kahn.
©International Monetary Fund. Not for Redistribution
114 FRANCE: FINANCIAL AND REAL SECTOR ISSUES
15 percent of central panties, they approximated a situation of fixed exchange rates relative to Germany.3
Even for an ERM core group, exchange rate parities are not necessarily fixed irrevocably, and imperfect credibility affects the interpretation of monetary indicators such as interest rates, and, to a lesser extent, cross-border aggregate money supplies. Indeed, the major difficulty in assuring a smooth transition to EMU is that stage 2 has elements both of an adjustable peg system and a monetary union. However, until stage 3 of EMU is attained, it is premature to imagine that monetary developments in other core-ERM countries would be given weight commensurate with those in Germany. Hence the exploration of intermediate arrangements in this study.
The plan of the study is as follows. First, an analytical section discusses the relevant issues and surveys the existing literature. A second section presents empirical results concerning the long-run properties and stability of French and German broad money demands (demands for M3) and compares them to the properties of an M3 variable for a core group of ERM members. A third section examines evidence of the predictive ability of other countries' aggregates in explaining output and inflation (in particular, of French M3 for German inflation, and vice versa). A fourth section considers how a core-ERM M3 aggregate could be used in stage 2. A final section draws tentative conclusions.
I. An Analytical Framework
There are three issues concerning monetary policy within the EMS that deserve attention. First, the value of an intermediate indicator such as the money supply rests on the stability and predictability of the relationship linking it ro economic activity and the price level. Therefore, it is important to examine the relative stability of national money supplies versus monetary variables aggregated across countries.4 A second relevant question relates ro the nature of the transmission of shocks from other countries when the exchange rate is fixed, or is limited in its fluctuation. These linkages may make it more useful to use an intermediate target that accounts for developments in other countries rather than a purely domestic target such as the domestic money supply. Finally, there is the issue of
3The Netherlands and Germany continue to respect the ± 2.25 percent bands for the guilder/ deutsche mark rate, on the basis of a bilateral agreement.
•There is also the issue of the proper definition of national money supplies. for instance whether they should include nonresident holdings and deposits in foreign currencies with domestic banks. See Angeloni, Cottarelli. and Levy ( 1991) and Monticelli ( 1993).

©International Monetary Fund. Not for Redistribution
ERM Money Supplies and the Tra11Sition to EMU 1 1 5
the transition to EMU, which may be facilitated by gtvmg increasing attention to other countries' monetary developments; this would permit a gradual transition from an asymmetric system in which only the money supply in the anchor country was targeted to one where all countries' money supplies were given weights proportional to their size, as in EMU.
Stability and Predictability of Money Demand
There has been considerable interest in the past few years in examining whether the demands for national aggregates have desirable properties, and conversely, whether an aggregation of money supplies across EMS countries is associated with a stable and predictable money demand. An article by Bekx and Tullio (1989) presented econometric evidence that the exchange rate of the deursche mark against the dollar was better predicted by an EMS monetary aggregate than by German money. Kremers and Lane (1990) found evidence of a stable demand for M 1 aggregated across ERM counrries,5 while more recent work by Monticelli and StraussKahn (1992b) and Arris, Bladen-Hovell, and Zhang (1993) suggests that a stable demand for broad money alsG exists for a subset of EC countries. Monticelli and Strauss-Kahn ( 1992a) survey national demand for money studies, and find that though a majority of the E U countries exhibit stability of money demand over the 1980s, there are some curious features in the demand functions of some countries.
As discussed, for instance, in Monticelli and Strauss-Kahn (1992a) and in Kremers and Lane (1992b), there are two main factors that can affect the relative stability of national and ERM money demands, possibly in conflicting ways. First, currency substitution-that is, shifts in the currency composition of money balances--can be expected to increase within the ERM, especially as monetary union approaches. Money balances in two different currencies should effectively be perfect substitutes if their exchange rate is expected to remain unchanged, and other factors, such as transactions costs, are similar. Conversion to a common currency (i.e., the European Currency Unit (ECU)) with achievement of EMU would itself produce perfect substitutability of these currency holdings, and their anticipated conversion would therefore enhance their substitutability. Second, aggregation bias will affect ERM money demands, unless the functional forms of countries' demand functions ar.e similar, and, more constrainingly, if parameter values are roughly the same. In practice, it
ssee. however. the comments by Barr ( 1992) and the rejoinder by Kremers and Lane (1992a).

©International Monetary Fund. Not for Redistribution
1 1 6 FRANCE: FINANCIAL AND REAL SECTOR ISSUES
seems that national money demands often differ both in the choice of included variables and in estimated coefficients-for instance, income and incerest rate elasticities.6 Therefore, esdmation of an aggregate equation incroduces a degree of specification bias, which may impair its stability, since changes in the composition of the aggregate money variable will also change apparenc income and interest rate elasticities.
Curre11cy substitutio11 can be expected to have two effects on national money demands. First, it would tend to make them sensitive co incerest rates in other ERM countries. Second, currency substitution would tend to make errors in demand functions in pairs of ERM countries negatively correlated, as shifts out of one currency into another that were not captured in the explanatory variables would show up as inverse shocks to money demands. Both of these factors would tend to make national money demands unstable, though tO an extent that depends on the definition of national aggregates. Most national definitions of broad money for EU countries include foreign currency deposits of residents with residenc banks, so at least part of currency substitution is internalized (Monticelli and Strauss-Kahn (1992a)). However, even such an aggregate would likely be sensitive to the relevant foreign interest rates. As for money holdings of foreign residents (or holdings of residents abroad, even in the home currency), these are not included in conventional aggregates, so that summing these aggregates across countries will not internalize cross-border holdings. There may still be negative covariance of residuals from national demand functions-possibly because relevant interest rates are not included-and hence an ERM demand function may nevertheless have a lower error variance than national equations.
The first factor may not be adequately captured in national money demand equations, because structural changes leading to increasing substitutability would not be adequately picked up through regressions with fixed coefficients, and also because the inclusion of several interest rates may give inconclusive results because of multicollinearity. One way co allow for the second factor would be to estimate national money demand equations as a system of equations and allow for cross-correlation of errors; in practice, national demand equations are generally estimated separately.7 Both factors could in principle be taken into account by creating a money variable that aggregated across the relevant countries and deposits. By internalizing shifts between money holdings, aggregation across countries
6See Fase and Winder (1992) and Monticelli and Strauss-Kahn (1992a) for a survey of recent empirical work on national money demand functions for EC countries.
7See, however, Lane and Poloz (1992).

©International Monetary Fund. Not for Redistribution
ERM Money Supplies a11d the Tra11Silion to EMU 1 1 7
could be expected to reduce residual error variance and also make unnecessary the inclusion of a large set of interest rate variables.
Aggregatio11 bias may be more severe in shore-run, dynamic equations than in long-run money demand relations. As argued in Monticelli and Strauss-Kahn (199Za), the properties of long-run money demand may be more critical than the short-run dynamics, given the emphasis on a medium-term horizon for money targeting, and, in particular, for controlling inflation. Cointegration tests, that is, tests of whether nonstationary variables tend to move together, help to identify long-run relationships among variables and therefore deserve special attention in the context of money demand. Studies using cointegration analysis show a degree of similarity across E U countries in price and income elasticities; interest rate semi-elasticities differ much more, partly as the result of choice of different variables.s
The net effect of currency substitution and aggregation bias will influence the usefulness of an aggregated money variable. One approach for evaluating this question is to estimate the demand for an aggregate money as well as demands for its national components, and to compare the equations' properties. Kremers and Lane (1990), for instance, highlight the low standard error, stability, and high speed of adjustment of EU demand for Ml compared with national demands for M l ; they contend that national equations give unreasonably low speeds of adjustment, perhaps as a result of omission of relevant foreign variables that are internalized in the wider aggregate. Another approach is the joint estimation of the national equations in order to test restrictions across coefficients and to allow for the negative covariance implied by currency substitution. Such an approach does not directly estimate the demand for an EU monetary aggregate, but rather suggests whether its stability properties are the result of similarity of coefficients or of currency substitUtion. Lane and Poloz ( 1992) conclude from such a decomposition that it is the latter that seems to account for the good properties of a European monetary aggregate; however, the evidence of currency substitUtion in the form of a significant role for exchange rates in money demand and negative covariances among countries' money demand disturbances also admits of other interpretations.
As mentioned above, the link between the good performance of an aggregation of national money supplies and the existence of currency substitution is not straightforward. Cross-border holdings are usually not included in conventional aggregates, while domestic residents' holdings with domestic banks in both domestic and foreign currenctes are
8See Monticelli and Strauss-Kahn (1992a), Table 5.

©International Monetary Fund. Not for Redistribution
118 FRANCE: FINANCIAL AND REAL SECTOR ISSUES
typically included. Therefore, a simple European aggregate will not captUre a potentially important part of currency substitution related to delocalization-though aggregates are currently being redefined to address this problem.
Angeloni, Cottarelli, and Levy (1991) recalculate national monetary aggregates in order to include in those aggregates various measures of cross-border holdings; they find that these aggregates perform consistently better than the standard aggregates for most countries. Monticelli (1993) investigates whether including cross-border holdings in EU-wide monetary aggregates improves the properties of money demand equations and the predictive power of money in explaining EU output. He concludes that extended measures of EU money that contain EU residents' holdings outside the EU and in non-EU currencies are poor at explaining EU income, while less extended measures (including only cross-border holdings within the E U or in EU currencies) perform well. However, none of the extended measures outperforms an EU-wide measure obtained by summing traditional national definitions. No doubt further work is warranted in this area, which may become more relevant as integration proceeds; however, this is beyond the scope of this chapter. The regression results reported below use the existing national money supply data, and aggregate across countries merely by summing these national money supplies, after conversion co a common currency.9
Transmission of Shocks to the Anchor Country
In a fixed exchange rate union, just as in a monetary union with a common currency, the money supply of the union as a whole is relevant for output and inflation in any single country that is a member of the union. With financial integration, a single interest rate would prevail on comparable financial instruments, and it would be fruitless to try ro establish separate monetary policies in different countries or regions. Money supplies could grow at different rates, however, because of differing shocks affecting demands for money in different countries or regions-principally shocks ro real activity and inflation, as well as different trends in output and the velocity of circulation of money.
An intermediate target such as the money supply should satisfy two criteria: it should give advance indication of factors affecting ultimate targets that can only be observed with a lag; and it should provide a variable that is under at least the indirect control of the monetary authorities, and
9The issue of which exchange rate to use is discussed below.
©International Monetary Fund. Not for Redistribution
ERM Money Supplies and the Transition to EMU 1 1 9
against which their performance can be judged. From the perspective of a single country whose target is its national inflation rate, monetary indicators in other countries in an exchange rate union may provide information additional to that provided by the domestic monetary aggregate. For instance, shocks to inflation in a neighboring ERM country will show up in higher German import prices and higher and German exports, and hence translate into greater pressures on capacity utilization in Germany. Therefore, it is in the interest of the anchor country to account for these de�elopments in setting its short-term interest rate. From the second perspective, controllability, although foreign money supplies will not be under the direct control of the monetary authorities of the anchor country, the authorities may, through their ability to vary interest rates throughout the union, be able to influence them indirecttly. This will depend on other central banks' reactions to interest rate changes and on whether the demand for the aggregate is negatively related to market interest rates.
Although the ERM is not a system of irrevocably fixed exchange rates, a core group of countries-Germany, France. the Benelux countries, and Denmark-have maintained fixed central parities since at least 1987. If exchange rates are allowed to vary as a resu It of occasional realignments, then the transmission effects of inflationary pressures may be offset through eventual devaluation. There is therefore less of a presumption that monetary developments among all ERM countries are relevant indicators of inflation in the anchor country. From January 1987 until the widening of the bands of fluctuation agreed on August 2, 1993, the operation of the ERM among the core group was a compromise between monetary union and a system of adjustable pegs. Though realignments were not absolutely ruled out, they were viewed as increasingly unlikely. There was reinforced monetary cooperation among the core group, for instance between France and Germany in the September 1992-March 1993 period, to defend the franc against speculative pressures. In these circumstances, inflation pressures elsewhere in the core group could affect inflation in the anchor country, because Germany might not be able to sterilize effects on its money supply if speculative pressures developed.10 Hence, such inflationary symptoms would be of concern for the anchor country, and might justify its central bank's giving some weight to monetary developments in the other core-group countries. For instance, if the money supply were growing faster elsewhere in the core group than in Germany, the Bundesbank could run a tighter monetary policy than otherwise, and con-
10See Deutsche Bundesbank (1993) for a discussion of the impact on liquidity in Germany resulting from the ERM crisis in 1992.

©International Monetary Fund. Not for Redistribution
120 FRANCE: FINANCIAL AND REAL SECTOR ISSUES
versely if other countries' money supplies were growing more slowly than Germany's.
Not resisting those inflationary pressures through monetary policy gives rise co a perverse feedback that has been noted in the operation of the ERM, namely that high-inflation countries have low real interest rates when fears of devaluation are absent. Adjusting interest rates in the anchor country co account for inflationary pressures in other countries would offset this bias co some extent. Nevertheless, countries whose inflation rate is persistently high would eventually have co realign, and markets would demand higher nominal interest rates as a result. These countries would likely have substantially higher nominal interest rates chan the anchor country if their inflation rates remained high.
The recent widening of the fluctuation bands greatly reduces the potential need for intervention by the Bundesbank, making it less likely that monetary developments in other ERM countries would spill over into Germany. However, the widening of the bands is intended to be temporary, and deviations from central parities for the countries considered here have so far been limited. Moreover, the Netherlands and Germany have concluded an agreement co defend the earlier narrow margins, and Belgium and Luxembourg have also expressed a desire co do so.
The Transition to EMU
The Maastricht Treaty provides for the creation of a European Monetary Institute, which has taken over from the Committee of Governors of EU Central Banks from the start of stage 2 and which has the role of promoting monetary cooperation and facilitating the transition co EMU. However, it is clear that actual responsibility for monetary policies will continue to reside with national central banks. Therefore, the period at the end of stage 2 and the beginning of stage 3 could involve a difficult transition from an asymmetric monetary policy that is focused on economic developments in the anchor country, to one decided by the European central bank that accounts for conditions in all countries in the monetary union in a symmetric fashion. A means of smoothing the transition would be for the anchor country to give a gradually increasing weight co monetary aggregates in ocher ERM countries in setting its policies.
It is important to recognize, however, that there are at least three difficulties with such a strategy. First, the distinction berween a core group, whose money supply would be taken into account by the anchor country, and non-core-group countries, whose money supply would not, raises fundamental issues concerning the list of countries that would be able co proceed co monetary union in 1997 or 1999. The Maastricht Treaty stipulates

©International Monetary Fund. Not for Redistribution
ERM Mo11ey Supplies a11d the Transition to EMU 121
that criteria for proceeding to stage 3 are to be based on information available in 1996 or 1998. Monetary coordination that occurs before then should not prejudge the set of countries proceeding to stage 3. Second, the assumption that the core-group countries themselves would not change their deutsche mark parities in the transition to EMU is far from certain. As argued above, if the transmission effects of inflationary pressures that arise in one country are to be neutralized by devaluation, or, if they endanger the credibility of parities, by higher risk premiums built into interest rates, it would be inappropriate to allow those pressures to lead to a tighter ERM monetary policy. Third, since the Bundesbank's mandate is to maintain the stability and purchasing power of its own currency, not tO stabilize the ERM price level, it would have to be demonstrated that ERM monetary indicacors were relevant to German inflation. Empirical evidence on this last point is provided in Section II below.
I I . Empirical Estimates of the Demand for Broad Money
In this section, evidence on the stability and predictability of the demand for broad money in France, Germany, and the ERM is discussed. Broad money (M3) is used, since it is the most relevant from the point of view of monetary targeting in Europe (both France and Germany currently have M3 targets). Existing studies are first briefly surveyed, and then new estimates are given for the demand for M3 in France, Germany, and a core group of ERM countries. The new estimates are made using the methodology of cointegration, which tests whether a set of nonstationary series move together in the long run, that is, are cointegrated (see Granger ( 1983)). If they are, then it can be shown that an error correction model describes the set of variables (Engle and Granger ( 1987)); in particular, a dynamic equation would relate the change in money balances to deviations from the long-run money demand and possibly to changes in other variables such as income and interest rates.
Existing Studies
France
Studies for France give mixed results concerning the properties of the demand for broad money, in respect of both its long-run relationship with real income, prices, and interest rates, and the stability of its short-run dynamics. Frochen and Voisin ( 1986) analyze the stability of several monetary aggregates for France from 1970 to 1984, and find that M3, especially,

©International Monetary Fund. Not for Redistribution
122 fRA CE: FINANCIAL AND REAL SECTOR ISSUES
seems to be affected by financial innovation in the 1983-84 period, leading to a sharp reduction in the income elasticity of money demand. The demand for M1, in contrast, does not seem to be affected. Bordes and Strauss-Kahn ( 1989), using cointegration techniques, also find that M 1 has more desirable properties than broader aggregates: M I was coinregrared with income, the interest rate, and inflation but M3 was not (despite an attempt to adjust the official M3 series for financial innovation). De Bandt (1991) also does nor find that French M3 is coinregrated with real GOP, the price level, interest rates, and inflation between 1981 and 1990, though he leaves open the possibility of cointegration when the opportunity cost of holding M3 balances is measured more precisely. Angeloni, Cottarelli, and Levy (1991) report relatively poor estimates of the demand for French M3 between 1982 and 1990, in that the only interest rate that enters is the short rate (a marker rate, rather than the own rare), which enters with a positive sign.
Germany
Available studies of money demand relate to the preunification period; postunification data for both monetary variables and for GNP are subject to serious problems when used in econometric relationships, as is discussed below. Studies using pre-1990 data indicate quire high income elasticities (significantly greater than unity, and sometimes over two) and a greater responsiveness to long-term interest rates than to short rates. A recent study by Schmid and Herrmann (1991), also using preunification West German data, finds cointegration of nominal money with nominal GNP and a market interest rate; however, it is not reported whether the constraint of a unit real income (as well as price) elasticity is tested. Postunification stability is not examined. Estimates of the demand for a traditionally defined M3 in Angeloni, Cottarelli, and Levy ( 1 991) indicate a long-run income elasticity just over unity, and semi-elasticities of the own rate on M3 and the long-term interest rates that are both equal to 0.6, but opposite in sign; the equation is estimated between 1982 and 1990 using quarterly data.
The EU
Studies of E U money demand have generally presented promising results.
Monticelli and Strauss-Kahn (1992b) present cointegration rests and error correction models for broad money aggregated across the EU, using current exchange rates (Luxembourg was omitted for statistical reasons,
©International Monetary Fund. Not for Redistribution
ERM Mo11ey Supplies tmd the Tra11Silio11 to EMU 123
and Greece and Portugal were excluded because they had not joined the ERM by 1991). They find evidence of cointegration of real broad money balances with EU real income and a market interest rate (no data for the own rate on M3 were available), over periods extending from, at the earliest, 1977 ro 1990:111. Including a simple time trend has virtually no effect; in particular, it does not lower the relatively high income elasticity, estimated to be 1.6, which the authors interpret as reflecting to some extent the omission of wealth from the equation. Including a segmented trend starting only in the second half of the 1980s does lower the estimated income elasticity, ro 1.3. The interest rate semi-elasticity in the cointegrating equation is -0.7,characterized by the authors as low relative to national srudies. Error correction models give satisfactory results that are similar across different specifications, with a significant and strong feedback of departures from equilibrium equal to 30 or 40 percent per quarter.
Artis, Bladen-Hovell, and Zhang (1993) present results for both M I and MZ demand, aggregated across seven EU countries (Germany, France, Italy, the Netherlands, Denmark, Belgium, and Ireland), using quarterly data from 1979 to 1990, and using base period exchange rates in aggregation. Both aggregates expressed in real terms (divided by consumer prices) are cointegrated with the log of EU real income and short-term market interest rates, with coefficients of 1.2 and -0. 7, respectively. In addition, error correction models with desirable statistical properties-stability, absence of serial correlation or heteroscedasticity, and suchlike-are identified for both aggregates. However, the speed of adjustmem to long-term disequilibrium is significantly faster for M I (73 percent) than for MZ (37 percent).
New Estimates
The estimates reported below use quarterly M3 data for France, Germany, and an aggregation of core-ERM countries over a period extending from about the beginning of the EMS to 1990:!1 (see Appendix I for data sources). Later periods are mainly used for stability tests. There is an important break point in 1990 because of problems with posrunification data for Germany. Hence only the earlier data, for West Germany alone, are initially used in estimation. However, an adjustment was also made ro preunification data for both G P and M3 to scale it up to the size of united Germany, in order to test whether an equation estimated over the earlier period could still be relevant after 1990.
Quarterly data for the following variables were used: seasonally adjusted broad money supply M3 (m), real GOP or GNP (y), a long-term interest rate (i,), a money-market rate (im,), a constructed own rate on M3 (r0,), the
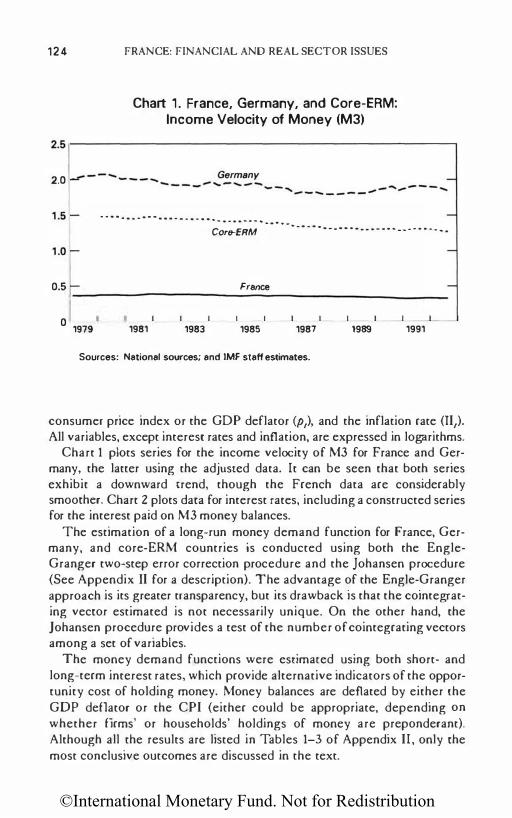
©International Monetary Fund. Not for Redistribution
124 FRANCE: FINANCIAL AND REAL SECTOR ISSUES
Chart 1. France, Germany, and Core-ERM: Income Velocity of Money (M3)
2.5.-------------------------------------------------,
2.0
1.5-
1.0-
· · · · · · - - · · · · · · · · · · · · · · . . . . . . .. . .. .. .. . .. .. Core-ERM
-... .. . .. . . . . .. . . . . . . . . . .. .. .. .. . . . .. . .. .
-
0.5 - France ----------------------------------
0 1979
I I _l 1981
I L 1983
L _I 1985 1987
Sources: National sources; and IMF staff estimates.
1989 1991
consumer price index or the GOP deflator (p,), and the inflation rate (TI,). All variables, except interest rates and inflation, are expressed in logarithms.
Chart 1 plots series for the income velocity of M3 for France and Germany, the latter using the adjusted data. It can be seen that both series exhibit a downward trend, though the French data are considerably smoother. Chart 2 plots data for interest rates, including a constructed series for the interest paid on M3 money balances.
The estimation of a long-run money demand function for France, Germany, and core-ERM countries is conducted using both the EngleGranger two-step error correction procedure and the johansen procedure (See Appendix II for a description). The advantage of the Engle-Granger approach is its greater transparency, but its drawback is that the cointegrating vector estimated is not necessarily unique. On the other hand, the johansen procedure provides a test of the number of cointegrating vectors among a set of variables.
The money demand functions were esrimared using both short- and long-term interest rates, which provide alternative indicators of the opportunity cost of holding money. Money balances are deflated by either the GOP deflator or the CPI (either could be appropriate, depending on whether firms' or households' holdings of money are preponderant). Although all the results are listed in Tables 1-3 of Appendix II, only the most conclusive outcomes are discussed in the text.

©International Monetary Fund. Not for Redistribution
ERM Money Supplies and the Transition to EMU 125
Chart 2. France and Germany: Interest Rate Developments
22�--------------------------------------------------� France (In percent)
' ' '
-......... ,Government bond yield
2 1979
Three-month rate -.... ....
"' ... .. ... "' ... .. ... .. ... . .. ... ...
.. ... ... .. . . . .. ... . ... ... Constructed own rate (M3)
1981 1983 1985
' .... , ' _,./ - ...... '/
1987
... . . ... ... .. ..
1989 1991
20�--------------------------------------------------, Germany (In percent)
Government bond yield ....... ,..,- - ....... ,_
/"'-.---' -..... - - ,. - ..- ...... / ... .. ... ... ... "' ," ... ... .. .. .. ... .... ..
. . ... .. ... .. - ... - ... ... .. .. ... ... Constructed own rate (M3} • • • • • • • • • • • • • • • • ·- • •
0 1979 1981 1983 1985 1987 1989
.. .. ... ... ...
Sources: IMF, lnternetionel Finenciel Statistics; and IMF staff estimates.
France
.. ... ... ... ... .. ..
1991
Using the cwo-srep procedure, the best long-run money demand function (deflated by the GOP deflaror) was found ro depend on real income and the difference between the long-term interest rare and the own rate on M3 (see Table 1, Appendix II). The long-run money demand function is given by
( 1 )
A unit root rest on the residuals allows the rejection of the null hypothesis of no coincegration and thereby suggests the existence of a long-run French

©International Monetary Fund. Not for Redistribution
126 FRANCE: FINANCIAL AND REAL SECIOR ISSUES
money demand relationship. The alternative johansen approach also suggests the existence of at least one long-run relationship that can be identified with long-run money demand (see Appendix II). In addition, contrary ro the two-step approach, the Johansen procedure reveals that a long-run money demand relationship exists even when nominal money balances are deflated by the CPl. When a dummy was included to account for the deregulation and financial innovations that occurred during the mid-1980s, a longrun money demand relationship was found in almost all instances.
An error correction model was then estimated ro capture the short-run dynamics, in which the disequilibrium in the previous period, represented by the lagged residuals of the long-run equation E,_ 1 , was an explanatory variable. The specification of the dynamic equation was chosen on the basis of the significance of a set of variables that included current and Jagged real income growth and changes in long-term interest rates. The most satisfactory dynamic money demand function for France is given by
ll(m,-p,) + 0.004 + 0.44!l(m,_ 1 -p,_1) (0.002) (0.15)
+ 0.015!lr0,_3 - 0.004/l im,_3- 0.267t,_ 1 , (0.008) (0.0025) (0.089)
RZ = 0.30, SER = 0.0083.
(2)
Estimated coefficient standard errors are included in parentheses. The equation standard error (SER) is less than I percent. Diagnostic tests for serial correlation, heteroscedasticity, linearity, and normality are reported in Table 2 of Appendix II; the dynamic equation passes all diagnostic tests except the linearity test. The error correction feedback term, E,_ 1, is significant at the 1 percent level with a coefficient of0.27, indicating a moderate adjustment of real money balances. When the equation is used to forecast money demand for 1990:1II-1992: III, a chi-square test suggests that the stability of the equation cannot be rejected at the I percent level but can be rejected at the 5 percent level.11
SatisfactOry short- and long-run money demand relationships thus seem to exist, which is encouraging given the problems with French money demand discussed above. From the perspective of monetary control, the above dynamic equation presents interesting features, namely the presence
11Estimating through 1991:111 and forecasting the next four quarters indicate stability at the 5
percent level.

©International Monetary Fund. Not for Redistribution
ERM Money Supplies and the Transition to EMU 127
of the money market interest rate and the own rate on M3, which are both largely controllable by the authorities. Interestingly enough, a variant of the equation in which the French-German short-term interest rate differential is also included does attribute a significant coefficient co chat variable, indicating possible evidence of currency substitution.
Germany
Analysis of the stability and long-run properties of the money demand function in Germany using data from 1978:1I co 1990:Il produces mixed results.'2 Using either the two-seep Engle-Granger or johansen estimation procedures, the existence of a cointegrating vectOr is apparent only when money balances are deflated by the CPI and the long-term interest race is used. The estimated long-run money demand equation, using the two-seep approach, is given by
m1-p1 = - 8.63 + 1.74y, - 0.016 (i,-r0,) + E, . (3)
Equation (3) implies a slightly higher elasticity for real income than has been reported elsewhere, while the semi-elasticity with respect co the difference between bond yields and the own return on money ( 1.6) is within the range of estimates by other researchers.
The best dynamic money demand equation was the following:
t:.(m,- p,) = 0.002 + 0.42t:.(m, _ 1 -p,_1) + 0.32t:.(m,_3-p,_3) (4)
(0.0017) (0.13) (0.12)
+0.027 t:.r0,_ 2 - 0.008/::.im,_ z - 0.004t:.im,_3 - 0.55£,_ 1,
(0.01) (0.003) (0.0018) (0.04)
RZ = 0.48, SER = 0.0068.
The coefficient values and their signs are sensible, and the dynamic equation passes all the diagnostic tescs. The coefficient of the error correction feedback term is, however, small and not significant at even the 10 percent level. Other specifications, in which the change of nominal money balances rather than real balances was the dependent variable, also produced
12Data for West Gennany were rescaled to make them comparable to data for the whole of Germany. Since GOP and M3 are in logarithms, only the constant is affected by the rescaling.

©International Monetary Fund. Not for Redistribution
128 FRANCE: FINANCIAL AND REAL SECTOR ISSUES
this result. Therefore, there is some doubt about the robustness of the cointegration result reported above, even over the period before unification. As for the stability of the dynamic equation, the results reject with 95 percent confidence the stability of the equation estimated through 1990 when it is used to forecast the 1990-92 period, even when a scale adjustment is made (Table 2, Appendix II).
Core-ERM Money Demand
The next stage in the investigation is ro explore aggregate money demand for the ERM core group-that is, the group of countries whose currencies have remained in the ERM narrow band for several years, and have not realigned relative to the deutSche mark since at least January 1987. These counuies include Belgium, Denmark, France, Germany, Luxembourg, and the Netherlands. Data were aggregated across countries using two methods: current purchasing power parities (PPPs), 13 and the ERM central parities against the deutsche mark that have prevailed since January 1987. Both methods have drawbacks: PPP weights are co some extent endogenous, as monetary policy will influence the path of prices, while central parities after 1987 are not obviously relevant for the earlier period. It turned out that estimates using PPP weights yielded more sensible results; these are reported in the text, while those using central parities in aggregation are relegated co Appendix III. Quarterly data are available for 1982:IV through 1990:11.
The data were first analyzed using the Engle-Granger two-step error correction procedure.14 Using PPP weights and data from 1982:IV-1990:11, a simple relationship was found between real core-group broad money (M3) deflated by the German CPI, real income (GOP), and the coregroup three-month interbank interest rate minus the own rate on money: 15
m 1 - p1 - - 12.7 + 1.9ly,- 0.004 (im,- r0,) + e, . (5)
13Current PPP rates are those underlying the OECD's national accounts survey for 1985 (OECD ( 1989)). calculated by multiplying these rates by the ratio of the GOP deflators of each country to that of Germany. This is equivalent to aggregating real variables using base period weights. This method yields nominal aggregates expressed in deutsche mark, which are divided
by a German price index to yield real aggregates expressed in 1985 deutsche mark.
••Preliminary testing revealed that first differences of all variables were stationary. as assumed by this procedure.
15Due to the difficulty of estimating an own rate for all the core countries, a GOP-weighted
average of the French and German own rate was calculated. This is a close approximation since the two countries represent more than 80 percent of the GOP of the core group.

©International Monetary Fund. Not for Redistribution
ERM Money Supplies and the Transition to EMU 129
Several features of this equation are noteworthy (see Table 3, Appendix II). First, test statistics obtained from the johansen procedure confirm the existence of one long-run money demand relationship among ERM countries. Second, the short-term interest rate (money market rate minus own rate) rather than the long-term interest rate appears as one of the variables in the cointegrating equation for core-group money, thereby enhancing the controllability properties of the monetary aggregate.
Turning to the error correction equation, the best dynamic specification estimated over the sample period 1981:II co 1990:11 is as follows:
ll(m,-p,) = 0.005 + 0.516(m,_4-p,_4) - 0.003rum,_2 - 0.18 e,_p (6) (0.002) (0.13) (0.001) (0.07)
R2 = 0.47, SER = 0.0076.
A noteworthy feature of the estimated dynamic equation is the error correction coefficient, -0.18, which is statistically significant at the 5 percent level; it is larger in magnitude than that reported above for Germany, implying a faster adjustment of money balances to disequilibrium. This is encouraging, to the extent that specification errors are often reflected in low estimated error correction coefficients (Kremers and Lane ( l 992b)). The estimated dynamic equation passes a range of specification tests, as reported in Table 4 of Appendix II. Short-term interest rates were found tO be statistically significant in this dynamic adjustment equation, but, as in the case of France and Germany, neither the long-term interest rate nor the growth of real G DP enters the dynamic equation. Finally, contrary to both the French and German results, the stability of the equation cannot be rejected at the 1 percent level.
Simultaneous Estimation: France, Germany, and Other Core-Group Countries
Another approach to examining money demand within the core group is to estimate money demand equations for the component countries simultaneously, in order to determine whether aggregation is justified by the data. The appropriate way to do this is to estimate money demands jointly, using the seemingly unrelated regressions (SUR) approach, and test the restrictions implied by aggregation.16
16As mentioned above. the restriction of equal coefficients across equations is only approximate since the dependent variable is in Jogs.

©International Monetary Fund. Not for Redistribution
130 FRANCE: FINANCIAL AND REAL SECTOR ISSUES
The form of equation that best lends itself co this kind of joint estimation is the one-step dynamic error correction equation. The dependent variable was specified as the change in real money balances while the explanatory variables were current and lagged changes in income, prices, and interest rates, as well as the lagged deviation of real money balances from their long-run relationship with real income and interest rates; the long-run income elasticity and interest semi-elasticity were estimated together with the other coefficients of the dynamic equation.
To reduce the dimension of the problem, the core group was divided into three components: France, Germany, and the remaining countriesBelgium, Denmark, Luxembourg, and the Netherlands-as a group.17 Both nominal and real variables for the remaining countries were aggregated into deutsche mark at post-1987 central parities. Money-market interest rates for the respective countries were used as the opportunity cost variable in money demand, and the own rate (which was not available for all countries) was omitted.
Money demand equations were estimated for each of these components, allowing different constant terms while constraining the slope parameters in the three equations ro be equal (the j superscript ranges over F = France, G = Germany, and 0 = other core-ERM). The best joint specification for the three components was
where
6m{ � ai- 0.156y{_ 1 + 0.316m{_2 + 0.336p{_ 3 (0.08) (0.08) (0. 1 1 )
- 0.021 (m{_ I -p{_ 1-J .97y{_ I + 0.03im{_ I ) , (0.14) (0.47) (0.02)
oF = -0. 1 9 ; rfl= -0.20 ; and aO= -0.17.
France Germany Others
(0. 1 1 ) (0.12) (0.10)
R2 = 0.30, SER = 0.0075, DW = 2.04. R2 = 0.16, SER = 0.0052, DW = 1.73. R2 = 0.02, SER = 0.0075, DW = 1 .91 .
(9)
This equation has a number of interesting features. First, it confirms that a common specification of money demand fits France, Germany, and
17The shares of these components in aggregate 1987 GOP were 36.1 percent for France. 45.2 percent for Germany. and 18.7 percent for the other countries.

©International Monetary Fund. Not for Redistribution
ERM Money Supplies 011d the Transition to EMU 131
the Benelux-Denmark grouping, as indicated by the low standard errors of the equations for the individual countries and because it satisfies a test that the same slope coefficients fit all three cases. Second, this is an error correction formulation, with negative feedback of the deviation of real money from its long-run money demand relationship, as given by the last term. Within the implied long-run relationship, income and interest elasticities are within the range that is typically found in the literature: the income elasticity of almost 2, while high, is not beyond the bounds of plausibility. The money-market interest rate also enters this relationship, with a semi-elasticity of 3.0.
Perhaps the most unsatisfactory aspect of the equation is the estimated error correction coefficient of only 0.021 (which does not even quite reach statistical significance at the 10 percent level). This implies a very slow dynamic adjustment of real money balances to variables affecting long-run money demand, and, in particular, to changes in interest rates-which were not found to have any statistically significant influence on monetary adjustment except through the error correction term.
In conclusion, the simultaneous estimation provides some, but limited, support for the aggregation needed to estimate a core-ERM equation that is not misspecified. The characteristics of the individual country equations using the joint specification-low standard errors, licde evidence of serial correlation, and satisfying tests of common coefficients-are, on the whole, favorable. They suggest that a common m0ney demand framework does not lead to serious misrepresentation of the behavior of the individual national components. However, the common equation estimated for che three components is not identical to the one estimated for the core group as a whole, and ic has some undesirable properties. To be sure, this is not surprising since some of the changes in che individual components may be submerged in the aggregate for the group as a whole, and the money demand estimation for the core group gives more weight to the larger countries, whereas the simultaneous equations approach creacs each of che components symmetrically, without regard ro size. Several questions were not resolved, and remain for further work, including the appropriate method of aggregation and the best choice of interest race variables.
I l l . Evidence on the Transmission of Monetary Impulses
As discussed above, goods market integration will tend to imply chat shocks to monetary variables in foreign countries will have effects on domestic economic activity and inflation. This effect is likely ro be
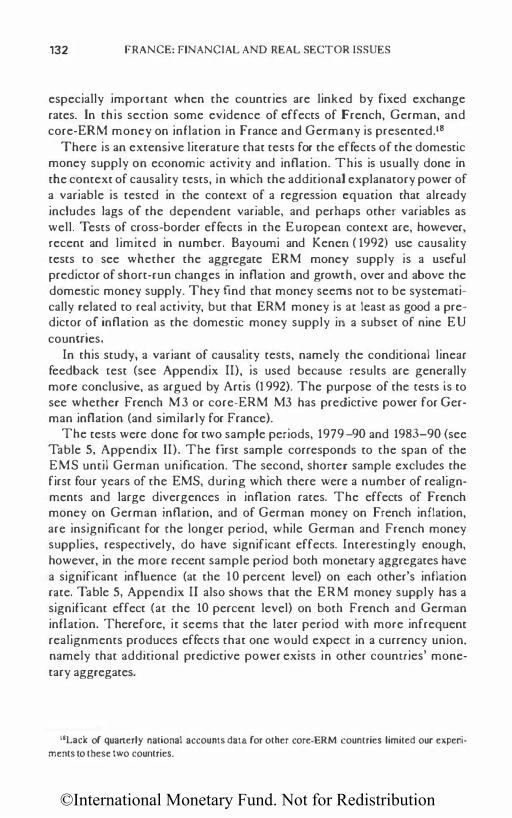
©International Monetary Fund. Not for Redistribution
132 FRANCE: FINANCIAL AND REAL SECTOR ISSUES
especially important when the countries are linked by fixed exchange rates. In this section some evidence of effects of French, German, and core-ERM money on inflation in France and Germany is presented.18
There is an extensive literature that tests for the effects of the domestic money supply on economic activity and inflation. This is usually done in the context of causality tests, in which the additional explanatory power of a variable is tested in the context of a regression equation that already includes lags of the dependent variable, and perhaps other variables as well. Tests of cross-border effects in the European context are, however, recent and limited in number. Bayoumi and Kenen ( 1992) use causality tests to see whether the aggregate ERM money supply is a useful predictor of short-run changes in inflation and growth, over and above the domestic money supply. They find that money seems not to be systematically related to real activity, but that ERM money is at least as good a predictor of inflation as the domestic money supply in a subset of nine EU countries.
In this study, a variant of causality tests, namely the conditional linear feedback rest (see Appendix II), is used because results are generally more conclusive, as argued by Artis (I 992). The purpose of the rests is to see whether French M3 or core-ERM M3 has predictive power for German inflation (and similarly for France).
The tests were done for two sample periods, 1979'-90 and 1983-90 (see Table 5, Appendix II). The first sample corresponds to the span of the EMS until German unification. The second, shorter sample excludes the first four years of the EMS, during which there were a number of realignments and large divergences in inflation rates. The effects of French money on German infla£ion, and of German money on French inflation, are insignificant for the longer period, while German and French money supplies, respectively, do have significant effects. Interestingly enough, however, in the more recent sample period both monetary aggregates have a significant influence (at the 10 percent level) on each other's inflation rate. Table 5, Appendix II also shows that the ERM money supply has a significant effect (at the 10 percent level) on both French and German inflation. Therefore, it seems that the later period with more infrequent realignments produces effects that one would expect in a currency union, namely that additional predictive power exists in other countries' monetary aggregates.
18Lack of quanerly national accounts data for other core-ERM countries limited our experi· ments to these two countries.

©International Monetary Fund. Not for Redistribution
ERM Money Supplies and the Transition to EMU 133
IV. Using Core-ERM Money in Stage 2 The statistical results presented above are only preliminary, and more
work has tO be done to test their robustness. Clearly they could not form the basis for monetary policy implementation without thorough evaluation. It is nevertheless useful co consider how, in principle, core-ERM money might be used in the transition to stage 3 of EMU.19 On the one hand, core-ERM money could serve as an additional indicator that might at times influence German monetary policy, or, on the other hand, there could be a formal target for core-ERM money.
As an additional indicator, core-ERM money could supplement the existing target for German M3. For instance, if German M3 were growing quickly but other ERM countries' money supplies were growing much more slowly, so that core-ERM M3 was growing at a satisfactory pace, then this might temper the concern for excessive German M3 growth. Conversely, too rapid growth in other ERM countries might induce caution in reducing German interest rates. In this perspective, the role of core-ERM money would be to aid in the interpretation of German developments, because, for example, at times the demand for German M3 might be distorted by exchange rate tensions or currency substitution.
As a formal target, core-ERM M3 could anticipate the mode of operation that would prevail under EMU, when monetary conditions of all countries in EMU would be given equal weight.20 This would represent a polar case, however; ocher arrangements might give more weight to meeting targets for German M3, and less to other core-ERM countries' M3. Allowing for a degree of symmetry in the monetary targets themselves need not involve symmetry in the implementation of monetary policy, since the anchor country could retain responsibility for determining monetary growth, while other core-ERM countries could devote their monetary instruments tO maintaining their exchange rates relative to the deutsche mark.
V. Conclusions
The tentative conclusion of the preliminary work reported above is that there appears to be some evidence of a long-run money demand relationship, for a core group of ERM countries, between M3, economic activity,
19Use of EU-wide aggregates in the transition to EMU has been discussed by, among others,
Angeloni. Couarelli. and Levy ( 1991). Van Riet ( 1992), Monticelli and Vii'lals ( 1992), and Commissariat g�ntral du Plan (1993 ).
20 Russo and Tullio ( 1988) discuss how an EU monetary aggregate could be targeted.
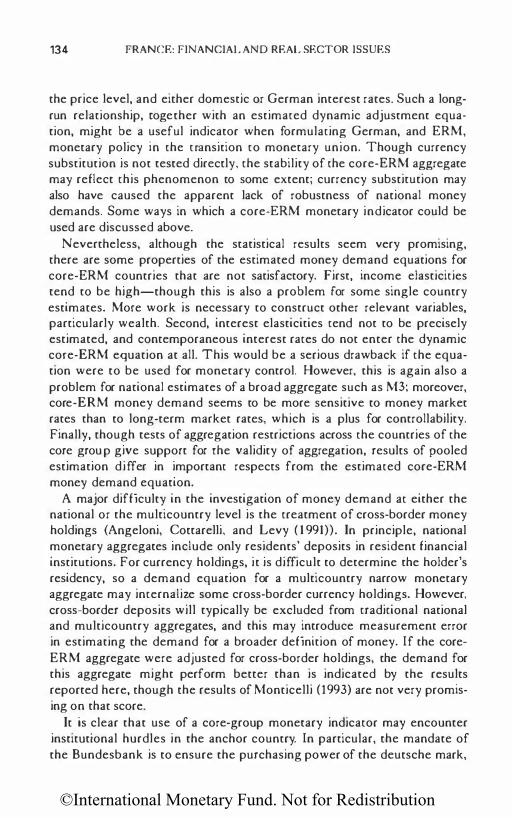
©International Monetary Fund. Not for Redistribution
134 FRANCE: FINANCIAL AND REAL SECTOR ISSUES
the price level, and either domestic or German interest rates. Such a longrun relationship, cogether with an estimated dynamic adjustment equation, might be a useful indicator when formulating German, and ERM, monetary policy in the transition to monetary union. Though currency substitution is not tested directly, the stability of the core-ERM aggregate may reflect this phenomenon to some extent; currency substitution may also have caused the apparent lack of robustness of national money demands. Some ways in which a core-ERM monetary indicator could be used are discussed above.
Nevertheless, although the statistical results seem very promising, there are some properties of the estimated money demand equations for core-ERM countries that are not satisfactory. First, income elasticities tend to be high-though this is also a problem for some single country estimates. More work is necessary to construct other relevant variables, particularly wealth. Second, interest elasticities tend not to be precisely estimated, and contemporaneous interest rates do not enter the dynamic core-ERM equation at all. This would be a serious drawback if the equation were to be used for monetary control. However, this is again also a problem for national estimates of a broad aggregate such as M3; moreover, core-ERM money demand seems to be more sensitive to money market rates than to long-term market rates, which is a plus for controllability. Finally, though tests of aggregation restrictions across the countries of the core group give support for the validity of aggregation, results of pooled estimation differ in important respects from the estimated core-ERM money demand equation.
A major difficulty in the investigation of money demand at either the national or the multicountry level is the treatment of cross-border money holdings (Angeloni, Cottarelli, and Levy ( 1 991)). In principle, national monetary aggregates include only residents' deposits in resident financial institutions. For currency holdings, it is difficult to determine the holder's residency, so a demand equation for a multicountry narrow monetary aggregate may internalize some cross-border currency holdings. However, cross-border deposits will typically be excluded from traditional national and multicountry aggregates, and this may introduce measurement error in estimating the demand for a broader definition of money. If the coreERM aggregate were adjusted for cross-border holdings, the demand for this aggregate might perform better than is indicated by the results reported here, though the results of Monticelli (1993) are not very promising on that score.
It is clear that use of a core-group monetary indicator may encounter institutional hurdles in the anchor country. In particular, the mandate of the Bundesbank is to ensure the purchasing power of the deutsche mark,

©International Monetary Fund. Not for Redistribution
ERM Money Supplies and the Trat1sition to EMU 135
nor some external target. Therefore, the statistical rest chat core-ERM money has predictive power for German inflation is important, because it suggests that other countries' money supplies may also be useful indicators in achieving a domestic German target. One aspect of the results that is particularly suggestive is that estimates of core-group money demand and tests of linear feedback are stronger for the peri,od from 1983 onward, when exchange-rate fluctuations within the core group were limited. This suggests that as a zone of exchange rate stability is maintained, at least among a small group of countries, and as European integration proceeds, the relevance of core-group ERM money may increase.
Appendix I
Data Sources and Definitions
Germany
Broad money (m): Average of end-month seasonally adjusted M3 stock. West Germany up to and including 1 990:IV; united Germany thereafter. Adjusted M3 data were also calculated ro make a consistent pre- and postunification series: west German money was scaled up by 14.3 percent from 1970:1 to 1990:III and by 1 2.9 percent in 1990:IV.
Source: Bundesbank tape.
Income (y): Real income based on GNP at 1991 prices. Seasonal adjust-ment of east German data based on west German seasonal facrors.
Sources: west German data from Bundesbank tape; east German data from OIW (1993). To make preunification data consistent with postunification data, an adjusted series was also created, in which real GOP was scaled up by 9.2 percent from 1970:1 to 1990:III, and by 8.2 percent in 1990:IV.
Long-term interest rate (t): Ten-year government bond yields.
Money market rate (im): Three-month interbank rate. Source: Bundesbank tape.
Own rate (r0): The own rate on M3 is constructed as the sum of time and statutory deposit rates weighted, respectively, by the period-by-period shares of time deposits and statutory savings in broad money.
Sources: Bundesbank tape and Bundesbank Monthly Report.
Prices {p): Consumer price index or GOP deflator. Source: Bundesbank tape.

©International Monetary Fund. Not for Redistribution
136 FRANCE: FINANCIAL AND REAL SECTOR ISSUES
Data adjustments for the cointegration tests raise west German money by 12.9 percent in 1990:IV and by 14.3 percent in the period 1970:I-1990:III; raise west German nominal GNP by 7.2 percent in 1990:IV and by 8.3 percent in the period 1970: I-1990:III; and raise real GNP by 8.2 percent in 1990:IV and by 9.2 percent in the period 1970:1-1990:111.
France
Broad money (m): Average of end-month seasonally adjusted M3 stock. Source: IMF, !ntemational Financial Statistics.
Income (y): Real GOP at 1980 prices, seasonally adjusted. Source: INSEE national accounts.
Long-term interest rate (t): Ten-year government yields.
Money market rate (im): Three-month interbank rate. Source: IMF, International Financial Statistics.
Own rate (r0): The own rate on M3 is a weighted average (with weights based on average shares in M3) of the returns on M 1 (assumed zero); M2-M1 (proxied with the interest rate on comptes sur livrets A ou bleus; and M3-M2 (proxied with the call money rate or taux au jour le jour).
Source: IMF, International Financial Statistics.
Prices (p): Consumer price index or GOP deflator. Source: IMF, International Financial Statistics.
Other ERM Countries
Broad money (m): M3 data, harmonized in accordance with instructions from the Committee of E U Central Bank Governors, were obtained from national sources for Belgium, Denmark, and the Netherlands. Before December 1982, a series for money plus quasi-money (IMF, lntemational Financial Statistics), seasonally adjusted, was used in place of M3 for the Netherlands. For Luxembourg, rime and savings deposits (IMF, International Financial Statistics) were used. The series for the four countries plus Germany and France were aggregated using the central deutsche mark parities that have prevailed since January 1987.
Income (y): Annual GOP for Belgium/Luxembourg, Denmark, and the Netherlands, was interpolated to quarterly using French real GOP as a guide series. Series were aggregated as for M3.
Source: IMF, World Economic Outlook.

©International Monetary Fund. Not for Redistribution
ERM Money Supplies tmd the Transition to EMU 137
Prices (p): Consumer price index or GOP deflator for Belgium, Denmark, Luxembourg, and the Netherlands were aggregated using shares of GOP in 1987.
Source: IM F, lntematio11(JI Financial Statistics.
Money market rates (im): Short-term rates. Source: IM F, !11femational Financial Statistics.
Appendix I I
Technical Details Concerning Estimation Results
Cointegration Analysis
Two techniques are used to test for coincegration: the two-step procedure of Engle and Granger ( 1987), in which ordinary least squares are used in the first step to estimate the long-run equation, and the residuals are tested for stationarity; and the maximum-likelihood Johansen procedure (Johansen (1988); Johansen and Juselius (1990)) in which a vector autoregression is estimated with the cross-equation restrictions implied by one or more cointegrating vecrors; the existence of such vectors is examined using tests on rhe eigenvalues of the VAR adjustment matrix (see Tables 1-3).
In the two-step procedure, stationarity of residuals is tested using either the augmented Dickey-Fuller (ADF) (Dickey and Fuller (1981)) or Phillips-Perron (PP) test (Phillips ( 1987); Phillips and Perron ( 1988)). The PP test differs from the ADF rest in the treatment of serial correlation in the noise process. Specifically, the PP test corrects for serial correlation by adding to the original unit root test statistic a correction factor that eliminates the dependency of the asymptotic distribution on the serial correlation of the noise function. The PP approach is non parametric with respect to noise parameters and has more power than the ADF test for models with moving average errors and positive serial correlation. However, when a parametric correction is needed, the PP test may be less reliable than the ADF test.
In the Johansen tests reported in the paper, a constant and three lags of each variable are included in estimation of the VAR.
Diagnostic Tests
The dynamic equations were subjected tO a number of tests to see whether they had satisfactory properties (see Table 4). The tests are described in Spanos (1986).
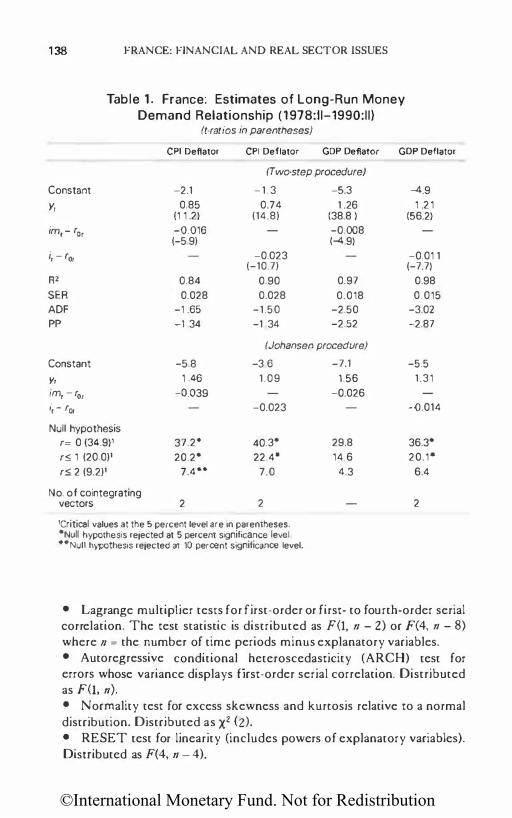
©International Monetary Fund. Not for Redistribution
138 FRANCE: FINANCIAL AND REAL SECTOR ISSUES
Table 1 . France: Estimates of Long-Run Money Demand Relationship (1978:11-1990:11)
(t-ratios in parentheses)
CPI Deflator CPI Deflator GOP Deflator
(Two-step procedure)
Constant -2.1 - 1 . 3 -5.3
y, 0.85 0.74 1 .26 (1 1 .2) (14.8) (38.8 )
im, - r0, -0.016 -0.008 (-5.9) (-4.9)
i, - 'or -0.023 (-10.7)
R2 0.84 0.90 0.97
SEA 0.028 0.028 0.018 ADF -1 .65 -1.50 -2.50 pp -1 .34 -1 34 -252
(Johansen procedure)
Constant -5.8 -3 6
y, 1 46 1.09 im, - r0, -O.Q39 i, - 'or -0.023
Null hypothesis f= 0 (34.9)1 37.2• 40.3"
rs 1 (20.0)1 20.2" 22.4.
rs 2 (9.2)1 7.4 •• 7.0
No. of cointegrating vectors 2 2
1Critical values at the 5 percent level are in parentheses. "Null hypothesis rejected at 5 percent significance leveL ""Null hypothesis rejected at 10 percent significance level.
-7.1
1.56
-0.026
29.8
14.6 4.3
GOP Deflator
�.9
1 .21 (56.2)
-0.01 1 (-7.7)
0.98
0.015 -3.02 -2.87
-5.5
1.31
-0.014
36.3"
20.1"
6.4
2
• Lagrange multiplier tesrs for first-order or first- to fourth-order serial correlation. The test statistic is distributed as F(l, 11 - 2) or F(4, 11 - 8) where n = the number of time periods minus explanatory variables. • Autoregressive conditional heteroscedasticity (ARCH) test for errors whose variance displays first-order serial correlation. Distributed as F(l, 11). • Normality test for excess skewness and kurrosis relative to a normal distribution. Distributed as x2 (2). • RESET test for linearity (includes powers of explanatory variables). Distributed as F(4, 11 - 4).

©International Monetary Fund. Not for Redistribution
ERN Money Supplies o11d the Transition to EMU 139
Table 2. Germany: Estimates of Long-Run Money Demand Relationship ( 1978:11-1 990:11)
(C·racios in parentheses)
CPI Deflator CPI Deflator GDP Deflator
(Two-seep procedure}
Constant
Y,
R2
SER ADF pp
-8.5
1 .7 1 (31.3)
-0.011 (-4.7)
0 96
0.026
-266 -2.56
-8.6
1 .74 (27.3)
-0.016 (-4.7)
0.94
0.30
-3.50* -2.50
-7.2
1.52 (31.8)
-0.009 (-4.4)
0.96
0.022
-2.27
-2.67
(Johansen procedure)
Constant
y, im, - r0, i, - for
Null hypothesis
r :: 0 (34.9)' r::; 1 (20.0)' r s 2 (9.2)1
No. of cointegrating vectors
-1 6 6
3.12
-0.136
so.o• 8.0 2.4
-3.2
0.92
-0.090
4o.o•
18.7 ••
3.9
'Cnucal values at the 5 percent level are 10 parentheses. •Null hypothesis rejected at 5 percent Significance level. • •Null hypothesis re,ected at 1 0 percent significance level.
-1.1
1 . 1 7
-0.547
54.o•
1 1 .3
2.6
GDP Deflator
-7.3
1.54 (27.4)
-0.0068 (-0.9)
0.94
0.027
-2.50 -2.23
-8.6
1.66
0.080
53.0"
18.1 ••
2.7
• Hendry test for forecast stability. Distributed as x2 (p), where p = number of forecast periods.
Aggregation Tests
In connection with SUR estimation of a common money demand equation for France, Germany, and the Benelux-Denmark group, the restrictions of common parameters were tested. The null hypothesis is that all coefficients (except rhe constant term) are the same across the three equations. The rest srarisric is a standard F test of linear restrictions using the residual sum of squares added across the three equations. The numerator degrees of

©International Monetary Fund. Not for Redistribution
140 FRA CE: FINANCIAL AND REAL SECTOR ISSUES
Table 3. Core-ERM Countries: Estimates of Long-Run Money Demand Relationship ( 1980:1-1990:11)
(t-ratios in parentheses)
CPI Deflator CPI Deflator GOP Deflator
(Two-step procedure)
Constant
y,
im,- r0,
i, - r0,
RZ SER ADF pp
-12.5
1.88 (38.9)
-0.004 (-3.9)
0.98
0.018
-2. 1 2
-2.85
-12.2
1.85 (37.9)
-0.006 (-4.6)
098
0 01 7
-2.20 -2.90
-10.1
1 .62 (55.9)
-0.003 (-4.1)
0.99
0 0 1 1
-2.77
-4.33 ••
(Johansen procedure)
Constant
y, im, - r0, i,- r0,
Null hypothesis r = 0 (34.9)1 r s 1 (20.0)1
rs 2 (9.2)1
No. of cointegrating vectors
-15.2
2.22
-0.014
40.6.
13.1
4.2
-19.6
2.76
-0.027
38.8• 17.2
4.5
'Critical values at the 5 percent level are in parentheses. •Null hypothesis rejected at 5 percent significance level. ••Null hypothesis rejected at 10 percent significance level.
-9.8
1 .59
-0.004
58. 1 • 25.7.
2.5
2
GOP Deflator
-10.0
1 .61 (50.3)
-0.003 (-3.5)
0.99
0 01 1 -2.50
-3.97 ••
...SA 1.41
-0.0001
59.6. 15.7
2.1
freedom are the number of restrictions implied by equal coefficients; the denominator degrees of freedom are the number of observations minus parameters in the unrestricted version. The value of test statistics for equation (9) in the text was 1 .80, compared with a critical value of 1.83.
Conditional Linear Feedback Tests
The conditional feedback test differs from the Granger test in that it includes leads and lags augmented with lagged dependent variables, in

©International Monetary Fund. Not for Redistribution
ERM Money Supplies and the Transitio11 to EMU
Table 4. Diagnostic Statistics1 for Dynamic Money Demand Equations
France Germany
141
Core-ERM 1979: 11-1990:11 1979: 11-1990:11 1981:11-1990:11
Serial correlation2 First-order 1.27 0.23 0.41 Lags 1-4 0.61 2.07 0.68
ARCH (1) test for heteroscedasticity 0.30 3.0 0.05
Normality testJ 3.06 0.26 2.04
RESET (4) test for linearity 3.14. 0.26 0.90
Forecast stability" 20.20. 17.8o• 8.23
'All statistics are in F form unless otherwise mentioned. Test statistics exceed 5 percent aitical values only when starred.
llagrange multiplier test. 3Jacque-Bera test. distributed as chi-square with 2 degrees of freedom. 'Out-of-sample forecast for 1990:111-1992:111. Distributed as chi-square with 9 degrees of freedom.
order to correct for the residual serial correlation that is likely to occur with one-sided tests (Geweke (1982)). A two-sided distributed lag of money growth on inflation is estimated for both France and Germany, and the exclusion of leads of money growth is tested. This provides a test of whether the particular monetary aggregate has predictive power (see Table 5).
Table 5. Conditional Feedback Tests of Effects of Money on Inflation
Inflation in:
France Germany
(1979:1-1990:11)
French money growth 3.90 •• 1.14 German money growth 2.26 3.22 .
(1983:1-1990:1/)
French money growth 6.00 •• 3.36 . German money growth 4.80 •• 2.72 . Core-ERM money growth1 2.79 . 2.79 .
The table reports the F-statistics for excluding the variable. A single asterisk indicates that the variable is significant at the 1 0 peroent level. A double asterisk indicates that the variable is significant at the 5 percent level.
'Core-ERM money supply growth excludes growth of the domestic money supply.

©International Monetary Fund. Not for Redistribution
142 FRANCE: FINANCIAL AND REAL SECTOR ISSUES
Appendix I l l
Core-ERM Money Demand Aggregate Using Central Parities
A long-run money demand equation for the aggregate, constructed using central parities prevailing since January 1987, was estimated for the period 1980:IV through 1992:IIJ21
(m1-p1) - - 9.57 + 1.85y1- 0.010 (im,- r0,). (A1)
This long-run equation is similar to the one obtained with PPP weights over the shorter sample: it has a fairly high long-run income elasticity ( 1.85) and a reasonable interest semi-elasticity (1.0). zz However, the evidence of cointegrarion is fairly weak, since the significance of the ADF rest statistic (3.1 5) is borderline.
Therefore, instead of a two-step procedure, one-step estimation was performed in which lagged levels of the variables in the long-run equation were included directly in a short-run dynamic equation, along with differences of these variables, in order to see if there was significant error correction feedback when the long-run money demand was estimated directly. The best specification of this dynamic equation was the following equation, in which the dependent variable is the change in 11omir1al money:
I:J.m1 - - 0.35t:J.m,_3 + 0.20l i:J.y,_ 2 (0.14) (0.093)
-0.24m,_ 1 + 0.15y,_1 - 0.00037 (im,_1 - r0,_1) , (0.006) (0.003) (0.00038)
R2 = 0.96, SER = 0.0042, OW = 2.26.
(A2)
This error correction specification implies results that are broadly consistent with those of the long-run equation-with the major exception that
21A larger series for M3 was created by extending the Netherlands data bank before 1982, and adjusting post-1990 Gennan data for unification (see Appendix !). The longer sample period was used in order to maximize the number of observations since the beginning of 1987-most relevant. given the central parities used.
221f only the 1987:1-1992:111 period is used in estimation. the estimated coefficients on the real income and interest rate variables are 1.19 and 0.002, respectively.

©International Monetary Fund. Not for Redistribution
ERM Money Supplies and the Transition to EMU 143
the coefficients on the levels of money and income imply an income elasticity of money demand (0.63) that is much lower than in equation (9). The German interest rate enters the dynamic equation only through the error correction component; its coefficient is of the same order of magnitude as in equation (9), but is not statistically significant. The dynamic equation passes all of the specification tests-including our-of-sample forecasts when the equation was re-estimated with a 1990:11 curoff, and was used to forecast 1990:III-1992:III-with the exception of the test for autoregressive conditional hereroscedasticity.
References
Angeloni, Ignazio, Carlo Cocrarelli, and Aviram Levy, "Cross-Border Deposits and Monetary Aggregates in the Transition to EMU," IMF Working Paper, WP/91/114 (Washington: International Monetary Fund, November 1991).
Artis, Michael ]., "Monetary Policy in Stage Two of EMU: What Can We Learn from the 1980s?" (mimeographed, 1992).
__ , Robin C. Bladen-Hovell, and Wing Zhang, "A European Money Demand," in Policy Issues in the Operation of Currency Unions, ed. by Paul R. Masson and Mark P. Taylor (Cambridge, England: Cambridge University Press, 1993).
Barr, David, "The Demand for Money in Europe: Commenc on Kremers and Lane," Staff Papers, International Monetary Fund, Vol. 39 (September 1992), pp. 718-29.
Bayoumi, Tamim, and Peter B. Kenen, "Using an EC-Wide Monetary Aggregate in Stage Two of EMU," IMF Working Paper, WP/92/56 (Washington: International Monetary Fund, july 1992).
Bekx, P., and G. Tullio, "A Note on the European Monetary System, and the Determination of the OM-Dollar Exchange Rate," Cahiers EcotJomiques de Bruxelles, Vol. 123 ( 1 989), pp. 329-43.
Bordes, Christian, and Marc-Olivier Strauss-Kahn, "Cointegration et demande de monnaie en France," Cahiers Economiques et Monftaires No. 34 ( 1 989), pp. 1 61-97.
Commissariat general du Plan, A French Perspective on EMU (Paris: Editions La Decouverre et La Documentation franc;aise, 1993).
De Bandt, 0., "Polirique monetaire et agregars de monnaie en France," Banque de France, Bulletin Trimestriel, No. 78 (June 1991), pp. 79-93.
Deutsche Bundesbank, "The Impact of External Transactions on Bank Liquidity, The Money Stock and Bank Lending," M011thly Report (January 1993), pp. 19-34.

©International Monetary Fund. Not for Redistribution
144 FRANCE: FINANCIAL AND REAL SECTOR ISSUES
Deutsches lnstitut fur Winschaftsforschung, Economic Bulletin, Vol. 30, No. 2 (April 1993 ).
Dickey, David A., and Wayne A. Fuller, "Likelihood Ratio Statistics for Autoregressive Time Series with a Unit Root," Econometrica, Vol. 49 (July 1981), pp. 1057-72.
Dornbusch, Rudiger, "Expectations and Exchange Rate Dynamics," Journal of Political Economy, Vol. 84 (December 1976), pp. 1 161-76.
Engle, Roben F., and Clive W. Granger, "Cointegration and Error Correction: Representation, Estimation, and Testing," Econometrica, Vol. 55 (March 1987), pp. 251-76.
Fase, M.M. and C.C. Winder, "The Demand for Money in the Netherlands and the Other EC Countries," CEPS Working Document No. 72 (Brussels: Centre for European Policy Studies, 1992).
Fr&hen, Patrick, and P. Voisin, "La Stabilite des Equations de Demande de Monnaie: le Cas de Ia France de 1970 a 1984," Banque de France, Cahiers Economiques et Monitaires No. 21 (1986), pp. 5-48.
Geweke, john, "The Measurement of Linear Dependence and Feedback Between Multiple Time Series," Journal of the American Statistical Association, Vol. 77 (June 1982), pp. 304-24.
Granger, Clive W., "Cointegrated Variables and Error-Correcting Models," UCSD Working Paper 83-13 (San Diego: University of California at San Diego, 1 983).
johansen, Soren, "Statistical Analysis of Cointegration Vectors," Journal of Econom ic Dynamics and Control, Vol. 1 2 (June-September 1988), pp. 231-54.
__ , and Katarina juselius, "Maximum Likelihood Estimation and Inference on Cointegration-with Applications to the Demand for Money," Oxford Bulletin of Economics and Statistics, Vol. 52 (May 1990), pp. 169-210.
Kremers, jeroen, and Timothy Lane, "Economic and Monetary Integration and the Aggregate Demand for Money in the EMS," Staff Papers, International Monetary Fund, Vol. 37 (December 1990), pp. 777-805.
__ (1992a), "The Demand for Money in Europe: Reply to Barr," Staff Papers, International Monetary Fund, Vol. 39 (September 1992), pp. 730-37.
__ (1992b), "The Implications of Cross-Border Monetary Aggregation," IMF Working Paper, WP/92/71 (Washington: International Monetary Fund, September 1 992).
Lane, Timothy, and Stephen Poloz, "Currency Substitution and CrossBorder Monetary Aggregation: Evidence from the G-7," IMF

©International Monetary Fund. Not for Redistribution
ERJI1 Money Supplies and the Transition to EMU 145
Working Paper, WP/92/81 (Washingron: International Monetary Fund, October 1992).
Monticelli, Carlo, "All the Money in Europe? An Investigation of the Economic Properties of EC-wide Extended Monetary Aggregates" (mimeographed, july 1993).
__ , and Marc-Oiivier Strauss-Kahn ( 1992a), "Broad Money Aggregates and National Money Demand in Europe," Economies etSociitls, Serie economic monetaire, No. 9 (September-October 1992), pp. 147-97.
__ ( 1992b), "European Integration and the Demand for Broad Money," BIS Working Paper, o. 18 (Basic: Bank for International Settlements, April 1992).
Monticelli, Carlo, and jose Vifials, "European Monetary Policy in Stage Three: What Are the Issues?" Paper presented at the Centre for Economic Policy Research conference Tire Mo11etary Future of Europe, La Corufia, Spain, December 1992.
Organization for Economic Cooperation and Development, National Accounts, Vol. I (Paris: OECD, 1989).
Phillips, Peter C., "Time Series Regression with a Unit Root," Econometrica, Vol. 55 (March 1987), pp. 277-301.
__ , and Pierre Perron, "Testing for a Unit Root in Time Series Regression," Biometrika, Vol. 75 (1988), pp. 335-46.
Russo, Massimo, and Guiseppe Tullio, "Monetary Policy Coordination within the European Monetary System: Is There a Rule?" Part II of Policy Coordination itJ the European Monetary System, IMF Occasional Paper 61 (Washington: International Monetary Fund, September 1988).
Schmid, Peter, and Heinz Herrmann, "Federal Republic of Germany: Old and New Problems Posed by a Target-Guided Monetary Policy," in The Orientation of Monetary Policy and the Monetary Policy Decision-JI1oking Process (Basic: Bank for International Settlements, April 1991), pp. 69-86.
Spanos, Aris, Statistical FoundatiOtiS of EcotJOmetric Modelling (Cambridge, England: Cambridge University Press, 1986).
Van Riet, A.G., "European Integration and the Demand for Money in the EC," De Nederlondsche Bonk Quarterly Bulletin 1992/3 (December 1992), pp. 33-43.

©International Monetary Fund. Not for Redistribution
Mlll@il§;liiNW
The Taxation of Returns from Personal Savings in France
GARY O'CALLAGHAN
D his chapter examines developments in France's financial system since the mid-1980s, and their implications for the system of taxation of
returns from saving.1 It will argue that the system is in need of a general review. The original approach tO taxation of returns from saving has been overtaken by events, in particular by financial and capital liberalization and European financial market integration, and there has not been a systematic review of irs goals and how they might be achieved. Instead, a number of specific taxation provisions have been introduced in a piecemeal fashion and withour regard to changing financial circumstances, and have accumulated as a system that is overcomplicated and that frustrates its original (and subsequent) objectives.2 In addition, these provisions have severely reduced the revenues generated from rhe taxation of rerurns from saving without, at the same rime, significantly increasing rhe overall incentive w save. The chapter outlines a general perspective that might be adopted in a review of the system and makes some specific policy recommendations.
A simple cross-country comparison reveals that the French system of taxation of returns from saving is subject to a greater range of exemptions and specific provisions than others.3 Many of these provisions existed prior to financial liberalization of internal markets in the mid-1980s and capital liberalization and European market integration after 1989, and are
'More specifically. the types of returns from saving principally considered arc deposit interest.
interest on bonds, dividend income. and capital gains on share investments.
2The system of taxation of savings in France was recently described by a prominent French banker as "defying logic" (Le Monde ( 1993)).
3While such observations are instructive, the value of cross-country comparisons of systems of taxation of returns from savings can be limited, and can lead to assessments that are less than conclusive. This is because financial and capital taxation systems across countries differ with the perceived goals of domestic policies (King and Fullerton (1983), pp. 307 and the following).
146

©International Monetary Fund. Not for Redistribution
The Taxation of Returns from Personal Saving in F ranee 147
outdated. However, rather than overhaul the system, continued attempts to pursue a sec of allocational goals through a system of differential cax treatment between financial instruments led ro further exemptions in later years. The chapter will assess the combined impact of these exemptions in terms of achieving the overall goals of the system. In this sense, it will examine whether there has been an optimal response co a changing financial environment-has the system adapted appropriately ro the additional constraints imposed by global financial developments? Has it adapted such that the existing structure of the system is consistent with its professed goals?
The summary review conducted here suggests three broad conclusions: First, the system as now constituted has some perverse effects that actually frustrate one of the policy goals-the goal of redistributing savings coward certain financial instruments. Second, attempts to reallocate toward specific instruments, by way of offering fiscal advantages, will be more distortional in a liberalized financial system and are less likely ro be successful in promoting the second goal of policy, which is ro foster an increase in aggregate savings. The third conclusion is that a uniform taxation system would not only be preferable in a liberalized financial setting, it would also reduce channels for tax avoidance and either lead to increased taxation revenues at existing rates or allow a general reduction of tax rates. The combination of the second and third conclusions would suggest that a uniform system would improve the trade-off between tax revenues and fiscal incentives aimed at increasing saving.4
These arguments, among others, are presented in more detail (in Section III) after a brief description of the development of the French system of taxation of returns from saving has been presented (in Section I) and the present system has been described (in Section II) and compared with others in the major industrial countries. Section IV offers some conclusions and specific policy recommendations.
4A general assessmen1 of the optimal level of taxation of returns from saving. at an aggregate
level, would be of limited value in the comext of this review. Studies such as Razin and Sadka (( 1989) and ( 1990)) have analyzed the optimal response to financial and capital market liberaliza. tion in terms of adjusting the aggregate level of taxation. However, taxation SYStems (and espe
cially the French system) are seldom defined by uniform aggregate taxation rates and provisions. Also. domestic financial assets will typically differ in range and attributes and are not perfect sub
stitut.es for one another or for foreign instruments (Mintz (1990), pp. 355 and the following). For
these reasons. it is deemed more appropriate to examine whether the composition of the system
has adapted in a manner that is consistent with its goals, and the question of whether aggregate rates should be higher or lower is not addressed.
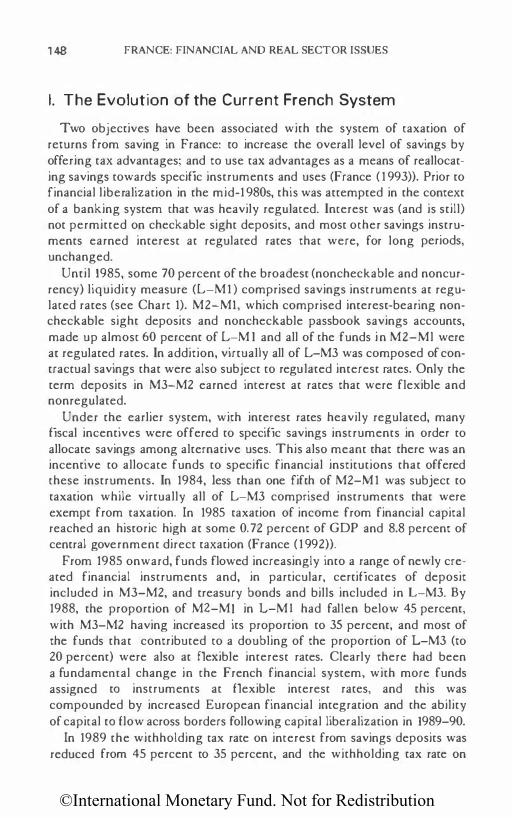
©International Monetary Fund. Not for Redistribution
1 48 FRANCE: FINANCIAL AND REAL SECTOR ISSUES
I. The Evolution of the Current French System
Two objectives have been associated wich the system of taxation of recurns from saving in France: tO increase the overall level of savings by offering tax advantages; and tO use tax advantages as a means of reallocating savings towards specific instruments and uses (France ( 1 993)). Prior to financial liberalization in the mid-1980s, this was attempted in the context of a banking system that was heavily regulated. Interest was (and is still) not permitted on checkable sight deposits, and most other savings instruments earned interest at regulated rates that were, for long periods, unchanged.
Until 1985, some 70 percent of the broadest (noncheckable and noncurrency) liquidity measure (L-M 1 ) comprised savings instruments at regulated rates (see Chart 1). M2-M1, which comprised interest-bearing noncheckable sight depositS and noncheckable passbook savings accounts, made up almost 60 percent of L-M I and all of the funds in M2-Ml were at regulated rates. In addition, virtually all of L-M3 was composed of contractual savings that were also subject to regulated interest rates. Only the term deposits in M3-M2 earned interest at rates that were flexible and nonregulated.
Under the earlier system, with interest rates heavily regulated, many fiscal incentives were offered to specific savings instruments in order to allocate savings among alternative uses. This also meant that there was an incentive to allocate funds to specific financial institutions that offered these instruments. In 1984, Jess than one fifth of M2-M 1 was subject to taxation while virtually all of L-M3 comprised instruments that were exempt from taxation. In 1985 taxation of income from financial capital reached an historic high at some 0. 72 percent of GOP and 8.8 percent of central government direct taxation (France (1992)).
From 1985 onward, funds flowed increasingly into a range of newly created financial instruments and, in particular, certificates of deposit included in M3-M2, and treasury bonds and bills included in L-M3. By 1988, the proportion of MZ-M I in L-M I had fallen below 45 percent, with M3-M2 having increased its proportion to 35 percent, and most of the funds that contributed to a doubling of the proportion of L-M3 (co 20 percent) were also at flexible interest rates. Clearly there had been a fundamemal change in the French financial system, with more funds assigned tO instruments at flexible interest rates, and this was compounded by increased European financial integration and the ability of capital tO flow across borders following capital liberalization in 1989-90.
In 1989 the withholding tax rate on interest from savings deposits was reduced from 45 percent to 35 percent, and the withholding tax rate on

©International Monetary Fund. Not for Redistribution
The Taxation of Retums from Personal Saving i11 F ranee 149
Chart 1 . France: Financial Aggregates (In percent of L-M1)
120.--------------------------------------------------, - M2-M1 I!Ej M3-M2 c:J L-M3
100
80
60
40
20
0 1980 1981 1982 1983 1984 1985 1986 1987 1988
Source: Banque de France, Bulletin Trimestriel (various issues).
income from most bonds and commercial paper was reduced from 25 to 15 percent. In addition, rhe taxation of life insurance benefits was virtually abolished. These reforms were enacted in preparation for capital liberalization and the integration of markers for financial services in Europe, and were prompted by an attempt to bring basic rates in line with the resr of Europe.5 Also, rhe marketing of foreign mutual funds that capitalize the financial income received as a means of delaying taxation was permitted in Europe from Occober 1, 1989. This was expected to lead to a displacement of financial intermediation ourside of France and, in response, French financial institutions were permitted co sell such instruments. These added substantially to the proportion of savings in instruments ar flexible interest races, in particular money marker mutual funds, because of relatively high short-term interest rates.
However, rather than overhaul rhe system in the lighr of these changed circumstances, the old practice of legislating fiscal preferences for different
seapital liberalization in Europe raised the prospect of competitive tax reductions in different
countries. as they tried to attract foreign funds. but attempts at establishing a uniform withholding
tax rate have not been successful to date. See Gardner (1992).

©International Monetary Fund. Not for Redistribution
150 FRANCE: FINANCIAL AND REAL SECTOR ISSUES
Chart 2. France: Financial Aggregates (In trillions of francs)
Sr--------------------------------------------------------,
- -
_., .., "" "" "" ""
_ ..,
- -
- -- -
.,.,., - -- - Tax·exempt
-- -
- -
- - - --
.. ... ... .. ... .. . - .. .. ... .. ..
.. - - ... .. ..
.. ... ... ... .. .. ... .. ... ... .. . .. M3-M1 .. .. .. .. .. ..
.... .. .. .. ..
.. ... ... - .. ..
.. .. .. .. ..
..... __ --.......
-- -- -·---Tax-exempt
1988 1989 1990 1991 1992
Source: Banque de France, Bulletin Trimestriel (various issues).
types of savings was extended through a series of stopgap measures. Furthermore, these have been adopted over rhe years without full consideration of their overall impact. A number of additional tax-exempt instruments were created in response tO the increase in money marker mutual funds, for example, in an attempt to lengthen the maturity of savings, and these are described in derail below. However, innovations aimed at securing a particular objective have often led to results that conflicted with earlier objectives, and have resulted in the introduction of successive stopgap measures to rectify the resulting distortions.
These developments also contributed substantially to an increase in the proportion of savings assigned to tax-free financial instruments. By the end of 1992, two thirds of the (newly defined) broad financial aggregate P2-Ml was free of taxation (Chart 2).6 This compares with 40 percent in 1 988. In addition, tax revenues from earnings on financial capital had
6In addition to M3-M I (as previously defined), P2-M I comprises Treasury bills and cenificates, commercial paper issued by nonfinancial companies, long-term contractual savings plans, bonds, most (i.e .. nonequity) mutual funds, and the compulsory reserves of insurance companies. Many of the tax exemptions on financial instruments are limited to specified amounts (as will be described below) and Chan 2 i s constructed on the basis that these limits are not exceeded.

©International Monetary Fund. Not for Redistribution
The Taxation of Returns from Persot1al Saving i11 France 151
halved, co 0.32 percent of GOP (from 0.62 percent) and 4.1 percent of direct taxation (from 7.7 percent).
I I . Taxation Systems in France and Other Major I ndustrial Countries
There are a number of salient features of the French system of expenditure and taxation that stand out from other major industrial countries (see Table 1). First, the levels of government revenues and expenditure are among the highest, each being 8-10 percentage pointS of GOP above average. Second, the relative incidence of taxation on labor income is the highest among the major industrial countries while the incidence of taxation on other income, including returns from saving, is lowest. Further examination of the structure of taxation reveals rwo important features: (1) taxes raised on labor income include the highest proportion of employer contributions, and the second highest contribution rates (OECO (1992)); and (2) taxes raised via a general taxation system, which includes the taxation of other forms of income and returns from saving, are very low. The common element to these is that they both reflect a failure co extract taxes based on an individual's overall ability to pay and put a commensurately higher burden on purely labor income.7 This contention is supported by Kopits ((1992), Chart 2).
The other notable feature of Table 1 is the extent of unfunded liabilities co workers in the form of accrued pension rights in France. These are second highest (to Italy) among the major industrial economies and imply an alarming future burden on a taxation system that already places one of the highest burdens on an economy among the major industrial countries. Given the present structure of the rax system, with its relatively heavy reliance on taxes on labor income, this implies a growing taxation wedge on labor unless reforms to the system are coupled with a movement toward a more generalized, and broad based, taxation system.
The Structure of Taxation i n France and the Major Industrial Countries
Aside from specific exemptions, the taxation of returns from saving is first affected by the overall structure of the taxation system. In this regard,
7While these data are an indication of the extent of the reliance on labor income, to the exclusion of income from savings and other sources. a complete review of the taxation systems involved will be required fully to establish this point. This is because the OECD data cited involve broad categories that will, for some countries. include some taxation on labor with "other personal income."

©In
tern
atio
nal M
onet
ary
Fund
. Not
for R
edis
tribu
tion
Tab
le 1
. M
ajo
r In
du
str
ial
Co
un
trie
s:
Ge
ne
ral
Go
ve
rnm
en
t R
ev
en
ue
s a
nd
Ex
pe
nd
itu
re i
n 1
99
0
01
""
Oth
er
Ma
jor
Indu
str
ial
West
U
nited
U
nit
ed
Fra
nce
C
ou
ntr
ies'
Ge
rman
y
:King
do
m
Sta
tes
Ca
na
da
It
aly
J
apa
n
(In perc
ent o
f GD
PJ
Ge
ne
ral
gove
rnm
en
t re
ven
ue
s
48
.8
38
.9
40
.5
39.3
3
3.3
43
.2
42
.7
34
.7
;:::;
Ge
ne
ral
gove
rnm
en
t >
e
xpe
nd
itur
e
50.2
4
1.9
4
2.3
4
0,6
3
5.7
4
7.3
5
3.6
3
1.8
�
Soci
at pr
ote
cti
on
··
-
expe
ndit
ure
? 2
6.0
1
8.9
2
4.9
2
0.3
1
4.8
1
8.6
23
.4
11
.6
- z
Mem
oran
dum
item
s {I
n pe
rcen
t of
tota
l) >
z
1.
Str
uct
ure
of
tax
ation
:")
la
bor
incom
e 4
6.1
2
6.7
3
6.8
1
7.5
2
9.5
14
.2
33.2
2
9.2
>
Empi
C¥lr
con
tribution
s 2
7.3
1
5.6
18
.8
10.0
1
6.6
9
.7
23
.6
15
.2
>
Other
pe
rson
al
inc
om
e
11
.8
30
.9
27
.4
28
.4
35
.8
40
.8
26
.3
26
.8
z
Consum
pti
on
28
.2
23
.8
27
.4
30
.4
16
.5
27
.4
28.0
1
3.2
Ci
;:
::; P
rope
r ty
5
.2
7.1
3
.3
8.4
1
0.8
9
.0
2.3
9
.0
>
Corpo
rate
inc
om
e
5.4
1
0.4
4
.7
11
.0
7.3
7.
5 10
.2
21
.5
Otfle
r 3
.3
1.0
OA
4
.3
L2
0
.2
::r.
Tota
l 100
.0
100
.0
100.0
100
.0
100.0
1
00
.0
100.0
1
00
.0
;;:
lin pe
rcent
of G
DPJ
..
..: "-'
;:
::; 2
. P
res e
nt
va
lue o
f ac
crue
d
::r.
�n
sion r
igh
ts-
ne
t li
abilit
ies
21
6
15
2
15
7
156
89
12
1
24
2
14
5
::r.
Sources
: IM
F. IM:J
rk:f Econom
rc Ou
tJook:
fnre
nm As
sessment Ja
nuary
1993: O
ECD.
f()(){)(J
fTljc; SuTYe
y Fr
ance. 1
992.
:r.
'Nonwa
g ted
CI'Jerage
ol rn<ljOI"
1ndu
smaJ cou
ntries
exd
uding
Fra
nce
. 2So
urce
: O
EC
D !1
992)
; for E
U. da
ta for
198
8.

©International Monetary Fund. Not for Redistribution
The Taxation of Retums from Personal Saving i11 France 153
France does not at first appear co be exceptional (Table 2). Dividend, interest, and capital gains taxes are included with ocher sources of income in the general taxation system, but chis is subject co the exception chat residents can opt for a final withholding tax on interest income. This also applies to the Italian system, while Japan completely excludes interest income from the general taxation system. In France, savers are allowed to choose the lower of the final withholding tax on interest or the marginal liability from the general taxation system, and this is an element of preferential treatment for interest income. Dividend income is allowed a 50 percent credit for corporate taxes paid, unlike in other countries, but is thereafter subjected to the marginal income tax rate. Capital gains are disadvantaged by being taxed at the marginal income tax rate and being allowed no deductions.
The structure of taxation in France in 1991 is outlined in Table 3. The general structure of the system has not changed since then, although some minor changes will be noted in the description that follows. Income tax (impot sur /e revenu) applies to income from employment, income from dividends and interest in excess of F 8,000 per year (unless a final withholding tax is opted for, see below), and pension income and capital gains on the sale of assets for more than F 20,000 (unless a "substantial interest" is held and a flat rate is applied, see below). Social security payments are deductible from taxable employment income, and supplementary comributions to other pension plans are deductible subject to certain limits. While the social surcharges (Table 3, line 24) have not heretofore been deductible, an increase in the contribution sociale giniralisle (CSG) in July 1993, to 2.4 percent from 1 . 1 percent, was made deductible.
The cop marginal income tax rate is 57 percent. However, this will not apply to most interest income because the taxpayer may elect to be taxed at a .final flat rate (prlll!vement libtrotoire, Table 3, line 23) that depends on the instrument involved. The rates range from 15 percent on bonds or other negotiable instruments to 35 percent on interest from savings deposits and 35-50 percent on interest from short-term claims on certain institutions (bons du trlsor or bons de coisse). Income from foreign securities is generally only taxable at graduated rates. Dividend income receives a tax credit of 50 percent of the income received (the ovoir fiscal, Table 3, line 20) in order fully to compensate for corporate taxes paid by the company (at the corporate tax rate of 34 percent).
Capital gains on securities represeming a substantial interest (when aggregate transactions in securities exceed F 316,900 a year or the taxpayer holds 25 percent or more of the shares) are taxed separately from income and subject co a 16 percent flat rate (Table 3, line 17). Capital gains arising from the sale of real property are taxable at a rate that

©International Monetary Fund. Not for Redistribution
154 FRANCE: FINANCIAL AND REAL SECTOR ISSUES
Table 2. Major Industrial Countries: Taxation Systems, 1991 1
France
Included with other income
Dividends Yes
Interest Yes
Capital gains Yes2
Pension 90 income
Deductions/allowances
Dividends5 Interest Capital gains
50
F 8.000
No
Withholding taxes on interest
Residents 15-509 Final Yes
Nonresidents 0-35
Other deductions/credits
Pension payments Government
social security Yes
Private pension scheme Yes
Life insurance 25
Mortgage interest 25
United Kingdom Germany
Yes Yes
Yes Yes
Yes Short-term3
Yes 60
No DM 600t6
No DM 600t6
Various OM 1 ,000
25 25 No No
�25 �25
No Limited
1 5 - 4010 No
No Limited Rental
Yes 1 1 only
United Italy States Canada Japan
Yes Yes Yes Yes
Yes Yes Yes No
Yes• Yes 75 Yes
Yes Yes 1 7 No
No No No Limited
No No No No No C$ 1 0,0007 Y 500,00()8
25 No No 20 Yes Yes
�30 0-30 25 15-20
Limited No 17 100
Limited No 17 No
L 2.5m No No Yes
L 7.0m Yes No No
Sources: International Bureau of Fiscal Documentation (19921: and Price Waterhouse (1992). 'Unless otherwise specified. numerical values are in percent of total relevant mcome. 2Substantial capital gains (exceeding F 316,900) are taxable at a fixed rate of 16 percent. 3Long-term gains on significant interests (25o/o) may be taxed. •capital gains on shares are taxed at a flat rate of 25 percent . 51n addition to an allowance for corporate taxes paid. &Total deduction is OM 600 for both dividends and interest. 7Lifetime exemption. 8Gains on long-term assets 15 years) receive 50 percent deduction. Some gains taxed at flat rate of
25 percent. "Optional. •oPercent of total •ncome. "On loans up to [30,000. t Signifies combined deduction.

©International Monetary Fund. Not for Redistribution
The Taxation of Retumsfrom Perso11al Savi11g i11 Frtmce 155
Table 3. France: Personal Taxation Calculation, 1991
1. Employment income 2. Less: social security payments 3. Subtotal 4. Dividends and qualifying interest income 5. Less: exemption 6. Subtotal 7. Capital gains on a nonsubstantial interest
in shares or bonds' 8. Pension income 9. Less: exemption 10. Subtotal 1 1 . Total 12. Income tax (impot sur le revenul 1 3 . Less: deductions: 14. 15. 16.
Mortgage interest Life insurance credit
Subtotal 17. Capital gains tax on a substantial interest
(1 - 2)
First F 8,000 (4 - 5 )
1 0 percent of (8) (8 -9) (3 + 6 + 7 + 10) Calculated on ( 1 1 ) (1 4 + 1 5) 25 percent of interest 25 percent of premium up to F 1 ,000 (1 2 - 13)
in shares and bonds' 16 percent 18. 19. 20.
Subtotal (1 6 + 1 7) Less: minoration 0-1 1 percent of (18) depending on level Less: dividend tax credit (avoir fiscal)
21 . Less: investment credit 22. Subtotal 23. Final withholding tax (prelevement
liberatoire) 24. Social surcharges: 25. Contribution sociale generalisee
26 27. 28.
Complementary contribution Social tax Total
50 percent of dividends 25 percent of investment up to F 2. 500 (1 8 - 1 9 - 20 - 2 1 ) 1 5 to 5 0 percent of interest
depending on debt instrument (25 + 26 + 27) 1 . 1 percent on all income and capital
gains 1 percent on all income 1 percent on all income and capital gains (22 + 23 + 24)
Source: International Bureau of Fiscal Documentation (1992); and Price Waterhouse (1992). 'A substantial interest exists when transactions exceed F 316,900 per year or the taxpayer holds
25 percent or more of the shares.
declines with the length of time for which the asset was held. The sale of a principal residence is rax exempt. There is also a 0.6 percent habitatio11 rax on income, which is withheld ro benefit local authorities, and a wealth tax of 0.5-1.5 percent is imposed on wealth exceeding F 4,390,000.
Exemptions from Taxation of Returns from Saving
Exemptions from taxation of returns from saving are far more extensive in France than in other major industrial countries. Where there are exemp-

©International Monetary Fund. Not for Redistribution
156 FRANCE: FINANCIAL AND REAL SECTOR ISSUES
tions in other systems, these generally apply to government savings instruments where the funds are at the disposal of the government, rather than to instruments in private institutions. The brief list of exemptions for the other major industrial countries is presented in Appendix I and should be compared with the following description of the extensive system of exemptions in France.
In addition co the general exemption on interest and dividend income (of F 8,000) mentioned above, and the fJVOir fiscal on dividend income, there is a range of deposit interest income that is completely tax exempt (including from the social surcharges, line 24 of Table 3). The principal instruments are listed in Table 4, where the instrument is defined, and the maximum interest income or deposit that is free of taxation is noted.8 The relative magnitudes of the funds invested in the various instruments as at the end of 1992 are also supplied and some additional provisions are noted.
The livrets A et ble11s are designed to reallocate funds, via a government credit agency, to some socially desirable function. They each paid an interest rate of 4.50 percent as at the end of 1991. Comptes and plans d'tporglltlogmwll are intended ro encourage saving for housing and offer rates ranging from 2. 75 percent co 6.00 percent.
CODE VI (comptes pour le dtveloppemmt industtiel) accounts were created with the objective of providing financial and rax incentives for small and medium-sized firms (petites et moymties entrepnses, or PMEs). They are special tax-exempt accounts, which pay a fixed interest rare (4.50 percent as at the end of 1991), and whose funds are reserved for loans to PMEs. In August 1991 the ceiling on deposits was raised ro F 15,000 (from F 1 0,000), and the rare of interest charged to PM Es was lowered to 8. 75 percent (from 9.25 percent).
M urual funds or OPCVM (organismes de placemC11ts collectifs en voleurs mobilieres), comprising SICAV (socittis d'iflvestissement a capital variable) and FCPs (jonds commu11S de plocmmll), have been established and exonerated from taxes on income earned since January 1989. Tax-free withdrawals are limited ro F 325,800 per year (as at the end of 1992). High money market rates have led to a substantial increase in money market mutual funds, which reached F 1,300 billion in April 1993 (from about half that level at the beginning of 1990), and the tax-free limit (on withdrawals from money marker funds only) was halved as of January l, 1993.9 Withdrawals
81n addit ion to the instruments listed in Table 4, a number of government bond issues have. from time to time. been exempted from taxation.
9This limit will not apply. however. to funds transferred to specified long-term mutual funds or invested in bonds to finance privatization (bons Ba/ladur) before the end of 1993.

©In
tern
atio
nal M
onet
ary
Fund
. Not
for R
edis
tribu
tion
Ta
ble
4.
Fra
nc
e:
Ta
x-F
ree
Sa
vin
gs
In
stru
me
nts
an
d F
ina
nc
ial
Ag
gre
ga
tes
, 19
92
Mon
etary
Ta
x .free
In
teres
t Ce
iling
H
oldi
ng
Bala
f'IIOe
Percen
t of
Growth
Rate
A
ggreg
ate
Inst
rumen
t Rate
Cf
,000
) Pe
riod
(F
im.)
Agg
regat
e (in
perc
ent)
' R
emar
ks
M2
-M
1 1
.20
2.1
100
.0
-3
.0
�
:::,.;:
...
Orcfi
na
ry d
ep
osi
t ac
co
un
ts h
ave
�
�
Liv
rets
A e
t bleus
4
.5
100
.0
73
8.4
6
1.4
-
3.9
si
m�a
r ra
tes
. ':
::. ..
...
Livre
ts C
OD
EV
I 4
.5
15
.0
91
.9
7.6
2
.1
Fu
nd
s to
b€ne
frt
PM
Es
. <:;
· ::
::
Aft
er
1 Yz
yea
rs. g
ain
rig
ht
to
�
Com
pte
s d
'ep
argn
e-lo
w-i
nte
res
t m
ort
ga
ge
. ::
:.::. �
log
emen
t 4
.0
150
.0
1.5
12
5.0
10
.4
4.2
So
me in
tere
st p
aid
by s
tate
. 1:
:::
:::2
Livre
ts d
'eparg
ne
<::;
�
popu
faire
5
.5
100
.0
75
.0
6.2
O
nly
low
-in
com
e p
erso
ns.
""
�
M3
-M
2
2,5
89
.8
100.0
12
.5
'""i::
�
OP
CV
M (
mo
ne
y
Ce
iling
ha
lVe
d f
rom
�
�
mark
et
fun
ds
} 3
25
.8
1.4
82
.3
57
.2
14.
3
Janu
ary
1. 1
99
3.
::::
':::.
.....
M4
-M
3
55
.1
100.0
1
2.2
�
�
-
-
Pl
(Ho
us
ing
�
-
. s
av
ings
::
::
pla
ns)
: 1.
044
.2
100.0
13
.9
'"l-:1
�
Livre
ts d
'epargne
..
..
en
treprise (L
EE
I 5
.5
0.6
0
.1
-2
6.7
�
Aft
er
four
ye
ars.
ga
in r
igh
t to
Pla
n d
'epargne-
low-i
nte
res
t m
ort
gag
e.
fogem
ent I
PE
U
6.0
4
00.0
4
.0
48
2.5
4
6.2
4
.3
So
me
in
tere
st
pai
d b
y s
tate
. (1
1 -.
.J

©In
tern
atio
nal M
onet
ary
Fund
. Not
for R
edis
tribu
tion
Ta
ble
4 (
con
clu
de
d)
�
U1
co
Mo
nela
ry
Tax
-Free
In
teres
t Ce
iling
H
old
ing
B
ala
ooe
Perc
ent
of
Gro
wth
Ra
te
Ag
greg
ate
lnstru
me
rrt
Ra
te
!F .0
00)
Peri
od
!Fb
n.l
A
gg
reg
ate
(in
perc
ent)
' R
em
arks
Plan
d'eparg
ne
To e
nc
ou
rag
e lo
ng
-te
rm s
avin
gs
�
popu
laire
{PEP
} 60
0.0
8.0
2
74
.2
26.3
3
8.3
but
can
borr
ow a
gai
nst.
�
�
Insu
ran
ce
::
:.
com
pan
ies
57
.2
5.5
3
5.5
�
'
Ba
nk
s 2
17.0
2Q
.8
39
.1
;;:;·
::,
<:>
P2
18o
nds)
2
,13
8.0
100
.0
12.0
�
�
�
lif
e i
nsur
a ne
e
Tax
de
du
cti
oo o
f 2
5%
of
an
nui
ty
....
:::
<.-.
rese
rve
s 9
18.0
4
2.9
1
9.3
u
p to
F 4
000.
�
OP
CV
M (
boo
dsl
325
.8
54
5.0
2
5.5
6
.5
<::
:::=
P3 (
Sh
are
s)
11
,11
5.0
\00
.0
1.6
�
;).
O
PC
VM (
shar
es
) <:)
3
25
.8
195
.0
1.8
-
2.0
�
::,
?tan
d'eparg
ne e
n .._
actions
(PEA
l 60
0.0
6
.0
Intr
odu
ce
d a
t e
nd
-19
92
. f?
�
Mem
orand
um it
ems
'·
�
Pe
rcen
t of
agg
reg
ate
s e
xem
pt
'·
:::
frorn
ta
xat
ioo2
�
P3
-M
1 2
6.1
� ::
:
P2
-M
l 64
.7
�
Sour
ce: Ban
que
de Ff
ance.
Arvmal
Report 1
992.
'Nomina
l growt
h in
1992
. 2�
ing 00
�ce
m ol
life
llSura
nce taX
lree.

©International Monetary Fund. Not for Redistribution
The Toxotior1 of Retums from Perso11ol Sovi11g itl France 159
beyond the ceiling are taxable at the IS percent flat rate (on negotiable securities) plus the three social taxes (including the CSG).
The substantial increase in money market mutual funds led ro a concern that there had been a substitution of short-term for long-term savings. In response, a tax-free deposit at savings institutions (the plan d 'iporgru populoire, or PEP) was introduced in 1990 to encourage longterm savings, but this meant that dividend income was then at a disadvantage. To rectify this, PEA (pla11 d'iparg11e et1 actions) mutual funds were introduced with similar incentives for share investment in 1992.
PEP accounts were introduced on January 1, 1990 (to replace an old age saving scheme) and experienced substantial growth in 1992. They are offered by (approved) banks and insurance companies only, and the funds cannot be withdrawn for eight years (an account can only be open for ten years). They were designed to promote long-term saving, earning an annual interest rate of 5.50 percent as at the end of 1991 (subsequently raised ro 9 percent), and the maximum deposit is F 600,000 (or double for a married couple).
PEA mutual funds were introduced in October 1992, and were designed to encourage savings in shares. They are limited to F 600,000 per individual (or F 1 .2 million per household) and are held with (approved) institutions. They are exempt from taxation on dividends and capital gains if held for six years and cannot be held for more than eight years. They were intended to "level the playing field" because the PEP had changed the incentive structure away from investment in shares.
The combination of the measures outlined above allows investors in France to avoid virtually any taxation on returns from saving. However, as is demonstrated in Section III, the system is unlikely to be successful in achieving its goals, and a general review of those goals and the manner in which they might be achieved is warranted.
I l l. A General Review of the System of Taxation of Returns from Saving
A few general points regarding the overall structUre of the system, and the effect of changing financial circumstance, are warranted before the effect of exemptions for specific instruments is examined.
Overall Taxation of Returns from Saving
The application of a final withholding tax on resident interest income is also found in three other European countries-Belgium, Greece, and Portugal (Gardner ( 1992), p. 60). There are two aspects to the process of capi-

©International Monetary Fund. Not for Redistribution
1 60 FRANCE: FINANCIAL AND REAL SECTOR ISSUES
tal liberalization and financial market integration in Europe that have severely constrained individual countries in levying taxes on interest income of resident individuals, and prompted the introduction of final withholding taxes. First, the ability of funds to flow across borders without detection has been eased, and it is more difficult to apply the residence principle of taxation whereby taxes are levied by the country of residence on an individual's global income. In these circumstances, an investor may only have to pay the foreign withholding tax on interest earned abroad and, unless there is a final withholding tax in the country of residence, resident investors will have to pay higher marginal income taxes at home. Unless there is an equivalent (or lower) withholding tax at home there will be an incentive for residents to invest abroad. The second problem is that, in the absence of harmonization of withholding tax rates on returns from saving across different countries, there may be competitive reductions of withholding tax rates as countries attempt to attract foreign funds. This would reduce the tax take for all countries (see Gardner (1992)).
France has responded by lowering withholding taxes, but still has one of the higher withholding tax rates on interest income in Europe. However, the increasing reliance on tax exemptions may also have been a response to the fact that withholding taxes in some countries (most notably Luxembourg) are set at zero. The efficacy of specific exemptions is examined below but, more broadly, agreement between EU countries on a minimum amount of withholding of tax or on the reporting by financial institutions would be desirable.'O
With such considerations pertaining to interest income, and because capital gains and dividend income are taxed at marginal tax rates, interest income receives a significant tax advantage over other forms of revenue from savings. Retained corporate earnings, which should ultimately produce a capital gain for individuals when shares are sold at a higher price, are effectively taxed at the marginal rate of taxation (unless a substantial interest is held) and this is a disincentive to investing in shares.
Effects of Exemptions
Most studies of the taxation of returns from saving have been conducted at an aggregate level where an optimum uniform rate of taxation can, at least in theory, be determined. Taxing income from savings will generate revenue but will also reduce the availability of savings at any
10The Belgian Prime Minister has indicated his intention to try to establish a universal withholding tax of 15 percent in Europe (L'Echo (1993)).

©International Monetary Fund. Not for Redistribution
The Taxation of Retums from Perso11al Savi11g i11 France 161
given interest rare and (by shifting a savings function inward) result in a reduction in capital accumulation and productive capacity. The optimum level of taxation will be determined in the context of this trade-off between tax revenue and productive capacity. It will also be influenced by similar decisions regarding the taxation of other bases (income, consump
tion, and wages) that cause other distortions. Auerbach and Kotlikoff (1987), for example, examine such questions in a dynamic setting where overall welfare is maximized by limiting the distortions tO economic growth that are caused by the combined rates of taxation.
There is a second (interrelated) level at which decisions regarding taxation of income from savings must be made, however, and this is the degree to which preferential tax treatment is given tO specific sources of returns from saving. This is particularly applicable ro France, given its wide range of tax exemptions, and these have become increasingly distortional over time as the financial circumstances in which they were introduced have changed. A simple analytical model is presented in Appendix II and can be used to support four basic points relating to the adaptation of the French system of taxation of returns from saving to financial and capital liberalization.
First, the pressure of competition from foreign financial instruments (including SICAVs) bearing flexible interest rates has prompted the introduction of domestic competitors. These have been afforded tax exemptions similar tO those of the pre-existing regulated instruments. Liberalized financial instruments bear higher interest rates, bur have lower nonpecuniary advantages such as acquired rights to mortgage financing or simple convenience. However, because the same system of tax advantages is applied ro both, and because this alleviates taxes on interest income, ir will acwally serve to increase the relative incentive to invest in the (higher-interestbearing) liberalized instruments. This obviously frustrates the original intention of offering tax exemptions tO regulated instruments.
Second, to the extent that a system of tax advantages for regulated instruments still exists, but in a liberalized financial setting, this causes larger distortions tO preferences than existed in the old system where tax advantages were assigned solely to certain regulated instruments. This is because the range of instruments available has increased. Also, because the new instruments (certificates of deposit, for example) generally bear higher
interest rates, there will be increased incentives to incur transactions cosrs and switch between instruments in order ro rake advantage of tax breaks, and then borrow against the regulated (and tax-exempt) instrument. It is possible, for example, to use a PEP as collateral against a loan. More generally, a system of preferential tax incentives is nor compatible with financial liberalization that allocates funds on the basis of market incentives.

©International Monetary Fund. Not for Redistribution
162 FRANCE: FINANCIAL AND REAL SECTOR ISSUES
Third, to the extent that one of the goals of policy is to encourage increased savings by providing tax incentives, a system of specific exemptions will increase the incentive ro incur transactions costs (as outlined above) and these will commensurately reduce the overall increase in rhe return to saving provided by the tax exemption. This results in a worsening of the trade-off between tax revenues and the levels of saving and capital accumulation. More significantly, perhaps, it can cause substantial economic losses for individuals by increasing the economic costs associated with acquiring the preferred set of instruments.
Fourth, the application of thresholds ro fiscal exemptions can be selfdefeating. Exemptions are secured by allocating funds to different financial instruments, up to the extent of the ceiling established, and this means that, while there is an incentive to allocate funds ro specific instruments, there is also an incentive co allocate to ochers (with exemptions) when the ceiling is reached. Thus exemptions that aim to favor one instrument may frustrate the incentives to invest in another.
The original set of tax exemptions was introduced in an attempt to increase the effective return on savings available and reallocate savings coward some specific regulated instruments. This was successful in a regulated environment even though ir did cause financial distortions. However, the successive introduction of financial and capital liberalization serves co increase the distortions caused by tax incentives and ultimately to frustrate the original policy goals. This is because a third goal of policy has been implicitly added to the original two, which is co limit the extent of intermediation occurring abroad, and the third is not compatible with reallocation coward a specific regulated domestic asset. Furthermore, financial liberalization involves the implicit expression of a fourth goal of policy, which is to allow capital markers co allocate funds freely and take advantage of market efficiency. All four goals cannot be simultaneously retained.
The lesson from this is that, because of the possibility of funds flowing to foreign (and effectively tax-free) financial instruments, the goal of reallocating toward specific domestic instruments must be relinquished. Henceforth, the maximum rate of taxation must be dictated by what is possible in the context of liberalized capital markets and, thereafter, the same rare of taxation should be applied to other instruments. If reallocation is attempted through lower tax rates on specific instruments, this will cause distortions that are far larger than in a regulated financial environment. The effectiveness of attempts to introduce specific incentives is diminished in a liberalized setting, which is a strong argument for a uniform system of taxation that will allow the relative benefits of instruments to attract investors. Overall, rax advantages will aggravate allocarional distortions and are less likely ro succeed in a liberalized financial environment.

©International Monetary Fund. Not for Redistribution
The Taxati011 of Retums from Perso11al Savi11g in F ranee 163
The extent of returns from saving relief is accentuated by the range of instruments that are exempted. This allows savers w reallocate savings instruments in response to changing market and interest rate conditions. This has been a principal feature of the French system in recent years with large-scale fund reallocation in response ro changing market conditions. There are many other fiscal incentives roward savings involving exemptions for life insurance contributions, pension contributions, moregage interest relief, and flat rate taxes on capital gains on a substantial interest. These incentives generally cake the form of exemptions from direct taxation and provide further avenues to protect income from savings from any real taxation. There are also subsidized interest payments on certain instruments (see Table 4).
There are a number of other distOrtions caused by a system of tax exemptions, which detract from an efficient allocation of savings and increase transactions costs.
A number of incentives (e.g., PEP and PEA) are offered on instruments that lock in funds for a particular time period. These are designed to increase the term for which savings are undertaken. This intention is, of itself, questionable on the basis that individuals may have a preference to maintain a flexible portfolio in case financial circumstances change. In reality, however, it is possible to borrow using these funds as collateral, and the lock-in effect only serves tO increase transactions costs. This is a prime example of the type of problem referred to above.
Financial intermediaries are faced with difficult planning decisions because many of the specific instruments are offered only by specific financial institutions, and there are large flows of funds between instruments in response w changes in fiscal regulations and market conditions. For example, banks cannot offer livrets, and these are likely to become more popular as shore-term flexible interest rates decline. This frustrates attemptS at financial planning where large-scale balance sheet changes can occur in response to fiscal incentives.
IV. Conclusion and Recommendations
The overall conclusion from the foregoing is that the system of taxation of returns from saving in France is overcomplicated and produces less revenue than in other major industrial countries. At the same time, many of the goals of the system have been frustrated by financial and capital liberalization. The present system has been overtaken by financial developments but has not been subjected to review. Instead, a plethora of exemptions has successively reduced tax revenue from savings without necessarily achieving its assigned objective.

©International Monetary Fund. Not for Redistribution
164 FRANCE: Fl ANCIAL A D REAL SECTOR ISSUES
A complete review of the system should consider the following poinrs: First, the goals of the system of taxation of returns from saving should be clearly expressed and ranked with reference ro several considerations. If the system aims at securing a high level of revenues, this should be exercised in the most efficient manner, and would involve minimizing the set of potential loopholes when exemptions are employed to avoid taxes. At the same time, if the system aims to minimize che disincentives to saving, it should avoid introducing unnecessary transactions costs that are caused by the same exemptions. The elimination of exemptions would also enhance the efficient allocation of savings ro their most desirable ends by allowing the liberalized financial system ro operate. one of these intentions is consistent with attempts ro allocate funds roward specific financial instruments, and this latter goal of policy is only achieved at a high cost in terms of sacrificing the others.
Second, in a liberalized financial system the practice of granting a range of specific tax exemptions can be counrerproductive in terms of reallocating savings. Exemptions should be considered in a general conrext, where their full effects are taken inro account, rather than in terms of the effects they would have in isolation. This would lead to a more general appreciation of their shortcomings.
Third, the most overriding argument for eliminating a system of specific tax incentives is that they can significantly increase transactions costs. These costs are likely to have increased with financial liberalization and detract significantly, and unnecessarily, from the benefits of market allocation.
Fourth, ro the extent that an incentive is considered desirable for small savers, the universal tax exemption (of F 8,000) would serve as a more effective incentive. A reduction in transactions costs would increase the return from savings and this exemption could, if considered desirable, be extended.
Fifth, and more generally, a more uniform tax code should be used to reduce the disadvanrage accorded to dividend income and retained earnings. This would be preferable to the inrroduction of schemes such as the PEA to encourage investment in shares.
Appendix I
Exemptions to Taxation of Returns from Saving in the Major Industrial Countries
Canada: Contributions to a number of registered savings plans are deductible for tax purposes.

©International Monetary Fund. Not for Redistribution
The Taxation of Retums from Personal Saving i11 F ranee 165
Germany: In general, interest income is not exempt although there are some exemptions granted for interest deriving from certain favored sources, for example, interest from qualifying life assurances, and Government-inscribed debt. In general, an allowance of DM 600 is granted tO individuals (DM 1,200 for spouses filing a joint return).
Italy: An exemption from taxes on income is granted with respect to interest on Treasury bonds, Post Office bonds, and some other public debt instruments. In addition, exemptions apply to some specialized public bonds issued under laws aimed at encouraging investment in certain industries or regions.
Japan: Interest received on certain government bond issues is exempt.
United Kingdom: Each individual is exempt from income tax on the first £70 of interest received on deposits at the National Savings Bank and on all interest received on limited holdings of National Savings certificates. With a personal equity plan (PEP) an individual may invest up to £6,000 per year in an investment fund PEP and £3,000 in a single company PEP, both investments being exempt from income tax and capital gains in the hands of the PEP investor.
United States: Interest on federal obligations of the United States has been subject to income tax since 1941 (with one minor exception). Interest on debt instruments issued by the states is exempt from federal taxes if they are issued for government activities, certain environmental activities, or for mortgage subsidies. Tax shelters can be used to offset taxes on passive investment income only.
Appendix I I
An Analysis of Exemptions from the Taxation of Returns from Saving
This appendix will attempt to demonstrate why a uniform tax rate on returns from saving is preferable to a system of specific provisions and exemptions. It does this by developing simple measures of both the incentives and distortions generated by specific provisions in the same analytical framework. In general, attempts to reallocate savings toward specific financial instruments will be less effective in terms of increasing the return on savings, and will cause greater distortions, than a generalized tax exemption aimed at increasing the rate of return on savings. This result is

©International Monetary Fund. Not for Redistribution
166 FRA CE: FINANCIAL AND REAL SEC'T'OR ISSUES
likely ro be screngthened with financial liberalization. Furthermore, attempts ro reallocate toward a specific regulated financial instrument may be counterproductive.
Four points regarding the effectiveness of, and distortions resulting from, a system of specific provisions are demonstrated:
( 1 ) a tax exemption introduced ro benefit a particular financial instrument, even in a regulated financial environment, may not be fully reflected in an increased after-tax return on savings. The incentive effects will be offset ro the extent that transactions costs are incurred in capturing the tax advantage but then reasserting individual preferences for an alternative instrument;
(2) a system of individual thresholds on tax exemptions, instead of a generalized exemption on all instruments, will increase the likelihood that these transactions costs are incurred and will therefore have a smaller impact on the rate of return on savings;
(3) the incentive co incur transactions costs, and therefore the level of transactions costs affecting the system, increases with the extent of financial I iberal ization; and
(4) the introduction of a system of generalized exemptions in a liberalized financial system can lead co results that are contrary to their original intentions.
A Regulated Financial Market-Instruments Bearing the Same Rate of Financial Return
Consider a setting in which there arc two financial instruments (A and B) available. Each receives the same rate of (fixed) financial return (i•) but has, in addition, a different set of nonpecuniary advantages to the representative agent (respectively, 00 and a6 for each instrument). Assume, for simplicity, that the nonpecuniary advantages are constant (i.e. that they do not diminish with an increase in the holdings of a particular instrument). Then the representative agent will hold all of one instrument (there will be a corner solution), depending on the rotal (pecuniary and nonpecuniary) rota I returns (r0 or r1), where
and
is the relative return ro instrument A.

©International Monetary Fund. Not for Redistribution
The Toxoti011 of Returns from Personol Saving in France 167
Chart 3. Attainable After-Tax Rate of Return
•
•
• •
• •
i * ( 1 - -r) + ab
• •
• •
•
•
•
•
• •
• • •
• • A A"
•A·
i * (1 - -r) + a, i * +a,
I< i * -r >I I< ; * -r - 4> >I< 4 »1
I< a, - ab >I
r,
Assume also that the overall level of savings will depe,nd on the return received on the chosen instrument {s (r), where <10 - <1" > 0,
S = s (r0), where <10 - <10 < 0.
Returns from saving are initially taxed at a rate 't but a tax exemption is offered to instrument B both to increase the overall level of savings and reallocate savings toward B. Therefore, the rotal after-tax rates of return are
ro = i'"(l - 't) + <Jo
and the relative return on B becomes
rb.a = i'"'t - (oo-<J/J).
Chart 3 (where the diagonal lines are at 45°) describes the options available to the investor under the assumption that <10 - ob > 0. Initially, funds

©International Monetary Fund. Not for Redistribution
168 FRANCE: FINANCIAL AND REAL SECI'OR ISSUES
Table 5. Effects of Tax Exemption with Regulated Market
{i) Return on savings:
Iii) Final reallocation toward instrument B:
{iii) Distortion:
i•t - {o. - o,). where $ > o.- ob.
i•t-$. where $ < o.- ob.
are allocated at point A. Then, with a tax exemption available on B, funds are switched ro B. However, there is another alternative available, which is to take advantage of the tax exemption on B, and then borrow funds against this deposit and redeposit in A (to take advantage of higher nonpecuniary gains). If borrowing and lending rates are the same, and there are no intermediation or transactions costs, this would allow the investor to move to point A'. There will, however, be costs incurred on such a transaction (cj>) and these will limit the investor's ability co move to point A'. The higher the costs, the more the invesror's maximum possible return (at some point A" ro the left of point A') is reduced. The maximum return is reduced ro i• + 00 - cj>. If cp exceeds 00- ob (which is the return at point A' less the return at point B) no switching for tax purposes will occur and the invescor retains instrument B only.
This setup permits a breakdown of the tax reduction (i•'t) inro two components: the effective increase in the rate of return on savings (i•'t- cj>), and transactions costs (cj>). The maximum transactions costs incurred will be 00- o6. This also allows one to assess the cost of the discortion co preferences caused by the tax incentive, if these are defined as the maximum transaction costs that an investor will be willing ro pay to reassert his preferences, after taking advantage of the tax break.
The effects of the introduction of the tax incentive are summarized in Table 5 in terms of (1) the increase in the rate of return on savings (which will increase the overall level of saving); (2) the influence on a final reallocation toward instrument B (which is only achieved if the original set of preferences is not re-established); and (3) the distOrtion caused (as here defined). The attempt to increase savings is unambiguously successful and a final reallocation roward instrument B will succeed, in spite of causing a disrortion, if intermediation costs are sufficiently high relative to the distortion. In general, the smaller the distortion, the more successful is the policy in terms of increasing the savings rare and reallocating toward

©International Monetary Fund. Not for Redistribution
The Taxation of Returns from Persot�al Savi11g it1 Fra11ce 169
Table 6. Effects of General Tax Exemption with Regulated Market and No Threshold to Exemptions
(i) Return on savings: i"T. (ii) Final reallocation
toward instrument 8: no switching.
(iii) Distortion: 0
Table 7 . Relative Returns on Financial Instruments (Relative return on instrument in row over column)
(a). With Tax Exemptions for B and D.
Instrument: A
1 . A ;"(1 - T) + a.
5. B ;•-rL(o.- o0)
9. c (i- i")(1 - T)
- (o.- oe)
13. D iT + i- ; •
- (o.-od)
(b). With No Tax Exemptions.
Instrument: A
1 . A i"(l -T) + a.
5. B -{o8-o0)
9. c (i- ;•)(1 - T)
- (o.-oe)
13. D (i- ;•)(1 -T)
- (o.-od)
B
2. (o.-ob) - i"-r
6. ;• + Oo
10. . . .. -It+ 1 - 1
- (ob-oe)
1 4. i-i" - (ob-od)
B
2. o.-o0
6. ;•(1 - T) + ob
10. (i- i.)(1 - t)
-(ob-oe)
14. (i-;•)(1 - T)
- (ob-od)
c D
3. 4. - (i- i")(1 - T) ·• a.- ad+ 1 T
+ a.- a. - (i- ;•) 7. 8.
ab-o• + iT -(i- i•)
ob-od - (i- i•)
1 1 . 12. i(1 -T) + a. a.-ad- iT
15. 16. iT- to.-od) i+ ad
c D
3. 4. o.-o. o�-od
- (i - i. ) ( 1 - t) -{i- i")(1 - t) 7. 8.
ob-oe ob-od - (i- i") (1 -T) -{i- i•) (1 -T)
1 1 . 12. i(1 - tl+oc a.-ad
15. 16. -{o.-od) i(1 - tl+od

©International Monetary Fund. Not for Redistribution
170 FRANCE: FINANCIAL AND REAL SECr0R ISSUES
instrument B. However, there are costs ro the policy, in addition ro the foregone taxes, which arc the smaller of the allocational distortion and transacttons costs.
The Problem with Thresholds on Exemptions
In a setting similar to that above, but with a general tax exemption and without thresholds assigned ro specific instruments, rhe invesror can choose the instrument upon which to obtain the rax advantage. ln these circumstances there will be no distortion caused by the tax incentive, no transactions costs will be incurred, and the full extent of the tax incentive will accrue to the rare of return on savings. This is outlined in Table 6.
Distortions with Financial Liberalization
Financial liberalization will increase the range of instruments available to savers and these will be at a flexible and higher rate of interest. An analysis similar ro that conducted above can be used to analyze rhe potential success and costs of an attempt to reallocate from a liberalized instrument bearing the higher rate of interest (instrument C) to the regulated instrument (instrument B). The own and relative rates of return on these instruments, with and without tax exemptions, are presented in Table 7(a) and (b) respectively. The tables present the own rate of return on the relevant instrument in the boxes on the downward-sloping diagonal and the relative rate of return from the instrument on the row, over that in the column, in the other boxes. This, by fol lowing the argument above, allows one ro draw the following summary (Table 8):
Table 8. Effects of Tax Exemption with Financial Liberalization
(i) Return on savings:
(ii) Final reallocation toward instrument B:
(iii) Distortion:
i"t- (i- ;•) + (crb- a c)• where 4> > (i- i") - (crb- a c).
;•, - 4>. where 4> < (i- ;•) - (crb- a c).
iff 4> > (i- i") - (crb- Oc). (i- i") - (ob- crcl·
Note that the policy can again succeed in reallocating savings toward instrument B in spite of causing a distortion. However, with a larger increase in interest rates following financial liberalization (i - i"), the policy is less likely to work and the distOrtion is greater. Again, a final reallocation will only occur to the extent that transactions costs exceed the

©International Monetary Fund. Not for Redistribution
The Toxarion of Retumsfrom Personal Saving in France 171
Table 9. Effects of Tax Exemption with Capital Liberalization
Return on savings: ti • - (i- i•) + (ab - a0). where <1> > t{i- i •1 - (ab - a0).
it.
Reallocation toward instrument B: iff q, > tU- i '") - (ab - a.l.
Distortion: t(i- i ") - (ab -a.).
distortion. On the other hand, if the incentive to reallocate coward instrument C is sufficiently large relative ro <P. substantial transactions costs will be incurred.
Distortions with Financial and Capital Market Liberalization
The effect of capital liberalization and market integration has been to severely limit the tax rate that can be imposed on the liberalized financial insrrument. This is because it now comperes with similar instruments abroad that may effectively bear only a limited withholding tax. As a result, a third goal of policy is now introduced, which is to limit the extent of financial intermediation of domestic financial assets occurring abroad. This was the case in France where exemptions were granted to SICAVs so that they could compete with similar foreign instruments. However, this has meant that the pre-existing system of granting tax exemptions has perverse results in terms of reallocating resources toward regulated domestic instruments.
If a financial instrument with a free interest rate and a tax exemption (instrument D) is introduced, for the purpose of limiting the flow of funds abroad, the effect of the tax exemptions on instruments D and B is ro i11creose the relative preference for instrument D over the regulated domestic instrument B. As is evident from Table 7, the relative preference for instrument D with tax exemptions [(i - i"'}-(00- od), from Table 7(a), box 14) is greater than without tax exemptions [(i - i"')(l - 't)- (o0 - od), from Table 7(b), box 14). Thus, the system of tax exemptions has become counterproductive as regards allocating toward regulated domestic instruments, and the exemptions reduce the likelihood of a reallocation coward instrument B. These results are summarized in Table 9. The distortion introduced between these instruments amounts ro 't(i - i"') -(o6 - od) and increases with the tax rare. However, it is lower than for a liberalized financial instrument with no rax exemption (instrument C) because both instruments (B and D) are given the same tax treatment.

©International Monetary Fund. Not for Redistribution
172 FRANCE: FINANCIAL AND REAL SECTOR ISSUES
References
Auerbach, Alan ]., and Laurence Kodikoff, Dynamic Fiscal Policy (Cam-bridge, England: Cambridge University Press, 1987).
Banque de France, Annual Report (Paris, various issues). Banque de France, Bulletin Trimestriel (Paris, various issues). France, Ministere de l'Economie et des Finances, "L'Epargne" 1n
Echanges, No. 22 (1993), pp. 1 6-19. __ , Ministere de I'Economie et des Finances, Les Notes Bleues: Projet de
Loi de Firumces pour 1993 (Paris, October 1992). Gardner, Edward, "Taxes on Capital Income: A Survey," in Tax Harmoni
zation in the European Community: Policy Issues and Analysis, Occasional Paper 94, ed. by George Kopits (Washington: International Monetary Fund, July 1992).
International Monetary Fund, World Economic Outlook: Interim Assessmmt (Washington: IMF, January 1993).
International Bureau of Fiscal Documentation, Europea11 Tax Ho11dbook (Amsterdam: IBFD Publications, 1992).
King, Mervyn A., and Don Fullerton, eds., The Taxation of Income from Capitol: A Comparative Study in the U.S., U.K., Sweder1, and West Germany: The Theoretical Framework (Cambridge, Massachusetts: National Bureau of Economic Research, 1983).
Kopits, George, ed., Tax Ham1o11ization i11 the Europeo11 Community: Policy Issues and A11alysis, Occasional Paper 94 (Washingron: International Monetary Fund, july 1992).
"La France a Ia Fiscalite de l'Epargne 'Ia Plus Aberrance d'Europe,"' Le Mo11de (Paris), June 23, 1993, p. 23.
"Le Precompte Mobilier a 15%," L'Echo (Paris), june 18, 1993, p.l. Mintz, j.M., "Comment" on Razin and Sadka, in Taxation in the Global
Ecotlomy, ed. by Assaf Razin and Joel Slemrod {Chicago: University of Chicago Press, 1990), pp. 349-56.
Organization for Economic Cooperation and Development, Economic Survry Fronce (Paris: OECD, 1992).
Price Waterhouse, Individual Taxes: A Worldwide Summary (London: Price Waterhouse, 1992).
Razin, Assaf, and Efraim Sadka, "Optimal Incentives to Domestic Investment in the Presence of Capital Flight," lMF Working Paper, WP/ 89/79 (Washington: International Monetary Fund, September 1989).
____ , "Integration of International Capital Markets: The Size of Government and Tax Coordination," in Taxation i11 the Global Eco11omy, ed. by Assaf Razin and Joel Slemrod (Chicago: University of Chicago Press, 1990), pp. 331-48.

©International Monetary Fund. Not for Redistribution
Mit}ii,Ji§;i¥!M
Some Considerations Relevant to Prefunded Pensions in France
JOAOUIM LEVY
t:� ension schemes in France have provided increasing coverage and .. benefits during the last 30 years, but their liabilities are essentially unfunded and the aging of the population has cast doubts on the long-run viability of such a pay-as-you-go system. This uncertainty has been acknowledged, but proposals made in the study published by the French authorities in 1991 (Livre Blanc sur les Retraites) were limited ro changes in some parameters ruling rhe current system and did nor include rhe implementation of prefunded pension schemes. This choice was justified by concerns about the guarantees pension funds could ultimately provide ro pensioners, income distribution, and rhe cost of financing a transition from the current system, but apparently did not consider the often salutary effects on capital markets and savings brought about by institutional investors such as pension funds. Therefore, in contrast to the situation in several other developed countries where private pension funds play an important role in providing income for retired workers, large-scale adoption of prefunded pensions in France is not yet certain.
Nevertheless, a significant number of French workers and households have shown growing interest in financial instruments rhar share several features with pension funds: they have increasingly purchased life insurance and annuities and participated in company-sponsored savings funds. Such an interest is an indication that markets may be ready for a gradual implementation of pension funds, and since recent research has shown that a transition from a pay-as-you-go system toward prefunded schemes can be achieved without hurting any generation while benefiting some, a choice in this direction may be warranted.
This chapter discusses current and forecast conditions of the pension system in France (Section I); the expansion of life insurance and other contractual savings in recent years (Section II); and aspects of a
173

©International Monetary Fund. Not for Redistribution
174 FRANCE: FINANCIAL AND REAL SECTOR ISSUES
transition toward pension funds (drawing on the experience with funds in other OECD countries), including effects of pension funds on capital markets, and suggestions on how to shift some of the liabilities of the currently unfunded schemes to funded pension funds (Section III).
I. The Pension System in France
Features of the Pension System
In France, the average standard of living of retirees improved significantly during the 1970s and 1980s, and it is equivalent to that of most working persons. Generous revaluations of benefits (30 percent in real terms since 1970), decreases in the minimum retirement age (to 60 years in most cases), as well as the possibility of cumulating pensions from different sources, removed retirees from the poorest segments of rhe population. In fact, statistics indicate that, in France, adjusted individual income peaks at age 66-70, when it is 25 percent higher than at age 31-40, and that around 80 percent of retirees' income is provided by pensions, including old age benefits (mitlitnllm viei//esse). In addition co having a relatively high income, the majority (70 percent) of those aged in the 60-70-year bracket own at least one house, in contrast co those below 40 years, who in most cases (51 percent) do not own the place where they live. This affluence does not fully extend to those older than 70, who often have lower pensions, but it suggests that during coming years the number of relatively well-off retirees will increase. This bright scenario, however, may be difficult to achieve, given the current method of operation of the pension system in France.
The French pension system comprises a large number of unfunded schemes, which grew up along occupational lines. These schemes can be broadly divided among those for private sector employees and the selfemployed, and those for public sector employees and workers in "special categories," such as railways and the merchant navy. Schemes in the first group usually comprise two levels: the basic pension (rigimc ginim/) and the supplementary pensions (regimes complimc11taires) grouped around the Association Ginirale des lnstitutio11s de Retraites des Cadres (AGIRC) for employed professionals and the Associotiotl des Regimes de Rctroites ComplimetJtaires (ARRCO) for other categories.' Contributions to both levels are
11n some cases. volumary supplememary schemes are also available. In some large companies
(especially in the oil sec10r). such schemes are similar 10 funded. defined-benefit schemes avail
able in the United States and the United Kingdom. Schemes for the public sector usually have only one level.

©International Monetary Fund. Not for Redistribution
Some Co11siderotio11s Relev0111 1o Prejunded Pensions in France 175
compulsory and subject ro ceilings (except for the additional 1.6 percent contribution paid by employers (Table 1)).2 Enterprises are required ro panicipare in an industry or assimilated scheme.
Benefits from the basic pension are determined by the number of years the beneficiary contributed, as well as by the average wage earned over a cenain number of years, indexed by either changes in price levels or average wage increases.3 Benefits from supplementary pensions are proportional to the number of points the individual accumulated before retiring. These points are usually purchased; rhe ratio between rhe annual pension each point secures and irs cost is known as the return ratio (rmdement) of contributions. Cumulation of pensions from different sources is allowed and most persons receive more than one pension: the Livre Blotrc indicates that retirees receive pensions from an average of 1 .5 basic schemes and 1.3 complementary schemes.
Contributions have risen during the last decade, and currently they average about 2.0 percent of total gross labor income. The supplementary pensions were able ro combine the increase in contributions with a fall in the effective return ratio.4 Despite these increases in contributions by workers (and, in the case of the supplementary pensions, the increasing adjustment effort by both workers and retirees), the cost of financing an increasing number of retirees for a longer period of time (due co an increase in life expectancy and decreases in retirement age) has strained the pension system in the last few years. For society as a whole, the increasing cost of pensions was reflected in the growth of pension payments, which, during the last ten years, swelled in real terms at an annual average rate of 4.5 percent, while the economy grew at only a 2.2 percent rare. These effects have been aggravated since 1991 by the slowdown of the economy.
l'Jne ceiling wage for contributions to social security corresponded in June 1994 to an annual salary ofF 152,160: ARRCO operates under the same ceiling. Contributions to AGIRC are com· puted based on wages between the social security ceiling and 4 timcs that ceiling for the so-called schedule B, and between 4 and 8 times that ceiling for (optional) schedule C.
3Pensions for public servants depend on the length of the contribution period and on wages in the last few months before retirement. Contributions to public servant pensions correspond to about 40 pereent of net salaries, with three quarters of them being financed by the state and the
rest by employees.
4The effective return ratio is defined as Vf(p a), where V i s the value of the point, p its price, and a is the call-up rate (raux d'appel), which is a surcharge on the price of the point. Not only has the price of the point increased more than its value-which has been loosely indexed to the CPI instead of to average real wages-but the call-up rate has also increased. A fall (in real terms) in the numerator is borne by retirees. and an increase in the denominator by the active population.

©International Monetary Fund. Not for Redistribution
176 FRANCE: FIN A CIAL AND REAL SECTOR ISSUES
Table 1. France: Contribution Rates to Pension Schemes (In percent of wages. 1991)
Contribution Ra te Overall Employer
General pension 16.35 8.20 scheme 1 .601
AGIRC 14.04 9.36 7.022
ARRCO 5.00 3.00
Source: Minis tere des Affaires Sociales. de Ia Sante. et de Ia Ville. 'Additional paid by employer. not subject to a ceiling. 'Supplementary pension (schedule Cl.
Medium- and Long-Term Perspectives
Employee
6.55
4.68 2.342
2.00
Simulations published in the Livre Bkmc show that by 2040 there would be between 1.3 and 1.7 workers for each retiree, compared with a ratio of 2.15 existing in the early 1990s, and that contributions would have to increase accordingly if pension benefits were to keep growing in line with wages.5 A high fertility rate and a high activity rate would each reduce the dependency ratio (the ratio of retirees per worker) by 10 points, while lower unemployment would have only a marginal impact on it. Changes in dependency ratios were expected ro require increases in contributions in a range of between 66 and 1 27 percent, implying a contribution-to-wage ratio of up to 41 percent (Table 2).6
In the absence of either increases in contributions or decreases in benefits, large financial shortfalls would develop before 2010, reaching some 370 billion of 1990 francs (about 4 percent of GOP) by that date, and worsening thereafter. These shortfalls are to be compared with a shortfall equivalent to 1 . 1 percent of GOP in 1990, and are concentrated mostly in the basic system.
The Livre BlatJc suggested three main changes in social security in order ro balance the system in 15 years: lengthening the contribution period required to obtain a full pension, lengthening the period taken into
5Simulations comprised eight scenarios. reflecting two hypotheses about fenility. labor force
panicipation, and unemployment rates. They indicate that the dependency ratio (beneficiaries/ contributors) will increase sharply after the "baby boom" generation stans to retire in 2005.
6These scenarios retained the demographic hypotheses described above, and a 2 percen t rate of growth of real wages.

©International Monetary Fund. Not for Redistribution
Some Considerations Relevant to ?refunded Pensions itJ France 177
Table 2. France: Forecasts of Dependency Ratios and Contribution Rates in the Pension System in 2040
Dependency Ratio
Low fertility High fertility
Low fertility High fertility
Contribution Rates
Low fertility High fertility
Low fertility High fertility
Source: Livre Blanc sur les Rerraires. '201 0 figures in parentheses.
Low Unemployment
Low participation High participation 0.75 0.66 0.66 0.58
High Unemployment
Low participation 0 78
High participation 0.68
0 68
(In percent) Low Unemployment
0.60
Low participation High participation 40.5 (25.1)1 35.1 (24.4) 35.4 (25.0) 30.9 (24.3)
High Unemployment
Low participation High participation 41.9 (26.2) 36.3 (25.5) 36.7 (26.0) 32.0 (25.3)
consideration when computing benefits, and indexing benefits to the consumer price level (CPI), instead of to the average wage level.7
The main suggestions in the Livre Blanc were adopted in 1993.8 However, the problems after "baby boomers" start co retire have nor been solved, and maintaining a pay-as-you-go system in the long run would still require contributions above 30 percent of gross wages, which may be infeasible. In fact, it is possible that workers and households have anticipated that, and, taking advantage of capital market liberalization and low inflation (which increased the supply of financial instruments and reduced the risk of inflationary depreciation of rerurns), looked for options in the private sector even in the absence of private pension funds as they exist in
7The Livre Blanc focused its auention on the basic system of social security (basic pension) leav· ing the regimes speciaux (including that for public servants) and the supplementary pensions in the background, in pan because some in the first group will be absorbed by the basic system in the long run, and those in the second group are managed by autonomous bodies (ARRCO and AGIRC).
8They comprise the indexation of pensions to the CPI instead of wage growth, the gradual increase in the contribution period for a full pension from 37.5 to 40 years (over the next 10 years)
and in the period used for the computation of the average wage from the best I 0 years to the best 25 years (over the next 15 years).

©International Monetary Fund. Not for Redistribution
178
Life insurance
Annuities
FCPEs
FRANCE: FINANCIAL AND REAL SECTOR ISSUES
Table 3. France: Stock of Financial Assets (End of period. in billions of francs)
1991 1992
778 942
248 273
80 92
Memorandum items M3 5,160 5,429 Usted shares 1 ,635 1,619
Source: Banque de France.
1993
1 '151
298 1 1 7
5,350 2,120
other countries.9 The next section provides an overview of the savings institutions recently favored by workers and households in general. This analysis is followed by a discussion of aspects of a transition to prefunded pens10ns.
I I . Company-Sponsored Funds and Life Insurance in France
In discussing rhe possible effects of pension funds I t 1s 1mponanr to emphasize that there have been profound changes in French capital markets in the last few years.10 Among the changes discussed in this section are the growth of life insurance and company-sponsored savings plans (FCPEs, or jo11ds commutlS de placement d'entreprise-a sort of closed-end mutual fund-and PEEs, or pla11s d'epargt1e d'mtreprise). Because some of their features are similar tO those of pension funds, and because they are provided by the private sector, both instruments are often considered attractive starting points for the establishment of a widespread system of pension funds in France.1 1 Their growth in recent years has been strong, and their assets correspond to about 20 percent of G DP (Table 3).
91n 1992, for instance. households directed almost half of their net saving toward the purchase of life insurance and annuities.
10See Zerah and Aucoin ( 1993) for an account of the liberalization process. 11The popularity of both PEEs and I ife insurance reflects not only the fiscal advantages granted
to these instruments. but also public trust in financial markets, and. in panicular, in basic mecha
nisms of defined-contribution pension funds. including protection from inflation. As in the United States, life insurance policies in France can be liquidated during the lifetime of the policy holder, and hence are mainly viewed as a savings instrument, not necessarily related to a bequest motive.

©International Monetary Fund. Not for Redistribution
Some CoT�sideratiotiS Relevat1t to Prifu11ded Pmsiot1s ;,, Fmt�ce 179
The Life Insurance Sector
Life insurance policies and annumes absorbed abour 60 percent of household financial saving in 1993, reflecting the growth of the sectOr in recent years, which can be attributed to three main factOrs: financial liberalization in the 1980s, tax advantages, and a new perception of the longerterm needs of workers.t2
The first factor leading to growth in the life insurance industry was the permission granted in 1985 to banks and ocher financial institutions tO sell insurance policies through their insurance subsidiaries (and the liberalization of the type of product that could be offered).13 Currently, these subsidiaries represent about half of the market. Competition has not only increased the volume of retail outlets, but also the yield provided by the average policy, which passed along the high interest rates available in recent years. The second factOr comprises an income tax deduction (prime) proportional to the amount invested and the income tax exemption of capital gains on savings held for at least eight years, as well as favorable treatment of bequests.t4 The fiscal expenditure implied by tax-exempting returns on long-term savings in France can be roughly estimated to be around F 20 billion a year; the budgetary cost of tax reductions is of the same order of magnitude.l5 Together, they correspond co about 5 percent of the revenues generated by the income tax. The third factor reflects the concern of economic agents about their future income, and the desire of chose already owning a house to diversify their assets.
Recent changes in life insurance regulations are expected to increase the length of contracts and the demand for life insurance in coming years, without adding fiscal incentives. A fidelity clause allowing insurers to offer
12Life insurance accounts for about 15 percent of household financial savings. permitting more than 40 percent of households to have some coverage and putting France among those EU countries. including the United Kingdom and the Netherlands. with the highest per capita premiums (France (1993)). Growth has been steady but strong, with annual contributions increasing 10-fold between 1980 and 1992. reaching almost 300 million francs at the later date.
The growth in life insurance and annuities has been shared by another long-term saving instrument, the PEP. which has accumulated deposits of about F 350 billion. This instrument replaced the retirement savings instrument PER (epargne de rerraire), introduced in 1986. and benefits from tax advantages similar to those granted to life insurance.
13The annual repon of the French Bank Commission (Commission Bancaire ( 1994)) presents a detailed study of the activity of banks in the insurance market.
14The tax deduction, corresponding to 25 percent of investments. is limited to F 4.000 a year
per household, with an additional F 1 .000 per child. In the case of death of the policy holder before 70 years of age, there are no transmission taxes. In the case of death after 70. a reduction of the taxable amount, up to F 200.000. is granted.
ISQf which F 6 billion is related to life insurance.

©International Monetary Fund. Not for Redistribution
180 FRANCE: FINANCIAL AND REAL SECTOR ISSUES
special rates for customers who keep their policies active for many years is expected to extend the length of contracts beyond the eight-year tax exemption period and reduce the risk insurers face of large withdrawals. However, at this stage, the absence of formal estimates hampers a precise evaluation of the effectiveness of that clause. In addition, flexible distribution of surpluses, new disclosure rules, and the recent update of the technical bases for computing annuities and premiums are expected to increase the demand for insurance. Such a flexible distribution of surpluses makes life insurance similar co defined-contribution pensions in the sense that it permits insurers to offer part of the upside of total returns, that is, tO shift part of the risk (and expected returns) to investors. 16
Features of Company-Sponsored Savings
In contrast to life insurance policies purchased by households on an individual basis, company-sponsored savings programs operate under the framework provided by regulations requiring firms with more than 100 employees to share part of their profits with the workforceY This legislation mandates that the share belonging to employees (participation) be frozen for a period of five years. During this period, resources can be held in bank accounts or in FCPEs.'8 In early 1993, these resources amounted to about 80 billion francs, half invested in funds.
Workers' share of profit is not the only source of funds co FCPEs. Firms-on their own initiative, or as the result of an agreement between labor and management-can create special funds tO collect the participation and other participatOry benefits. These funds-PEEs-enjoy several tax advantages, again reflecting the policy of granting fiscal incentives for long-term savings.19 Since 1959, workers have been able to receive incen-
16Defined-benefit schemes are those where retirement income depends on years of work and/or salary. while defined-contribution schemes are those where pensions vary with the return on assets invested.
"In 1986. the requirement was extended lo firms with more than 50 employees. effective in 1991.
18Fordetails on holding restrictions and tax regimes. see Lefebvre (1993). Blocked accounts are usually used as collateral for investment loans 10 the firm and remunerated at market rates.
19The main tax advantages of PEEs are the following: Employers' voluntary contributions are not included in employees' taxable income. and are not added 10 the wage bill for the purpose of computing social security contributions, if blocked for a period of time. In addition. they arc deducted from the firm's taxable income. Workers' profit shares deposited in PEEs are not taxable for a period of five years. and investments made by PEEs maintain tax exemptions intrinsic to the financial instruments in which the investments are made. The lax deduction of contributions 10 PEEs and the lax exemption of reinvested returns are common 10 pension funds in many countries and reflect the benefits granted 10 mandatory contributions 10 pension schemes in France.

©International Monetary Fund. Not for Redistribution
Some Considerations Relevant to Prejunded Pensions in France 181
Table 4. France: Sources of Funds for PEEs in 1 989 (In percenV
Profit-Sharing
53
Incentive Payments and Workers' Voluntary Deposits
38 Source: Commission des Operations de Bourse (COB).
Em ployers' Deposits
9
tive payments tied to productivity measures (intiressement), which can also be deposited in tax-favored investment instruments. 20 By 1990 about 2 million employees (about 10 percent of the labor force) had signed agreements to receive incentive payments. Employers' voluntary contributions (abondemetlts) and voluntary worker deposits are also an important source of financing of PEEs, as reported in Table 4.2t
PEEs enjoy great freedom in choosing their investment policies, whilebecause they are institutions handling contractual savings (as are pension funds)-they are overseen by representatives of employees.22 Funds deposited in a PEE can be invested in individual accounts or in many types of closed-end mutual funds. The vast majority of FCPEs (including those linked to PEEs) are managed by financial institutions outside the sponsoring company, mainly banks and insurance companies, under the supervision of a board that has a majority of representatives of employees.z.J Competition among financial institutions for managing these increasingly large funds (Table S) has led them to supply a variety of savings instruments, allowing
20These payments can reach up to 10 percent of the wage bill of each firm (except in special cases. when they can reach up to 1 5 percent), and, at the individual level, up to half of the reference maximum wage for social security contributions. Because PEEs are not mandatory, only 33 percent of companies paying interessemem have one (52 percent in the case of state-controlled institutions and firms). most firms simply sponsoring an FCPE.
21Employers' contributions are limited to F 10,000 per employee annually, except if they comprise stock issued by the firm itself. in which case they can reach up to F 15,000. Voluntary worker deposits can amount to as much as one fourth of a worker's gross wages. Workers can also participate in stock option programs and may sometimes be subject to mandatory contributions to PEEs. but stock options have experienced limited success and mandatory contributions are small.
being limited to a maximum ofF I ,000 per year.
22The type of savings instrument. management criteria, and restrictions on withdrawals are set
out in the internal statutes of the PEEs, which have to be registered with the Stock E)(change Commission.
23More than 50 financial institutions manage the 4,000-plus existing FCPEs. with the ten biggest institutions managing about 70 percent of the total funds. In the case of state-owned companies, around 80 percent of the resources in FCPEs are managed by professionals (Pastre and Moseovici (1991)).

©International Monetary Fund. Not for Redistribution
182
Value
FRANCE: FINANCIAL AND REAL SECTOR ISSUES
Table 5. France: Total Assets in Mutual Funds of Enterprises
(In billions of francs)
1986 1988 1990 1992
38 48 67 92
Source: COB.
1993
1 1 7
companies to offer funds tailored to workers' demands. It has also led financial institutions to charge relatively low management fees.24
Portfolios of Life Insura nce Companies and FCPEs
The aggregate portfolios of life insurance companies and PEEs indicate how contractual savings are invested in France. Their distributions of assets differ, in part because the former offer a more standard product while the latter offer tailored products that are sometimes a source of financing for the sponsoring firm. A brief analysis of the portfolio of life insurance suggests that the current distribution of assets is close co the efficient portfolio frontier, defined as the minimum variance portfolio for a given rate of return.
The portfolio of the insurance industry is mostly composed of fixed income assets, including both government and private paper (Table 6). This is explained by the liquidity and relatively high returns of those assets in recent years, and not by binding regulations. In fact, since 1990, the obligation co invest at least 34 percent of the portfolio in bonds and notes has been eliminated, and only maximum limits on rhe orher types of assets currently exist. The proportions of real estate and loans have markedly decreased over the years as financial markers developed and low inflation endured, and are well below their respective maxima of 40 and 1 0 percent. The proportion of stocks is also below the allowed ceiling of 65 percent. Chart 1 suggests that, although conservative, the portfolio of the life insurance seccor is efficient, that is, for the level of expected return chosen, the variance is virtually minimized. Chart 1 shows the efficient portfolio frontier generated by holdings of bonds, real estate, and a diversified portfolio of stocks, considering annualized returns for the period
24Annual fees have been estimated to be around 0.5 percent of the value of portfolios managed by institutions, thus comparing favorably with the management cost of pension funds in regulated
countries such as Gennany and Japan, but less favorably with those in countries such as the United States (0.4 percent) and the United Kingdom (0.2 percent) (Davis ( 1993)).

©International Monetary Fund. Not for Redistribution
Some Considerations Relevant to Prefunded PensiotJS itJ F rt111ct 183
Table 6. France: Distribution of Life Insurance Portfolios (In percent)
1982 1992
Fixed income 52.7 61.3
Stock 14.8
Real estate 19.5 10.7
Negotiable debt 10.3
Loans 7.1 2.1
Source: Ministry of Finance.
1979-93. It also shows the position of the aggregate portfolio held by insurance companies.zs
An increase in the proportion of stocks would be desirable as a way to improve the protection of the portfolio against inflation, especially if the average holding period of policies is to be stretched beyond ten years. Recent changes in regulations concerning the distribution of surpluses (see above) are expected to work in this direction, by increasing the attractiveness of real assets at the expense of guaranteed returns. An increase of 5 percentage points in the proportion of stocks-along the portfolio frontier-would permit an increase in expected returns of 0.6 percentage points, while increasing the volatility of the portfolio by about 40 percent. Such a portfolio adjustment would create a demand for about F 70 billion in equity-the equivalent of 150 percent of privatizations in the 1993-94 period.
The aggregate portfolio of FCPEs already includes a significant proportion of stocks (Table 7). As noted before, there are almost no restrictions on the type of financial assets held by PEEs, allowing them tO take advantage of the relatively long-term nature of deposits benefiting from tax incentives and invest a significant proportion of their assets in stocks. The average period of a deposit in a PEE oscillates between 7 and 7'h years, thus actually exceeding the five-year blocking period determined by the legislation. Although the legislation does not impose a cap in the share of PEEs' portfolio invested in stock issued by the sponsoring company, on average this proportion is below 20 percent.
The analysis of the portfolio of PEEs and life insurance suggests that the expansion of contractual savings (e.g., pension funds) could lead to more financing to firms (taking into account the importance of equity in the portfolio distribution of FCPEs, as well as the size of the portfolio of
2ssee Huang and Litzenberger ( 1988) for the properties of the efficient frontier.

©International Monetary Fund. Not for Redistribution
184 FRA CE: FINANCIAL AND REAL SECTOR ISSUES
Chart 1 . France: The Portfolio Frontier (At constant prices, 1979-93)
7.0�------------------------------------------------� -;:., � 6.5 Q; a.
E :J � '0 � ., a. X w
10 20 30 40 50 Variance
60 70 80 90 100
Sources: Wharton Econometrics Forecasting Associates; Commission des Operations de Bourse; and IMF staff calculations.
life insurance companies) and that management fees and transactions costs could further decrease as the volume of savings increases and competition tO manage these portfolios develops. The effects of pension funds on the capital markets of other developed countries is one of the topics discussed in the following section, together with the macroimplications of a greater reliance on savings instruments as sources of income tO retirees, and how this income might be protected against inflation.
I l l . Aspects of a Transition Toward Prefu nded Pensions
This section attempts to address the main concerns usually expressed about the adoption of prefunded pension schemes (i.e., the intergenerational cost of a transition, the degree of protection against inflation such funds can provide, and the relative advantages of defined-benefit and defined-contribution schemes), discusses expected effects on capital markets, and examines some implications of supporting prefunded pensions other than by simply creating yet another tax-favored savings tnstrumenr.

©International Monetary Fund. Not for Redistribution
Some CotJsideratiotJs Re/evatit to PrejutJded PensiotJs itJ Fra11ce 185
Table 7. France: Asset Composition of FCPEs (In billions of francs)
1986 1990 1993 Mutual funds 8.8 18.7 27.4
Stocks 18.1 25.5 55.2
Of which issued by the company 5.9 1 1 .8 23.6
Fixed income 10.4 19.6 34.2
Of which issued by the company 1.8 3.1 8.8
Cash 0.9 1 . 1 0.9
Source: COB.
lntergenerational Cost
1993 Share (in percent)
23.2
46.8
20.0
29.0
7.5
0.8
It is well known that when total labor compensation is growing fastbecause of either a high race of population growth or technical progress reflected in sustained increases in real wages-a pay-as-you-go system may be more efficient chan a prefunded syscem.26 However, given the population growth projected for Europe in the coming decades, the above conditions do not seem to apply. It has also been highlighted that contributions to social security most often ace as a cax on labor, distorting and reducing labor supplyY On the ocher hand, because savings are the result of an intertemporal decision abom consumption, and not about labor supply, conrribmions to prefunded pension plans are thought to be nemral in relation to the latter. Taking these elements into account, and in particular the effects of taxes on labor supply, overlapping generation models with endogenous labor supply indicate that prefunded pensions can be more efficient than a pay-as-you-go system (when population growth is modest), in some cases permitting a switch from the latter to a
26Th is will be the case when the combined rate of growth of the population and of the real wage exceeds the interest rate in steady state; that is. the capital/labor ratio is higher than the so-called
golden rule level. See, for instance. Anus ( 1993).
27For instance. the rationale for introducing the CSG-a tax used to finance the French social
security system (and, in panicular, pensions) and levied on all sons of incomes-was to shift part
of the burden from labor.

©International Monetary Fund. Not for Redistribution
186 FRANCE: FINANCIAL AND REAL SECTOR ISSUES
funded system in a way that does not hurt any generation, that is, permitting a Pareto-improving switch.zs
Implementing such a transition (which would nor hurt any generation and therefore addresses the concerns raised in rhe Livre Blanc) would probably require a transicory increase in public debr.29 Homburg (1990) suggested a capital reserve system with government debt (co effect intergenerational transfers), similar to Raffelhi.ischen (I 993) who also suggests the introduction of credit instruments. The increase in public debt (which simply reflects the implied liabilities of the pension system) would not offset the increase in savings, permirting an increase in capital accumulation. Because in France the implied liability of social security exceeds annual GOP (Kune, Petit, and Pinxt ( 1993}), a full transition to prefunded pensions without hurting any generation may be infeasible. However, as the Raffelhi.ischen simulation shows, the effects of a transition are not linear, that is, much can be achieved with a partial reduction of contributions to unfunded schemes and the establishmenr of pension funds. This cautious approach can also minimize distributional effects due to macroeconomic and financial uncertainty not captured in the above models.
Protection Against Inflation
The opposition co funded pension schemes in France results ro some extent from the failure, during the 1 930s and early 1940s, of several prefunded pension systems to provide adequate income to their members . .lO This failure contributed to the choice, made in 1945, of
28Homburg ( 1990} and Breyer and Straub ( 1991) prove the existence of transition paths from a steady state that are Pareto improving. This contrasts with results using models that do not consider the utility of leisure, such as Diamond (1993} and Blanchet (1993}, where such a switch will always hurt at least one generation, because labor supply does not adjust to changes in incentives. Simulations in Raffelhiischen ( 1993) confirm the results in Breyer and Straub for the case of Germany. In this exercise. reductions in restrictions on remunerated work after retirement age help the labor supply to adjust to reductions in payroll taxes. leading to a Pareto improvement. Results in Cazes and others ( 1992) and Chauveau and Lou fir ( 1994) also illustrate this point. The latter paper presents a simulation in which prefunded pensions lead to a decrease in output in the medium term and to unattractive results in the long term, while the former paper presents a much more positive outcome. The result in the latter paper is due in part to the way prefunded pensions are treated. that is. the assumption that contributions to prefunded pensions were invested in a ''superfund" whose returns were not necessarily associated with individual contributions. Hence contributions are treated as an additional tax on labor. in contrast to the approach taken in the former paper. where contributions are treated as (contractual} savings.
29The choice between financing through debt or additional taxes should be determined by a balance between the distortion induced by new taxes and the (interest} burden on future generations dictated by debt.
l01n particular. due to the depreciation of government debt caused by the Second World War.

©International Monetary Fund. Not for Redistribution
Some Considerations Relevant to ?refunded Pensi011S in France 187
financing the national social security system through the pay-as-you-go method. Nowadays, the increasing sophistication of financial markets and a lasting decrease in inflation may have reduced the magnitude of the inflationary threat, but it is useful to review how prefunded pensions in other countries have performed in this area.
The protection against inflation afforded by defined-benefit schemes varies according co the way sponsoring firms compute pensions. In most countries, defined-benefit schemes offer discretionary increases in benefits after retirement and some indexation before thac.31 Notably, in the Netherlands negotiated increases are the norm, and in Germany indexation is mandatory. However, the ability to deliver inflation protection ultimately depends on the return of portfolios and on the existence of assets whose real returns are not systematically eroded by inflation (e.g., scocks and indexed bonds).32 Indications are that protection against inflation has been effective during the last 25 years, as in most developed countries the average return of pension funds' portfolios seems co have exceeded inflation.33 In addition, it has also exceeded increases in real average earnings (wages) in several countries (Table 8).
Returns depend on the distribution of assets held by pension funds, and this distribution varies from country to country depending on three factors: the extent of indexation of pensions (especially to wages), minimum funding requirements, and the supply of government bonds (Table 9). The first factor favors stocks, whose returns reflect the growth of the real economy. In countries where indexation is not common (as in Canada), the share of bonds tends to be higher.
The second factor-high funding requirements-usually induces funds to invest in low-volatility assets, hence potentially decreasing the share of stocks and long-maturity bonds.34 In countries such as the United Kingdom, where required funding is limited, stocks are an attractive
31See Table 12 for a comparison of indexation rules in selected countries.
>2Low returns could limit the effectiveness of the protection against inflation provided by defined-benefit schemes. because they might require those companies offering fully indexed pensions to inject additional resources (from, for instance. operational reserves). possibly impacting on the firm's financial health and on its future existence. Funding requirements are discussed in more detail in the Appendix.
330f course, the protection afforded by funded pensions against inflation depends to a certain extent
on macroeconomic conditions. A war or a continued deterioration of the economy would reflect on the assets held by pension funds and impact on future pensions. Diversification into international markets can, however, hedge pension funds' portfolios against real shocks to the domestic economy.
34Funding requirements may require a company sponsoring a defined-benefit scheme immediately to top up the fund with new resources whenever assets fall below projected liabilities. This automatic reaction is what discourages holding a high-volatility portfolio.

©International Monetary Fund. Not for Redistribution
1 88 FRANC!<:: Fl A CIA!. AND REAL SECTOR ISSUES
Table 8. Real Returns of Pension Funds and Other Financial Assets and Rate of Growth of Average Earnings { 1967-90)
Real Returns
Pension Government Growth of funds bonds Market paper Equities Average Earnings
United Kingdom 5.8 0.8 1 .7 8.1 2.6
United States 2.2 0.6 2.0 4.7 0.2
Canada 1.6 0.0 2.5 4 5 1.7
Netherlands 4 0 1 .0 1.6 7.9 2.4
Sweden 0.2 -o.9 1.3 8.4 1 . 5
Germany 5.1 2.7 3.1 9.5 4.0 Source: Davis (1993).
invesrmenr and do nor require sophisticated investment srraregies; in the United Stares, higher funding requirements may have discouraged a larger holding of srocks despite the availability of financial derivatives, which can hedge the portfolio against stock price falls.35 The final factor, supply of public debt, works in two ways to make bonds more attractive to pension funds: a higher supply will tend to increase the liquidity and the coupon rates paid by governmenr paper. However, the effect on protection against inflation is not clear.
Several facrors suggest rhar pension funds will continue to provide effective protection against inflation, even in the absence of indexed bonds. They include the proportion of stock holdings evidenced in Table 9; the current yield curve in Europe, which does not predict a surge in inflation; and financial innovations, such as portfolio "immunization" (i.e. the reduction of portfolios' sensitivity ro inrerest rate changes).36
Effects on Capital Markets
International experience shows that pension funds have fostered the development of capital markets mainly because of the scale of their operations, the nature of their liabilities, and their need and ability to use
3SThe proportion of pension funds' assets invested in derivatives is still difficult to measure, because in most cases such investments are off-book items.
36Immuniuuion can be used as a hedge against innation. because it protects the value of the portfolio against a fall in the price of long-term debt when nominal interest rates increase. This is
achieved by reducing lhe maturity of the portfolio of bonds through the use of derivatives or short sales of longer-term bonds.

©International Monetary Fund. Not for Redistribution
Some Co11siderations Relevant to Prefrmded Pe11sio11s itr Fra11ce 189
Table 9. Asset Composition of Pension Funds' Portfolios (As a percentage of assets. 1990)
Short-Term Bonds
Assets Equity Government Private Loans Property
United Kingdom 7 63 1 1 3 9
United States 9 46 20 16 Canada 1 1 29 39 8 3 Netherlands 3 20 1 4 4 39 1 1
Sweden 3 1 22 63 1 0 1 Germany 2 1 8 1 7 8 36 6
Source: National flow-of-funds data. in Davis (1993).
sophisticated financial instruments. It also suggests that these effects are strengthened if funds are under outside management; effects on aggregate saving and on firms' governance are considered positive, but difficult to measure.
Because pension funds have long-term liabilities, they can provide longterm company financing; and because funds seek to be able to trade a large volume of assets without affecting prices, they create incentives for the expansion of active markets for bonds and stocks. Indeed, countries whose pension funds are large in aggregate tend to have stock exchanges with large capitalizations (Table 10) and generally low transactions costs (Hepp ( 1992)). Funds also create a demand for derivatives-used as a way to avoid having to trade illiquid assets (e.g., fuwres on an asset can be more liquid than the asset itself) or, as noted above, for hedging their portfolios against increases in interest rates.
The influence of pension funds on household saving is likely to be positive, but not one-for-one in relation to the increase of assets held by funds. The main swdies in this area are Feldstein ( 1978), which shows that in the United States saving decreased when unfunded pensions were adopted, and Munnell ( 1976), which suggests that although holding private (funded) pensions decreases other personal saving, the introduction of funded pensions may increase the pool of capital.37 An illustration of the importance of pension funds as savings institutions in the United
37Results in Diamond and Hausman ( 1980) and Avery. Elliehausen, and Gustafson ( 1986) suggest that each dollar invested in pensions is associated with an increase in total saving of up to
40 cents (see Bodie and Munnell (1992)). Recent research on individual retirement accounts (lRAs) (Gale and Scholz ( 1994)), however, underscores the shifting of taxable forms of savings into sheltered instruments.

©International Monetary Fund. Not for Redistribution
190 FRANCE: FINANCIAL AND REAL SECTOR ISSUES
Table 10. Pension Fund and Life Insurance Assets {As a percentage of GOP)
Stock Exchange
Pension Fund Assets Life Insurance Assets Capitalization'
1970 1980 1990 1970 1980 1990 1991
United Kingdom 1 7 23 55 26 23 42 97
United States 1 7 24 35 24 1 8 24 63
Canada 13 17 28 1 8 1 4 1 1 10()2
Netherlands 29 46 77 16 17 30 40
Sweden 22 30 28 20 21 36 40
Germany 2 2 3 8 1 2 1 8 24
France 2 6 1 3 29
Sources: National flow-of-funds data in Davis. 0993); COB; OECD Financial Statistics; and IMF staff estimates.
'Domestic shares. ,lndudes foreign shares.
States, the United Kingdom, Canada, and the etherlands is the size of their assets as a ratio to GOP (Table 10). In the United Kingdom and in the Netherlands, claims on pension funds also represent an important share of personal sector assets: about 40 and 30 percent respectively.
Pension funds can also play a role in privatization by providing a group of large and potentially stable invescors.38 In France, the currenc level of privatizations (around F SO billion a year) could easily be absorbed by pension funds, even if they were to invest the equivalent of only a fraction of contributions currently paid to mandatory supplementary schemes.
Pension funds, like other institutional invescors, create incentives for bank disintermediation, that is, because funds create a large demand for securities, they may encourage firms co issue stock or bonds, instead of seeking loans from banks.39 This may increase the transparency of financial markets, but have only indirect effeclts on the financing of small enterprises.40 However, even if the cost of funds is higher for small firms
38Pension funds were among the major players in the privatization process in the United Kingdom. Chile. and Brazil.
39Securitization in France expanded throughout the 1980s. Lahidji ( 1994) reports that the reliance on banks for credit (raux d' intermediation) decreased from 70 percent to 40 percent in 1991 and to less than 20 percent in 1992.

©International Monetary Fund. Not for Redistribution
Some Considerations Relevant to Prefunded Pensions in France 1 9 1
than for large firms, a larger pool of savings and competition in financial markets should lower the absolute cost of funds so that the overall effect of pension funds could also be favorable to small firms.
The above discussion suggests that the effects of pension funds on French capital markets would be positive. These effects would of course depend on the regulations adopted and on the supervisory authority established. If a system based on defined-contribution schemes, where workers have the right to choose and change the manager of their savings, were adopted (see below), an industry along the lines of that currently managing mutual funds could be expected to develop (this industry includes "boutique" funds, but has a large participation of banks and insurance companies that benefit from their strong repuration).4t In this case, portfolio regulations paralleling those applied to insurance companies could be appropriate. In any case, a cap on self-investment and on investment in nonlisted securities would be desirable.42 The supervision of funds should be under one authority, to enhance protection against fraud and the development of financial disclosure guidelines. Therefore it would be useful to have clarified whether pension funds are to be considered part of the insurance industry, or under the control of the COB, which already regulates mutual funds.
401nstitutional investors tend to require firms to publish more information, because they are usually less likely than banks to become directly involved in the management of firms. In general, more information should lead to bener investment allocation. However. the dislike of institutional
investors for less liquid assets puts small companies at a disadvantage in relation to large compa
nies and may force them to continue to rely mainly on banking credit.
41The concentration of the financial sector is stronger in France than in the United States. The
top 1 5 money managers in the United States manage about 30 percent of the assets, with the top
firm managing 4 percent of total assets (Lakonishok, Shleifer. and Vishny (1992)). In France, the
top 15 financial institutions have a much more dominant position. For instance. the five largest
institutions control just over half of the market of mutual funds (Dermine and Roller ( 1992)) and
the five largest banking institutions have 68 percent of total deposits (Commission Bancaire ( 1994)). In addition. in France. several banks own pan of the capital of insurance companies (in
addition to their own insurance subsidiaries), and vice versa. The extent to which this concentra
tion affects competition has not, however, been documented. For the case of mutual funds, Dermine and Roller (1992) do n01 find evidence that the market power of the five top banks affects
the fees charged to manage mutual funds. They suggest, however, that because of the well-known
fact that mutual funds are one among the many services (often) offered as a bundle, to analyze the
return of mutual funds in isolation may not reveal the local monopoly power that could exist at the
level of bank branches.
421n France, cross ownership of (nonlisted) stock among firms is quite usual (Szpiro ( 1992)) and if pension funds (in particular. defined-benefit schemes) are not required to hold listed stock.
firms could simply expand this practice. increasing the risk borne by eventual pensioners.

©International Monetary Fund. Not for Redistribution
1 92 FRANCE: FINANCIAl. AND REAL SECTOR ISSUES
The Choice Between Defined-Benefit and
Defined-Contribution Schemes
Private pension funds in developed countries comprise mainly defined-benefit schemes, although defined-contribution pensions (e.g., personal pensions) are increasingly popular.43 The main advantages of defined-benefit pensions are that firms bear most of the risk of providing pensions (including, sometimes, inflationary risk), and that they offer the possibility of achieving some income redistribution; the main advantages of defined-contribution schemes are their portability and transparency. These advantages, as well as issues raised by defined-benefit schemes, are discussed in the Appendix. In the United States, most of the increase in coverage in the last 20 years has been achieved through the setting up of defined-contribution schemes, which nowadays cover as many workers as defined-benefit schemes. Personal pensions were introduced in the United States during the 1970s in the form of I RAs, and in the United Kingdom during the 1980s.
The analysis in the Appendix suggests that a system based on defined-contribution schemes may be easier to implement because such pensions are similar ro savings instruments, which most workers are acquainted with, and because they are fully portable. In addition, it suggests that defined-contribution schemes ( 1) may provide more security to investors than defined-benefit schemes, whose pensions depend on the fate of the sponsoring company; (2) can be hedged against inflation, as long as there are no undue restrictions on pension funds' investment in stocks; and (3) should be subjected to restrictions on early withdrawals in order to ensure a minimum amount of savings upon retirement (e.g., when changing jobs, pensioners should not be able to cash in their savings).
The Possibility of Contracting Out to Prefunded Schemes
Fostering private pension funds is one among different ways to accumulate enough savings to finance pensions after 2010.+� Another way would be ro increase the current reserves of the supplementary pensions
•3See the Appendix (fable 12) for a comparison of main features of pension funds in selected countries.
44Another approach would be to rely on foreign savings between 2015 and 2055. which has the drawback that other European countries face the same demographic trend.

©International Monetary Fund. Not for Redistribution
Some Co11siderotio11s Relevant to Preftmded Pensio11s i11 Fm11ce 193
by setting aside contributions co accumulate assets.4� Irrespective of the way this accumulation is achieved, the extent of the adjustment required to balance the finances of the supplementary pensions will be large. Table 1 1 presents two extreme scenarios aimed at illustrating this fact.
The first scenario shows the effects of a policy of indexing pensions to actual wage increases. The second scenario illustrates the sharp decrease in benefits necessary to balance the schemes without increasing the contribution rate, as well as the scope of prefunding in cushioning pan of the loss in benefits implied by such a policy. Both scenarios are simplified and do not do full justice to the complexity of the ARRCO system. But they can be seen as boundaries inside which the actual configuration of the schemes in France will probably evolve. Therefore they can be used as benchmarks tO evaluate the magnitude of required changes. For instance, in the first scenario, contributions are almost tripled by 2060. Considering that the supplementary pensions are meant co provide only a fraction of total retirement income, it is obvious that a contribution rate around 20 percent of wages is unsustainable. The second scenario indicates the reduction in benefits necessary tO keep contribution rates at the current level: pension benefits (at constant prices) would have to be reduced gradually by more than 20 percent in the next 40 years. Such a reduction would imply a halving of the pension/wage ratio. In this case, a funded component to the scheme, based on additional contributions amounting to 4 percent of wages, would permit an increase in the real value of pensions, owing to the accumulation of savings. These financial reserves would stabilize at 20 times the level of annual pay-as-you-go contributions, or about 1 SO percent of the value of annual wage income.46
The intergenerational transfers implied by the two alternatives outlined above are reflected in the evolution of the net value (co workers) of panicipating in a pension scheme. This value is measured by computing the net present value of contributions and benefits for each cohort of workersY In
45The current reserve. which corresponds to about one year of benefits. generates 5 percent of the income of the system, illustrating the scope for such an approach. Technically. the setting
aside could be achieved without an increase in contributions. by adjusting the value of the point. Adjustments of contributions and benefits are not new to the system. During the 1950s. AGIRC lowered call-up rates when it wanted to decumulate an incipient reserve caused by the rapid increase in contributing participants (Lynes (1985)).
46ln a rough calculation, assets would be wonh around the value of annual GOP. The second scenario illustrates a modest use of pre funded pensions, adopting a contribution rate of only 4 percent. which is relatively large in the context of supplementary schemes but would be too small if prefunding the general scheme were chosen.
47The discount rate adopted is 2. 75 percent a year. equal to the (conservative) real interest rate chosen.

©In
tern
atio
nal M
onet
ary
Fund
. Not
for R
edis
tribu
tion
Ta
ble
11.
F
ran
ce
: S
ce
na
rio
s f
or
Ba
lan
cin
g S
up
ple
me
nta
ry P
en
sio
n S
ch
em
es
..
... <0
(Flows a
nd s
tocks
in c
onst
ant p
rices}
�
2000
2010
202
0 20
30
2040
205
0 20
60
2070
Demographic indica
tors1
B
irth
year
fo
r ge
ne
rati
on r
etir
ing
at 60
194
0
1950
1960
19
70
1
980
l990
2
000
20
10
�
.::0
Tota
l pop
ula
tion l
in m
illio
ns
of
pers
ons
) 5
9.5
6
1.7
6
3.3
6
4.7
6
5.6
65
.9
64.6
6
4.3
>
z
F\:>
pula
tion
+50/popul
ati
on 2
0-
60
0.2
3
0.2
6
0.30
0
.34
0
.36
0
.36
0.3
7
0_3
7
�
Exp
ect
ed
life
aft
er
reti
reme
nt a
t 60
{in
year
s)
23
2
5
26
27
28
29
30
30
;::
. ,
Sce
nario
A: Pe
nsions
indexed
to wa
ges
z
>
z
Eff
ecti
ve c
ontr
ibu
tion
rat
e [
as a
�
pe
rce
ntag
e o
f w
age
s)
9.1
2
11.
10
13.5
9
16.7
5
18.5
2
18.88
19
.27
19
.44
>
:-
Ave
rage
yearly
ch
an
ge
of
valu
e
>
of
poin
t {i
n p
ero
en
tl
2.0
2
.0
2.0
2
.0
2.0
2
.0
2.0
2
.0
z
c
Ra
tios
(I
n pe
rcent)
:;:o
m
>
N
ew
pen
sion/
1990
pen
sio
n
11
3
127
14
3
161
18
2
205
2
31
26
0
c- cr.
Coott
ibuti
on/1990
contr
ibu
tio
n
137
1
88
25
9
360
44
9
516
5
94
67
5
m
q
Wag
e/wag
e in
1990
1
13
1
27
\43
16
1 1
82
2
05
23
1 2
60
d
Pv
of be
ne
fits-tO<On
tribu
tions
rati
o2
146
1
41
124
10
5
87
7
6
69
66
:;:&:)
v.:
lifeti
me
exc
ess
ben
efi
t o
f sc
hem
e a
s
v.:
c:
perc
en
tag
e o
f lif
eti
me w
age e
arn
ing
s3
4
3
2
-2
-4
-
6
-6
rr.
cr.
Scena
rio
8: S
table
con
tribu
tion r
ates
and
fund
ed c
omponent
ln
dJc-ato
rs f
or
un
funde
d c
om
pone
nt
Eff
ecti
ve c
on
trib
uti
on
rate
(as
a p
erce
nta
ge
o
f w
age
s)
7.5
0
7.50
7
.50
7.50
7
.50
7
.50
7.50
7
.50

©In
tern
atio
nal M
onet
ary
Fund
. Not
for R
edis
tribu
tion
(..:)
�
:::
Ave
rage
ye
arty
ch
an
ge
of
va
lue
"'
(")
of
poin
t (i
n pe
rcen
t)
-1.
6
-1.
0
-1.
5
-1.
3
0.3
1
.7
1.7
1.
9
<:>
:::
Ra
tios
{Tn pe
rc en
rJ
..., �-
Ne
w pe
ns
ion/19
90 p
ensi
on
85
8
7 8
1 76
7
7
85
94
10
5
�
;s A
vera
ge
con
tribu
tio
n/1990
av
era
ge
..
.. <:;
· c
ontr
ibuti
on
1
13
12
7
143
16
1 18
2
20
5
23
1 2
60
::
:
Wag
e/w
ag
e i
n 1
990
12
7
182
2
05
2
31
260
..
., 1
13
14
3
161
�
Life
tim
e e
xc
es
s be
nefi
t o
f s
ch
em
e a
s
"'
perc
en
tag
e o
f lif
eti
me
wag
e e
arn
i.ngs
J -
1 -
2
-2
-
3
-3
-3
-3
�
::.
In
dica
tors for
funde
d oo
mpon
ent
:::
....
Ra
te of
co
ntr
ibution
{as
a pe
rce
nta
ge
of
wag
es)
4
.0
4.0
4
.0
4.0
4
.0
4.0
4
.0
4.0
�
�
In
tere
st
rate
(irl p
erc
em
a ye
ar)
2.7
5
2.7
5
2.7
5
2.7
5
2.7
5
2.7
5
2.7
5
2.7
5
�
Re
serv
es/p
en
sion
pay
me
nts
• 2
.6
7.3
1
1.0
13
.0
13.3
13
.2
13.0
13
.0
':}
:::
Re
serv
es
/PAYG5
con
tribu
tio
ns
2
.6
7.6
12
.5
16.7
19
.6
20
.6
21.
0
20
.8
�
�
Indicators
for th
e agg
rega
te scl
leme
�
Ra
tios
(In
per
cent}
::
: "
·
New pe
ns
ion/1
990 pe
ns
ion
8
5
97
104
1
15
13
8
151
167
186
<:;
· ::
:
Con
tribu
tion
/1990
oon
tribu
tion
173
19
5
220
2
47
2
79
3
14
354
3
99
..
... �
.
Pv o
f be
nefi
ts-t
o-<o
ntr
ibution
s r
atio
2 10
2
100
93
90
87
8
7 8
5 8
5 ::
:
�
'Based
on pr
OJeco
ons 111 O
mh
(1994
1. �
7Pv
(prese
nt va
l�l o
l pe11sionsJPv
of con
trtbu
tJons,
foe the
oohon
reoo
ng m
the
followt
ng l��
�e \'ear
s.
:::
�Pv
ol pe
i\Sion
s-Pv o
' con
t11bution
si/Pv o
f wag
es. fo
r the
cohof"t
re1I1ng
on th
e fol
lowing frve
years.
�
'lnc
lud:
ng th
e pay
-a�
component
' Pav-a
s·yo
lJilO
<D
(11

©International Monetary Fund. Not for Redistribution
196 FRANCE: FINANCIAL ANO REAL SECTOR ISSUES
the first scenario, the net value of the scheme changes from being significantly positive in early years ( 4 percent of the present value of lifetime wage earnings) tO being significantly negative in later decades (up tO -6 percent of lifetime wage earnings), so that those persons already retired or retiring soon would benefit from a generous scheme while those retiring later in the future would not recoup the amount of contributions made. The net loss is so large for future generations, even after the population stabilizes, because those generations will be burdened with very high contributions w a system that will yield less than the discount rate.
The net balance of future generations improves when contribution rates are kept constant (they are on average equal to -3 percent of lifetime wage earnings), bur that of currem retirees and of those now in the middle of their careers worsens by the equivalent of about 4 percent of their lifetime wage earnings. Funded components do not change the absolute net loss of schemes, because these components are assumed to be actuarially fair. Bur they increase the relative overall return of those schemes, especially in the long run. For instance, even with relatively low prefunding, the average ratio of discoumed benefits ro contributions stabilizes at a higher rare in the second scenario than in the first. An additional welfare-improving implication of prefunded pensions and low contribution rates is that, compared with a high contribution rare scenario, they free more resources to households, which can use them in optimal ways. However, neither extreme scenario Pareco-dominates the ocher, and they do not give indications on how the accumulation of assets will be achieved, nor on how financial reserves should be managed.
Private pensions would decentralize the process of accumulation, and could be introduced by permining a partial contracting out of the system in exchange for the freezing of the comribution rate. In this case, a decrease in future liabilities of the system-instead of a proportional increase of assets and liabilities-would be achieved, because workers would have part of their contributions deposited in defined-contribution funds of their choice, outside current schemes. This switch might increase (contractual) savings, which, as noted above, are usually not perceived as distortional taxes on labor and therefore might contribute co higher economic growth. However, as illustrated in the second scenario, by reducing the inflows inro the pay-as-you-go system, it may require decreases in benefits for those already drawing pensions relative co a system without contracting out.
The hoarding of a fraction of labor income in savings instruments should be particularly attractive to younger workers, who would benefit most from the compounding of returns on financial assets. Chart 2 shows how pension benefits (in constant prices) would increase with the number

©International Monetary Fund. Not for Redistribution
Some Co11sidemtio11s Relevo111 1o Pre[u11ded Pensions in F ranee 197
Chart 2. France: Standardized Value of Pensions (For similar patterns of contributions)
7.---------------------------------------------------. Ratio
Unfunded: 11.5% return ratio - · ·
... -::.. .. --· :.,.:";:.,.Funded: 2.75% yield
- - ·
Funded: 3.75% yield ,
, .. .. .. ,.,... !"· �·�· · · · ·
,.
0�----�------�------�------�----�------�------J 10 15 20 25 30 35 40 Years of contribution before retirement
Source: IMF staff calculations.
of comriburion years ro defined-contribution funds, for a given real rewrn, and co pay-as-you-go systems, for a given rewrn ratio (the values are standardized relative to che pension earned after concributing cen years co a dcfined-concriburion plan yielding 2. 75 percent a year in real cerms).48 It
illustrates chat even for the generous recurn ratio of 1 1 .5 percent, longterm users of funded pensions may be better off.
The contracting-our scenario is one among several that could be adopted (including making prefunded pensions mandarory, as in Switzerland) and complements the graduc1l increase in che retirement age that will take place as a consequence of extending ro 40 the number of years needed co qualify for a full social security pension. ( c has the advantage of not requiring increasing fiscal exemptions that would probably be necessary to make concribucions co funded pensions attractive at a time of rising contributions to mandatory schemes. The approach would also keep the basic pay-as-you-go principle (riportition), focusing it on the basic social
•sThc exercise in Chan 2 a_�sumes that wages increase by 1.5 percent a year over the working
life and that pensions are on average paid for 20 years-20 percent longer than they are currently
paid. The yields adopted (2.75 and 3.75 percent a year in real tern1s) arc conservative when com
pared with the returns of recent years. The return ratios renect the evolution of ARRCO ratios.
which have been reduced over time. Return ratios arc not directly comparable with the yield of a
bond (see Section I for a definition).

©International Monetary Fund. Not for Redistribution
198 FRANCE: FINANCIAL AND REAL SECTOR ISSUES
security pension, while spreading the cost of pensions across generations and favoring the development of capital markets.
IV. Conclusions
The growth of the life insurance sector and of company-sponsored savings plans suggests that individuals in France have both increasing confidence in financial markets and the desire to use them co guarantee future income, indicating a favorable environment for the expansion of prefunded pension schemes. The face that French workers have increasingly included PEEs (which share features with defined-contribution schemes) in their collective agreements indicates a perception that such sources of deferred income can be part of labor compensation, which is a common feature in the United States and ocher countries chat have funded pensions.
Their growth also suggests chat financial markets are responsive co changes in demand and that the positive effects on capital markets associaced with pension funds in other countries could take place in France. In the case of both PEEs and life insurance, despite the still relative dominance of a few large insurance and banking firms, a dynamic market has developed, suggesting that insurance companies are probably ready co manage large pension funds. In fact, since the deregulation in the 1980s, insurance companies have managed large financial portfolios not only for themselves but also for third parties. The size of the insurance market can be gauged by the amount paid in premiums, which corresponded in 1993 roughly to half of social security contributions.
According to the elements presented in chis study, pension funds in ocher developed countries have had a positive effect on capital markets mainly due co the size of their operations, the information they require from firms, and the financial innovations they foster (to some extent, pension funds also tend to help to increase the household savings rate). The effect of institutional investors on French capital markets in recent years suggests that similar developments could be expected in France following an expansion of pre funded pension schemes for French workers.
The fact that most resources in FCPEs come from participatory benefits does not constitute a significant difference in relation to the financing of pension funds in other countries. Mandatory contributions co funds are present in some countries where the basic social security pension is small, and, in France, mandatory contributions could be tied to a sort of rebate (or freeze of contribution rates) linked co the relinquishing of fuwre rights on supplementary pensions. Tax benefits applied co PEEs are not essentially different from chose granted to most pension funds. But if these

©International Monetary Fund. Not for Redistribution
Some CotTsiderations Relevant to Prefrmded Pe11sions i11 Fra11ce 199
incentives were to be extended tO pensions, it might be advisable to do so through a coherent system of taxation of capital gains ro avoid unnecessary tax expenditure.
If the above indications are taken as pointing to the establishment in France of a pension system based also on private prefunded schemes, questions arise about the social cost of a transition and the guarantees offered by such systems. The preliminary answer to the first question is that a Pareto-improving transition, associated with increased labor supply and employment, can in principle be achieved. A possible way ro initiate a transition would be to permit workers to contract out from the mandatory supplementary pension system, in order to participate in a defined-contribution plan.
The second question can also be partially answered by looking at the regulations adopted in other countries, as well as by drawing on current regulations covering the French life insurance industry and on the practice among PEEs. The experience in foreign countries, and the fact that regulations on French insurance companies have recently been liberalized, suggest that few restrictions on portfolio distribution would be desirable. Among them, however, would be limits on investment in stocks or debt issued by the company sponsoring the pension fund, and in nonquoted securities. In addition, the participation of workers in supervisory boards, their right tO change fund managers, and broad disclosure rules would tend to protect the assets accumulated and to increase returns, hence increasing the trust of the public. International experience also suggests that defined-contribution schemes may provide more transparency and be easier ro introduce. Because portability of benefits, as well as vesting (the right to receive some benefit after a minimum number of years of work), add some complexity to the management of defined-benefit schemes, these may be more difficult to implement nationwide. It also suggests that having a unified statutory authority responsible for supervising all pension schemes and regulations, possibly along the lines of that in place in the Netherlands, would increase confidence in the system and facilitate its introduction.
Appendix
Features of Defined-Benefit and Defined-Contribution Schemes
Defined-benefit schemes raise three issues: minimum funding levels, the ownership of surpluses, and portability.

©International Monetary Fund. Not for Redistribution
200 FRANCE: FINANCIAL AND REAL SECTOR ISSUES
Minimum funding levels are actuarial concepts that are applied diversely in different countries, all of them having the objective of guaranteeing that the firm has actually set aside enough resources tO fund pension liabilities. Minimum funding levels can work coward protecting the value of pension funds in conjunction with, or as a substitute for, restrictions on portfolio composition: any rime funding goes below the minimum, rhe fund has ro be tOpped up; certain assets, especially chose chat are more volatile, cannot be held by funds. In the United States, the United Kingdom, and the
etherlands, there are mandarory minimum funding levels bur no specific regulations on portfolio distributions; in Switzerland there are both (see Table 12 for features of funds in selected countries).49 The ownership of surpluses is generally given to the sponsoring firm, because it is understood that since the firm is committed to complement any shortfall of pensions, it should also be entitled ro surpluses. In the United Kingdom and the United States the firm can either withdraw the surpluses (paying taxes) or adopt a contribution holiday. I t can also assume the surpluses when a fund is liquidated. 5° In some countries (e.g., the Netherlands), rhe policy is closer to that followed by insurance companies in France: surpluses are distributed co workers.
Portability of benefits (the transfer of benefits when leaving a firm) and vesting not only remove disincentives to labor mobility, but also protect workers against abuses. Portability is usually easier to achieve when benefits are based on average wages and not final wages, but in any case an element of arbitrariness is unavoidable (depending on the formulas used) and full neutrality cannot be guaranteed.51 These difficulties have often prevented the extension of coverage of defined-benefit schemes to workers with less stable careers. Regulations on vesting aim at preventing firms from evading the payment of pensions to workers who leave before retirement age, by, for instance, returning contributions without paying interest. Both in the United States and in most European countries, maximum periods before vesting have been imposed, varying from ten years in Germany to one year in the etherlands (where a more homogeneous system exists).
The main concerns about defined-contribution schemes, and especially personal pensions, are the cost of managing these accounts, and doubts
49ln the United Kingdom. mandatory funding covers only the relatively small guaranteed minimum pensions (GMPs).
soln the United States. this led, during the 1980s. to several company takeovers aimed at liquidating funds with surpluses. until legislation curbed such a behavior by imposing penalties on companies liquidating their funds.
s•see Young (1991) for simulations for different working profiles.

©International Monetary Fund. Not for Redistribution
Some Co11sideratio11s Releva111 to Pre/tmded Pmsio11s in Fm11ce 201
Table 12. Features of Pension Systems and Pension Funds in Selected Countries
United Kingdom United States Canada
Social security
Retirement age (men/women) 65/60 65/65 65/65
Coverage All residents All workers All residents
Replacement ratio Flat pension 0.40 0.35
Supplementary pensions
Financing Funded Funded Funded (private)PAYG (SERPS)l
Coverage Voluntary Voluntary Voluntary (in percent) 70 55 45
Indexation after Discretionary, Discretionary, retirement but common. but common. Not common.
Predominant type DB2 (SERPS and DB (occup- DB
occupational), ationall. DC
DC (Private {IRA).
Pensions).
Fiscal incentives
Benefits Taxed Taxed Taxed
Employer contributions Deductible Deductible• Deductible•
Worker contributions Deductible Deductible• Deductible•
Regulation of Prudent man Prudent man Prudent man portfolios concept; 5% concept; 1 0% concept; 7%
self-investment self-investment limit on real limit; concen- limit for DB estate. tax on tration limit for plans. foreign invest-DC schemes. ment above 10%.
Funding Obligatory only Higher Obligatory for contracted- insurance out part. premia if
underfunded (AB0).4
Vesting Two years. Five years. No Two years. Little Indexation of indexation of indexation of accumulated accumulated accumulated benefits. benefits. benefits.

©International Monetary Fund. Not for Redistribution
202 FRANCE: FINANCIAL AND REAL SECTOR ISSUES
Table 12 (concluded).
Social security
Retirement age (men/women)
Coverage
Replacement ratio
Supplementary pensions
Financing
Coverage (in percent)
Indexation after retirement
Predominant type
Fiscal incentives
Benefits
Employer contributions
Worker contribution
Regulation of portfolios
Funding
Vesting
Netherlands
65/65
All residents
0.35
Funded
Voluntary 50
Almost universal.
DB
Taxed
Deductible
Deductible
Prudent man concept; 5 o/o self-investment lim it; 5 o/o foreign investment for public pensions.
Obligatory for lBO 7 or PBO.a
One year. Indexation of accrued benefits.
Sources: Davis (1993}; and Pestieau (1991). 'State earnings-related pension scheme. 2Defined-benefit. 3Defined-contribution. •Accumulated benefit obligations. sraxed at lower rate. •Deductible up to a ceiling. 'Indexed benefit obligations. eprojected benefit obligations.
Sweden
65/65
All workers
0.60
Funded
Voluntary 55
Mandatory
DB
Taxed5
Deductible5
Deductibles
Majority to be in listed bonds and loans to contributors.
lBO. with contributions adjusted every 5 years.
Immediate. national scheme.
Switzerland
65/62
All workers
0.60
Funded
Voluntary 45
Almost universal.
DC (60%), DB (40o/o)
Taxed
Deductible
Deductible
30% limit on domestic shares. 50% domestic real estate. 20% foreign currency assets, 10% foreign shares.
Obligatory for lBO or PBO.
Graded vesting between five and 30 years.

©International Monetary Fund. Not for Redistribution
Some Considerations Relevant to Prefrmded Pmsions in France 203
about the ability of workers co save enough and to choose appropriate savings instruments. The experience with personal pensions in the United States and United Kingdom is viewed among some institutional invesrors as evidence chat workers tend co choose the wrong savings instrumentresponding more to advertisements chan to considerations about longterm returns (Makin (I 993))-buc evidence supporting such a judgment is scant and Diamond (1993), among ochers, has noted that freedom of choice is welfare improving. In addition, Lakonishok, Shleifer, and Vishny (1992) noted that returns from stock portfolios held by American definedbenefit pension funds are lower than chose of the SPSOO index, comrasting co returns of either mutual funds or accounts managed by insurance companies. The authors suggest that even if managemem costs are lower for defined-benefit schemes, agency problems may imply that total returns to employees are not higher than for defined-contribution schemes. Concerns about the amount saved by workers, which is often seen as too low, and the "excessive" risk borne by employees can be addressed by imposing minimum contribution levels, limiting early withdrawals, providing mandatory education about the savings instruments available to workers, and requiring full disclosure of characteristics of these instrumems. Of these, limiting early withdrawals, as is done in the United Kingdom and was recently initiated in the United States (by imposing a 20 percent tax on withdrawals), is probably the most important measure.52
References
Artus, Patrick, "Bien-etre, croissance et systeme de retraite," in Epargtu, ed. by Patrick Arcus, C. Bismuc, and D. Plihon (Paris: Presses Universi caires de France, 1993).
Avery, RobeH, Gregory Elliehausen, and Thomas Gustafson, "Pensions and Social Security in Household Portfolios: Evidence from the 1 983 Survey of Consumer Finances," in Savings and Capital Formation: The Policy Options, ed. by Francis Adams and Susan Wachter (Lexington, Massachusetts: Lexington Books, 1986), pp. 127-60.
Blanchet, D., "Retraites, epargne ec croissance," in Epargne, ed. by Patrick Artus, C. Bismuc, and D. Plihon (Paris: Presses Universiraires de France, 1993).
52In the United States. employers are not mandated to contribute. and. moreover. employees can cash in their personal pensions when they change jobs: before the adoption of the 20 percent tax, only 30 percent of the IRA accounts were rolled over after a job change.

©International Monetary Fund. Not for Redistribution
204 FRANCE: FINANCIAL A D REAL SECTOR ISSUES
Bodie, Zvi, and Alicia Munnell, Pensions rmd the Economy: Sources, Uses, rmd Limitations of Data (Philadelphia: University of Pennsylvania Press, 1992).
Breyer, Friedrich, and Marrin Straub, "Welfare effects of unfunded pension systems when labor supply is endogenous," Discussion Paper Series I, o. 252 (Konstanz: Universitat Konstanz, Fakultat fUr Wirrschaftswissenschaften und Statistik, January 1991 ).
Cazes, Sandrine, Thierry Chauveau, Jacques Le Cacheux, and Rahim Loufir, "L'avenir des retraites dans un modele d'equilibre general calculable," Revue d'Economie Finonciere, Vol. 23 (Wimer 1992), pp. 109-24.
Chauveau, Thierry, and Rahim Loufir, "L'avenir du regime de retraite frant;a is," Revue Ecor10mique, Vol. 45 (May 1994 ), pp. 789-804.
Commission Bancaire, Rapport pour l'ormie !993 (Paris, 1994). Davis, Eric, "The Structure, Regulation, and Performance of Pension
Funds in Nine Industrial Countries," Policy Research Working Paper No. 1229 (Washington: World Bank, December 1993).
Dermine, jean, and Lars-Hendrik Roller, "Economies of Scale and Scope in French Mutual Funds," Joumal of Fi11flnciol lntermediatio11, Vol. 2 (March 1992), pp. 83-93.
Diamond, Peter, "Privatization of Social Security: Lessons from Chile," NBER Working Paper, No. 4510 (Cambridge, MassachusettS: arional Bureau of Economic Research, October 1993).
__ , and ]. Hausman, "Individual Savings Behavior," paper prepared for the National Commission on Social Security, 1980.
Dinh, Quang Chi, "La population de Ia France a !'horizon 2050," Economie etStotistique, o. 274 ( 1994), pp. 7-32.
Feldstein, Marrin, "Do Private Pensions Increase arional Savings?" Joumol of Public Economics, Vol. I 0 (December 1978), pp. 277-93.
France, Ministry of the Budget, "lnreressement, participation, epargne dans les organismes soumis au controle d'etat," Les notes bleues, No. 6 1 1 (Paris, 1992).
_, "L'evolution de !'assurance-vie en France," Les notes bleues de Berry, No. 24 (Paris, 1993).
Gale, William, and John Scholz, "IRAs and Household Saving," Ameriran Economic Review, Vol. 84 (December 1994), pp. 1 233-60.
Hepp, Stefan, "The investment behaviour of European pension funds: implications for Europe's capital markers," in The Future of Pensions in the European Community, ed. by jorgen Mortensen (London: Brassey's, 1992), pp. 151-70.

©International Monetary Fund. Not for Redistribution
Some Cottsiderations Relevant to Prefunded Pensions in F ranee 205
Homburg, Stefan, "The Efficiency of Unfunded Pension Schemes," Journal of lnstitutiottal and Theoretical Ecot10mics, Vol. 146 (December 1990), pp. 640-47.
Huang, Chi-fu, and Robert Litzenberger, Fotmdations for Financial Economics (New York: Elsevier Science Publishers, 1988).
Kune, J., W. Petit, and A. Pinxt, "The Hidden Liabilities of the Basic Pensions System in the Member Stares" (Louvain-la-Neuve, Belgium: Centre for European Policy Studies, 1993).
Lahidji, Reza, "Le financement de !'economic fran9aise depuis 1980," Problemes Economiques, No. 2371 (April 13, 1994), pp. 22-27.
Lakonishok, Josef, Andrei Shleifer, and Robert Vishny, "The Structure and Performance of the Money Management Industry," Brookit1gs Papers 011 Economic Activity: Microeconomics ( 1992), pp. 339-79.
Lefebvre, Francis, Memento pratique-social (Paris: Editions Francis Lefebvre, 1993).
Legendre, R., "Evaluation empirique de quelques reformes de l'impot sur le revenu," Economieet Privision, Vol. 1 10 ( 1993).
Livre Blanc sur les Retraites (Paris: La Documentation fran9aise, 1991 ). Lynes, Tony, "Paying for Pensions: The French Experience," Suntory
Toyota International Centre for Economics (London: London School of Economics and Political Science, 1985).
Makin, Claire, "When I'm 64," f11stitutio11al Investor, Vol. 18 (October 1993), pp. 52-59.
Munnell, Alicia, "Private Pensions and Saving: New Evidence," Joumal of Political Economy, Vol. 84 (October 1976), pp. 1013-32.
Pasrre, Olivier, and P. Moscovici, "Epargne salariale et fonds propres," Ministry of lndustry and Trade (Paris, 1991).
Pestieau, Pierre, "Les prestations de pension privees: leur repartition estelle juste?" presented at the Organization for Economic Cooperation and Development Conference des Experts Nationaux sur les Pensions Privees et la Politique Publique, Paris, July 1991.
Raffelhuschen, Bernd, "Funding social security through Pareto-optimal conversion policies," Journal of Economics (Zeitschrift fiir Nationalekonomie), Supplement No. 7 ( 1 993), pp. 105-31 .
Szpiro, Daniel, "Points d e repere sur l e marche des actions des entreprises fran9aises," Revued'Economie Financiere, Vol. 20 (Spring 1992).
Willard, Jean-Charles, "L'avenir de la retraite complememaire des cadres: un point de vue technique," Revue d'Economie Financiere, Vol. 23 (Winter 1992), pp. 195-21 1 .
Young, H., "Niveaux et formes des allocatio.ns de pensions privees: dans quelle mesure sont-ils adequats?" presented at the Organization for Economic Cooperation and Development Conference des Experts

©International Monetary Fund. Not for Redistribution
206 FRANCE: FINANCIAL AND REAL SECTOR ISSUES
Nationaux sur les Pensions Privees et Ia Politique Publique, Paris, July 1991.
Zerah, Dov, and Olivier-Alban Aucoin, Le systeme firJaflcier fratlfais: dix mrs de mutatio11s (Paris: La Documentation fran�aise, 1993).

©International Monetary Fund. Not for Redistribution
ADF AGIRC
AIF ANPE ARCH ARRCO AUD
CARA CEP CES CIP CODEVI
COB CPI CRE
CSG
ECB ECU EMS EMU ERM EU
FCP FCPE
GOP GMP
Glossary
Augmented Dickey-Fuller (test). Association Generate des Institutions de Retraites des Cadres. Action d'insertio11 et de jormatio11. Agence Nationale pour l'Emploi. Autoregressive conditional heteroscedasticity. Association des Regimes de Retraites Complementaires. Allocation rmique digressive.
Constant-absolute-risk-aversion (utility function). Certificat d'ltudes primaires. Contra/ emploi-solidariti. Control d'i11Sertion professiomulle. Comptes pour le dtfveloppeme111 industriel. Commission des Operations de Bourse. Consumer price index. Contra! de retour iJ l'emploi. Contribution sociale genera lisle.
European central bank. European currency unit. European Monetary System. European monetary union. Exchange rate mechanism. European Union.
Fonds commu11s de placement. Fotuls commu11S de placement d'entreprise.
Gross domestic product. Guaranteed minimum pensions.
207

©International Monetary Fund. Not for Redistribution
208
liP IN SEE
IRA
LEE
NAIRU
OECD OFCE OLG OPCVM OPEC
PAYG PEA PEE PEL PEP PI PME pp ppp
RMI
SBIC SER SERPS SICAV SMIC SPSOO SUR
uv
VAR
WEFA WEO
FRANCE: FINANCIAL AND REAL SECTOR ISSUES
lnvariance of incidence proposition. Institut Nationale de Ia Statistique ec des Etudes Economiques. Individual retirement account.
Livrets d'epargtu entreprise.
Non-accelerating-inflation rate of unemployment.
Organization for Economic Cooperation and Development. Observatoire Fran9ais des Conjonctures Economiques. Overlapping generations. Organismes de placements collectifs en valeurs mobilieres. Organization of Petroleum Exporting Countries.
Pay as you go. Plan d'tpargne en actions. Plan d'ipargne d'entreprise. Plan d'ipargne-logement. Pl011 d'ipargne populaire. Permanent-income (model). Petites et moyennes entreprises. Phillips-Peron (test). Purchasing power parity.
Revenu mi11imum d'insertion.
Schwanz-Bayes information criterion. Standard error. State earnings-related pension scheme. Sociltis d'itroestissement a capital variable. Solaire minimum interprofessionel de croissance. Standard & Poor's 500 (stock index). Seemingly unrelated regressions.
Unemployment-vacancy (ratio).
VectOr autoregression.
Wharton Econometrics Forecasting Associates. World Ecot1omic Outlook.