framework on distribution outsourcing in government-run ... · pdf filetable 4.18: logistical...
TRANSCRIPT

Framework on Distribution Outsourcing in Government-Run Distribution Systems
March 2011

2
About MIT-Zaragoza
The MIT- International Zaragoza Logistics Programme at Zaragoza Logistics Center (ZLC) is a research institute established by the Government of Aragón in Spain in partnership with the Massachusetts Institute of Technology and the University of Zaragoza. The ZLC hosts the MIT-Zaragoza International Logistics Program. The Center is acknowledged for its excellence in supply chain research and education in Europe and other parts of the world. The center has a core group of faculty and researchers from leading institutions who are considered global experts in their respective fields.
About Transaid
Transaid is an international development charity which seeks to reduce poverty and improve quality of life through providing better access to basic services such as health, education and economic opportunities in Africa and the developing world. Transaid achieves this by building local skills and knowledge to make transport safer, cheaper and more effective. Specifically Transaid specializes in the following: building capacity of the public health authorities to provide effective, safe and cost efficient transport management systems to promote equitable access to primary health care services; developing and improving logistics and supply chain systems to enhance the delivery of medicines, equipment and relief services to vulnerable communities; providing technical and financial analysis of the transport component of relief and emergency programmes; promoting effective partnership to support and enhance community participation in developing sustainable transport solutions in rural areas; developing and delivering transport and logistics training and qualifications for public and private sector operators.
About VillageReach
VillageReach is a nonprofit organization with a hybrid, interdisciplinary approach to improving access to healthcare for remote, underserved communities around the world. Our model combines the creation of social businesses that address infrastructure gaps with health system strengthening programs that benefit communities at the last mile. VillageReach partners with governments, businesses, and nonprofit organizations to provide innovative, efficient and sustainable improvements to health systems. Our solutions are scalable, replicable, and produce measurable improvement.
Acknowledgements
The authors are grateful to: Ebere Anyachukwu, DFID; Abdel Raouf Qawas, PATHS2; Vimal Pant, PATHS2; Dr. O. Ishola PATHS2; Mike Egboh, ABT Associates; Garba Safiyanu PATHS2 state coordinator; Dr Abubakar Izge, PATHS2 Team Leader; Phrm Kabir Yusuf, PATHS2; Phrm Auwalu Abdulsalam, PATHS2; Phrm Tukur Ibrahim, Hospital Management Board; Benson Obonyo, PATHS2; Phrm Kamilu Mudi Salisu, DMA deputy director drugs; Hajiya Amina Jibrin, DMA chief accountant; Alhaji Tajudden Gambo, Permanent Secretary, Kano of Health Ministry of Health (KMOH); Pharm. Tijjani Nasidi, Director Pharmaceutical Services (KMOH); Dr Said Muhammad, Zonal Director, Hospital Management Board, Zone 5 Gaya, Kano; Pharm Ali Adamu, DMA director of drugs; Dr. Umar Mustafa, Managing Director, Mentholatum; Dr Carolyn Sonners, DFID medical advisor, Northern Nigeria; Jane Miller, DFID; Saul Walker, DFID; Cheri Grace, DFID.
This assessment would not have been possible without the tireless efforts and impressive dedication of the field survey team including Adesoji Adegbulugbe and Tukur Ibrahim and planning support of Kabir Yusuf and Auwalu Abdulsalam. Finally, the study design, data analysis, and report writing team were critical to completing the assessment. The team included Noel Watson from MIT-Zaragoza; Gary Forster from Transaid; and Leah Hasselback from VillageReach.

3
Table of Contents
List of Tables, and Graphs .................................................................................................................. 5
Acronyms ................................................................................................................................................. 6
Executive Summary .............................................................................................................................. 7
1 Background .......................................................................................................................................... 8
2 Literature Review .............................................................................................................................. 9
3. Distribution Outsourcing in Government-Run Distribution Systems............................ 9 3.1 Conceptualizing Drivers of Performance of Government Run Health Supply Chain ......................... 10
3.1.1 Key Drivers of Supply Chain Performance ........................................................................................................... 10 3.2 Assessing Capability ...................................................................................................................................................... 13
3.2.1 Warehousing ..................................................................................................................................................................... 13 3.2.2 Commodity Distribution ............................................................................................................................................... 13
3.3 Measuring Performance .............................................................................................................................................. 14 3.3.1 Costing the Supply Chain ............................................................................................................................................. 15
3.4 Framework for Improvement Using 3PLs ........................................................................................................... 20 3.4.1 Classifying Improvement Opportunities ............................................................................................................... 20 3.4.2 Constraints.......................................................................................................................................................................... 22 3.4.3 Operating with 3PLS ...................................................................................................................................................... 25 3.4.4 Performance Modeling .................................................................................................................................................. 26 3.4.5 Searching for Recommendations ............................................................................................................................. 26 3.4.6 Initiating the 3PL Relationship ................................................................................................................................. 30
3.5 Summary ............................................................................................................................................................................ 30
4 Case Study – Kano, Nigeria ........................................................................................................... 31 4.1 Kano State and Healthcare in Nigeria .................................................................................................................... 31
4.1.1 Health System Strengthening in Kano, Nigeria ................................................................................................. 32 4.1.2 The DRF System for Essential Drugs Distribution in Kano .......................................................................... 32
4.2 Assessing Capability and Measuring Performance .......................................................................................... 35 4.2.1 Assessment of the DMA ................................................................................................................................................. 35 4.2.2 Assessment of DRF Distribution: The PHC/SHC Collection Network ....................................................... 40 4.2.3 Assessment of Third Party Warehouse Providers ............................................................................................. 46 4.2.4 Assessment of Third Party Transportation Providers .................................................................................... 47
4.3 DRF Recommendations ............................................................................................................................................... 47 4.3.1 Considered Options ......................................................................................................................................................... 48 4.3.2 Current System Recommendations A: Strategic Partial Outsourcing to PHCs ................................... 50 4.3.3 Current System Recommendations B: DMA Delivery to SHCs ..................................................................... 53 4.3.4 Expansion of DRF Recommendations: DMA as Sole Warehouse ............................................................... 55 4.3.5 General Challenges ......................................................................................................................................................... 56
5 Conclusion .......................................................................................................................................... 57
Appendix A ............................................................................................................................................ 59 A.1 Additional Specifics on Our Costing Model ......................................................................................................... 59 A.2 Sampling Methodology in Kano Nigeria ............................................................................................................... 60
A.2.1 PHCs ....................................................................................................................................................................................... 60

4
A.2.2 SHCs ....................................................................................................................................................................................... 62 A.3 Summary of Assessment findings ........................................................................................................................... 63 A.4 Specific Assumptions/Observations from the Model for Current System Recommendation A ... 64 A.5 Specific Assumptions/Observations for Current System Recommendation B .................................... 65
Bibliography ......................................................................................................................................... 67

5
List of Tables and Figures
Tables
Table 3.1 Phase of System Strengthening and Related Tools ................................................................................ 10 Table 3.2: Summary of Capabilities.................................................................................................................................... 12 Table 3.3: Breakdown of Costs and Cost Types ............................................................................................................. 18 Table 3.4: Study Population by Survey Type .................................................................................................................. 19 Table 3.5: Summary of Supply Chain Improvenment Opportunities & Potential 3PL Contributions .. 21 Table 3.6: Summary of Iterative Process for Recommendation Generation ................................................... 27 Table 3.7: Phase of System Strengthening and Related Tools ............................................................................... 30 Table 4.3 Summary of Findings on DMA Capabilities ................................................................................................ 35 Table 4.4: Summary of Basic Operational Capability Assessment of DMA ...................................................... 36 Table 4.5: DMA Fleet Management Findings ................................................................................................................. 37 Table 4.6: Summary of DMA Warehouse Costs ............................................................................................................. 38 Table 4.7: Breakdown of DMA Inventory Investment Costs .................................................................................... 39 Table 4.8 Summary of Findings on PHC & SHC Capabilities ................................................................................... 40 Table 4.9: PHC DRF System Costs ........................................................................................................................................ 42 Table 4.10: Breakdown of Sources of Funding for Costs .......................................................................................... 43 Table 4.11: Incremental Costs for PHC DRF System ................................................................................................... 44 Table 4.12: SHC DRF System Costs ...................................................................................................................................... 45 Table 4.13: Incremental Costs for SHC DRF System ................................................................................................... 46 Table 4.14 Summary of System Recommendations & Observations ................................................................... 48 Table 4.15: List of Current System Options with Advantages and Challenges ............................................... 49 Table 4.16: List of Expansion of DRF Options with Advantages and Challenges .......................................... 50 Table 4.17: Cost & Savings Breakdown from Strategic Partial Outsourcing to PHCs ................................ 51 Table 4.18: Logistical Statistics of Required Distribution Services from 3PL ................................................ 52 Table 4.19: Cost & Savings Breakdown from Delivery to SHCs ............................................................................. 54 Table 4.20: Cost & Savings Breakdown - Expanding the DRF System with One versus Two Warehouses ................................................................................................................................................................................... 55 Table 4.21: Cost & Savings Breakdown from Recommendations A & B ............................................................ 57 Table A.1: PHCs in Sample and Their Characteristics ............................................................................................... 60 Table A.2: Sample Distribution Data for Last 3 PHC DRF Replenishments ..................................................... 61 Table A.3: SHCs in Sample and Their Characteristics ................................................................................................ 62 Table A.4: Sample Distribution Data for Last 3 SHC DRF Replenishments ..................................................... 62
Figures Figure 3.1 Drivers of Supply Chain Performance ......................................................................................................... 11 Figure 3.2: Framework as Mapping ................................................................................................................................... 20 Figure 4.1: The DRF System ................................................................................................................................................... 33 Figure 4.2: DMA Cost Breakdown ....................................................................................................................................... 38 Figure A.1: DRF Distribution System Summary ............................................................................................................ 61

6
Acronyms 3PL Third Party Logistics
A&E Accident & Emergency
ARV Antiretroviral drug
BI Bamako Initiative
CMS Central Medical Store
DFID Department for International Development (UK)
DMA Drug Management Agency
DRF Drug Revolving Fund
FMOH Federal Ministry of Health
HMB Hospital Management Board
KPI Key Performance Indicator
LGA Local Government Authority
LMIS Logistics Management Information System
MCH Maternal and Child Health
MDG Millennium Development Goal
MIT Massachusetts Institute of Technology
NDP National Drug Policy
PATHS Partnership for Transforming Health Systems
PHC Primary HealthCare Centre
PoD Proof of Delivery
RFQ Request for Quote
SCM Supply Chain Management
SDP Service Delivery Point
SHC Secondary HealthCare Centre
SMOH State Ministry of Health
SMS State Medical Store
THC Tertiary Health Care
UNICEF United Nations Children’s’ Fund
WHO World Health Organization

7
Executive Summary
A significant proportion of procurement and distribution of essential drugs in most countries in sub-Saharan Africa is done by the Ministry of Health (MoH) or a para-statal agency closely linked to the Ministry of Health. The drug distribution needs within a country, however, usually overwhelm such drug distribution logistic systems along one or more of these dimensions. Outsourcing provides one means of augmenting the performance of existing logistics systems as needed. However, our understanding of how to couple such outsourcing with government run systems in developing countries is very limited.
The purpose of this work is to develop a framework/approach for considering and selecting outsourcing opportunities as a means of improving public sector pharmaceutical supply chain performance. In addition, this work includes developing a set of tools for modeling the potential cost and performance of these outsourcing opportunities that can support the design and assessment of outsourcing policy proposals. The primary audience for this work is both developed and developing country policy makers and practitioners working in the pharmaceutical sector.
We first conceptualize the drivers of supply chain performance, in order to focus on the potential advantages that 3PLs can provide to the supply chain. The key drivers in our framework of supply chain performance include supply chain structure, management approach, and the individual capabilities of the supply chain actors/decision makers. The capability of both actors in the government run distribution system and potential 3PLs are considered pivotal for supply chain performance, and much attention was given to capability framing and assessment. Opportunities for improving supply chain performance can be understood in terms of operational related changes along the dimension captured by these drivers, we developed models for predicting performance improvements with more precision. Choosing an appropriate improvement opportunity involving outsourcing is presented as a process approach consisting of specific analytical steps including the assessment of the supply chain, multiple solution generation and multiple approaches to validation of solutions. The developing country context of these pharmaceutical supply chains presents salient constraints and challenges, such as capability development and funding for solution implementation, that are also addressed. Our approach is grounded by application to essential drug distribution in the state of Kano, Nigeria. Applying the frameworks in Kano provided an opportunity to refine the conceptual frameworks based on a reality. The application also strongly supported the need for developing supply chain improvements through an iterative process consisting of specific analytical steps rather than an application of a formulaic mapping. This iterative process heavily depended on the various constraints and complexities within the supply chain and the operating environments. The application of the model also served to validate the conceptual approach, and resulted in a series of recommendations for using and not using 3PLs.
8
1 Background A significant proportion of procurement and distribution of essential drugs in most countries in sub-Saharan Africa is done by the Ministry of Health (MoH) or a para-statal agency closely linked to the Ministry of Health. The typical model is that the manufacturers ship the drugs to the Central Medical Stores (CMS), which then distributes in bulk to district or regional warehouses, which in turn distribute supplies to hospitals, clinics, primary health centers etc. The model has variations depending on the country’s policies on decentralization (implying, for example, more tiers in the system) and on the policies with regard to public facilities being able to procure either from public or private sector.
The performance of such government run drug distribution systems (including transport, warehousing and stock management) can be characterized along the dimensions of geographic reach, flow capacity, leadtimes, cost, mix of products transported and reliability. (These dimensions are usually interrelated. For example, an increase in geographic reach usually implies an increase in cost.) The drug distribution needs within a country, however, usually overwhelm such drug distribution logistic systems along one or more of these dimensions. Outsourcing provides one means of augmenting the performance of existing logistics systems as needed. However, our understanding of how to couple such outsourcing with government run systems in developing countries is very limited.
These limits on our understanding of such hybrid systems can be considered to stem from three areas of ignorance. First, the operational dynamics of many existing government run drug distribution systems are still mostly a mystery; that is, the relationship between the different dimensions of performance, especially with respect to costs, is poorly understood. Second, there exists a similarly poor understanding of the performance potential for third party providers of such logistics systems. Thus ascertaining whether a third party is capable of meeting performance requirements along certain dimensions is difficult. Third, it is also not a trivial matter to combine government run distribution systems and third party providers to create a hybrid system that achieves the targeted performance. The factors that would govern the choice of third party providers such as their capabilities, system incentives or system performance needs, and the rules for implementing such hybrid systems are still largely unclear. One end result of these limits are that governments and policy makers are resistant to the use of outsourced systems as they have no means of evaluating how they will perform as compared to the status quo.
The purpose of this work is to develop a framework for considering and selecting outsourcing opportunities as a means of improving public sector pharmaceutical supply chain performance1. In addition, this work involves developing a set of tools for modeling the potential cost and performance of these outsourcing opportunities that can support the design and assessment of outsourcing policy proposals. The primary audience for this work is both developed and developing country policy makers and practitioners working in the pharmaceutical sector.
In section 3 we describe our approach for evaluating the opportunity for distribution outsourcing in a government run distribution system. In section 4, we provide the results of the application of our approach to a drug revolving fund in Kano, Nigeria used to provide essential medicines to primary and secondary health facilities within the state.
1 Although true public sector supply chains are not the only health commodity supply chains that could benefit from
outsourcing (for example, mission-based health commodity providers), we restrict our study to these supply chains.

9
2 Literature Review The general literature on 3PLs can be divided into three broad categories [1]. The first category of papers describes 3PL practices and trends in certain regions of the world. Predominately, papers in this category have focused on Europe and the USA, that is, developed countries. From this literature, frequently outsourced functions include warehousing, transportation and distribution. The main benefits of 3PLs suggested by these surveys include: cost savings, operational efficiency, flexibility and improvement of customer service[1]. In Europe and the USA, a mix of internal and external logistics services was found to provide better control and balance to ensure consistency and flexibility, and cross pollination of best practices and industry expertise [2]. Studies outside of Europe and USA are few, examples being Mexico[1], China [3], Malaysia [4] and Ghana [5]. The second category of research is part of the larger body of work on the conceptual basis of outsourcing, e.g., transaction cost economics [6], the importance, economic and otherwise, of the outsourcing decisions, and some general guidance on the factors that should be considered. These factors include categorizing capabilities or competencies, e.g. [7], cost analysis, associated risks, supplier influences and a strategic perspective [8]. The third category of research proposes practical frameworks for guiding managers through the process of making outsourcing decisions. Given the vast amount of literature in the second category, it is surprising that the number of papers in this third category is small [9; 10]. Whether framing the outsourcing decision as make vs. buy [11] or as general outsourcing [9; 10] the following general steps have been proposed for a process:
(1) Define or categorize activities. (2) Evaluate activities or organization and potential outsourcing partners (3) Evaluate outsourcing decisions.
In the second and third step of evaluations, cost analyses are prominent.
Given the focus of general management literature on developed countries, and the few frameworks for guiding managers with outsourcing, it is understandable that for government run drug distribution systems in developing countries there has been a lack of practical frameworks for outsourcing/the use of 3PLs in this context. This article then has the potential to contribute both the academic literature on outsourcing but also to help delivery practice.
Government run drug distribution systems offer some differences from traditional businesses that may affect aspects our framework for outsourcing or the use of 3PLs. Traditional businesses must seek to maintain possession or control of those activities that enable them to capture enough of the current and future value that they expect to create. As such, this adds constraints to the potential relationships that are appropriate for the traditional business. Government run drug distribution systems if anything are expected to operate with social welfare in mind or at worst, cost recovery.
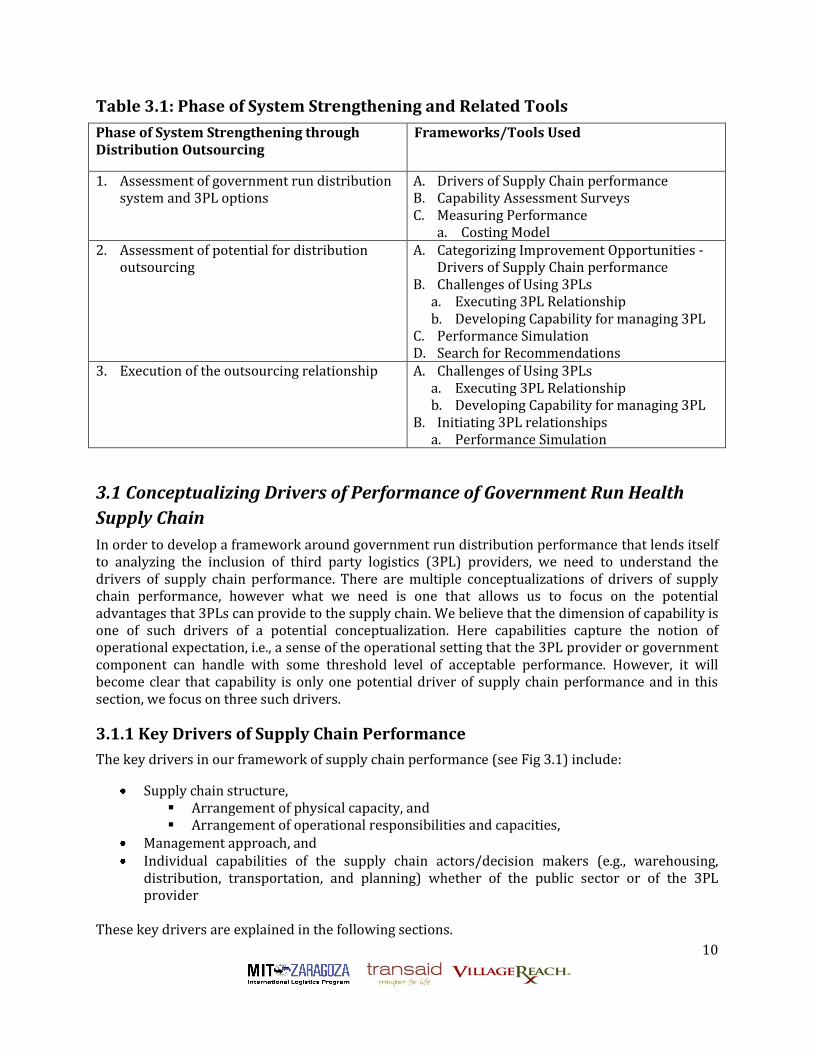
3. Distribution Outsourcing in Government-Run Distribution Systems In this section, we describe our approaches for assessing the need and potential for distribution outsourcing, and then the preparation for and execution of an outsourced relationship. For each phase of our systems analysis and strengthening approach, we require specialized frameworks and tools, which we also describe in this section. In Table 3.1 we provide a list of frameworks and tools used in each phase of our analysis.
10
Table 3.1: Phase of System Strengthening and Related Tools
Phase of System Strengthening through Distribution Outsourcing
Frameworks/Tools Used
1. Assessment of government run distribution system and 3PL options
A. Drivers of Supply Chain performance B. Capability Assessment Surveys C. Measuring Performance
a. Costing Model 2. Assessment of potential for distribution
outsourcing A. Categorizing Improvement Opportunities -
Drivers of Supply Chain performance B. Challenges of Using 3PLs
a. Executing 3PL Relationship b. Developing Capability for managing 3PL
C. Performance Simulation D. Search for Recommendations
3. Execution of the outsourcing relationship A. Challenges of Using 3PLs a. Executing 3PL Relationship b. Developing Capability for managing 3PL
B. Initiating 3PL relationships a. Performance Simulation
3.1 Conceptualizing Drivers of Performance of Government Run Health
Supply Chain
In order to develop a framework around government run distribution performance that lends itself to analyzing the inclusion of third party logistics (3PL) providers, we need to understand the drivers of supply chain performance. There are multiple conceptualizations of drivers of supply chain performance, however what we need is one that allows us to focus on the potential advantages that 3PLs can provide to the supply chain. We believe that the dimension of capability is one of such drivers of a potential conceptualization. Here capabilities capture the notion of operational expectation, i.e., a sense of the operational setting that the 3PL provider or government component can handle with some threshold level of acceptable performance. However, it will become clear that capability is only one potential driver of supply chain performance and in this section, we focus on three such drivers.
3.1.1 Key Drivers of Supply Chain Performance
The key drivers in our framework of supply chain performance (see Fig 3.1) include:
Supply chain structure, Arrangement of physical capacity, and Arrangement of operational responsibilities and capacities,
Management approach, and Individual capabilities of the supply chain actors/decision makers (e.g., warehousing,
distribution, transportation, and planning) whether of the public sector or of the 3PL provider
These key drivers are explained in the following sections.

11
Figure 3.1: Drivers of Supply Chain Performance
Supply Chain Structure
Supply chain structure covers the strategic choices of physical capacity and operational responsibilities and capacity and their location within the supply chain. It covers such areas as:
The choice of participants in the supply chains The division of roles within the supply chains among the participants Network design(e.g., number of tiers in the supply chain, physical transportation capacity,
physical warehousing capacity) Operational capacity
As the structural element of the supply chain structure driver suggests, this driver provides scope to the performance of the supply chain. For example, the proximity of a primary health center or community clinic to this community sets the scope for performance along such dimensions as reach, while their proximity to a storage location sets the scope for performance along such dimensions as cost or leadtimes. Operational responsibilities cover the division of roles in the supply chain and also create scope for performance. For example, collocating distribution with a central warehouse will have different implications for costs and utilizations compared to leaving the responsibility for distribution with individual facilities that receive commodities from the central warehouse.
Management Approach
The management approach driver covers the operational choices that govern how capacity in the supply chain and end-customer needs will be monitored and managed. The existence of supply chain structure does not ensure that the capacities and responsibilities captured in this structure will be used in a timely manner especially in response to end-customer needs and signals. These additional performance requirements, in turn, require what we refer to as the management approach that covers such areas as:
Decision making support Information system

12
Replenishment policy Incentives Contract types
Essentially how we monitor the end-customer and performance around the supply chains, and then enable responses to these signals of performance through motivation, decision-making and policies governing execution helps determine how much of the scope of performance, dictated by structure, the supply chain is able to capture.
Capabilities
Finally, related to structure but very significant for our purposes are the individual capabilities of the different components of the healthcare supply chain, e.g., warehousing and distribution. In assessing the components of the state run distribution system, it is helpful to distinguish between three types of capability to provide a sense of operating expectations.
Basic operations capability Advanced operations capability 3PL related capability
Basic operations capability, as the name suggests, refers to fundamental activities that define that component of the supply chain. For example, basic capabilities for a warehouse may cover activities such receiving, storing, managing spoiled/wasted product, and security. Advanced operations capability is the organizational features above and beyond those of a basic operations capability. Again considering our example of a warehouse, this may include different warehouse offerings such as public warehousing, contract warehousing, cross-docking, and general advanced operational capabilities such as problem solving or information technology connectivity. The distinction between basic and advanced capabilities could in some cases be subjective, but it reflects the need for being able to describe the wide diversity of capability that we would find in a developing country in terms that are more relevant to their operating potential. Third party logistics capability are the organizational features that support initiating and managing third party logistical relationships or managing a customer as a third party logistics provider. We say more about the third party logistics capability in section 3.4.3.
Table 3.2: Summary of Capabilities
• Basic Operational Capabilities – Capacities – Discreet Activities
• Storage, etc • Advanced Operational Capabilities
– Service offering • Product +
– Problem Solving – Connectivity – Ease of monitoring
• 3PL Related – Managing 3PL – 3PL managing client

13
3.2 Assessing Capability
One approach to assessing capability is an assessment/survey of the organizational and operational features that typically accompany/support this capability. In this section, we provide basic descriptions of the features of surveys that can be used for capability assessment. In our description, we focus on warehousing and commodity distribution. It is usually appropriate in giving these surveys that respondents be mid-level supervisors or managers with sufficient organizational proximity to the front-line operational personnel, but also have a broader understanding of the general policy expectations and justification of their organizations. See Appendix B for surveys that can be used for capability assessment.
3.2.1 Warehousing
Warehousing Basic Assessment
In this assessment, we focus on four basic activities for warehousing: receiving & shipping, storage, security and disposal of expired/spoilt medicines. Our four basic operational capabilities are assessed based on the system components of physical infrastructure2, informational infrastructure3, roles & responsibilities4 and finally processes5 that support these capabilities.
Warehousing Advanced Assessment
In this assessment, we focus on more advanced offerings from a warehouse such as pharmaceutical and regulatory experience, specific service offerings such public warehousing, contract warehousing, cross-docking services, pick-pack services and order fulfillment and any technology-based offering.
Warehouse 3PL Related Capability Assessment
For the potential management of the 3PL, we focus on the ability to identify and select 3PL, to interact and control the 3PL and to manage the risks associated with this arrangement. For the potential 3PL, we focus on issues such as client management, project management, and key performance indicator (KPI) measurement capabilities, potential for independent audits and contract types, e.g., cost plus and fixed price.
3.2.2 Commodity Distribution
Basic Capability Assessment
For commodity distribution, a number of separate abilities are considered under the basic capability assessment. These abilities are fleet management, data management, and forecasting and procurement.
Fleet management
The cost effective and efficient distribution of medical commodities requires a well managed transport operation. The presence of a comprehensive, disseminated, understood, and enforced
2 Physical infrastructure refers to the physical hardware that supports the warehouse activities/capabilities. 3 Informational infrastructure refers to the informational tools and their content that support the warehouse activities/capabilities. 4 Roles and responsibilities refer to the job roles and their definitions that support the warehouse activities/capabilities. 5 Processes refer to the sequence of activities and the operational logic encoded in that sequence.

14
policy underlies every successful transport operation. Without adequate planning, vehicles will at times sit unutilized or at other times be over-utilized leaving little capacity available to respond to emergency orders. A fit-to-purpose planned preventative maintenance regime will minimize vehicle downtime, reduce running costs and make planning more reliable. We focus on these features of policy, planning and maintenance in our assessment.
Data Management
In this assessment, we focus on the accuracy, speed of retrieval and breadth of data collected including not only financial transactions but also logistical considerations such as weight and volume, etc.
Forecasting and Procurement
Our survey for forecasting focuses on a forecasting process comprised of three steps:
1) Learning: Here we focus on features such as monitoring the performance of the forecasting approach and attempts to learn from past forecasting activities so as to create improvements in forecasting or maintain high forecasting performance.
2) Data Collection/Sharing: Here we focus on the data that is collected and used for forecasting and whether that data is appropriate for the task.
3) Quantification: Here we focus on the quantification of the forecast itself based on some methodology.
For procurement, we focus on the presence of a systematic approach that incorporates supplier leadtimes, inventory targets, monitoring of inventory levels and performance monitoring.
Advanced Capability Assessment: Problem Solving
Here the focus is on the particular types of problems that are particularly crucial to providing a particular service but may lie outside of the range of expertise expected for a particular participant of the supply chain.
3PL Related Capability Assessment
For the potential management of the 3PL, we focus on the ability to identify and select 3PLs, to interact and control the 3PL, and to manage the risks associated with this arrangement. For the potential 3PL, we focus on issues such as client management, project management, KPI measurement capabilities, potential for independent audits, and contract types, e.g., cost plus, fixed price.
3.3 Measuring Performance
In order to assess the government run distribution system and the potential for improvement using 3PLs we must consider metrics for performance and be able to benchmark the current system along those metrics and then be able to predict performance of the system after potential improvements. Performance for a supply chain can be characterized along the dimensions of cost, geographic reach, flow capacity, leadtimes, products transported, and reliability. Examples of metrics for each dimension include:
Costs Distribution costs per unit delivered

15
Distribution costs per patient treated Procurements costs per patient treated Geographic reach
Percentage of facilities serviced Stock outs at facilities serviced
Flow capacity Maximum total cubic volume of transport equipment
Leadtimes Average response times including/excluding delivery times
Products transported Percentage of products on government state lists
Reliability Variability in average response times
For all of the examples above except costs, measurement though not trivial, is not very difficult because the measurements are generally required at only one point in the supply chain. Costs, however, present a challenge, since it requires measurements at multiple places in the supply chain. In addition, in developing countries’ supply chains, data at times can be a luxury. We focus on costing the supply chain given its difficulty but also because of its ability to help uncover the important dynamics in the supply chain, and because of its importance in determining the allocation of scarce financial resources.
3.3.1 Costing the Supply Chain
Previous Studies
Previous studies have attempted similar cost studies of public sector supply chains. Individual findings of such studies include:
1. In Ghana, storage was found to be the largest cost for the supply system partly due to the three tiers of storage - central, regional and district [12].
2. In Uganda, the MoH was found to be paying more than a fair share of costs in the system [13].
3. In Zimbabwe, budget analysis was also crucial for revealing impediments to effective supply chain performance. Costing multiple alternatives was also found to be crucial for decision making [14].
In Zambia, cost of delivering ARVs in studied areas ranged from 7.6-16.1 percent of the value of the commodities [15].
Challenges of Costing Developing Country Supply Chains
Costing developing country supply chains has many additional challenges. Firstly, the availability of data and the quality of this data is the foundation of any costing methodology, but in some developing countries, good quality data may not exist or be shared. Data can be particularly challenging to secure in supply chains with costs distributed to different agencies throughout the supply chain, rather than being managed and spent by a central entity, as well as in supply chains where there are no budget lines allocated to the distribution of medicines and supplies at some levels in the supply chain. In particular, costing can be met with resistance as it can potentially

16
reduce inefficiencies and corruption [13] and withholding cooperation in the form of sharing data is one means of protest.
Secondly, given the size of the supply chain, sampling is a necessary feature of any methodology. Such sampling methodology should strive for representativeness but settings may not always allow for an ideal sampling approach [12],[13],[14],[15]. Many developing country supply chains use a collection system for part or all of their supply chain and estimating transportation costs when a large number of service delivery points (SDPs) operate this collection system with varying transport options, e.g., public transport, ambulances or private transport, is difficult [12]. Additional complications arise when supply chains do not operate in a routine system. For example, in addition to changing forms of transport, the frequency of distribution, staffing, and supply chain structure can all vary within a given location.
Estimating levels of wasted stock given the potential for such stock to have been accumulating over a number of years can prove an additional challenge [12]. A cost analysis must be specific to the situation, i.e., is it cost recovery that is the crucial question of performance or is it the costs for additional activities say through expansions that are crucial (incremental cost analysis6)? [13]. The answer to that question is likely to vary based on the audience of the costing, and could result in a situation where the selection of costs that should be included by the supply chain manager conflicts with the funder of the costing exercise, for example. In addition, usually “there is no universal definition for what must be included in fixed, variable, direct and indirect costs” [13].
Finally. in some settings, not only is it important to understand the costs of operating the supply chain system but also who helps bear what costs. A holistic cost treatment, that recognizes as many resources that contribute to distribution as is possible, will undoubtedly highlight the different sources of funding for supply chain costs - some from state, federal, donor, NGOs, etc – that characterize many developing country settings. Such realities can create a dilemma for improvements such as 3PL outsourcing as, although net system savings may exist, achieving these savings could result in costs increasing for one funding source relative to others. How politically should such solutions be broached especially when the analysis paints the costs quite explicitly?
Methodology Description: Distribution Costing
Approach and Model
Our distribution costing model costs the supply chain from a central warehouse to service delivery point facilities. Our approach handles collection system settings, incorporates cost of time of non-SC personnel involved in SC activities and is comprehensive including costs of transportation, inventory, commodity, management, etc.
When costing data is not available but must be collected, random and purposive sampling methodologies are appropriate, with the choice of methodology depending on the situation7. Given
6 Incremental cost analysis reflects analysis to determine how costs will change with change in service or
product offered. Cost Recovery analysis reflects analysis to evaluate whether cost of services incurred for a client are covered by the revenue from that client. 7 In random sampling, a probability proportional to health facility size (as measured by commodity use or population catchment) is generally used for selection of facilities. In purposive sampling, we sample based on one or more specific predefined groups that we are seeking and ensure that these predefined groups are represented in the sample. There are multiple approaches that can be categorized as purposive sampling.

17
a sample of health centers, our costing model approach traces the supply chain activities for the past three replenishments to these health centers, and gathers information on the costs of these activities.
Costs in the model projections include those related to distributing commodities of the supply chain being evaluated. These costs include:
Commodities, including a wastage factor. Personnel costs for distribution transport, warehousing, and management.
Salaries, including only the portion of salary corresponding to the time allocated for the task.
Per diems Transport costs
Vehicle depreciation
Vehicle insurance costs
Fuel
Vehicle maintenance including labor and parts
Vehicle breakdown repairs including the labor, parts, and per diem for traveling time for breakdowns that require transport to another location.
Public transport usage costs Cold chain costs
Cost of fuel to power the refrigerator Refrigerator maintenance costs Refrigerator repair costs. This includes the cost of labor, per diems, and parts for
repairs. Cost Measurement
Only costs directly related to the supply chain being evaluated are included. For example, if a pharmacy technician spends two days in a month picking up medicines and supplies, only that percent (2 days / total 22 working days in a month) of his or her salary is included in final costs. If the technician’s trip was only half for vaccine distribution, then only half of the percentage of his or her salary was included. The same principle was applied to all cost-bearing activities.
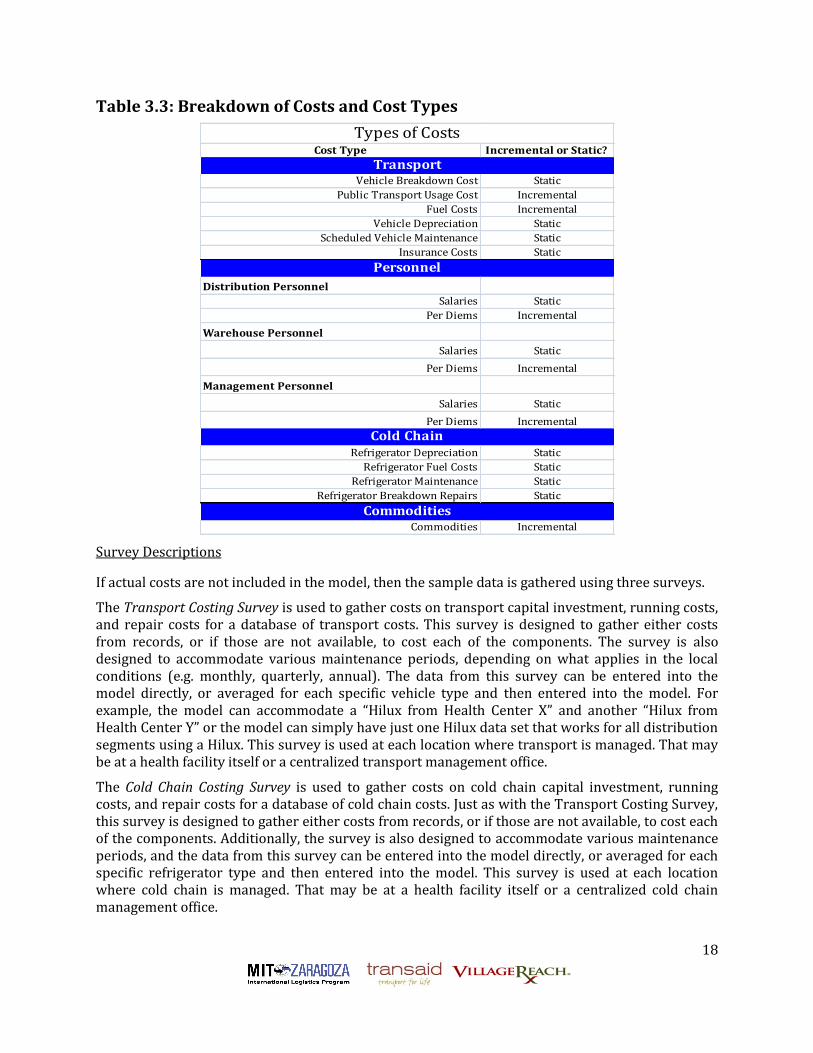
The model includes both static costs -costs that are incurred regardless of how the distribution system is managed under the DRF - and incremental costs - costs that are incurred because of how the distribution system used.8 It is important to classify costs in this way because they have decision-making implications, and different implications on budgets and expenses. For example, static costs are not likely to change depending on the supply chain design or operations, but incremental costs are subject to change with improvements or changes to the supply chain. For budgeting purposes, this is important also because while overall a long-term budget may decrease, there may be line items that increase in the short-term to realize those savings. Additionally, the categorization of costs in this way is useful when examining the constraints, and particularly who pays for changes in the supply chain. The table below shows a breakdown of costs and their types. In Appendix A.1 we provide additional specifics on our costing model approach.
8 Static and incremental costs are similar to fixed and variable costs respectively.
18
Table 3.3: Breakdown of Costs and Cost Types
Cost Type Incremental or Static?
Vehicle Breakdown Cost Static
Public Transport Usage Cost Incremental
Fuel Costs Incremental
Vehicle Depreciation Static
Scheduled Vehicle Maintenance Static
Insurance Costs Static
Distribution Personnel
Salaries Static
Per Diems Incremental
Warehouse Personnel
Salaries Static
Per Diems Incremental
Management Personnel
Salaries Static
Per Diems Incremental
Refrigerator Depreciation Static
Refrigerator Fuel Costs Static
Refrigerator Maintenance Static
Refrigerator Breakdown Repairs Static
Commodities Incremental
Personnel
Types of Costs
Transport
Cold Chain
Commodities
Survey Descriptions
If actual costs are not included in the model, then the sample data is gathered using three surveys.
The Transport Costing Survey is used to gather costs on transport capital investment, running costs, and repair costs for a database of transport costs. This survey is designed to gather either costs from records, or if those are not available, to cost each of the components. The survey is also designed to accommodate various maintenance periods, depending on what applies in the local conditions (e.g. monthly, quarterly, annual). The data from this survey can be entered into the model directly, or averaged for each specific vehicle type and then entered into the model. For example, the model can accommodate a “Hilux from Health Center X” and another “Hilux from Health Center Y” or the model can simply have just one Hilux data set that works for all distribution segments using a Hilux. This survey is used at each location where transport is managed. That may be at a health facility itself or a centralized transport management office.
The Cold Chain Costing Survey is used to gather costs on cold chain capital investment, running costs, and repair costs for a database of cold chain costs. Just as with the Transport Costing Survey, this survey is designed to gather either costs from records, or if those are not available, to cost each of the components. Additionally, the survey is also designed to accommodate various maintenance periods, and the data from this survey can be entered into the model directly, or averaged for each specific refrigerator type and then entered into the model. This survey is used at each location where cold chain is managed. That may be at a health facility itself or a centralized cold chain management office.

19
The Distribution Costing Survey is used to gather the frequency of replenishment, cost allocations for personnel and transport, and allocation of distribution costs to the specific supply chain. The data from this survey is entered directly into the model, and is not averaged. This survey is used at each stop in the supply chain where commodities are transported. For example, if a province delivered commodities to a district and then the district delivered them to a health center, then this survey is administered at the province to determine the costs of delivering to the district, and also at the district to determine the costs of delivering to the health center. However, note that to determine where the survey must be administered often starts with the bottom of the supply chain asking the health center when and where they last received the commodities. Continuing on the example, if in January the district delivered to the health center, but in February and March the health center collected the commodities, then the survey must be administered in both locations.
Depending on the level of existing data available, each survey takes between 30 – 60 minutes to administer.
Study Population
The surveys are to be administered to health facilities, health management, and transport and cold chain managers. The table below describes the general study population by survey type. The specific person to administer the survey to depends on the health system local structure and context.
Table 3.4: Study Population by Survey Type
Survey Administered To
Transport Costing Survey Transport manager at centralized or local facility
Accounts manager (if actual cost expenditure data exists)
Cold Chain Costing Survey Cold chain manager at centralized or local facility
Accounts manager (if actual cost expenditure data exists)
Distribution Costing Survey Distribution manager at each supply chain stop
In the context of low-income country public health systems, these positions are often health workers, pharmacy staff, and/or health management staff.
Methodology Description: Warehouse Costing
Approach and Model
The warehouse model costs the warehouses and major storage depots within the supply chain. Usually the number of such sites is small enough that sampling is not necessarily a major feature of the approach. However, if sampling is needed, a similar philosophy to that of the distribution costing approach is appropriate. Surveys and study population are similar to that of the distribution costing approach.
We focus warehouse costing around three components:
Occupancy costs including utilities, depreciation etc. whether these costs are shared other programs using the warehouse or not
Salary and benefits

20
Inventory investment costs including expiry, inflation, foregone real interest, insurance, etc.
3.4 Framework for Improvement Using 3PLs
Essentially a framework for outsourcing opportunities is a mapping from the capabilities of the public sector and interested 3PL providers onto a particular choice of supply chain structure and management approach. This choice should also be driven by the particular short and long term priorities expressed by relevant stakeholders for the public sector supply chain. This idea is captured in Figure 3.2 below. Determining the appropriate outsourcing recommendation including the incorporation of 3PL providers or not, is best approached as a process consisting of specific analytical steps rather than an application of some formulaic mapping. These steps include multiple solution generation and multiple approaches to validation of potential solutions. Multiple approaches to validation of potential solutions are needed because of the implications for changes in the supply chain especially changes involving the use of 3PL providers. These implications include various constraints that are technical, resource related and political as well as the challenges of using 3PLs such as developing the capability for managing 3PLs.
In this section, we first classify supply chain improvement opportunities using our framework from section 3.1 on key drivers of supply chain performance. Next, we consider constraints that create additional challenges for potential recommendations. We then examine specific implications of the use of 3PLs and then describe a performance simulation model important for validation of recommendations. Finally, we describe the process of analytical steps for determining the appropriate outsourcing recommendations.
Figure 3.2: Framework as Mapping
3.4.1 Classifying Improvement Opportunities
There are multiple ways in which the supply chain in developing countries can be improved. Improvement however is generally either the result of economizing or creating new opportunities
Public sector capabilities
3PL capabilitiesShort-term & long-term priorities
Framework: Mapping
Outsourcing Recommendation-Supply Chain Structure-Management Approach

21
to create value. Based on our framework for drivers of supply chain peformance, improvement can be the result of:
1) Redesign supply chain structure a) to reduce waste opportunities b) to take advantage of economies, e.g., economies of scale in expansion or in task aggregation c) to provide capacities to extend the reach of the supply chain or the set of services it
provides d) to match capabilities
2) Redesign management approach a) to improve monitoring of system b) to improve speed or quality of decision making/response to system c) so as not to impede, but motivate, required capabilities d) to better complement supply chain structure
3) Improving capabilities a) to provide basic support, i.e., have basic capabilities at a threshold b) to fit current or redesigned supply chain stucture and management approach
For the above individual components to improve supply chain performance, changes can either be made through changes limited to the government run distribution system as it is or by involving 3PL providers. The table below summarizes the potential contributions of 3PL providers in supply chain improvements.
Table 3.5: Summary of Supply Chain Improvenment Opportunities & Potential
3PL Contributions
Supply Chain Improvement
Opportunities
3PL Contribution
Improve basic capabilities 3PL agent replace base activity
Economies of scale in task aggregation Assign tasks to 3PL agent
Better support for decision-making 3PL agent has better basic capabilities
3PL agent contributes advanced capabilities
Economies of scale in expansion 3PL agent provides additional capacity quicker
SC structure redesign 3PL agent provides specific capacity quicker
Base focus on more critical activities 3PL agent assumes non critical tasks
Redesigning Supply Chain Structure
In redesigning the supply chain structure, 3PL providers can provide capacity for extending the reach or services of the supply chain or help take advantage of economies if their capabilities allow. Essentially, a 3PL provider is a quicker way of providing potentially well-tested capacity for these purposes, rather than building the capacity within the government run distribution system. Some opportunities for redesigning the supply chain structure, such as reducing waste opportunities,

22
may not be dependent on the choice of 3PL capacity versus base capacity. In some situations however, the structural redesign is meant to complement the capabilities that are available in the supply chain, in which case, it could be completely dependent on the capabilities of any 3PLs that are integrated.
Redesigning Management Appraoch
In redesigning the management approach, the focus is on improving the efficiency and effectiveness of the monitoring of the supply system and its end-customers as well as the response to the information provided through monitoring. The choice of 3PL versus directly improving the base hinges on the opportunities for system integration in terms of monitoring and executing decisions that result from this monitoring. In many developing countries, the management approach is a hybrid of rudimentary legacy systems and approaches resulting from technical assistance and requirements for aid from external donors. These requirements for aid from external donors even determine some of the policy concerning how 3PLs should be engaged. Typically, the management approach generally conforms to the government-run distribution system and its capabilities and idiosyncrasies, and a 3PL must be able to adapt. 3PLs can provide some flexibility in terms of motivation and costing. Typically, the bureaucratic setting of the government-run distribution system implies poor flexibility with respect to how activities and personnel are compensated. However, there is usually more latitude with the design of 3PL contracts so that the attention towards particular activities or efficiencies can be emphasized. In such cases, incentives can more easily be matched to the cost structure inherent in the supply chain structure which can lead to more efficient use of resources by the 3PL compared to the base.
Improving Capability
As capability is the engine for supply chain performance and capability can differ between 3PLs and the base, 3PLs provide a quicker way of introducing potentially well-tested capability into the supply chain. In the case of basic capability, a 3PL can raise the level of basic capability to a required threshold. In the case of advanced capability, such capability can better complement a redesigned supply chain structure or management approach.
3.4.2 Constraints
While capability is a primary consideration of including 3PLs, there are a number of constraints and barriers to change that can also play a big role in the decision to use 3PLs, the ability of 3PLs to perform in the specific environment, and their implementation. These constraints can be divided into three categories: technical, resource, and political.
Technical Constraints
The biggest technical constraint to using 3PLs is the capacity of 3PLs and the government to manage them. This constraint is addressed throughout the framework, so it is excluded from the discussion in this section. To guide technical constraints, the analysis should include an examination of:
1. Who performs what role in a proposed supply chain improvement? 2. How does that differ from the roles performed currently? 3. Do they have the ability to fill that role in this operating environment?
One technical constraint that should be examined is government policy related to outsourcing. Is outsourcing allowed (or disallowed) by law? What is the process to go about securing and

23
maintaining an outsourced provider? Is it possible to follow that process in the given situation? If a government allows outsourcing of government activities, but the process is particularly long or challenging, then it may not be possible to implement.
Next, what is the policy related to handling of medicines and medical supplies? Such policies may be determined by the government, parastatal organizations handing medical stores, and/or donors supporting drug purchases. For example, there may be a policy that dictates that a parastatal medical store is responsible for the drugs up until the point it reaches the service delivery point, and this requires the medical store staff physical presence until that point. In the case of policy, what is the feasibility of incorporating a 3PL? What is the feasibility of changing the policy?
Another consideration is the policy and practices around storing medicines and medical supplies. As above, there may be regulations related to who may store drugs, and perhaps even certifications or required registrations to store the products. Similarly there may be entrenched practices as to how drugs or stored or even how many drugs are stored. For example, while efficient logistics systems would call for maintaining appropriate stock levels that are not too high or too low, practice might be to store too much stock as a risk mitigation strategy.
A fourth technical consideration is the reliability of the private sector in general. While the capacity of the private sector for 3PLs constitutes a large part of the framework, the general reliability of the private sector will help to determine if the 3PLs will stay in business long enough to risk outsourcing services to them. For example, in some low-income countries, there is a hesitancy to outsource because there is a general belief that business come and businesses go so it is not worth the effort to outsource to a 3PL when they may shut their doors in a few months.
Resource Constraints
The concept of resource constraints is all too familiar in low-income countries. To guide an analysis of resource constraints, it is important to ask:
1. Who is paying for what in the current system? 2. How does will that change in the proposed improvement? 3. Is that party willing and able to absorb that change?
First, in examining resource constraints, it is important to map the budget holders in the supply chain as it is currently and with the proposed improvement. This answers the first question above of who pays for what. When compared to the activities performed in the supply chain, this exercise may also reveal who is financially profiting, breaking even, or losing money in the current system, and that will reveal who is likely to support or resist changes. This ability to support or resist should also be mapped against their power in making the improvement decision and implementing it. For example, if it is revealed that health centers are losing money on the existing system but will break even in the proposed improvement, they are likely to support the improvement. But what will their support accomplish? It may have no bearing on the decision, but facilitate a successful implementation.
Another major resource constraint is the requirements for an up-front investment in the proposed change. Does the proposed improvement require an expense to implement? Does that expense result in savings over time? Do the savings overtime recoup the initial investment? Who will pay for that investment? Is there a need for a repeat of the investment after a certain time

24
period, e.g. 3 years? If yes, who will pay for that? In low-income countries where budgets are stretched, decisions are sometimes made to continue with a system that is more expensive over the long-term but affordable now. Similarly, if an investment is required every few years, it may be preferable to avoid the change thereby avoiding additional fundraising activities every few years.
Political Constraints
Political constraint can be a major impediment to changes in a supply chain, and the use of a 3PL provider in the supply chain. General questions to guide the analysis of political constraints include:
1. Who has a vested interest in the current system? 2. For those with a vested interest, will they resist the proposed change and what is the
implication of their resistance? 3. Who would have a vested interest in the proposed change? 4. For those with a vested interest in the proposed change, what is the implication of their
support for the proposed change?
Data and knowledge equal power in a supply chain. Data tells you where the drugs are and where the drugs went. This is particularly important for drugs that have a high street value and are often subject to diversion. A proposed improvement to the supply chain may change who has access to data and knowledge about the status and whereabouts of drugs, and this may create resistance by some parties, while fostering support from other parties. It is critical to look at the changing role of data and information with proposed changes.
Ownership of results is another area of political constraints that should be analyzed. At the end of the day, who will be held responsible for logistics problems? Who will be held responsible for more targeted problems in the supply chain, such as facility stock outs or diversion from warehouses? These are the people and functions that bear the risk for the 3PL service provision, and if they resist hiring or implementing a 3PL, the chances of success decrease. How do these stakeholders feel about transferring the responsibility for the activities to someone else? Can they trust a 3PL to provide better results than they do? This is also an important consideration when different health programs are pitted against each other.
A third area for political constraints is donor involvement. What donors are involved in the supply chain? What regulations and policies – formal and informal – do they have regarding the supply chain improvements? Donors, especially large donors, often have a big voice in making decisions about supply chain, often proportional to the size of their donation. Their perspectives should be examined and understood to understand if they facilitate or hamper the supply chain improvements.
Finally, political ideologies can serve as a constraint. Ideologies could consist of the role of the government in the health system, where certain activities should be performed within a health system, and the role of the private sector in the public health system operations. For example, in some countries the private sector may be embraced as a player in the public health system, thus facilitating outsourcing to 3PLs. Another example, is the role of decentralization that may be taken to mean that the district (or local government) should be carrying out the activities to support the health system in their catchment, which may hamper the use of 3PLs or other supply chain improvements.

25
3.4.3 Operating with 3PLS
Challenges of Using 3PLs
Many challenges accompany the use of 3PLs, which should be addressed before considering their use. Firstly, if a 3PL is introduced in order to assume activities that were originally performed by the base, then the base can lose some of the skills attached to these activities or not proceed to develop these skills further. The transition of activities from the base to the 3PL can also be challenging and touch on sensitive issues of politics and power dynamics, as discussed above. For example, who maintains responsibility for the drugs when being managed by the 3PL? As an expensive commodity purchased by the government that is highly susceptible to theft, the government is accountable for the drugs and some may be reluctant to hand over the commodities to a 3PL when the public holds the government accountable for them. Additionally, a 3PL adds a decision maker or partner to the supply chain which requires additional coordination and information sharing, increasing the complexity of the required management approach. Finally, there is a risk of poor service from the use of a 3PL. This poor service can result from poor oversight by the base or inappropriate experience on the part of a 3PL partner with the existing or redesigned supply chain structure or management approach.
Developing the Capability for Managing 3PLs
The major challenge for executing a 3PL engagement is that of developing the 3PL management capability within the public sector. One reason why this is challenging is that it requires an appreciation for good basic and advanced capability in order to appreciate/recognize it in a 3PL. In some cases however, a 3PL could be used to introduce a level of capability into the supply chain that was not there before. This leaves the base in the position of having to value and also recognize this capability.
Another aspect of the challenge of outsourcing is that it can be described as managing from a distance. A 3PL is usually not monitored continuously and in some cases does not provide close proximity for frequent observations. Such a setting can stretch already suspect management capabilities, particularly in the context of dealing with such expensive, high demand commodities.
Finally given that managing 3PLs is a capability like that of basic or advanced, we argue that it must be nurtured through a set of time intensive activities, including mentoring, allowing for trial and error, and visualizing improved performance. This implies an Explicit Capability Development Plan driven by proven operations principle rather than wishful thinking9. In particular, developing 3PL management capability should usually begin with some attempt to create the basic or advanced capability of a 3PL in-house, even on a small scale. Especially in cases where the success of the hybrid system will require intense coordination between the parties, such an approach to developing 3PL management capability can create appreciation for the operational challenges faced by the 3PL providing common ground for the required collaboration.
9 A particular situation that provides an example of this is the way in which Toyota brought its unique production system to the US back in the 80s and 90s. For its first Greenfield plant, it brought mentors from Japan to the US who spent upwards of three years teaching their counterparts in one-on-one settings how to think of themselves and their operational roles and responsibilities and then slowly ramped up production sacrificing short-term productivity for true capability development.

26
3.4.4 Performance Modeling
Although an understanding of the drivers of supply chain performance can be obtained using the categories of supply chain structure, management approach and capabilities that we have discussed in this article, a prediction of the changes in costs that would result from improvement opportunities is a powerful tool. In order to generate these predictions we created a model that simulates distribution and warehousing costs for a particular supply chain structure and certain elements of the management approach specifically different contract types.
The distribution model we created is an Excel-based model with average distribution flows, average distances between destinations, average volume of inventory sent to a destination, average number of destinations in a route, etc., as its basic template. The use of averages in this way implies that volatility is assumed to "average out". This assumption is for tractability of the model. Other significant features of the model include:
Costs simulated include fuel costs, depreciation, maintenance, insurance, distribution manager and distribution personnel salaries, etc.
Transport volume constraints and time constraints for realistic considerations on transportation
Heuristic optimization of number of destinations on a route10 Sharing of vehicles and personnel over different network configurations Different 3PL contracts, e.g. cost per kilogram, cost per kilometer, cost per trip, cost per
destination Operational statistics for sharing with 3PL expected logistical responsibilities, e.g., number
of days of distribution, number of round trips, number of destinations, etc. Optimization of certain supply chain structure and management approach features via
search across potential parameters
The warehousing model we created is also an Excel-based model which simply captures the relevant warehouse related costs as planned for the government run distribution system or as expected from a warehousing 3PL. The costs emphasized in the model are the same as in our costing survey mentioned earlier:
Occupancy costs including utilities, depreciation etc. whether these costs are shared other programs using the warehouse or not,
Salary and benefits,
Inventory investment costs including expiry, inflation, foregone real interest, insurance, etc.
3.4.5 Searching for Recommendations
Our approach to choosing the appropriate improvement option for supply chain is best described as an iterative process consisting of specific analytical steps rather than an application of some formulaic mapping. Within supply chain systems, usually more than one solution can meet expectations for improvement. In addition, supply chain systems and recommendations for their
10
In this case, the model is able to choose number of destinations on a route that helps to minimize costs of
distribution.

27
improvement can be complex, usually composed of multiple subcomponents. The implication of both of these observations is that the determination of a solution is more appropriately considered as a search through the potential solution space including different options for the subcomponents of the solution. In particular, for this search, it is appropriate for initial options to be constrained as little as possible by priorities and constraints, and in sequential iterations, priorities and constraints are reintroduced. Our approach reflects this search implication and steps of our approach include assessment of the supply chain, multiple solution generation, and multiple approaches to validation of potential solutions based on the implications raised in previous subsections. In Table 3.6, we provide a summary of the steps of the iterative process and then describe these steps below along with observations about implementing each step.
Table 3.6: Summary of Iterative Process for Recommendation Generation
Step 1: Understand the drivers of government-run supply chain performance.
As we have argued in this article, this first step involves the capability assessment of the government-run drug distribution system and mapping of both the supply chain structure and management approaches at work. Performance assessments, especially costing of the supply chain, are particularly important here for grounding the relationship between drivers and performance measured.
Observations:
1 Current management approaches may not have been designed with an accurate picture of the costs or performance implications. The fact that it is often necessary to take deliberate steps to understand the drivers of supply chain performance can mean that the design of the current management approach may not have been undertaken with such an understanding. As a result, potential mismatches may be lurking.
2 Current structural approaches may be significant cost drivers. Again, the structural design of the supply chain could have been made without an accurate picture of the cost/performance of the supply chain and potential mismatches again may lurk.
Step 1: Understand the drivers of government-run supply chain performance.
Step 2: Consider improvement options as dictated by capability deficiencies in base operations and complementing strengths in potential 3PL providers.
Step 3: Cost various options and predict performance.
Step 4: Assess the fit with short-term and long-term priorities.
Step 5: Assess additional resources for implementing alternative options.
Step 6: Iterate through steps 2-5 as needed incorporating a successively larger number of constraints and implications of potential choices.

28
Step 2: Consider improvement options as dictated by capability deficiencies in base operations
and complementing strengths in potential 3PL providers.
This step assumes that a capability assessment of potential 3PLs is available. In some cases, the assessment of 3PLs can be substituted with plausible performance/cost expectations for such 3PLs based on prior experience or experience in other industries or even countries. Note here that initially we strive not to constrain our improvement options by our short or long-term priorities or by additional resource, technical or political constraints. This affords a more open-minded approach to the search for improvement opportunities. This is important because there is usually no one best approach to improvements, and in some cases recommendations can be created from piecing together "winning" attributes from various solutions.
Observations:
1 The performance drivers, supply chain structure and management approach, should also be considered as potential pieces of the puzzle. As mentioned in section 6.1, all three drivers of supply chain performance-supply chain structure, management approach, and capability- are potential dimensions along which improvements can be generated for the supply chain. In particular, current structure and approaches may not be inhibitors of current performance with current capabilities, but may do so given a change in capability resulting from local improvements or the introduction of a 3PL.
2 It is beneficial to be explicit about the justification for the expected improvements from a particular solution. Not only does this practice ensure that the solution has received sufficient examination, it also creates an explicit hypothesis about the dynamics of the supply chain that can be tested either by a model simulation, or a pilot, or feedback from supply chain personnel.
3 Weak basic and advanced capabilities can be improved with the local improvements. Although the 3PL can provide the option of readily available capability, it should be borne in mind that local capability, basic or advanced can be improved.
4 Improvement options that involve the use of a 3PL will need 3PL management capabilities for support.
5 The development of capabilities, especially 3PL capabilities, of the proven solution should be accompanied with an explicit capability development plan.
Step 3: Cost various options and predict performance.
Here, the performance simulating model is a powerful tool for sifting through the various options. Models that provide some elements of optimization can also help eke the best performance possible out of a particular solution approach. A model is not the only way in which solutions can be analyzed, as in some cases feedback from supply chain personnel can be even more valuable in terms of feedback about feasibility and expected results.
Observations
1 Confirmation or refutation of initial justifications for solution approaches can help improve understanding of supply chain dynamics. As mentioned in the observations of step 2, being explicit about the justifications for particular solutions is helpful when validating the solutions, as the process of validating the solution can provide evidence that the dynamics of the supply chain have indeed been understood.

29
2 In the development of capabilities, some basic capabilities are generally easier to develop than advanced capabilities, while in other cases the opposite is true. This observation speaks to the complexity of the activities that define a capability. In some cases it is the basic capability that has a more complex set of activities in comparison to the activities that represent the advanced capability, and in some cases the reverse is true.
Step 4: Assess the fit with short-term and long-term priorities
At this point in the process, specific priorities for the supply-chain and for health system delivery in the developing country can also be used to screen solutions in light of their performance assessments.
Observations
1 Tensions between short and long-term priorities may exist for certain solutions and not necessarily for others, however tensions aren't necessarily bad; they may reflect the operational realities for the two priorities.
Step 5: Assess additional resources for implementing alternative options
This step recognizes that solutions may vary in terms of the costs to various contributors to the supply chain, e.g., Ministries of Health, NGOs, global aid partners, etc. As a result, the feasibility of certain solutions depends on the resources available to the individual donors and their willingness to fund these solutions and potentially share savings with other contributors.
Observations
1 Some contributors may need to increase their contribution of one resource to the supply chain in order to receive savings on other resource contributions. Though improvements for the health system may create net system savings, these savings may not be equally shared among all contributors to the health system, and furthermore savings may be divided across the various resources that a particular contributor supplies. Capturing these savings may mean that the contributor needs invest additional resources, so as to implement the solution, and then capture the returns in terms of savings on other supplied resources.
Step 6: Iterate through steps 2-5 as needed incorporating a successively larger number of
constraints and implications of potential choices.
This step emphasizes a sequential process of learning/understanding about both the supply chain and potential improvement options that occurs through steps 2-5, so much so, that successive iterations through the steps is beneficial for strengthening solution options, refining choice criteria based on priorities (long and short term) and constraints (resource, technical and political), and ultimate final recommendation generation.
Observations
1 Steps 2-5 sequentially layer additional constraints on potential solutions.
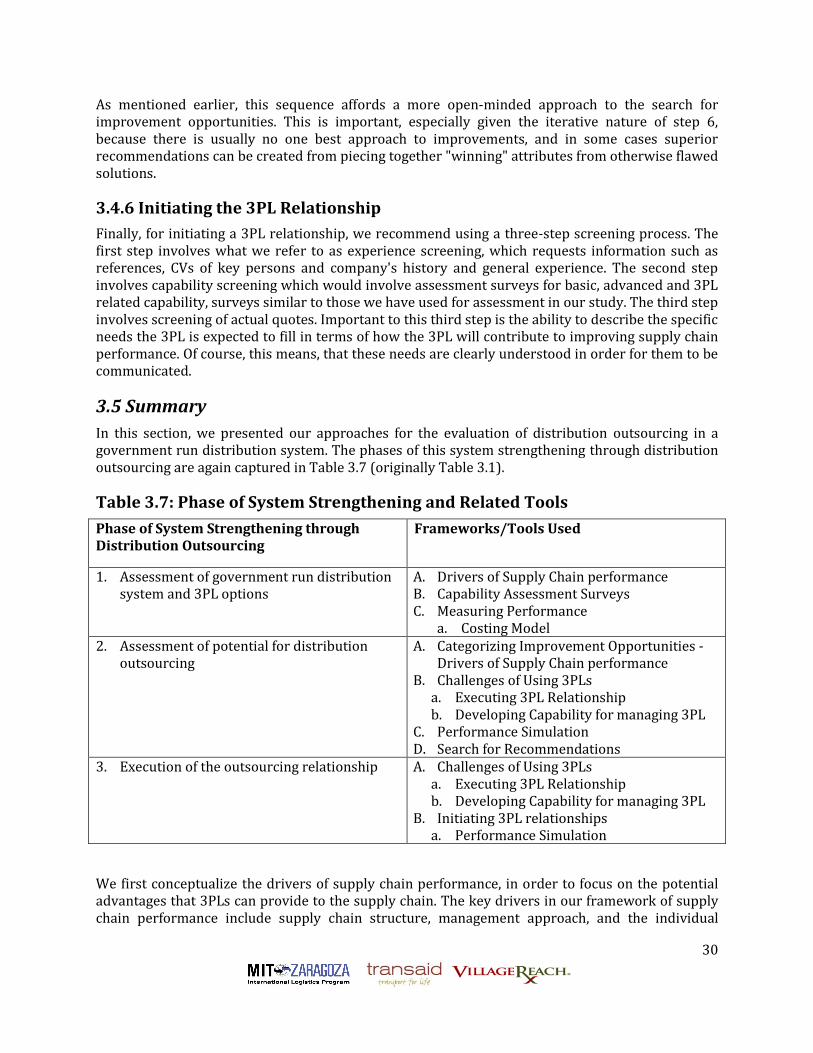
30
As mentioned earlier, this sequence affords a more open-minded approach to the search for improvement opportunities. This is important, especially given the iterative nature of step 6, because there is usually no one best approach to improvements, and in some cases superior recommendations can be created from piecing together "winning" attributes from otherwise flawed solutions.
3.4.6 Initiating the 3PL Relationship
Finally, for initiating a 3PL relationship, we recommend using a three-step screening process. The first step involves what we refer to as experience screening, which requests information such as references, CVs of key persons and company's history and general experience. The second step involves capability screening which would involve assessment surveys for basic, advanced and 3PL related capability, surveys similar to those we have used for assessment in our study. The third step involves screening of actual quotes. Important to this third step is the ability to describe the specific needs the 3PL is expected to fill in terms of how the 3PL will contribute to improving supply chain performance. Of course, this means, that these needs are clearly understood in order for them to be communicated.
3.5 Summary
In this section, we presented our approaches for the evaluation of distribution outsourcing in a government run distribution system. The phases of this system strengthening through distribution outsourcing are again captured in Table 3.7 (originally Table 3.1).
Table 3.7: Phase of System Strengthening and Related Tools
Phase of System Strengthening through Distribution Outsourcing
Frameworks/Tools Used
1. Assessment of government run distribution system and 3PL options
A. Drivers of Supply Chain performance B. Capability Assessment Surveys C. Measuring Performance
a. Costing Model 2. Assessment of potential for distribution
outsourcing A. Categorizing Improvement Opportunities -
Drivers of Supply Chain performance B. Challenges of Using 3PLs
a. Executing 3PL Relationship b. Developing Capability for managing 3PL
C. Performance Simulation D. Search for Recommendations
3. Execution of the outsourcing relationship A. Challenges of Using 3PLs a. Executing 3PL Relationship b. Developing Capability for managing 3PL
B. Initiating 3PL relationships a. Performance Simulation
We first conceptualize the drivers of supply chain performance, in order to focus on the potential advantages that 3PLs can provide to the supply chain. The key drivers in our framework of supply chain performance include supply chain structure, management approach, and the individual

31
capabilities of the supply chain actors/decision makers. The capability of both actors in the government run distribution system and potential 3PLs are considered pivotal for supply chain performance, and much attention was given to capability framing and assessment. Improvement opportunities for supply chain performance can be understood in terms of operational related changes along the dimension captured by these drivers and models were created for predicting performance improvements with more precision. Choosing an appropriate improvement opportunity involving outsourcing is presented as a process approach consisting of specific analytical steps including the assessment of the supply chain, multiple solution generation and multiple approaches to validation of solutions. The developing country context of these pharmaceutical supply chains presents salient challenges, such as capability development and funding for solution implementation, that are also addressed.
In the next section we turn to grounding our approach through application to essential drug distribution in the state of Kano, Nigeria.
4 Case Study – Kano, Nigeria In this section, we describe a case study of the application of our frameworks and tools for analysis of distribution outsourcing options for a drug revolving fund (DRF) in Kano, Nigeria used for essential drug distribution to primary health centers (PHCs) and secondary health centers (SHCs) within the state. In the first subsection, we describe the healthcare system in Nigeria and Kano focusing on the DRF and its characteristic supply chain structure and management approach. In the next subsection we provide the results of findings to assess the capabilities with the DRF supply system, measure performance using a costing approach and assess potential 3PL partners. In the final subsection, we provide recommendations for strengthening the DRF system based on a search for recommendations recognizing the implications of challenges for use of 3Pls and existing constraints within the DRF system.
4.1 Kano State and Healthcare in Nigeria
According to the 2006 census figures from Nigeria, Kano State has a population totaling 9,383,682 and is the largest state in Nigeria. The state is home to 44 local government area (LGAs). Historically, Kano State has been a commercial and agricultural state, which is known for the production of groundnuts as well as for its solid mineral deposits, though very little mining takes place in the state[16]. The state has roughly 18,684 square kilometres of cultivable land and is the most extensively irrigated state in the country[16]. Foreign investments and investors can be seen all over the city. It is arguably within the first five states in terms of commercial activity within Nigeria. Kano also has traditionally received the largest proportion of centrally collected (mostly oil) revenues. From 1990-96 Kano received 10.9% of allocated revenue. In contrast, the next highest state was Sokoto State, receiving 3.5%, with Abuja, Lagos State, and Akwa Ibom State receiving 3.2% each [17]. Kano’s size suggested the ready availability of third party options that could be studied and recommendations made against.
The healthcare system in Nigeria is generally comprised of a three-tier system, namely: Primary Health Care (PHC), Secondary Health Care (SHC), and Tertiary Health Care (THC). The responsibility to provide health care is shared by all the Federal Government, States, and the LGAs. All the 36 states and 774 local governments are responsible for technical coordination, training and financial aspects of primary and secondary health care, while the Federal government sets standards, overall policy goals, coordinates activities, and ensures quality. The PHC and SHC facilities are available at district, divisional and zonal levels of the states and typically, the SHCs are
32
the responsibility of state ministries of health (SMOHs) and fall under the state´s Hospitals Management Board (HMB), while PHCs are the responsibility of the LGA in which they fall.
4.1.1 Health System Strengthening in Kano, Nigeria
Kano state provided an interesting location to test, refine, and apply the framework and tools for outsourcing in government-run distribution systems. The existence of a vibrant private sector indicated possible opportunities for 3PL services. Existing efforts were underway to strengthen the supply chain in the province through the Partnerships for Transforming Health Systems (PATHS2) programme described below. The complex health system and previously identified challenges within the supply chain highlighted the need for supply chain improvements. Initially some program directors communicated their sense that the supply system required some changes in order to meet long-term priorities of expansion of their supply chain strengthening efforts. Our assessment of the DRF in Kano provided a more detailed and verifiable understanding of these weaknesses in the DRF supply chain. In addition, the DRF in Kano made for an appealing place to apply the framework because of expectations for transaction record availability compared to non-revolving fund systems. The DRF, with its financial incentives providing sufficient motivation, could be expected to have more complete and accurate records that could support a more accurate and complete assessment.
PATHS2 programme is a five year programme in support of the health system in Nigeria. The goal of PATHS2 is to support Nigeria in using its own resources efficiently and effectively to achieve the Millennium Development Goals (MDGs) set for the country. The programme seeks to improve the planning, financing and delivery of sustainable and replicable pro-poor services for common health problems in up to six States across the country. Initially work started in the four States of Enugu, Kaduna, Kano, and Jigawa as well as supporting work at the Federal level.
Under PATHS, the predecessor of PATHS2, health system strengthening efforts sought to increase PHC access to affordable, essential drugs. PATHS chosen approach was to support the implementation of DRFs, which served to capitalize the existing supply chain system, enabling initial inventory stores of essential drugs at state medical stores that were then available for purchase by PHC facilities. In Kano initially communicated challenges for the DRF related to capacity for expansion of the DRF to additional facilities, deviations of some facilities from expected ordering schedules, inventory levels, potential for reduction of inefficient supply chain activities, and concerns on whether smaller facilities where able to participate in the program as fully as larger facilities. Outsourcing could provide one way of addressing these challenges, especially those related to either general capacity issues, specific supply chain management (SCM) capability deficiencies, or general management related deficiencies.
4.1.2 The DRF System for Essential Drugs Distribution in Kano
The Drug Revolving Fund (DRF) was one of four supply systems that supplied essential drugs in Kano. The other three were: (1) Free Maternal and Child health (MCH) through the SMOH and the Hospital Management Board to Secondary Health Centers only; (2) Free Accident and Emergency (A & E) drugs both through the SMOH and the Hospital Management Board to Secondary Health Centers only; and (3) LGAs buy and distribute drugs to their facilities.
The DRF system operated similar principles of the Bamako Initiative. The Bamako Initiative was introduced by WHO/UNICEF in the late 1980s to improve access to essential drugs and thus improve health outcomes. After donating commodities to a facility, a process referred to as
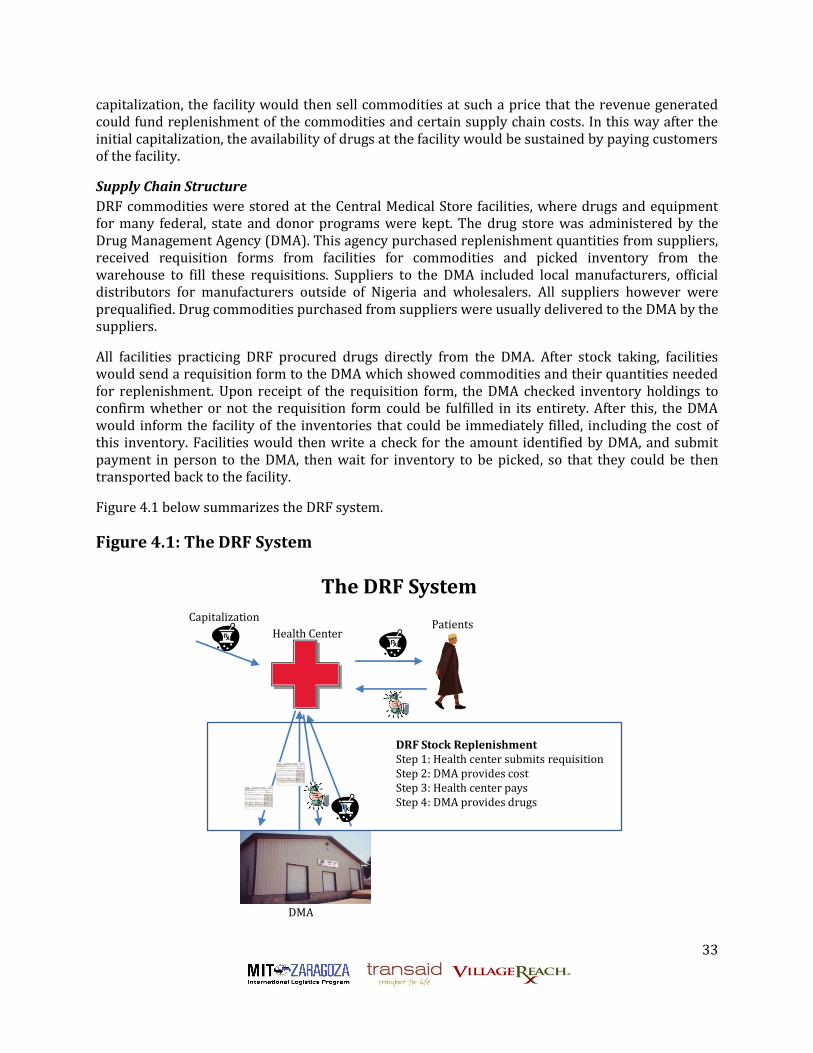
33
capitalization, the facility would then sell commodities at such a price that the revenue generated could fund replenishment of the commodities and certain supply chain costs. In this way after the initial capitalization, the availability of drugs at the facility would be sustained by paying customers of the facility.
Supply Chain Structure
DRF commodities were stored at the Central Medical Store facilities, where drugs and equipment for many federal, state and donor programs were kept. The drug store was administered by the Drug Management Agency (DMA). This agency purchased replenishment quantities from suppliers, received requisition forms from facilities for commodities and picked inventory from the warehouse to fill these requisitions. Suppliers to the DMA included local manufacturers, official distributors for manufacturers outside of Nigeria and wholesalers. All suppliers however were prequalified. Drug commodities purchased from suppliers were usually delivered to the DMA by the suppliers.
All facilities practicing DRF procured drugs directly from the DMA. After stock taking, facilities would send a requisition form to the DMA which showed commodities and their quantities needed for replenishment. Upon receipt of the requisition form, the DMA checked inventory holdings to confirm whether or not the requisition form could be fulfilled in its entirety. After this, the DMA would inform the facility of the inventories that could be immediately filled, including the cost of this inventory. Facilities would then write a check for the amount identified by DMA, and submit payment in person to the DMA, then wait for inventory to be picked, so that they could be then transported back to the facility.
Figure 4.1 below summarizes the DRF system.
Figure 4.1: The DRF System
DMA
Health CenterPatients
DRF Stock ReplenishmentStep 1: Health center submits requisitionStep 2: DMA provides costStep 3: Health center paysStep 4: DMA provides drugs
Capitalization
The DRF System

34
Management Approach
In dealing with Suppliers, purchases by the DMA were usually done on a tendering process resulting in periodic but short term relationships between the DMA and the suppliers.
In dealing with facilities, formally, the DMA requested a two-week lead time between submission of requisition forms and collection of inventory. This two-week lead time was in part facilitated by the facilities being expected to order when they're inventory fell to the two-month mark. This formal procedure also meant that facilities needed to make two trips to the DMA, one for submission of requisition forms and receipt of inventory availability and final cost, and the second trip, to submit the newly written check and collect inventory. The DMA did not provide transportation of inventory to any of the primary health facilities, and only to very few and large secondary health facilities. Facilities collected inventory using either personal transportation vehicles, ambulances, DMA transportation vehicles if available, or different forms of public transportation. Transportation was one of the expenses that margins from the DRF were expected to cover.
In practice, many facilities did not abide by the formal expectations for replenishment such as the DMA's two-week lead time. Some facilities would wait until inventory was very low before ordering or try to combine the two trips into one. For example, representatives from the facility would arrive at the DMA with the facility’s requisition form and a blank check already made out to the DMA. Representatives would then wait for the requisition form to be processed, complete the check with the cost for available inventory provided by the DMA, and then collect the available inventory and return to the facility.
Although there was an intention to review the operational guidelines for the DRF at different levels of operation, the allocation of individual organization’s markups to expected system costs were as follows:
DMA - (with 6% mark-up on initial cost of items before transfer to facilities)
Inflation - 1.5% Unavoidable loss and expiry - 0.75% Legitimate expenses - 3.5% Monitoring & Supervision - 0.25%
PHCs - (with 10% mark up on items procured from DMA, in addition to DMAs 6%)
Unavoidable losses and expiry - 1% Inflation - 2% Deferral & Exemption11 - 2% Monitoring & Supervision - 2% Legitimate expenses - 3%
SHCs - (also with 10% mark up on items procured from DMA, in addition to DMAs 6%)
A. Unavoidable loss and expiry - 1% B. Inflation -4%
11 Deferral & Exemption (D&E) covered situations in which the PHC or SHC decided to give essential drugs free of charge to the patient. This decision could be based on either the patient's economic situation or in the case of emergencies, for example. The decision to use the D&E was usually done on a case-by-case basis.

35
C. Monitoring & Supervision - 1% D. Legitimate expenses - 1% E. Deferral & Exemption - 3%
4.2 Assessing Capability and Measuring Performance
In this section, we report findings on an assessment of the capabilities in the DRF supply chain. We focus on warehousing and commodity distribution. We also report findings from a costing of the supply chain based on sales in 2009. We focus on the DMA for the warehouse costing and PHCs and SHCs using a purposive sampling for distribution costing (see Appendix A.2).
4.2.1 Assessment of the DMA
In this subsection, we report findings for assessment of the capabilities of the DMA representing the primary source of warehousing capabilities in the DRF supply chain. The findings include costing analysis of warehousing activities at the DRF. A summary of the findings are presented in the table below.
Table 4.3 Summary of Findings on DMA Capabilities
Warehousing Capabilities
A rough assessment of the capabilities at the DMA in line with our study objectives, provided primarily a benchmark against which third-party warehouse providers could be compared rather than an assessment for the purposes of improving the DMA's warehousing capabilities. The table below provides a summary of the findings. The findings suggested that there was a little room for improvement with physical infrastructure especially with respect to capabilities of security and disposal, so as to bring it up to par with the other system components. Informational infrastructure at the DMA seemed to be a particular strength, which could probably be attributed to the training and incentives under the DRF program.
Adequate basic and advanced warehousing capabilities Suspect forecasting and procurement capabilities Data management focused on financial transactions Good problem solving of transportation problems No third-party logistics management capabilities Poor fleet management capability Warehousing costs represented a 37% markup vs 10% allowed
markup o Primary cost driver: level of inventory investment

36
Table 4.4: Summary of Basic Operational Capability Assessment of DMA
Warehousing - Basic operational capabilities
Physical Infrastructure
Informational Infrastructure
Roles & Responsibilities
Processes Sub-total
% Max score
Receiving & Shipping
5 4 9 10 28 85% 33
Storage 16 20 7 10 53 63% 84
Security 2 3 6 8 19 39% 49
Disposal of expired/
spoiled medicines
4 6 3 6 19 79% 24
Sub-total 27 33 25 34 119 63%
52% 77% 66% 60%
Commodity Distribution Capability
Management Capacity
The capacity of the DMA to manage an increasing number of requisitions was not yet an inefficiency, but we predicted it to be a bottleneck in the future. The DMA reported receiving about 20 requisitions per week.
Data Management
Our requests for data revealed that sufficient data recording and management capability existed but seemed primarily focused on financial data recording of receipts and sales at the DMA. Logistical information such as volumes and weights of sales and receipts were either not kept or not as easily retrieved.
Forecasting and Procurement
Although previous assessments of the DRF system found shortages of product at the DMA, these shortages were attributed to supplier lead times that were inconsistent and orders that failed to be filled on time[18]. The assessment also stated that the DMA had also reportedly supplied some medicines close to their expiration date to health facilities. Despite these references to shortages, our assessment seemed to show a high level of inventory investment at the DMA, which suggests suspect forecasting and procurement capability. In analyzing the cost drivers, we did recognize features of the supply systems for essential drugs in Kano that raised the complexity of forecasting and procurement in Kano.
Transportation Fleet Management at the DMA
The DMA was the primary source of centralized transportation in the DRF system. The management of the transport operation at the DMA was analyzed as one pre-determinant of
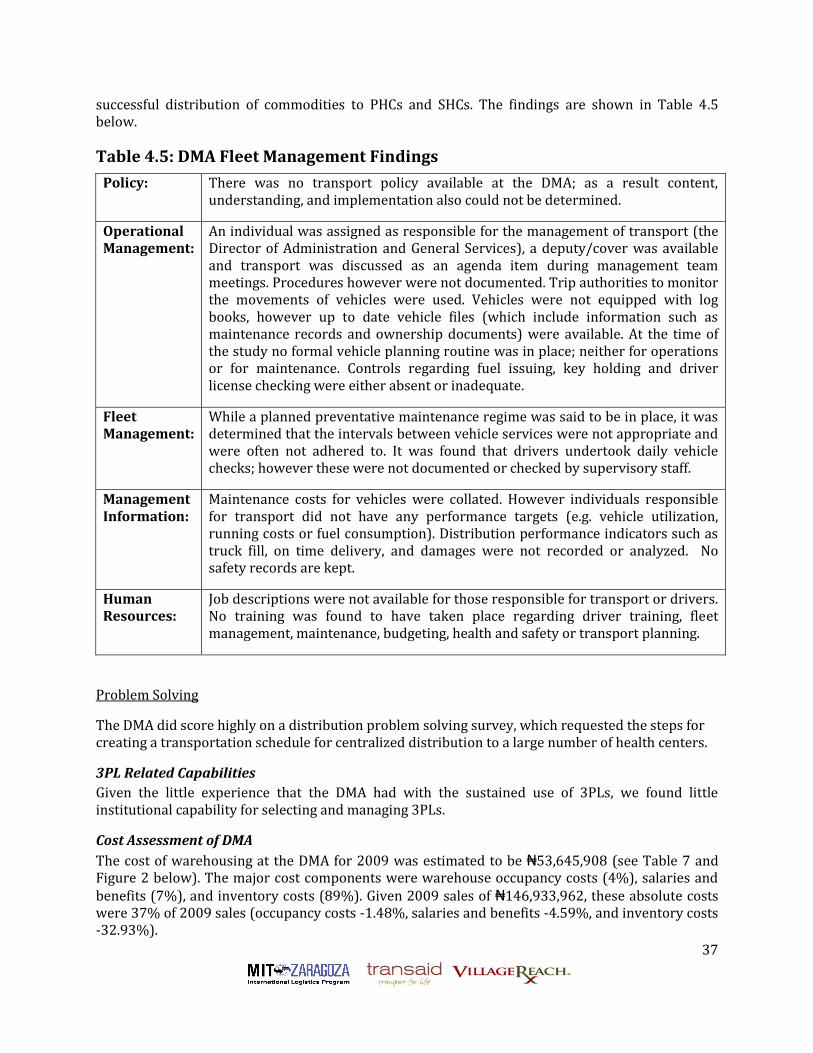
37
successful distribution of commodities to PHCs and SHCs. The findings are shown in Table 4.5 below.
Table 4.5: DMA Fleet Management Findings
Policy: There was no transport policy available at the DMA; as a result content, understanding, and implementation also could not be determined.
Operational Management:
An individual was assigned as responsible for the management of transport (the Director of Administration and General Services), a deputy/cover was available and transport was discussed as an agenda item during management team meetings. Procedures however were not documented. Trip authorities to monitor the movements of vehicles were used. Vehicles were not equipped with log books, however up to date vehicle files (which include information such as maintenance records and ownership documents) were available. At the time of the study no formal vehicle planning routine was in place; neither for operations or for maintenance. Controls regarding fuel issuing, key holding and driver license checking were either absent or inadequate.
Fleet Management:
While a planned preventative maintenance regime was said to be in place, it was determined that the intervals between vehicle services were not appropriate and were often not adhered to. It was found that drivers undertook daily vehicle checks; however these were not documented or checked by supervisory staff.
Management Information:
Maintenance costs for vehicles were collated. However individuals responsible for transport did not have any performance targets (e.g. vehicle utilization, running costs or fuel consumption). Distribution performance indicators such as truck fill, on time delivery, and damages were not recorded or analyzed. No safety records are kept.
Human Resources:
Job descriptions were not available for those responsible for transport or drivers. No training was found to have taken place regarding driver training, fleet management, maintenance, budgeting, health and safety or transport planning.
Problem Solving
The DMA did score highly on a distribution problem solving survey, which requested the steps for creating a transportation schedule for centralized distribution to a large number of health centers.
3PL Related Capabilities
Given the little experience that the DMA had with the sustained use of 3PLs, we found little institutional capability for selecting and managing 3PLs.
Cost Assessment of DMA
The cost of warehousing at the DMA for 2009 was estimated to be ₦53,645,908 (see Table 7 and Figure 2 below). The major cost components were warehouse occupancy costs (4%), salaries and benefits (7%), and inventory costs (89%). Given 2009 sales of ₦146,933,962, these absolute costs were 37% of 2009 sales (occupancy costs -1.48%, salaries and benefits -4.59%, and inventory costs -32.93%).

38
Table 4.6: Summary of DMA Warehouse Costs
S
uSummary of Warehouse Cost Total Costs
Dedicated
Warehouses
Warehouse Occupancy 2,172,271 2,172,271
Salaries and Fridge Benefits 3,500,000 3,500,000
Inventory Investment 47,973,637 47,973,637
Total Warehouse Cost 53,645,908 53,645,908
Warehouse Cost per $ sales 0.37 0.37
Figure 4.2: DMA Cost Breakdown
4% 7%
89%
DMA Cost Breakdown
Warehouse Occupancy Salaries and Fringe Benefits
Inventory Investment
The following should be noted about the calculation of these costs:
1. Depreciation costs of the warehouses were identified as 0.
2. Salary and fringe benefits were estimated based on an average salary of ₦500,000 for seven persons since this information was not revealed for the study.
3. Average inventory was calculated from two physical audits.
4. Inventory investment costs assumed an inflation rate of 10% and a real interest rate of 0%. Also although no insurance was purchased for the warehouse, we assumed implied costs inventory of no insurance to be the same as the cost of insurance for which we used 1% of average inventory value, see Table 8 below.

39
Table 4.7: Breakdown of DMA Inventory Investment Costs I
n
vInventory Investment
Shared
Warehouse
Occupancy Prorated Costs
Dedicated
Warehouse
Occupancy
Real Interest Rate 0%
Inflation 10%
Average Total Inventory 371,821,426.93
Inventory Cost Prorate Percentage
Foregone Interests - -
Inflation - 37,182,142.69
Insurance -
Total Inventory Losses - 7,073,280.00
Implied Insurance Cost per $ of Average Monthly
Inventory (if no insurance paid) 0.01 - 3,718,214.27
Total cost of Inventory Investment - 47,973,636.96
Drivers of Costs and Inefficiencies
The primary driver of costs from the DMA for the DRF system was the cost of the investment in inventory. With average total inventory of ₦371,821,427, this represented an investment of 30.4 months of inventory. With inflation of 10%, and thus inflation costs of ₦37,182,143, this represented 69.3% of absolute costs and 25% of 2009 sales. Given an inflation allocation from the markup of 1.5%, the sustainability of the DRF was questioned. It was also found to be highly likely that the level of inventory investment was also correlated with the level of inventory loss, which represented 13.2 % of absolute costs and 4.8% of 2009 sales. Again, given an inflation allocation from markup of 0.75%, this level of inventory loss was determined to be unsustainable.
The high level of inventory investment reflected poorly on the forecasting and procurement capabilities at the DMA. However, certain system dynamics added to the complexity of forecasting and procurement:
1. Many PHCs placed orders on an emergency basis, such that they needed the stock replenished immediately. The DRF policy was that PHCs must reorder when they reach their minimum stock level of a two months’ supply, and they must provide a requisition two weeks before picking up the medicines and supplies. Adhering to the policy would allow the DMA lead time to ensure they have the stock to fill orders. By placing orders on an emergency basis and needing the replenishment immediately, DMA’s ability to plan to have the required stock is decreased. This problem was made worse because the PHC orders were not regular, which further decreased the DMA’s ability to plan for stock. Moreover, the problem continued upstream as the DMA had problems with their suppliers adhering to established lead times.
2. The lack of data at the PHC level about patients, prescriptions, drug use, and drug sales limited the data set available for accurate forecasting and procurement.
3. Second, the irregularity of orders from the PHCs was magnified by the irregularity of other supply chains in the state, such as drugs donated by other entities or other vertical programs. For example, if the separate malaria supply chain was not providing any drugs, then the PHCs ordered malaria drugs from the DRF, but when the malaria program provided drugs, the orders of malaria drugs in the DRF suddenly stopped or decreased. The ebb and flow of orders also limited the DMA’s ability to plan to have the necessary stock levels.

40
4.2.2 Assessment of DRF Distribution: The PHC/SHC Collection Network
In this subsection, we report findings for assessment of the distribution capabilities of the DRF supply chain. The findings include costing analysis of distribution activities within the DRF supply chain. A summary of the findings are presented in the table below.
Table 4.8 Summary of Findings on PHC & SHC Capabilities
Commodity Distribution Capability
Management Capacity
Each DRF facility had at least one storekeeper, who was well-trained and mentored by staff from the HMB.
Data Management
Our requests for data revealed that sufficient data recording and management capability existed at the SHCs and PHCs although again primarily focused on financial data recording of receipts and sales at the PHC. Inventory record-keeping, such as use of stock cards, was not always consistent. Procedurally, physical stock-taking was the primary driver of requisition quantities.
Forecasting and Procurement
Despite our observations that each store visited had shelves stocked with DRF medicines and supplies, forecasting and procurement capability at PHC and SHC facilities seemed somewhat compromised. As mentioned earlier, some facilities would wait until stock quantities were very low before sending a requisition to the DMA. The cost analysis suggests that there may have been some cost savings associated with this practice, especially for the PHCs, as their inventory policy as
Mixed problem-solving capability of managing coordinating requisition and delivery amongst themselves
Data management focused on financial transactions Compromised forecasting and procurement capabilities (e.g., too many
emergency orders) No third-party logistics management capabilities PHC Costing Results
o 19.35% of 2009 sales (public transport; fuel; and per diems) vs. 3% markup allowed for Legitimate Expenses
o Inflation costs 3.33% of 2006 sales vs. 2% markup allowed for inflation
o Primary cost driver: requisition and collection system; inventory investment; personnel costs
SHC Costing Results o 0.14% of 2009 sales (public transport; and fuel) vs. 1%
markup allowed for Legitimate Expenses o Inflation costs 4.17% of 2006 sales vs. 4% markup allowed for
inflation o Primary cost driver: requisition and collection system;
inventory investment;
41
originally designed called for monthly requisitions to the DMA, but our costing analysis showed that a quarterly replenishment schedule would be more cost effective.
Transportation Fleet Management
Since the PHCs and SHCs did not own their own distribution fleet, we did not focus on an assessment of this capability at these facilities.
Problem Solving
Roughly half of the PHCs and SHCs scored adequately on a distribution problem solving survey, which requested the steps for coordinating shared transportation of commodities from the DMA between the facility and three of its closest neighbors. This survey reflected the potential option of facilities being grouped into small clusters and transportation of commodities from the DMA being shared within the cluster.
3PL Related Capabilities
Given the little experience that the health facilities had with the sustained use of 3PLs, we found little institutional capability for selecting and managing 3PLs.
A Note on Management Approach
It was evident that sufficient incentives existed to replenish DRF stock to prevent stock outs and stock shortages. Incentives included sufficient funds available at the PHC to support distribution costs, benefits to the community, which encouraged active involvement of community members in DRF management, and DRF funds supporting other activities at the health center, which encouraged additional DRF sales. One PHC visited had constructed a new area of the facility using DRF funds, which further improved the working environment and care given at the PHC. Therefore, the incentive at the PHC was to continue stocking the medicines and supplies so that they could treat patients and support the PHC for quality care at the PHC. The assessment indicated that even if transport was not available, PHC staff would use their resources to pay for public transportation costs or fuel to use the DMA vehicle. An additional incentive to stock DRF medicines and supplies was the fact that it was the only reliable supply chain in state’s public health system.
Costs of the Kano DRF Supply System to PHCs
To cost Kano’s DRF supply system to the PHCs, we sampled 10 PHCs with the methodology described in Appendix A.2 and modeled the costs for the 155 PHCs that were operating at a steady state in 2009. We completed 10 Distribution Costing Surveys with an average duration of 49 minutes, and five Transport Costing surveys with an average duration of 28 minutes. At each PHC, we gathered data for the last three DRF replenishments to determine a monthly cost that was then modeled for an annual cost. To gauge effectiveness and efficiency in the system, the costs were calculated as a cost per Naira spent on DRF commodities and per kilometer. In the sample, we found a total of 824 km was driven in a one-month period for DRF distribution to the PHCs.
Over a 12 month period, the distribution of DRF drugs to PHCs was estimated to cost ₦62,177,287.94 ($414,515.25). With the cost of the drugs themselves constituting nearly half of this cost, the transport cost per Naira of DRF sales from the DMA was ₦2.3. By conventional standards, this was not an efficient cost. The cost per kilometer driven in the distribution is significantly higher at ₦75,406.67 ($502.71). The cost findings are detailed below in Table 4.9. The breakdown of the sources of funding for costs is shown in Table 4.10

42
Table 4.9: PHC DRF System Costs
Totals From DataEntire State
Estimate
Entire State
EstimateN/km
(one month) (one month) (12 months)
Transport Costs
Vehicle Breakdown Cost 182.37 2826.80 33921.64 3.43
Public Transport Usage Cost 2364.32 36647.01 439764.06 44.44
Fuel Costs 7445.10 115399.05 1384788.60 139.95
Vehicle Depreciation 9864.67 152902.32 1834827.82 185.44
Scheduled Vehicle Maintenance 1988.25 30817.93 369815.12 37.38
Insurance Costs 3.70 57.33 687.95 0.07
Total Transport Costs 21848.41 338650.43 4063805.19 410.70
Distribution Personnel Costs
Distribution Salaries 34,489.21 534,582.79 6,414,993.45 648.33
Distribution Per Diems 17,883.13 277,188.57 3,326,262.80 336.17
Total Distribution Personnel Costs 52,372.35 811,771.35 9,741,256.25 984.49
Warehouse Personnel Costs
Storekeeper Salaries 94,711.96 1,468,035.35 17,616,424.25 1,780.39
Total Warehouse Personnel Costs 94,711.96 1,468,035.35 17,616,424.25 1,780.39
Management Personnel Costs
Manager Salaries 17,511.93 271,434.92 3,257,218.99 329.19
Total Management Personnel Costs 17,511.93 271,434.92 3,257,218.99 329.19
Total Personnel Costs 164,596.23 2,551,241.62 30,614,899.50 3,094.07
DRF Essential Medicines 143,072.75 2,217,627.68 26,611,532.18 2,689.47
Inflation Costs 73,920.92 887,051.07 89.65
Total DRF Commodities Costs 143,072.75 2,291,548.60 27,498,583.25 2,779.12
Total Cost: 329,517.40 5,181,440.66 62,177,287.94 6,283.89
Total DRF Sales in Naira: 143,073 2,217,628 26,611,532
Estimated Cost per Naira of DRF Sales: 2.30 2.34 2.34
Total Cost: $2,196.78 $34,542.94 $414,515.25 $41.89
Total DRF Sales in USD: $953.82 $14,784.18 $177,410.21
System Costs Over 12 Months
Transport Costs in Naira
Personnel costs in Naira
DRF Commodities
Total Cost Over 12 Months
Total Incremental Cost Over 12 Months in USD

43
Table 4.10: Breakdown of Sources of Funding for Costs
Cost Type Incremental or Static?Funding
Source
Vehicle Breakdown Cost Incremental MoH
Public Transport Usage Cost Incremental DRF
Fuel Costs Incremental DRF
Vehicle Depreciation Incremental MoH
Scheduled Vehicle Maintenance Partly Static MoH
Insurance Costs Static MoH
Distribution Personnel
Manager Salaries Static MoH
Manager Per Diems Incremental DRF
Distribution Salaries Static MoH
Distribution Per Diems Incremental DRF
Storekeeper Salaries Static MoH
Storekeeper Per Diems Incremental DRF
Refrigerator Depreciation Static MoH
Refrigerator Fuel Costs Static MoH
Refrigerator Breakdown Repairs Static MoH
DRF Essential Medicines Incremental DRF
Inflation Costs Incremental DRF
Types of Costs
Transport
Personnel
Cold Chain
DRF Commodities
Transportation costs to PHCs mostly comprised incremental costs to both the DRF and the MOH. Directly related to these transportation costs were distribution personnel costs, which included static costs to the MOH - salaries - and incremental costs to the DRF - per diems. The table below details these transportation costs of the system modeled for the 155 DRF facilities.
As detailed in Appendix A.2, many of the PHCs in our sample often took two trips to the DMA to replenish their medicines and supplies: one trip to place the order and determine the cost, and a second trip to pick up the order. These trips were also done for only one PHC at a time, rather than by consolidating all PHCs in a certain area and then making a trip. As each trip has a financial and human resource cost, the duplicate trips created an inefficiency of sorts. From the PHC perspective, this cycle was problematic because the DMA did not always have the medicines or supplies they required. While this was the case in well below half of the instances, it resulted in additional financial and human resource cost to pick up the orders in multiple trips to the DMA. The problem became greater because PHCs were not allowed to place an order with the DMA when they had an open order. This meant that when a PHC placed an order that the DMA took some weeks to fill, they could not order any additional medicines or supplies during that order fulfillment time.

44
Table 4.11: Incremental Costs for PHC DRF System
Entire State
Estimate% of 2009 Sales
Funding
Source
(12 months)
Transport Costs
Vehicle Breakdown Cost 33,921.64 0.13% MoH
Public Transport Usage Cost 439,764.06 1.65% DRF
Fuel Costs 1,384,788.60 5.20% DRF
Vehicle Depreciation 1,834,827.82 6.89% MoH
Scheduled Vehicle Maintenance 369,815.12 1.39% MoH
Insurance Costs 687.95 0.00% MoH
Total Transport Costs 4,063,805.19 15.27%
Distribution Personnel Costs
Distribution Per Diems 3,326,262.80 12.50% DRF
Total Personnel Costs 3,326,262.8012.50%
DRF Essential Medicines 26,611,532.18 100% DRF
Inflation Costs 887,051.07 3.33% DRF
Total DRF Commodities Costs 27,498,583.25
Total Cost: 34,888,651.24 131%
Incremental System Costs Over 12 Months
Personnel
DRF Commodities
Transport
Total Cost Over 12 Months
Looking only at the incremental costs, the total costs of the system for a year are ₦ 34,001,600.17 ($226,677.33). Without the drugs, the total costs are ₦ 7,390,067.99 ($49,267.12) representing 28% of 2009 sales. However, the costs of using public transportation and fuel are only incurred for DRF distribution with a total annual cost of the system is ₦ 5,150,815.46 ($34,338.77) which represents 19.35%, of 2009 sales. PHCs sell DRF commodities at a 10% markup to cover the expenses of running the system of which only 3% is allocated for legitimate expenses. This analysis indicated that the costs of transporting the drugs alone constituted roughly 6 times this legitimate expense allocation. This represented a significant threat to the sustainability of the DRF system. Inflation costs were also higher than the markup allocated for it - 3.33% vs. 2%.
Costs of the Kano DRF Supply System to SHCs
To cost Kano’s DRF supply system to the SHCs, we sampled 4 SHCs with the methodology described in Appendix A.2 and modeled the costs for the 25 SHCs that were operating in Kano state. We completed four Distribution Costing Surveys with an average duration of 54 minutes, and three Transport Costing surveys with an average duration of 76 minutes. At each SHC, we gathered data for the last three DRF replenishments to determine a monthly cost that was then modeled for an annual cost. To gauge effectiveness and efficiency in the system, the costs were calculated as a cost per Naira spent on DRF commodities and per kilometer. In the sample we found a total of 221 km was driven in a one-month period for DRF distribution to the SHCs.
Over a 12 month period, the distribution of DRF drugs to SHCs was estimated to cost ₦155,981,061.10 ($860,937.65). With the cost of the drugs themselves constituting nearly 80% of this cost, the distribution cost per Naira of DRF sales from the DMA was only ₦1.21 ($0.008). The

45
cost per kilometer driven in the distribution was significantly higher at ₦705,967.79 ($4,706.45). The cost findings are detailed below.
Table 4.12: SHC DRF System Costs
Totals From Data
Entire State
Estimate
Entire State
EstimateN/km
(one month) (one month) (12 months)
Transport Monthly Costs
Vehicle Breakdown Cost N739.66 N4622.88 N55474.56 N20.92
Public Transport Usage Cost N825.00 N5156.25 N61875.00 N23.34
Fuel Costs N1631.04 N10193.97 N122327.68 N46.14
Vehicle Depreciation N8365.74 N52285.88 N627430.60 N236.65
Scheduled Vehicle Maintenance N343.74 N2148.35 N25780.18 N9.72
Insurance Costs N0.00 N0.00 N0.00 N0.00
Total Transport Costs N11905.17 N74407.33 N892888.01 N336.77
Distribution Personnel Monthly Costs
Distribution Salaries N21333.65 N133335.33 N1600023.94 N603.47
Storekeeper Salaries N302750.00 N1892187.50 N22706250.00 N8564.01
Manager Salaries N14955.86 N93474.14 N1121689.69 N423.06
Total Personnel Costs N339039.52 N2118996.97 N25427963.63 N9590.55
Cold Chain Monthly Costs
Refrigerator Depreciation N3125.68 N19535.47 N234425.63 N88.42
Refrigerator Fuel Costs N3052.50 N19078.13 N228937.50 N86.35
Total Refrigerator Breakdown Costs N3875.00 N24218.75 N290625.00 N109.61
Total Refrigeration Costs N6927.50 N43296.88 N519562.50 N195.96
DRF Essential Medicines N1721875.29 N10761720.58 N129140646.95 N48707.38
Total DRF Commodities Costs N1721875.29 N10761720.58 N129140646.95 N48707.38
Total Cost: N2079747.48 N12998421.76 N155981061.10 N58830.65
Total DRF Sales in Naira: 1,721,875 10,761,721 129,140,647
Estimated Cost per Naira of DRF Sales: 1.21 1.21 1.21
Total Cost: $13,864.98 $86,656.15 $1,039,873.74 $392.20
Total DRF Sales in USD: $11,479.17 $71,744.80 $860,937.65
System Costs Over 12 Months
Cold Chain
Transport
Personnel
DRF Commodities
Total Cost Over 12 Months
Total Incremental Cost Over 12 Months in USD
The above SHC costing and analysis examined the holistic costs of the system. Following the same approach used for the PHC distribution system costing, an analysis of the incremental/static costs of the system and the sources of funding was beneficial. As with PHCs, transportation costs to SHCs mostly comprised incremental costs to both the DRF and the MOH. Directly related to these transportation costs were distribution personnel costs, which included static costs to the MOH - salaries – but different from PHCs, no per diems.
The table below details the incremental costs of the system for the sample and modeled for the 25 DRF SHCs. In this scenario, the total costs of the system for a year were ₦135,414,395.25 ($902,762.64), 95% of which was the cost of drugs. Without the drugs, the total costs were ₦ 6,273,748.30 ($41,824.98). These costs represented 5% of the costs of the drugs. However, the costs of using public transportation and fuel - ₦184,202.63 (0.14% of 2009 Sales) - and inflation costs - ₦5,380,860.29 (4.17% of sales) - were only incurred for DRF distribution. SHCs sold DRF commodities at a 10% markup of which 1% was allocated to cover legitimate expenses and 4% for inflation. This analysis indicated that the markup should cover the costs of distributing these drugs

46
and inflation. The situation was very different for the PHCs where the cost of distributions was higher and the quantity of drugs was lower.
Table 4.13: Incremental Costs for SHC DRF System
Entire State
Estimate% of 2009 Sales
Source of
Funding
(12 months)
Transport Monthly Costs
Vehicle Breakdown Cost 55,474.56 0.04% MoH
Public Transport Usage Cost 61,875.00 0.05% DRF
Fuel Costs 122,327.68 0.09% DRF
Vehicle Depreciation 627,430.60 0.49% MoH
Scheduled Vehicle Maintenance 25,780.18 0.02% MoH
Insurance Costs - 0.00% MoH
Total Transport Costs 892,888.01 0.69%
DRF Essential Medicines 129,140,646.95 100.00% DRF
Inflation costs 5,380,860.29 4.17% DRF
Total DRF Commodities Costs 134,521,507.24
Total Cost: 135,414,395.25 104.86%
Total DRF Sales in Naira: 129,140,647 5,565,062.97 37,100.42
Estimated Cost per Naira of DRF Sales: 1.01
Total Cost: $902,762.64
Total DRF Sales in USD: $860,937.65
Transport and Personnel as a Proportion of Sales0.69%
Total Incremental Cost Over 12 Months in USD
Transport
DRF Commodities
Incremental System Costs Over 12 Months
Total Cost Over 12 Months
4.2.3 Assessment of Third Party Warehouse Providers
During this study, three third party warehouse providers (Providers A-C) were assessed for their appropriateness in providing effective warehousing services. The key findings of the study are as follows:
3PL options were available with comparable basic operational capabilities to the DMA. Key offerings from these 3PL providers included:
Experience either as providers or managing their own supply chain; Contract warehousing at their facilities; Insurance on behalf of clients; Use of computers and computer technology; and Dedicated representatives as point of contact and flexibility in terms of reporting to
customers and compliance with customer operating procedures requirements. We concluded that nontraditional 3PL providers should be kept in mind as options. It
appeared that provider B, as a result of managing its own supply chain for its own needs, had developed more refined capabilities for pharmaceutical logistics and warehousing than a more diversified and traditional 3PL provider.
During the study, only one warehouse provider submitted a mock RFQ. Costs showed similar occupancy and salary costs compared to the DMA.

47
4.2.4 Assessment of Third Party Transportation Providers
During the study, three third party transportation providers (Providers A-C) were assessed for their appropriateness in providing effective transport for pharmaceutical distribution. The key findings of the study are as follows:
Private sector capacity was adequate. Many transport providers were discussed before the three providers above were designated as subjects of the study.
A variety of providers were available. Our cross section showed the difference between different types of providers in terms of systems, processes, and strengths. For some distribution operations (such as bulk goods, i.e. hospital beds) it may be more appropriate to use the services of Provider A while for small consignment multi drop distribution it may be more appropriate to use a specialist in this field such as Provider C.
In-house 3PL management capacity requirements vary greatly. Depending on the experience of the service provider, it was clear that varying amounts of 3PL management capacity are required within the contracting party (e.g. the DMA) to manage the 3PL relationship.
At the time of the study, only two transportation providers had submitted a mock RFQ. Provider B submitted his costs as a per kilogram contract (₦500), while Provider A submitted costs as a per roundtrip contract (₦28,000) for a moderate distance. Provider B’s quote was considered competitive for less than full truckload distribution especially to PHCs but not for SHCs. The Provider C’s quote was not considered competitive at all.
4.3 DRF Recommendations
Having analyzed the major cost drivers and the capabilities within the existing system and 3PLs, we provide the findings from our search for recommendations given short and long-term priorities of the DRF leadership and an analysis and observations regarding the various constraints for the recommendations. (A summary of assessment findings is provided in Appendix A.3). The short-term priority of leadership for the DRF was to increase efficiencies in the management of the DRF without raising costs to the end customer. Any efforts at improvement also needed to lay the groundwork for longer-term priorities. These longer-term priorities included expanding the DRF to additional facilities and expanding the volume of products that flow through the DMA as a result of integrating the different supply chains, e.g., LGA essential drug distribution, that flow to the health centers.

48
Table 4.14 Summary of System Recommendations & Observations
4.3.1 Considered Options
The options that we considered for analysis included options for the current system and options for expanding the DRF system to more PHCs. For both these time frames not only did we consider outsourcing options, but we also considered the potential for local improvements without outsourcing.
Current System Options
In Table 4.15 below we list the specific options considered for the current system and the qualitative advantages and challenges of implementing each option.
• Delivery to PHCs – Partial outsourcing (2/3 of PHCs) – Sequence
• DMA delivers to 1/3 of PHCs – learns capability for distribution
• 1 or more 3PLs introduced once capability is learned, but in a staged manner
– Markup allocation does not cover remaining distribution costs (9.78% costs vs 5% markup allocation) after cost of implementation (6.7% costs)
• Delivery to SHCs – Markup allocation more than covers remaining distribution
costs (2.7% vs 5% markup allocation) • Budget Recommendations
– Cross subsidization from SHCs to PHCs (2.3% SHC markup is equivalent to 11.2% markup on PHC sales)
• DMA – Expand DRF to reduce inventory investments – Improve forecasting and regularity/visibility of supply chains
to PHCs & SHCs

49
Table 4.15: List of Current System Options with Advantages and Challenges
Options Advantages Challenges
DMA begins delivery to PHC
Should reduce transportation costs to PHC's resulting from aggregating deliveries
Handling requisitions Problem-solving for
transportation Poor fleet management
capability Recovering increase in
costs at DMA DMA begins delivery to SHC
Potential reduction in inventory investments at SHC
Savings in transportation cost may be small since higher volumes suggest more full truckload deliveries in present system
Recovering increase in costs at DMA
DMA outsources delivery to PHCs to transport 3PLs
Should reduce transportation costs to PHC's resulting from aggregating deliveries
DMA can focus on warehousing functions
Poor third-party management capability at DMA
Handling requisitions Recovering increase in
costs at DMA
DMA outsources delivery to SHCs to transport 3PLs
Potential reduction in inventory investments at SHC
Savings in transportation cost may be small since higher volumes suggest more full truckload deliveries in present system
Poor third-party management capability at DMA
Recovering increase in costs at DMA
PHCs in small groups organize delivery amongst themselves
Should reduce transportation costs to PHC's resulting from aggregating deliveries
Cost recovery within small groups potentially manageable
Mixed capability within PHCs of problem-solving required for this option
Handling requisitions Potentially expensive if it
cannot happen organically but requires individual set up support for each group.
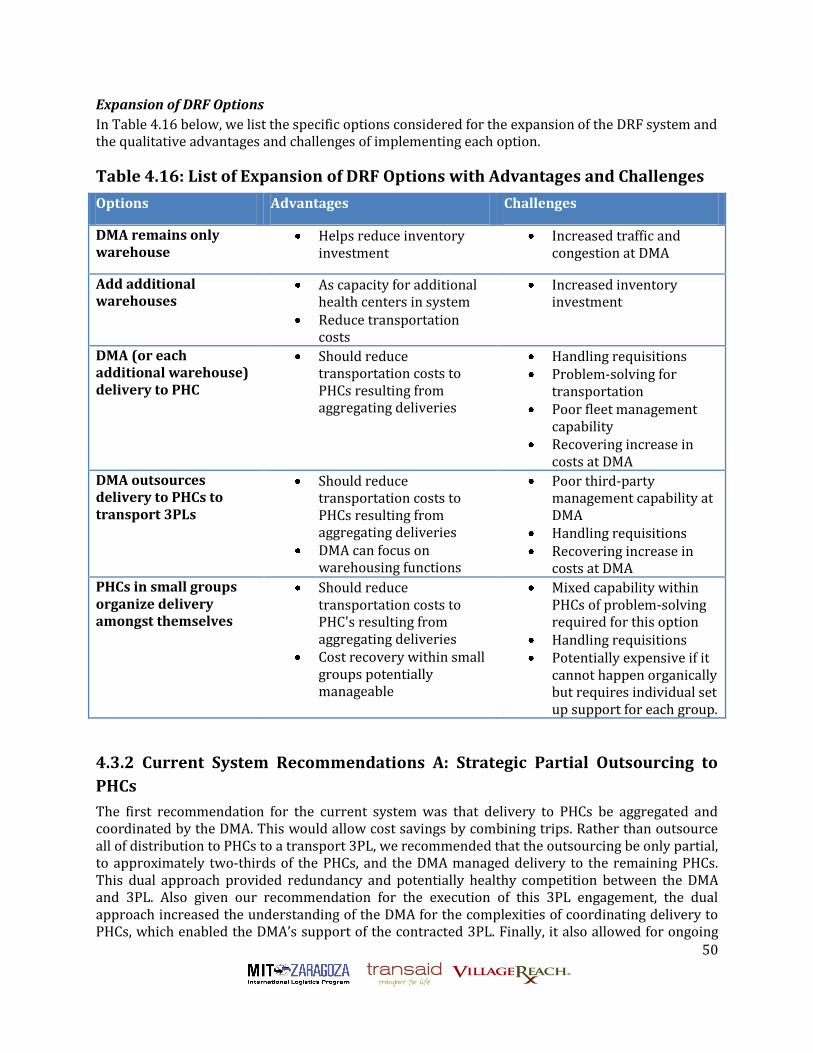
50
Expansion of DRF Options
In Table 4.16 below, we list the specific options considered for the expansion of the DRF system and the qualitative advantages and challenges of implementing each option.
Table 4.16: List of Expansion of DRF Options with Advantages and Challenges
Options Advantages Challenges
DMA remains only warehouse
Helps reduce inventory investment
Increased traffic and congestion at DMA
Add additional warehouses
As capacity for additional health centers in system
Reduce transportation costs
Increased inventory investment
DMA (or each additional warehouse) delivery to PHC
Should reduce transportation costs to PHCs resulting from aggregating deliveries
Handling requisitions Problem-solving for
transportation Poor fleet management
capability Recovering increase in
costs at DMA
DMA outsources delivery to PHCs to transport 3PLs
Should reduce transportation costs to PHCs resulting from aggregating deliveries
DMA can focus on warehousing functions
Poor third-party management capability at DMA
Handling requisitions Recovering increase in
costs at DMA
PHCs in small groups organize delivery amongst themselves
Should reduce transportation costs to PHC's resulting from aggregating deliveries
Cost recovery within small groups potentially manageable
Mixed capability within PHCs of problem-solving required for this option
Handling requisitions Potentially expensive if it
cannot happen organically but requires individual set up support for each group.
4.3.2 Current System Recommendations A: Strategic Partial Outsourcing to
PHCs
The first recommendation for the current system was that delivery to PHCs be aggregated and coordinated by the DMA. This would allow cost savings by combining trips. Rather than outsource all of distribution to PHCs to a transport 3PL, we recommended that the outsourcing be only partial, to approximately two-thirds of the PHCs, and the DMA managed delivery to the remaining PHCs. This dual approach provided redundancy and potentially healthy competition between the DMA and 3PL. Also given our recommendation for the execution of this 3PL engagement, the dual approach increased the understanding of the DMA for the complexities of coordinating delivery to PHCs, which enabled the DMA’s support of the contracted 3PL. Finally, it also allowed for ongoing

51
measurement and comparison of the benefits of the outsourcing of distribution logistics versus in-house management of this distribution logistics.
At the time of the study, many PHCs and SHCs were making multiple trips to the DMA for a single replenishment. Typically, one trip was to place the order and the second trip was to pay for and receive the procurement. An outsourced distribution system would involve a transporter completing a regular circuit of the PHCs, for example on a quarterly basis. This circuit could be planned such that each facility is visited twice with a two-week interval in between. The first visit would be to collect the procurement order from the facility, and the second would be to deliver the commodities. Such an arrangement would provide the DMA with the lead-time required to compile the order, and provide a service to the PHCs and SHCs who previously had to travel to the DMA and wait at the DMA to place and process the order.
In the table below, we show the expected savings from this approach using the following definitions:
System Savings: the savings to the entire supply chain system from the approach. DRF Savings: the savings to the DRF. PHC (DRF) Savings: the savings to the PHCs’ DRF revenue account. MOH Savings: the savings to the MOH in assets or personnel that have been freed up for
other MOH activities
Table 4.17: Cost & Savings Breakdown from Strategic Partial Outsourcing to
PHCs
Current 155
PHCs
Partial
Outsourcing to
155 PHCs System Savings DRF Savings
PHC (DRF)
Savings
MOH
Savings
Transport Costs 0
Vehicle Breakdown Cost 33,922 3,539 30,383 (3,539) 33,922
Public Transport Usage Cost 439,764 439,764 439,764 439,764
Fuel Costs 1,384,789 129,399 1,255,389 1,255,389 1,384,789
Vehicle Depreciation 1,834,828 477,782 1,357,046 (477,782) 1,834,828
Scheduled Vehicle Maintenance 369,815 63,704 306,111 (63,704) 369,815
Insurance Costs 688 1,800 (1,112) (1,800) 688
Total Transport Costs 4,063,805 676,225 3,387,580 1,148,328 1,824,553 2,239,253
Total Personnel Costs 30,614,899 21,977,230 8,637,669 3,167,334 3,167,334 5,470,335
Total Refrigeration Costs 0 0
Total DRF Commodities Costs 27,498,583 27,276,275 222,308 222,308 222,308 0
3PL Costs Transportation 1,115,945 (1,115,945) (1,115,945)
Grand Totals 62,177,288 51,045,676 11,131,612 3,422,025 5,214,195 7,709,587
Percentage of 2009 Sales 233.6% 191.8% 41.8% 12.9% 19.6% 29.0%
Third party transportation costs were based on a contract of ₦500 per kilogram. Our recommendation resulted in savings at all levels with an overall 41.8% of sales system savings, which includes 29.0% MOH savings and maximum savings of 19.6% at the PHCs. The difference in savings between the DRF savings and the PHC (DRF) savings, of 6.7%, represents the cost of implementing the partial outsourcing recommendation. If all 6.7% of costs came from the PHCs, for example, through a transportation fee, this would reduce the PHC savings to 12.9%. Recall from Table 4.8 that as a percentage of 2009 sales, distribution and inflation costs for the PHCs were 22.68% implying that with savings of 12.9% (after 6.7% cost of implementation), the markup allocation of 5% does not cover remaining distribution costs of 9.78% (22.68% - 12.9%). It was noted, however, that since SHC sales are 4.85 times that of PHC sales, the cost of implementing the

52
partial outsourcing recommendation would be 1.4% of SHC sales. Additional explanations/observations from the model are provided in Appendix A.4.
Challenges for Current System Recommendation A: Executing Engagement
We recommend the following sequence for implementing our recommendation.
Step1: The DMA begins initial delivery to roughly a third of the PHCs in a geographical region. This step would involve the DMA developing a fleet management capabilities and problem-solving or distribution to PHCs. Potential timelines for step 1 range from 3 to 6 months.
Step 2: The DMA begins outsourcing delivery of another a third of the PHCs to a 3PL. This step would involve the DMA developing its capabilities for managing a 3PL, however this capability builds on those learned in step 1. Potential timelines for step 2 range from 3 to 6 months.
Step 3: The DMA completes outsourcing delivery of the final third of the PHCs to the 3PL. Potential timelines for step 3 range from 2-3 months.
Engaging 3PL
Using the relevant logistical parameters used for programming our performance simulation (see Appendix A.4), the following output from the cost model could be used to request quotes from 3PLs.
Table 4.18: Logistical Statistics of Required Distribution Services from 3PL
Number of vehicle-days needed for distribution 100
Number of vehicle days available 240
Total # of kilometres covered in one year 18900
Total # of litres of fuel used in one year 2362.5
Total # of kg delivered 2231.890323
Total # of round trips 100
Average # of destinations on each round trip 4
Average # of km per roundtrip 189
Average # of Kg per roundtrip 22.32
Challenges for Current System Recommendation A: Handling Requisitions
To address the process of requisitioning in an outsourced distribution system, we proposed that the DMA or 3PL pick up requisitions from PHCs on a routine basis. This solution poses four primary challenges in implementation.
1) This solution would require the facilities to complete their order by a certain date and time to have it available when the outsourced provider comes to pick it up. If a facility did not have the requisition ready at the right time, it would cause delays in the distribution system, or requiring the facility to make a trip to the DMA at a later date to submit the requisition, or it may result in the facility not placing an order at all during the month. This was likely to be a major implementation challenge at the beginning, but as time passes and the system operates

53
regularly, it is likely that the facilities will learn to work with the system and have their orders ready.
2) If a facility had an outstanding order with the DMA, they were not allowed to place another order. The frequency of this situation was expected decrease as the DMA had adequate lead-time to fill orders. However, it merited discussion with the DMA to identify other ways to address this problem. For example, a system could be established whereby facilities have 2 types of orders/accounts with the DMA: one account for orders that can be filled within 2 weeks and maintains a constant paid-in-full status; and a revolving account where commodities with longer lead-times are billed. This latter account could be allowed to carry a running balance and considered on an individual facility basis.
3) In the DMA system used at the time of the study, the facilities decided when to place orders. The facilities controlled their own expenses to meet their individual needs, and this outsourced solution provided a more cost-effective solution to the DMA, but at the expense of a small amount of autonomy to the facilities. Some personnel may resist this change out of frustration related to the loss of autonomy for the timing of procurements. As with the other challenges, this was expected to reduce over time as people became accustomed to the change and the advantages of the new distribution system.
4) For many staff within the health system, there are professional and personal advantages to making trips to the DMA, which is located in the capital of Kano. While in the data collection, all respondents reported that the purpose of their trip was 100% for DMA procurements, one can imagine that while in the city, they took advantage of the opportunity to meet with colleagues, deliver reports, run errands, etc. Eliminating one trip to the DMA eliminated one opportunity to take care of other business in town, and had the potential to create some resentment or lack of cooperation from some staff. However, picking up orders is a service to the staff, as it allows overworked staff more time to complete their work at their post.
4.3.3 Current System Recommendations B: DMA Delivery to SHCs
The first recommendation for the current system was that delivery to SHCs be carried out by the DMA. This again would allow cost savings primarily by reducing inventory investments at the SHCs. It was not recommended outsourcing to 3PLs for the following reasons:
1. The large volumes to SHCs imply better utilizations rates for transport assets that would better leverage DMA distribution capabilities and assets especially those developed for Recommendation A.
2. Expansion was not a strong long-term priority for the SHC network given that most SHCs were already in the DRF.
3. Monthly deliveries to the SHC only added roughly 1.25 requisition transactions and 1.25 delivery transactions per day to the needed capacity at the DMA.
In the table below, we show the expected savings from this approach using the following definitions:
System Savings: the savings to the entire supply chain system from the approach. DRF Savings: the savings to the DRF. PHC (DRF) Savings: the savings to the PHCs’ DRF revenue account. MOH Savings: the savings to the MOH in assets or personnel that have been freed up for
other MOH activities

54
Table 4.19: Cost & Savings Breakdown from Delivery to SHCs
Current 25 SHCs
DMA Delivery to
25 SHCs System Savings DRF Savings
SHC (DRF)
Savings MOH Savings
Transport Costs 0
Vehicle Breakdown Cost 75,445 9,160 66,285 (9,160) 75,445
Public Transport Usage Cost 84,150 84,150 84,150 84,150
Fuel Costs 166,366 334,913 (168,547) (168,547) 166,366
Vehicle Depreciation 853,306 1,236,600 (383,294) (1,236,600) 853,306
Scheduled Vehicle Maintenance 35,061 164,880 (129,819) (164,880) 35,061
Insurance Costs 0 1,800 (1,800) (1,800) 0
Total Transport Costs 1,214,328 1,747,353 (533,025) (1,496,837) 250,516 963,812
Total Personnel Costs 34,582,031 33,708,855 873,175 (210,000) (210,000) 1,083,175
Total Refrigeration Costs 1,025,424 1,025,424 0
Total DRF Commodities Costs 134,521,507 130,754,904 3,766,603 3,766,603 3,766,603 0
3PL Costs Transportation 0 0 0
Grand Totals 171,343,289 167,236,536 4,106,754 2,059,766 3,807,119 2,046,987
Percentage of 2009 Sales 3.2% 1.6% 2.9% 1.6%
We assumed that the DMA would manage delivery to SHCs with their own truck. (We provide more specific assumptions and observations about the model in Appendix A.5.) Our model showed that this would result in savings at all levels with an overall system savings of 3.2% of 2009 sales, which included 1.6% MOH savings and maximum savings of 2.9% at the SHCs. The difference in savings between the DRF savings and the SHC (DRF) savings of 1.3%, represented the cost of implementing delivery to SHC recommendation. If all 1.3% of costs come from the SHCs, for example, through a transportation fee, this would reduce the SHC savings to 1.6% or ₦2,059,766. Recall from Table 4.8 that as a percentage of 2009 sales, distribution and inflation costs for the SHCs were 4.31% implying that with savings of 1.6% (after 1.3% cost of implementation), the markup allocation of 5% more than covers remaining distribution and inflation costs of 2.71% (4.31% - 1.6%).
Most of the DRF savings were derived from the reduction in inflation costs as a result of lower inventory at the SHCs. (Inflation costs under Recommendation B were 1.25% of sales vs. 4.17% for current costs.) This lower inventory results from our recommended monthly delivery frequency to the SHC's and safety stock of one month. (This monthly delivery frequency would be a dramatic reduction from the average frequency of our sample of 3.875 months between replenishments.) The expected savings from DMA delivery are not inconsequential, especially since mark-up allocated to inflation is 4%.
Challenges for Current System Recommendation B: Reducing Inventory Investment
As mentioned earlier, the savings from recommendation B were the result of the reduction in inventory investment at the SHC in response to more frequent deliveries. Inventory however can serve an emotional purpose inasmuch as an economic one; SHC store managers may feel more comfortable with a larger buffer stock just in case. Such emotional justification for seemingly excess inventory may even seem adequate given the history of unfilled orders at the DMA. This is a standard challenge of developing trust with in the supply chain so that system savings can accrue to various supply chain partners. It was determined that it makes sense to pursue this recommendation after Current Recommendation A, as the performance of the DMA providing regular deliveries to the PHCs would provide credible evidence to the SHC of the development of the DMA’s capabilities. This would also serve to allow the DMA to focus on the PHCs without

55
distraction from trying to implement two recommendations at once. In addition, in the early stages of implementation of Recommendation B, the reduction in inventory investment at the SHCs should be gradual, say over six months. This would also serve to gradually ramp up monthly deliveries from the DMA to the SHC, as during this gradual reduction of the inventory at the SHC, deliveries from the DMA would be less than their expected long-term average.
4.3.4 Expansion of DRF Recommendations: DMA as Sole Warehouse
In expanding the DRF to additional facilities, we recommended that the DMA be kept as the sole warehouse. Adding additional warehouses to the network potentially reduced transportation costs since facilities would be closer to a warehouse. However, the estimated savings from such a network as estimated in the table below for distribution to PHCs is small - system savings of 0.8% of expected sales for tripling the size of the PHC DRF network with two warehouses versus only the DMA.
Table 4.20: Cost & Savings Breakdown - Expanding the DRF System with One
versus Two Warehouses
Partial Outsourcing to
465 PHCs
Partial
Outsourcing to
465 PHCs with 2
warehouses System Savings
Total Transport Costs 2,073,331 1,936,896 136,435
Total Personnel Costs 65,721,691 65,217,483 504,209
Total Refrigeration Costs 0 0 0
Total DRF Commodities Costs 82,161,463 82,161,463 0
Total Warehouse Costs 0 0 0
3PL Costs Transportation 3,347,835 3,347,835 0
Grand Totals 153,304,321 152,663,677 640,644
Percentage of 2009 Sales 192.0% 191.2% 0.8%
The other potential challenge to a multiple warehouse network is the potential for excessive inventory investment. At the time of the study, the DMA was operating with 30 months of inventory. This suggested the need for improvement in the forecasting and procurement capabilities of the DMA. Additional warehouses could compound the inventory investment costs issues that could be observed at the DMA. Even assuming that the DMA improved its capability for managing inventory, and its capability could be passed on the additional warehouse, the analysis in the previous table suggested that the transportation savings would not be significant.
Challenges for Current System Recommendations: Improving Forecasting and Procurement
Capability
The expansion of the DRF to additional facilities was a natural way to reduce the excess inventory investment at the DMA; as sales automatically increase with the addition of facilities, the months of sales can decrease if no additional inventory is introduced into the system. However, if the forecasting and procurement capabilities of the DMA remain suspect and the system dynamics that increased complexity of forecasting and procurement are not reduced, the resulting increase in excess inventory will tend to be even more dramatic.
Although forecasting and procurement were not examined in detail, the following observations should prove helpful in improving forecasting and procurement outcomes:

56
1. The DMA does seem to have consumption data from facilities to support forecasting and procurement. The data may be in paper form and not digitized, which would hamper analysis somewhat. However, its existence is a crucial piece of the puzzle for improving forecasting and procurement outcomes.
2. Predictability improves the ability to forecast. The recommendations for PHC distribution (and even for the considered but rejected option for SHC distribution) have regularity as a feature, e.g., quarterly deliveries, two-week lead times between requisition and deliveries, etc. Such features should reduce uncertainty in the system and enable forecasting and procurement capabilities to improve and support DRF distribution.
3. Conversations with DRF system designers raised the potential for other drug supply chain systems, e.g., the LGA drug supply system, purchase more commodities from the DMA but have the inventory flow from the DMA to the facilities without passing through LGA stores. Such approaches would increase the level of information available to the DMA about commodity flows to the facilities and provide greater control of the flow of these commodities to the DMA, which should help reduce the complexity of forecasting and procurement.
4.3.5 General Challenges
Who Pays?
Irrespective of which recommendations or alternatives are adopted, the allocation of the costs of the recommendation between the parties involved - DMA, SHC, PHC and MOH –are a major consideration.
Recall that our Recommendations A & B had costs 6.7% of PHC sales (1.7% of SHC sales) and 1.3% of SHC sales (6.31% of PHC sales) respectively. Our cost analysis showed that the DMA and the PHCs had unsustainable cost structures, while the SHC’s cost structure seemed sustainable but had potential for additional efficiencies, e.g., reduction in inflation costs. In particular, the SHC’s could clearly afford a transportation fee paid to the DMA of roughly 1.3% of their allowed markup. The SHC could go further in assuming costs of the recommendations. A closer look at inflation costs for the SHC suggested that under Recommendation B, inflation had been reduced from 4.16% to 1.25% of sales. Essentially, if the inflation markup allowance for SHCs was reduced to 1.3%, and a transportation fee of 2.7% was levied on the SHCs, then this transportation fee could cover the costs of Recommendations A & B. Table 4.18 shows a slight improvement in costs that result from eventual simultaneous implementation of Recommendations A and B. Here combining the recommendations reduced the costs of Recommendations A and B to 2.7% of SHC sales (the difference between DRF savings and SHC & PHC savings in the table) from 3.0%, the sum of the recommendations individually. Based on our cost analysis, if the SHC assumed the transportation fee of 2.70%, its cost structure should still remain sustainable, while the PHC cost structure that currently costs roughly 22.68% of PHC sales (DRF funded transportation costs and inflation costs) could experience full savings of 21.19%. Note that recommendation A assumed 155 PHCs on the DRF and it was likely that as more PHCs are added to the DRF, this transportation fee of 2.7 % of sales levied on the SHC would not necessarily cover the costs for the additional PHCs unless SHC sales also increased under the recommendations. In addition then, we noted the savings to the MOH from our recommendations.
Recall that MOH savings were in the form of MOH personnel and assets that would now be freed up to pursue other MOH priorities. It seemed fair to consider that the MOH could also contribute to the costs of these recommendations in the drug revolving fund, but such an action, could result in an actual increase in the MOH’s budget. Although the MOH may be tempted to react negatively to such
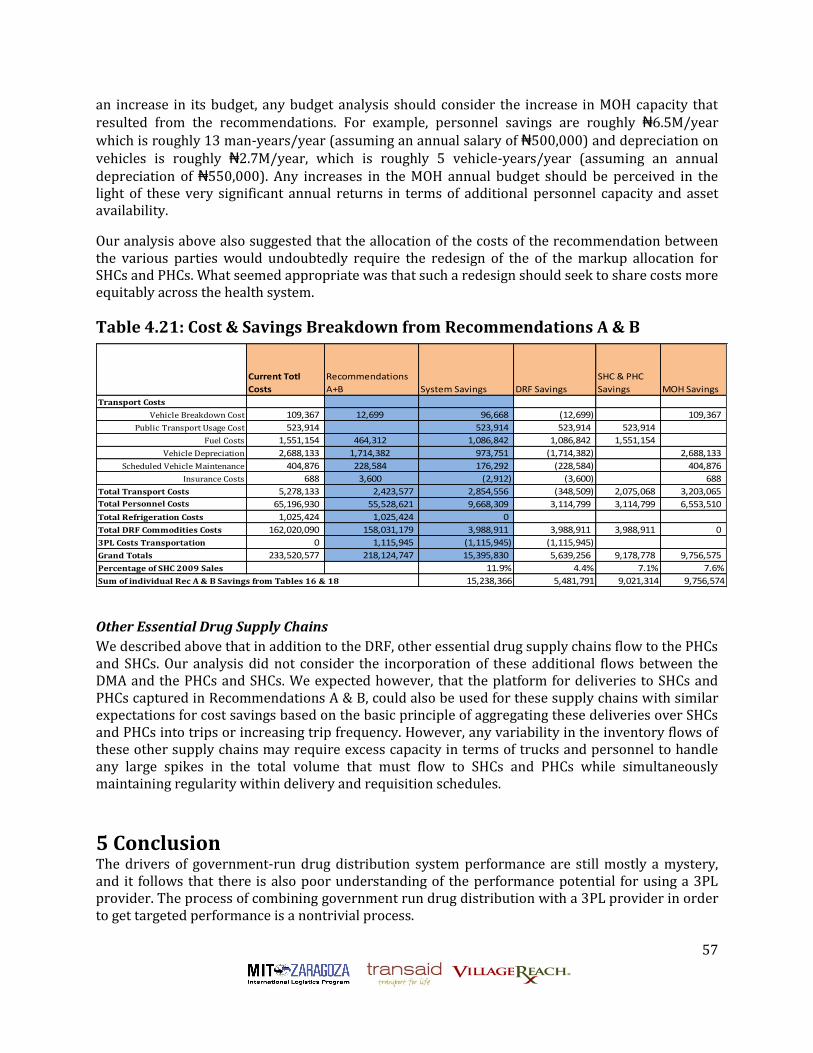
57
an increase in its budget, any budget analysis should consider the increase in MOH capacity that resulted from the recommendations. For example, personnel savings are roughly ₦6.5M/year which is roughly 13 man-years/year (assuming an annual salary of ₦500,000) and depreciation on vehicles is roughly ₦2.7M/year, which is roughly 5 vehicle-years/year (assuming an annual depreciation of ₦550,000). Any increases in the MOH annual budget should be perceived in the light of these very significant annual returns in terms of additional personnel capacity and asset availability.
Our analysis above also suggested that the allocation of the costs of the recommendation between the various parties would undoubtedly require the redesign of the of the markup allocation for SHCs and PHCs. What seemed appropriate was that such a redesign should seek to share costs more equitably across the health system.
Table 4.21: Cost & Savings Breakdown from Recommendations A & B
Current Totl
Costs
Recommendations
A+B System Savings DRF Savings
SHC & PHC
Savings MOH Savings
Transport Costs
Vehicle Breakdown Cost 109,367 12,699 96,668 (12,699) 109,367
Public Transport Usage Cost 523,914 523,914 523,914 523,914
Fuel Costs 1,551,154 464,312 1,086,842 1,086,842 1,551,154
Vehicle Depreciation 2,688,133 1,714,382 973,751 (1,714,382) 2,688,133
Scheduled Vehicle Maintenance 404,876 228,584 176,292 (228,584) 404,876
Insurance Costs 688 3,600 (2,912) (3,600) 688
Total Transport Costs 5,278,133 2,423,577 2,854,556 (348,509) 2,075,068 3,203,065
Total Personnel Costs 65,196,930 55,528,621 9,668,309 3,114,799 3,114,799 6,553,510
Total Refrigeration Costs 1,025,424 1,025,424 0
Total DRF Commodities Costs 162,020,090 158,031,179 3,988,911 3,988,911 3,988,911 0
3PL Costs Transportation 0 1,115,945 (1,115,945) (1,115,945)
Grand Totals 233,520,577 218,124,747 15,395,830 5,639,256 9,178,778 9,756,575
Percentage of SHC 2009 Sales 11.9% 4.4% 7.1% 7.6%
Sum of individual Rec A & B Savings from Tables 16 & 18 15,238,366 5,481,791 9,021,314 9,756,574
Other Essential Drug Supply Chains
We described above that in addition to the DRF, other essential drug supply chains flow to the PHCs and SHCs. Our analysis did not consider the incorporation of these additional flows between the DMA and the PHCs and SHCs. We expected however, that the platform for deliveries to SHCs and PHCs captured in Recommendations A & B, could also be used for these supply chains with similar expectations for cost savings based on the basic principle of aggregating these deliveries over SHCs and PHCs into trips or increasing trip frequency. However, any variability in the inventory flows of these other supply chains may require excess capacity in terms of trucks and personnel to handle any large spikes in the total volume that must flow to SHCs and PHCs while simultaneously maintaining regularity within delivery and requisition schedules.
5 Conclusion The drivers of government-run drug distribution system performance are still mostly a mystery, and it follows that there is also poor understanding of the performance potential for using a 3PL provider. The process of combining government run drug distribution with a 3PL provider in order to get targeted performance is a nontrivial process.

58
To unpack the mystery of government run drug distribution systems we developed a framework for thinking about supply chain performance that could guide the areas of focus of our study, grounding that framework in measuring the performance of a particular government run drug distribution system with cost as our main metric. To understand the performance potential for 3PLs, we created a cost model to predict improvements in the government run drug distribution system whether from outsourcing or from local improvements. Finally, we considered the process of the initiation and management of 3PL outsourcing, focusing on 3PL screening and engagement and probably the most challenging aspect, how the public sector should/can learn to manage 3PLs.
59
Appendix A
A.1 Additional Specifics on Our Costing Model
Sample or actual data including the portion of transport, personnel, cold chain, and commodity costs that apply to the supply chain being studied can be entered in the model directly into the Excel worksheets, or via macros to facilitate the data entry. As the costs are entered into the model, they are standardized to monthly costs, and the model then projects and calculates the costs for the entire study catchment at a monthly, sample, and time period selected by the user.
Additional model features include:
Cost summaries at a time period determined by the user. For example, in addition to a monthly cost, costs can be calculated on a quarterly, bi-annual, or annual basis.
Automated currency conversion. Costs can be entered in the model as the same or different currency than the user desires for the outputs.
Supply chain flexibility. The model can accommodate all types of supply chain designs including hub and spoke and circular distributions, collection and delivery systems, and any combination thereof. The model is designed to accommodate situations where the supply chain is not systematic.
Cost-effectiveness and efficiency measures. The model calculates costs per two measures selected by the user. For example, these measures can be cost per a certain health impact measure, commodity type used, dollar amount spent on commodities, km driven, etc. These measures provide an opportunity to measure cost-effectiveness and efficiency depending on the measures used.
Labor costs categorization. The costs of labor are divided between distribution transport, warehouse, and management costs.
Transport and cold chain base data. The model pulls transport equipment, transport maintenance, and cold chain equipment data from a base of costs entered by the user. Each time those pieces of equipment are used in distribution, they are pulled from to determine the cost of that distribution segment’s use.
Averaging actual breakdown and cold chain maintenance costs. To calculate the costs of transport breakdowns, cold chain breakdowns, and cold chain maintenance, the model accepts a series of actual data and averages them. Then, just as above each time the related equipment is used in distribution, they are pulled from to determine the cost of that distribution segment’s use.
Flexible staff types. The user can designate the worker types (e.g. health worker, non-health worker, pharmacy, etc) for the calculation of their costs and time in the distribution system.
Staff time summaries. The model automatically populates and calculates the staff time used in the distribution system divided by distribution transport, warehousing, and management. These classifications are further broken down by types of staff as described above.
Graphs for costing analysis. The model provides pie graphs for the total system costs, transport costs, cold chain costs, personnel costs, and personnel time.
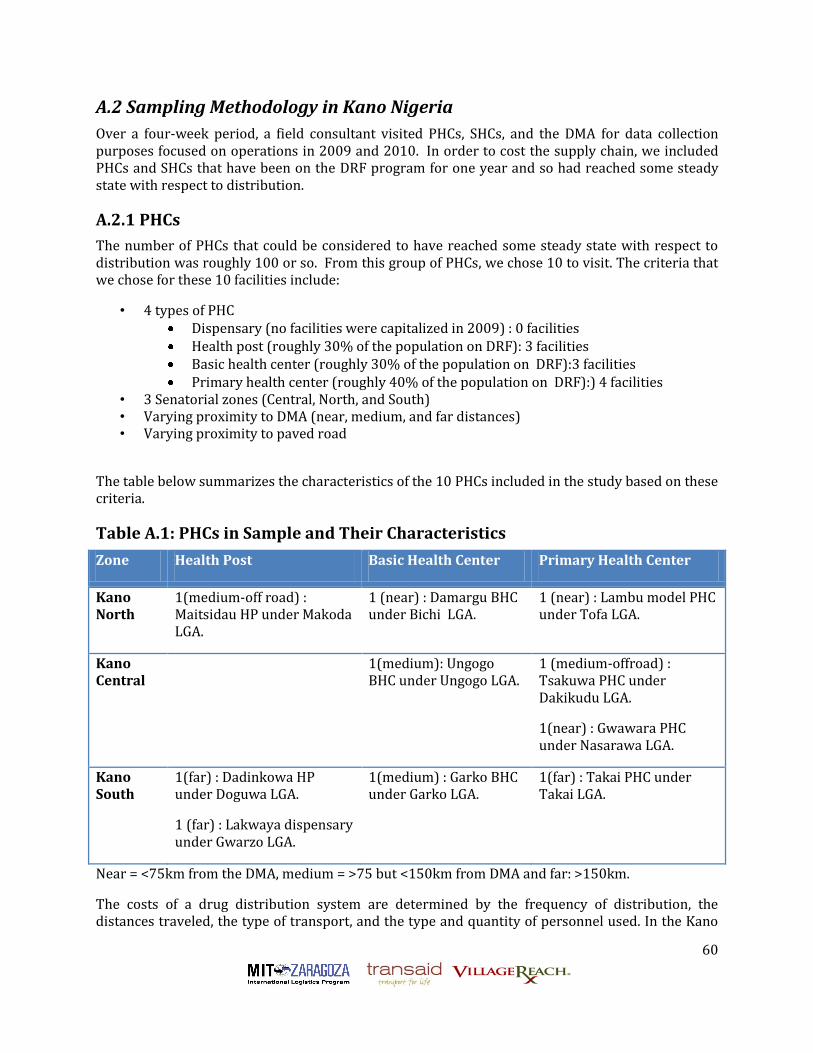
60
A.2 Sampling Methodology in Kano Nigeria
Over a four-week period, a field consultant visited PHCs, SHCs, and the DMA for data collection purposes focused on operations in 2009 and 2010. In order to cost the supply chain, we included PHCs and SHCs that have been on the DRF program for one year and so had reached some steady state with respect to distribution.
A.2.1 PHCs
The number of PHCs that could be considered to have reached some steady state with respect to distribution was roughly 100 or so. From this group of PHCs, we chose 10 to visit. The criteria that we chose for these 10 facilities include:
• 4 types of PHC Dispensary (no facilities were capitalized in 2009) : 0 facilities Health post (roughly 30% of the population on DRF): 3 facilities Basic health center (roughly 30% of the population on DRF):3 facilities Primary health center (roughly 40% of the population on DRF):) 4 facilities
• 3 Senatorial zones (Central, North, and South) • Varying proximity to DMA (near, medium, and far distances) • Varying proximity to paved road
The table below summarizes the characteristics of the 10 PHCs included in the study based on these criteria.
Table A.1: PHCs in Sample and Their Characteristics
Zone Health Post Basic Health Center Primary Health Center
Kano North
1(medium-off road) : Maitsidau HP under Makoda LGA.
1 (near) : Damargu BHC under Bichi LGA.
1 (near) : Lambu model PHC under Tofa LGA.
Kano Central
1(medium): Ungogo BHC under Ungogo LGA.
1 (medium-offroad) : Tsakuwa PHC under Dakikudu LGA.
1(near) : Gwawara PHC under Nasarawa LGA.
Kano South
1(far) : Dadinkowa HP under Doguwa LGA.
1 (far) : Lakwaya dispensary under Gwarzo LGA.
1(medium) : Garko BHC under Garko LGA.
1(far) : Takai PHC under Takai LGA.
Near = <75km from the DMA, medium = >75 but <150km from DMA and far: >150km.
The costs of a drug distribution system are determined by the frequency of distribution, the distances traveled, the type of transport, and the type and quantity of personnel used. In the Kano

61
DRF distribution system, these factors varied widely. These factors varied by PHC and by month. The system and its variations are portrayed in the diagram below, which shows the average monthly number of replenishment trips (frequency), types of transport used in the full data set, range of distances sampled, and the total number of people involved in the transport of the DRF drug distribution by PHC from the total data set of this sample.
Figure A.1: DRF Distribution System Summary
DMA
Gwagwarawa7 km Ungogo
17 km
Lambou Model20 km Tsakuwa
32 km
Maitsidau55 km
Damargu60 km
Lakwaya74 km
Garko80 km
Takai90 km
Dadinkowa230 km
Public transportation
Personal vehicle
Ambulance
Facility owned vehicle
Total Number of People involved in distribution
Average number of trips per replenishment
DRF Distribution System Summary
The table below shows the data for the same distribution system variables from the sample of PHCs. This table reveals the variety in the number of people involved in a distribution trip between and within PHCs.
Table A.2: Sample Distribution Data for Last 3 PHC DRF Replenishments
Total
No. of
Trips
Average No. of
Trips per
Replenishment
Average No. of
Months Between
Replenishments
Type of Transport
Round
Trip
km
Minimum
No. of
People
Involved
Maximum
No. of
People
Involved
2 1 9 Facility Owned Truck 148 5 5
5 1.67 2.5
Personal motorcycle
Ambulance 40 1 4
6 2 3.5
Incharge private car
Ambulance 160 1 4
3 1 1.25 Ambulance 34 2 2
1 1 Unknown Facility Owned Truck 120 3 3
2 2 > 9 Public transportation 110 1 1
6 2 2.5 Public transportation 14 2 3
3 1 6.5 Public transportation 460 1 1
4 1.67 6
Personal motorcycle
Public transportation 64 1 4
6 2 7.5 Ambulance 180 3 3*Of the 10 PHCs sampled, 2 PHCs had the documentation and sufficient recall to provide data on only the previous
replenishment. One PHC had the documentation and sufficient recall to provide data on only the last 2
replenishments.
Distribution Data for Last 3 DRF Replenishments*
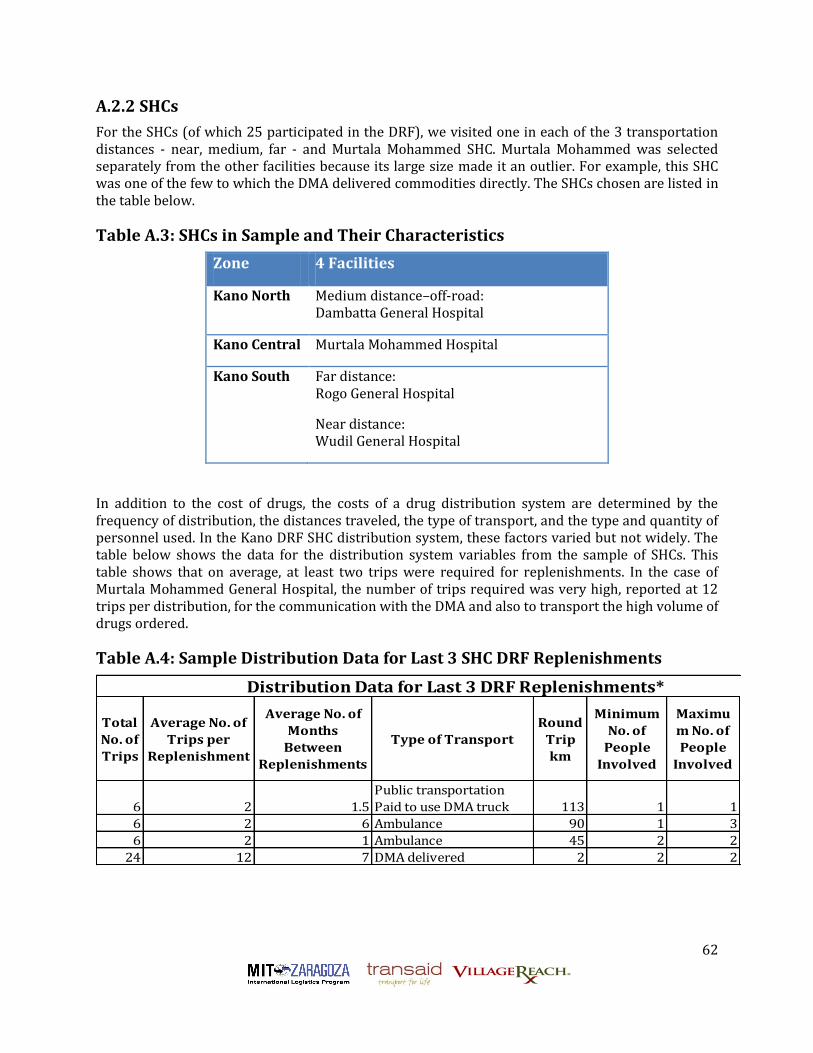
62
A.2.2 SHCs
For the SHCs (of which 25 participated in the DRF), we visited one in each of the 3 transportation distances - near, medium, far - and Murtala Mohammed SHC. Murtala Mohammed was selected separately from the other facilities because its large size made it an outlier. For example, this SHC was one of the few to which the DMA delivered commodities directly. The SHCs chosen are listed in the table below.
Table A.3: SHCs in Sample and Their Characteristics
Zone 4 Facilities
Kano North Medium distance–off-road: Dambatta General Hospital
Kano Central Murtala Mohammed Hospital
Kano South Far distance: Rogo General Hospital
Near distance: Wudil General Hospital
In addition to the cost of drugs, the costs of a drug distribution system are determined by the frequency of distribution, the distances traveled, the type of transport, and the type and quantity of personnel used. In the Kano DRF SHC distribution system, these factors varied but not widely. The table below shows the data for the distribution system variables from the sample of SHCs. This table shows that on average, at least two trips were required for replenishments. In the case of Murtala Mohammed General Hospital, the number of trips required was very high, reported at 12 trips per distribution, for the communication with the DMA and also to transport the high volume of drugs ordered.
Table A.4: Sample Distribution Data for Last 3 SHC DRF Replenishments
Total
No. of
Trips
Average No. of
Trips per
Replenishment
Average No. of
Months
Between
Replenishments
Type of Transport
Round
Trip
km
Minimum
No. of
People
Involved
Maximu
m No. of
People
Involved
6 2 1.5
Public transportation
Paid to use DMA truck 113 1 1
6 2 6 Ambulance 90 1 3
6 2 1 Ambulance 45 2 2
24 12 7 DMA delivered 2 2 2
Distribution Data for Last 3 DRF Replenishments*

63
A.3 Summary of Assessment findings
Major Cost Drivers
The major cost drivers identified in our costing analysis were the following:
Level of inventory investment at DMA; Requisition and collection system, especially from the PHCs including transportation costs
and per diems; Required inventory investment at PHCs and SHCs; and Personnel costs.
Capability Assessment
Capability assessment of the DMA showed:
Adequate basic and advanced warehousing capabilities; Suspect forecasting and procurement capabilities; Data management focused on financial transactions; Good problem solving of transportation problems; No third-party logistics management capabilities; and Poor fleet management capability.
Capability assessment of the PHCs and SHCs showed:
Mixed problem-solving capability of managing coordinating requisition and delivery amongst themselves;
Data management focused on financial transactions; Compromised forecasting and procurement capabilities (e.g., too many emergency orders);
and No third-party logistics management capabilities.
Capability assessment of transport 3PLs showed:
A range of fleet management capability from weak to good; A range of problem solving of distribution problems from weak to good; and Mixed capability for managing clients.
Capability assessment of warehousing 3PLs showed:
Adequate basic and advanced warehousing capabilities; and Good capability for managing clients.
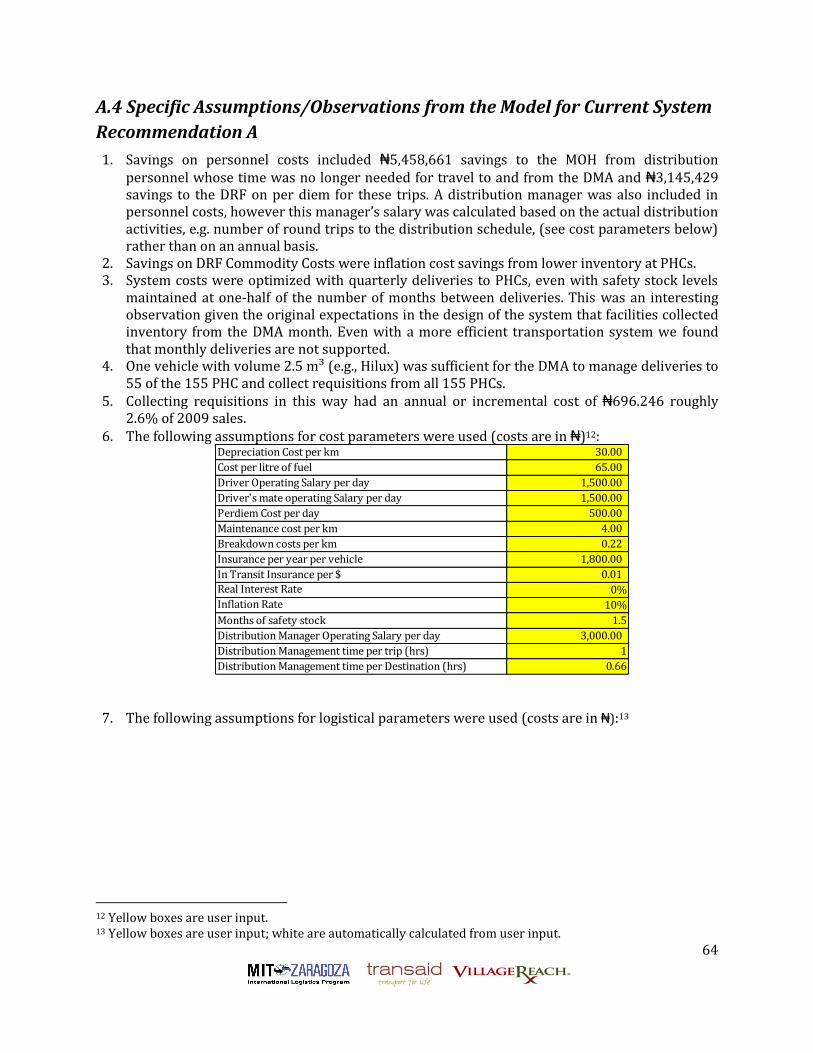
64
A.4 Specific Assumptions/Observations from the Model for Current System
Recommendation A
1. Savings on personnel costs included ₦5,458,661 savings to the MOH from distribution personnel whose time was no longer needed for travel to and from the DMA and ₦3,145,429 savings to the DRF on per diem for these trips. A distribution manager was also included in personnel costs, however this manager’s salary was calculated based on the actual distribution activities, e.g. number of round trips to the distribution schedule, (see cost parameters below) rather than on an annual basis.
2. Savings on DRF Commodity Costs were inflation cost savings from lower inventory at PHCs. 3. System costs were optimized with quarterly deliveries to PHCs, even with safety stock levels
maintained at one-half of the number of months between deliveries. This was an interesting observation given the original expectations in the design of the system that facilities collected inventory from the DMA month. Even with a more efficient transportation system we found that monthly deliveries are not supported.
4. One vehicle with volume 2.5 m³ (e.g., Hilux) was sufficient for the DMA to manage deliveries to 55 of the 155 PHC and collect requisitions from all 155 PHCs.
5. Collecting requisitions in this way had an annual or incremental cost of ₦696.246 roughly 2.6% of 2009 sales.
6. The following assumptions for cost parameters were used (costs are in ₦)12: Depreciation Cost per km 30.00
Cost per litre of fuel 65.00
Driver Operating Salary per day 1,500.00
Driver's mate operating Salary per day 1,500.00
Perdiem Cost per day 500.00
Maintenance cost per km 4.00
Breakdown costs per km 0.22
Insurance per year per vehicle 1,800.00
In Transit Insurance per $ 0.01
Real Interest Rate 0%
Inflation Rate 10%
Months of safety stock 1.5
Distribution Manager Operating Salary per day 3,000.00
Distribution Management time per trip (hrs) 1
Distribution Management time per Destination (hrs) 0.66
7. The following assumptions for logistical parameters were used (costs are in ₦):13
12 Yellow boxes are user input. 13 Yellow boxes are user input; white are automatically calculated from user input.

65
Average yearly dollar shipment to 1 destination point 171,683.87
Avg Dollar per unit volume (m3) 769,230.77
Average yearly shipment volume to 1 destination point (m3) 0.22
Typical Drug Density (Kg/m3) 100
Average yearly shipment Kg to 1 destination point 22.32
Number of Working days in a year 240
Average number of delivery visits to destination per year 4
Average volume shipment per visit (m3) 0.056
Average dollar shipment per visit 42,920.97
Average Kg shipment per visit 5.58
Average volume capacity of vehicles (m3) 2.5
Average time at each destination (hr) 0.33
Average time at source (hr) per destination 0.33
Average speed (kilometers per hour) 45
Average km per litre 8
Number of hours in one day 7
A.5 Specific Assumptions/Observations for Current System
Recommendation B
1. System costs were roughly optimized with monthly deliveries to SHCs, with safety stock levels maintained at 1 month.
2. We also assumed that as with PHC, the distribution system analyzed would involve the DMA transporter completing a regular circuit of the SHCs, on a monthly basis. This circuit could be planned such that each facility is visited twice with a two-week interval in between. The first visit would be to collect the procurement order from the facility, and the second would be to deliver the commodities. Such an arrangement would provide the DMA with the lead-time required to compile the order, and provide a service to the PHCs and SHCs who previously had to travel to the DMA and wait at the DMA to place and process the order.
3. One vehicle with volume 2.5 m³ was sufficient for the DMA to manage deliveries and collect requisition from all 25 SHCs.
4. Collecting requisitions in this way had an annual incremental cost of ₦624,497 roughly 0.48% of 2009 sales.
5. The following assumptions for cost parameters were used:
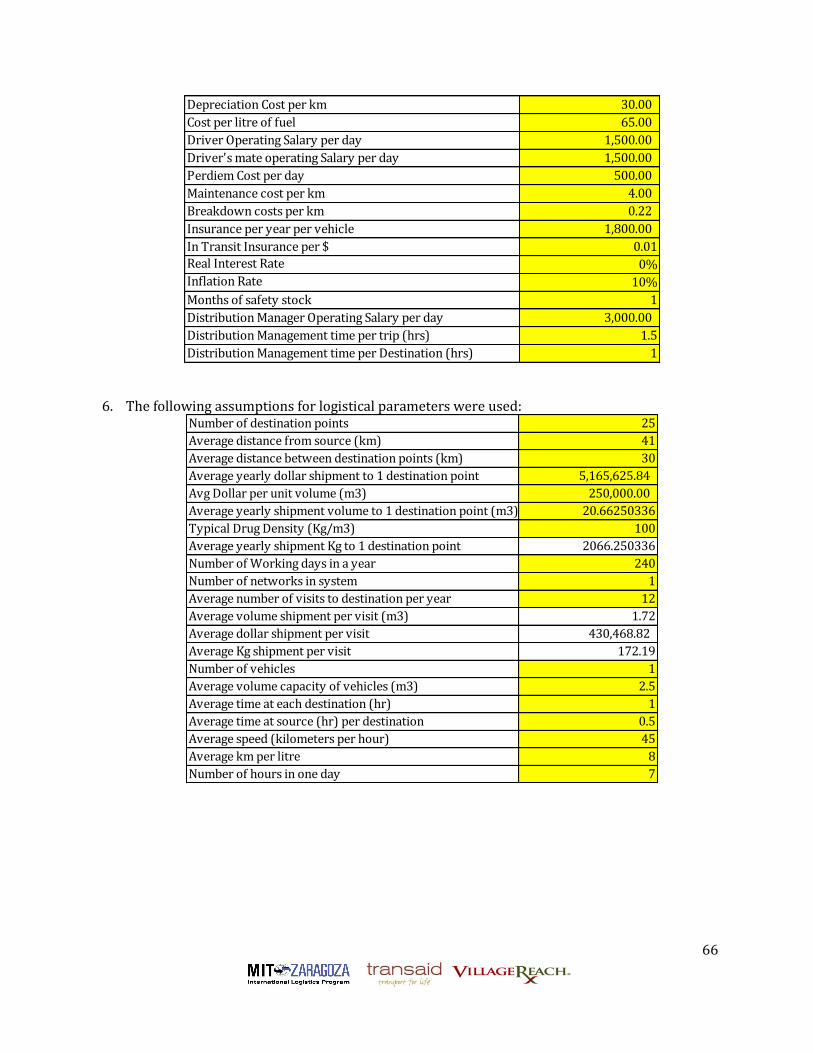
66
Depreciation Cost per km 30.00
Cost per litre of fuel 65.00
Driver Operating Salary per day 1,500.00
Driver's mate operating Salary per day 1,500.00
Perdiem Cost per day 500.00
Maintenance cost per km 4.00
Breakdown costs per km 0.22
Insurance per year per vehicle 1,800.00
In Transit Insurance per $ 0.01
Real Interest Rate 0%
Inflation Rate 10%
Months of safety stock 1
Distribution Manager Operating Salary per day 3,000.00
Distribution Management time per trip (hrs) 1.5
Distribution Management time per Destination (hrs) 1
6. The following assumptions for logistical parameters were used:
Number of destination points 25
Average distance from source (km) 41
Average distance between destination points (km) 30
Average yearly dollar shipment to 1 destination point 5,165,625.84
Avg Dollar per unit volume (m3) 250,000.00
Average yearly shipment volume to 1 destination point (m3) 20.66250336
Typical Drug Density (Kg/m3) 100
Average yearly shipment Kg to 1 destination point 2066.250336
Number of Working days in a year 240
Number of networks in system 1
Average number of visits to destination per year 12
Average volume shipment per visit (m3) 1.72
Average dollar shipment per visit 430,468.82
Average Kg shipment per visit 172.19
Number of vehicles 1
Average volume capacity of vehicles (m3) 2.5
Average time at each destination (hr) 1
Average time at source (hr) per destination 0.5
Average speed (kilometers per hour) 45
Average km per litre 8
Number of hours in one day 7

67
Bibliography
[1] P. Arroyo, J. Gaytan, and L. de Boer, A survey of third party logistics in Mexico and a comparison with reports on Europe and USA. International Journal of Operations & Production Management 26 (2006) 639-667.
[2] R.C. Lieb, R.A. Millen, and L.N. Van Wassenhove, Third-party logistics: a comparison of experienced American and European manufacturers. International Journal of Physical Distribution & Logistics Management 23 (1993) 11.
[3] J. Hong, and A.T.H. Chin, Firm specific characteristics and logistics outsourcing by Chinese manufacturers. Asia Pacific Journal of Marketing and Logistics 16 (2004) 14.
[4] M.S. Sohail, and A.S. Sohal, The use of third party logistics services: a Malaysian perspective. Technovation 23 (2003) 401-408.
[5] M.S. Sohail, N.K. Austin, and M. Rushdi, The use of third party logistics services: evidence from a sub-Sahara African nation. International Journal of Logistics: Research and Applications 7 (2004) 13.
[6] O.E. Williamson, Markets and Hierarchies, Free Press, New York, NY, 1975. [7] C.K. Pralahad, and G. Hamel, The core competence of the corporation. Harvard Business Review
(1990) 13. [8] D. Ford, B. Cotton, D. Farmer, A. Gross, and I. Wilkinson, Make-or-buy decisions and their
implications. Industrial Marketing Management 22 (1993) 8. [9] R. McIvor, A practical framework for understanding the outsourcing process. Supply Chain
Management 5 (2000). [10] L. de Boer, J. Gaytan, and P. Arroyo, A satisficing model of outsourcing. Supply Chain
Management-an International Journal 11 (2006) 444-455. [11] D.R. Probert, The practical development of a make or by strategy: the issue of process
positioning. Integrated Manufacturing Systems 7 (1996) 8. [12] M. Huff-Rousselle, and S. Raja, Ghana: Estimating the Cost of Logistics in the Ministry of Health
Supply System, Family Planning Logistics Management (FPLM)/John Snow, Inc., for the US Agency for International Development, 2002.
[13] T. Vian, Uganda: Assessing the Costs of Distribution to Health Sub-Districts, John Snow, Inc/DELIVER and Boston University, for teh US Agency for International Development, Arlington, VA, 2003.
[14] T. Vian, Zimbabwe: Assessing the Cost of Transporting HIV/AIDS Commodities: A Case Study in Financial Analysis, John Snow, Inc/DELIVER and Boston: Boston University, for the US Agency for International Development, Arlington, VA, 2003.
[15] E. Baruwa, M. Tien, and D. Sarley, Zambia ARV Supply Chain Costs: A Pilot of the Supply Chain Costing Tool, USAID | DELIVER PROJECT, Task Order 1, Arlington, VA, 2010.
[16] B.M. Sani, and S.i. Sulaiman, The Structure of Kano Economy. [17] Kano Federal Constituency Newsletter of Office of the Speaker, House of Representative,
Federal Republic of Nigeria [18] JSI, Rapid Assessment of Drug Logistics Systems in Kano State, 2009.