framework for the management of wetlands …
TRANSCRIPT

FRAMEWORK FOR THE MANAGEMENT OF WETLANDS WITHIN CATCHMENTS WHERE ESKOM OPERATES
Report to the
Water Research Commission
by
Adri Venter1 and Steve Mitchell1,2 1Eon Consulting
2Centre for Environmental Management, University of the Free State
WRC Report No. 2222/1/15
ISBN 978-1-4312-0665-0
April 2015

ii
Obtainable from Water Research Commission Private Bag X03 Gezina, 0031 [email protected] or download from www.wrc.org.za
DISCLAIMER
This report has been reviewed by the Water Research Commission (WRC) and approved for publication. Approval does not signify that the contents necessarily reflect the views and policies of the WRC, nor does mention of trade names or commercial products constitute
endorsement or recommendation for use.
© WATER RESEARCH COMMISSION

iii
EXECUTIVE SUMMARY
South Africa is a water stressed country. The definition of water stress is related to water scarcity as it includes the need to meet both human and ecological needs. The country also has huge economic development pressures and social upliftment challenges which increase the pressure on water availability (WWF, 2014). South Africa, with carbon emissions in 2012 at 330 000 kt (6.3 t per capita), ranks 19th in the world for total carbon emissions (Olivier et al., 2014). Eskom’s coal-fired power stations are large contributors to South Africa’s carbon emissions.
Since the revision of environmental policy and legislation that began after 1994 the legislative requirements for wetland management have become much more demanding – in particular the National Water Act (1998), the various parts of the National Environmental Management Act (1998), National Environmental Management Protected Areas Act (2003) and the National Environmental Management: Biodiversity Act (2004). There are also other acts that have effect on wetland management. These Acts require a high level of compliance from those working in and around wetlands. The legal requirements are evolving so it is necessary to keep abreast of the requirements and adapt to changes as they occur.
This can be challenging for the environmental managers at Eskom. The wetland management framework (WMF) has been developed to give guidance in the decision making and management of wetlands on Eskom property. The WMF, as developed, is suitable for broader application than just Eskom. The ecological and management principles are applicable anywhere in southern Africa and beyond. The legal aspects, however, are specifically South African. The framework may be applied to agricultural, urban, mining or other developments in South Africa with little modification. The intention of this document is that it should provide an industry standard that will get embedded in Eskom’s modus operandi and be used by Eskom personnel. To this end the structure has followed that of the Eskom Project Life Cycle Model (PLCM). This project has added an extra dimension to the Eskom PLCM by creating a process for the management of wetlands within the current legal environment and the current understanding of the ecosystem services in a format that may be embedded within the existing PLCM.
Background
Eskom (originally ESCOM or EVKOM) was established in 1923 in terms of the Electricity Act of 1922. It follows that much of the infrastructure was built before the more recent understanding of the importance of the contributions of ecological infrastructure to the national economy or the spate of new legislation post 1994.
The realization amongst water managers that the country was going to be short of water came to the fore after the drought of the late 1960s. But it wasn’t for another two decades or so that this knowledge became widely accepted. So water stress has been an issue since the late 20th century.
The earlier developments were put in place without the current understanding of the need to conserve water or the need to care for the environment by, for instance, protecting water quality or providing environmental flows.
Wetlands are now recognized as important providers of ecosystem services. A recent publication (De Groot et al., 2912) shows that inland wetlands are the most valuable

iv
providers of ecosystem services of all the inland biomes. The greatest contribution to this value is the regulating services.
Eskom benefits from these services, but with the coal fired power stations of Mpumalanga and the Ingula PSS being in the upper catchments of major river systems, the activities of Eskom have the potential to influence the quality of the benefits provided by the ecological infrastructure to others downstream in the SES. It is, therefore, part of Eskom’s corporate responsibility to the SES to conserve the wetlands that provide these benefits to the wider SES.
One of the requirements of the NWA is that a water use license (WUL) is required for any activity that will affect a water course or wetland. While not national policy, there is an emphasis on no net loss of wetlands in the issue of WULs and there is a corps of expertise that has developed around the management and rehabilitation of rivers and wetlands. The delineation of wetlands is a basic requirement for the issue of a WUL, as is the buffer zone around wetlands. The current regulatory zone around wetlands is 500 metres – as such any activity within the regulatory zone requires a Water Use Licence.
The demand for a high level of compliance creates the need for a defined and repeatable methodology for guiding environmental managers and others who plan developments that may impact on the environment to follow so that the impacts can be minimized and, where necessary, the required authorisations may be applied for in advance. The issue of authorisations is a fairly lengthy process and can delay projects if not taken into account early enough.
The wetland management framework (WMF) developed during this project incorporates the legal requirements in a way that integrates them into the overall process of managing wetlands on site during the various stages of the PLCM.
Eskom is one of seven South African companies (123 world-wide; 2014 figures) which have accepted the challenge of the UN CEO Water Mandate to embrace responsible water stewardship. This commits Eskom to a number of activities around caring for water and the institutional environment. In addition to the achievement of a high level of water management in-house, there is a commitment to influence the supply chain to do the same.
The ecological infrastructure that provides the benefits to the SES is not confined by the boundaries of individual properties but by catchments. The commitment through the CEO Water Mandate to manage the water resource should, therefore, be managed by consensus, catchment-wide within the complex SES. Eskom, being a major player within the catchments in which it operates, is in the position to begin to address this.
Objectives
The overall objective of this project was to develop and test an adaptable planning framework that streamlines the conservation of wetlands in areas where Eskom operates from coal to customer.
The following aims were addressed in order to achieve the overall objective:
• To conduct a situation analysis on the methods available to achieve ecologically sustainable energy generation.
• To develop an adaptable strategic framework that considers the sustainability of ecosystems at catchment scale and which can be implemented nationally.
• Collaboratively develop, streamline and test an Eskom environmental conservation management plan on selected sites.

v
• To understand the capacity needs necessary for the application of new monitoring tools, if any, and train the core group of implementing officers.
• To recommend further research on broader water and energy knowledge gaps.
Approach
The first step in the process of developing the required wetland management system was to conduct an extensive literature review.
Next, the wetland management framework (WMF) was incorporated into the Eskom Project Life Cycle Management (PLCM) process.
The incorporation of the WMF into the Eskom PLCM would embed it in the process. This would enable environmental managers, decision-makers and engineers to make valid decisions within the complexity of integrating issues from the ecological, legal, corporate responsibility and the broader environment of the social-ecological system (SES) in a manner congruent with the existing stages of project management.
An additional stage to the PLCM, ‘Operation’ between the steps of Commissioning and Handover and Close out was inserted.
In addition, the Eskom Water Strategy was examined and a generic structure of a large corporate organisation was drawn up to find the most appropriate section of the organisation to perform the various tasks.
The WMF has a total of 78 steps necessary to align with the PLCM. These are distributed as shown in Table 1. In each stage of the PLCM the aspects of wetland management that need to be addressed are listed consecutively so that the person using the framework can work through the stage and not omit anything.

vi
Table ES1: Illustrating the number of action steps in the WMF addressing each category of the PLCM
Stage in the PLCM Action steps
Pre-Feasibility 1-12
Feasibility 13-26
Business Plan 27-37
Planning and design 38-45
Contracting and procurement 46-48
Construction 49-53
Commissioning and hand-over 54-58
Operation 59-71
Close-out 72-74
Evaluate 75-78
Each action step has five components. The first is the stage of the PLCM that is being addressed. The second, the title of the action step, defines the scope of the step. The third gives the relevance to category of focus or impact. This is expressed by a symbol. The fourth component is a list of key questions which will guide the user in the actions to be taken to address the step. The final component lists the organisational elements which will need to be addressed.
Taking Action step 18 as an example: Perform Basic Design is illustrated in Table 2. In the WMF, the first three columns are colour coded differently for each step of the PLCM.
The WMF is designed in such a way that it can be accessed for the step relevant for the stage of the PLCM which is to be addressed. As a result there is some repetition in the overall framework to ensure that nothing important is omitted.

vii
Table ES2: The application of the wetland management framework (WMF) in the context of the PLCM with action step 18 as the example
Stage Action Steps
Focus or Impact
Core Questions Organisational Elements
Feasibility
18 Perform basic design
I. Have wetlands and their buffer zones been indicated on the site lay-out plan?
II. Are there any alternatives to the project design/lay-out to minimise impacts on wetlands, e.g.: a. Location (alternative
properties) b. Site (alternative sites on
the property) c. Activity alternatives d. Layout alternatives e. Design alternatives f. Technology alternatives, g. Operational alternatives?
III. If rehabilitation will be undertaken, has a partnership with Working for Wetlands been established?
IV. If artificial wetlands are considered, has a suitably qualified and experienced person been involved and has the time taken for the wetland to reach optimum efficiency been taken into account? Has maintenance infrastructure (such as cutting and removal of vegetation) been incorporated into the planning?
• Data and Information systems
• Communication systems
1.1 SUB-FRAMEWORKS OF THE WMF
A number of sub-frameworks were considered while developing the WMF. This was considered necessary to capture the complexity of issues which needed to be addressed. These are listed below and described in greater detail after the WMF in the report:
• Hierarchy of conservation targets • Wetland delineation • Impact inventory • Impact assessment • Wetland health assessment • Vegetation • Prioritisation of wetlands for rehabilitation • Rehabilitation of impacts

viii
• Biodiversity corridors • Buffer zones • Indicators • Vegetation management under transmission lines • Ecosystem services • Wetland offsetting • Monitoring • Ecosystem services for communities • Pollution attenuation • Constructed wetlands • Natural wetlands • Carbon storage in wetlands
Case studies
In order to test the WMF, four power stations were selected for the case studies as follows:
Decommissioned and return to service: Grootvlei
Operational: Matla and Kriel
Construction phase: Kusile.
A water management plan (WMP) was developed for Matla in three phases.
Phase 1: Preparation, Status Quo Analysis on site: The intended outcome of Phase 1 is to preserve the status quo on site.
Phase 2: Looking beyond the fence line: The intended outcome of Phase 2 is to develop an integrated wetland management plan.
Phase 3: Taking it a step further: The intended outcome of Phase 3 is engaging the supply chain and implement best practices and planning for closure.
The WMP also lists basic functions which need to be part of each of the phases.
Eskom’s position in the social-ecological system was examined using the Framework developed by Anderies et al., 2004 (Figure 1). Eskom’s relationship to the water resource was assessed in the following ways:-
• The relationship with users upstream in the catchment. This includes inter-basin transfers,
• The managing of aquatic ecological infrastructure on site, • The relationship with users downstream of the Eskom activities, • The management of aquatic ecological infrastructure over the transmission network
and • Eskom-owned mines and purchase agreements.
Eskom’s role as a resource user was examined from the point of view of the commitment to the UN CEO Water Mandate.
The public infrastructure providers (Government Departments, the CMA, Olifants River Forum, etc.) set the rules for operating in the catchment. Eskom’s role in this milieu was examined from the legal requirements point of view and their advocacy role.

ix
Eskom’s role with the public infrastructure has two branches. The first is their compliance with legislation and other rules and the second involves the use and maintenance of physical infrastructure such as water supply systems.
The arrows between the boxes indicate the interactions between the four boxes. The arrows at the top and bottom of the figure indicate socio-economic external influences over which Eskom has no control such as economic factors. The arrows coming into the sides indicate environmental influences over which Eskom has no control such as extreme weather events.
The framework was populated using the data from the case study on Matla power station.
Figure ES1: Possible areas of involvement for Eskom in the Matla Wetlands case study, as defined by the Anderies Framework
A series of modules as power point presentations were developed on the following topics:
1. What is a wetland 2. National policy 3. Eskom Project Life Cycle Model 4. Adaptive management 5. Sub-frameworks for the wetland management framework 6. Using the wetland management framework.
There is a read-me file which explains how the hyperlinking system works. It is important to read this before starting.
Each of these modules has slides that are hyperlinked to relevant documents.
Managers and engineers need only do modules 1, 2 and 3. Personnel responsible for environmental management should do modules 2 through 6.
Results
The report consists of seven chapters that cover the following aspects of wetland management on Eskom properties.

x
There is also a series of 6 power point presentations covering relevant topics related to wetland management. Each of these has hyperlinks into relevant documents so that the reader may get more detail on each of the topics addressed. This is accompanied by an Instructors manual which gives the methodology. The modules are designed in such a way that managers and engineers need only do Modules 1, 2 and 3 while environmental managers need to do modules 2 to 6. The README file explains how the system should be used and it is important that the person reads this before starting.
The PowerPoint presentations cover the following topics:
1. Wetlands, ecosystems and biodiversity. 2. National policy and legislation, application for water use license and Eskom-specific
policies. 3. The Eskom Project Life Cycle Model. 4. Adaptive management – the process of learning by doing. 5. Introducing the sub-frameworks on which the wetland management framework is
based. 6. An exercise in using the wetland management framework.
Chapter 2: Literature Review
The literature review (Chapter 2) addresses a broad sweep of issues around wetland management. The focus of this chapter has been on South African literature, with the international literature included where relevant. The review covers the current policy and legislation as it applies to wetlands and includes such issues as wetland inventory, wetland delineation and buffer zones. The ecological aspects covered include aspects such as the sustainability of ecological infrastructure, ecosystem services provided by wetlands. Carbon sequestration and pollution attenuation by wetlands have been covered in some detail. Indicators of wetland health and impacts on wetlands have been reviewed. Rehabilitation and offsetting are topical discussion points and these have been covered. The place of constructed wetlands in the overall management milieu has been addressed. Eskom has internal policies on aspects such as vegetation and water management on Eskom property and servitudes. Where these have been made available, they have also been covered.
Chapter 3: The Wetland Management Framework
The steps of the wetland management framework (WMF) have been developed to match the Eskom Project Life Cycle Model (PLCM). The PLCM is the standard approach used by Eskom in managing its projects. The WMF adds a further dimension to the PLCM in that it provides the means whereby protection of the surface water environment, in particular wetlands, may be integrated into the standard PLCM in a logical manner. This was done so that the WMF may be used at any stage of an Eskom project to identify and address the relevant wetland issues while a project is progressing. The WMF is based on a number of sub-frameworks covering the range of topics needed to address the diverse aspects of wetland management. The following aspects are addressed for each of the 78 steps of the WMF:
• The relevance of the step to the category of focus or impact of the step (legal, environmental, social responsibility and the role of Eskom in the wider catchment management).
• One or more core questions to guide the process to address each step.

xi
• The various corporate organizational elements which would be involved, for instance skills development systems, HR systems or data and information systems.
Chapter 4: Selected Case Studies to Test the Robustness of the wetland management Framework
Case study sites for testing of the WMF were selected on the criteria of the constructional (Kusile), operational (Matla and Kriel) and return-to-service (Grootvlei) phases of the PLCM. For each of these the level at which the steps of the WMF had been addressed was assessed. In each case, it was found that the legal issues were prioritised, but Kusile was the only Power Station (PS) that had addressed wetland management on the property. Following this, the steps of a wetland management plan for Matla PS were drawn up to guide the PS through the steps necessary to conform to the legal, environmental and corporate responsibility of Eskom on the site.
Chapter 5: The catchment perspective
Recognising that Eskom has a national footprint geographically and is a major user of water, the chapter addresses the responsibilities of Eskom (both Head Office and on site) concerning the management of environmental, social and institutional issues. The chapter is structured around two frameworks, that of Anderies et al. (2004) which assesses the robustness of a social ecological system (SES) and that of the Millennium Ecosystem assessment (2005) which defines the ecosystem services. Key references are provided for each category of responsibility to guide the activities identified. Finally, using the data and information from the Matla case study (Chapter 4), the Anderies framework has been populated at the desktop level using the quaternary catchments B11E and B11D as the wider SES. This illustrates the role of Eskom in the SES of the catchments in which Eskom is active.
Chapter 6: Future Research Needs
A number of sources were consulted during the identification of the future research needs. Some of the needs identified are Eskom-specific while others apply to other entities as well. Within the SES some are technical, some ecological, some economic, some related to policy and legislation and some related to community upliftment. The investigation of alternate technologies is also addressed.
Future research needs for the water / energy nexus
A total of 40 potential research areas have been identified for the WRC to consider. Some of these are directly relevant to Eskom. The following topics have been assessed as priority areas in a preliminary assessment. The full suite of research areas should, however, be considered before the final decisions are made.
• Technical Research o Soil carbon sequestration by wetlands and release of carbon when wetlands
are disturbed (paragraph: Soil carbon). o Water conservation and demand management (water use efficiency)
(paragraph: Water conservation and demand management). Various parts of the process use water at different rates, the selective catalytic reducing process and flue gas desulphurization may be identified as priority areas.

xii
o Integrated natural resource management. The possibility of the existing strategy being rolled out into the catchments where Eskom operates should be investigated (paragraph: Integrated natural resource management for the benefit of ecosystem services).
• Social/economic research o The benefits and costs of alternate technologies available to power
generation, water use and impact on quality, impact on the environment and impact on food production. The contribution of each to the carbon footprint should be considered (Benefits and costs to power generation, water use and food production).
o Ecosystem-based adaptation to climate change for Eskom-specific activities (The energy, agriculture and water nexus).
• Legal/policy research o Possible future changes in wetland or water policy and legislation
(Consideration of possible future changes in wetland or water policy and legislation).
Conclusions
As South Africa is a water-stressed country, it is necessary that every water user play their part in conserving the resource. As a major industrial water user, Eskom has an important role to play both in water conservation and in a leadership capacity.
The wetland management framework (WMF) has been structured to mesh with Eskom’s Project Life Cycle Model. In this way environmental managers are guided through the necessary activities for each phase of the PLCM. The WMF has been developed as a practical ‘how to’ guide for managing wetlands on Eskom’s property to ensure a consistent level of performance across the organisation.
Industry perspective
From the industry perspective the wetland management framework represents best practice. It is recommended that a phased approach be taken when implementing the WMF on properties that were developed before the current legislation was promulgated, beginning with issues of legal compliance. Legal compliance is an aspect that is becoming increasingly important.
Keywords
Wetland management, ecosystem services, compliance, catchment management, corporate environmental responsibility.
Future review
The wetland management framework should be regarded as a living document. As such, once it is in use it should be reviewed to assess how it may be refined to fulfil Eskom’s needs in a more focused way.
The legal landscape is still evolving. Changes in the policies, legislation and regulations affecting wetlands and water management should be anticipated and incorporated into the WMF as appropriate.
Return on investment
The return on investment may be considered in three ways. Firstly, the investment has resulted in the delivery of a wetland management framework which will empower

xiii
environmental managers to engage meaningfully in the planning and execution of activities within the PLCM. Secondly, if implemented as recommended, it has the potential to save Eskom from having to pay penalties for non-compliance to environmental and other requirements. Thirdly, the potential to harness ecological services to the benefit of Eskom through comprehensive wetland management, will contribute to the preservation of water quality and water availability.

xiv
ACKNOWLEDGEMENTS
The authors extend a special thanks to the project managers:
Ms Kaajial Durgapersad, Senior Environmental Advisor, Research, Testing and Development, Sustainability Division, Eskom
Mr Bonani Madikizela, Research Manager, Water Research Commission
We thank the following people who have given guidance and/or comment on the various products over the course of this project. Their comments have been very helpful.
Mr M Breedt Eskom Ms Michillay Brown Eskom Mr K Chetty Eskom Mr J Dini SANBI Ms Theresa Ferguson EON Consulting Ms M Joseph Eskom Ms M Kgole Eskom Ms M Kotze Eskom Mr M Michael Eskom Mr M Mitchell EON Consulting Ms G Mkhatahwa Eskom Mr R Mokobodi Eskom Ms L Moodley EON Consulting Mr S Naidoo Eskom Mr T Oosthuizen Eskom Ms F Radebe Eskom Ms D Ramaphosa Eskom Dr W Roets DWS Ms F Sono Eskom Ms F Tiba Eskom Mr Tefo Tshabidi Eskom
The authors extend their gratitude to the members of the WRC Review Group who attended meetings:
Ms A Burgher Prime Africa Consultants Mr C Cowden Ground Truth Mr J Dini SANBI Ms K Durgapersad Eskom Ms W Lutsch DEA Dr CJ Kleynhans DWS Mr B Madikizela WRC (Chairperson) Ms F Mbedzi DWS Mr M Michael Eskom Mr S Naidoo Eskom Ms M Wilkinson Sustento Development
We thank Ms L Liebenberg and Ms S Mitchell for their assistance in the preparation of the final document.
This research was funded jointly by Eskom Holdings and the Water Research Commission. We, the project team, express our gratitude for the opportunity to do the work.

xv
LIST OF ABBREVIATIONS
Abbreviation Definition
AMD Acid water from mine workings
ARC-ISCW Agricultural Research Council – Institute for Soil, Climate and Water
ARD Acid water from waste rock
BGIS Biodiversity GIS
CDM Clean development mechanism
CMA Catchment management area
CSI Corporate Social Investment
DEAT Department of Environmental Affairs and Tourism
DPSIR Driving forces, Pressures, States, Impacts, Responses Framework
DWA(F) Department of Water Affairs (and Forestry) (up to 2014)
DWS Department of Water and Sanitation (from 2014)
EIA Environmental Impact Assessment
EIS Ecological importance and sensitivity
EMP Environmental management plan
EMS Environmental management system
FGD Flue Gas Desulfurization
GHG Green House Gas
HR Human Resources
IBT Inter basin transfer
IWRM Integrated water resource management
KAP Knowledge, Attitude, Practice
MA (MEA) Millennium ecosystem assessment
NFEPA National Freshwater Ecosystem Priority Area
NWA National Water Act (Act 36 of 1998)
PAH Polycyclic aromatic hydrocarbon
PCBs Poly Chlorinated Biphenyls
PCLM Eskom Project Life-Cycle Model
PE Primary Energy
PES Present ecological state
PLCM Project life cycle model
POP Persistent organic pollutant
PS Power station
RoD Record of decision
xvi
Abbreviation Definition
RQOs Resource Quality Objectives
RWQO Resource Water Quality Objectives
SACNASP The South African Council for Natural Scientific Professions
SAM Strategic Adaptive Management
SANBI South African National Biodiversity Institute
SES Socio-ecological system
TEEB The Economics of Ecosystems and Biodiversity
UNFCCC United Nations Framework Convention on Climate Change
URS User Requirement Specification
WfWet Working for Wetlands
WMA Water management area
WMF Wetland management framework
WMP Water management plan
WRC Water Research Commission
WRCS Water resource classification system
WRM Water resource management
WSLG Water Sector Leadership Group
WUA Water User Association
WUL Water use licence

xvii
GLOSSARY OF TERMS
Term Definition with a brief description
Ecological infrastructure
Ecological infrastructure refers to naturally functioning ecosystems that deliver valuable services to people, such as fresh water, climate regulation, soil formation and disaster risk reduction. It is the nature-based equivalent of built or hard infrastructure, and is just as important for providing services and underpinning socio-economic development.
Ecosystem services
The aspects of ecosystems (including ecosystem organisation or structure as well as process and/or functions) that are utilized by people to produce human well-being (Millennium Ecosystem Assessment, 2005). Ecosystem services are the benefits provided to the social-ecological system.
Integrity
Integrity is defined as the ability of a system to support “a balanced integrated, adaptive community of organisms having a species composition, diversity, and functional organization comparable to the natural habitat of the region” (Karr and Dudley, 1981; U.S. EPA, 2002a; Fennessy et al., 11 – 2007)
Resilience The concept of resilience measures the amount of change or disruption that is required to transform the maintenance of a system from one set of mutually reinforcing processes and structures to a different set of processes and structures (Anderies et al., 2004).
Resource The Resource is defined in terms of the ecosystem services it delivers. This definition integrates the ecosystem services from which the Social-Ecological System derives benefits with the health of the ecological infrastructure which provides these benefits.
Robustness The concept of robustness is well developed in engineering, where it refers to the maintenance of system performance either when subjected to external, unpredictable perturbations, or when there is uncertainty about the values of internal design parameters (Anderies et al., 2004).
Social-ecological system (taken as equivalent to socio-ecological system)
A social-ecological system is a linked system of people and nature. (Roux et al., 2009); or, a socio-ecological system can be defined as people, their natural and human-made resources and the relationships among them (Anderies et al. 2004).

xviii

xix
TABLE OF CONTENTS
1 Introduction .............................................................................................................. 1
1.1 Background ............................................................................................. 1
1.2 Layout of the Report ................................................................................ 7
2 Literature Review .................................................................................................. 10
2.1 Literature Review .................................................................................. 10
3 The Wetland Management Framework ................................................................ 94
3.1 The Wetland Mangement Framework: Introduction .............................. 94
3.2 Using the Wmf ..................................................................................... 135
3.3 Impact Inventory (Pollution, Altering of Hydrological Regimes,
Disturbances, Invasive Species, Erosion and Siltation) ....................... 138
3.4 Impact Assessment ............................................................................. 140
3.5 Wetland Health Assessment ............................................................... 142
3.6 Vegetation ........................................................................................... 143
3.7 Prioritisation of Wetlands for Rehabilitation and Intervention .............. 145
3.8 Rehabilitation of Impacts ..................................................................... 146
3.9 Biodiversity Corridors .......................................................................... 147
3.10 Buffer Zones ........................................................................................ 147
3.11 Indicators and Early Warning Systems ................................................ 148
3.12 Vegetation Management ..................................................................... 148
3.13 Ecosystem Services ............................................................................ 149
3.14 Wetland Offsetting ............................................................................... 150
3.15 Monitoring ............................................................................................ 151
3.16 Ecosystem Services for Communities ................................................. 152
3.17 Pollution Attenuation for Eskom and their Mines with Relevance to
RQOS of Feeder Catchments .............................................................. 156
3.18 Carbon Storage In Wetlands ............................................................... 164
4 Selected Case Studies to Test the Robustness of the Wetland
management Framework .................................................................................... 169
4.1 Pilot Site Selection .............................................................................. 169
4.2 Pilot Site Situation Analysis ................................................................. 173
4.3 Wetland Management Plan for Matla Power Station (PS) ................... 179
4.4 Analysis of Wetlands Associated with Matla PS with Reference to
its Catchment ....................................................................................... 180
4.5 Wetland Ecosystem Services .............................................................. 185
4.6 Status of Wetland Management at Matla PS....................................... 186
4.7 Pilot Phase: Conclusion and Recommendations ................................. 198
5 The Catchment Perspective ............................................................................... 199
5.1 The Framework ................................................................................... 199
5.2 The Resource – Defining Eskom’s Interface ....................................... 206
5.3 Eskom as a Resource User ................................................................. 224
5.4 Eskom and the Infrastructure Providers .............................................. 230
5.5 Eskom and the Public Infrastructure.................................................... 231

xx
5.6 Using the Frameworks......................................................................... 236
5.7 Case Study: Populating the Anderies Framework for Matla PS
and Eskom ........................................................................................... 238
5.8 Conclusions ......................................................................................... 246
6 Future Research Needs Within the Water-Energy Nexus with
recommendations for Further Research Within the Green Economy
Context, Including Impacts of and Adaptation to Climate Change .................... 248
6.1 Future Research .................................................................................. 248
6.2 Identification of Future Research Needs ............................................. 251
6.3 On Eskom Property ............................................................................. 253
6.4 Research Needs in the Catchments Where Eskom is Active .............. 259
6.5 In the Social Ecological System .......................................................... 261
6.6 Preliminary Assessment of Research Priorities ................................... 266
7 Conclusion ........................................................................................................... 267
8 References .......................................................................................................... 269 APPENDIX ..................................................................................................................276

xxi
LIST OF FIGURES
Figure 1: Illustrating the water stress experienced by countries globally ................................ 2
Figure 2: Map of Eskom’s power generation and main distribution infrastructure. Kusile is not on this map .................................................................................................................. 4
Figure 3: The inter-water management area transfers in the north eastern part of South Africa (NWRS 1, 2004: p 17) ....................................................................................... 5
Figure 4: A Conceptual Framework for the Wise Use of Wetlands and the maintenance of their ecological character, and the application of the guidelines in the Ramsar ‘toolkit’ of Wise Use Handbooks 4th edition (vol. 1; 2010) .................................................... 12
Figure 5: An example of the comparative qualitative assessment of the carbon storage capacity across wetland types derived from the DFN decision support matrix, comparing the relative carbon store size per unit area across wetland types. .......... 31
Figure 6: The carbon stock in both plants and soils for different biomes (Davidson, 2010).. 36
Figure 7: Wetlands on and adjacent to (A) the Grootvlei PS property .................................. 40
Figure 8: Wetlands on and adjacent to the Matla and Kriel PS property .............................. 40
Figure 9: Planning and design for AMD long-term solutions (DWA, 2013) ........................... 44
Figure 10: Overall structure of the Wetland Livelihood Value Index. Numbers in circles correspond to steps in the assessment process after step 1 (defining objectives and level of assessment (Turpie, 2010b)) ........................................................................ 47
Figure 11: The DPSIR assessment framework (from Kristensen, 2004) .............................. 48
Figure 12: The generic design of a monitoring programme as given by Ramsar Convention (Wise Use Handbook 18, 2010). This is not prescriptive and should be adapted as required ..................................................................................................................... 51
Figure 13: A framework for strategic adaptive management showing the 5 key steps (from Biggs and Rogers, 2003, adapted by Pollard and du Toit, 2007).............................. 53
Figure 14: Flowchart of key steps in the environmental impact assessment procedure (from Ramsar Wise Use of Wetlands Vol. 16) .................................................................... 70
Figure 15: Spatial scales of prioritisation down to the catchment and sub-catchment level . 72
Figure 16: Wetland prioritisation steps that are required at different spatial scales .............. 73
Figure 17: Biodiversity Priority Areas (i), Water Management Areas, and Tertiary catchments (GIS data available on NBI database) ....................................................................... 78
Figure 18: Water stressed catchments (v) Water Management Areas (WMAs) and Tertiary Catchments (Data available on DEA ENPAT (Environmental Potential Atlas) database and DWA Water Situation Assessment Model) ......................................... 78
Figure 19: Working for Water and Working for Wetland Project locations (xi) Water Management Areas, and Tertiary catchments (Data available on the Working for Water (WfW) database) ............................................................................................ 79
Figure 20: Possible relationships that might be expected between functional effectiveness scores (i.e. the provision of wetland ecosystem services, as assessed using WET-EcoServices) and wetland impact scores (as assessed using WET-Health) (From Ellery et al., 2010) ..................................................................................................... 83
Figure 21: The mitigation hierarchy (SANBI and DWS, 2014) .............................................. 85

xxii
Figure 22: Overview of Wetland Offset Framework .............................................................. 88
Figure 23: An overall adaptive management framework for the management of open areas by Mondi (Kotze, 2004) ............................................................................................. 95
Figure 24: The different organisational systems that characterise an organisation ............ 101
Figure 25: How to consult the WMF .................................................................................... 135
Figure 26: A Framework for SAM showing 5 key steps (from Biggs & Rogers 2003, adapted by Pollard & du Toit, 2007). ..................................................................................... 151
Figure 27: The location of the four sites selected for the pilot study. .................................. 172
Figure 28: The primary and quaternary catchments associated with the 4 power stations selected for the pilot study ...................................................................................... 173
Figure 29: An overview of the NFEPA wetlands associated with the Matla Power Station area (SANBI, 2012) ................................................................................................. 179
Figure 30: Images associated with Matla PS with reference to the National Wetland Inventory (SANBI, 2013) (Figure 30A: Wetlands on the Matla Power Station property with the NFEPA overlay and Figure 30B: Wetlands on the Matla Power Station property without the NFEPA overlay) ...................................................................... 180
Figure 31: Level of threat to which various wetlands are exposed in South Africa (Nel and Driver, 2011). CR = critically endangered; EN = endangered; VU = vulnerable; LT = least threatened. ..................................................................................................... 185
Figure 32: A conceptual overview of the approach to the WMP for Matla PS .................... 187
Figure 33: Step by step development of generic wetland management plan for Matla PS (Starting at the bottom and being influenced by the WMF from the top) ................. 188
Figure 34: A Framework illustrating a social-ecological system as conceptualised by Anderies et al. (2004). ............................................................................................. 200
Figure 35: The relationship between ecosystem services and well-being as conceptualised in the Millennium Ecosystem Assessment (from MA, 2005:vi) ................................... 205
Figure 36: The colour coded elements of the SES for ease of reference ........................... 206
Figure 37: An overview of the steps involved in using the Framework ............................... 237
Figure 38: The Anderies Framework .................................................................................. 238
Figure 39: The Millennium Ecosystem Assessment Framework ........................................ 238
Figure 40: The primary and quaternary catchment associated with Matla PS and the neighbouring power stations. .................................................................................. 239
Figure 41: Images associated with Matla PS with reference to the National Wetland Inventory (SANBI, 2013) ......................................................................................... 240
Figure 42: A comparison of relative wetland surface area between the Matla PS property and the SES (Quaternary catchments B11D and B11E)................................................ 242
Figure 43: Possible areas of involvement for Eskom in the Matla Wetlands case study, as defined by the Anderies Framework. ...................................................................... 243
Figure 44: Pathways and milestones for the period 2009 to 2015 related to water (Eskom, 2009b) ..................................................................................................................... 276
Figure 45: Pathways and milestones for the period 2016 to 2030 related to water (Eskom, 2009b) ..................................................................................................................... 277
xxiii
LIST OF TABLES Table 1: A structured framework for planning a wetland inventory ....................................... 20
Table 2: Wetlands functions, related effects of functions, and corresponding societal values (Lechine et al., 1997 as adapted from NRC 1995) .................................................... 25
Table 3: The average values (in Int. $/ha y) of ecosystem services per biome (extracted from de Groot et al., 2012). ............................................................................................... 28
Table 4: The average values (in Int.$/ha/yr) of ecosystem services for inland wetlands, showing the contributions of individual services to the total value (extracted from de Groot et al., 2012). .................................................................................................... 29
Table 5: Results of the comparative qualitative assessment for all types of wetlands (adapted from DFN (2010)) ....................................................................................... 37
Table 6: Pollution attenuation processes to improve water quality (DWA, 2000) ................. 46
Table 7: Effectiveness indicators for wetland health (Ramsar Vol. 9, 2010) ......................... 50
Table 8: Impact scores and Present State category describing the integrity of wetlands. .... 55
Table 9: Guideline to assess the magnitude of impacts on wetland integrity ....................... 56
Table 10: Different land use types and activities that may affect the inflow quantities to the HGM unit from the upstream catchment and the magnitude of their collective effects .................................................................................................................................. 57
Table 11: Factors potentially contributing to an increase or decrease in the flood peak magnitude and/or frequency received by the HGM unit ............................................ 59
Table 12: Typical changes in water distribution and retention patterns within an HGM unit as a result of obstructions .............................................................................................. 60
Table 13: Trajectory class, change score and the symbol used to evaluate the Trajectory of Change to the geomorphology of each HGM unit ..................................................... 63
Table 14: Description of common disturbance classes in South African wetlands ............... 64
Table 15: A preliminary framework, based on core principles, for assessing the integrity of the wetland as a whole. Some potential indicators are listed. These principles are considered sufficiently robust for use at the micro-catchment scale (from Pollard et al., 2009). .................................................................................................................. 68
Table 16: Examples of wetland prioritisation ........................................................................ 75
Table 17: Scores for the potential suitability of wetland sites for rehabilitation ..................... 76
Table 18: Criteria used for Tertiary level catchment prioritisation (national and provincial scale) ......................................................................................................................... 77
Table 19: WET-EcoServices ecological services and benefits ............................................. 80
Table 20: Wetland management framework approach and symbols used to indicate the category of focus or impact ..................................................................................... 100
Table 21: The application of the wetland management framework (WMF) in the context of the PLCM. ............................................................................................................... 103
Table 22: List of scientific and best practices included in the WMF with reference to the Category of Impact/Focus ....................................................................................... 128

xxiv
Table 23: Calculation of unmitigated ratings ....................................................................... 162
Table 24: Recommended site selection options ................................................................. 171
Table 25: Summary of findings of the site visits .................................................................. 174
Table 26: Summary of findings of the site visits .................................................................. 178
Table 27: Surface area associated with Matla property and the two associated quaternary catchments .............................................................................................................. 181
Table 28: Surface area of wetlands in the total catchment ................................................. 181
Table 29: Surface area of wetlands within the Matla PS boundaries .................................. 182
Table 30: Overview of the average wetland situation in South Africa ................................. 182
Table 31: Measures that are to be taken to protect the Matla wetlands ............................. 184
Table 32: Findings of the Matla PS site visit with reference to critical elements of the WMF ................................................................................................................................ 186
Table 33: The WMP for Matla PS ....................................................................................... 189
Table 34: The entities involved in social ecological systems (from Anderies et al., 2004) .. 201
Table 35: The links between the entities of a social-ecological system (from Anderies et al., 2004) ....................................................................................................................... 201
Table 36: Eskom responsibilities for planning sustainable management of the water resource upstream of the power station .................................................................. 207
Table 37: Eskom responsibilities for planning sustainable management of the water resource on the power station site .......................................................................... 210
Table 38: Eskom responsibilities for planning sustainable management of the water resource downstream of the power station ............................................................. 218
Table 39: Eskom responsibilities for planning sustainable management of the water resource on transmission servitudes ....................................................................... 220
Table 40: Eskom responsibilities for planning sustainable management of the water resource in Eskom owned or managed mines ........................................................ 222
Table 41: The CEO Water Mandate, with the focus on the goals for the period 2014-2015 ................................................................................................................................ 224
Table 42: The infrastructure providers ............................................................................... 230
Table 43: National Policy and legislation concerning the management of the water resource, with a focus on wetlands. ........................................................................................ 231
Table 44: Respective sizes of associated quaternary catchment and Matla PS................. 240
Table 45: Surface area of wetlands in the SES and on the Matla property ........................ 241
Table 46: Attendees of the site selection meeting on 24 May 2013 ................................... 278
Table 47: Attendees of the site selection meeting on 26 July 2013 .................................... 279

1
1 INTRODUCTION
1.1 BACKGROUND
Internationally, the water supply crisis is ranked amongst the top five global risks both in terms of its likelihood to happen as well as its impact by the World Economic Forum 2013 report. Global freshwater demand is projected to exceed current supply by 40% by 2030. This will increase the risks on food, energy and industrial and human security globally. The projected shortage of water has a number of contributing factors which are listed below:
• Increasing water demand. Population growth and economic development contribute to a substantial increase in water demand.
• Water scarcity and unsustainable supply. Water is already over-allocated in many regions of the world and approximately 2.4 billion people (circa 1/3 of the world population) live in water stressed countries.
• Declining water quality. Poor water quality is an acute problem around the world with the main contributors globally being agricultural runoff, industrial wastewater and poorly treated human waste. The two major causes in South Africa are poorly treated municipal (human and industrial waste) and acid mine drainage.
• Unmet environmental, social and economic needs. While the water may be available to meet these needs, this may in some cases be a water resource management issue.
• Changing expectations. During the 20th century, the global population increased 4-fold while the water demand increased 9-fold.
• Climate change. Projections of climate change indicate that, firstly, in certain areas of the world precipitation will decrease while in others it will increase. Secondly, the nature of precipitation events will change, becoming less frequent and more violent. In addition, the projected increase in heat wave events will increase evaporation from rivers and storage reservoirs (UN CEO Water Mandate; World Economic Forum).
Where does South Africa fit into this picture? To quote the WWF (2014):
South Africa is a chronically water stressed country with huge economic development
pressures and social upliftment challenges.
Water availability is one of the most decisive factors that will affect the economic,
social and environmental well-being of South Africa over the next decade, and its
supply is already precariously limited.
In the past, South Africa has invested heavily in water infrastructure and this is, in
part, why the country has enjoyed a false sense of water security. However, the
country is fast approaching full utilisation of available surface water yields, and
running out of suitable sites for new dams.
Water supply issues cannot be solved by simply building more dams or creating more
infrastructure, but rely heavily on rehabilitating, maintaining and conserving the
natural areas which form the critical catchments and “water factories” for the country.
Furthermore, climate change models also predict significant changes to both rainfall
and temperature in southern Africa, which will affect water storage negatively.

2
Figure 1 provides an overview of the water stress experienced globally. South Africa is currently in the region of High Stress.
Figure 1: Illustrating the water stress experienced by countries globally (http://www.wri.org/sites/default/files/uploads/water_stress_by_country.png)
Water stress is a more inclusive term than water scarcity, and is defined by the Pacific Institute as follows:
“Water stress” refers to the ability, or lack thereof, to meet human and ecological
demand for water. Compared to scarcity, “water stress” is a more inclusive and
broader concept. It considers several physical aspects related to water resources,
including water scarcity, but also water quality, environmental flows, and the
accessibility of water (http://pacinst.org/water-definitions/ ).
Eskom is one of the biggest industrial water users in the South Africa accounting for about 2% of the national water requirement in the year 2000 (NWRS, 2004). Eskom supplies over 95% of South Africa’s electricity and generates 45% of the electricity used on the African continent (Eskom 2009a). In addition to this, the electricity distribution grid covers the entire country. Eskom also owns and manages several coalmines. Eskom generates the bulk of electricity used in South Africa and electricity is fundamental to the functioning of modern society. Much of the country’s economic activity, as well as its social stability, depend on there being an efficient and reliable supply of electrical power. Thus, Eskom’s water use is considered to be of strategic importance by the Department of Water and Sanitation. Water use designated as being of strategic importance will, however, be subject to the same efficiency criteria and water demand management requirements as is applied to other uses (NWRS, 2004).
United Nations CEO Water Mandate
Water poses one of the greatest sustainability challenges of the 21st Century. Water scarcity and pollution, among many other issues, threaten our ability to grow strong and stable economies, meet basic human needs, and protect healthy ecosystems (and the services they provide), while also posing severe human health problems. Business organizations are greatly affected by – and also often contribute to – these important issues.

3
Because of this, they are increasingly seeking more information and trying to understand how to address these challenges.
The UN CEO Water Mandate is a part of the UN Global Compact. The UN Global Compact ‘asks companies to embrace universal principles and to partner with the United Nations. It has grown to become a critical platform for the UN to engage effectively with enlightened global business.’ Launched in July 2007 by the UN Secretary-General, the UN CEO Water Mandate is a unique public-private initiative designed to assist companies in the development, implementation, and disclosure of water sustainability policies and practices (UN CEO Water Mandate).
The UN CEO Water Mandate is, thus, aimed at mobilising a critical mass of business leaders to embrace responsible water stewardship. Worldwide there are currently 123 companies that have signed up to embrace the principles of the mandate, with seven of these being South African companies (UN CEO Water Mandate, 2014). As a signatory to the UN CEO Water Mandate, Eskom actively encourages its suppliers and other role players to improve their water conservation, quality monitoring, wastewater treatment and recycling practices. Whilst some of their activities generate pollution, Eskom requires clean water for its own processes and also recognizes the value of the ecosystem goods and services generated by healthy ecosystems and the benefits that society derives from these. To this end, Eskom has developed its water management policy which addresses Eskom’s contribution to the national long-term sustainability of the water resource and outlines how this is to be achieved. Eskom is committed to the maintenance of water resources within the catchments within which it operates, as it requires good quality water for its boiler and other operations. The national economy relies on the power generated by Eskom, but equally it is essential to maintain the natural water infrastructure in good condition so that it will continue to deliver the benefits on which the socio-economy depends. The utility is thus committed to ensuring that the ecosystems and wetlands in particular, under their jurisdiction are maintained in a healthy ecological state.
South Africa’s water scarcity creates the imperative for increasing the efficiency of water use. Eskom is proactive in this and, in addition to being signatory to the UN CEO Water Mandate, has formed water management task teams to improve the efficiency of water usage. The current target for water use, utility-wide, is 1.32 ℓ kWh-1. The target set for 2017 is 1.20 ℓ kWh-1 (Divisional Report Key indicators, 2012). This target puts pressure on Eskom Holdings to implement effective water conservation and water demand management across all their activities. However, dry cooling power stations use considerably less water, with Matimba Power Station, the largest dry-cooled power station in the world, using 0.1 ℓ kWh-1. Medupi PS and Kusile PS will both use dry-cooling technology.
Eskom therefore saw the need to develop a generic framework for a conservation plan that may be implemented, with appropriate customization, on all its properties and contractually-bound coal suppliers (Please refer to the Terms of Reference in the block below). The Framework needs to be integrated into measures aimed at the management of Eskom’s strategic and operational activities. The overall framework developed consists of several sub-frameworks, each designed to address specific aspects of Eskom’s activities. For instance, the Conservation Plan Framework promotes the conservation of the environment together with the ecosystem services that the environment provides and the sustainable environmental planning framework within a catchment perspective has been developed with this in mind.
Eskom’s Footprint
Geographically, Eskom has a national footprint although the coal-fired power stations are largely concentrated in the upper Olifants and upper Vaal basins in Mpumalanga (Figure 2). The water footprint, however, extends beyond the upper Olifants and Vaal basins as both

4
basins support economic activities which require more water than is available in the basins. The extra water is supplied by inter-basin transfers (IBT) from surrounding basins (
Figure 3) which effectively extends the geographical footprint to include the donor river basins. This has been taken into account in assessing the sustainable environmental planning as Eskom requires the assurance of supply of water (both quality and quantity) that is provided by these IBTs.
It was noted that, at the start of this project, Eskom had two other initiatives on wetlands. These were the booklet entitled ‘Wetland classification and Risk Assessment Index’ (Oberholster et al., 2014) and the development of a GIS supported wetland inventory of Eskom properties.
Figure 2: Map of Eskom’s power generation and main distribution infrastructure. Kusile is not on this map (http://www.eskom.co.za/c/article/730/map-of-eskom-power-stations/

5
Figure 3: The inter-water management area transfers in the north eastern part of South Africa (NWRS 1, 2004: p 17)
In addition to the power generation infrastructure itself, Eskom has approximately 30 000 km of power line servitudes together with a number of substations associated with the distribution network.
Eskom’s Water Strategy
As may be seen, Eskom’s footprint is nation-wide. Taking cognisance of the fact that Eskom is a strategic user of water and that the utility accounts for circa 2-3% of South Africa’s water use (Eskom Water Policy) with a footprint extending across the country, Eskom has engaged with the Department of Water and Sanitation National Water Resource Planning Directorate to develop a long-term water strategy. This strategy is based on the following principles:
• Social progress which recognizes the needs of everyone;
• Effective protection of the environment;
• Prudent use of natural resources
• Supporting an environment of high, stable economic growth and employment.
The strategy includes water demand management and reuse of effluents, and the key elements are as follows:
• Meet the water requirements for new power stations
• Meet the water requirements for existing power stations
• Develop long-term water plans to ensure security of water supply
• Develop and implement a water conservation and water demand management strategy
• Meet the water quality objectives of the various catchments
• Efficiently manage water cost increases into the future
• Actively influence policy, strategy, planning, legislative and regulatory issues related to water
• Engage stakeholders on water challenges and solutions.
(http://financialresults.co.za/2011/eskom_ar2011/cd_grp_commercial04.php).

6
The objectives identified in this strategy are to:
1. Ensure long term water scenario planning 2. Meet the water requirements for new and existing power stations 3. Meet the water quality objectives of the various catchments 4. Manage water cost increases into the future 5. Influence policy, strategy, legislation and regulatory environment 6. Regular communication and intervention with respective government departments and 7. other stakeholders by means of a dedicated advocacy and stakeholder engagement plan 8. Implementing a water conservation water demand management strategy 9. Water management assurance, advisory and supporting role to projects, power stations
and coalmines.
In order to achieve the key elements and objectives of the water strategy, Eskom has developed the Vision 2030 which outlines the pathway and milestones to be followed between 2009 and 2030 which was presented to the Water Sector Leadership Group during 2009. The pathway and milestones are illustrated in Appendix 1 (Figures 4 and 5).
The milestones and targets relate mostly to compliance, partnerships, technology and management interventions which are all mostly focused on water use efficiencies. The improvement of water use efficiency will have an overall positive effect on the national water budget, including the environment.
ISO 14000
The ISO 14000 family of standards provide guidance towards sustainable environmental management and the standards together with the monitoring programmes, etc. developed under this framework should be applied to Eskom’s activities. International standards are becoming increasingly important for organisations working together to achieve proactive environmental management, risk management, sound corporate governance and sound operational and financial practices. ISO 14000 also provides a yardstick which may be used by governments and regulatory bodies to assess and ensure alignment nationally and internationally. ISO 14000, widely used in Europe for management of the environment including wetlands, is gaining acceptance in the USA because of the standards that it offers in fields such as environmental auditing and environmental performance evaluation. In addition, it offers guidelines for sustainable development, pollution prevention and assurance of compliance. While ISO 14000 certification is not compulsory, it does offer a measure of competence in the sustainable management of the environment (The Wendel Insider, Fall 2003). South Africa ranks 72 out of 178 Countries in the Environmental Performance Index (http://epi.yale.edu/epi/country-rankings) and the focused implementation of ISO 14000 will help to improve this ranking.
Legislation
Eskom strives to comply with the legislative landscape within which it operates. The framework for wetland management needed to address this as a matter of priority. To this end the policies on water management and the management of alien and invasive vegetation on Eskom holdings complies with the requirements of national legislation. The framework underpins this by providing methods which will enable the improved management of wetlands and associated ecosystems on their property.

7
Water-Food-Energy Nexus
In 1911, John Muir observed, ‘When we try to pick out anything by itself in nature, we find it hitched to everything else in the Universe.’
A century later, a gathering of the World Economic Forum discovered the same phenomenon. Four hundred top decision-makers listed the myriad looming threats to global stability, including famine, terrorism, inequality, disease, poverty, and climate change. Yet when we tried to address each diverse force, we found them all attached to one universal security risk: fresh water. (Margaret Catley-Carlson, Patron, Global Water Partnership, 2008-2010, Chair of World Economic Forum Global Agenda Council on Water Security) (quoted from Williams and Pittock, undated).
Eskom has taken cognisance of this interconnectedness through the integration of water and environmental management into the core business of electricity generation. The need for an adequate supply of good quality water is important for Eskom’s on-going electricity generation capacity. The supply of sufficient water of good quality is the role of regulating and provisioning ecosystem services and these services depend on.
Kusile PS is the new build power station on the Highveld in western Mpumalanga, an area rich in wetlands. Concern for the impact of construction activities on, and the delivery of ecosystem services in, the wider catchment as led to the development of a wetland management strategy for Eskom’s Kusile property (Harris et al., 2013). The wetland management strategy covers such aspects as the impact of turbidity on the functioning of wetland systems downstream of the development and also takes cognisance of Eskom’s land and biodiversity policy which requires that measures are in place to limit impacts of infrastructure and other land uses and also comply with all legislation at all stages of the project life cycle.
1.2 LAYOUT OF THE REPORT
The report consists of seven chapters that cover the following aspects of wetland management on Eskom properties.
There is also a series of 6 power point presentations covering relevant topics related to wetland management. Each of these has hyperlinks into relevant documents so that the reader may get more detail on each of the topics addressed. This is accompanied by an Instructors manual which gives the methodology. The modules are designed in such a way that managers and engineers need only do Modules 1, 2 and 3 while environmental managers need to do modules 2 to 6. The README file explains how the system should be used and it is important that the person reads this before starting.
The PowerPoint presentations cover the following topics:
1. Wetlands, ecosystems and biodiversity 2. National policy and legislation, application for water use license and Eskom-specific
policies. 3. The Eskom Project Life Cycle Model. 4. Adaptive management – the process of learning by doing. 5. Introducing the sub-frameworks on which the wetland management framework is based. 6. An exercise in using the wetland management framework.
Chapter 2: Literature Review
The literature review (Chapter 2) addresses a broad sweep of issues around wetland management. The focus of this chapter has been on South African literature, with the international literature included where relevant. The review covers the current policy and legislation as it applies to wetlands and includes such issues as wetland inventory, wetland

8
delineation and buffer zones. The ecological aspects covered include aspects such as the sustainability of ecological infrastructure, ecosystem services provided by wetlands. Carbon sequestration and pollution attenuation by wetlands have been covered in some detail. Indicators of wetland health and impacts on wetlands have been reviewed. Rehabilitation and offsetting are topical discussion points and these have been covered. The place of constructed wetlands in the overall management milieu has been addressed. Eskom has internal policies on aspects such as vegetation and water management on Eskom property and servitudes. Where these have been made available, they have also been covered.
Chapter 3: The Wetland Management Framework
The steps of the wetland management framework (WMF) have been developed to match the Eskom Project Life Cycle Model (PLCM). The PLCM is the standard approach used by Eskom in managing its projects. The WMF adds a further dimension to the PLCM in that it provides the means whereby protection of the surface water environment, in particular wetlands, may be integrated into the standard PLCM in a logical manner. This was done so that the WMF may be used at any stage of an Eskom project to identify and address the relevant wetland issues while a project is progressing. The WMF is based on a number of sub-frameworks covering the range of topics needed to address the diverse aspects of wetland management. The following aspects are addressed for each of the 78 steps of the WMF:
• The relevance of the step to the category of focus or impact of the step (legal, environmental, social responsibility and the role of Eskom in the wider catchment management).
• One or more core questions to guide the process to address each step.
• The various corporate organizational elements which would be involved, for instance skills development systems, HR systems or data and information systems.
Chapter 4: Selected Case Studies to Test the Robustness of the Environmental Conservation Framework
Case study sites the testing of the WMF were selected on the criteria of the constructional (Kusile), operational (Matla and Kriel) and return-to-service (Grootvlei) phases of the PLCM. For each of these the level at which the steps of the WMF had been addressed was assessed. In each case, it was found that the legal issues were prioritised, but Kusile was the only PS that had addressed wetland management on the property. Following this, the steps of a wetland management plan for Matla PS were drawn up to guide the PS through the steps necessary to conform to the legal, environmental and corporate responsibility of Eskom on the site.
Chapter 5: The Catchment Perspective
Recognising the Eskom has a national footprint geographically and is a major user of water, the chapter addresses the responsibilities of Eskom (both Head Office and on site) concerning the management of environmental, social and institutional issues. The chapter is structured around two frameworks, that of Anderies et al. (2004) which assesses the robustness of a social ecological system (SES) and that of the Millennium Ecosystem assessment (2005) which defines the ecosystem services. Key references are provided for each category of responsibility to guide the activities identified. Finally, using the data and information from the Matla case study (Chapter 4), the Anderies framework has been populated at the desktop level using the quaternary catchments B11E and B11D as the wider SES. This illustrates the role of Eskom in the SES of the catchments in which Eskom is active.

9
Chapter 6: Future Research Needs
A number of sources were consulted during the identification of the future research needs. Some of the needs identified are Eskom-specific while others apply to other entities as well. Within the SES some are technical, some ecological, some economic, some related to policy and legislation and some related to community upliftment. The investigation of alternate technologies is also addressed.

10
2 LITERATURE REVIEW
2.1 LITERATURE REVIEW
Water management
Professor Schulze of the University of KwaZulu-Natal (pers. comm.) observes that variability and uncertainty are two factors that Australia and South Africa have in common. The co-efficient of variability of the climate, rainfall in particular, of these countries is amongst the world’s highest, and the variability of runoff varies by two to five times that of the rainfall. He notes that it is the temperature or precipitation events, not the averages, which have the impact.
This variability makes it imperative that South Africa manages its water resource carefully. The focus has been largely on managing the surface water to provide the assurance of supply necessary to support growth in a diverse economy and this has been an effective strategy. Surface water has been impounded where it occurs and, where necessary, infrastructure has been developed to move water to where it is required by means of inter-basin transfers (NWRS 1, 2004).
The present situation is that most of the potential dam sites have been used so few opportunities remain for obtaining more water from the surface environment. But the need for water to support growth and development remains, and as noted by the World Economic Forum (2014) the increase in the demand for water is strongly influenced by the changing expectations of people, with the 4-fold increase in population over the 20th century leading to a 9-fold increase in water consumption. While the NWRS 1 (2004) provides the foundation of water management, the second National Water Resource Strategy (NWRS 2, 2012) has adopted a different approach to management of the water resource, focusing on water security while taking cognisance of the high coefficient of variability of rainfall. It also takes note of the fact that the deterioration of water quality from eutrophication, acid mine drainage, salinization and microbial contamination need to be addressed. The vision guiding the NWRS 2 is aimed at serving the social-ecological system in all its complexity. To this end a number of core strategies will be followed in the management of the water resource to support the social-ecological system.
The core strategies (NWRS 2, 2013) are:
• Implementation of Equity Policy;
• Putting water at the centre of integrated development planning and decision-making;
• Ensuring water for equitable growth and development;
• Contributing to a just and equitable South Africa;
• Prioritising and ensuring the implementation of water conservation and demand management;
• Optimizing and stretching of our available water resources (groundwater, water re-use, desalination (including seawater), water systems optimization and rainwater harvesting);
• Committing to the protection of our water resources and ecosystems;
• Achieving effective and smarter water governance;
• Embedding sustainable business principles and practices in water resources and systems management;
• Implementing a water sector investment framework for infrastructure, human resource capacity and institutions;
• Engaging the private and water use sectors.

11
Eskom, as noted in Chapter 1, has engaged with the DWS in aligning its water strategy with the national interest. Flowing from this the Eskom Water Management Policy (2013) provides a framework through which Eskom’s business should interact with the water resource throughout its value chain. As a strategic water user and signatory to the UN Global Compact – the CEO Water Mandate, Eskom commits to:
• Being proactive in addressing water sustainability issues within Eskom’s activities
• Driving water sustainability within the wider social-ecological system
• Encourage companies throughout its value chain to subscribe to water sustainability practices
• Participate in multi-stakeholder forums on water sustainability issues
• Be transparent when dealing with water sustainability issues when dealing with DWS and other stakeholders
• Raise awareness of water sustainability issues across its area of operation
• Ensure that water forms part of sustainability indicators in business decision making
• Participate in national and international accreditations aimed at improving issues around water sustainability
• Invest in research and implementation of new technologies aimed at improving water efficiency and minimising impacts on water resources.
The importance of wetlands
Internationally, the importance assigned to wetlands is reflected by the number of organisations which focus on these ecosystems. The Ramsar Convention (Ramsar, 2014) was initially concerned with conserving habitat for migratory waterfowl but since its inception in 1971 it has broadened its scope in recognition of the important role wetlands play in the provision of livelihoods for people who depend on the stream of benefits that wetlands provide, and now the focus is on wise or sustainable use of wetlands. There are currently 168 contracting parties to the Ramsar Convention, with 2 168 wetlands designated as wetlands of international importance which have a combined area of 208 674 342 ha. Wetlands International is a global NGO with the mission of sustain and restore wetlands, their resources & biodiversity and works towards wetlands being treasured and nurtured for their beauty, the life they support and the resources they provide.
Wetlands are important providers of Ecosystem Services which the Millennium Ecosystem Assessment categorises as supporting, provisioning, regulating and cultural (MA, 2005). This categorisation has been used as a framework to focus the 21 handbooks which make up the toolkit on Wise Use of Wetlands developed by the Ramsar Convention on Wetlands, as shown in Figure 4 below.

12
Figure 4: A Conceptual Framework for the Wise Use of Wetlands and the maintenance of their ecological character, and the application of the guidelines in the Ramsar ‘toolkit’ of Wise Use Handbooks 4th edition (vol. 1; 2010)
The contribution of wetlands to the hydrological cycle plays an important role maintaining the health of the water resource in addition to providing other services. Emerton and Bos (2004) give a number of key messages, three of which are quoted here:
• Ecosystems matter for people and water services
• Under-investment in ecosystems results in reduced water services
• Including ecosystem values in economic analysis improves decision-making
The South African Constitution (Act 108 of 1996) states that everyone has the right to an environment that is not harmful to their health or well-being and is protected for the benefit of present and future generations (Ch 2, para. 24). In addition, the vision for the NEPAD programme on conserving Africa’s wetlands is:
African countries and their people have healthy and productive wetlands and
watersheds that can support fundamental human needs (clean water, appropriate
sanitation, food security and economic development) (NEPAD, 2003).
Thus, the conservation of wetlands is institutionally enshrined.
The National Wetland Inventory, housed within SANBI (SANBI, undated) has to date mapped 2,9 million hectares of wetlands, amounting to 2,4% of South Africa’s land surface).
There are a number of definitions of wetlands, and that of the National Water Act (DWAF, 1998) reads as follows:

13
“wetland'' means land which is transitional between terrestrial and aquatic systems
where the water table is usually at or near the surface, or the land is periodically
covered with shallow water, and which land in normal circumstances supports or
would support vegetation typically adapted to life in saturated soil.” (National Water
Act, Act 36 of 1998; Chapter 1; Clause xxix).
In practice, this definition refers to palustrine wetlands, the type of wetland addressed by Oberholster et al. (2014), and for this document will be the definitive definition.
There are other definitions, however. The definition used by the Ramsar Convention is much broader and reads as follows:
For the purpose of this convention wetlands are areas of marsh, fen, peatland or
water, whether natural or artificial, permanent or temporary, with water that is static
or flowing, fresh or salt, including areas of marine water the depth of which at low
tide does not exceed six metres (Ramsar Convention, Article 1.1, 2009).
It should be noted that, in the Ramsar Convention documents quoted below, this is the definition that has been followed.
That accepted by SANBI for the South African National Wetland Classification System follows the Ramsar definition with minor changes, and is as follows:
WETLAND: an area of marsh, peatland or water, whether natural or artificial,
permanent or temporary, with water that is static or flowing, fresh, brackish or salt,
including areas of marine water the depth of which at low tide does not exceed ten
metres (SANBI, 2012).
While the definition of wetlands from the National Water Act (1998) has been followed in this document, the classification system followed is that of SANBI (2012). The functional units of this classification are:
• Channelled valley-bottom wetland
• Unchannelled valley-bottom wetland
• Floodplain wetland
• Depression
• Flat
• Hillslope seep
• Valleyhead seep
There are several Natural Resource Management Programmes in South Africa that work with wetlands, but their impact on wetland management or rehabilitation has not been evaluated. Nor have the management of individual wetlands and the cooperation of organisations managing these been evaluated. Kotze et al. (2009) in their review of the impact of the Natural Resource Management Programmes examine these issues under the following divisions:
• Part 1 broadly examines the impact of the Natural Resource Management Programmes which promote the conservation and rehabilitation of wetlands.
• Part 2 presents the framework that was used for assessing management effectiveness and applies this framework to 21 individual wetlands.

14
• Part 3 examines in further detail six of the 21 wetlands, and focuses on the relationship between participation in rehabilitation and the long-term sustainability of natural resource management.
• Part 4 presents a framework for assessing how effectively various organizations and programmes collaborate, and applies this framework to one of the 21 sites.
Specific ecosystem service functions of wetlands contributing to their importance in the social-ecological landscape are examined below.
In spite of this interest in wetlands, Mucina & Rutherford (2006) indicate that wetland vegetation types are not well known and that more attention should be given to the vegetation in these types of wetlands in the future. Against this backdrop, and using the same database system as used by SANBI (TURBOVEG) Sieben (2011) compiled vegetation data in wetlands in Kwazulu-Natal, the Free State and Mpumalanga and provided guidelines on the minimum data requirements and a sampling protocol. Van Ginkel et al. (2011) and Wentzel and Van Ginkel (2012) have provided in-depth information on certain wetland plants, but more is required to address the concern articulated by Mucina and Rutherford (2006).
Eskom recognises the importance of wetlands and that within the area of its jurisdiction across the country there are a number of wetlands. In terms of the legal requirements, Eskom is obliged to conserve these and to this end has developed the Eskom Wetland Classification and Risk Assessment Index Field Guide (Oberholster et al., 2014).
Wetlands and South African Legislation
There is no single piece of South African legislation dedicated to the protection of wetlands. However, the protection of wetlands has been directly or indirectly included in the following pieces of legislation. Armstrong (2009) provides a thorough coverage of the legislation valid at the time and the reader is referred to this document for detailed discussion of each piece of legislation. Certain regulations have been promulgated since Armstrong’s 2009 synthesis and important ones are mentioned below.
National Environmental Management Act, 1998 (Act No. 107 of 1998): is the framework environmental legislation in South Africa and provides indirect protection for wetlands as an environmental resource.
National Environmental Management: Biodiversity Act, 2004 (Act 10 of 2004): This Act gives effect to ratified international agreements affecting biodiversity to which South Africa is a party, and which bind the Republic. Furthermore, the Minister may list ecosystems and species that are threatened or in need of protection, and these might include wetland ecosystems and species closely associated with wetlands. The Minister may also list threatening processes and activities in listed ecosystems and related to protected species. The Act also makes provision for the rehabilitation of ecosystems, which include wetlands. The Minister may also promulgate a list of invasive species and the required measures associated with these.
Regulation GN R543, 18 June 2010: Environmental Impact Assessment Regulations: provides for activities that may impact detrimentally on the environment to require prior environmental authorisation.
Regulation GN R544 (Listing Notice 1): sets out a list of identified activities which may not commence without environmental authorisation from the competent authority and which must follow the basic assessment procedure as provided for in regulations 21 to 25 of the NEMA EIA Regulations. These include activities in wetlands and estuaries.

15
National Environmental Management: Protected Areas Act (57 of 2003): The intention of the Act is to protect and conserve ecologically viable areas as well as their natural landscapes. These would include wetlands designated as or within protected areas.
National Environmental Management: Waste Act 2008 (Act 59 of 2008): In recognition of the adverse impact that poor waste management practices have locally and globally, the intention of this Act is to minimise pollution and so promote sustainable development.
National Water Act, 1998 (Act 36 of 1998): activities in and within 500 m of wetlands or the saltwater mixing zone of estuaries will require a water use licence. The Act also makes provision for the protection of water resources, which include all wetlands as well as the prevention of pollution and degradation of these resources. Any activity which will impact a wetland requires that the wetland be delineated. The requirements for wetland delineation are reviewed below.
Regulation GNR 1352 (in terms of the NWA) of 12 November 1999, Regulations on Use of Water for Mining and Related Activities Aimed at the Protection of Water Resources: the regulation is specifically aimed at mining activities and prohibits water pollution and activities that may impact on the integrity of a water resource, such as the location of residue deposits and open cast or underground mining activities within 100 m or within the 1:100 year flood line of any water resource. The Regulations also makes provision for the protection of water resources during the mining of sand and alluvial minerals from watercourses and estuaries.
Conservation of Agriculture Resources Act, 1983 (Act 43 of 1983): sets out measures to prevent the spread of alien vegetation. Given the ideal growth opportunities afforded by wetlands for alien species, the protections of wetlands from invasive species are implied in this legislation. The legislation includes a list of alien and invasive species and the required measures to be taken in relation to these. The Act also provides for the regulation of control over the utilisation of agricultural resources in SA in order to promote the conservation of soil, water and vegetation (including wetlands). In accordance with the Act, Authorisation is required to:
1. Drain or cultivate any vlei, marsh or water sponge. 2. Cultivate any land within the flood area of a watercourse or within 10 m outside the flood-
area of a watercourse. 3. Divert run-off from a water course, or 4. Burn veld, including wetland vegetation.
CARA: Regulation GNR 1048 of 24 May 1984 (as amended): makes provision for the protection of land and promotes the conservation of soil and water resources and natural vegetation through various measures, such as the prevention of soil erosion, the prevention of the disturbance of natural flow patterns and run-off, prevention of bush encroachment and makes provision for the restoration of land resources. Wetlands and their supporting hydrology are by definition included under the term “natural resources”.
National Forests Act, 1998 (Act 84 of 1998): forestry activities that may impact on wetlands are regulated.
Mountain Catchments Act (Act 62 of 1970): this Act provides for the conservation, use, management and control of land situated in mountain catchment areas.
Wetland delineation
The definitive guideline for the delineation of wetlands in the environmental cluster of South African government departments is the Practical Field Procedure for The Identification and Delineation of Wetlands and Riparian Areas (Rountree et al., 2008). This document is the one referred to in licenses/permits issued by the DWS and so is the one which should guide Eskom’s activities relating to wetlands. Wetland is a term applied to a variety of ecosystems,

16
depending on the definition used and these have been briefly covered above (Paragraph 2.XX – Why are wetlands important?). The DWAF field procedure uses the definition from the NWA:
“wetland” means land which is transitional between terrestrial and aquatic systems
where the water table is usually at or near the surface, or the land is periodically
covered with shallow water, and which land in normal circumstances supports or
would support vegetation typically adapted to life in saturated soil (paragraph xxix,
Ch. 1; NWA, 1998).
Three broad zones are identified in the DWAF field procedure for the delineation of wetlands, and these are: the Permanent zone, the Seasonal zone (wet for much of the year) and the temporary zone (wet occasionally). The object of delineation is to identify the outer edge of the temporary zone. Wetlands are not always wet, particularly at the edge of the temporary zone, so four indicators have been provided for identifying the areas considered as wetlands. These four indicators are:
• The Terrain Unit Indicator: this indicator helps to identify those parts of the landscape where wetlands are more likely to occur.
• The Soil Form Indicator: this indicator identifies the soil forms, as defined by the Soil Classification Working Group (1991), which are associated with prolonged and frequent saturation.
• The Soil Wetness Indicator: this indicator identifies the morphological "signatures" developed in the soil profile as a result of prolonged and frequent saturation.
• The Vegetation Indicator: this indicator identifies hydrophilic vegetation associated with frequently saturated soils.
According to the wetland definition used in the National Water Act, vegetation is the primary indicator, which must be present under normal circumstances. However, in practise, the soil wetness and form indicators tend to be the most important, and the other indicators are used in a confirmatory role. The reason is that vegetation responds relatively quickly to changes in soil moisture regime or management and may be transformed; whereas the morphological indicators in the soil are far more permanent and will hold the signs of frequent saturation long after a wetland has been drained (perhaps for several centuries). Despite hydrology not being one of the four indicators listed above, the delineation procedure is substantially facilitated by an understanding of the broad hydrological processes that drive the frequency of saturation, particularly in the case of river channels.
Determining the boundaries of wetlands in the field
The field procedure provides detailed guidance for each of the steps below.
1. Get all the information that you can from maps, air photos, reports, other documents before going into the field. In practise, Google Earth is an accurate and readily accessible source of recent information. This desktop delineation will save a lot of time in the field.
2. Once in the field:
• Find a vantage point from which the wetland can be viewed. This will permit you to match the desktop delineation to the terrain.
• Starting at the bottom of the wetland, look for wetness or hydrophilic plants to identify the wettest part of the wetland.

17
• Move up the wetland to the point where the boundary of the temporary wetland/terrestrial zone is determined and put in a flag.
• Do enough transects across the wetland (temporary wetland/terrestrial zone boundary to temporary wetland/terrestrial zone boundary), flagging each until the wetland is delineated.
• Note the necessary and appropriate buffer zones. • A point to watch for – if a wetland has been drained, the soil wetness indicators may still
be present, but terrestrial plants will replace the hydrophilic plants.
3. Where the iron content of the soil is low, mottles may be scarce throughout the three wetness zones. Nevertheless, the general trend of an increase and then a decrease in mottle abundance, as one move from the temporary zone through the seasonal and then the permanent zone remains true.
4. In wetlands that are in very sandy soil or coarse sediment, organic material and iron oxides are often leached out, giving the soil a white, bleached look. In cases such as this, it is not possible to use normal soil wetness indicators for delineation. Reliance should instead be placed on other indicators.
5. Take special note of the ‘specific cases’ category in Appendix A of the document. These ‘specific cases’ do not conform to the general characteristics described above. The specific cases are:
• Hydrophilic vegetation growing on alluvial deposits that are too young to show the morphological indicators of wetness.
• Sandy soils such as occur along the coast. Note that sandy soils occurring inland, such as granitic soils, may also not show the typical indicators.
• Soils derived from quartzites and dolomites.
The DWS field procedure (DWAF, 2008) does not put much emphasis on ecoregions, only mentioning that each ecoregion may contain distinctive vegetation communities. The wetland classification system developed for the National Wetland Inventory of SANBI (Ewart-Smith et al., 2006) emphasises the influence of ecoregions on wetlands. The ecoregions will to some extent dictate the nature of wetlands occurring within the particular ecoregion. There are 31 Level 1 ecoregions in South Africa (including Lesotho and Swaziland) and each delineation needs to locate the wetland within the appropriate ecoregion, especially for the development of EIAs, EMPs, etc. Level 2 and Level 3 ecoregions provide greater detail and insight into the expected nature of the areas (Kleynhans et al., 2005).
The following hierarchical classification system is proposed for wetlands (SANBI, 2012):
Level 1 Connectivity to open ocean
Level 2 Level 1 Ecoregion (from Kleynhans et al., 2005)
Level 3 Landscape unit
Level 4 Hydrogeomorphic (HGM) unit (Level 4 is divided into a number of categories which vary depending on the landscape unit and the HGM unit.
In South Africa, methodologies for the formal identification and delineation of wetlands revolve primarily around the use of soil morphological indicators, with the soils of permanently saturated wetlands in particular being easily recognizable by their grey colour and mottled appearance. A number of wetland types and conditions have however been identified for which soil morphological indicators do not readily apply. These include

18
seasonally saturated to inundated wetlands in sandy coastal aquifers dominated by aeolian (windblown) sands. In many of these systems, both anoxic conditions and the mineral stripping via podsolization that leads to mottling do not occur. The soils of temporary wetlands in very arid areas are also often too shallow, too saline or too temporarily inundated to exhibit typical wetland features in their soils. Such wetlands are called “cryptic”, and cannot reliably be identified as wetlands during the dry season on the basis of standard wetland identification and delineation tools (Day et al., 2010). Day et al. (2010) and Bird (2010) propose indicators for the identification of temporary wetlands using invertebrates and plants as indicators and provide methods for using these indicators. These indicators should be used when the assessor is faced with the wetlands in sandy soils as covered in Annexure A of the DWAF (2008) field procedure.
Job (2008) also tested the DWAF (2008) field procedure widely in the Western Cape where wetlands may be difficult to identify. She found that 65% of wetlands could be identified using the indicators described in the DWAF (2008) field procedure, and the remaining 35% fell into the ‘special cases’ category. These were mostly sandy and low chroma soils. For these, the recommendation that she made are:
• Record the presence of a dark, high carbon content layer on the soil surface, and/or
• Thoroughly document landscape conditions and any remnant vegetation, soil, hydrology indicators, and then develop the rationale for considering the area to be wetland.
Buffer strips or zones
Buffer zones perform the following functions (from Table 1 in MacFarlane et al., in press):
• Maintaining basic aquatic processes
– Maintaining channel stability – Groundwater recharge – Control of microclimate and water temperature – Flood attenuation – Maintenance of general wildlife habitat
• Reducing impacts on water resources from upstream activities and adjoining land uses
– Storm water attenuation – Sediment trapping – Removal of toxics – Nutrient removal – Removal of pathogens
• Providing habitat for aquatic and semi-aquatic species
– Provision of habitat for aquatic species – Screening of adjacent disturbances – Habitat connectivity
• Providing habitat for terrestrial species
– Provision of habitat for terrestrial species – Habitat connectivity
• Ancillary societal benefits
– Reduces flood risk

19
– Enhances visual quality – Improve air quality – Provides recreational opportunities – Economic benefits
The role that buffers are able to play needs to be understood. For instance, they cannot mitigate point source impacts such as sewage outflows or storm water drains. These require other approaches.
The DWAF General Authorisation (2009) for any development occurring within 500 m of a wetland requires a risk-based evaluation of the potential impact of the project to be carried out on the development and the potential risks that the development may involve (N Fourie, pers comm.). There is a completed but not yet published Water Research Commission report (MacFarlane et al., in press. WRC Project number K5/2200) detailing research on the development of a process to assess the risk to a water body from the surrounding land use. This presents a repeatable method for assessing risk and will be tested by the DWS with a view to accepting it as the guideline for assessing the necessary buffer zone width to protect a body of water.
Wetland inventory
Volume 13 of the Ramsar Handbooks on Wise Use (2010) note that wetland inventory has multiple purposes which include:
• Listing particular types, or even all, wetlands in an area
• Listing wetlands of local, national and/or international importance
• Describing the occurrence and distribution of wetland taxa
• Describing the occurrence of natural resources such as peat, fish or water
• Establishing a baseline for measuring change in the ecological character of wetlands
• Assessing the extent and rate of wetland loss or degradation
• Promoting awareness of the value of wetlands
• Providing a tool for conservation planning and management
• Developing networks of experts and cooperation for wetland conservation and management.
The Ramsar Convention designated wetlands of international importance originally for their importance for water birds, especially migratory birds, but this scope has now been broadened. Most of the wetlands designated, however, are clearly defined and usually large. Volume 13 of the Ramsar handbooks for wise use (2010) presents a hierarchical approach for the delineation of wetlands for the sake of designating wetlands of international importance. The first steps are taken at desktop before moving into the field, as follows:
• Level 1: Desktop – the first assessment is at a broad level, considering the geology. Climate and ecoregion of the wetland. This is based on existing datasets.
• Level 2: Desktop – the second level of assessment is based on Level 1, but with the hydrology and vegetation of the wetland included.
• Level 3: Fieldwork is undertaken at this level to identify physical, physico-chemical and biological features of wetland complexes within each wetland region. This is done at a broad scale.
• Level 4: Level 4 assessment involves fieldwork to identify and analyse the physical, physico-chemical and biological features of wetland habitat within each complex. – plant

20
and animal assemblages and species – land and water use – wetland management at a greater level of detail than undertaken at Level 3.
Volume 13 of the Ramsar Handbooks (2010) gives detail on the monitoring requirements for designated wetlands. Recognising that monitoring can be expensive, programmes should be cost-effective and adequate for management purposes (see Section XX – Adaptive Management). Rapid assessment techniques are suitable for broad-scale implementation and may provide adequate data for broad-scale management. However, detailed quantitative monitoring is often required for specific sites. The Ramsar framework for the design of a monitoring framework is discussed under the section titled ‘The identification, and development where necessary, of a suite of indicators for monitoring the health of the ecosystem services identified as important in the area to be conserved’.
Volume 15 of the Ramsar Handbooks on Wise Use (2010) provides a framework for planning a wetland inventory (Table 1). In order to complete the task to the standard required by the Ramsar Convention, the requirement is that all steps to be followed. They do, however, suggest that the emphasis may be placed on ecosystem services if this is desirable.
Table 1: A structured framework for planning a wetland inventory
Step Guidance
1. State the purpose and objective State the reason(s) for undertaking the inventory and why the information is required, as the basis for choosing a spatial scale and minimum data set.
2. Review existing knowledge and information
Review the published and unpublished literature and determine the extent of knowledge and information available for wetlands in the region being considered.
3. Review existing inventory methods Review available methods and seek expert technical advice to: a) choose the methods that can supply the required information; and b) ensure that suitable data management processes are established.
4. Determine the scale and resolution Determine the scale and resolution required to achieve the purpose and objective defined in Step 1.
5. Establish a core or minimum data set Identify the core, or minimum, data set sufficient to describe the location and size of the wetland(s) and any special features. This can be complemented by additional information on factors affecting the ecological character of the wetland(s) and other management issues, if required.
6. Establish a habitat classification Choose a habitat classification that suits the purpose of the inventory, since there is no single classification that has been globally accepted

21
Step Guidance
7. Choose an appropriate method Choose a method that is appropriate for a specific inventory based on an assessment of the advantages and disadvantages, and costs and benefits, of the alternatives.
8. Establish a data management system Establish clear protocols for collecting, recording and storing data, including archiving in electronic or hardcopy formats. This should enable future users to determine the source of the data, and its accuracy and reliability. At this stage it is also necessary to identify suitable data analysis methods. All data analysis should be done by rigorous and tested methods and all information documented. The data management system should support, rather than constrain, the data analysis.
A meta-database should be used to: a) record information about the inventory datasets; and b) outline details of data custodianship and access by other users.
9. Establish a time schedule and the level of resources that are required
Establish a time schedule for: a) planning the inventory; b) collecting, processing and interpreting the data collected; c) reporting the results; and d) regular review of the program.
Establish the extent and reliability of the resources available for the inventory. If necessary make contingency plans to ensure that data is not lost due to insufficiency of resources.
10. Assess the feasibility & cost effectiveness
Assess whether or not the program, including reporting of the results, can be undertaken within under the current institutional, financial and staff situation. Determine whether the costs of data acquisition and analysis are within budget and that a budget is available for the program to be completed.
11. Establish a
reporting procedure
Establish a procedure for interpreting and reporting all results in a timely and cost effective manner.
The report should be succinct and concise, indicate whether or not the objective has been achieved, and contain recommendations for management action, including whether further data or information

22
Step Guidance
is required.
12. Establish a review and evaluation process
Establish a formal and open review process to ensure the effectiveness of all procedures, including reporting and, when required, supply information to adjust or even terminate the program.
13. Plan a pilot study Test and adjust the method and specialist equipment being used, assess the training needs for staff involved, and confirm the means of collating, collecting, entering, analysing and interpreting the data. In particular, ensure that any remote sensing can be supported by appropriate “ground-truth” survey.
Inventory of SA Wetlands – NFEPA Project
SANBI has coordinated the South African wetland inventory since 2004 and has to date produced four versions of the National Wetland Map. Version 4 of the National Wetland Map formed the foundational data layer for the National Freshwater Ecosystems Priority Areas (NFEPA) project (Driver et al., 2011; Nel et al., 2011a, 2011b).
The NFEPAs are a set of strategic spatial priorities for conserving water ecosystems and supporting the sustainable use of water resources. Development pressures result in it not always being possible to maintain all water ecosystems in good ecological condition. However, in order to support the health and sustainability of water ecosystems and thus the provision of water-related ecosystem services, a certain proportion of water ecosystems need to be maintained in good ecological condition. The NFEPAs represent such a set of ecosystems, derived systematically and proactively, in the most efficient configuration, based on the best available science.
NFEPA maps are available on the SANBI BGIS website (http://bgis.sanbi.org) both as image files and as shape files that can be manipulated in GIS. In addition to the maps, two supplementary reports have been published:
• A technical report, which explains the scientific methods and stakeholder engagement process used to create the map products and the analysis of legal and institutional mechanisms available for implementing NFEPA products
• An implementation manual that provides guidance on how to use the FEPA maps in the water sector, the biodiversity sector and other key sectors whose planning and decision making impacts on freshwater ecosystems
The NFEPA maps provide a single, nationally consistent information source for incorporating water ecosystem goals into planning and decision-making processes. Not every FEPA can automatically be considered key ecological infrastructure, but when combined with other information sources, the NFEPA maps remain a primary input in the identification of ecological infrastructure of significance for water security.

23
The maps support integrated water resource management by providing guidance on how many rivers, wetlands and estuaries, and which ones, should remain in a natural or near-natural condition to support the water resource protection goals of the National Water Act. This does not mean FEPAs should be restricted from human use, but rather that they should be supported by good planning, decision-making and management to ensure that human use does not impact unduly on the condition of the resource.
The NFEPA project responds to the high levels of threat prevalent in river, wetland and estuary ecosystems of South Africa and provides strategic spatial priorities for conserving the country’s freshwater ecosystems and supporting sustainable water resources.
The history of the NFEPA initiative, provided by SANBI on the following website (http://bgis.sanbi.org/nfepa/project.asp?) provides the following background history to the project.
Freshwater ecosystems provide a valuable natural resource, with economic, aesthetic, spiritual, cultural and recreational value. Yet the integrity of freshwater ecosystems in South Africa is declining at an alarming rate largely as a consequence of a variety of challenges that are practical (managing vast areas of land to maintain connectivity between freshwater ecosystems), socio-economic (competition between stakeholders for utilisation) and institutional (building appropriate governance and co-management mechanisms).
The first National Spatial Biodiversity Assessment (NSBA) in 2004 provided a national assessment of the status of terrestrial, river, marine and estuarine ecosystems and identified broad priority areas for biodiversity conservation for terrestrial ecosystems. Freshwater ecosystems were lacking as some critical datasets was unavailable. However, the NSBA highlighted the dire state of river ecosystems in South Africa, which were far worse than the state of terrestrial ecosystems.
In 2006, (Roux et al., 2006) a process was initiated to develop cross-sector policy objectives for conserving South Africa’s inland water biodiversity, which led to the definition of a national goal for freshwater conservation policy in South Africa: “to conserve a sample of the full diversity of species and the inland water ecosystems in which they occur, as well as the processes which generate and maintain diversity”. Five policy objectives, each with a set of recommendations, were identified in order to achieve this goal:
• Set and entrench quantitative targets
• Plan for the representation of inland water biodiversity
• Maintain the processes which encourage the evolution and persistence of ecosystems
• Establish a network of inland water conservation areas and
• Enable effective implementation
NFEPA takes forward the implementation of the Cross-Sector Policy Objectives for Inland Water Conservation. It also builds on the river component of the National Spatial Biodiversity Assessment (NSBA) 2004.
Roux et al. (2006) note that a loss of biodiversity inevitably leads to ecosystem degradation and the subsequent loss of important ecosystem services. This loss is most detrimental to the rural poor who rely directly on the ecosystem services, particularly the provisioning services, most heavily. Taking cognisance of the above, the quantitative target for inland water biodiversity conservation in South Africa has been set at ‘at least 20% of each inland water ecosystem type (determined at an appropriate scale) should be in the Natural Class in the DWAF (now DWS) water resource classification system’. Rivers-Moore (2011), however, found that the Beta-diversity turned over in less than 20% of the river length in the upper reaches, requiring a higher percentage of the river than the blanket 20% to be conserved.

24
The national goal of the NFEPA initiative is
To conserve a sample of the full variety or diversity of inland water ecosystems that
occur in South Africa, including all species as well as the habitats, landscapes, rivers
and other water bodies in which they occur, together with the ecosystem processes
responsible for generating and maintaining this diversity, for both present and future
generations.
The wetland inventory undertaken by SANBI is broader than a straightforward inventory, as it addresses the sustainability of wetlands and rivers and their contribution to the conservation of aquatic biodiversity. The NFEPA project was conceptualised with these objectives in mind.
Over 100 000 South African wetlands have been delineated during the NFEPA project using a combination of remote sensed data and existing mapped localities. The project team recognise that not all wetlands have been mapped and that there are some substantial gaps that still need to be filled. The NFEPA initiative, however, identifies priority wetlands and rivers for protection in South Africa and provides an important tool for planning and prioritising interventions.
The NFEPA project does not differentiate between the various types of wetland as defined by SANBI (2012). The different types of wetlands occur in different parts of the landscape and do not all provide the same basket of ecosystem services. For instance, un-channelled valley bottom wetlands, a critically endangered wetland type (Van Vuuren, 2014), are more effective at upgrading water quality than are channelled valley bottom wetlands, but impacts on unchannelled valley bottom wetlands tend to erode channels, reducing their effectiveness in the delivering this ecosystem service.
Ecological Infrastructure
Ecological infrastructure refers to naturally functioning ecosystems that deliver valuable services to people, such as water and climate regulation, soil formation and disaster risk reduction (Ecological infrastructure fact sheet, 2014). It is the nature-based equivalent of built or hard infrastructure, and is just as important for providing services and underpinning socio-economic development. Ecological infrastructure includes, for instance, healthy mountain catchments, rivers, wetlands, coastal dunes, and nodes and corridors of natural habitat, which together form a network of interconnected structural elements in the landscape. Manuel (2012) notes that in spite of integrated planning networks and the existence of good ecological information, the environment is often seen as an obstacle to development, and if the high growth rate envisaged by the national Development Plan (NPC, 2011) is to be achieved through construction and extraction-based development, then the environment will certainly be an obstacle. Planning and managing the ecological infrastructure will provide for ecologically sustainable development while promoting economic and social development. Investing in ecological infrastructure is a low-cost high-return development strategy with multiple social, economic and environmental gains.
Ecosystem Services Provided by Wetlands
Wetlands provide a variety of ecosystem services such as ground water recharge, flood attenuation, pollution abatement, habitat for biodiversity, recreation opportunities, and provide for the livelihood of some communities through the harvesting of resources. Barbier et al. (1997) provides the following examples: Wetland systems directly support millions of people and provide goods and services to the communities outside the wetland. For example, wetland soils are used for agriculture, fish are caught to eat, trees are cut for

25
timber and fuel wood and wetland reeds are harvested to make mats and to thatch roofs. Direct use takes the form of recreation, such as bird watching or hiking. Communities benefit indirectly from wetland functions or services. As flood water flows out over a floodplain wetland, the water is temporarily stored which reduces the peak river level to prevent flooding of riparian dwellers downstream. The value of wetland ecosystem services has also been emphasised by Becker (1998), who states that wetlands are considered to be a good last line of defence for water quality problems. Wetlands can retain up to 96% of nitrogen and 97% of phosphorus and thus have the potential to significantly lower the cost of sewage treatment (Bolund and Hunhammar, 1999). Table 2 summarises some of the ecosystem services offered by wetlands.
Table 2: Wetlands functions, related effects of functions, and corresponding societal values (Lechine et al., 1997 as adapted from NRC 1995)
Functions Effects Societal Value
Hydrologic
• Short-term surface water storage
• Long-term surface water storage
• Maintenance of high water table
Biogeochemical
• Transformation, cycling of elements
• Retention, removal of dissolved substances
• Accumulation of inorganic sediments
Habitat and Food Web Support
• Maintenance of characteristics plant communities
• Maintenance of characteristic energy flow
• Reduced downstream flood peaks
• Maintenance of base flows, seasonal flow distribution
• Maintenance of hydrophytic community
• Maintenance of nutrient stocks within wetlands
• Reduced transport of nutrients downstream
• Retention of nutrients, metals, other substances
• Food, nesting, cover for animals
• Support for populations of vertebrates
• Reduced damage from floodwaters
• Maintenance of fish habitat during dry periods
• Maintenance of biodiversity
• Wood production
• Maintenance of water quality
• Maintenance of water quality
• Support for furbearers, waterfowl
• Maintenance of biodiversity
The framework developed through the Millennium Ecosystem Assessment (2005) provides a way of understanding ecosystem services which has been widely adopted and is currently the standard. This has been taken further through the Economics of Ecosystems and Biodiversity (TEEB). The following brief descriptions of 17 ecosystem services are taken from the TEEB (The Economics of Ecosystems and Biodiversity) web site http://www.teebweb.org/resources/ecosystem-services/ .

26
Provisioning services
Provisioning Services are ecosystem services that describe the material or energy outputs from ecosystems. They include food, water and other resources.
Food: Ecosystems provide the conditions for growing food. Food comes principally from managed agro-ecosystems but marine and freshwater systems or forests also provide food for human consumption. Wild foods from forests are often underestimated.
Raw materials: Ecosystems provide a great diversity of materials for construction and fuel including wood, biofuels and plant oils that are directly derived from wild and cultivated plant species.
Fresh water: Ecosystems play a vital role in the global hydrological cycle, as they regulate the flow and purification of water. Vegetation and forests influence the quantity of water available locally.
Medicinal resources: Ecosystems and biodiversity provide many plants used as traditional medicines as well as providing the raw materials for the pharmaceutical industry. All ecosystems are a potential source of medicinal resources.
Regulating services
Regulating Services are the services that ecosystems provide by acting as regulators, e.g. regulating the quality of air and soil or by providing flood and disease control.
Local climate and air quality: Trees provide shade whilst forests influence rainfall and water availability both locally and regionally. Trees or other plants also play an important role in regulating air quality by removing pollutants from the atmosphere.
Carbon sequestration and storage: Ecosystems regulate the global climate by storing and sequestering greenhouse gases. As trees and plants grow, they remove carbon dioxide from the atmosphere and effectively lock it away in their tissues. In this way, forest ecosystems are carbon stores. Biodiversity also plays an important role by improving the capacity of ecosystems to adapt to the effects of climate change. (See also the section on carbon sequestration by wetlands below.)
Moderation of extreme events: Extreme weather events or natural hazards include floods, storms, tsunamis, avalanches and landslides. Ecosystems and living organisms create buffers against natural disasters, thereby preventing possible damage. For example, wetlands can soak up floodwater whilst trees can stabilize slopes. Coral reefs and mangroves help protect coastlines from storm damage.
Wastewater treatment: Ecosystems such as wetlands filter both human and animal waste and act as a natural buffer to the surrounding environment. Through the biological activity of microorganisms in the soil, most waste is broken down. Thereby pathogens (disease causing microbes) are eliminated, and the level of nutrients and pollution is reduced.
Erosion prevention and maintenance of soil fertility: Soil erosion is a key factor in the process of land degradation and desertification. Vegetation cover provides a vital regulating service by preventing soil erosion. Soil fertility is essential for plant growth and agriculture and well-functioning ecosystems supply the soil with nutrients required to support plant growth.
Pollination: Insects and wind pollinate plants and trees which is essential for the development of fruits, vegetables and seeds. Animal pollination is an ecosystem service mainly provided by insects but also by some birds and bats. Some 87 out of the 115 leading global food crops depend upon animal pollination including important cash crops such as cocoa and coffee (Klein et al., 2007).

27
Biological control: Ecosystems are important for regulating pests and vector borne diseases that attack plants, animals and people. Ecosystems regulate pests and diseases through the activities of predators and parasites. Birds, bats, flies, wasps, frogs and fungi all act as natural controls.
Habitat or supporting services
Habitats for species: Habitats provide everything that an individual plant or animal needs to survive: food; water; and shelter. Each ecosystem provides different habitats that can be essential for a species’ lifecycle. Migratory species including birds, fish, mammals and insects all depend upon different ecosystems during their movements.
Maintenance of genetic diversity: Genetic diversity is the variety of genes between and within species populations. Genetic diversity distinguishes different breeds or races from each other thus providing the basis for locally well-adapted cultivars and a gene pool for further developing commercial crops and livestock. Some habitats have an exceptionally high number of species which makes them more genetically diverse than others and are known as ‘biodiversity hotspots’
Cultural services
Recreation and mental and physical health: Walking and playing sports in green space is not only a good form of physical exercise but also lets people relax. The role that green space plays in maintaining mental and physical health is increasingly being recognized, despite difficulties of measurement.
Tourism: Ecosystems and biodiversity play an important role for many kinds of tourism which in turn provides considerable economic benefits and is a vital source of income for many countries. In 2008 global earnings from tourism summed up to US$ 944 billion. Cultural and eco-tourism can also educate people about the importance of biological diversity.
Aesthetic appreciation and inspiration for culture, art and design: Language, knowledge and the natural environment have been intimately related throughout human history. Biodiversity, ecosystems and natural landscapes have been the source of inspiration for much of our art, culture and increasingly for science.
Spiritual experience and sense of place: In many parts of the world natural features such as specific forests, caves or mountains are considered sacred or have a religious meaning. Nature is a common element of all major religions and traditional knowledge, and associated customs are important for creating a sense of belonging.
Implications for the study
Eskom is also a user of wetland ecosystem services, as are users downstream. One of the risks identified by Eskom relates to deteriorating water quality in the catchments where their power stations are situated. The optimisation of the ecosystem services associated with wetlands for the benefit of Eskom should be investigated and potentially harnessed.
In a series of publications (Wetland Management Series) (Dada et al., 2007 and others in the WET series, 2009) on wetland rehabilitation several tools were developed for use by South African role-players. These tools were developed as part of a comprehensive nine-year research programme on wetland management which was initiated in 2003 by the Water Research Commission (WRC) and a range of partners. The research examined wetland

28
rehabilitation, wetland health and integrity and the sustainable use of wetlands. The WET-EcoServices publication contains the tool used to assess the services that individual wetlands provide. The tool provides guidelines for scoring the importance of a wetland in delivering each of 15 different ecosystem services (including flood attenuation, sediment trapping and provision of livestock grazing).
Implications for the study
Well-researched tools have been developed specifically for the South African landscape to identify and evaluate ecosystem services associated with wetlands. New developments for which environmental authorisation is required, have to assess the potential impact on wetlands and the functions which they perform. Whilst the ecosystem services have been identified, this is not always pulled through to continuous monitoring and evaluation.
The Value of Ecosystem Services from Wetlands
The ecosystem services from wetlands have a higher value than other inland ecosystems. Table 3 (extracted from de Groot et al., 2012) gives the average values of the ecosystem services from a number of studies reported in the literature.
Table 3: The average values (in Int. $/ha y) of ecosystem services per biome (extracted from de Groot et al., 2012).
Biome
----------------
Ecosystem services
Marine Coral reefs
Coastal systems
Coastal wetlands
Inland wetlands
Rivers and lakes
Tropical forest
Temperate forest
Woodlands Grasslands
No. of estimates
14 94 28 139 168 15 96 58 21 32
Provisioning 102
55 724
2 396 2 998 1 659 1 914 1 828 671 253 1 305
Regulating 65
171 478
25 847 171 515 17 364 187 2 529 491 51 159
Habitat 5
16 210
375 17 138 2 455 0 39 862 1 277 1 214
Cultural 319
108 837
300 2 193 4 203 2 166 867 990 7 193
Total economic value
491 352 249
28 917 193 845 25 682 4 267 5 264 3 013 1 588 2 871
Table 4 gives the breakdown of the contributions of the value of the benefits derived from ecosystem services for each of the main categories given in Table 3 for inland wetlands. The regulating services are the most valuable, making up 2/3 of the total value of the benefits.

29
Table 4: The average values (in Int.$/ha/yr) of ecosystem services for inland wetlands, showing the contributions of individual services to the total value (extracted from de Groot et al., 2012).
ECOSYSTEM SERVICE Int.$/ha/yr
PROVISIONING SERVICES 1 659
1 Food 614
2 Water 408
3 Raw materials 425
4 Genetic resources
5 Medicinal resources 99
6 Ornamental resources 114
REGULATING SERVICES 17,364
7 Air quality regulation
8 Climate regulation 488
9 Disturbance moderation 2986
10 Regulation of water flows 5606
11 Waste treatment 3015
12 Erosion prevention 2607
13 Nutrient cycling 1713
14 Pollination
15 Biological control 948
HABITAT SERVICES 2455
16 Nursery service 1287
17 Genetic diversity 1168
CULTURAL SERVICES 4203
18 Esthetic information 1292
19 Recreation 2211
20 Inspiration 700
21 Spiritual experience
22 Cognitive development
TOTAL ECONOMIC VALUE
25,682

30
Kotze et al. (2009) developed a method for evaluating 15 ecosystem services delivered by wetlands. The authors recognise that different HGM types of wetlands offer different ecosystem services, for instance, floodplains characteristically contribute to the attenuation of floods and Unchannelled valley bottom wetlands are more effective at trapping sediments. They recognise, nevertheless, that the scores obtained from different wetland types may still be compared and will give a measure of the basket of benefits provided by the wetlands under consideration. This procedure provides the basis for estimating the ecosystem services available from a wetland. It also provides an effective method for determining the ecological importance and sensitivity of a wetland
Carbon Sequestration by Wetlands
Carbon sequestration is not given explicitly by de Groot et al. (Table 4), but Euliss et al. (2006) working on the prairies of North America, found that wetlands sequestered twice the organic carbon as no-till cropland on about 17% of the area, making wetlands important non-forest carbon sinks.
Carbon can occur in the soil either as inorganic or organic form. Inorganic carbon originates mainly from the parent material (Nelson & Sommers, 1996). Soil organic carbon (SOC) originates from living material. SOC is a dynamic component of an ecosystem, and its accumulation is based on a balance between input (organic matter production) and output (decomposition, methanogenesis, and erosion). Typical wetland characteristics contribute to the fact that wetlands are one of the most effective ecosystems for storing soil carbon (Adhikari et al., 2009); although it is important to note that not all wetlands, even if constantly waterlogged, accumulate carbon equally effectively. South African soils have low organic matter levels; according to Du Preez et al. (2011), about 58% of soils contain less than 0.5% organic carbon and only 4% contain more than 2% organic carbon. Although any ecosystem might have a high organic matter input, SOC is usually quickly lost to the atmosphere due to aerobic microbial decomposition of the organic matter. As wetlands are hostile environments for most microbes, these ecosystems have the ability to accumulate SOC very effectively (Fey, 2010):
• Wetlands are characterized by waterlogged soil. This inhibits the action of the dominant aerobic microbes and facilitates the activity of anaerobic microbes, slowing the decomposition of organic material and leading to the accumulation of SOC.
• Wetlands are usually acidic due to waterlogging. This limits the range of microbial types that can survive in this environment, contributing to reduced decomposition rates.
• Wetland soils are leached, providing little nutrition in the soil for microbes to survive.
• In cold environments SOC usually accumulates even more effectively as low temperatures also inhibit microbial activity. This is the reason why most peatlands of the world are found in the northern hemisphere (Hinsby, 2011).
Decomposition in wetlands is, however, a complex matter based on numerous secondary, inter-related factors such as climate, wetland type and hydrogeomorphic setting, hydroperiod, quality and quantity of the organic matter, microbial communities, electron acceptor supply, low redox potentials and pH (Reddy & DeLaune, 2008; Bernal & Mitch, 2006; Neue et al., 1997).
While wet, anaerobic soils in permanently wet wetlands tend to accumulate large amounts of organic matter in a partially decomposed condition (Adhikari et al., 2009), SOC in seasonal or temporary wetlands oxidizes during the dry periods. Both Bernal & Mitsch (2008) and Cresser et al. (2007) found that 40-60% of the carbon pool in soil occurs in the top 25 cm of the soil. SOC content and decomposition rates also decrease with the depth of a soil profile,

31
as most organic matter input takes place at the soil surface, (Reddy & DeLaune, 2008; Reddy et al., 2000).
Peatlands are wetlands characterized by the accumulation of a layer of decomposed organic material. The International Mire Conservation Group (IMCG) defines peatlands as wetlands with more than 30% organic matter (roughly equal to 20% organic carbon or more), in a layer of more than 30 cm thick. In South Africa, a wetland is regarded as a peatland when it contains 20% or more SOC of a thickness of 20 cm or more. Although peatlands cover only 3% of land area worldwide, they contain 30% of the global SOC, making them an invaluable carbon sink. Equally, destroyed or degraded peatlands can significantly contribute to greenhouse gas emissions. According to estimation by Maltby et al. (1993) the mineralization process in a drained peatlands starts immediately, and results in emission of carbon dioxide ranging between 2.5 and 10t C/ha/yr.
Figure 5: An example of the comparative qualitative assessment of the carbon storage capacity across wetland types derived from the DFN decision support matrix, comparing the relative carbon store size per unit area across wetland types
Implications for the study
Carbon plays an integral part in the chemical and physical functioning of wetlands. However, carbon is easily lost when a wetland is degraded or impacted on. In order for Eskom to realize the true value of the wetland systems found on their property, it is important that they understand the processes and dynamics of carbon in wetlands.
Wetlands play an important role in carbon sequestration and present opportunities for Eskom in this regard.

32
Ecosystem services derived from carbon in wetlands
According to Doran and Parkin (1994) soil quality is ‘the capacity of soil to function within ecosystem and land use boundaries to sustain biological productivity, maintain environmental quality, and promote plant, animal and human health’. Soil health is ‘the continued capacity of soil to function as a vital living system, within ecosystem and land use boundaries, to sustain biological productivity, promote the quality of air and water environments, and maintain plant, animal and human health’. The organic matter content of soils is a key attribute to both soil health and soil quality (Du Preez et al., 2010).
SOC is a major driver of biogeochemical processes in wetlands (Bernal & Mitch, 2008). It maintains the most important soil functions by improving cation exchange capacity, buffer pH, supplying nutrients such as nitrogen and phosphorous, providing long-term storage for nutrients in the soil, lowering bulk density, and increasing hydraulic conductivity, soil stability, infiltration capacity, and water holding capacity (Passoni et al., 2009; Reddy & DeLaune, 2008), all of which form an integral part of a very productive ecosystem. It also increases soil fertility (Jankauskas et al., 2006) and strongly influences the binding and buffering capacity of soil, thus diminishing the diffusion of pollution from soil to water (CEC, 2002).
Carbon credits and offsetting
Various definitions exist for the term ‘carbon credit’, but the message is the same. A carbon credit can be a certificate or permit showing that the holder has paid to have a certain amount of carbon dioxide removed from the environment (Collins English Dictionary, 2013). It can also be used as a generic term to assign a value to a reduction or offset of GHG emissions. A carbon credit is usually equivalent to one ton of carbon dioxide equivalent (The Carbon Credit Network, 2012) and can be traded in the international market at their current market price (Investopedia Inc., 2013).
The aim of carbon markets is to attempt to mitigate the increase in concentrations of GHGs. The Kyoto Protocol formed the basis for the current carbon economy. It was adopted in December 1997 in Kyoto, Japan, and came into force in February 2005 when the mandatory number of countries acceded to it. The Kyoto Protocol is only binding on countries regarded to be the main contributors of GHG emissions, and sets limits on the emissions of six GHGs by industrialised countries, who, in turn, set quotas on the emissions of local business and organizations. The targets vary between countries, but the aim is to have reduced the combined emissions by 5% of the 1990 levels by 2012 (Scholtz & De Villiers, undated).
The Carbon market concept originates from the Clean Development Mechanism (CDM), one of the Kyoto Protocol’s three market-based mechanisms. It was envisaged as: “a way to allow industrial countries greater flexibility in meeting their emissions targets, while at the same time transferring cleaner technologies to developing countries so they can build cleaner technologies into their own economic development programs” (Scholtz & De Villiers, undated). There are two carbon markets:
• Verified Carbon Market – Verified Emission Reduction credits are bought by companies who wish to offset their carbon footprint.
• Compliance Carbon Market – The compliance market is reserved for institutional trade, where large companies are necessitated to offset their carbon footprint every year to reach the Kyoto Protocol targets enforced by their respective governments.
The trading of carbon on the carbon market follows an emissions-trading approach. GHG emissions are capped, where after markets are used to allocate the emissions among the group of regulated sources. This allows market mechanisms to drive industrial and

33
commercial processes to lower emissions or reduce carbon intensive approaches. There are two types of carbon transactions (Scholtz & De Villiers, undated):
• Allowance-based transactions – credits created and allocated to a party by regulators under a cap-and-trade regime such as the Assigned Amount Units under the Kyoto Protocol are purchased.
• Project-based transactions – credits are purchased from a project that already reduces GHG emissions. These projects are usually under the CDM or Joint Implementation mechanisms.
CDM projects result in three types of Kyoto units (UNFCC, 2008):
• Certified emission reductions (CERs) (issued for projects that reduce emissions);
• Temporary CERs and
• Long-term CERs (both temporary and long-term CERs are issued for projects that enhance removals through afforestation and reforestation projects).
The CDM Executive Board supervises the CDM, and is responsible for registering projects, approving methodologies for determining project baselines, monitoring emission reductions, and for issuing CERs (UNFCC, 2008).
Each user of carbon credits has a certain allowance of credits. Unused credits can be sold to users who are about to exceed their quotas, privately or on the open market (which functions almost like the stock exchange – the Chicago Climate Exchange and the European Union's Emissions Trading Scheme are examples hereof (Hansen, 2009)). Any GHG mitigation projects which generate carbon credits can use these to finance carbon reduction schemes between partners around the world. There are also many companies that sell carbon credits to commercial and individual customers who wish to lower their carbon footprint (UNFCC, 2007). As demand for energy grows, the total emissions must still stay within the cap, but it allows industry some flexibility and predictability in its planning to accommodate this.
A report by Hallowes (2009), however, deems carbon trading as a failure, stating that ‘there is no link between the price of carbon and the costs of climate change, or the costs of emissions reduction required to seriously mitigate climate change; and no necessary link between the number of credits in circulation and an overall reduction in greenhouse gas emissions.’
Carbon credits and offsetting in the European Union
EU initiatives to reduce greenhouse gas emissions include (EC, 2013):
• The European Climate Change Programme (ECCP), which has led to the implementation of new policies and measures;
• The EU Emissions Trading System, which has become the EU's key tool for reducing greenhouse gas emissions from industry most cost-effectively;
• Adopting legislation to raise the share of energy consumption produced by renewable energy sources, such as wind, solar and biomass, to 20% by 2020;
• Setting a target to increase Europe's energy efficiency by 20% by 2020 by improving the energy efficiency of buildings and of a wide array of equipment and household appliances;
• Binding targets to reduce CO2 emissions from new cars and vans;
• Supporting the development of carbon capture and storage (CCS) technologies to trap and store CO2 emitted by power stations and other major industrial installations.

34
Most of the EU initiatives revolve around cutting greenhouse gases through using less, or increasing efficiency. The EU mandate that by 2020, all member states would have cut their emissions up to 20% below the 1990 levels and up to 80-95% of the 1990 levels by 2050.
The EU states that “In the EU, the forest and agriculture sectors counter some of these emissions by removing an amount of carbon from the atmosphere equal to about 9% of the EU's total greenhouse gas emissions in other sectors. A variety of different land uses and management practices can limit emissions of carbon and enhance removals from the atmosphere within forestry and agriculture.” (EC, 2012). In addition to actual emission changes, they can trade according to the credits gained by participating in LULUCF (Land Use, Land Use Change and Forestry). These activities are contained to forestland management, cropland management, grazing land management and/or revegetation. Added later to LULUCF is wetland drainage and rewetting (EUROPA, 2012).
Carbon credits and offsetting in RSA
South Africa is one of the most carbon intensive economies in the world. CO2 emissions for 2004 were estimated at 440-million tons (Hallowes, 2009). The designated national authority in South Africa is the Department of Energy. In practice, however, the Department of Environmental Affairs is the lead department for implementing UNFCCC and dealing with climate change.
According to Scholtz & De Villiers (undated) the first carbon credits were issued in June 2008 in South Africa. Since then 228 CDM projects have been submitted to the Department of Energy of which 189 were Project Idea Notes and 39 Project Design Documents (PDDs). Twenty of the 39 PDDs have been registered as CDM projects (7 was issued with carbon credits), and 19 are at different stages of the project cycle. These projects concerns bio-fuels, energy efficiency, waste management, fuel switching and hydro-power, and include sectors such as manufacturing, mining, agriculture, energy, waste management, housing, transport and residential. Very few South African companies have been awarded carbon credits, and the public remain hesitant to take advantage of CDMs. Examples of CDM projects in South Africa are:
• The Kuyasa project based in the Khayelitsha settlement in Cape Town. The project involved retrofitting eight low-cost houses and two crèches with energy-saving devices such as insulated ceilings, low-watt bulbs and solar water heaters, saving almost 2.85 tons of CO2 each year. These buildings are 5% warmer in winter and 5% cooler in summer allowing a saving of up to 40% on electricity bills. In August 2004 the project was allowed to earn carbon credits. The project was also awarded joint third place at the global Point Carbon’s Best CDM Project 2004 Competition in Amsterdam.
• The eThekwini Municipality Landfill project aims to generate electricity through the fermentation of household waste. The methane released by the waste is then converted into electric power by generators. The project is expected to generate up to 10 Megawatts of electricity (enough to supply light to approximately 9000 homes). This will reduce the volume of coal burnt at city power stations, thereby reducing GHG emissions.
• More recently, Gold Fields’ Beatrix Mine in Welkom has been accorded CDM status. The project captures methane gas at source in the mine. The gas is then conveyed to the surface and then flared or used to generate electricity. It is expected that this activity will reduce the mine’s carbon emissions by 1.7 million tons of CO2 equivalent between 2011 and 2018. Gold Fields could earn up to R200 million from the sale of carbon credits that will be yielded from the Beatrix Mine project.
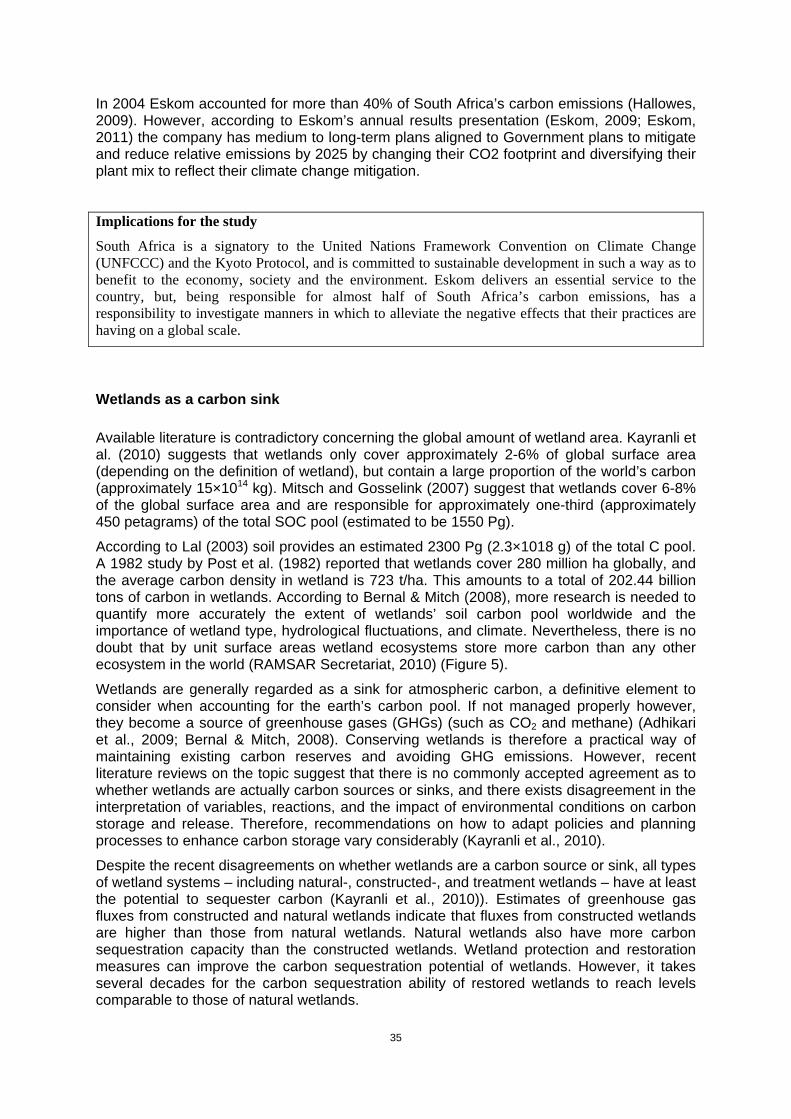
35
In 2004 Eskom accounted for more than 40% of South Africa’s carbon emissions (Hallowes, 2009). However, according to Eskom’s annual results presentation (Eskom, 2009; Eskom, 2011) the company has medium to long-term plans aligned to Government plans to mitigate and reduce relative emissions by 2025 by changing their CO2 footprint and diversifying their plant mix to reflect their climate change mitigation.
Implications for the study
South Africa is a signatory to the United Nations Framework Convention on Climate Change (UNFCCC) and the Kyoto Protocol, and is committed to sustainable development in such a way as to benefit to the economy, society and the environment. Eskom delivers an essential service to the country, but, being responsible for almost half of South Africa’s carbon emissions, has a responsibility to investigate manners in which to alleviate the negative effects that their practices are having on a global scale.
Wetlands as a carbon sink
Available literature is contradictory concerning the global amount of wetland area. Kayranli et al. (2010) suggests that wetlands only cover approximately 2-6% of global surface area (depending on the definition of wetland), but contain a large proportion of the world’s carbon (approximately 15×1014 kg). Mitsch and Gosselink (2007) suggest that wetlands cover 6-8% of the global surface area and are responsible for approximately one-third (approximately 450 petagrams) of the total SOC pool (estimated to be 1550 Pg).
According to Lal (2003) soil provides an estimated 2300 Pg (2.3×10¹⁸ g) of the total C pool. A 1982 study by Post et al. (1982) reported that wetlands cover 280 million ha globally, and the average carbon density in wetland is 723 t/ha. This amounts to a total of 202.44 billion tons of carbon in wetlands. According to Bernal & Mitch (2008), more research is needed to quantify more accurately the extent of wetlands’ soil carbon pool worldwide and the importance of wetland type, hydrological fluctuations, and climate. Nevertheless, there is no doubt that by unit surface areas wetland ecosystems store more carbon than any other ecosystem in the world (RAMSAR Secretariat, 2010) (Figure 5).
Wetlands are generally regarded as a sink for atmospheric carbon, a definitive element to consider when accounting for the earth’s carbon pool. If not managed properly however, they become a source of greenhouse gases (GHGs) (such as CO2 and methane) (Adhikari et al., 2009; Bernal & Mitch, 2008). Conserving wetlands is therefore a practical way of maintaining existing carbon reserves and avoiding GHG emissions. However, recent literature reviews on the topic suggest that there is no commonly accepted agreement as to whether wetlands are actually carbon sources or sinks, and there exists disagreement in the interpretation of variables, reactions, and the impact of environmental conditions on carbon storage and release. Therefore, recommendations on how to adapt policies and planning processes to enhance carbon storage vary considerably (Kayranli et al., 2010).
Despite the recent disagreements on whether wetlands are a carbon source or sink, all types of wetland systems – including natural-, constructed-, and treatment wetlands – have at least the potential to sequester carbon (Kayranli et al., 2010)). Estimates of greenhouse gas fluxes from constructed and natural wetlands indicate that fluxes from constructed wetlands are higher than those from natural wetlands. Natural wetlands also have more carbon sequestration capacity than the constructed wetlands. Wetland protection and restoration measures can improve the carbon sequestration potential of wetlands. However, it takes several decades for the carbon sequestration ability of restored wetlands to reach levels comparable to those of natural wetlands.

36
Davidson (2010) notes that when carbon storage capacity is related to surface area, wetlands store more carbon than other ecosystems, as illustrated in Figure 6.
Figure 6: The carbon stock in both plants and soils for different biomes (Davidson, 2010)
The role of wetlands in Carbon offsetting
Up until recently, interest in restoring ecosystems to reduce or offset greenhouse gas emissions focused mostly on forestry. It is only in recent years that this focus has shifted towards wetland ecosystems, particularly peatlands (DFN, 2010). As mentioned before, it is important to note that different types of wetland ecosystems sequester carbon more or less efficiently (DFN, 2010; Hansen, 2009; Bridgham, 2006). The Danone Group, in collaboration with the IUCN and the Ramsar Convention Secretariat, compiled an extensive report to document the potential offset of mangrove and other wetland systems. Their findings are in Table 5 as follows:

37
Table 5: Results of the comparative qualitative assessment for all types of wetlands (adapted from DFN (2010))
Mangroves Tidal saltmarshes
Tropical peat swamp forests
Temperate alpine and boreal forested wetlands
Carbon storage
Medium-High C storage per unit area, but low total globally
Medium-High storage per unit area, but low total globally
High C storage per unit area, but Medium globally by total area
Low-High C storage per unit area, and High globally by total area
Carbon sequestration rates
High C sequestration rates
High sequestration rates
Medium sequestration rates (but highly variable)
Low-Medium sequestration rates
Emissions Low trace gas emissions
Low trace gas emissions
Low trace gas emissions
Medium-High trace gas emissions
Restoration potential
High restoration potential (if hydrology functional), but Low emissions reduction globally from avoided degradation
Medium-High restoration potential, but Low for avoided degradation
Medium-High restoration potential; High potential for avoided degradation
Medium restoration potential; High avoided degradation potential
Ecosystem Services
High ecosystem services at community Level
Very High ecosystem service provision
Medium-High ecosystem service provision
Medium ecosystem services provision
Market development
Well positioned for market development
Positioning for market development is weak
Well positioned for market development
Good market positioning for some types
Potential for offset
Very High potential offset potential through restoration
High potential for offsets through restoration, but faces a current market gap
High offset potential, especially through avoided degradation
High offset potential, especially through avoided degradation, if there is effective management of trace gas emissions

38
As mentioned in the previous section, all analyses conclude that wetlands (even rehabilitated wetlands) have the potential to sequester atmospheric carbon in soils and plants. However, the wetlands' net effect on global warming potential is still uncertain (Hansen, 2009). While wetlands act as a carbon sink-reducing CO2 levels, other GHGs may be released (primarily methane (CH4) and nitrous oxide (N20)). A wetland's release of CH4 and N20 can more than offset the global warming potential of the CO2 it removes from the atmosphere. Bridgham et al. (2006) found no conclusive evidence that wetlands significantly alter the GHG stock of carbon. However, it is admitted that a lot of uncertainty surrounds the detail on releases of CH4 and N20 by wetlands.
Hansen (2009) developed a model with which to determine the viability of creating wetlands for carbon credits. He found that the economic potential of restoring wetlands for the sale of carbon offsets is limited, as the costs to rehabilitate the wetlands in his study exceeded per acre carbon sequestration values. Together, these results suggest that in most areas, creating wetlands for carbon offset production and sales is not likely to be economically viable for most landowners, especially for non-forested wetlands. However, if landowners were in the position to sell other wetland services such as water quality benefits, mitigation banking credits, or hunting rights in combination with carbon offsets, then creating wetlands might be profitable.
Implications for the study
The use of wetlands to sequester carbon for the purpose of carbon offsetting or trading is an attractive option. However, wetlands are unique, dynamic systems. Although a lot of research has been done on the sequestering potential of wetlands there are still uncertainties about whether we fully grasp the functioning completely.
Site Assessment vs. a Landscape Approach
The ability of a wetland to provide an ecosystem service such as water quality improvement, is reflected by landscape variables related to upstream and downstream land uses and land configurations (King et al., 2003), and therefore wetlands should not be viewed as isolated systems in the landscape, but rather as a response to broader environmental patterns. Wetlands are too often perceived as isolated from the larger ecosystems from which they form a part, whether it is aquatic or terrestrial. Riverine wetlands for example, are both sources (if degraded) and sinks of pollution, and should therefore be considered as a network of wetlands, rather than isolated patches in the landscape. Zedler and Kercher (2005) therefore propose that preserving and restoring wetlands to improve water quality requires a landscape approach, in order to find sites that can intercept a significant fraction of the water shed run-off. Riverine wetlands, for example, due to their extensive interface with uplands, have the capacity and opportunity for improving water quality (Brinson, 1988). On average at least 5% of temperate-zone watersheds should consist of wetlands in order to optimise ecosystem services derived from wetlands (Mitch and Gosselink, 2000). This figure will vary, however, depending on wetland type, catchment characteristics and water resource objectives. The authors therefore proposed that total wetland surface area required for optimising wetland functionalities, should be determined.
Turpie et al. (2010a) undertook a study to estimate the water treatment capacity of wetlands on a landscape scale in the South Western Cape. Samples were collected at over 100 points and analysed for a variety of water quality constituents. The authors obtained data from 19 water treatment works, which indicated that the average cost of removal of

39
ammonium nitrogen is in the order of R26 per kilogram. Based on this, the results from their study indicated that the average potential value of the wetlands in the study area is averaged R14 350 ha-1 yr-1 or a total of R328 million for the wetlands in the study area. The authors concluded that these values are high enough to compete with the alternative land uses that threaten the existence of wetlands. As such, wetlands should be given considerably more attention in land-use planning and regulation. The protection of wetlands in this context, especially in stressed catchments should be incentivised.
The reader is furthermore referred to the section in this document on the prioritisation of wetlands for rehabilitation, where wetlands and their ecosystem services reviewed are represented at several spatial scales, including on a catchment scale.
Implications for the study
The concept and methodology underlying the economic valuation of wetlands can be valuable tools for Eskom. Potential areas of application include: to quantify impacts on wetlands, wetland offsetting and banking as well as to analyse and quantify alternative options when proposed developments potentially impact on wetlands.
Such an assessment and valuation should however take place with due regard to the broader catchment characteristics and drivers of environmental change.
Wetlands on Eskom properties
Eskom has a national footprint (see Figure 2). Although the coal-fired power stations are concentrated in the eastern Highveld area, the power line and supporting infrastructure servitudes cover the country. The Eastern Highveld area is particularly rich in wetlands with wetlands covering an estimated 9.9% of the Upper Olifants River Catchment (Palmer et al., 2002). The power stations sited in this area are closely associated with wetlands. Two examples are shown in Figure 7a and b (Grootvlei PS and Matla PS).
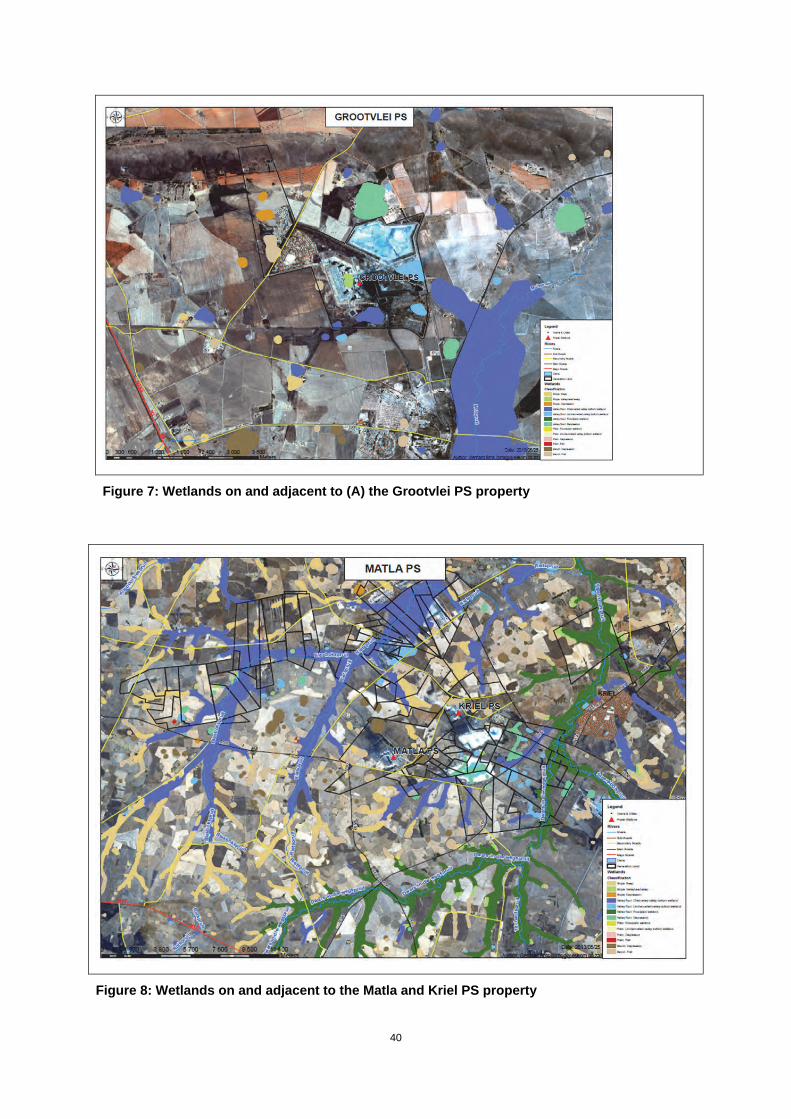
40
Figure 7: Wetlands on and adjacent to (A) the Grootvlei PS property
Figure 8: Wetlands on and adjacent to the Matla and Kriel PS property

41
An in-depth analysis of the wetlands on the Matla property is provided in Chapter 4.
The older power stations were established before the current legislation was promulgated. An exception to this is Kusile PS. A detailed wetland management strategy has been developed for the Kusile site which comprises 4 major sections – determination of the wetland baseline, avoidance of wetland impacts, mitigation of impacts and compensation. A key success factor of this strategy is the relationship between Eskom and Working for Wetlands, with an MOU having been signed between the two organisations. This document also takes cognisance of Eskom’s Land and Biodiversity Policy which states that
Eskom will ensure in the planning, construction, operation and decommissioning of
their activities, that measures are in place to limit the impact of its infrastructure, land
use and use of other resources on biodiversity and shall comply with all applicable
legislation (Harris et al., 2013).
Water Quality and Pollution Attenuation
The DWAF (1996: Vol 1) describes water quality to be the “physical, chemical, biological and aesthetic properties of water which determine its fitness for a variety of uses and for protecting the health and integrity of aquatic ecosystems. Many of these properties are controlled or influenced by constituents that are either dissolved or suspended in water”.
Water having the unique chemical property of polarity and hydrogen bonds, can dissolve; absorb; adsorb or suspend numerous compounds (including toxic compounds), thus losing its purity (Momodu and Anyakora, 2010). These compounds can be acquired from sources such as the surrounding environment; anthropogenic activities; animals and other biological activities (Momodu and Anyakora, 2010). The materials that are dissolved or suspended in the water may originate from point and non-point sources.
Point and non-point sources
Point sources are those sources which discharge a stream through a defined discharge point and these discharges tend to be continuous with little variability in the environment (Carpenter et al., 1998). Contaminants from point source discharges and their chemical concentrations can be measured and monitored at a specific point of release, and these can then be regulated and treated at the source (Carpenter et al., 1998). Examples of point sources are industrial and municipal wastewater effluent, runoff and leachate from waste disposal sites, runoff and groundwater infiltration from animal feedlots, runoff from mines, construction sites and oil fields, and sewers (Carpenter et al., 1998).
Non-point sources (which originate from a number of activities that stretch across the landscape) are those sources of contaminants that have been diluted by rainfall (which is already considered as impure) and thereafter drain into water bodies as overland flow, groundwater seepage or through precipitation from the atmosphere (Wanielista et al., 1977; Carpenter et al., 1998). Non-point sources are more difficult to control as they, by definition, they cannot be treated at source unless they can be collected. The sources of these contaminants, which can be from the natural environment (generally inorganic compounds) or from man-made pollutants which are from industries (inorganic or organic compounds), are difficult to trace and may have a greater detrimental effect on the quality of water (Wanielista et al., 1977). Non-point sources can be from either rural or urban regions where, for instance, agricultural pollutants (pesticides, fertilizers and other chemicals) are used in both subsistence and commercial farming (Wanielista et al., 1977). Pollutants from urban areas include solid wastes, organic chemicals, street surface contaminants (heavy metals, nutrients, pesticides, bacteria dirt and dust), and air and vehicle pollutants; where these may vary in quantity and their distribution (Wanielista et al., 1977). According to Williamson and

42
Morrisey (2000), the cumulative effects of non-point source pollution in these aquatic ecosystems are of great concern. The use of indicators is a method of measuring amounts of pollutants, including long term anthropogenic activities such as mining activities (Jumbe and Nandini, 2009); and measures the health and integrity of water by measuring the ‘fitness for use’ (DWAF, 1996).
Implications for the study Eskom point and non-point sources include amongst others:
• Seepage from ash dams and coal storage areas directly into the groundwater and surface water systems
• Surface runoff from mines and power stations
• Acid Mine Drainage from coal mining operations Seepage and overflows from unlined pollution containment dams and maturation ponds
Water quality indicators
Biological, chemical, and environmental indicators have been developed by researchers for sustainable natural resource management and these are used as “early warning” signals (Reed and Dougill, 2002). These “early warning” signals are shown by changes in the natural environment (Reed and Dougill, 2002) and these indicators that are measured tend to be more for harmful changes or degradation to the natural environment. According to Noble et al. (2003), “different indicators and different indicator levels identified as standards are used by water quality programs in different states, countries, and regions”. These are also a quantitative measure of the pressures on the state of the environment and its changes, which use spatial and temporal evaluation criteria (da Silva and Rodrigues, 2004). In South Africa, The Department of Water Affairs and Forestry have developed criteria that list the critical levels of water quality indicators. These are used to measure the ‘fitness for use’ of the water for different categories of users. These levels vary slightly depending on the water body being tested, such as estuaries, freshwater environments, water at industrial sites, water for recreational use, for irrigation, and most importantly the critical limits for domestic use and drinking purposes. Some examples of indicators are levels of pH, Temperature, Dissolved Oxygen (DO), Turbidity, Specific conductivity or Total Dissolved Solids (TDS), Nitrates, and Chloride and Ammonium concentrations, and heavy metals. These guidelines are available in the DWAF South African Water Quality Guidelines of 1996.
Nutrients and heavy metals
Human impacts have also altered cycles such as the biogeochemical cycles, where anthropogenic influences have effected changes in Nitrogen (N), Phosphorous (P), and Carbon (C) cycles (Smith et al., 1999). Due to an increase in the use of agricultural fertilizers, N and P compounds have increased in ecosystems, and the total amount of N and P exported from the surface in runoff increases linearly with the N and P soil content (Smith et al., 1999). Humans use flowing waters as convenient wastewater disposal systems therefore the loading of N and P to the world's rivers, lakes, and oceans is thus very strongly influenced by human population densities, the population densities of livestock, and land use (Smith et al., 1999).
Nutrients, total dissolved or suspended solids, sulphates and heavy metals are present in aquatic ecosystems at varying concentrations (DWA, 2000; Coleman et al., 2011), where increases in nutrient concentrations affect the natural balance of aquatic ecosystems and

43
often result in eutrophication and degradation (DWA, 2000). Nutrients are transported from terrestrial to aquatic systems as dissolved pollutants in runoff (from agriculture, industry, urban runoff, domestic wastewater, and landfill leachate) or as particles in runoff as particulate pollutants (pollutants mobilised with soil particles through adsorption) (DWA, 2000). Heavy metals are widespread, non-degradable pollutants that are toxic and persistent in the environment (Jumbe and Nandini, 2009). Heavy metals have detrimental consequences on aquatic life and humans that utilize polluted water sources. Heavy metals enter water bodies and contaminate sediments via natural sources such as eroded minerals within sediments; leaching of ore deposits; volcanism extruded products, and terrestrial runoff; or via anthropogenic activities such as, solid waste disposal; leachate from landfills; industrial or domestic effluents; and harbour channel dredging (Zheng et al., 2008; Momodu and Anyakora, 2010). Simple engineering options that may improve the effects of pollution arising from these sources include (DWA, 2000):
• Riparian buffer zones
• Constructed wetlands
• Existing wetlands
• Drainage ditch management
• Vegetated filter strips
• Hedges
These basic ecological engineering options alter hydrological pathways so that water is directed through existing wetlands. Features such as oxbow lakes and other former channels on floodplains may greatly increase their nutrient and pollutant removal functions (DWA, 2000).
Implications for the study
An increase in pollutants can lead to the degradation of wetlands by accelerating the degradation of wetland health. Wetlands will be able to sustain themselves by attenuation for a period of time until critical limits and levels of pollutants have been reached. Wetland water quality should be monitored continuously (using South African DWS water quality guidelines) to minimise degradation so that they can continue to supply humans with the services from which we benefit.
Acid mine drainage (AMD)
Acid mine drainage (AMD) is the generation of acid caused by the exposure of rock containing certain sulphide minerals (most commonly Iron pyrite (FeS2)) with air and water, resulting in the production of highly acidified water containing elevated concentrations of sulphate and metals (Keet, 2010). This can be recognised by a yellow/orange/brown tint to waters. In South Africa AMD is largely associated with gold and coal mining (Keet, 2010).
Risks associated with AMD (Keet, 2010):
• Harmful to ecosystems, presenting a massive environmental challenge
• Negatively impacts on quality of water resources
• Flooding and Decanting from disused mines
• Discharge does not meet water quality standards, but this shows no immediate threat (lag in environmental effects)
• Flooding of the Basin or catchment

44
• Effects to human and animal life
• Sinkholes in dolomitic areas
• Destruction of heritage value
• Difficulty for mines to achieve compliance with water quality standards within short time periods.
Short-term solutions are those that will prevent the rise of water levels in mine voids from exceeding the Environmental Critical Level (ECL is the highest water level in the mine void which can be allowed without the mine water negatively impacting on the shallow ground water aquifers and the surface water resources) (DWA, 2012). These short-term solutions to AMD as suggested by The Department of Water Affairs (DWA, 2012) include:
• The installation of pumps to extract AMD from mines to on-site treatment plants
• The construction of on-site water treatment plants in each basin, with the option of refurbishing and upgrading existing treatment facilities owned by the mines
• The installation of infrastructure to convey treated water to discharge into nearby watercourses.
The DWA has recently engaged in a key stakeholder and communication session and together they have developed a feasible long-term solution to AMD problems. This feasible solution will be one that is technically sound, environmentally sustainable, economically viable, institutionally feasible & legally acceptable (DWA, 2013). Figure 9 below explains the planning required for long-term solutions and will, to a large extent, be informed by existing information, monitoring initiatives, technical input and expert advice.
Figure 9: Planning and design for AMD long-term solutions (DWA, 2013)
This long-term solution has been designed to include all Interested and Affected Parties (I&APs) within an EIA process with the following objectives in mind:
• To undertake focused consultation with identified key stakeholders and stakeholder sectors/groups to assist in identifying sustainable solutions, technical options, management scenarios
• To engage identified key stakeholders in various relevant fields throughout the study, to obtain their input and comments on concepts, principles, and assessments of alternatives

45
• To assist the DWA to keep the wider stakeholder group informed of progress and key outcomes and to provide opportunities for constructive input to inform the feasibility study
• To communicate information to the wider stakeholder group in a manner that enhances their understanding of the AMD challenge and enables them to provide constructive inputs
• To record stakeholder input for consideration in informing the feasibility study.
Implications for the study
Eskom may need to use temporary short-term solutions as an intervention to possible AMD problems at their mines and/or power stations. Long-term solutions will need to be developed through feasibility studies and EIA processes and should include all the necessary stakeholders. This ensures for sufficient quality control processes to be put into place and thus reducing the volume of pollutants downstream.
Case study of the Vaal River
The Integrated Vaal River System is the largest in South Africa and 60% of the country’s Gross Domestic Product is derived within this catchment. Therefore, subsistence and commercial users rely heavily on the ecosystem services provided by the catchment, one important service being the provision of water (Eon, 2012). This has been able to happen thus far as the water quality and its related pollution concentrations have not reached critical levels. A number of industries rely on this catchment for water and 90% of Eskom’s base load generation comes from the Vaal (Eon, 2012). Currently the Vaal is experiencing water quality and seasonal flow problems. Water quality issues include eutrophication, microbial pollution, and increased salinity. This system requires intervention by at least 2014 to prevent water shortages (Eon, 2012).
Pollution attenuation
Wetlands are known to provide “sinks” for pollutants (including nutrients and metals). This is also known as pollution attenuation. The capacity for pollutant removal largely depends on the size of the wetland and the inputs received by the wetland which are related to their position along hydrological pathways (DWA, 2000). Wetlands can attenuate pollution when the input load of pollutants into a wetland is still below critical level. Wetland functioning can ensure the following (DWA, 2000):
• Acting as a sediment sink for deposited suspended solids and particulate-bound pollutants, including a proportion Chemical Oxygen Demand (COD)
• Denitrification processes that reduce NOx to nitrogen
• Providing a medium for chemical ionic interchange at the surface and sub-surface layer (precipitation and adsorption)
• Provide the physical separation of particulates and particulate-bound pollutants from water at the sub-surface layer
• Reduce spray drift attenuation (attenuation of chemicals (such as those used in agriculture) that are transported by wind to wetlands)
• Assimilation of metals and nutrients by plants and other organisms (e.g. microbes).
Pollution attenuation can, therefore, improve the quality of water leaving the wetland. Some of the mentioned processes are seen in Table 6 below.

46
Table 6: Pollution attenuation processes to improve water quality (DWA, 2000)
Pollution type Removal process
BOD/COD Oxidation
Absorption
Filtration/sedimentation
Microbial decomposition
Suspended solids/sediment Filtration/sedimentation
Nitrogen/nitrogen compounds Adsorption
Assimilation/absorption
Amonification-nitrification-denitrification
Phosphorus/Phosphorus compounds Sorption/adsorption
Bioaccumulation/absorption
Ionic precipitation
Particulate retention
Hydrocarbons and heavy metals Absorption
Caption exchange
Bioaccumulation/absorption
Sulphur Microbial oxidation or reduction
Bacteria Adsorption
Predation
Sedimentation
Sterilisation by UV light
Iron and manganese Oxidation and precipitation
Implications for the study
Eskom should direct their efforts into protecting their wetlands as these can improve water quality and reduce environmental degradation through natural measures. Efforts should involve assessing the current wetland health (assessing hydrology, geomorphology, and vegetation) and then implementing rehabilitation or restoration method with continuous monitoring thereafter. Constructed wetlands and measuring offsets can be considered if existing wetlands are beyond rehabilitation interventions.
Sustainable Livelihoods and Economic Opportunities for Surrounding Communities
Approaches with reference to sustainable livelihoods have been developed by several global organisations (e.g. DFID) in a response to poverty alleviation policies in the late 1990’s. These approaches encompass all aspects impacting on poverty levels in its broadest sense, and include education, health, financial services, security and natural resources. These aspects have been described as five types of capital, and include (Turpie, 2010b):

47
• Human Capital includes the levels of skills, knowledge, ability to work and level of health.
• Social Capital includes the strength of networks and connectedness, membership in groups and exchange relationships.
• Financial Capital includes the available stocks of, and regular inflows of, money.
• Physical Capital is the infrastructure, utilities, energy, technologies, access to information and tools and equipment.
• Natural Capital comprises the natural resource stocks, public goods such as biodiversity, air quality, and divisible goods such as land and trees.
Livelihoods are considered as sustainable when the above capital can cope with and recover from stress without undermining the natural resource base. Many communities in South Africa are directly dependent on natural systems to sustain their livelihoods. Wetlands in particular are valuable because of the services they provide for example providing grazing, fertile soil for the cultivation of crops, protein sources and material for thatching. It is therefore imperative to understand the degree of dependence of people’s livelihoods before making decisions that may impact on the sustainability of their livelihoods (Turpie, 2010b).
Turpie (2010b) developed a simple index for the assessment of the importance of a wetland for the sustainable livelihood of communities surrounding a wetland. The assessment is based on the degree to which a wetland contributes to reducing the vulnerability of households to poverty. These more vulnerable households would be more dependent on the wetland in question. Figure 10 below provides an overview of the Wetland Livelihood Value Index.
Figure 10: Overall structure of the Wetland Livelihood Value Index. Numbers in circles correspond to steps in the assessment process after step 1 (defining objectives and level of assessment (Turpie, 2010b))

48
Implications for the study
The relative importance of wetlands should include an investigation into the reliance of surrounding communities for their livelihood on wetlands that may be impacted by mines associated with Eskom’s supply chain. In some instances, continued access to land to continue using the services that wetlands provide, will impact positively on sustainable livelihoods of communities reliant on wetland services. At the same time, the sustainable use of wetlands provides opportunities for wetland conservation whilst balancing corporate social responsibilities.
The compilation of a Management plan for wetlands associated with sustainable livelihoods will promote wise and sustainable use.
Indicators and early warning systems
According to the DPSIR framework (Drivers, Pressure, State Impact and Response Framework) there is a sequence of causal links between the stimulus causing a situation, the state of the system under consideration resulting from the pressures exerted by the stimulus, the impact on the system and the appropriate management response. This framework presents a structure within which all monitoring and indicators should be placed (see Figure 11, Kristensen, 2004). Placement within the framework indicates the relationship between the individual indicator and the change being monitored.
Figure 11: The DPSIR assessment framework (from Kristensen, 2004)
The understanding provided by the framework enables the link between the origin and consequence of a problem to be identified and so any planned interventions may effectively address the cause. In addition, it makes clear the relationship of how an indicator in one sector, say the state, addresses a driver or pressure.
The following examples from each of the categories of the DPSIR framework are taken from Kristensen (2004). A ‘driving force’ is a need, such as shelter, food, water and entertainment for an individual. In the industrial sector it may be the need to remain profitable, for instance. Driving forces lead to human activities such as food production, transport, the need for power, etc., which exert pressures on the environment. The state of the environment (e.g. the bio-physical and chemical components of the air, water, soil, etc.) is affected by these

49
pressures. These in turn impact on the health of humans and the environment. The response may address the causal chain at any point and interventions may be in the form of, for instance, policy or remedial action.
The DPSIR framework is used in the South African State of the Environment Reporting as it is viewed as providing a systems-analysis view of the relations between the environmental system and the human system (SOER, 2005).
Implications for the study
The DPSIR model is a useful tool to guide monitoring and record keeping requirements enabling an advance warning system.
The data sheets of the Eskom field guide (field sheet and score sheet) provide the basis for a monitoring programme but have not been arranged within the DPSIR framework.
Indicators are a reflection of a given situation or variables that help to measure change or progress in achieving objectives and reaching targets. If measured sequentially over time, indicators can indicate the direction and speed of change and can also be used to compare different areas or groups of people with respect to the existence of a given situation. The ideal indicator is:
• Valid (measures what it is supposed to measure)
• Objective (gives the same answer whenever it is applied)
• Sensitive (sensitive to changes in the situation)
• Specific (reflects only changes in the situation).
A hierarchy of indicators to establish the temporal and spatial trends in wetland ecosystems, the habitats provided and the species inhabiting the wetlands is presented in Volume 13 of the Ramsar Handbooks for Wise Use (2010). These indicators are designed to assess the pressures and threats to wetlands and to respond to or address these. The Ramsar convention has worked closely with the Convention for Biodiversity to develop indicators which track biodiversity changes, including the following:
• Trends in extent of selected biomes, ecosystems and habitats
• Trends in abundance and distribution of selected species
• Change in status of threatened species
• Trends in genetic diversity of domesticated animals, cultivated plants, and fish species of major socio-economic importance
• Coverage of protected areas
• Criteria and indicators for sustainable management of ecosystems
• Biodiversity used in food and medicine
• Water quality in aquatic ecosystems
• Trophic integrity of ecosystem
• Nitrogen deposition
• Numbers and cost of alien invasions.
Some of these indicators are relevant to the scale at which Eskom works and would need to be made specific to Eskom’s needs. At a broad level, the initial tranche of effectiveness indicators, as determined by Ramsar, is given in Table 7.

50
Table 7: Effectiveness indicators for wetland health (Ramsar Vol. 9, 2010)
Indicator Sub-indicator(s)
A. The overall conservation status of wetlands
i. Status and trends in wetland ecosystem extent
ii. Trends in conservation status – qualitative assessment
B. The status of the ecological character of Ramsar Sites
i. Trends in the status of Ramsar Site ecological character – qualitative assessment
C. Trends in water quality i. Trends in dissolved nitrate (or nitrogen) concentration
ii. Trends in Biological Oxygen Demand (BOD)
D. The frequency of threats affecting Ramsar Sites
i. The frequency of threats affecting Ramsar Sites – qualitative assessment
E. Wetland sites with successfully implemented conservation or wise use management plans
i. Wetland sites with successfully implemented conservation or wise use management plans
F. Overall population trends of wetland taxa
i. Trends in the status of water bird biogeographic populations
G. Changes in threat status of wetland taxa
i. Trends in the status of globally-threatened wetland-dependent birds
ii. Trends in the status of globally-threatened wetland-dependent amphibians
H. The proportion of candidate Ramsar Sites designated so far for wetland types/features
i. Coverage of the wetland resource by designated Ramsar Sites
Implications for the study
A number of indicators are to be found in the literature, each of which has been designed to monitor specific conditions. Certain indicators may be developed which will be generic to Eskom Holdings Ltd, for example the presence (with density) or absence of alien invasive biota. Other indicators will need to be developed to suit specific conditions which may be linked to ecoregions or other features specific to the area.

51
Once appropriate indicators have been selected these should be included in a monitoring programme. The Ramsar framework provides, in a series of logical steps, the design and planning of a monitoring programme (see Figure 12). This is not prescriptive and may be adapted as appropriate to the need (Ramsar Wise Use of Wetlands, Vol 18, 2010).
In order to ensure that a monitoring programme is effective it should be included within the framework of Strategic Adaptive Management (SAM) as described by Pollard and du Toit (2007) (see the following section titled ‘Adaptive Management’).
Figure 12: The generic design of a monitoring programme as given by Ramsar Convention (Wise Use Handbook 18, 2010). This is not prescriptive and should be adapted as required
The Eskom field guide provides Eskom’s field workers with a standard procedure for assessing wetlands on their property. This procedure combines the wetland physiognomy (determined remotely) with field measurements such as vegetation and soil to complete a scorecard which will then provide a numerical score of the wetland condition. A monitoring and management programme could be based on the criteria measured in the Eskom Wetland Classification and Risk Assessment Field Guide (Oberholster et al., 2014).

52
Adaptive Management
“Adaptive management” was first introduced to the sphere of natural resource management by Holling (1978) with his concept of “Adaptive Resource Management”. Adaptive management has been defined by Rogers and Lutton (2011) (quoting Meffe et al. (2002)) as: “The process of treating resource management as an experiment such that the practicality of trial and error is added to the rigour and explicitness of the scientific experiment, producing learning that is both relevant and valid”.
Adaptive management may be practised with different levels of rigour which are broadly categorised as follows:
• Active (classic or true) adaptive management in which the emphasis is strongly on the scientific method, the process of “experiment” and on modelling
• Passive adaptive management in which there is much less emphasis on the scientific method/experiment and more on learning by a range of means/tools
• Documented trial and error in which there is no stipulated structure to the decision making process but what does happen and its consequences are nonetheless well documented.
Strategic Adaptive Management (SAM) as defined by from Biggs and Rogers (2003) and adapted by Pollard and du Toit (2007) falls under a) active adaptive management as described above, and one requirement is that each step is fully documented to allow for assessment of the achievement of the objectives during the review provided by the feedback loops. The SAM process is structured to guide a ‘learning by doing’ process through which there is an on-going assessment of effectiveness of the overall management programme, encouraging the refinement of the goals of management based on the results of management interventions as indicated by the monitoring programme. The basic steps in SAM are (from Pollard and du Toit 2007):
1. Visioning. Understand, with stakeholders, the social, economic and ecological context of the system to be managed, and the principles/values that guide management. Develop a broadly acceptable vision of the future.
2. Translate vision into ecosystem targets. Develop an objectives hierarchy that documents the sequential reasoning used in translating a broad societal values-based vision into science-based ecosystem outcomes.
3. Options analysis:
3.1. Scope the range of management options to achieve the desired future conditions and predict their likely outcomes under different scenarios. Expect the unexpected.
3.2. Assess the acceptability of outcomes from a range of perspectives 3.3. Select the best options in co-operation with stakeholders.
4. Operationalise (implement, monitor and audit achievements). 5. Reflect at each step. Is thinking and action congruent with principles/values? What does
the knowledge gained tell us about (1) our understanding of the system, (2) its responses and, (3) how realistic are the desired outcomes and (4) how useful are the processes used to achieve them.
The process is outlined in Figure 13, which indicates the feedback loops which provide the review of the process. The same principle is recommended by Kotze (2004) for use by the Mondi Wetland Project, providing a structured review process for assessing the achievement of the stated objectives.

53
Figure 13: A framework for strategic adaptive management showing the 5 key steps (from Biggs and Rogers, 2003, adapted by Pollard and du Toit, 2007)
Implications for the study
Given that the overall aim of this project is to develop and test an adaptable planning framework that streamlines the conservation of wetlands in areas where Eskom operates from coal to customer, it is proposed that Eskom follows an active adaptive management process to ensure on-going improvement of and maintaining the relevance of this Wetland Management Framework (WMF).
The steps of the framework should be reviewed and refined as necessary as the framework is implemented.

54
Wetland Health Assessment
Wetland health is used to determine the ecophysical health or condition of the wetland; to understand if they are beyond repair, if they require rehabilitation and management interventions, or if they are healthy enough to be left alone due to little degradation (Macfarlane et al., 2009). Wetlands are measured by their similarity to or deviation from their natural characteristics, that is, the climate, geology, soil, water, nutrient supply, and radiant energy, together with its biotic community. If they have not been modified or experienced levels of disturbances from human impact, they are regarded as “natural” or “reference condition” (Macfarlane et al., 2009: 17). Wetland health is also assessed to determine the degradation factors so that appropriate intervention methods can be designed. Wetland health can be assessed at both the broad catchment level and the detailed individual wetland level based on field assessments and indicators.
When conducting health assessments, the objectives and the geographical boundaries need to be clearly defined (assisted by using GIS, orthophotos or topocadastral maps) and available resources such as:
• Possible land uses and their extent in the catchment area
• Presence of drains
• Dams or erosional features (including details such as depth, etc.)
• Loss of vegetation
• Types of indigenous or alien vegetation
• The mean annual precipitation and potential evapotranspiration (Macfarlane et al., 2009).
Wetland Health indicators:
The Water Research Commission is currently funding the design of a National Wetland Monitoring Programme for South Africa (WRC project number K5/2269). The following review of indicators covers the current South African situation, but the National Wetland Monitoring Programme, scheduled to be completed in early 2016, is likely to become the national benchmark for wetland monitoring.
Wetland health can be assessed by measuring indicators such as geomorphology, hydrology and vegetation. These assist for wetland rehabilitation and their planning and assessments (Macfarlane et al., 2009). Assessments of the geomorphology, hydrology and vegetation of wetlands may vary from the “present” ecological state (PES) to the “critically altered” state (categories A-F, with A being unmodified and F being at critical level) (see Table 8 below), as well as measuring them against the Trajectory of Change, that is, the threat or vulnerability to change (Macfarlane et al., 2009) (see descriptions below).

55
Table 8: Impact scores and Present State category describing the integrity of wetlands
Impact category
Description Impact score range
Present State category
None Unmodified, natural 0-0.9 A
Small Largely natural with modifications. A slight change in ecosystem processes is discernible and a small loss of natural habitats and biota may have taken place.
1-1.9 B
Moderate Moderately modified. A moderate change in ecosystem processes and loss of natural habitats has taken place but the natural habitat remains predominantly intact.
2-3.9 C
Large Largely modified. A large change in ecosystem processes and a loss of natural habitat and biota and has occurred.
4-5.9 D
Serious The change in ecosystem processes and loss of natural habitat and biota is great but some remaining natural habitat features are still recognizable.
6-7.9 E
Critical Modifications have reached a critical level and the ecosystem processes have been modified completely with an almost complete loss of natural habitat and biota.
8-10 F
The Trajectory of change can also be scored in a “class range” to calculate the weighted score (see Macfarlane et al., 2009).
Measuring wetland health is symbolic as it is difficult to measure and compare similarities or differences to other wetlands as each wetland is a unique ecosystem. Wetlands are dynamic and respond to temporal changes – whether these are weekly, daily, seasonally, over longer periods due to climatic changes, or over geological and geomorphological evolutionary time scale. The range of these changes consequently makes functional, structural and compositional assessments difficult (Macfarlane et al., 2009). Therefore assessments can be done by measuring the hydrology component (which can measure for impacts due to the quantity and distribution in impacted or unimpacted states); as well as the geomorphology and vegetation components which can be used as indicators as they are visible and measurable. Geomorphology indicators can measure soil erosion and vegetation can measure alien invasive species or ruderal species (species adapted to rapidly colonize sites with disturbed soils). Measurable indicators need to take into account the differences between natural versus anthropogenic factors (Macfarlane et al., 2009). Ruderal species typically increase in abundance on disturbed sites but are gradually replaced by successional species as the site recovers.
The impact of hydrology, geomorphology and vegetation are scored quantitatively and measure the intensity and extent of impacts to result in the allocation of a score. The
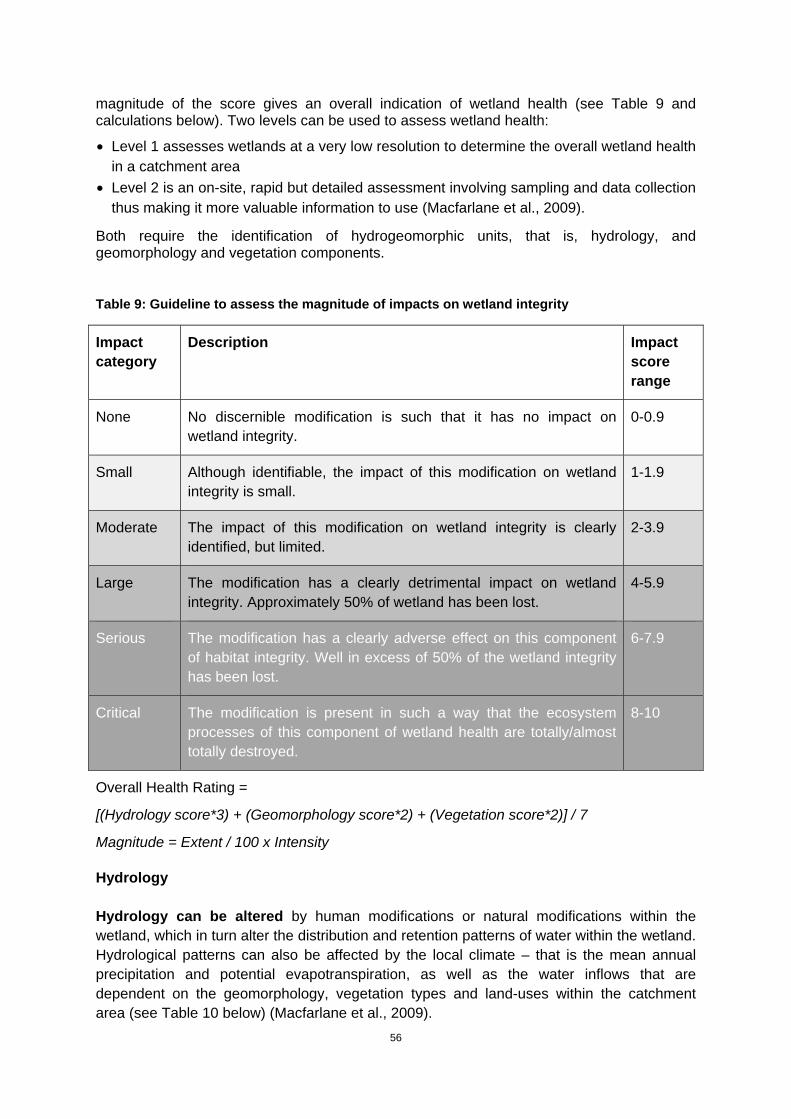
56
magnitude of the score gives an overall indication of wetland health (see Table 9 and calculations below). Two levels can be used to assess wetland health:
• Level 1 assesses wetlands at a very low resolution to determine the overall wetland health in a catchment area
• Level 2 is an on-site, rapid but detailed assessment involving sampling and data collection thus making it more valuable information to use (Macfarlane et al., 2009).
Both require the identification of hydrogeomorphic units, that is, hydrology, and geomorphology and vegetation components.
Table 9: Guideline to assess the magnitude of impacts on wetland integrity
Impact category
Description Impact score range
None No discernible modification is such that it has no impact on wetland integrity.
0-0.9
Small Although identifiable, the impact of this modification on wetland integrity is small.
1-1.9
Moderate The impact of this modification on wetland integrity is clearly identified, but limited.
2-3.9
Large The modification has a clearly detrimental impact on wetland integrity. Approximately 50% of wetland has been lost.
4-5.9
Serious The modification has a clearly adverse effect on this component of habitat integrity. Well in excess of 50% of the wetland integrity has been lost.
6-7.9
Critical The modification is present in such a way that the ecosystem processes of this component of wetland health are totally/almost totally destroyed.
8-10
Overall Health Rating =
[(Hydrology score*3) + (Geomorphology score*2) + (Vegetation score*2)] / 7
Magnitude = Extent / 100 x Intensity
Hydrology
Hydrology can be altered by human modifications or natural modifications within the wetland, which in turn alter the distribution and retention patterns of water within the wetland. Hydrological patterns can also be affected by the local climate – that is the mean annual precipitation and potential evapotranspiration, as well as the water inflows that are dependent on the geomorphology, vegetation types and land-uses within the catchment area (see Table 10 below) (Macfarlane et al., 2009).
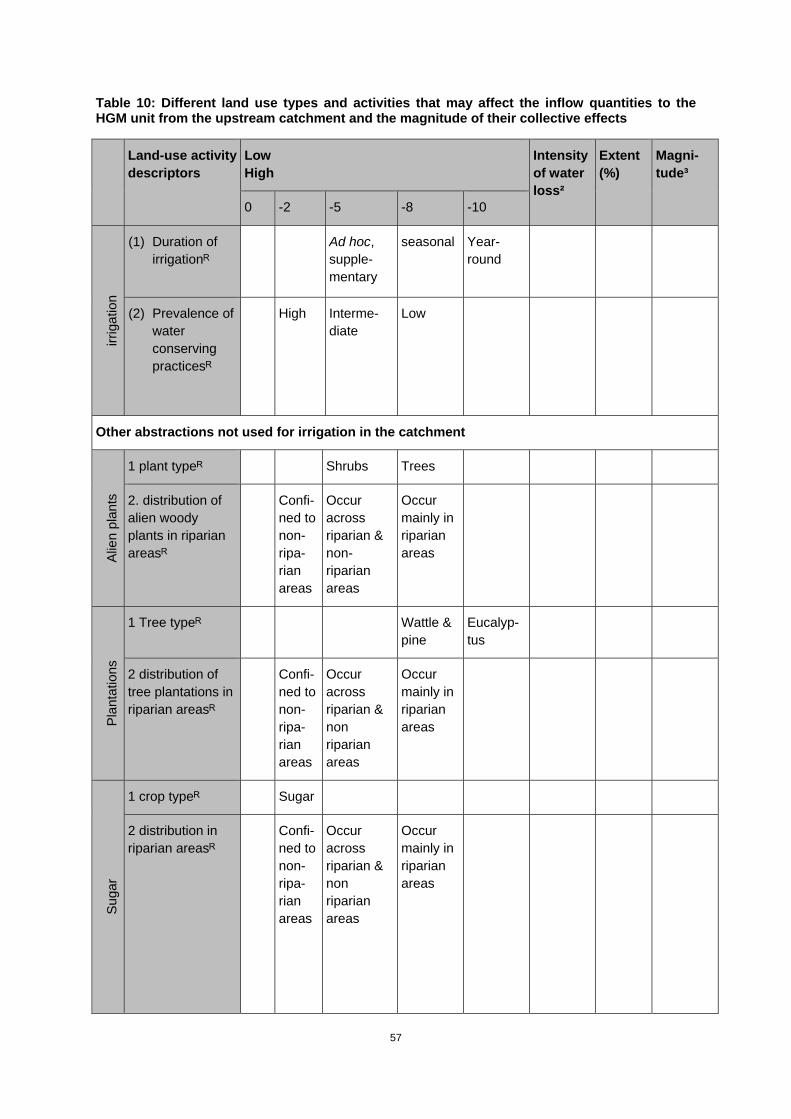
57
Table 10: Different land use types and activities that may affect the inflow quantities to the HGM unit from the upstream catchment and the magnitude of their collective effects
Land-use activity descriptors
Low High
Intensity of water loss²
Extent (%)
Magni-tude³
0 -2 -5 -8 -10
irrig
atio
n
(1) Duration of irrigationᴿ
Ad hoc, supple-mentary
seasonal Year- round
(2) Prevalence of water conserving practicesᴿ
High Interme-diate
Low
Other abstractions not used for irrigation in the catchment
Alie
n pl
ants
1 plant typeᴿ Shrubs Trees
2. distribution of alien woody plants in riparian areasᴿ
Confi-ned to non-ripa-rian areas
Occur across riparian & non-riparian areas
Occur mainly in riparian areas
Pla
ntat
ions
1 Tree typeᴿ Wattle & pine
Eucalyp-tus
2 distribution of tree plantations in riparian areasᴿ
Confi-ned to non-ripa-rian areas
Occur across riparian & non riparian areas
Occur mainly in riparian areas
Sug
ar
1 crop typeᴿ Sugar
2 distribution in riparian areasᴿ
Confi-ned to non-ripa-rian areas
Occur across riparian & non riparian areas
Occur mainly in riparian areas

58
Land-use activity descriptors
Low High
Intensity of water loss²
Extent (%)
Magni-tude³
0 -2 -5 -8 -10
Dams: specific allowance for releasing low flows within the operating rules of the damᴿ
Allow-ance made
No allowance made
a. Wetland Draining
Several factors affect wetland draining. These include:
i. Wetland slopes – The steeper the slope of the wetland, the more efficiently the water drains from the wetland through the drains; and
ii. Hydraulic conductivity – A greater hydraulic conductivity of wetland soils can lead to a more effective drainage of removing sub-surface water from the wetland. If the wetland has mineral soil then the hydraulic conductivity is approximately measured on soil texture. If the HGM unit has peat (organic) soil, then the hydraulic conductivity is based on the degree of humification of the soil. Finer soil texture has smaller pore spaces between the particles, therefore water moves through the soil at a slower rate. Similarly, the more humified the peat, the finer the particles of organic matter, and the slower the water moves through the soil (Macfarlane et al., 2009).
b. Level of Wetness
Wetlands can also be affected by the level of wetness:
i. The greater the natural level of wetness of the wetland prior to any artificial drainage or gully erosion, the greater the potential for the area to be much drier due to artificial drains or erosion gullies. The natural level of wetness can generally be estimated by referring to a comparable unaltered wetland, but this may sometimes be impossible;
ii. Drains and gullies affect sub-surface flow – the deeper the drains and gullies in the affected area, the greater the potential of the drain and gully network to intercept sub-surface flow and to lead intercepted flow (sub-surface and surface) out of the wetland. The greater the density of drains, the more likely they are to effectively desiccate the section of wetland in which they occur; and
iii. Dams, weirs and poorly constructed road crossings can cause unnatural retention of water and reduce flow into a wetland. These affect the hydrological integrity of the wetland (see Table 11 and Table 12 below) (Macfarlane et al., 2009).

59
Table 11: Factors potentially contributing to an increase or decrease in the flood peak magnitude and/or frequency received by the HGM unit
Level of reduction
Low High
Score
0 -2 -5 -8 -10
1. Collective volume of dams in the wetland’s catchment in relation to mean annual runoff (MAR)ᴿ*
<20% 20-35% 36-60% 60-120% >120%
2. Level of abstraction from the damsᴿ
Low Moderately low
Intermediate Moderately high
high
3. Specific allowance for natural floods within the operating rules of the damᴿ**
Good allowance made
Moderate allowance
Limited allowance
Poor allowance
No allowance
Level of increase***
Low High
Score
0 +2 +5 +8 +10
4. Extent of hardened surfaces in the catchmentᴿ
<5% 5-20% 21-50% 50-70% >70%

60
5. Extent of areas of bare soil in the wetland’s catchment including that associated with poor veld conditionᴿ***
<10% 11-40% 41-80% >80%
Combined sore: [Average of (1), (2) and (3)] + [(4) + (5)]****
The combined score will be the range from -10 to +10 depending on whether the increases in peak flow are greater or smaller than the decreases.
*MAR – mean annual rainfall (m3) = [runoff (mm) / 1000 (m)] x [catchment area (ha) x 10 000 (m2)]
Table 12: Typical changes in water distribution and retention patterns within an HGM unit as a result of obstructions
1.Upstream impact of flooding
Extent of HGM unit affected by flooding upstream of the impeding structureᴿ
ha %
Descriptor Low High
Score
0 2 5 8 10
1.Representation of different hydrological zones prior to flooding by the damᴿ
- Seasonal and perma-nent zone both present and collective-ly >30%
Permanent and seasonal zones both present but collectively <30%
Seasonal zone present but permanent zone absent
Permanent and seasonal zones lacking (i.e. only the temporary zone present)
Intensity of impact: score of (1) X 0.8*
Magnitude of impact score: extent of impact/100 x intensity of impact

61
2.Downstream impact on quantity and timing of flows to downstream portion of the HGM unit
Extent of HGM unit affected downstream of the impeding structureᴿ ha
%
Descriptor Low High
Score
0 2 5 8 10
Extent to which dams or roads interrupt low flows to down-stream areasᴿ
No interrup-tion (e.g. many culverts through a road embank-ment)
Slight interruption (e.g. a moderate number of culverts through a road embankment)
Intermediate interruption (e.g. earth dam with very high seepage or road embankment with no/very limited culverts)
Moderately high interruption (e.g. earth dam with some seepage/flow releases)
High interruption (e.g. a concrete dam with no seepage and no low flow releases)
Level of abstraction from the dam/sᴿ
Low Moderately low
intermediate Moderately high
High
Proportion of catchment flows intercep-tedᴰ
Dam intercepts <20% of the affected area’s catch-ment
Dam intercepts 21-40% of the affected area’s catchment
Dam intercepts 41-60% of the affected area’s catchment
Dam intercepts >80% of the affected area’s catchment
Collective volume of dam/s in relation to MAR of the affected areaᴰ
<20% 20-35% 36-60% 60-120% >120%

62
Intensity of impact: mean score of the THREE highest scoring factors x 0.8
Magnitude-of-impact score: extent of impact/100 x intensity of impact
*0.8 is the weighting factor. This is given relative to the impact of drainage channels, which are considered to have the greatest potential impact on hydrological integrity out of all the on-site factors considered, and is therefore assigned a weighting factor of 1.
3. Combined impact
Combined impact: Magnitude of impact for upstream + Magnitude of impact for downstream
c. Surface Roughness
Surface roughness is primarily determined by vegetation (hummocks covered in vegetation). It can also affect water distribution and retention within a wetland, that is, the greater the surface roughness, the greater the frictional resistance to the flow of water, thus reducing the flow velocity through the wetland. Reduced flow velocity reduces the rate of erosion but is variable due to season variations in vegetation and the occurrence of fires (Macfarlane et al., 2009). Altered surface roughness can be assessed by assessing the HGM unit by:
i. Assessing current surface roughness;
ii. Estimating historical surface roughness under natural conditions; and
iii. Comparing current roughness with historical and natural conditions.
The hydrology can also be affected by land use activities such as dams, alien plants, commercial afforestation, and sugarcane within the wetland boundary, and depositional and erosional features from construction and excavation processes such as mining and sand winning.
Implications for the study
Expected impacts on wetland hydrology from activities by Eskom include:
• The establishment and extension of ash dams
• Cutting of vegetation in wetlands under power lines
• Holding dams
• Water abstraction
• Building of roads and other infrastructure such as transmission lines
• Cut-off drains
• Excavation from mining activities
• Dumping of waste rock, overburden and tailings
• Runoff from paved areas • Engineering structures that cause channelling of flow thereby disrupting diffuse flow.

63
Geomorphology
Wetlands are affected by both inputs (which are generally equal to or greater) and outputs of sediments, where the inputs of sediments tend to be captured by wetlands. Geomorphic processes shape and control wetland structures, and gullying and erosion can lead to increases in the outputs of sediments which can threaten the natural structure and functioning of the wetland (Macfarlane et al., 2009).
Overall geomorphic impact
The overall impact of the geomorphic state can be calculated using the intensity and magnitude of erosional, depositional and organic material. More detail can be seen in Macfarlane et al. (2009: pages 87-89). The vulnerability of a wetland to erosion can also be measured as well as the predictions of the condition or geomorphological state over the next five years.
Table 13: Trajectory class, change score and the symbol used to evaluate the Trajectory of Change to the geomorphology of each HGM unit
Trajectory class
description HGM unit change score
Class Range
Symbol
Improve slightly
Geomorphological condition is likely to improve slightly over the next 5 years
1 0.3 to 1.0 ↑
Remain stable
Geomorphological condition is likely to remain stable over the next 5 years
0 -0.2 to +0.2
→
Deteriorate slightly
Geomorphological condition is likely to deteriorate slightly over the next 5 years
-1 -0.3 to -1.0
↓
Deteriorate greatly
Geomorphological condition is likely to deteriorate greatly over the next 5 years
-2 -1.1 to -2.0
↓↓
Implications for the study
Assessment of wetland health provides the basis from which both rehabilitation interventions may be planned and the impact on ecosystem services may be assessed.
Vegetation
Wetland vegetation has specific compositional and structural characteristics that provide specialised habitats for wetland dependent species and provide important services for local communities. It also provides an important service towards flood attenuation and nutrient retention. The “Present Vegetation State” is assessed against the deviation from the natural

64
conditions. Factors such as cultivation, grazing, changes in the hydrology (drying out of the catchment or wetland), water quality (e.g. high nutrient inputs), and geomorphology (e.g. alluvial depositions) can also cause changes in the vegetation characteristics within wetlands. Some indigenous species increase in abundance when a site is disturbed due to their ability to adapt to changing environments and waterlogging. See Table 14 below for the common disturbances in South Africa.
Table 14: Description of common disturbance classes in South African wetlands
Disturbance class
Description
Land uses commonly associated with complete with transformation of wetland habitat
Infrastructure Includes houses, roads and other permanent structures that totally replace wetland vegetation.
Deep flooding by dams
This includes situations where flooding is too deep for emergent vegetation to grow.
Land uses commonly associated with substantial-to-complete transformation of vegetation characteristics
Crop lands These lands are still in use and when active are generally characterized by almost total indigenous vegetation removal (predominance of introduced species). Examples include maize lands, tree plantations, sugarcane lands & madumbe fields, etc.
Commercial plantations
Common plantations include pine, wattle, gun, poplar. Other land uses such as vineyards and orchards may have a similar impact on wetland vegetation.
Annual pastures These areas are characterized by frequent soil disturbance with a general removal of wetland vegetation. Some ruderal wetland species may become established but are frequently removed.
Perennial pastures
Although such areas generally include a high abundance of alien terrestrial grasses or legumes, the reduced disturbance frequently may permit the establishment of some wetland species.
Dense alien vegetation
Where dense patches of alien plants can be identified within a wetland system, they should be identified as a separate disturbance class and evaluated as a unit.
Shallow flooding by dams
Such areas can often be identified at the head or tail end or edges of dams.

65
Sports fields These include cricket pitches, golf courses and the like, where a species such as Kikuyu have been introduced and are maintained through intensive management. These are often located within areas of temporary wetland where terrestrial species generally dominate.
Gardens Gardens are generally associated with urban environment.
Sediment deposition/infilling and excavation
Deposition includes sediment from excessive erosion or human disturbance (e.g. a construction site) upstream of the wetland, which is carried by water and deposited in the wetland. Infilling is the placement by humans of fill material in the wetland (e.g. for sports field). Excavation is the direct human removal (usually with heavy machinery) of sediment from the wetland, which is commonly associated with mining and sand winning.
Eroded areas In wetlands this typically occurs as gully erosion.
Land uses commonly associated with moderate transformation of vegetation characteristics
Old/abandoned lands
These secondary vegetation areas have typically been altered through historic agricultural practices, but are in the process of recovering. They are generally characterized by a high relative abundance of ruderal species, but this abundance may vary greatly depending on time since cultivation ceased. In cases where this varies greatly within an HGM unit, it may be best to distinguish between vegetation classes comprising recently abandoned lands and areas comprising older lands that are at a more advanced successional stage of recovery.
Land uses generally associated with low or no transformation of wetland vegetation
Seepage below dams
Earthen dams used for agricultural purposes often allow water to leak through the wall, creating artificial wetter areas below the dam wall. Such areas are typically characterized by an increase in hydric species.
Minimal human disturbance
These primary vegetation areas have not been significantly impacted by human activities, but may have been impacted upon by factors such as scattered alien plants. It may include wetland areas within game reserves or extensive grazing management systems. Small pockets of untransformed vegetation may also be set aside as streamside buffers on commercial landholdings.
Note: Scattered alien plants may occur in most of the above disturbance classes. Where this occurs, alien plants are considered as part of the larger disturbance class of which they are part (e.g. scattered bramble occurring within an old land), and the intensity of disturbance score is modified to account for the fine grain disturbances within them.

66
Issues of importance
Vegetation is a key component of wetland definition in the NWA, but it may only be used as the primary indicator in undisturbed conditions. It provides a helpful field guide in locating the wetland boundary when the wetland has not been transformed.
Disturbances within the wetland can be referred to as “grain size” at a spatial scale. A coarse grain size (generally the case in a large-scale agricultural context) can be easily identified and mapped as large individual disturbance units using GIS. The aerial extent of each class is then estimated by summing the areas of mapped disturbance units. This extent is estimated as a proportion (%) of the HGM unit and recorded. Patches of fine-scale disturbance units are grouped and mapped as part of a coarse-scale disturbance unit (or units) and intensity and magnitude are calculated accordingly (Refer to Macfarlane et al., 2009). In either case, the aerial extent of each disturbance class is estimated as a proportion of the HGM unit and recorded. The cumulative cover (%) of individual patches (at a finer grain size) that form part of the disturbance class can be represented in the form of spatial mapping.
Alien vegetation poses one of the most significant threats to wetland vegetation and is a major focus of rehabilitation programs. Where further management intervention is needed, it is useful to identify the problem species and to obtain further insight into their occurrence and tabulate the data. It is important to stress that alien vegetation, especially Typha capensis and Phragmites australis occur naturally across many wetlands in South Africa. Many wetland areas are naturally dominated by a single species, especially in the permanently wet portions of a wetland, where only species tolerant of intense waterlogging are able to grow. It is important to note the classification of plants when identifying species in a wetland, that is, obligate wetland species, facultative wetland species, facultative species, facultative dryland species and dryland species. Similarly to the hydrology and geomorphology components, the Present Vegetation State can be assessed and scored using categories, Trajectory classes, change scores and symbols.
The three components, hydrology, geomorphology and vegetation are directly or indirectly interlinked. Thus measuring wetland health and ecosystem services determines their Present Ecological State (PES) and Ecological Importance and Sensitivity (EIS) respectively. These can be used to measure the current state of wetlands, the future impacts and changes to wetland health, to ensure that the appropriate management interventions can be planned and the success of these interventions can be monitored.
Impact inventory
(Pollution, altering of hydrological regimes, disturbances, invasive species, erosion and siltation)
Measuring impacts
MacFarlane and Kotze (2009) provide a series of indicators for assessing the health of wetlands. Broadly, these may be divided into hydrological indicators, geomorphological indicators and vegetation indicators. These assess both catchment-wide and on-site activities such as dam construction and irrigation in the catchment or the presence of drains, gullies, sediment plugs, loss of organic sediment or alien plants in the wetland. The WET-Health tool provides a way to score the intensity of the impact numerically. The magnitudes of the impact scores are then combined in a structured way to produce an overall wetland health score. The WET-Health assessment scorecard provides a status-quo against which future changes may be measured.

67
A definitive document for the determination of physical impacts on wetlands is Wet-Sustainable Use: a system for assessing the sustainability of wetland use (Kotze, 2010). This builds onto the WET-Health of MacFarlane and Kotze (2009), recognising that without a sustainable management system in place, a wetland is vulnerable to degradation and it follows that a degradation in the condition of a wetland will erode the flow of ecosystem services emanating from the wetland. While this document focuses on ecological sustainability, it considers the place of the wetland within the broader social ecological system (from household to international level) and involves consultation with users to garner their perspectives on the sustainability of land-use activities.
The assessment of impacts begins by asking to what extent the use of the wetland has altered the following components of the wetland’s environmental condition:
• The distribution and retention of water,
• The erosion of sediment,
• The accumulation of soil organic matter (SOM),
• The retention of nutrients, and
• The natural species composition of the vegetation in the wetland.
The document provides two levels of assessment. Level 1 depends on several generalisations regarding the land that is being considered. Level 2 is structured around WET-Health (MacFarlane et al., 2009).
Following the assessment of the above 5 aspects, each is interpreted in terms of the consequences to the livelihoods of the ecosystem users. For instance, draining or erosion may provide opportunities for cultivation, but will impact on most of the provisioning services that would be provided by a healthy wetland downstream. Similarly, while invasion of wetlands by alien vegetation may provide some resource value, such as the provision of fuel, the resource base for medicine, crafts, thatching and livestock grazing is generally reduced.
In recognition of the importance of wetlands in the livelihoods of people and noting that many of these wetlands were degraded, Pollard et al. (2009) asked the questions ‘what indicators can be used to assess the situation, to track change and to evaluate impacts?’; and ‘how can these be developed in a way that is meaningful both for managers but also for the users themselves?’ Fundamental to answering these questions is the concept that integrated management typically deals with interlinked, dynamic and hence complex systems. Complexity and systems thinking critiques conventional management approaches for their failure to recognise variability and linkages as essential properties of many complex systems. Indicators are thus needed that describe the performance of the individual systems and their contribution to the performance of wider systems. Since outcomes are not entirely predictable they have to be managed through a process of strategic adaptive management that embraces learning-by-doing. Indicators need to support this premise. Based on these concepts the authors developed a suite of indicators, some of which are specific to the cultivation methods used in the Craigieburn wetlands and others more widely applicable to wetlands in general. Examples of the latter are given in Table 15.

68
Table 15: A preliminary framework, based on core principles, for assessing the integrity of the wetland as a whole. Some potential indicators are listed. These principles are considered sufficiently robust for use at the micro-catchment scale (from Pollard et al., 2009)
Volume 13 of the Ramsar Handbooks for Wise Use (para 52-55; 2010) provides a rapid assessment method which may be used for the assessment of both natural and anthropogenic disasters. The guidance recognizes that the purposes for rapid assessment of wetlands include:
• a) Collecting general biodiversity data in order to inventory and prioritize wetland species, communities and ecosystems; obtaining baseline biodiversity information for a given area;
• b) Gathering information on the status of a focus or target species (such as threatened species); collecting data pertaining to the conservation of a specific species;
• c) Gaining information on the effects of human or natural disturbance (changes) on a given area or species;
• d) Gathering information that is indicative of the general ecosystem health or condition of a specific wetland ecosystem;

69
• e) Determining the potential for sustainable use of biological resources in a particular wetland ecosystem; and
• f) Has been designed from the suite of methods available which can be tailored to the particular needs of the situation.
Implications for the study
Wet-Health provides indicators that have been developed specifically for SA conditions. These can be used for monitoring programs.
Impact assessment
Volume 16 of the Ramsar Handbooks for Wise Use (2010) provides a flow chart of the key steps in the impact assessment procedure which are given below (Figure 14). This procedure provides structure to the planning and implementation of an impact assessment which will ensure that nothing is left out. This will be of assistance to both specialists doing the impact assessment as well as managers who are overseeing the process.
In Volume 19 of the Ramsar handbooks on Wise Use of Wetlands, Ramsar provides a method for assessing the ecological character of a wetland. The ecological character is defined as the combination of the ecosystem components, processes and services that characterise the wetland at a given point in time. Determination of the ecological character will do two things, firstly it will provide the link between wetland health and the stream of ecosystem services that are used by people and secondly, it will provide a benchmark against which future assessments may be compared. This will provide a measure of the change in the services resulting from defined impacts on that wetland and will, through a process of adaptive management, enable the improvement of the stream of services to meet the requirements of the social-ecological system.
The Ramsar process described above is similar to the South African process of defining the desired state of an ecosystem and then putting interventions in place to manage towards the defined desired state.

70
Figure 14: Flowchart of key steps in the environmental impact assessment procedure (from Ramsar Wise Use of Wetlands Vol. 16)
Implications for the study
The ideal of ’no net loss’ of ecosystem services is applied to both wetland surface area and wetland functionality. It is necessary to know both the extent of surface area and the state of the wetland to be managed before any rehabilitation can be planned. The environmental impact assessment procedure requires managers to both assess the current state of wetlands under their jurisdiction as well as to predict the impact of land use, construction and other changes on wetlands.

71
Prioritisation of wetlands for rehabilitation and intervention
Wetlands for rehabilitation in South Africa need to be ranked in order of importance in order to direct limited resources appropriately (Rountree et al., 2009). Ranking or prioritisation values would be based on the objectives of the prioritisation process and this includes identifying and prioritising catchments and wetlands which match particular objectives, either for rehabilitation, conservation or monitoring activities (Rountree et al., 2009). Subsequent to this, the National Freshwater Ecosystem Priority Areas (NFEPA) has been published by the WRC. This identifies priority wetlands and rivers for protection in South Africa. This should be consulted in prioritisation and planning of interventions. The ranking can refer to criteria or objectives such as the hydrological functions, socio-economic values and biodiversity support aspects. Prioritising the same set of wetlands on different objectives will yield different outcomes depending on the criteria used for assessment.
The seven-step prioritisation process proposed by Rountree et al. (2009) is a spatial approach that looks at:
• Step 1: Define the aims and objectives of the prioritisation project
• Step 2: Identify the spatial extent of the study area (the spatial scale of the assessment determines which specific information and protocols can be used)
• Step 3: Collate available information
• Step 4: Develop prioritisation criteria
• Step 5: Screen for candidate catchments
• Step 6: Prioritise catchments
• Step 7: Assess the potential of prioritised catchments to meet the objectives
This process can be used at a national or provincial scale where they can be used to prioritise tertiary level catchments, at a regional scale they can be used to prioritise quaternary catchments and at a local spatial scale they can be used to prioritise individual wetlands, or clusters of wetlands (see Figure 15 below). Wetlands can be prioritised at the different scales based on who chooses to prioritise them (see Figure 16 below for prioritisation steps) (Rountree et al., 2009).

72
Figure 15: Spatial scales of prioritisation down to the catchment and sub-catchment level
Principles to guide and the requirements for the process of prioritisation:
Prioritisation and rehabilitation planning should incorporate the following:
• The contribution of landholders or users and other key stakeholders if practical and cost-effective.
• Protecting wetlands that are still intact or stable and that would be easier to improve.
• Those that are of high priority due to their provision of goods and services.
• Assess the current state of the wetland as it is due to the cumulative impacts of activities in the broader scale of the catchment, thus including the broader catchment and landscape.
• Ensure they are aligned with the catchment and biodiversity conservation plans.
• Consider the willingness and capacity for local people and local structures to become involved.
• Address the causes of degradation and prioritisation and rehabilitation plans that should be developed by a team of experts in design and planning and the ecological functioning of the wetland (Rountree et al., 2009).

73
Figure 16: Wetland prioritisation steps that are required at different spatial scales
The seven-step prioritisation process is provided in more detail below (Rountree et al., 2009):
• Step 1: Define the aims and objectives of the prioritisation project
An aim and objective can be applied to rehabilitation projects that aims to improve the current condition of wetlands; conservation planning that aims to preserve biodiversity; and wetland reserve studies (environmental flow determination) that aim to improve understanding and management of wetlands.
a. Rehabilitation projects:
Rehabilitation projects focus on achieving biodiversity support, water quality improvement, sediment stabilisation or reinstated flooding regimes, as well as job creation and poverty relief as part of the Working for Wetlands (WfWetlands) Programme and their role in the government’s expanded public works programmes.
b. Conservation Planning:
Wetlands at a national scale have been identified in South Africa by SANBI and in addition are in the process of being classified at a provincial and municipal level at a higher resolution. In South Africa the national conservation efforts have been to maintain RAMSAR sites, but in conservation planning we need to focus our rehabilitation efforts on those wetland types which are rare and unique, are at risk or are increasingly under threat, and those that provide habitats to endangered species.

74
c. Wetland Reserve Studies:
Wetland reserves (environmental flow determination) and water resources are managed by The Department of Water and Sanitation in South Africa. There is an urgent need to look at the resource quality objectives and ecological specifications to ensure that the current standard of wetlands is maintained. South Africa needs to be practical and focus on stratified sampling to study representative systems and also focus on priority wetland systems in given water management areas. This can assist to identify priority wetland systems in catchment area. One needs to identify high-risk wetland systems, systems with a high ecological integrity, provision of high-level goods and services, wetlands impacted on by water allocation, and those in an important water management area.
• Step 2: Identify the spatial extent of the study area (the spatial scale of the assessment determines which specific information and protocols can be used)
The spatial scale is defined in order to focus the study and guide the assimilation of relevant knowledge, information and data and the development of prioritisation criteria for selecting or scoring between various wetland areas or individual systems. Identifying the spatial scale is necessary as it is vital to recognise that the current and future condition of a particular wetland system is a product of the condition of the catchment and the activities within the catchment. Understanding specific wetland systems is necessary as generally the problems experienced are due to factors higher up in the catchment.
• Step 3: Collate available information
All available information about the wetlands, including data and local knowledge sources, possible indicators of wetland extent, type, characteristics and condition, location and surrounding land use activities needs to be collated for the study area.
• Step 4: Develop prioritisation criteria
Prioritisation criteria can be qualitative or quantitative (depending on the resolution of data and specialist knowledge) and need to address the objectives. Scoring corresponds to the objectives used, the scale of analysis, and the data and information that are available at that specific scale to address those criteria. Prioritisation criteria can include: wetland size, wetland condition, connectivity between the site and other wetlands or downstream rivers, rare plant/animal populations (biodiversity support), wetland type (rarity), diversity of vegetation types, level of ecosystem goods and services, proximity of the site to suitable, nodes of employment (in the case of rehabilitation programmes like WfWetlands which are linked to poverty alleviation), level of threats or likely future impacts, and specific ecosystem services of the wetland (e.g. prioritising the types of wetlands which improve water quality in a catchment with large water quality impacts over those that attenuate floods). See Table 16 below for prioritisation examples.
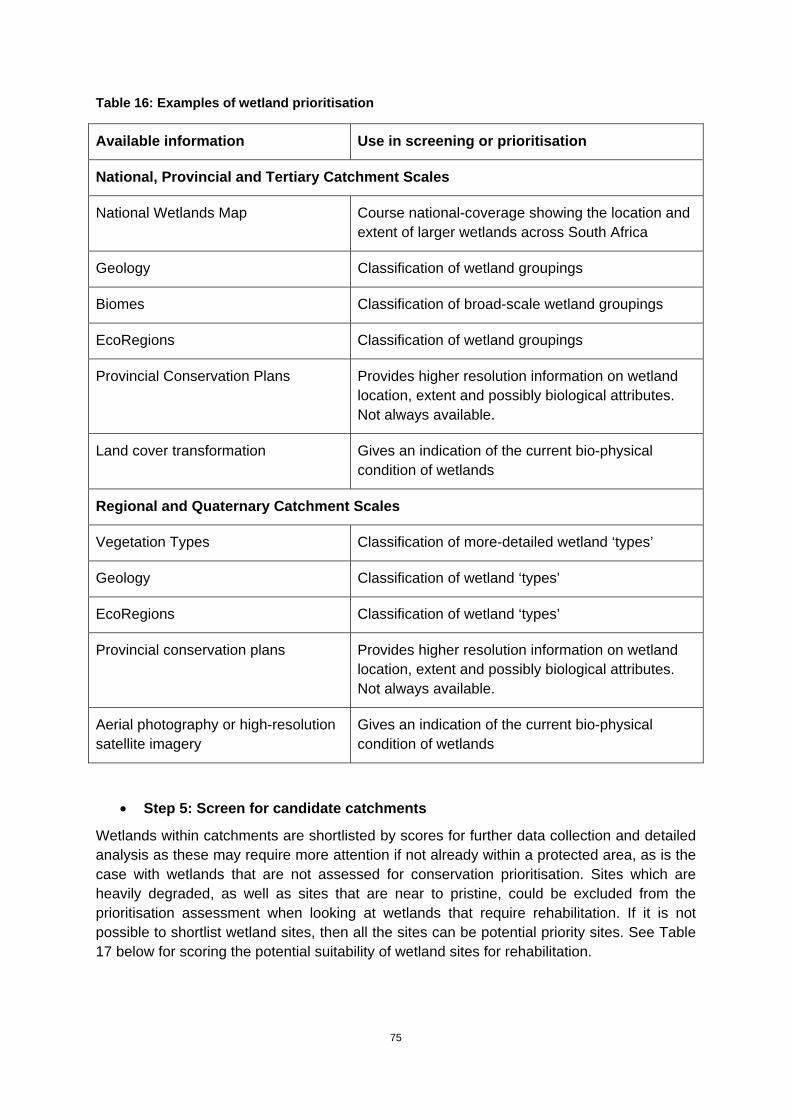
75
Table 16: Examples of wetland prioritisation
Available information Use in screening or prioritisation
National, Provincial and Tertiary Catchment Scales
National Wetlands Map Course national-coverage showing the location and extent of larger wetlands across South Africa
Geology Classification of wetland groupings
Biomes Classification of broad-scale wetland groupings
EcoRegions Classification of wetland groupings
Provincial Conservation Plans Provides higher resolution information on wetland location, extent and possibly biological attributes. Not always available.
Land cover transformation Gives an indication of the current bio-physical condition of wetlands
Regional and Quaternary Catchment Scales
Vegetation Types Classification of more-detailed wetland ‘types’
Geology Classification of wetland ‘types’
EcoRegions Classification of wetland ‘types’
Provincial conservation plans Provides higher resolution information on wetland location, extent and possibly biological attributes. Not always available.
Aerial photography or high-resolution satellite imagery
Gives an indication of the current bio-physical condition of wetlands
• Step 5: Screen for candidate catchments
Wetlands within catchments are shortlisted by scores for further data collection and detailed analysis as these may require more attention if not already within a protected area, as is the case with wetlands that are not assessed for conservation prioritisation. Sites which are heavily degraded, as well as sites that are near to pristine, could be excluded from the prioritisation assessment when looking at wetlands that require rehabilitation. If it is not possible to shortlist wetland sites, then all the sites can be potential priority sites. See Table 17 below for scoring the potential suitability of wetland sites for rehabilitation.

76
Table 17: Scores for the potential suitability of wetland sites for rehabilitation
Score Description of the class
0 The returns are considered to be very low or the sites considered lost causes’ that are extremely degraded (e.g. with a deeply incised gully throughout the length of the wetland) and which would be prohibitively expensive to rehabilitate
1 A site which has potential (e.g. reasonably intact areas threatened by headcut erosion) but where the returns are likely to be low (e.g. because the intact areas is relatively small, i.e.<3 ha and/or appears to have a low level of wetness) or uncertain
2 A site where the returns are potentially moderate (e.g. a moderately sized area with artificial drains that could be plugged or a moderately sized are threatened by gully erosion)
3 A site where returns are potentially high (e.g. a large area, i.e.>20 ha, with artificial drains that could be plugged or a large area threatened by gully erosion)
• Step 6: Prioritise catchments
Prioritisation criteria are developed to address the project objectives. If it is not possible to shortlist wetland sites, then all the sites can be potential priority sites. Tertiary catchments (national and provincial) can be prioritised using a GIS-based tool where it looks at land cover. At the quaternary scale, desktop analysis and field-based assessments need to be done with local and regional specialist knowledge at hand. One must always revisit the aims and objectives at the larger scale so as not to lose focus when constraints and opportunities are encountered at the smaller scale.
o Tertiary catchment scale:
The GIS-based tool allows for resources to be more appropriately focussed at the national and provincial scales. Priority areas are chosen based on the key strategic national needs or services (such as biodiversity support to the supply of resources and erosion control) provided by the wetlands in the particular catchments. Six priority categories have been selected to focus on at a provincial level by members of national and provincial government, statutory bodies, civil society and the private sector; these are: hydrology, biodiversity, socio-economic, threats/impacts, physical, and strategic categories (see Table 18 below for detailed priority categories).

77
Table 18: Criteria used for Tertiary level catchment prioritisation (national and provincial scale)
National criteria Examples of sub-criteria
Biodiversity Biodiversity nodes/hotspots (biodiversity map)
Protected areas
Threatened or priority wetlands including the peat eco-regions
Ramsar sites and their catchments
Hydrological Water-stressed catchments
Runoff per capita
Water supply catchments
Water quality at catchment scale
International obligations with respect to water sharing
Socio-Economic Nodes identified under the Integrated Sustainable Rural Development Strategy
Urban renewal projects
Livelihoods dependent on wetland goods and services?
Poverty indicators
Threats/impacts New land cover map
physical Erodibility index
Unique natural features, e.g. karst landscapes
Density and distribution of wetlands (new land cover; wetland coverage; Cowan wetland regions)
Strategic International rivers and boundaries
Spatial development initiatives
Existence of Catchment Management Agencies
From the above-mentioned six categories, 13 indicators were selected to address the prioritisation criteria, these are:
• National Biodiversity Priority Areas,

78
• Protected Areas,
• Peat Wetland Eco-regions,
• Ramsar Sites,
• Water-stressed Catchments,
• Water (Chemical) Quality,
• Spatial Development Initiatives (SDIs),
• Water Catchment Management Agencies (CMAs),
• Conservation Status Index,
• Erodibility (Soil) Index,
• Working For Water/Wetland Project,
• Locations,
• Poverty Gap Index, and
• Integrated Sustainable Rural Development and Urban Renewal Nodes.
These indicators can be selected and weighted to provide a single or integrated qualitative wetland-priority index value based on desired attributes for each tertiary catchment within South Africa and the output from the GIS model can be represented as maps (see a few of the selected criteria represented as GIS maps in Figure 17, Figure 18 and Figure 19 below).
Figure 17: Biodiversity Priority Areas (i), Water Management Areas, and Tertiary catchments (GIS data available on NBI database)
Figure 18: Water stressed catchments (v) Water Management Areas (WMAs) and Tertiary Catchments (Data available on DEA ENPAT (Environmental Potential Atlas) database and DWA Water Situation Assessment Model)

79
Figure 19: Working for Water and Working for Wetland Project locations (xi) Water Management Areas, and Tertiary catchments (Data available on the Working for Water (WfW) database)
Implications for the study
Eskom together with the DEA would need to assess the location of their wetlands in relation to the provincial and national priority catchment areas. Assessments will need to be based on the abovementioned 13 indicators. If they are within a priority catchment they will need to be protected with the correct rehabilitation, conservation or monitoring activities in place. If they are not within priority catchments, Eskom will need to rank and prioritise them on criteria or objectives such as the hydrological functions, socio-economic values and biodiversity support aspects and then implement rehabilitation, conservation or monitoring activities.
o Quaternary catchment scale:
Due to a lack of detailed level maps and tools for assessing quaternary catchments, prioritisation at the regional scale is done in the form of guidelines and on-site assessments for outlining the criteria and considerations for prioritisation of quaternary catchment areas, using expert knowledge, and/or regional databases as these become available. At a national level, one identifies a wetland on rarity from GIS tools, but at the local scale a wetland could or could not be prioritised due to the local landowner or land tenure arrangements which can only be found out from on-site assessments.
Sources of available data at the regional scale can include: regional experts/specialists, SANBI wetlands map to inform on the likely location and density of wetlands in a particular sub-catchment, high-resolution satellite data, aerial photography or other imagery such as Google Earth to conduct desktop surveys of wetland condition, and/or provincial C-plan wetlands information (not available for all provinces). A scoring system can also be developed to score each area (each quaternary catchment area within the priority tertiary catchment study area) to measure the catchment’s suitability to meet the prioritisation criteria. This provides a prioritisation score for each candidate catchment being considered, thus allowing for the development of a list of prioritised catchments.
o Within the quaternary catchment scale:
This is a sub-catchment assessment that collates local scale information. A rapid assessment to shortlist candidate sites of priority wetlands can be done using the WET-health (to measure the present ecological state) (MacFarlane et al., 2009) or WET-EcoServices (Kotze et al., 2009b) guidelines to identify problems or priorities on-site so as to not make assumptions and mistakes of the effects from other catchments (see Table 19

80
below for WET-EcoServices ecological services and benefits). Individual wetlands need to be prioritised relative to other wetlands by using similar sources of available data as mentioned above for the regional scale. Similarly a scoring system can also be developed at the local scale. This method is done to assign indices of wetland services which can be used for comparative purposed between different wetlands. Different criteria are assessed and weights are assigned to the indices, depending on the objectives of the prioritisation project.
Table 19: WET-EcoServices ecological services and benefits
Wetlands benefits
(goods and services)
Indirect benefits
Hyd
rolo
gica
l ben
efits
Flood attenuation
Streamflow augmentation
Sediment trapping
Phosphate trapping
Phosphate assimilation
Nitrate assimilation
Toxicant assimilation
Erosion control
Biodiversity conservation – integrity
Biodiversity conservation – irreplaceably
Direct benefits
Water supply
Provision of harvestable resources
Socio-cultural significance
Tourism and recreation
Education and research
A list of focal criteria used to identify local scale priority wetlands for rehabilitation is provided below:
• Focus on wetlands that are rare or represent rare types
• Focus on wetlands that are in good condition before those that are in poor condition
• Focus on deteriorating wetlands before stable or improving ones
• Focus on problems that are easiest to fix
• Focus on those sites that will generate a guaranteed immediate positive benefit before those that have potentially longer-term, but less certain, positive benefits

81
• Focus on those problems or sites perceived to be important by local communities or stakeholders before those not perceived to be important
• Recognise lost causes for what they are, and focus effort problems and sites where there is more chance of success
• Focus on those problems known to have tried and tested remedies
• Incorporate a broader (catchment or sub-catchment) level assessment to identify any causes that may be outside of the wetland itself
• Focus on wetlands with a good recovery potential
• Focus where the willingness and capacity for local people and local structures to become involved and address the causes of degradation are high.
Implications for the study
Wetland rehabilitation takes resources in the form of skilled planning, people to do the work, funds and time. Through the prioritisation of wetlands to be rehabilitated, Eskom could direct the available resources to the areas where they will have most impact. Publication of this prioritisation would be seen as a declaration of intention.
• Step 7: Assess the potential of prioritised catchments to meet the objectives
Once the prioritised sites have been identified, these are assessed against the original project objectives, criteria indicators, or the criteria scores, as sometimes they do not always adequately reflect the original intentions of the objectives (resolutions of data may be insufficient or correlations between parameters may be weak). Thus the last step is merely to do a “cross check” to ensure that the prioritisation criteria have been accurately assessed and scored, and that the selected priority sites are able to address the objectives of the study. If unsuitable then one needs to reassess the prioritisation scoring.
Rehabilitation of impacts
WET-Legal (Armstrong, 2009) guides the wetland manager through the plethora of South Africa’s legislation dealing with wetlands. The guide covers legislation from the Departments of Water Affairs, Environmental Affairs and Agriculture as well as other pieces of relevant legislation. The requirements of the international agreements to which South Africa is signatory are explained. The guide also clarifies the activities which require authorisation and the laws that compel rehabilitation and/or action on the part of the user or landowner. Supporting this is an explanation of the responsibility of the person/organisation conducting the activity.
Gardner et al. (2012) and Dini (undated) outline the key message in dealing with wetlands during development, and that is as follows:
• Avoidance: Avoiding wetland impacts involves proactive measures to prevent adverse change in a wetland’s ecological character through appropriate regulation, planning or activity design decisions.
• Mitigation: Mitigating wetland impacts refers to reactive practical actions that minimize or reduce in situ wetland impacts.

82
• Compensation: Compensating for wetland impacts refers to actions that are intended to offset the residual impacts on wetland ecological character that remain after any mitigation has been achieved. Dini (undated) makes the point that offsite mitigation is not a license to destroy wetlands or short circuit regulatory processes.
Alexander and McInnes (2012), in their Ramsar briefing note, describe the benefits of wetland restoration. The key messages that they convey are:
• Stop the global loss of wetlands to prevent further erosion of the stream of ecosystem services provided by wetlands on which the social ecological system relies.
• Prioritisation of the protection and restoration of wetlands applies to both the methods used and the wetlands themselves. The most effective way to protect wetlands is to remove the drivers/pressures that are causing the change in ecological character. Where this is not possible or where the damage has already been done, then appropriate rehabilitation interventions should be implemented. The wetlands to be protected or rehabilitated should also be prioritised.
• Restoration is not a substitute for protection. Protection is more cost effective than restoration and should be the intervention of choice.
• Holistic wetland restoration objectives should be formulated. Experience has shown that where this is not practiced the restoration interventions are prone to failure.
• Decision makers should recognise the full suite of restoration benefits to provide the ecosystem services as described in the Millennium Ecosystem Assessment (2005).
A number of the key messages given above are covered in detail in the reports emanating from the Wetlands Research Programme: Wetland Rehabilitation of the Water Research Commission and these are covered individually below. There are a large number of wetlands of a variety of types in a range of Ecozones and land uses and many of these are degraded and require rehabilitation.
A range of land cover classes identified based on the National Land cover database for SA have been identified with respect to their impacts on water inputs to, and retention of water within, wetlands. If present in the catchment, these land cover classes can either 1) increase or 2) decrease water inputs to a wetland, OR if present in a wetland itself, they can 3) increase direct water losses from the wetland, 4) reduce surface roughness, 5) impede the flow of water in a wetland or 6) enhance the flow of water in a wetland. Ellery et al. (2010) have examined the effect of each category of land cover change from the natural condition on each of these parameters and have assigned an intensity of impact score to each. For instance, the Land Cover Change Impact Metric is based on the recognition that wetland structure and function are fundamentally affected by the hydrological regime and this may take several forms (Figure 20).

83
Figure 20: Possible relationships that might be expected between functional effectiveness scores (i.e. the provision of wetland ecosystem services, as assessed using WET-EcoServices) and wetland impact scores (as assessed using WET-Health) (From Ellery et al., 2010)
A. Linear – e.g. abstraction of water for irrigation in a catchment.
B. Drastic reduction with small impact – e.g. erosion
C. Small impacts have little effect on wetland functionality, but the negative impact on functionality increases exponentially to the impact – e.g. pollutants
D. Small impacts may increase the provision of ecosystem services, followed by a drastic decline in the provision of ecosystem services with increase in the impact – e.g. the effect of gullies on flood attenuation.
Macfarlane et al. (2009) provide a toolkit for assessing wetland health. The output of this impact and indicator-based toolkit provides an assessment of the intensity and magnitude of impact per HGM and guides follow up rehabilitation activities as necessary.
Kotze et al. (2009b) guides the process of assessing 15 benefits of the regulating and supporting services provided by inland, palustrine wetlands, noting a number of characteristics which may influence each of the services, and provides a score sheet for recording the data in a way that is transparent. It also prompts the user to identify threats to the wetland and possibilities for enhancing the benefits realised.
Kotze et al. (2009c) have developed a process to inform the planning of the wetland rehabilitation process that integrates into the broader management of the wetland and catchment, and which produces sustainable outcomes. This is achieved through the provision of three main elements:
• Background information on wetland rehabilitation,
• Guiding principles for rehabilitation, and
• A framework with step-by-step guidelines for undertaking the planning and implementation of wetland rehabilitation.
Russell (2009) follows the rehabilitation planning with a comprehensive manual on the selection and implementation of rehabilitation methods that are appropriate for the particular problem being addressed and for the wetland and its catchment context.
84
It gives the key concepts relating to wetland degradation, especially from erosion and gives detailed guidance for the design and implementation of interventions for the rehabilitation of inland palustrine wetlands and their catchments, focusing particularly on wetlands associated with natural drainage networks. Although some aspects of the tool require high levels of civil engineering expertise, it is designed primarily for rehabilitation workers who have completed training in soil conservation, life sciences or engineering at a diploma level and who have practical field experience.
Assessment of the effectiveness of implementation interventions is covered in the publication WET-RehabEvaluate (Cowden and Kotze, 2009). WET-RehabEvaluate recognises that monitoring and evaluation are closely linked to planning and provides the background to rehabilitation and step by step guidelines for monitoring and evaluation of rehabilitation projects. It gives guidance on how to review the achievement of the objectives of the rehabilitation, the identification of performance indicators, the development of a monitoring evaluation plan and how to report on performance. Outcomes of the monitoring and evaluation are based on system integrity and the delivery of ecosystem services by the rehabilitated wetland as measured by WET-Health (MacFarlane et al., 2009) and WET-Ecoservices (Kotze et al., 2009b).
When wetlands have been degraded it may not be possible to restore them to their original state, and in this case, as a final option and in order to achieve the ideal of no net loss (Dini, undated), a license for wetland mitigation banking may be sought. Cox and Kotze (2008) assessed the appropriateness of wetland mitigation banking as a mechanism for securing aquatic biodiversity in the grassland biome of South Africa. Mitigation banking was first developed in the USA to address their ‘no net loss’ policy. Canada has not accepted mitigation banking as they say it encourages a ‘commodity’ approach. In South Africa offsets have been applied with limited success and sustainability. South African legal instruments are considered adequate, but tools appropriate to South African conditions are not yet available. In the USA it was found that small, ad hoc wetland mitigation offsets had a high failure rate because they did not have the necessary resources to ensure their success and were difficult to control. As a result the USA model has gone the route of fewer, larger banks which have the resources to ensure sustainability. In basins such as the Colorado where water is scarce, the water to maintain the bank has to be purchased, making the running of a mitigation bank an expensive process. The South African model, as developed by Cox and Kotze (2008) puts the role of banker into the hands of Working for Wetlands, a state organisation. This gets around many of the problems experienced in the USA with its private banking system. This model still needs to be tested in practice, and the upper Olifants, Mpumalanga, has been selected as the case study area. A difference between the USA system and that proposed for South Africa is that South Africa requires the wetland offset to be in the same catchment as the wetland that it is to ‘replace’. In the USA they have found that a single larger wetland has a generally greater benefit than many smaller ones for functions such as supporting water bird populations.
Wetland offsetting and no net-loss
Wetland offsetting
The focus up to this point in time has largely been on conserving representative sites from a biodiversity perspective. However, the South African wetland offset guidelines (SANBI and DWS, 2014) state that any offset should preferable be made in the same sub-catchment but at least in the same quaternary in order to maintain the flow of ecosystem services to the quaternary catchment.

85
Implications for the study
The consideration of wetlands within an ecosystem approach is vital to ensure their long-term survival. Wetlands as a percentage of surface area in a catchment have also not been mainstreamed in South Africa. As a leader in the landscape of corporate environmental responsibility, Eskom is in the ideal position to raise the debate on this issue, especially with reference to wetland offsetting initiatives. Given the ability of wetlands to attenuate especially non-point source pollution, these measures could improve water quality in the catchments that Eskom operates in.
Biodiversity offsets are measurable conservation outcomes resulting from actions
designed to compensate for significant residual adverse biodiversity impacts arising
from project development after appropriate prevention and mitigation measures have
been taken. The goal of biodiversity offsets is to achieve no net loss and preferably
net gain of biodiversity on the ground with respect to species composition, habitat
structure, ecosystem function and people’s use and cultural values associated with
biodiversity (SANBI and DWS, 2014).
The ideal of wetland offsets is to achieve a measurable “no net loss” or “net gain” conservation outcomes (SANBI and DWS, 2014). The goal of quantifying losses or gains distinguishes offsets from other compensatory conservation methods. In summary, offsets seek to mitigate or compensate for impacts on the environment from project development after the necessary measures have been taken to first minimize and avoid these impacts this can also be known as “compensatory mitigation” (SANBI and DWS, 2014). An example of compensation mitigation is of aquatic systems in the United States if America to restore and maintain the chemical, physical and biological integrity of the waters as developed in their Clean Water Act (SANBI and DWS, 2014). When planning offsets, a hierarchy needs to be considered, see Figure 21 below for steps.
Figure 21: The mitigation hierarchy (SANBI and DWS, 2014)

86
A draft set of best practice guidelines for designing and implementing wetland offsets (SANBI and DWS, 2014) has been generated in response to the need to develop a comprehensive technical guideline for wetland offsets, with a particular emphasis on coal mining in the Mpumalanga Highveld. The report addresses the following aspects:
• Offset site selection: guidelines to inform the site selection process through a structured protocol and supporting guidance.
• Methodology for calculating offset ratios: appropriate compensation for residual impacts on wetlands is provided, in line with the principle of ‘no-net-loss’ or ‘net gain’.
• Technical protocols to evaluate wetlands as part of the wetland offset methodology: Monitoring the rehabilitation process and project sign-off
This document provides valuable information and will be directing future wetland offsetting in SA.
Implications for the study
SANBI and DWS, 2014. Wetland Offsets: A best practice guideline for South Africa is the definitive resource for wetland offsetting in South Africa.
Wetland conservation in national and international legislation
At an international level, wetland protection is important across a range of conventions, such as the Ramsar Convention, Convention on Biological Diversity and the United Nations Convention to Combat Desertification (SANBI and DWS, 2014). International guidelines and standards on offsets are emerging and principles on biodiversity offsets were developed by members of the Business and Biodiversity Offset Programme (BBOP) Advisory Committee as the basis for the design and implementation of high quality biodiversity offsets (SANBI and DWS, 2014). This standard ensures for the best practice biodiversity offsets and thus verifying their success by complying with all relevant national and international laws. In South Africa, national laws directly or indirectly relate to wetland protection, conservation and management; but more specifically relating to general water, biodiversity and ecosystem conservation. Such laws include The South African Constitution 108 of 1996, The National Environmental Management Act 107 of 1998, The Environmental Impact Assessment (EIA) regulations, The National Water Act 36 of 1998, The General Authorisations (GAs), The National Environmental Management: Biodiversity Act No 10 of 2004, The Conservation of Agricultural Resources Act 43 of 1967, The National Forest Act 84 of 1998, The Natural Heritage Resources Act 25 of 1999, The National Environmental Management: Protected Areas Act 57 of 2003, and The Mountain Catchments Areas Act 62 of 1970 (SANBI and DWS, 2014). South Africa is currently developing biodiversity offset guidelines that will be used nationally. These incorporate widely accepted general principles of design and implementation which have been published in the Business and Biodiversity Offset Programme of 2009.
Overview of Wetland Offset Framework
A step-wise process is outlined below detailing the steps taken to assess possible lasting impacts of a proposed development. First the wetland must be delineated, and then divided into hydrogeomorphic units. Then an assessment of the following factors must be done:
• Importance of the wetland to biodiversity conservation;

87
• Its Present Ecological State reflecting its current health and integrity (see section 8 for detailed breakdown on wetland health); and
• Its key ecosystem services, thereby differentiating between the direct and indirect services;
• The species of conservation concern (wetland dependent species which will be impacted upon), should be assessed.
See a more detailed guideline to the steps of the Wetland Offset Framework by SANBI and DWS, (2014). Figure 22 presents an overview of Wetland Offset Framework.

88
Figure 22: Overview of Wetland Offset Framework
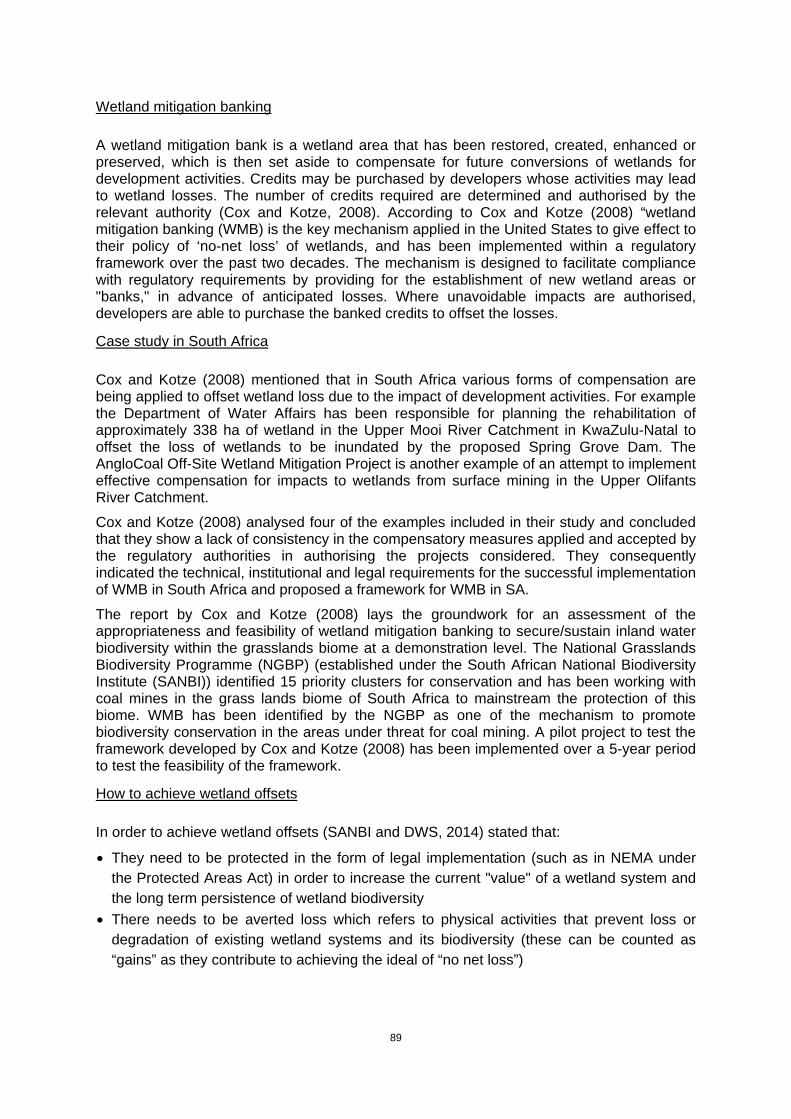
89
Wetland mitigation banking
A wetland mitigation bank is a wetland area that has been restored, created, enhanced or preserved, which is then set aside to compensate for future conversions of wetlands for development activities. Credits may be purchased by developers whose activities may lead to wetland losses. The number of credits required are determined and authorised by the relevant authority (Cox and Kotze, 2008). According to Cox and Kotze (2008) “wetland mitigation banking (WMB) is the key mechanism applied in the United States to give effect to their policy of ‘no-net loss’ of wetlands, and has been implemented within a regulatory framework over the past two decades. The mechanism is designed to facilitate compliance with regulatory requirements by providing for the establishment of new wetland areas or "banks," in advance of anticipated losses. Where unavoidable impacts are authorised, developers are able to purchase the banked credits to offset the losses.
Case study in South Africa
Cox and Kotze (2008) mentioned that in South Africa various forms of compensation are being applied to offset wetland loss due to the impact of development activities. For example the Department of Water Affairs has been responsible for planning the rehabilitation of approximately 338 ha of wetland in the Upper Mooi River Catchment in KwaZulu-Natal to offset the loss of wetlands to be inundated by the proposed Spring Grove Dam. The AngloCoal Off-Site Wetland Mitigation Project is another example of an attempt to implement effective compensation for impacts to wetlands from surface mining in the Upper Olifants River Catchment.
Cox and Kotze (2008) analysed four of the examples included in their study and concluded that they show a lack of consistency in the compensatory measures applied and accepted by the regulatory authorities in authorising the projects considered. They consequently indicated the technical, institutional and legal requirements for the successful implementation of WMB in South Africa and proposed a framework for WMB in SA.
The report by Cox and Kotze (2008) lays the groundwork for an assessment of the appropriateness and feasibility of wetland mitigation banking to secure/sustain inland water biodiversity within the grasslands biome at a demonstration level. The National Grasslands Biodiversity Programme (NGBP) (established under the South African National Biodiversity Institute (SANBI)) identified 15 priority clusters for conservation and has been working with coal mines in the grass lands biome of South Africa to mainstream the protection of this biome. WMB has been identified by the NGBP as one of the mechanism to promote biodiversity conservation in the areas under threat for coal mining. A pilot project to test the framework developed by Cox and Kotze (2008) has been implemented over a 5-year period to test the feasibility of the framework.
How to achieve wetland offsets
In order to achieve wetland offsets (SANBI and DWS, 2014) stated that:
• They need to be protected in the form of legal implementation (such as in NEMA under the Protected Areas Act) in order to increase the current "value" of a wetland system and the long term persistence of wetland biodiversity
• There needs to be averted loss which refers to physical activities that prevent loss or degradation of existing wetland systems and its biodiversity (these can be counted as “gains” as they contribute to achieving the ideal of “no net loss”)

90
• Some may need to undergo rehabilitation/restoration in order to manipulate the physical, chemical, or biological characteristics of a degraded wetland system in order to repair or improve wetland integrity and associated ecosystem services
• There needs to be an establishment of new wetland systems in some catchment areas where they didn’t exist before which leads to “gains” in wetland area, functions and biodiversity values
• There needs to be direct compensation to affected parties for loss of ecosystem services which can be done by monetary compensation or regulating the supporting services.
Implications for the study
We are aware of a study commissioned for the New Largo Colliery (dated 2012) for
Anglo American Thermal Coal for a wetland offset plan. The study is undertaken by Wetland Consulting Services. It would be imperative for the compilation of this study to pursue alignment with related initiatives in the catchments in which Eskom operates.
Vegetation management
Eskom has clearly defined environmental procedures for managing vegetation growing within the servitudes, recognising that vegetation management within power line and other servitudes has financial, social and environmental implications (Anon., 2010). The procedures state that clearing of vegetation needs to be done as economically as possible, without causing unnecessary environmental damage and without impacting on the rights and requirements of the landowner and other interested and affected parties. In terms of the Occupational Health and Safety Act, 1993 (Act 85 of 1993), “The supplier, or user of power lines shall control vegetation in order to prevent it from encroaching on the minimum safety clearances of the power lines and the owner of the vegetation shall permit such control”. Trees that are growing close enough to power lines to threaten them should they fall will be removed, but indigenous vegetation that does not interfere with the safe operation of the power line should be left undisturbed. Species protected by law will not be cut without a permit from the relevant authority. Alien vegetation, specifically category 1, 2 and 3 plants, will be controlled and removed in such a way as not to spread propagules. The risk of fire below the power lines needs to be kept to a minimum, so vegetation needs to be kept under control. But apart from this, indigenous vegetation will not be disturbed. Some general restrictions are that deep valleys, environmentally sensitive areas and legally protected areas shall not be cleared provided that the vegetation poses no threat to the safe operation or reliability of the power line. Measures to prevent soil erosion shall, at all times, be implemented and rivers, watercourses and other water bodies shall at all times be kept clear of vegetation trimmings and debris. The integrity of riparian areas shall be maintained by only trimming the parts of trees directly affecting the safe operation of the power line.
Implications for the study
The Eskom vegetation guidelines are comprehensive, although the practical application in the field cannot be guaranteed, especially if untrained workers are utilised to control vegetation. A relevant on-the-job-training course should be investigated.

91
Artificial and Constructed Wetlands
Function of constructed wetlands
Wetlands are nature’s biological filters and are crucial for the improvement of water quality and pollution reduction (Sheoran and Sheoran, 2006). Wetlands assist in the prevention of floods through water retention. As wetlands are water rich areas they also attract a wide variety of animals, therefore acting as an enhancer and protectors of biodiversity. Artificial wetlands are sometimes spontaneously created by a change in the landscape, for example next to roads due to increased run-off. Constructed wetlands on the other hand are designed with a specific purpose in mind. Constructed wetlands assists in pollution reduction through removal of nutrients and other harmful pollutants, including acid mine drainage (AMD) from surface or underground coal mines (Nicomrat et al., 2006). Established constructed wetlands have the capacity to fulfil the same functions as natural wetlands and have the potential to become somewhat self-sustaining in fulfilling these functions (Arroyo et al., 2010). This self-sustainability is often referred to as “passive” technology. Constructed wetlands can also increase biodiversity (Batty et al., 2005) by increasing wildlife habitats (Arroyo et al., 2010). They can also function as environmental recreational sites (HydrateLife, 2012), and can provide educational possibilities (Odinga et al., 2011).
Several mechanisms are involved in the removal of pollutants from water entering a natural or constructed wetland. Sedimentation, for example is recognized as the principle process in the removal of heavy metals from waste water in natural and constructed wetlands (Sheoran and Sheoran, 2006). Sedimentation occurs when metals or other suspended particulate are accumulated into large enough particles to sink, and the metals and other particulate matter are then trapped within the wetland sediments. Another mechanism for removing metals is through sulphate-reducing bacteria (SRB). Wetland plants also remove nutrients such as phosphate or nitrate by “uptake or precipitation near the roots”. Plants need to be carefully chosen to fulfil the required functions, because different plant species respond differently to different forms of pollution (Russel, 2009). Consideration however, must be given to legislation governing alien species and declared weeds. In certain cases, for example the water hyacinth (Eichhornia crassipes), plants may have useful properties for the purposes of pollutant removal, but are declared weeds and are not allowed to be deliberately planted in a wetland or in a specific region (Russel, 2009). It is important to consider the complete “life-cycle” of constructed wetlands. Plants absorb pollutants, but upon saturation it is required to dispose of them in an environmentally friendly manner. Composting or burning the plants will release the contaminants back into the environment, making the use of the constructed wetlands redundant (Russel, 2009). Bacteria are removed through a combination of sedimentation (due to their adherence to sediments), increased opportunities for predation and exposure to UV (Cohen, 2006).
Construction
Constructing wetlands can entail either making use of only a “pure” wetland or to use it in conjunction with other pollution reducing methods. The use of “pure” wetlands depends on the required designed function, the amount of land area available, the pH, and other environmental factors such as which plants will grow where. This type of “pure” wetlands is also referred to as passive treatment. The inclusion of other methods in conjunction with wetlands includes the use of additional limestone or other chemical techniques as pre-treatment before the water enters the wetland (Greger and Nyquist, 2009). Using “pure” wetlands reduces the need to chemically treat water, but pre-treating water has the potential to extend a constructed wetland’s life.

92
Cost, maintenance and lifetime
Various and conflicting opinions are evident in the literature (Sheoran and Sheoran, 2006), (Cohen, 2006), (Gitari et al., 2011), (HydrateLife, 2012), however, it appears that a good approach to decide whether a constructed wetland is cost-effective or not is to compare it to other alternatives that could potentially treat the same or similar problems.
There are several opinions regarding the lifetime period of constructed wetlands, these opinions range from a life of approximately 5 years (Russel, 2009) and can be as long as 20 to 30 years (Coleman et al., 2011). Ideally, the constructed wetland should be self-sustaining, however maintenance might be required when it becomes evident that plants have reached their saturation point and need to be replaced (Coleman et al., 2011). Concerns have been raised by experts about the saturation-point of the plants used in the constructed wetlands, especially when the constructed wetland is used to treat non-biodegradable pollutants such as metals (Arroyo et al., 2010).
An increase in the amount of mosquitos (Malan et al., 2009) could be a consequence of a constructed wetland, especially if the conditions are in line with their breeding habits. Methods, such as draining and in-filling, can be employed to regulate the mosquito population (Malan et al., 2009).
Feasibility
A report by Grobelaar et al. (2004) stated that “the use of wetlands for the treatment of mine water has been a failure under South African conditions…after more than 25 years of research into the matter.” Further in the document the authors divide wetlands into two types: “Well-constructed structures kept under anaerobic conditions and harvested periodically to remove heavy metal build-up” and the second type, that is wetlands that are not well maintained and merely becoming toxic waste sites. The authors classify South African wetlands into this category.
Current research on the functioning of the rehabilitation on the 139 ha Zaalklapspruit wetland in the Mpumalanga Highveld coal mining area, a wetland receiving AMD, is showing promising results in the capacity of the wetland to improve water quality. The Zaalklapspruit was originally an unchannelled valley bottom wetland, but agricultural activities had caused a channel to be eroded through the wetland. The rehabilitation has re-established the typical unchannelled wetland pattern of water flow across the entire wetland, slowing the passage of water through the wetland. Initial monitoring results have shown an increase in pH and a reduction in the level of dissolved metals (Van Vuuren, 2014). Van Vuuren (2014) notes that, while wetlands do not have unlimited capacity to improve water quality, when employed as part of an integrated water quality improvement strategy together with such measures as reducing the pollution at source, they can fulfil a useful role.
The USA though, have had demonstrated success with constructed wetlands. As a result of research by the US Bureau of Mines, over 400 engineered wetlands were constructed on mined lands in the previous four years (Kleinmann, 2006). Mine operators indicated that the wetlands assisted in reducing the amount of chemical treatment required. The amount saved in the amount of chemicals used, repaid the cost of constructing the wetland in under a year.
A research and development project by the Environment Agency (Wiseman, 2002) “demonstrated that passive constructed wetland treatment systems can be an effective and low cost means of mine water treatment for both net alkaline and net acidic discharges.” Five wetlands in various phases where analysed. The wetlands were not problem-free, but the main recommendation from the research, was that a “routine inspection and maintenance programme” should be developed. It was also noted that a characteristic of constructed wetlands is that they are low maintenance, not maintenance free.

93
Implications for the study
Constructed wetlands are an environmental and an economically viable treatment method, however a plan needs to be in place to ensure that routine inspection is done and that there is a maintenance programme. A pilot project as a first step would assist with determination of the feasibility of constructed wetlands within the Eskom context.

94
3 THE WETLAND MANAGEMENT FRAMEWORK
3.1 THE WETLAND MANGEMENT FRAMEWORK: INTRODUCTION
An Overview of the Term “Adaptive Management”
Given that the overall aim of this project is to develop and test an adaptable planning framework that streamlines the conservation of wetlands in areas where Eskom operates from coal to customer, it is necessary to unpack what the term means in this context.
“Adaptive management” was first introduced to the sphere of natural resource management by Holling (1978) with his concept of “Adaptive Resource Management”. Adaptive management has been defined by Rogers and Lutton (2011) (quoting Meffe et al. (2002)) as:
The process of treating resource management as an experiment such that the
practicality of trial and error is added to the rigour and explicitness of the scientific
experiment, producing learning that is both relevant and valid.
Adaptive management can be summarised under three headings:
• Active (classic or true) adaptive management in which the emphasis is strongly on the scientific method, the process of “experiment” and on modelling
• Passive adaptive management in which there is much less emphasis on the scientific method/experiment and more on learning by a range of means/tools
• Documented trial and error in which there is no stipulated structure to the decision making process but what does happen and its consequences are nonetheless well documented.
Active adaptive management has the following basic steps:
1. List imaginative policy options 2. Model system function and likely response to the new policy 3. Identify gaps in knowledge during the modelling process 4. Management actions designed and implemented as large scale experiment to fill
information gaps 5. Monitor system performance/response to management manipulation 6. Modify model on basis of experiment outcomes to decide on best policy.
It is proposed that Eskom follows an active adaptive management process to ensure on-going improvement of and maintaining the relevance of this Wetland Management Framework (WMF). Figure 23 below provides an overview of an adaptive management framework compiled by Kotze (2004) for the Mondi Wetlands Project.

95
Figure 23: An overall adaptive management framework for the management of open areas by Mondi (Kotze, 2004)
PURPOSE OF THIS WMF
Defining the Term “Framework”
A framework has been aptly defined by the Business Directory as: “A broad overview, outline, or skeleton of interlinked items which supports a particular approach to a specific objective, and serves as a guide that can be modified as required by adding or deleting items. (http://www.businessdictionary.com/definition/framework.html#ixzz2WfiFH7fk, 2013).
Within the context of the WMF, it is important to acknowledge that this represents a broad overview, outline or skeleton of interlinked items to support Eskom’s commitment to ensuring that the ecosystems (and wetlands in particular), under their jurisdiction are maintained in a healthy ecological state. The WMF should therefore be seen as a generic framework for a conservation plan that must be implemented, with appropriate customisation.
This WMF will therefore promote the conservation of the environment, with due cognisance of the ecosystem services that it provides. The Framework will adopt the principle of adaptive management with the feedback loops designed to ensure that the principle of ‘learning by doing’ is effectively implemented. The overall framework will consist of several sub-frameworks, each designed to address specific aspects of Eskom’s activities. These sub-frameworks will be integrated into the overarching WMF in such a way that the
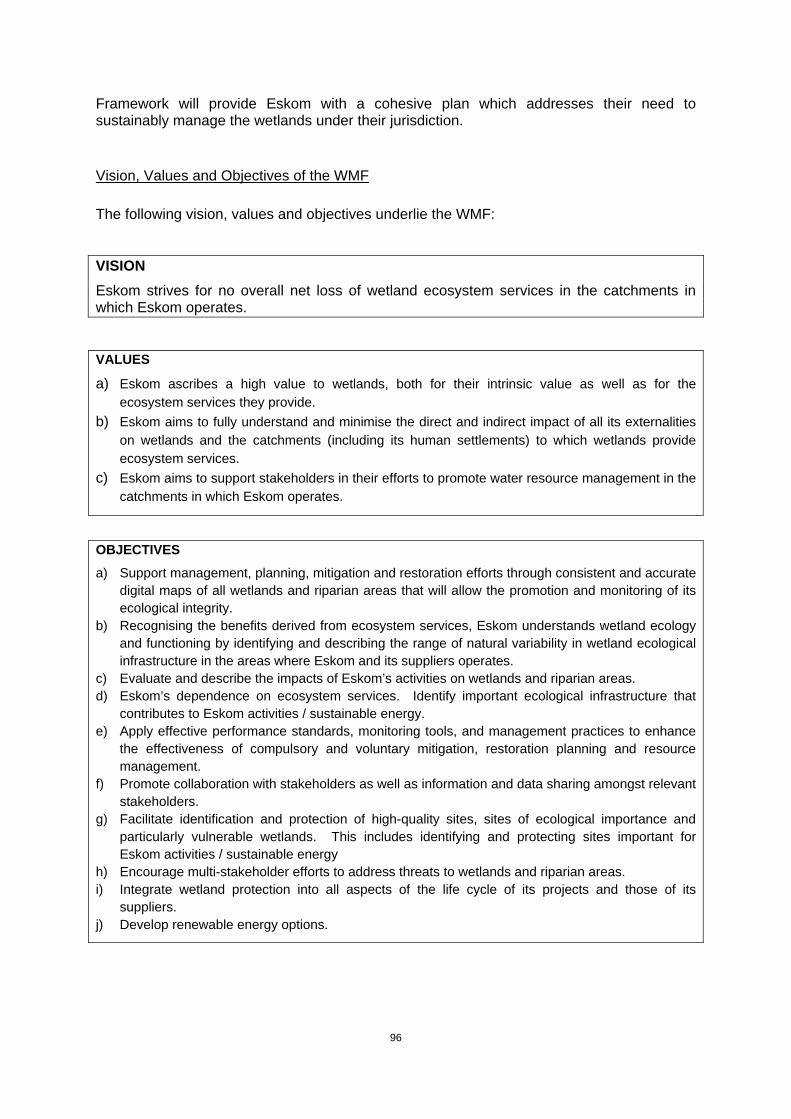
96
Framework will provide Eskom with a cohesive plan which addresses their need to sustainably manage the wetlands under their jurisdiction.
Vision, Values and Objectives of the WMF
The following vision, values and objectives underlie the WMF:
VISION
Eskom strives for no overall net loss of wetland ecosystem services in the catchments in which Eskom operates.
VALUES
a) Eskom ascribes a high value to wetlands, both for their intrinsic value as well as for the ecosystem services they provide.
b) Eskom aims to fully understand and minimise the direct and indirect impact of all its externalities on wetlands and the catchments (including its human settlements) to which wetlands provide ecosystem services.
c) Eskom aims to support stakeholders in their efforts to promote water resource management in the catchments in which Eskom operates.
OBJECTIVES
a) Support management, planning, mitigation and restoration efforts through consistent and accurate digital maps of all wetlands and riparian areas that will allow the promotion and monitoring of its ecological integrity.
b) Recognising the benefits derived from ecosystem services, Eskom understands wetland ecology and functioning by identifying and describing the range of natural variability in wetland ecological infrastructure in the areas where Eskom and its suppliers operates.
c) Evaluate and describe the impacts of Eskom’s activities on wetlands and riparian areas. d) Eskom’s dependence on ecosystem services. Identify important ecological infrastructure that
contributes to Eskom activities / sustainable energy. e) Apply effective performance standards, monitoring tools, and management practices to enhance
the effectiveness of compulsory and voluntary mitigation, restoration planning and resource management.
f) Promote collaboration with stakeholders as well as information and data sharing amongst relevant stakeholders.
g) Facilitate identification and protection of high-quality sites, sites of ecological importance and particularly vulnerable wetlands. This includes identifying and protecting sites important for Eskom activities / sustainable energy
h) Encourage multi-stakeholder efforts to address threats to wetlands and riparian areas. i) Integrate wetland protection into all aspects of the life cycle of its projects and those of its
suppliers. j) Develop renewable energy options.
97
Sub-frameworks of the WMF
An overview of the sub-frameworks contained in this WMF is provided below:
a) Hierarchy of conservation targets
Given the varied nature and role of wetlands in the landscape, it will be required to take cognisance of and set conservation targets for each type of wetland affected by Eskom’s operations.
b) Monitoring and evaluation
Indicators will be developed to monitor each of the sub-frameworks described below. These will be based on the findings of the research and the targets set. This section will be completed after the pilot study.
c) Carbon and wetlands
Wetlands are considered important sinks for greenhouse gasses. Wetlands under Eskom’s jurisdiction will be ranked in terms of their Green House Gas (GHG) attenuation potential. This will ensure that the criteria and targets related to wetland conservation take cognisance of this important wetland function.
d) Wetland off-setting
There are times when Eskom is unable to avoid impacting on, or destroying wetlands. This sub-framework will outline the decision-making process on how this destruction may be offset to ensure no-net loss in the particular catchment.
e) Biodiversity conservation
This sub-framework will give methods for assessing the conservation status of the areas under consideration and outline the necessary interventions and monitoring process to ensure that targets are met.
f) Ecosystem services for communities
This sub-framework will set out the process for identifying and evaluating the value of the ecosystem services used by communities and how these will be affected by Eskom activities. Where the impact may be negative, the framework will include feedback loops to assess mitigation measures where these are appropriate. At the same time, opportunities will be identified to promote access to wetland goods and services by surrounding communities, in support of Eskom’s social responsibility initiatives.

98
g) Pollution attenuation for Eskom and their mines
The potential of wetlands (both natural and artificial) to attenuate pollution levels in surface water could be harnessed by Eskom to promote water quality in the catchments within which it operates. Understanding and incorporating this within the initial wetland inventory, will ensure that the criteria and targets related to wetland conservation take cognisance of this important wetland function.
h) RQOs of feeder catchments
Based on the pollution attenuation potential of wetlands, Eskom can set strategic conservation and rehabilitation targets to improve catchment water quality.
i) Waste treatment
Eskom generates a variety of wastes, some of which are air-borne, some water-borne and some solid. Each of these categories of waste will stress the environment and negatively impact on the biodiversity. This sub-framework will guide the effective management of the various treatment methods (e.g. high rate, artificial wetland, etc.) that may be selected. The Eskom policy of zero liquid effluent discharge will be progressively implemented, but this sub-framework will guide waste management under the current waste management regime.
APPROACH TO THE WMF
Action Categories
The elements of the Framework have been divided into four broad approaches to guide and focus the user with respect to the purpose of the elements contained in the framework. Table 20 below provides an explanation of the categories and their focus and impact areas, as well as the symbols that will be used in the WMF. The categories are:
• Catchment perspectives
• Corporate social responsibility
• Harnessing ecosystem services for the benefit of Eskom (including carbon and climate change issues)
• Legal compliance.
These categories were devised based on current Eskom initiatives, policies, strategies and value systems. Examples of prominent Eskom initiatives are provided in the two text boxes below:

99
Eskom presented its Vision 2030 with respect to water pathways to the Water Sector Leadership Group (WSLG) during 2009. This included milestones for the period 2009 to 2015 and 2016 to 2030 and includes targets related to compliance, partnerships, technology and management interventions which are all mostly focused on water use efficiencies.
These are given in the Annexure.
Eskom Water Strategy
Principles:
a) Social progress which recognizes the needs of everyone
b) Effective protection of the environment
c) Prudent use of natural resources
d) Supporting an environment of high, stable economic growth and employment
The major water strategic objectives identified in Eskom’s Water Strategy are:
a) Ensure long term water scenario planning
b) Meet the water requirements for new and existing power stations
c) Meet the water quality objectives of the various catchments
d) Manage water cost increases into the future
e) Influence policy, strategy, legislation and regulatory environment
f) Regular communication and intervention with respective government
departments and other stakeholders by means of a dedicated advocacy and
stakeholder engagement plan
g) Implementing a water conservation water demand management strategy
h) Water management assurance, advisory and supporting role to projects, power
stations and coal mines.
Specific actions undertaken/subtasks of relevance for this study include:
a) Endorsement of the UN CEO Water mandate
b) Ensuring zero liquid effluent discharge
c) The compilation of a procedure for coal supply contracting, in order to ensure
suppliers are legally compliant
d) Closure plans for defunct and cost-plus mines

100
Table 20: Wetland management framework approach and symbols used to indicate the category of focus or impact
Symbol Category of Focus or Impact
Legal compliance
This category refers to measures that Eskom has to take to ensure that it is in compliance with relevant South African legislation.
Harnessing ecosystem services for the benefit of Eskom (including carbon and climate change issues)
This category refers to ways in which Eskom can promote and sustainably use ecosystem good and services, on which the organisation as well as human health and wellbeing depends.
Corporate social responsibility
This category refers to matters “beyond the Eskom fence line” and is mainly strategic in nature with reference to maintaining good relationships with surrounding communities as well as support the need for social development, upliftment and poverty reduction in South Africa.
Catchment perspectives
This category refers to matters “beyond the Eskom fence line” and is mainly strategic in nature with reference to the current and future state of water resource in the relevant catchment.
Organisational Alignment
In order to ensure that the WMF is entrenched within Eskom, it is necessary to promote alignment with its organisational systems. Figure 24 below summarises the main systems that are typical of large organisations such as Eskom. It also indicates external linkages and that scientific principles should underlie the WMF.
As such, throughout the WMF, linkages with these systems will be indicated. For example, to ensure optimum access to data and information with respect to wetlands, it would be ideal to centralise such information or ensure its uptake in a catalogue of metadata.The WMF will, in cases such as these, remind the user to manage data by referring to “Data and Information Systems”. In the same manner, should the need for education and awareness become evident, the WMF will refer the user to Skills Development Systems.
To ensure that the WMF is properly entrenched within the organisation, corporate communication about its existence is advised.

101
Figure 24: The different organisational systems that characterise an organisation
The Eskom Project Life-Cycle Model (PLCM)
The WMF is ultimately aligned with the Eskom PLCM. The PLCM prescribes different project phases and the step required for each. The PLCM, as the accepted practice and management model of the life cycle of projects, is therefore ideal to form the foundation of the WMF.
Legislation, government policy and guidelines Stakeholders + Partners
Government Departments
Utility service users
Surrounding communities
Strategy
Mission
Goals & Objectives
Intent
Activity Systems
Structural systems
Measurement systems
Human resource systems
Communication systems
Financial systems
Coordination
Governance systems
Skills development systems
Data and Information systems
Risk management systems
Environmental management systems
Corporate reporting systems
Eskom
Scientific Body of Knowledge
Coal suppliers
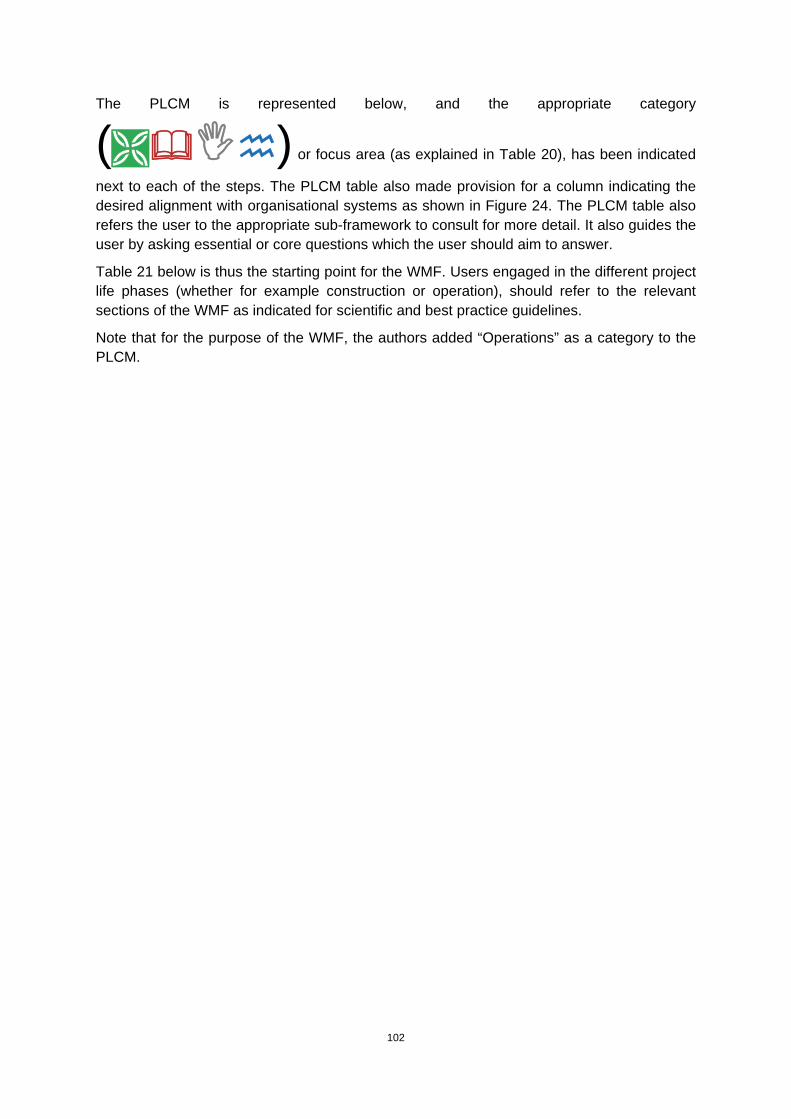
102
The PLCM is represented below, and the appropriate category
() or focus area (as explained in Table 20), has been indicated
next to each of the steps. The PLCM table also made provision for a column indicating the desired alignment with organisational systems as shown in Figure 24. The PLCM table also refers the user to the appropriate sub-framework to consult for more detail. It also guides the user by asking essential or core questions which the user should aim to answer.
Table 21 below is thus the starting point for the WMF. Users engaged in the different project life phases (whether for example construction or operation), should refer to the relevant sections of the WMF as indicated for scientific and best practice guidelines.
Note that for the purpose of the WMF, the authors added “Operations” as a category to the PLCM.

103
Tab
le 2
1: T
he
app
licat
ion
of
the
wet
lan
d m
anag
emen
t fr
amew
ork
(W
MF
) in
th
e co
nte
xt o
f th
e P
LC
M
Sta
ge
Ac
tio
n S
tep
s
Rel
eva
nce
to
C
ateg
ory
of
Fo
cus
or
Imp
act
(with
re
fere
nce
to T
able
20
)
Co
re Q
ues
tio
ns
Org
anis
atio
nal
E
lem
ents
(with
re
fere
nce
to F
igu
re
24)
Pre
-Fea
sib
ility
1.
E
stab
lish
Cor
e pr
ojec
t tea
m
i.
Is
the
team
aw
are
of
the
wet
land
m
anag
emen
t fr
amew
ork?
Ski
lls d
evel
opm
ent
syst
em
s
2.
P
erfo
rm
Con
cept
de
sign
i. W
ill a
ny w
etla
nds
be a
ffect
ed?
ii.
Has
a d
eskt
op-le
vel a
sses
smen
t be
en d
one
to d
eter
min
e th
e ar
ea o
f w
etla
nds
on s
ite,
its e
cosy
stem
ser
vice
s an
d th
e sp
atia
l rel
atio
nshi
p to
oth
er a
ctiv
ities
? iii
. W
hat i
s th
e ov
eral
l env
ironm
enta
l sta
te o
f the
cat
chm
ent?
iv
. A
re th
e R
QO
s be
ing
met
cur
rent
ly?
v.
How
wou
ld W
MF
influ
ence
the
conc
ept d
esig
n?
vi.
Wha
t is
the
sta
tus
of t
he w
etla
nd f
rom
a c
onse
rvat
ion
pers
pect
ive
(e.g
. ha
s it
been
lis
ted
as
cons
erva
tion
wor
thy?
) vi
i. Is
the
est
ablis
hmen
t of
art
ifici
al w
etla
nds
a fe
asib
le o
ptio
n to
tre
at a
nd p
reve
nt r
un-o
ff or
effl
uent
tha
t ca
n ca
use
envi
ronm
enta
l pol
lutio
n?
viii.
A
re t
here
any
opp
ortu
nitie
s fo
r w
etla
nd r
elat
ed r
esea
rch,
pr
omot
ing
CS
I th
roug
h su
stai
nabl
e liv
elih
oods
, ca
rbon
of
fset
ting
or w
etla
nd r
ehab
ilita
tion?
ix
. W
hat
kind
of
da
ta
sets
is
al
read
y av
aila
ble
for
the
wet
land
s on
si
te,
and
how
ca
n th
ey
be
inco
rpor
ated
/util
ized
?
Dat
a an
d In
form
atio
n sy
ste
ms
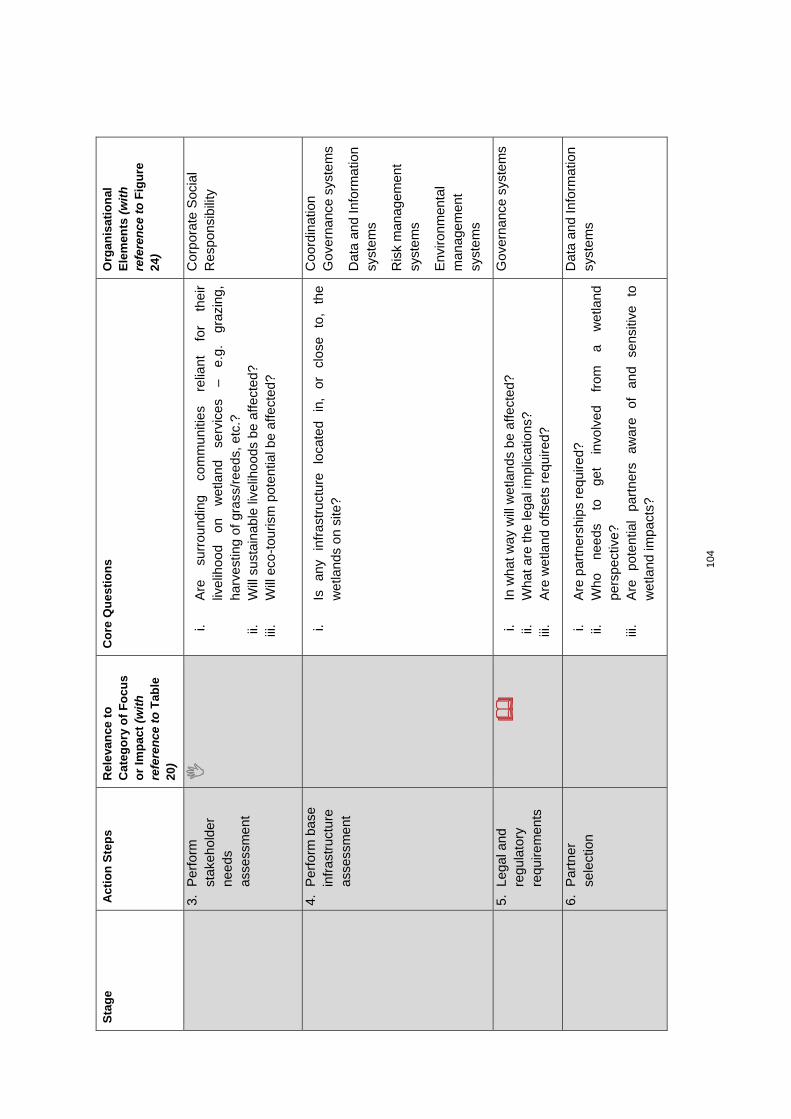
104
Sta
ge
Ac
tio
n S
tep
s
Rel
eva
nce
to
C
ateg
ory
of
Fo
cus
or
Imp
act
(with
re
fere
nce
to T
able
20
)
Co
re Q
ues
tio
ns
Org
anis
atio
nal
E
lem
ents
(with
re
fere
nce
to F
igu
re
24)
3.
P
erfo
rm
stak
ehol
der
need
s as
sess
men
t
i.
Are
su
rrou
ndin
g co
mm
uniti
es
relia
nt
for
thei
r liv
elih
ood
on
wet
land
se
rvic
es
– e.
g.
graz
ing,
ha
rves
ting
of g
rass
/ree
ds, e
tc.?
ii.
W
ill s
usta
inab
le li
velih
oods
be
affe
cted
? iii
. W
ill e
co-t
ouris
m p
oten
tial b
e af
fect
ed?
Cor
pora
te S
ocia
l R
espo
nsib
ility
4.
P
erfo
rm b
ase
infr
astr
uctu
re
asse
ssm
ent
i.
Is
any
infr
astr
uctu
re
loca
ted
in,
or
clos
e to
, th
e w
etla
nds
on s
ite?
Coo
rdin
atio
n G
over
nanc
e sy
stem
s
Dat
a an
d In
form
atio
n sy
ste
ms
Ris
k m
anag
emen
t sy
ste
ms
Env
ironm
enta
l m
anag
emen
t sy
ste
ms
5.
Le
gal a
nd
regu
lato
ry
requ
irem
ents
i.
In w
hat w
ay w
ill w
etla
nds
be a
ffect
ed?
ii.
W
hat a
re th
e le
gal i
mpl
icat
ions
? iii
. A
re w
etla
nd o
ffset
s re
quire
d?
Gov
erna
nce
syst
ems
6.
P
artn
er
sele
ctio
n
i. A
re p
artn
ersh
ips
requ
ired?
ii.
W
ho
need
s to
ge
t in
volv
ed
from
a
wet
land
pe
rspe
ctiv
e?
iii.
Are
po
tent
ial
part
ners
aw
are
of
and
sens
itive
to
w
etla
nd im
pact
s?
Dat
a an
d In
form
atio
n sy
ste
ms

105
Sta
ge
Ac
tio
n S
tep
s
Rel
eva
nce
to
C
ateg
ory
of
Fo
cus
or
Imp
act
(with
re
fere
nce
to T
able
20
)
Co
re Q
ues
tio
ns
Org
anis
atio
nal
E
lem
ents
(with
re
fere
nce
to F
igu
re
24)
7.
C
omm
erci
al
and
finan
cial
st
ruct
ure
i.
Are
the
re f
unds
ava
ilabl
e in
cas
e th
e w
etla
nd n
eed
rest
orat
ion
or s
peci
al m
anag
emen
t?
Fin
anci
al s
yste
ms
Sup
ply
chai
n sy
ste
ms
8.
B
usin
ess
case
an
d ris
k as
sess
men
t
ii.
Wha
t eco
syst
em s
erv
ices
can
be
harn
esse
d?
iii.
Wha
t eco
syst
em s
erv
ices
will
be
affe
cted
? iv
. Is
th
ere
an
oppo
rtun
ity
for
pove
rty
alle
viat
ion
or
sust
aina
ble
livel
ihoo
ds th
roug
h w
etla
nd u
se?
v.
Wha
t w
ill t
he i
mpl
icat
ion
be o
f w
etla
nd m
odifi
catio
n fo
r th
e ca
tchm
ent?
vi
. W
hich
nei
ghbo
urin
g la
ndow
ners
nee
d to
con
trib
ute
to
the
initi
ativ
e?
Com
mun
icat
ion
syst
em
s
Dat
a an
d In
form
atio
n sy
ste
ms
9.
S
take
hold
er
man
agem
ent
i. W
ho u
ses
the
wet
land
at p
rese
nt?
ii.
Wha
t go
ods
and
serv
ices
is
the
wet
land
bei
ng u
sed
for
at p
rese
nt?
iii.
How
w
ill
wet
land
m
odifi
catio
n af
fect
ne
ighb
ourin
g pr
oper
ties
or n
eigh
bour
ing
com
mun
ities
? iv
. Is
it n
eces
sary
to
enga
ge w
ith S
AN
BI,
DE
A,
the
loca
l w
etla
nd m
anag
emen
t fo
rum
, W
orki
ng f
or W
etla
nds,
lo
cal c
atch
men
t m
anag
emen
t ag
ency
or
DW
A a
t th
is
stag
e?
Com
mun
icat
ion
syst
em
s
Dat
a an
d In
form
atio
n sy
ste
ms
10
. Pro
ject
de
velo
pmen
t pl
anni
ng
i. W
hat w
ill th
e im
pact
be
on w
etla
nds?
ii.
W
hat
are
the
driv
ers
of
wet
land
ch
ange
an
d th
e cu
rren
t res
pons
es?
iii.
Hav
e w
etla
nds
and
thei
r bu
ffer
zone
s be
en in
dica
ted
on th
e pr
opos
ed s
ite la
yout
pla
n?
Com
mun
icat
ion
syst
em
s
Dat
a an
d In
form
atio
n

106
Sta
ge
Ac
tio
n S
tep
s
Rel
eva
nce
to
C
ateg
ory
of
Fo
cus
or
Imp
act
(with
re
fere
nce
to T
able
20
)
Co
re Q
ues
tio
ns
Org
anis
atio
nal
E
lem
ents
(with
re
fere
nce
to F
igu
re
24)
iv.
If w
etla
nds
will
be
dest
roye
d or
sig
nific
antly
mod
ified
, w
hat w
ill b
e th
e im
pact
on
the
abili
ty o
f th
e ca
tchm
ent
to
cont
inue
to
pr
ovid
e ec
osys
tem
se
rvic
es
at
the
sam
e le
vel t
han
befo
re?
v.
Will
the
RQ
Os
be m
et?
vi.
Are
wet
land
offs
ets
requ
ired?
vi
i. A
re th
ere
any
alte
rnat
ives
to m
inim
ise/
avoi
d im
pact
s:
− Lo
catio
n (a
ltern
ativ
e pr
oper
ties)
− S
ite (
alte
rnat
ive
site
s on
the
prop
erty
)
− A
ctiv
ity a
ltern
ativ
es
− La
yout
alte
rnat
ives
− D
esig
n al
tern
ativ
es
− T
echn
olog
y al
tern
ativ
es,
− O
pera
tiona
l alte
rnat
ives
vi
ii.
Wha
t are
the
oppo
rtun
ities
for
reha
bilit
atio
n,
cons
erva
tion
or w
etla
nd o
ffset
ting?
ix
. H
as th
e re
quire
d bu
ffer
zone
s be
en d
eter
min
ed?
(Reg
ulat
ory
line
of 5
00 m
from
bou
ndar
y of
wet
land
) x.
H
ave
the
requ
ired
envi
ronm
enta
l au
thor
isat
ions
/wat
er u
se a
utho
risat
ions
bee
n id
entif
ied
as w
ell a
s th
e im
pact
it w
ill h
ave
on th
e tim
e lin
e an
d pr
ojec
t bud
get?
syst
em
s

107
Sta
ge
Ac
tio
n S
tep
s
Rel
eva
nce
to
C
ateg
ory
of
Fo
cus
or
Imp
act
(with
re
fere
nce
to T
able
20
)
Co
re Q
ues
tio
ns
Org
anis
atio
nal
E
lem
ents
(with
re
fere
nce
to F
igu
re
24)
11
. Scr
een,
pr
iorit
ise
and
appr
oval
i.
Hav
e w
etla
nd m
anag
emen
t is
sues
bee
n in
clud
ed i
n th
e sc
reen
ing
crite
ria?
ii.
Wha
t ar
e th
e im
plic
atio
ns o
f th
ese
actio
n st
eps
on
prev
ious
fin
ding
s w
ith r
espe
ct t
o w
etla
nd o
n si
te a
nd
in th
e ca
tchm
ent?
Com
mun
icat
ion
syst
em
s
Dat
a an
d In
form
atio
n sy
ste
ms
12
. Ass
ess
stag
e an
d pl
an n
ext
stag
e
i.
Hav
e al
l wet
land
act
ions
bee
n co
nclu
ded
and
carr
ied
over
to th
e ne
xt p
hase
?
Com
mun
icat
ion
syst
em
s
Dat
a an
d In
form
atio
n sy
ste
ms
Fea
sib
ility
13. S
truc
ture
and
es
tabl
ish
DC
O
and
PM
O
Con
trac
t and
3rd
par
ty
stru
ctur
es
i.
Are
the
re a
ny w
etla
nd a
ctiv
ities
whi
ch w
ill r
equi
re t
he
incl
usio
n of
a fo
rmal
pos
ition
/rol
e in
the
PM
O?
Fin
anci
al s
yste
ms
Sup
ply
chai
n sy
ste
ms
14
. Dea
l st
ruct
urin
g an
d ba
nkab
le
repo
rt
i.
How
wou
ld W
MF
influ
ence
the
bank
able
rep
ort?
ii.
W
hat
are
the
finan
cial
impl
icat
ions
of
deci
sion
s ta
ken
rega
rdin
g w
etla
nds
on s
ite?
Fin
anci
al s
yste
ms
Sup
ply
chai
n sy
ste
ms

108
Sta
ge
Ac
tio
n S
tep
s
Rel
eva
nce
to
C
ateg
ory
of
Fo
cus
or
Imp
act
(with
re
fere
nce
to T
able
20
)
Co
re Q
ues
tio
ns
Org
anis
atio
nal
E
lem
ents
(with
re
fere
nce
to F
igu
re
24)
15
. Pre
limin
ary
site
se
lect
ion
i. W
hat i
s th
e st
atus
of t
he w
etla
nds
on s
ite?
ii.
H
ave
wet
land
s an
d th
eir
buffe
r zo
nes
been
indi
cate
d on
the
site
layo
ut p
lan?
(R
egul
ator
y zo
ne 5
00 m
) iii
. W
hat w
ill th
e im
pact
be
on w
etla
nds
as w
ell a
s on
the
dr
iver
s of
wet
land
cha
nge?
iv
. W
hat a
re th
e cu
rren
t res
pons
es to
wet
land
impa
cts?
v.
W
hat
is t
he r
ole
of t
he w
etla
nd/s
in
the
catc
hmen
t an
d ha
ve a
ny b
een
earm
arke
d fo
r co
nser
vatio
n?
vi.
Wha
t is
the
PE
S a
nd E
IS s
tatu
s?
vii.
If w
etla
nds
will
be
dest
roye
d or
sig
nific
antly
mod
ified
, w
hat w
ill b
e th
e im
pact
on
the
abili
ty o
f th
e ca
tchm
ent
to
cont
inue
to
pr
ovid
e ec
osys
tem
se
rvic
es
at
the
sam
e le
vel t
han
befo
re?
viii.
A
re th
ere
any
alte
rnat
ives
to m
inim
ise
impa
cts:
− Lo
catio
n (a
ltern
ativ
e pr
oper
ties)
− S
ite (
alte
rnat
ive
site
s on
the
prop
erty
)
− A
ctiv
ity a
ltern
ativ
es
− La
yout
alte
rnat
ives
− D
esig
n al
tern
ativ
es
− T
echn
olog
y al
tern
ativ
es,
− O
pera
tiona
l alte
rnat
ives
ix
. W
hat
are
the
oppo
rtun
ities
fo
r re
habi
litat
ion,
co
nser
vatio
n or
wet
land
offs
ettin
g?
x.
Has
the
requ
ired
buffe
r zo
nes
been
det
erm
ined
? xi
. H
ave
the
requ
ired
envi
ronm
enta
l an
d w
ater
us
e
Com
mun
icat
ion
syst
em
s
Dat
a an
d In
form
atio
n sy
ste
ms

109
Sta
ge
Ac
tio
n S
tep
s
Rel
eva
nce
to
C
ateg
ory
of
Fo
cus
or
Imp
act
(with
re
fere
nce
to T
able
20
)
Co
re Q
ues
tio
ns
Org
anis
atio
nal
E
lem
ents
(with
re
fere
nce
to F
igu
re
24)
auth
oris
atio
ns b
een
iden
tifie
d as
wel
l as
the
impa
ct it
w
ill h
ave
on th
e tim
e lin
e an
d pr
ojec
t bud
get?
xi
i. H
as
the
poss
ible
im
pact
on
th
e R
QO
s be
en
iden
tifie
d?
xiii.
Is
ther
e a
wet
land
reh
abili
tatio
n pl
an?
16
. Exe
cute
EIA
, re
gula
tory
and
le
gal
i.
Has
a
wet
land
sp
ecia
list
been
ap
poin
ted
to
unde
rtak
e w
etla
nd s
tudi
es?
i. Is
the
wet
land
spe
cial
ist
SA
CN
AS
P r
egis
tere
d in
the
ap
prop
riate
pro
fess
iona
l cat
egor
y?
ii.
Doe
s th
e sc
ope
of
the
wet
land
st
udy
adeq
uate
ly
addr
ess
the
requ
irem
ents
of
the
proj
ect
as w
ell
as
the
obje
ctiv
es o
f thi
s F
ram
ewor
k?
iii.
Hav
e al
l w
etla
nds
and
thei
r bu
ffer
zone
s be
en
delin
eate
d an
d id
entif
ied?
iv
. H
ave
the
PE
S a
nd E
IS b
een
dete
rmin
ed a
s w
ell
as
whi
ch s
peci
fic E
S a
re i
mpo
rtan
t. H
ave
all
wet
land
he
alth
impa
cts
and
thre
ats
been
iden
tifie
d?
v.
Is t
here
an
appr
opria
te e
nviro
nmen
tal
man
agem
ent
plan
to p
reve
nt/m
anag
e w
etla
nd im
pact
s?
vi.
Has
the
del
inea
tion
data
(sh
ape
files
) be
en o
btai
ned
from
the
Con
sulta
nt?
vii.
Has
an
appl
icat
ion
been
sub
mitt
ed f
or a
ll re
leva
nt
envi
ronm
enta
l aut
horis
atio
ns?
viii.
If
a w
etla
nd o
ffset
is
requ
ired,
has
the
nec
essa
ry
info
rmat
ion
requ
ired
to
dete
rmin
e of
fset
s be
en
acqu
ired?
ix
. H
ave
all t
he im
pact
s to
the
wet
land
bee
n id
entif
ied?
Dat
a an
d In
form
atio
n sy
ste
ms
Com
mun
icat
ion
syst
em
s
Fin
anci
al s
yste
ms
Sup
ply
chai
n sy
ste
ms

110
Sta
ge
Ac
tio
n S
tep
s
Rel
eva
nce
to
C
ateg
ory
of
Fo
cus
or
Imp
act
(with
re
fere
nce
to T
able
20
)
Co
re Q
ues
tio
ns
Org
anis
atio
nal
E
lem
ents
(with
re
fere
nce
to F
igu
re
24)
x.
Hav
e th
e ne
cess
ary
sam
ples
bee
n ta
ken
in o
rder
to
dete
rmin
e th
e ca
rbon
sto
ck o
f the
wet
land
? xi
. H
as
the
pote
ntia
l ef
fect
on
th
e R
QO
s be
en
iden
tifie
d?
17
. Pro
duce
use
r re
quire
men
t sp
ec (
UR
S)
ii.
H
ave
rele
vant
W
MF
re
quire
men
ts/g
uide
lines
be
en
incl
uded
in th
e U
RS
?
Dat
a an
d In
form
atio
n sy
ste
ms
Com
mun
icat
ion
syst
em
s
18
. Per
form
bas
ic
desi
gn
i. H
ave
wet
land
s an
d th
eir
buffe
r zo
nes
been
indi
cate
d on
the
site
layo
ut p
lan?
ii.
A
re t
here
any
alte
rnat
ives
to
the
proj
ect
desi
gn/la
y-ou
t to
min
imis
e im
pact
s on
wet
land
s, e
.g.:
− Lo
catio
n (a
ltern
ativ
e pr
oper
ties)
− S
ite (
alte
rnat
ive
site
s on
the
prop
erty
)
− A
ctiv
ity a
ltern
ativ
es
− La
yout
alte
rnat
ives
− D
esig
n al
tern
ativ
es
− T
echn
olog
y al
tern
ativ
es,
− O
pera
tiona
l alte
rnat
ives
iii.
If re
habi
litat
ion
will
be
un
dert
aken
, ha
ve
a
Dat
a an
d In
form
atio
n sy
ste
ms
Com
mun
icat
ion
syst
em
s
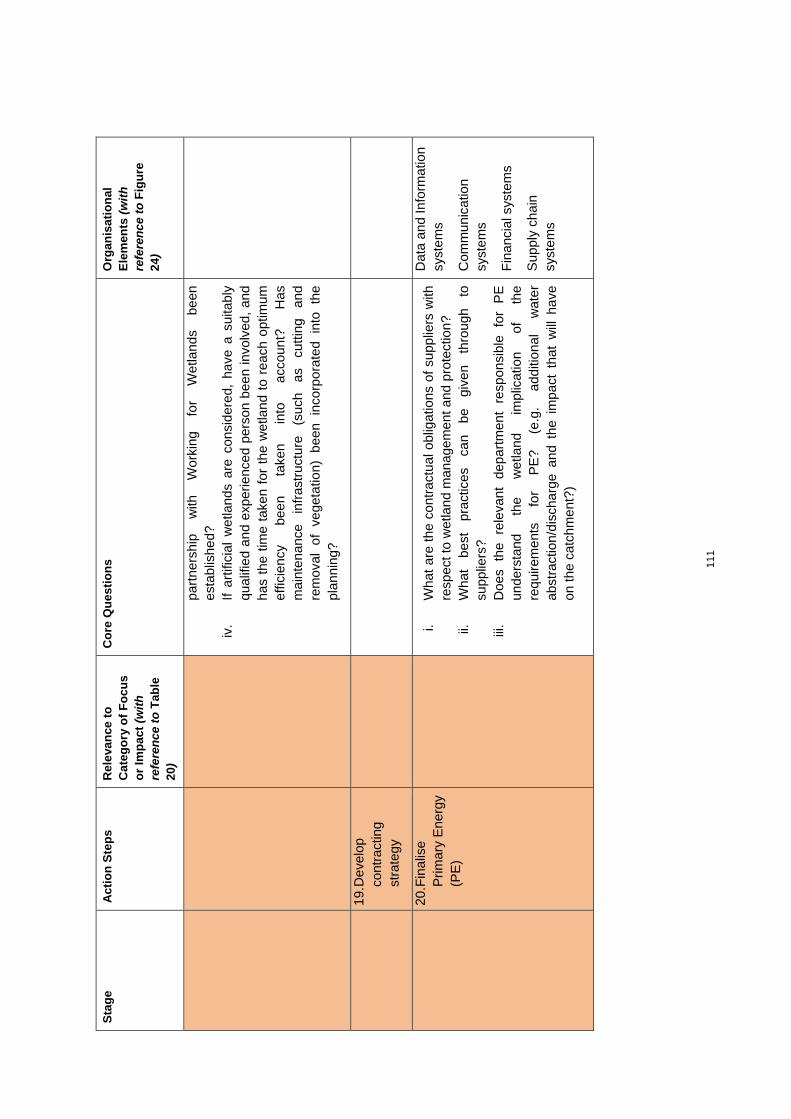
111
Sta
ge
Ac
tio
n S
tep
s
Rel
eva
nce
to
C
ateg
ory
of
Fo
cus
or
Imp
act
(with
re
fere
nce
to T
able
20
)
Co
re Q
ues
tio
ns
Org
anis
atio
nal
E
lem
ents
(with
re
fere
nce
to F
igu
re
24)
part
ners
hip
with
W
orki
ng
for
Wet
land
s be
en
esta
blis
hed?
iv
. If
artif
icia
l w
etla
nds
are
cons
ider
ed,
have
a s
uita
bly
qual
ified
and
exp
erie
nced
per
son
been
invo
lved
, an
d ha
s th
e tim
e ta
ken
for
the
wet
land
to
reac
h op
timum
ef
ficie
ncy
been
ta
ken
into
ac
coun
t?
Has
m
aint
enan
ce
infr
astr
uctu
re
(suc
h as
cu
tting
an
d re
mov
al
of
vege
tatio
n)
been
in
corp
orat
ed
into
th
e pl
anni
ng?
19
. Dev
elop
co
ntra
ctin
g st
rate
gy
20
. Fin
alis
e P
rimar
y E
nerg
y (P
E)
i.
Wha
t ar
e th
e co
ntra
ctua
l obl
igat
ions
of
supp
liers
with
re
spec
t to
wet
land
man
agem
ent a
nd p
rote
ctio
n?
ii.
Wha
t be
st
prac
tices
ca
n be
gi
ven
thro
ugh
to
supp
liers
? iii
. D
oes
the
rele
vant
de
part
men
t re
spon
sibl
e fo
r P
E
unde
rsta
nd
the
wet
land
im
plic
atio
n of
th
e re
quire
men
ts
for
PE
? (e
.g.
addi
tiona
l w
ater
ab
stra
ctio
n/di
scha
rge
and
the
impa
ct t
hat
will
hav
e on
the
catc
hmen
t?)
Dat
a an
d In
form
atio
n sy
ste
ms
Com
mun
icat
ion
syst
em
s
Fin
anci
al s
yste
ms
Sup
ply
chai
n sy
ste
ms

112
Sta
ge
Ac
tio
n S
tep
s
Rel
eva
nce
to
C
ateg
ory
of
Fo
cus
or
Imp
act
(with
re
fere
nce
to T
able
20
)
Co
re Q
ues
tio
ns
Org
anis
atio
nal
E
lem
ents
(with
re
fere
nce
to F
igu
re
24)
21
. Fin
alis
e si
te
sele
ctio
n
i. H
ave
wet
land
s be
en
prio
ritis
ed
for
inte
rven
tions
, su
ch a
s re
habi
litat
ion
or p
rote
ctio
n?
ii.
Hav
e w
etla
nds
and
thei
r bu
ffer
zone
s be
en in
dica
ted
on th
e si
te la
yout
pla
n?
iii.
Hav
e th
e co
rrec
t ra
nkin
g va
lue
been
ass
igne
d to
the
w
etla
nds
in
term
s of
th
eir
pote
ntia
l G
HG
se
ques
trat
ion?
Dat
a an
d In
form
atio
n sy
ste
ms
Com
mun
icat
ion
syst
em
s
22
. Pre
pare
and
di
strib
ute
RF
Is
i.
Hav
e re
leva
nt w
etla
nd m
atte
rs b
een
incl
uded
in
the
RF
I?
23
. Est
ablis
h pr
ojec
t m
anag
emen
t su
ppor
t
i.
Doe
s th
e pr
ojec
t re
quire
an
y sp
ecia
l w
etla
nd
supp
ort?
Dat
a an
d In
form
atio
n sy
ste
ms
Com
mun
icat
ion
syst
em
s
Fin
anci
al s
yste
ms
Sup
ply
chai
n sy
ste
ms
24
. Est
ablis
h C
O
man
agem
ent
supp
ort
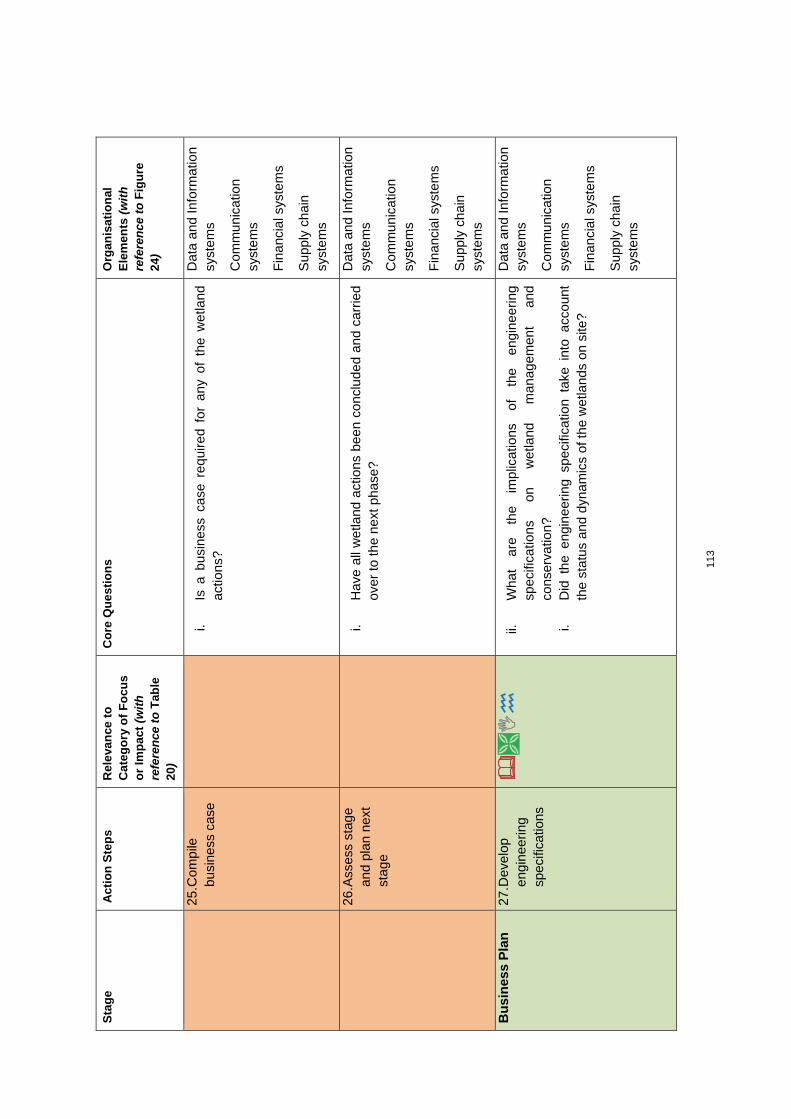
113
Sta
ge
Ac
tio
n S
tep
s
Rel
eva
nce
to
C
ateg
ory
of
Fo
cus
or
Imp
act
(with
re
fere
nce
to T
able
20
)
Co
re Q
ues
tio
ns
Org
anis
atio
nal
E
lem
ents
(with
re
fere
nce
to F
igu
re
24)
25
. Com
pile
b
usi
ness
cas
e
i. Is
a b
usin
ess
case
req
uire
d fo
r an
y of
the
wet
land
ac
tions
?
Dat
a an
d In
form
atio
n sy
ste
ms
Com
mun
icat
ion
syst
em
s
Fin
anci
al s
yste
ms
Sup
ply
chai
n sy
ste
ms
26
. Ass
ess
stag
e an
d pl
an n
ext
stag
e
i.
Hav
e al
l wet
land
act
ions
bee
n co
nclu
ded
and
carr
ied
over
to th
e ne
xt p
hase
?
Dat
a an
d In
form
atio
n sy
ste
ms
Com
mun
icat
ion
syst
em
s
Fin
anci
al s
yste
ms
Sup
ply
chai
n sy
ste
ms
Bu
sin
ess
Pla
n
27. D
evel
op
engi
neer
ing
spec
ifica
tions
ii.
Wha
t ar
e th
e im
plic
atio
ns
of
the
engi
neer
ing
spec
ifica
tions
on
w
etla
nd
man
agem
ent
and
cons
erva
tion?
i.
Did
the
eng
inee
ring
spec
ifica
tion
take
int
o ac
coun
t th
e st
atus
and
dyn
amic
s of
the
wet
land
s on
site
?
Dat
a an
d In
form
atio
n sy
ste
ms
Com
mun
icat
ion
syst
em
s
Fin
anci
al s
yste
ms
Sup
ply
chai
n sy
ste
ms
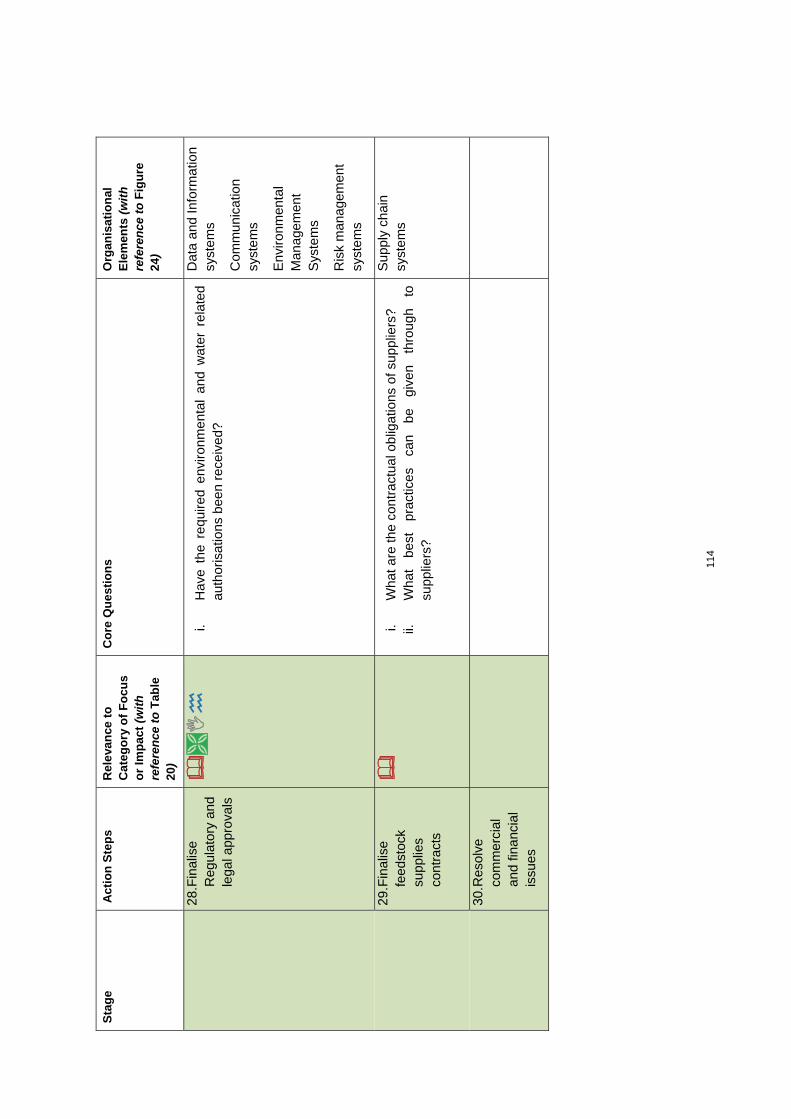
114
Sta
ge
Ac
tio
n S
tep
s
Rel
eva
nce
to
C
ateg
ory
of
Fo
cus
or
Imp
act
(with
re
fere
nce
to T
able
20
)
Co
re Q
ues
tio
ns
Org
anis
atio
nal
E
lem
ents
(with
re
fere
nce
to F
igu
re
24)
28. F
inal
ise
Reg
ulat
ory
and
lega
l app
rova
ls
i. H
ave
the
requ
ired
envi
ronm
enta
l an
d w
ater
rel
ated
au
thor
isat
ions
bee
n re
ceiv
ed?
Dat
a an
d In
form
atio
n sy
ste
ms
Com
mun
icat
ion
syst
em
s
Env
ironm
enta
l M
anag
emen
t S
yste
ms
Ris
k m
anag
emen
t sy
ste
ms
29. F
inal
ise
feed
stoc
k su
pplie
s co
ntra
cts
i.
Wha
t are
the
cont
ract
ual o
blig
atio
ns o
f sup
plie
rs?
ii.
Wha
t be
st
prac
tices
ca
n be
gi
ven
thro
ugh
to
supp
liers
?
Sup
ply
chai
n sy
ste
ms
30. R
esol
ve
com
mer
cial
an
d fin
anci
al
issu
es

115
Sta
ge
Ac
tio
n S
tep
s
Rel
eva
nce
to
C
ateg
ory
of
Fo
cus
or
Imp
act
(with
re
fere
nce
to T
able
20
)
Co
re Q
ues
tio
ns
Org
anis
atio
nal
E
lem
ents
(with
re
fere
nce
to F
igu
re
24)
31. P
roje
ct
exec
utio
n st
rate
gy
i.
Hav
e al
l wet
land
man
agem
ent
actio
ns b
een
capt
ured
in
the
stra
tegy
? ii.
If
a w
etla
nd o
ffset
is
requ
ired,
has
fun
ds b
een
set
asid
e fo
r th
is a
ctiv
ity?
Dat
a an
d In
form
atio
n sy
ste
ms
Com
mun
icat
ion
syst
em
s
Fin
anci
al s
yste
ms
Sup
ply
chai
n sy
ste
ms
32. L
ife c
ycle
op
erat
ion
plan
i. H
ave
appr
opria
te i
ndic
ator
s be
en d
efin
ed t
o m
onito
r an
d m
easu
re w
etla
nd r
elat
ed a
ctio
ns?
ii.
Hav
e th
e ap
prop
riate
sk
ills
been
as
sign
ed
to
the
proj
ect?
iii
. Is
ov
ersi
ght
requ
ired
to
mak
e su
re
that
th
e op
erat
iona
l tea
m u
ses
the
best
pra
ctic
es?
Dat
a an
d In
form
atio
n sy
ste
ms
Com
mun
icat
ion
syst
em
s
Fin
anci
al s
yste
ms
Sup
ply
chai
n sy
ste
ms
Ski
lls d
evel
opm
ent
syst
em
HR
sys
tem
s
33. F
inal
ise
pow
er
purc
hase
ag
reem
ent

116
Sta
ge
Ac
tio
n S
tep
s
Rel
eva
nce
to
C
ateg
ory
of
Fo
cus
or
Imp
act
(with
re
fere
nce
to T
able
20
)
Co
re Q
ues
tio
ns
Org
anis
atio
nal
E
lem
ents
(with
re
fere
nce
to F
igu
re
24)
34. D
etai
led
busi
ness
pla
n de
velo
ped
i.
Hav
e al
l wet
land
man
agem
ent
actio
ns b
een
capt
ured
in
the
busi
ness
pla
n?
Fin
anci
al s
yste
ms
Sup
ply
chai
n sy
ste
ms
35. I
nitia
te a
nd
stru
ctur
e pr
ojec
t set
-up
i.
Hav
e th
e ap
prop
riate
ski
lls a
nd r
espo
nsib
ilitie
s be
en
assi
gned
to th
e pr
ojec
t?
ii.
Are
en
viro
nmen
tal/w
etla
nd
awar
enes
s pr
ogra
ms
requ
ired
for
cont
ract
ors
on s
ite?
Ski
lls d
evel
opm
ent
syst
em
HR
sys
tem
s
36. D
ata
hand
ove
r to
exe
cutio
n
i. H
ave
any
delin
eatio
n pl
ans
and
man
agem
ent
actio
ns
been
han
ded
over
to th
e ap
prop
riate
per
son
on s
ite?
ii.
Are
th
e co
ntra
ctor
s pr
oper
ly
trai
ned
rega
rdin
g th
e w
etla
nd is
sues
on
site
?
Ski
lls d
evel
opm
ent
syst
em
HR
sys
tem
s
Sup
ply
chai
n sy
ste
ms
Dat
a an
d In
form
atio
n sy
ste
ms
Com
mun
icat
ion
syst
em
s
37. A
sses
s st
age
and
plan
nex
t st
age
i.
Hav
e al
l wet
land
act
ions
bee
n co
nclu
ded
and
carr
ied
over
to th
e ne
xt p
hase
?
Sup
ply
chai
n sy
ste
ms
Pla
nn
ing
&
Des
ign
38
. Pro
ject
Sta
rt-
up

117
Sta
ge
Ac
tio
n S
tep
s
Rel
eva
nce
to
C
ateg
ory
of
Fo
cus
or
Imp
act
(with
re
fere
nce
to T
able
20
)
Co
re Q
ues
tio
ns
Org
anis
atio
nal
E
lem
ents
(with
re
fere
nce
to F
igu
re
24)
39
. Est
ablis
h pr
ojec
t or
gani
satio
nal
stru
ctu
re
i.
Hav
e th
e ap
prop
riate
ski
lls a
nd r
espo
nsib
ilitie
s fo
r w
etla
nd m
anag
emen
t bee
n as
sign
ed to
the
proj
ect?
Ski
lls d
evel
opm
ent
syst
em
HR
sys
tem
s
40. P
re-q
ualif
y su
pplie
rs
i.
Wha
t are
the
cont
ract
ual o
blig
atio
ns o
f sup
plie
rs?
ii.
Wha
t be
st
prac
tices
ca
n be
gi
ven
thro
ugh
to
supp
liers
?
Ski
lls d
evel
opm
ent
syst
em
HR
sys
tem
s
Sup
ply
chai
n sy
ste
ms
Dat
a an
d In
form
atio
n sy
ste
ms
Com
mun
icat
ion
syst
em
s

118
Sta
ge
Ac
tio
n S
tep
s
Rel
eva
nce
to
C
ateg
ory
of
Fo
cus
or
Imp
act
(with
re
fere
nce
to T
able
20
)
Co
re Q
ues
tio
ns
Org
anis
atio
nal
E
lem
ents
(with
re
fere
nce
to F
igu
re
24)
41. L
ong-
lead
-tim
e ite
ms:
issu
e en
quiry
i.
If an
y ar
tific
ial
wet
land
s ar
e pl
anne
d, h
as t
he t
ime
take
n to
re
ach
optim
um
effic
ienc
y be
en
com
mun
icat
ed?
ii.
Are
th
e re
leva
nt
pers
ons
awar
e th
at
wat
er
use
licen
ses
(in c
ases
req
uire
d w
here
wet
land
s ar
e to
be
affe
cted
) ha
ve a
lon
g le
ad-t
ime
and
that
thi
s m
ay
impa
ct o
n pr
ojec
t exe
cutio
n sc
hedu
les?
iii
. H
ave
the
impl
icat
ions
of
lo
ng-t
erm
m
onito
ring
of
carb
on s
tock
s in
the
wet
land
s be
en c
omm
unic
ated
?
Ski
lls d
evel
opm
ent
syst
em
HR
sys
tem
s
Sup
ply
chai
n sy
ste
ms
Dat
a an
d In
form
atio
n sy
ste
ms
Com
mun
icat
ion
syst
em
s
Fin
anci
al s
yste
ms
42. D
etai
led
proc
urem
ent
and
cont
ract
ing
plan
i.
Wha
t are
the
cont
ract
ual o
blig
atio
ns o
f sup
plie
rs?
ii.
Wha
t be
st
prac
tices
ca
n be
gi
ven
thro
ugh
to
supp
liers
? iii
. D
o co
ntra
ctor
s ha
ve
the
rele
vant
ex
perie
nce,
an
d co
rrec
t met
hodo
logy
, etc
.?
Ski
lls d
evel
opm
ent
syst
em
HR
sys
tem
s
Sup
ply
chai
n sy
ste
ms
Dat
a an
d In
form
atio
n sy
ste
ms
Com
mun
icat
ion
syst
em
s
43. D
etai
led
fund
ing
and
call-
dow
n pl
an
i.
In t
he c
ase
of m
inin
g, w
hat
are
the
impl
icat
ions
in t
he
Qua
ntum
of
F
inan
cial
P
rovi
sion
fo
r w
etla
nd
reha
bilit
atio
n an
d m
anag
emen
t as
w
ell
as
any
rem
nant
hyd
rolo
gica
l im
pact
s?
Fin
anci
al s
yste
ms

119
Sta
ge
Ac
tio
n S
tep
s
Rel
eva
nce
to
C
ateg
ory
of
Fo
cus
or
Imp
act
(with
re
fere
nce
to T
able
20
)
Co
re Q
ues
tio
ns
Org
anis
atio
nal
E
lem
ents
(with
re
fere
nce
to F
igu
re
24)
44. P
roje
ct
impl
emen
tatio
n pl
an
i. H
ave
all w
etla
nd a
ctio
ns b
een
incl
uded
? ii.
Is
a s
take
hold
er m
anag
emen
t pla
n in
clud
ed?
iii.
Doe
s th
e pl
an
incl
ude
appr
opria
te
mon
itorin
g,
mea
sure
men
t and
rep
ortin
g to
ols?
iv
. H
as t
he c
ondi
tions
of
the
licen
ses/
EIA
s gr
ante
d by
th
e en
viro
nmen
tal a
utho
ritie
s be
en a
dher
ed to
?
Sup
ply
chai
n sy
ste
ms
Dat
a an
d in
form
atio
n
Env
ironm
enta
l m
anag
emen
t sy
ste
ms
45. A
sses
s st
age
and
plan
nex
t st
age
i.
Hav
e al
l wet
land
act
ions
bee
n co
nclu
ded
and
carr
ied
over
to th
e ne
xt p
hase
?
Sup
ply
chai
n sy
ste
ms
Dat
a an
d in
form
atio
n
Co
ntr
acti
ng
&
Pro
cure
men
t 46
. Com
plet
e ba
lanc
e of
en
quiri
es
i.
Wha
t are
the
cont
ract
ual o
blig
atio
ns o
f sup
plie
rs?
ii.
Wha
t be
st
prac
tices
ca
n be
gi
ven
thro
ugh
to
supp
liers
?
Sup
ply
chai
n sy
ste
ms
Dat
a an
d in
form
atio
n
Com
mun
icat
ion
syst
em
s
47. U
pdat
e pr
ojec
t im
plem
enta
tion
plan
i.
Hav
e w
etla
nds
and
thei
r bu
ffer
zone
s be
en in
dica
ted
on th
e si
te la
yout
pla
n?
ii.
Hav
e an
y ne
w w
etla
nd a
ctio
ns e
mer
ged
that
hav
e to
be
add
ed?
iii.
Is t
he p
roje
ct s
till
in l
ine
with
the
lic
ense
s/E
MP
s th
at
wer
e gr
ante
d as
wel
l as
the
man
agem
ent
obje
ctiv
es
for
the
wet
land
s?
Dat
a an
d in
form
atio
n
Env
ironm
enta
l m
anag
emen
t

120
Sta
ge
Ac
tio
n S
tep
s
Rel
eva
nce
to
C
ateg
ory
of
Fo
cus
or
Imp
act
(with
re
fere
nce
to T
able
20
)
Co
re Q
ues
tio
ns
Org
anis
atio
nal
E
lem
ents
(with
re
fere
nce
to F
igu
re
24)
48. A
sses
s st
age
and
plan
nex
t st
age
i.
Hav
e al
l wet
land
act
ions
bee
n co
nclu
ded
and
carr
ied
over
to th
e ne
xt p
hase
?
Sup
ply
chai
n sy
ste
ms
Dat
a an
d in
form
atio
n
Co
nst
ruct
ion
49
. Est
ablis
h si
te
supp
ort
infr
astr
uctu
re
i. H
ave
wet
land
s an
d th
eir
buffe
r zo
nes
been
indi
cate
d on
the
site
layo
ut p
lan?
ii.
H
ave
wet
land
s an
d th
eir
buffe
r zo
nes
been
de
mar
cate
d as
no-
go z
ones
? iii
. H
ow w
ill c
omm
uniti
es c
ontin
ue t
o ga
in a
cces
s to
the
w
etla
nd th
at s
usta
ins
thei
r liv
elih
oods
? iv
. W
here
ne
cess
ary,
ha
ve
wet
land
cr
ossi
ngs/
culv
erts
be
en p
rope
rly in
stal
led?
v.
H
ave
cont
ract
ors
been
brie
fed
abou
t no
-go
wet
land
ar
eas?
vi
. H
ave
cont
ract
ors
been
pr
oper
ly
trai
ned
in
the
rele
vant
wet
land
iss
ues/
Env
ironm
enta
l M
anag
emen
t P
lan
of th
e w
etla
nd o
n si
te?
Dat
a an
d in
form
atio
n
Ski
lls d
evel
opm
ent
syst
em
s
Com
mun
icat
ion
syst
em
s
Pro
cure
men
t sy
ste
ms
Ris
k m
anag
emen
t sy
ste
ms
Env
ironm
enta
l m
anag
emen
t sy
ste
ms
50. M
anag
e de
tail
desi
gn
i. H
ave
wet
land
s an
d th
eir
buffe
r zo
nes
been
indi
cate
d on
the
site
layo
ut p
lan?
ii.
H
ave
any
new
iss
ues
emer
ged
whi
ch c
an p
oten
tially
im
pact
on
wet
land
s?
iii.
If w
etla
nds
are
to b
e re
habi
litat
ed,
are
the
deta
iled
desi
gns
done
to th
e sa
tisfa
ctio
n of
WfW
et?
Ris
k m
anag
emen
t sy
ste
ms
Env
ironm
enta
l m
anag
emen
t sy
ste
ms
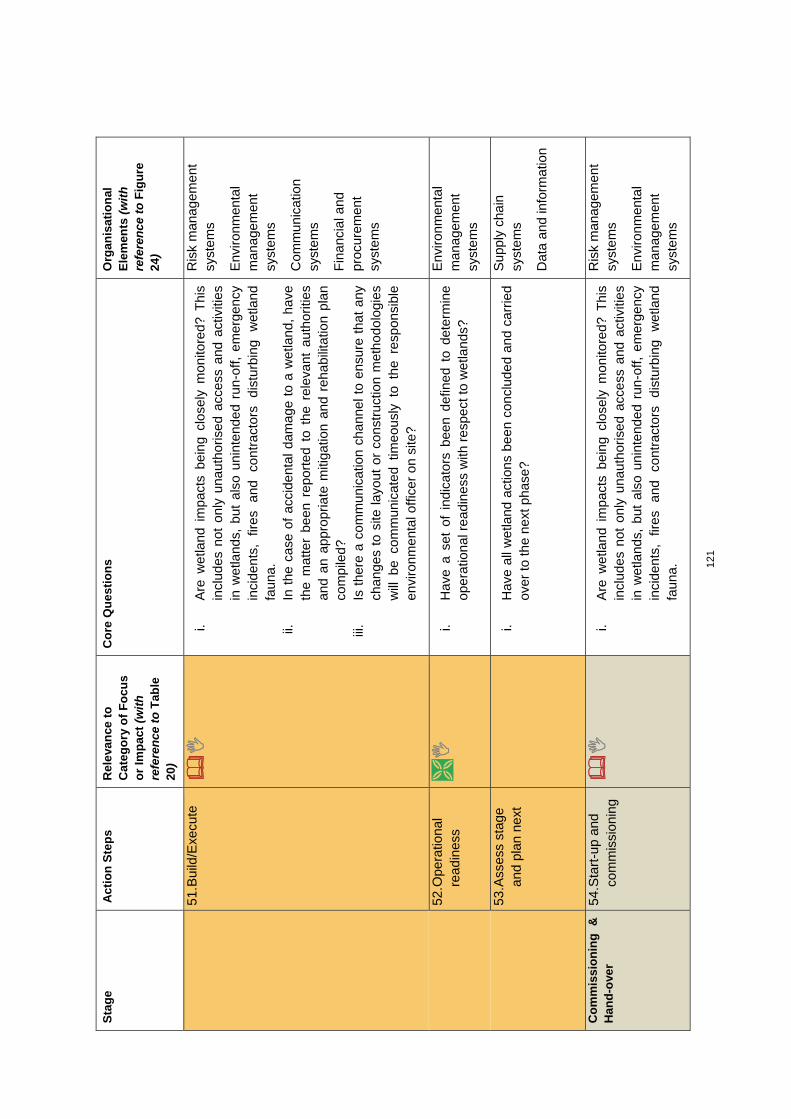
121
Sta
ge
Ac
tio
n S
tep
s
Rel
eva
nce
to
C
ateg
ory
of
Fo
cus
or
Imp
act
(with
re
fere
nce
to T
able
20
)
Co
re Q
ues
tio
ns
Org
anis
atio
nal
E
lem
ents
(with
re
fere
nce
to F
igu
re
24)
51. B
uild
/Exe
cute
i. A
re w
etla
nd i
mpa
cts
bein
g cl
osel
y m
onito
red?
Thi
s in
clud
es n
ot o
nly
unau
thor
ised
acc
ess
and
activ
ities
in
wet
land
s, b
ut a
lso
unin
tend
ed r
un-o
ff, e
mer
genc
y in
cide
nts,
fir
es
and
cont
ract
ors
dist
urbi
ng
wet
land
fa
una.
ii.
In
the
cas
e of
acc
iden
tal
dam
age
to a
wet
land
, ha
ve
the
mat
ter
been
rep
orte
d to
the
rel
evan
t au
thor
ities
an
d an
app
ropr
iate
miti
gatio
n an
d re
habi
litat
ion
plan
co
mpi
led?
iii
. Is
the
re a
com
mun
icat
ion
chan
nel t
o en
sure
tha
t an
y ch
ange
s to
site
lay
out
or c
onst
ruct
ion
met
hodo
logi
es
will
be
com
mun
icat
ed t
imeo
usly
to
the
resp
onsi
ble
envi
ronm
enta
l offi
cer
on s
ite?
Ris
k m
anag
emen
t sy
ste
ms
Env
ironm
enta
l m
anag
emen
t sy
ste
ms
Com
mun
icat
ion
syst
em
s
Fin
anci
al a
nd
proc
urem
ent
syst
em
s
52. O
pera
tiona
l re
adin
ess
i. H
ave
a se
t of
ind
icat
ors
been
def
ined
to
dete
rmin
e op
erat
iona
l rea
dine
ss w
ith r
espe
ct to
wet
land
s?
Env
ironm
enta
l m
anag
emen
t sy
ste
ms
53. A
sses
s st
age
and
plan
nex
t
i. H
ave
all w
etla
nd a
ctio
ns b
een
conc
lude
d an
d ca
rrie
d ov
er to
the
next
pha
se?
Sup
ply
chai
n sy
ste
ms
Dat
a an
d in
form
atio
n
Co
mm
issi
on
ing
&
H
and
-ove
r 54
. Sta
rt-u
p an
d co
mm
issi
onin
g
i. A
re w
etla
nd i
mpa
cts
bein
g cl
osel
y m
onito
red?
Thi
s in
clud
es n
ot o
nly
unau
thor
ised
acc
ess
and
activ
ities
in
wet
land
s, b
ut a
lso
unin
tend
ed r
un-o
ff, e
mer
genc
y in
cide
nts,
fir
es
and
cont
ract
ors
dist
urbi
ng
wet
land
fa
una.
Ris
k m
anag
emen
t sy
ste
ms
Env
ironm
enta
l m
anag
emen
t sy
ste
ms

122
Sta
ge
Ac
tio
n S
tep
s
Rel
eva
nce
to
C
ateg
ory
of
Fo
cus
or
Imp
act
(with
re
fere
nce
to T
able
20
)
Co
re Q
ues
tio
ns
Org
anis
atio
nal
E
lem
ents
(with
re
fere
nce
to F
igu
re
24)
55. H
and-
over
i. H
as
a ne
w
base
line
asse
ssm
ent
on
all
wet
land
s be
en e
xecu
ted?
ii.
H
as
the
resp
onsi
bilit
y of
w
etla
nd
mon
itorin
g be
en
assi
gned
to a
par
ty?
iii.
Hav
e re
sidu
al c
onta
ctor
res
pons
ibili
ties
with
res
pect
to
w
etla
nd
reha
bilit
atio
n an
d m
aint
enan
ce
been
de
fined
? iv
. A
re
com
mun
ities
ad
equa
tely
tr
aine
d to
ef
fect
ivel
y m
anag
e w
etla
nds
unde
r th
eir
cont
rol?
v.
H
ave
new
sta
ff be
en t
rain
ed a
nd s
uppl
ied
with
all
rele
vant
info
rmat
ion?
Sup
ply
chai
n sy
ste
ms
Dat
a an
d in
form
atio
n
Ski
lls D
evel
opm
ent
Sys
tem
s
HR
sys
tem
s
56. C
onso
lidat
e do
cum
enta
tion
i.
Hav
e w
etla
nd m
anag
emen
t be
en i
ncor
pora
ted
into
pr
oced
ures
and
man
agem
ent
plan
s of
the
IS
O 1
4001
E
MS
for
the
site
? ii.
H
ave
a co
py o
f th
e fin
al s
ite p
lan
with
wet
land
s an
d th
eir
buffe
r zo
nes
been
obt
aine
d?
iii.
Hav
e al
l re
leva
nt i
nfor
mat
ion
been
sto
red
for
easy
re
trie
val a
nd fo
r re
fere
nce
to le
sson
s le
arnt
?
Env
ironm
enta
l M
anag
emen
t S
yste
ms
Dat
a an
d in
form
atio
n sy
ste
ms
57. D
emob
ilise
site
of
fice
and
staf
f
i. H
ave
wet
land
bar
riers
bee
n re
mov
ed?
ii.
Hav
e al
l ar
eas
that
ha
ve
been
da
mag
ed
been
re
habi
litat
ed?
Env
ironm
enta
l M
anag
emen
t S
yste
ms
58. A
sses
s st
age
and
plan
nex
t st
age
i.
Hav
e al
l wet
land
act
ions
bee
n co
nclu
ded
and
carr
ied
over
to th
e ne
xt p
hase
?
Sup
ply
chai
n sy
ste
ms
Dat
a an
d in
form
atio
n

123
Sta
ge
Ac
tio
n S
tep
s
Rel
eva
nce
to
C
ateg
ory
of
Fo
cus
or
Imp
act
(with
re
fere
nce
to T
able
20
)
Co
re Q
ues
tio
ns
Org
anis
atio
nal
E
lem
ents
(with
re
fere
nce
to F
igu
re
24)
Ope
ratio
n*
59. U
nder
stan
d th
e S
tatu
s Q
uo o
f th
e si
te
i. D
o th
e pe
rson
nel
on
site
un
ders
tand
w
here
th
e w
etla
nds
are
and
wha
t its
sig
nific
ance
are
? ii.
W
hat
are
the
oper
atio
nal
requ
irem
ents
as
soci
ated
w
ith w
etla
nds
and
wet
land
str
uctu
res
on s
ite (
e.g.
W
ULA
and
RoD
con
ditio
ns)?
iii
. A
re
the
pers
onne
l on
si
te
trai
ned
to
reco
gniz
e ne
gativ
e im
pact
s on
the
wet
land
s?
HR
Sys
tem
s
Ski
lls d
evel
opm
ent
syst
em
Com
mun
icat
ion
syst
em
Env
ironm
enta
l M
anag
emen
t sy
ste
ms
60. W
etla
nd
delin
eatio
n,
Buf
fer
zone
s an
d ec
olog
ical
co
rrid
ors
i. In
wha
t w
ay w
ill t
he p
hysi
cal
pres
ence
of
thes
e be
in
dica
ted
and
resp
ecte
d an
d m
aint
aine
d?
ii.
Are
the
RQ
Os
bein
g m
onito
red?
iii
. H
as t
he m
aint
enan
ce o
f w
etla
nd o
ffset
s be
en t
aken
in
to a
ccou
nt?
Env
ironm
enta
l M
anag
emen
t sy
ste
ms
61. U
nder
stan
d as
pect
s an
d im
pact
s re
late
d to
ope
ratio
ns
with
ref
eren
ce
to w
etla
nds
i. H
ow w
ill c
hang
ing
oper
atio
nal
requ
irem
ents
with
a
pote
ntia
l to
im
pact
on
w
etla
nd
be
iden
tifie
d,
prev
ente
d an
d m
itiga
ted?
ii.
In
the
cas
e of
em
erge
ncy
inci
denc
es,
are
ther
e an
ap
prop
riate
em
erge
ncy
resp
onse
pla
n an
d ho
w w
ill
wet
land
s be
reh
abili
tate
d?
iii.
Who
w
ill
mon
itor
wet
land
he
alth
an
d id
entif
y an
y pe
ndin
g pr
oble
ms
– e.
g. e
rosi
on,
esta
blis
hmen
t of
al
ien
and
decl
ared
wee
ds?
Env
ironm
enta
l M
anag
emen
t sy
ste
ms
Com
mun
icat
ion
syst
em
s
Dat
a an
d in
form
atio
n sy
ste
ms

124
Sta
ge
Ac
tio
n S
tep
s
Rel
eva
nce
to
C
ateg
ory
of
Fo
cus
or
Imp
act
(with
re
fere
nce
to T
able
20
)
Co
re Q
ues
tio
ns
Org
anis
atio
nal
E
lem
ents
(with
re
fere
nce
to F
igu
re
24)
62. U
nder
stan
d pe
rmit
and
othe
r le
gal
requ
irem
ents
i.
Sho
uld
any
oper
atio
nal
para
met
ers
chan
ge,
or t
he
miti
gatio
n an
d re
habi
litat
ion
of w
etla
nd i
mpa
cts,
are
th
e le
gal r
equi
rem
ents
und
erst
ood?
Ris
k m
anag
emen
t sy
ste
ms
Env
ironm
enta
l m
anag
emen
t sy
ste
ms
63. I
SO
140
01
i.
Is w
etla
nd m
anag
emen
t (in
clud
ing
wet
land
offs
ets)
in
clud
ed in
EM
S d
ocum
enta
tion?
ii.
Is
this
upd
ated
, mai
ntai
ned
and
revi
ewed
?
Env
ironm
enta
l m
anag
emen
t sy
ste
ms
64. M
onito
ring
and
Rep
ortin
g
i. W
hat
are
the
repo
rtin
g re
quire
men
ts a
ssoc
iate
d w
ith
wet
land
s an
d w
etla
nd s
truc
ture
s on
site
(e.
g. W
ULA
an
d R
oD c
ondi
tions
)?
ii.
Wha
t ar
e th
e re
port
ing
requ
irem
ents
ass
ocia
ted
with
th
e ec
olog
ical
indi
cato
rs o
f the
wet
land
s on
site
?
Dat
a an
d in
form
atio
n sy
ste
ms
Pro
cure
men
t m
anag
emen
t sy
ste
ms
Fin
anci
al
man
agem
ent
syst
em
s
65. T
rain
ing
and
awar
enes
s
i. H
as w
etla
nd m
anag
emen
t be
en in
clud
ed in
indu
ctio
n tr
aini
ng,
gene
ral
awar
enes
s pr
ogra
ms
and
job
spec
ific
trai
ning
of r
elev
ant i
ndiv
idua
ls?
ii.
Are
rec
ords
kep
t of t
his?
Ski
lls d
evel
opm
ent
66
. Env
ironm
enta
l In
cide
nts
i.
Is
ther
e an
ap
prop
riate
in
cide
nt
man
agem
ent
prot
ocol
?
Env
ironm
enta
l m
anag
emen
t sy
ste
ms

125
Sta
ge
Ac
tio
n S
tep
s
Rel
eva
nce
to
C
ateg
ory
of
Fo
cus
or
Imp
act
(with
re
fere
nce
to T
able
20
)
Co
re Q
ues
tio
ns
Org
anis
atio
nal
E
lem
ents
(with
re
fere
nce
to F
igu
re
24)
67
. New
wor
k an
d ex
pans
ions
of
site
ope
ratio
ns
i. Is
the
re a
com
mun
icat
ion
chan
nel t
o en
sure
tha
t an
y ch
ange
s to
si
te
oper
atio
ns
will
be
co
mm
unic
ated
tim
eous
ly t
o th
e re
spon
sibl
e en
viro
nmen
tal o
ffice
r on
si
te?
Com
mun
icat
ion
syst
em
s
68
. Sta
keho
lder
m
anag
emen
t
i. H
as a
sta
keho
lder
for
um b
een
crea
ted
and
is r
egul
ar
com
mun
icat
ion
bein
g un
dert
aken
?
Com
mun
icat
ion
syst
em
s
Sta
keho
lder
m
anag
emen
t
69
. Sus
tain
able
liv
elih
oods
i. H
as a
sta
keho
lder
for
um b
een
crea
ted
and
is r
egul
ar
com
mun
icat
ion
bein
g un
dert
aken
?
Com
mun
icat
ion
syst
em
s
Sta
keho
lder
m
anag
emen
t
70
. Wet
land
re
habi
litat
ion
i. S
houl
d w
etla
nds
have
to
be r
ehab
ilita
ted,
wha
t ar
e th
e le
gal
impl
icat
ions
? H
ave
the
appr
opria
te
stak
ehol
ders
, suc
h as
WfW
et b
een
invo
lved
? ii.
H
ave
the
RQ
Os
of t
he c
atch
men
t be
en t
aken
int
o ac
coun
t whe
n pl
anni
ng r
ehab
ilita
tion?
Env
ironm
enta
l m
anag
emen
t sy
ste
ms
Sta
keho
lder
m
anag
emen
t
71
. Fire
i. Is
the
re a
n ap
prop
riate
fire
man
agem
ent
plan
and
ho
w is
this
con
trol
led,
impl
emen
ted
and
mai
ntai
ned?
ii.
If
the
wet
land
s on
site
con
tain
pea
t de
posi
ts,
has
it be
en
spec
ifica
lly
addr
esse
d th
e fir
e m
anag
emen
t pl
an?
Env
ironm
enta
l m
anag
emen
t sy
ste
ms
Ris
k m
anag
emen
t pl
an

126
Sta
ge
Ac
tio
n S
tep
s
Rel
eva
nce
to
C
ateg
ory
of
Fo
cus
or
Imp
act
(with
re
fere
nce
to T
able
20
)
Co
re Q
ues
tio
ns
Org
anis
atio
nal
E
lem
ents
(with
re
fere
nce
to F
igu
re
24)
Clo
se-o
ut
72. I
nitia
te P
lant
lif
e cy
cle
plan
O
&M
i. H
as a
mon
itorin
g, m
easu
ring
and
repo
rtin
g sc
hedu
le
been
incl
uded
? ii.
W
hat
are
the
impl
icat
ions
fo
r ar
tific
ial
wet
land
s,
wet
land
mai
nten
ance
and
reh
abili
tatio
n?
iii.
Wha
t are
the
offs
et r
equi
rem
ents
?
iv.
Wha
t are
the
budg
et r
equi
rem
ents
?
Env
ironm
enta
l m
anag
emen
t sy
ste
ms
Ris
k m
anag
emen
t pl
an
Fin
anci
al
man
agem
ent
syst
em
s
Dat
a an
d in
form
atio
n m
anag
emen
t
73. C
lose
-out
pr
ojec
t
i. H
ave
a w
etla
nd a
sses
smen
t be
en d
one
to d
eter
min
e th
e st
atus
quo
at t
his
stag
e?
Env
ironm
enta
l m
anag
emen
t sy
ste
ms
Dat
a an
d in
form
atio
n m
anag
emen
t
74. A
sses
s st
age
and
plan
nex
t st
age
i.
Hav
e al
l wet
land
act
ions
bee
n co
nclu
ded
and
carr
ied
over
to th
e ne
xt p
hase
?
Sup
ply
chai
n sy
ste
ms
Dat
a an
d in
form
atio
n

127
Sta
ge
Ac
tio
n S
tep
s
Rel
eva
nce
to
C
ateg
ory
of
Fo
cus
or
Imp
act
(with
re
fere
nce
to T
able
20
)
Co
re Q
ues
tio
ns
Org
anis
atio
nal
E
lem
ents
(with
re
fere
nce
to F
igu
re
24)
Eva
luat
e 75
. Con
duct
pos
t pr
ojec
t rev
iew
i. H
ave
wet
land
man
agem
ent
actio
ns b
een
revi
ewed
an
d m
easu
red
agai
nst
pre-
dete
rmin
ed
indi
cato
rs?,
e.
g. c
ompl
ianc
e w
ith R
QO
s, W
etla
nd o
ffset
s be
ing
mai
ntai
ned
in g
ood
cond
ition
.
ii.
Hav
e th
e m
onito
ring
resu
lts
of
wet
land
he
alth
in
dica
tors
bee
n co
mpi
led
and
sum
mar
ized
to
indi
cate
sh
ortc
omin
gs in
the
proj
ect?
Dat
a an
d in
form
atio
n sy
ste
ms
Ski
lls d
evel
opm
ent
syst
em
s
76. E
valu
ate
proj
ect
gove
rnan
ce
and
oper
atio
nal
deliv
ery
i. D
id t
he A
dapt
ive
Man
agem
ent
Fra
mew
ork
fulfi
l its
pu
rpos
e?
77. E
valu
ate
tech
nica
l de
liver
y
i.
Was
trai
ning
and
aw
aren
ess
adeq
uate
? ii.
W
ere
staf
f/con
trac
tors
ap
prop
riate
ly
skill
ed
to
deal
w
ith w
etla
nd is
sues
? iii
. D
id
artif
icia
l w
etla
nds,
w
etla
nd
reha
bilit
atio
n m
etho
dolo
gies
ren
der
the
requ
ired
outc
omes
? iv
. H
ave
the
mon
itorin
g of
ec
olog
ical
in
dica
tors
be
en
eval
uate
d fo
r ef
ficie
ncy
Ski
lls d
evel
opm
ent
syst
em
s
HR
sys
tem
s
Dat
a an
d in
form
atio
n sy
ste
ms
78. F
eedb
ack
and
less
ons
lear
nt
i. W
hat
less
ons
can
be i
ncor
pora
ted
into
the
Ada
ptiv
e M
anag
emen
t Fra
mew
ork?
ii.
W
hat
actio
ns
are
requ
ired
to
ensu
re
on-g
oing
m
anag
emen
t for
the
envi
ronm
enta
l tea
m?
iii.
Wha
t be
st
prac
tices
ca
n be
gi
ven
thro
ugh
to
stak
ehol
ders
and
the
wet
land
com
mun
ity?
Ski
lls d
evel
opm
ent
syst
em
s
HR
sys
tem
s
Dat
a an
d in
form
atio
n sy
ste
ms

128
Ess
enti
al B
ackg
rou
nd
Info
rmat
ion
Rel
ated
to
Sci
enti
fic
and
Bes
t P
ract
ices
The
WM
F i
nclu
des
scie
ntifi
c an
d be
st p
ract
ice
guid
elin
es.
A l
ist
of t
hese
is
indi
cate
d be
low
in
Tab
le 2
2 an
d ha
s be
en l
inke
d to
one
of
the
4
cate
gorie
s of
im
pact
or
focu
s. R
ecur
ring
and/
or c
ross
cut
ting
issu
es h
ave
been
ind
icat
ed b
elow
eac
h of
the
lis
ted
aspe
cts
in i
talic
s an
d bl
ue
font
.
Tab
le 2
2: L
ist
of
scie
nti
fic
and
bes
t p
ract
ices
incl
ud
ed in
th
e W
MF
wit
h r
efer
ence
to
th
e C
ateg
ory
of
Imp
act/
Fo
cus
A
spec
t C
ateg
ory
of
Imp
act/
Fo
cus
1 T
he w
ater
/ene
rgy
nexu
s: K
ey w
ater
and
env
ironm
enta
l ch
alle
nges
fac
ing
Esk
om a
nd c
urre
nt m
easu
res
to
addr
ess
thes
e
2 W
etla
nds
and
the
Sou
th A
fric
an le
gisl
atio
n
3
Wet
land
del
inea
tion
and
wet
land
inv
ento
ry w
ith r
espe
ct t
o bo
th E
skom
pre
mis
es a
nd t
he c
atch
men
ts w
ithin
w
hich
they
ope
rate
Hie
rarc
hy o
f con
serv
atio
n ta
rget
s
Giv
en t
he v
arie
d na
ture
and
rol
e of
wet
land
s in
the
lan
dsca
pe,
it w
ill b
e re
quire
d to
tak
e co
gnis
ance
of
and
set
cons
erva
tion
targ
ets
for
each
type
of w
etla
nd a
ffect
ed b
y E
skom
’s o
pera
tions
.
RQ
Os
of fe
eder
cat
chm
ents
Bas
ed o
n th
e po
llutio
n at
tenu
atio
n po
tent
ial o
f w
etla
nds,
Esk
om c
an s
et s
trat
egic
con
serv
atio
n an
d re
habi
litat
ion
targ
ets
to im
prov
e ca
tchm
ent w
ater
qua
lity.
Hyd
rolo
gica
l int
egrit
y
It is
vita
l to
unde
rsta
nd w
ater
use
by
diffe
rent
rol
e pl
ayer
s w
ithin
a c
atch
men
t to
ens
ure
that
the
hyd
rolo
gica
l int
egrit
y of
w
etla
nds
is m
aint
aine
d. I
n or
der
to s
et r
ealis
tic c
onse
rvat
ion
targ
ets,
an
unde
rsta
ndin
g of
cur
rent
and
fut
ure
wat
er u
se
in th
e ca
tchm
ent i
s re
quire
d.
GH
G s
inks
Wet
land
s ar
e co
nsid
ered
to
be i
mpo
rtan
t si
nks
for
gree
nhou
se g
asse
s. W
etla
nds
und
er E
skom
’s j
uris
dict
ion
will
be

129
A
spec
t C
ateg
ory
of
Imp
act/
Fo
cus
rank
ed i
n te
rms
of t
heir
GH
G a
ttenu
atio
n po
tent
ial.
Thi
s w
ill e
nsur
e th
at t
he c
riter
ia a
nd t
arge
ts r
elat
ed t
o w
etla
nd
cons
erva
tion
take
cog
nisa
nce
of th
is im
port
ant w
etla
nd fu
nctio
n.
4 Im
pact
inv
ento
ry (
pollu
tion,
alte
ring
of h
ydro
logi
cal
regi
mes
, di
stur
banc
es,
inva
sive
spe
cies
, er
osio
n an
d
silta
tion)
5 Im
pact
Ass
essm
ent
6 W
etla
nd H
ealth
Ass
essm
ent
7 V
eget
atio
n
8 P
riorit
isat
ion
of w
etla
nds
for
reha
bilit
atio
n an
d in
terv
entio
n
Hie
rarc
hy o
f con
serv
atio
n ta
rget
s
Giv
en t
he v
arie
d na
ture
and
rol
e of
wet
land
s in
the
lan
dsca
pe,
it w
ill b
e re
quire
d to
tak
e co
gnis
ance
of
and
set
cons
erva
tion
targ
ets
for
each
type
of w
etla
nd a
ffect
ed b
y E
skom
’s o
pera
tions
.
RQ
Os
of fe
eder
cat
chm
ents
Bas
ed o
n th
e po
llutio
n at
tenu
atio
n po
tent
ial o
f w
etla
nds,
Esk
om c
an s
et s
trat
egic
con
serv
atio
n an
d re
habi
litat
ion
targ
ets
to im
prov
e ca
tchm
ent w
ater
qua
lity.
Hyd
rolo
gica
l int
egrit
y
It is
vita
l to
unde
rsta
nd w
ater
use
by
diffe
rent
rol
e pl
ayer
s w
ithin
a c
atch
men
t to
ens
ure
that
the
hyd
rolo
gica
l int
egrit
y of
w
etla
nds
is m
aint
aine
d. I
n or
der
to s
et r
ealis
tic c
onse
rvat
ion
targ
ets,
an
unde
rsta
ndin
g of
cur
rent
and
fut
ure
wat
er u
se
in th
e ca
tchm
ent i
s re
quire
d.
GH
G s
inks
Wet
land
s ar
e co
nsid
ered
to
be i
mpo
rtan
t si
nks
for
gree
nhou
se g
asse
s. W
etla
nds
und
er E
skom
’s j
uris
dict
ion
will
be
rank
ed i
n te
rms
of t
heir
GH
G a
ttenu
atio
n po
tent
ial.
Thi
s w
ill e
nsur
e th
at t
he c
riter
ia a
nd t
arge
ts r
elat
ed t
o w
etla
nd
cons
erva
tion
take
cog
nisa
nce
of th
is im
port
ant w
etla
nd fu
nctio
n.

130
A
spec
t C
ateg
ory
of
Imp
act/
Fo
cus
9 R
ehab
ilita
tion
of im
pact
s
RQ
Os
of fe
eder
cat
chm
ents
Bas
ed o
n th
e po
llutio
n at
tenu
atio
n po
tent
ial o
f w
etla
nds,
Esk
om c
an s
et s
trat
egic
con
serv
atio
n an
d re
habi
litat
ion
targ
ets
to im
prov
e ca
tchm
ent w
ater
qua
lity.
10
Bio
dive
rsity
cor
ridor
s
Bio
dive
rsity
con
serv
atio
n
Thi
s su
b-fr
amew
ork
will
giv
e m
etho
ds f
or a
sses
sing
the
con
serv
atio
n st
atus
of
the
area
s un
der
cons
ider
atio
n an
d ou
tline
the
nece
ssar
y in
terv
entio
ns a
nd m
onito
ring
proc
ess
to e
nsur
e th
at ta
rget
s ar
e m
et.
11
Buf
fer
Zon
es
12
Indi
cato
rs a
nd e
arly
war
ning
sys
tem
s
Mon
itorin
g an
d ev
alua
tion
Indi
cato
rs w
ill b
e de
velo
ped
to m
onito
r ea
ch o
f th
e su
b-fr
amew
orks
des
crib
ed b
elow
. T
hese
will
be
base
d on
the
fin
ding
s of
the
rese
arch
and
the
targ
ets
set.
13
Veg
etat
ion
man
agem
ent
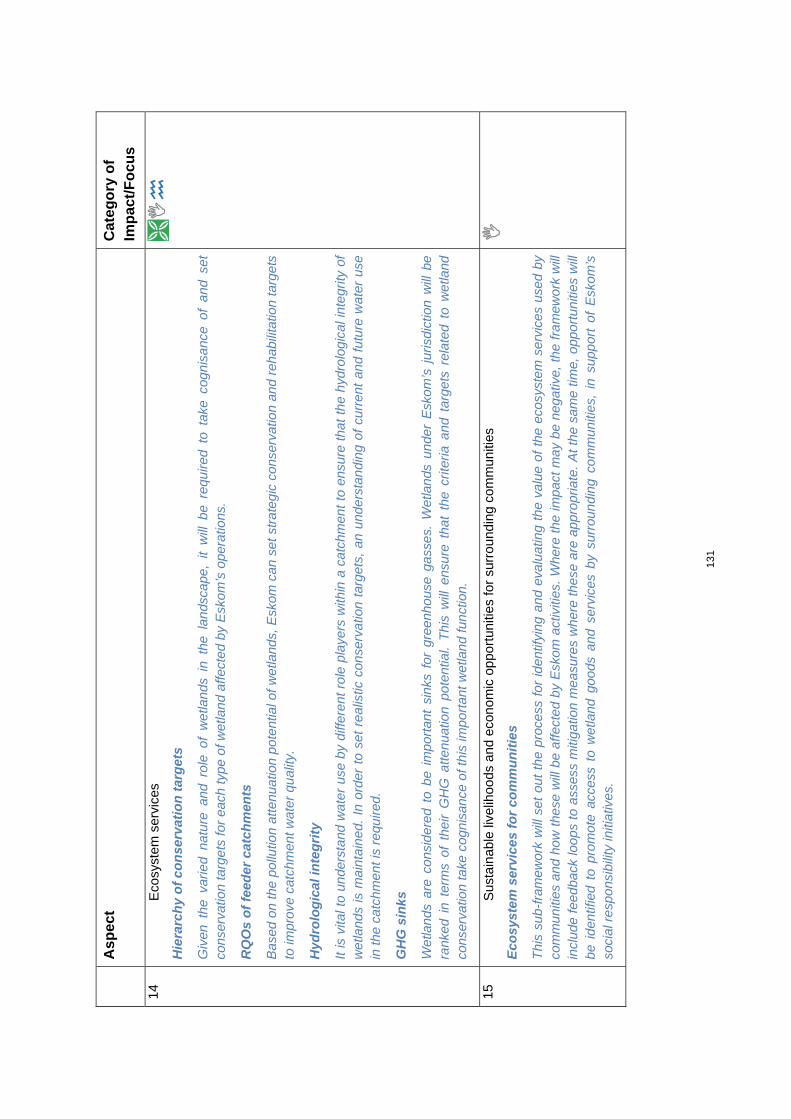
131
A
spec
t C
ateg
ory
of
Imp
act/
Fo
cus
14
Eco
syst
em s
ervi
ces
Hie
rarc
hy o
f con
serv
atio
n ta
rget
s
Giv
en t
he v
arie
d na
ture
and
rol
e of
wet
land
s in
the
lan
dsca
pe,
it w
ill b
e re
quire
d to
tak
e co
gnis
ance
of
and
set
cons
erva
tion
targ
ets
for
each
type
of w
etla
nd a
ffect
ed b
y E
skom
’s o
pera
tions
.
RQ
Os
of fe
eder
cat
chm
ents
Bas
ed o
n th
e po
llutio
n at
tenu
atio
n po
tent
ial o
f w
etla
nds,
Esk
om c
an s
et s
trat
egic
con
serv
atio
n an
d re
habi
litat
ion
targ
ets
to im
prov
e ca
tchm
ent w
ater
qua
lity.
Hyd
rolo
gica
l int
egrit
y
It is
vita
l to
unde
rsta
nd w
ater
use
by
diffe
rent
rol
e pl
ayer
s w
ithin
a c
atch
men
t to
ens
ure
that
the
hyd
rolo
gica
l int
egrit
y of
w
etla
nds
is m
aint
aine
d. I
n or
der
to s
et r
ealis
tic c
onse
rvat
ion
targ
ets,
an
unde
rsta
ndin
g of
cur
rent
and
fut
ure
wat
er u
se
in th
e ca
tchm
ent i
s re
quire
d.
GH
G s
inks
Wet
land
s ar
e co
nsid
ered
to
be i
mpo
rtan
t si
nks
for
gree
nhou
se g
asse
s. W
etla
nds
und
er E
skom
’s j
uris
dict
ion
will
be
rank
ed i
n te
rms
of t
heir
GH
G a
ttenu
atio
n po
tent
ial.
Thi
s w
ill e
nsur
e th
at t
he c
riter
ia a
nd t
arge
ts r
elat
ed t
o w
etla
nd
cons
erva
tion
take
cog
nisa
nce
of th
is im
port
ant w
etla
nd fu
nctio
n.
15
Sus
tain
able
live
lihoo
ds a
nd e
cono
mic
opp
ortu
nitie
s fo
r su
rrou
ndin
g co
mm
uniti
es
Ecos
yste
m s
ervi
ces
for c
omm
uniti
es
Thi
s su
b-fr
amew
ork
will
set
out
the
pro
cess
for
iden
tifyi
ng a
nd e
valu
atin
g th
e va
lue
of t
he e
cosy
stem
ser
vice
s us
ed b
y co
mm
uniti
es a
nd h
ow t
hese
will
be
affe
cted
by
Esk
om a
ctiv
ities
. W
here
the
impa
ct m
ay b
e ne
gativ
e, t
he f
ram
ewor
k w
ill
incl
ude
feed
back
loop
s to
ass
ess
miti
gatio
n m
easu
res
whe
re t
hese
are
app
ropr
iate
. A
t th
e sa
me
time,
opp
ortu
nitie
s w
ill
be i
dent
ified
to
prom
ote
acce
ss t
o w
etla
nd g
oods
and
ser
vice
s by
sur
roun
ding
com
mun
ities
, in
sup
port
of
Esk
om’s
so
cial
res
pons
ibili
ty in
itiat
ives
.

132
A
spec
t C
ateg
ory
of
Imp
act/
Fo
cus
16
Wet
land
Offs
ettin
g
Wet
land
off-
setti
ng
The
re a
re t
imes
whe
n E
skom
is
unab
le t
o av
oid
impa
ctin
g on
, or
des
troy
ing
wet
land
s. T
his
sub-
fram
ewor
k w
ill o
utlin
e th
e de
cisi
on-m
akin
g pr
oces
s on
how
this
des
truc
tion
may
be
offs
et to
ens
ure
no-n
et lo
ss in
the
part
icul
ar c
atch
men
t.
GH
G s
inks
Wet
land
s ar
e co
nsid
ered
to
be i
mpo
rtan
t si
nks
for
gree
nhou
se g
asse
s. W
etla
nds
und
er E
skom
’s j
uris
dict
ion
will
be
rank
ed i
n te
rms
of t
heir
GH
G a
ttenu
atio
n po
tent
ial.
Thi
s w
ill e
nsur
e th
at t
he c
riter
ia a
nd t
arge
ts r
elat
ed t
o w
etla
nd
cons
erva
tion
take
cog
nisa
nce
of th
is im
port
ant w
etla
nd fu
nctio
n.
17
Rel
ativ
e im
port
ance
of
wet
land
s w
ith r
espe
ct t
o pe
rcen
tage
of
the
tota
l ca
tchm
ent
surf
ace
area
, as
wel
l as
w
etla
nd ty
pe
Hie
rarc
hy o
f con
serv
atio
n ta
rget
s
Giv
en t
he v
arie
d na
ture
and
rol
e of
wet
land
s in
the
lan
dsca
pe,
it w
ill b
e re
quire
d to
tak
e co
gnis
ance
of
and
set
cons
erva
tion
targ
ets
for
each
type
of w
etla
nd a
ffect
ed b
y E
skom
’s o
pera
tions
.
RQ
Os
of fe
eder
cat
chm
ents
Bas
ed o
n th
e po
llutio
n at
tenu
atio
n po
tent
ial o
f w
etla
nds,
Esk
om c
an s
et s
trat
egic
con
serv
atio
n an
d re
habi
litat
ion
targ
ets
to im
prov
e ca
tchm
ent w
ater
qua
lity.
Hyd
rolo
gica
l int
egrit
y
It is
vita
l to
unde
rsta
nd w
ater
use
by
diffe
rent
rol
e pl
ayer
s w
ithin
a c
atch
men
t to
ens
ure
that
the
hyd
rolo
gica
l int
egrit
y of
w
etla
nds
is m
aint
aine
d. I
n or
der
to s
et r
ealis
tic c
onse
rvat
ion
targ
ets,
an
unde
rsta
ndin
g of
cur
rent
and
fut
ure
wat
er u
se
in th
e ca
tchm
ent i
s re
quire
d.
GH
G s
inks
Wet
land
s ar
e co
nsid
ered
to
be i
mpo
rtan
t si
nks
for
gree
nhou
se g
asse
s. W
etla
nds
und
er E
skom
’s j
uris
dict
ion
will
be
rank
ed i
n te
rms
of t
heir
GH
G a
ttenu
atio
n po
tent
ial.
Thi
s w
ill e
nsur
e th
at t
he c
riter
ia a
nd t
arge
ts r
elat
ed t
o w
etla
nd
cons
erva
tion
take
cog
nisa
nce
of th
is im
port
ant w
etla
nd fu
nctio
n.

133
A
spec
t C
ateg
ory
of
Imp
act/
Fo
cus
18
Car
bon
stor
age
in w
etla
nds
GH
G s
inks
Wet
land
s ar
e co
nsid
ered
to
be i
mpo
rtan
t si
nks
for
gree
nhou
se g
asse
s. W
etla
nds
und
er E
skom
’s j
uris
dict
ion
will
be
rank
ed i
n te
rms
of t
heir
GH
G a
ttenu
atio
n po
tent
ial.
Thi
s w
ill e
nsur
e th
at t
he c
riter
ia a
nd t
arge
ts r
elat
ed t
o w
etla
nd
cons
erva
tion
take
cog
nisa
nce
of th
is im
port
ant w
etla
nd fu
nctio
n.
19
Wat
er Q
ualit
y an
d P
ollu
tion
Atte
nuat
ion
Pollu
tion
atte
nuat
ion
for E
skom
and
thei
r min
es
The
pot
entia
l of
wet
land
s (b
oth
natu
ral
and
artif
icia
l) to
atte
nuat
e po
llutio
n le
vels
in
surf
ace
wat
er c
ould
be
harn
esse
d by
Esk
om t
o pr
omot
e w
ater
qua
lity
in t
he c
atch
men
ts w
ithin
whi
ch i
t op
erat
es.
Und
erst
andi
ng a
nd i
ncor
pora
ting
this
w
ithin
the
ini
tial
wet
land
inv
ento
ry,
will
ens
ure
that
the
crit
eria
and
tar
gets
rel
ated
to
wet
land
con
serv
atio
n ta
ke
cogn
isan
ce o
f thi
s im
port
ant w
etla
nd fu
nctio
n.
Was
te tr
eatm
ent
Esk
om g
ener
ates
a v
arie
ty o
f w
aste
s, s
ome
of w
hich
are
air-
born
e, s
ome
wat
er-b
orne
and
som
e so
lid.
Eac
h of
the
se
cate
gorie
s of
was
te w
ill s
tres
s th
e en
viro
nmen
t an
d ne
gativ
ely
impa
ct o
n th
e bi
odiv
ersi
ty.
Thi
s su
b-fr
amew
ork
will
gui
de
the
effe
ctiv
e m
anag
emen
t of
the
var
ious
tre
atm
ent
met
hods
(e.
g. h
igh
rate
, ar
tific
ial w
etla
nd,
etc.
) th
at m
ay b
e se
lect
ed.
The
Esk
om p
olic
y of
zer
o liq
uid
efflu
ent
disc
harg
e w
ill b
e pr
ogre
ssiv
ely
impl
emen
ted,
but
thi
s su
b-fr
amew
ork
will
gui
de
was
te m
anag
emen
t und
er th
e cu
rren
t was
te m
anag
emen
t reg
ime.
RQ
Os
of fe
eder
cat
chm
ents
Bas
ed o
n th
e po
llutio
n at
tenu
atio
n po
tent
ial o
f w
etla
nds,
Esk
om c
an s
et s
trat
egic
con
serv
atio
n an
d re
habi
litat
ion
targ
ets
to im
prov
e ca
tchm
ent w
ater
qua
lity.

134
A
spec
t C
ateg
ory
of
Imp
act/
Fo
cus
20
Art
ifici
al a
nd C
onst
ruct
ed W
etla
nds
Was
te tr
eatm
ent
Esk
om g
ener
ates
a v
arie
ty o
f w
aste
s, s
ome
of w
hich
are
air-
born
e, s
ome
wat
er-b
orne
and
som
e so
lid.
Eac
h of
the
se
cate
gorie
s of
was
te w
ill s
tres
s th
e en
viro
nmen
t an
d ne
gativ
ely
impa
ct o
n th
e bi
odiv
ersi
ty.
Thi
s su
b-fr
amew
ork
will
gui
de
the
effe
ctiv
e m
anag
emen
t of
the
var
ious
tre
atm
ent
met
hods
(e.
g. h
igh
rate
, ar
tific
ial w
etla
nd,
etc.
) th
at m
ay b
e se
lect
ed.
The
Esk
om p
olic
y of
zer
o liq
uid
efflu
ent
disc
harg
e w
ill b
e pr
ogre
ssiv
ely
impl
emen
ted,
but
thi
s su
b-fr
amew
ork
will
gui
de
was
te m
anag
emen
t und
er th
e cu
rren
t was
te m
anag
emen
t reg
ime.
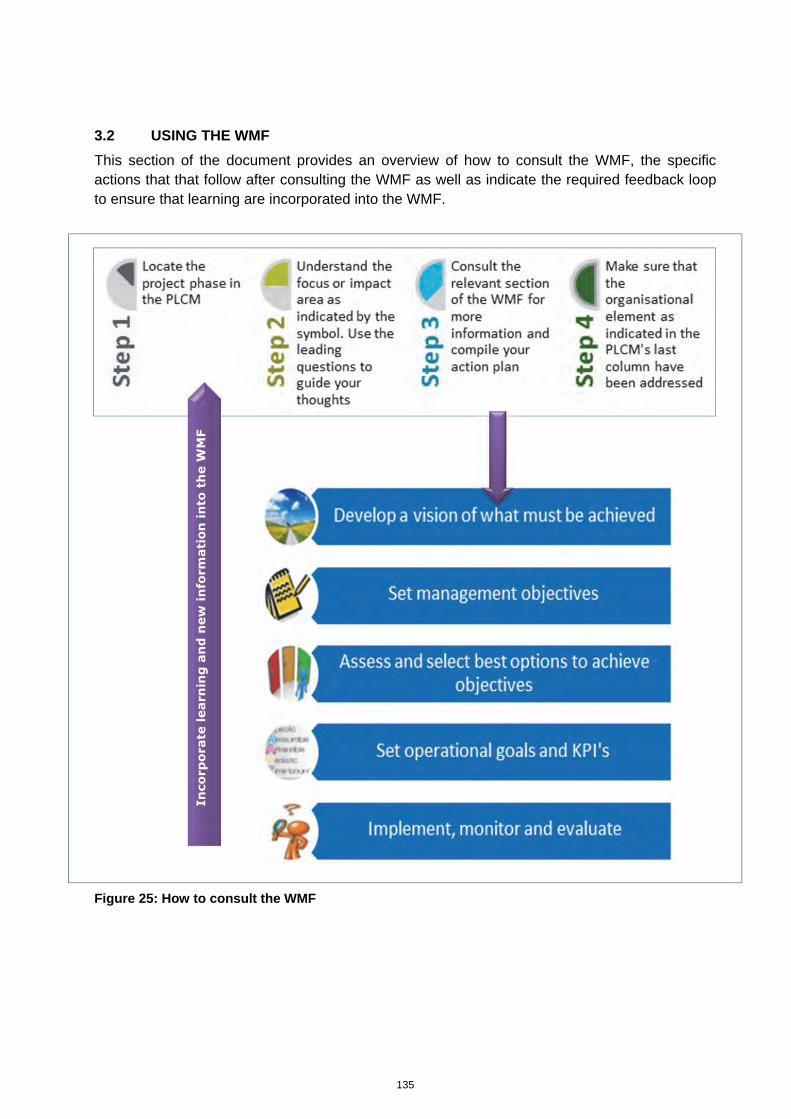
135
Inco
rpor
ate
lear
nin
g a
nd
new
info
rmat
ion
into
th
e W
MF
3.2 USING THE WMF
This section of the document provides an overview of how to consult the WMF, the specific actions that that follow after consulting the WMF as well as indicate the required feedback loop to ensure that learning are incorporated into the WMF.
Figure 25: How to consult the WMF

136
WETLAND DELINEATION WITH RESPECT TO BOTH ESKOM PREMISES AND THE
CATCHMENTS WITHIN WHICH THEY OPERATE
����
Pre-Feasibility
The need
The following pieces of legislation have bearing on all developments which may affect wetlands (Armstrong, 2009): There have been changes to the legislation since Armstrong (2009) that need to be taken into account.
i. The Constitution, 1996 ii. National Environmental Management Act, 1998 (NEMA) iii. National Water Act 36 of 1998 (NWA) iv. Conservation of Agricultural Resources Act 43 of 1983 (CARA) v. National Forests Act 84 of 1998 (NFA) vi. National Heritage Resources Act 25 of 1999 (NHRA) vii. National Environmental Management: Biodiversity Act 10 of 2004 (Biodiversity Act) viii. National Environmental Management: Protected Areas Act 57 of 2003 (Protected Areas
Act) ix. Mountain Catchments Areas Act 62 of 1970
In addition, there are other pieces of legislation which may apply under certain circumstances, such as the World Heritage Conventions Act 49 of 1999, the Seashore Act 21 of 1935 and the Marine Living Resources Act 18 of 1998. Provincial and local government legislation may also have specific relevance to specific instances.
Any developments which encroach on a wetland will need a Water Use License (WUL) from the DWA. It is, thus, important that the location and extent of wetlands on a site is taken into consideration early in the planning process.
Property boundaries are imposed on the natural ecosystem and so if the stream of ecosystem services is to be conserved, then it is necessary to consider the entire ecosystem, and not just the part under the jurisdiction of Eskom. The desktop assessment should, thus, take account of neighbouring systems as well, and as far as possible include them in the planning process.
The Process
Preliminary wetland assessment may be conducted using Eskom’s wetland classification and risk assessment index field guide (Eskom, undated). Wetland delineation is, however, a specialised task demanding a high level of compliance. It should be done by practitioners who are properly qualified. It may be worth Eskom’s while to train a member of staff to delineate wetlands. Otherwise, qualified practitioners may be contacted through the South African Wetland Society (http://society.wetlands.za.net/index.htm) if someone has not already been identified. At the Pre-feasibility step, locate and make contact with a suitable service provider.
Feasibility
The need

137
Accurate delineation of wetlands at the early stages of planning a development is necessary because this will form part of the application for the permits and licences required for the planned developments to proceed.
The process
a) With the wetland expert on site, confirm that all wetlands have been correctly identified. b) Following the approved process (DWAF, 2008), ensure that all wetlands are delineated,
marked on the ground and mapped. The process should include the identification of the type of wetland as well as any features which may need special attention. This information may also be needed when assessing the stream of ecosystem services form the wetland (Section 14 of the document).
c) While the wetland expert is on site it is necessary to have the present ecological state (PES), ecological importance and sensitivity (EIS) and threats to the wetland health determined (Anon, 1999; DWAF, 2004; DWAF, 2008; Kleynhans, 1999; MacFarlane et al., 2009). The reason for this is that if it becomes necessary to apply for a wetland offset permit, the authorities will assume that the wetland to be impacted is in ‘A’ class and determine the offset accordingly. Whereas if the wetland is in a ‘B’ or ‘C’ class the requirements for the offset will be adjusted accordingly. This will determine if there is an attribute that needs special conservation attention.
d) All the results of the delineation, PES and EIS determinations should be handed to the contract managers. This should include all maps, electronic and paper.
e) The delineation and the determination of the PES and EIS will enable the planning to take account of wetlands and assess the potential impacts of the development, including any mitigation measures which may be necessary.
f) These documents may then be submitted to the relevant authorities to get the required environmental authorisations.
Integral to the delineation of wetlands is the determination of the buffer zones around the wetlands. This is covered in Section 11 of this document.
Business Plan
Ensure that all documents related to the findings of the wetland delineation, PES and EIS determinations have been made available to the business planning process, and are accounted for in this process.
Construction
Ensure that the wetlands, as delineated and marked on the ground, as well as their buffer zones (Section 11) have been demarcated as no-go zones for all construction processes.
Commissioning and Hand-over
Conduct a new baseline assessment on all wetlands to monitor impacts of the construction process on wetlands, and remediate/rehabilitate impacts as necessary.
Operation
The environmental management system (EMS) provides a model based on ISO 14001 within which there is guidance for continual improvement in the management of the environmental responsibilities of an organisation (DEAT, 2004). This model should be adopted and kept

138
updated. Any change in operations should be communicated to the environmental office which should conduct routine monitoring. The environmental office should report on the state of wetland management in terms of the conditions set out in the Water Use License, the RoD and other permitting requirements that may exist. It may be expedient to develop a standard format for this report. This report will provide communication from the environmental office to the central management office. It is important that this communication is open and that operational decisions which will affect the environment are communicated timeously to the environmental office. Communication should also be maintained with the stakeholder forum, although this will not cover the same level of operational detail as the communication with the management office. All documents should be lodged in the central repository.
During the operational phase, the wetland demarcation should be maintained so that operations do not interfere with the wetlands. After any incident, such as fire or a spill, which may destroy the demarcation, the wetland and demarcations should be returned to the required state in terms of the environmental management plans (EMP).
Evaluate
The adaptive management cycle should address the integrity of the wetland as initially delineated – see Section 21 below.
3.3 IMPACT INVENTORY (POLLUTION, ALTERING OF HYDROLOGICAL REGIMES, DISTURBANCES, INVASIVE SPECIES, EROSION AND SILTATION)
����
Pre-feasibility
The need
It is necessary to know the health of the wetlands on the site before the start of any activities. The reasons for this are:
• Are there different sites on which to develop? If there are, then the following procedures should be undertaken on each site. This will contribute to the decision-making process.
• The condition (or health) of the wetlands on a greenfield site will form part of the application for a water use license (WUL). Where any mitigation, rehabilitation or offset activities are necessary the condition (or health) of the wetlands at the beginning of the project will form the basis for conditions imposed through the WUL or other permits. In addition, it will set the baseline for decisions on any mitigation, rehabilitation or offset activities to be carried out.
• The impacts on the wetland(s) should be considered when planning the developments that are to be undertaken. This will provide the basis for decisions on alternate layout, design, technology and operational aspects to minimise impacts which should be considered in the overall planning.
Working for Wetlands has been mandated by DEA to perform or oversee wetland activities which require permitting. So, Working for Wetlands should be engaged early on in the process and their guidance sought when assessing impacts on wetlands.

139
The process
Impacts before activities begin on the site
The existing impacts on the site should be inventoried using the method described in WET-Health (MacFarlane e al., 2009). There are two components to this method. The first is done at desktop using aerial photography, Google Earth or some similar resource. From this it is possible to gauge the likely threats or impacts on a site from the surrounding land use. The second component requires an experienced wetland scientist to examine the wetland site and identify and inventorise the impacts on the ground. This will set the baseline for further negotiation in permit applications and site planning.
Planning during the pre-feasibility phase
Once the wetlands have been mapped and existing impacts determined it is possible to consider the planned developments. Inventorying impacts from the development should consider the following points:
• The options of layout, design, technology and operations should form part of the inventory of the impacts on the site and their mitigation.
• Layout of infrastructure on the site – this should be planned and inventoried with the impacts that the infrastructure will have on wetlands during the construction and operation phases. For instance, hard surfaces (including roads) will alter the runoff pattern on the site; culverts will channel flow that previously may have been diffuse across the site, causing erosion; effluents streams from the planned activities need to be handled in a way that will minimise impacts on the wetlands and so the infrastructure to handle effluents should be sited with this in mind. Where there is more than one site being considered the available options should be assessed for all sites.
The impacts originating from neighbouring properties or originating on the Eskom site and impacting on neighbouring properties should be inventoried. Options for working together with neighbours, where advantageous, should be considered at this stage so that they may form part of the Public Participation Process of the project.
Feasibility
Decisions taken at the pre-feasibility stage should be passed to the Feasibility stage for incorporation into the final planning.
Business Plan
The impact inventory will complement the assessment of the impacts of the development and they will need to be incorporated into the process of obtaining the WUL and other permits necessary the project to proceed.
Planning and Design
The planning and design should take account of the impacts as inventoried and incorporate appropriate mitigation strategies where relevant.

140
Contracting and procurement
Where relevant, clauses on the prevention or minimisation of impacts as inventoried and assessed should be included in work package contracts.
Construction
Plan to ensure that foreseen impacts are minimised during the construction phase.
Be alert for impacts that were not foreseen, and mitigate these.
Operation
The initial impact inventory was completed at the pre-feasibility stage. This inventory should be monitored and updated at between one and five year intervals, depending on the indicators selected. Changes that have taken place both on the site and in the adjacent landscape which may change the situation should be recorded. This document should be lodged in the central repository.
Evaluate
Confirm that the impacts foreseen during the pre-feasibility phase were assessed correctly. Note any impacts that were not foreseen and how they have been mitigated.
Ensure that the adaptive management process includes indicators that will identify and assess the impacts of the development (see Section 21 below).
3.4 IMPACT ASSESSMENT
����
Pre-feasibility
The need
Having inventoried the impacts on the site before any development has taken place, it is necessary to assess the health of the wetlands. The reasons for this are:
• The state of the wetland’s health will provide a baseline against which impacts during the construction and operation phases will be assessed. If this is not done it will be assumed that all wetlands were in ‘A’ class – see the following bullet point.
• The condition (or health) of the wetlands on a greenfield site will form part of the application for a water use license (WUL). Where any mitigation, rehabilitation or offset activities are necessary the condition (or health) of the wetlands at the beginning of the project will form the basis for conditions imposed through the WUL or other permits. In addition, it will set the baseline for decisions on any mitigation, rehabilitation or offset activities to be carried out.
141
Working for Wetlands has been mandated by DEA to perform or oversee wetland activities which require permitting. So, Working for Wetlands should be engaged early on in the process and their guidance sought when assessing impacts on wetlands.
The Process
Impacts before activities begin on the site The existing impacts on the site should be assessed using the method described in WET-Health (MacFarlane e al., 2009). There are two components to this method. The first is done at desktop using aerial photography, Google Earth or some similar resource. From this it is possible to gauge the likely threats or impacts on a site from the infrastructure to be developed as well as the surrounding land use. The second component requires an experienced wetland specialist to examine the wetland site and identify and assess the impacts on the ground. This will serve to test projections of the impacts on the ground.
Planning during the pre-feasibility phase Once the wetlands have been mapped and existing impacts assessed it is possible to consider the planned developments. The planning should consider the following points:
• The options of layout, design, technology and operations should form part of the assessment of the impacts on the site and their mitigation.
• Layout of infrastructure on the site – this should be planned in consideration with the impacts that it will have on wetlands during the construction and operation phases. For instance, hard surfaces (including roads) will alter the runoff pattern on the site; culverts will channel flow that previously may have been diffuse across the site, causing erosion; effluents streams from the planned activities need to be handled in a way that will minimise impacts on the wetlands and so the infrastructure to handle effluents should be sited with this in mind.
Impacts originating from neighbouring properties or originating on the Eskom site and impacting on neighbouring properties should be included in the assessment. Options for working together with neighbours should be planned.
Feasibility
Decisions taken at the pre-feasibility stage should be passed to the Feasibility stage for action.
The projections of impacts made at the pre-feasibility stage may be checked/ground-truthed by the wetland specialist.
Business Plan
Assessment of the impacts of the development need to be incorporated into the process of obtaining the WUL and other permits necessary for the project to proceed.
Planning and Design
The planning and design should take account of the impacts as assessed and incorporate appropriate mitigation strategies where relevant.

142
Contracting and Procurement
Ensure that contractors are aware of their potential impacts and abide by the plans to mitigate these. Where relevant, clauses on the prevention or minimisation of impacts as inventoried and assessed should be included in work package contracts.
Construction
Plan to ensure that foreseen impacts are minimised during the construction phase.
Be alert for impacts that were not foreseen, and mitigate these.
Operation
Impacts from the operations on site have been identified and plans have been put in place to mitigate these. The potential impact of any changes in the operations should be assessed both in terms of the legal requirements as well as changes in the ecosystem services and measures to mitigate these impacts should be put in place.
Incident management plans should be drawn up to address accidents that will potentially occur. Training on avoiding and managing incidents in and around wetlands should be included in the training programmes for staff as well as the induction course for contractors on site.
Incidents and any changes in incident management should be reported regularly and the reports should be lodged in the central repository.
Evaluate
Confirm that the impacts foreseen during the pre-feasibility phase were assessed correctly. Note any impacts that were not foreseen and how they have been mitigated.
Ensure that there the adaptive management process includes indicators that will assess the impacts of the development and operations.
3.5 WETLAND HEALTH ASSESSMENT
����
Pre-Feasibility
Before any activities take place on the site
The health of wetlands on the site should be assessed prior to any activities taking place on the site following the method described in MacFarlane et al. (2009). At the same time the threats to wetland health should be identified so that these may be taken into account, and mitigated where possible, in the planning and development of the site. The present ecological state (PES) of the wetland should be determined at this stage as this will set the baseline against which future health assessments will be made. At the same time the Ecological Importance and Sensitivity (EIS) should be determined (DWAF, 2004; 2007; 2008).
143
The assessment of Wetland Health together with the determination of the PES and EIS will give an indication of which of the ecosystem services are important in the system.
Feasibility
Ensure that the health of the wetland has been determined and that threats to the health have been defined.
Ensure that the PES and EIS have been determined.
Business Plan
The business plan should address the management of the threats to wetland health such as alien invasive plants, erosion, siltation, etc. It should also address the formation of strategic partnerships with other stakeholders and in particular with Working for Wetlands and Working for Water as appropriate.
Contracting and Procurement
Ensure that those contracted to work on site understand the importance of maintaining wetland health and abide by the requirements set for wetland protection on the site.
Operation
Maintaining wetland health is a requirement in terms of the WUL and the RoD. It is important that this is communicated through training and general awareness creation to all personnel employed on the site. As ecosystems are not confined within property boundaries, it is also necessary to communicate the activities in the wetlands with the stakeholder forum, specifically adjacent property holders, so that all understand what is to be achieved.
Evaluate
A suitable indicator of wetland health should be included in the adaptive management framework.
3.6 VEGETATION
���
Pre-Feasibility
The initial wetland impact inventory and assessment will have identified the presence of alien invasive vegetation where this is an issue, and its control will have been planned.
Regulations have been gazetted requiring control of invasive alien plants (SANBI, viewed June 2013). In summary, category 1a or 1b species must be removed and destroyed and species in category 2 and 3 may only be kept under certain conditions. The species of concern are listed on the SANBI web site. Personnel involved in the management of vegetation on Eskom property should be trained in the recognition and handling of these plants.

144
Feasibility
The ecoregion of the country into which the wetland falls (Kleynhans et al., 2008) will determine what indigenous vegetation may be expected to occur in a wetland. This will have been identified during the determination of the PES and EIS.
The threats and impacts to the wetland will have been determined through the impact inventory, the impact assessment and the wetland health assessment. One impact, or threatened impact, that should be closely managed is the presence of alien invasive vegetation. Alien invasive vegetation is detrimental to wetlands for a variety of reasons, all of which lead to a change (usually negative) in the stream of ecosystem services which the wetland delivers.
During the Feasibility phase plans should be made to promote the growth of indigenous vegetation cover and to control any alien invasive vegetation which may be present. Where possible, a strategic partnership should be formed with the Working for Wetlands and/or Working for Water programmes of DEA. Working for Wetlands have been mandated by DEA to conduct wetland rehabilitation, and so are able to advise and help in this regard where required.
Business Plan
The business plan should include measures to conserve wetland health, such as the on-going control of alien vegetation where it occurs and the promotion of indigenous vegetation.
Vegetation management is an on-going activity. While the initial clearance of alien invasive vegetation may be a once-off activity, the follow-up is likely to go on for a decade or longer and this should be noted in the plan.
Contracting and Procurement
Teams engaged to work on the vegetation in wetlands should be trained in the Recognition and handling of alien vegetation. The guidelines issued by Eskom (Eskom 2009; 2010) provide the basis from which to work. Detail on certain species of invasive plants is available from SANBI.
Operation
During the EMS process objectives and targets will have been set for the management of vegetation on Eskom property, and for the purpose of this framework specifically for vegetation management in wetlands. Progress towards these targets should be monitored and reported in the routine reports submitted to the central management office.
Where a dense infestation of alien vegetation has been cleared it is advisable to seed or plant the area with suitable indigenous vegetation to hasten recovery and so reduce erosion during the recovery period. Contact details of nurseries where seed or plant material may be sourced are available from Working for Wetlands personnel.
In the management of alien invasive vegetation regular communication with the stakeholder forum is important, as any area where the alien invasive vegetation is not controlled will serve as a source of reinvasion, so increasing the length of time needed to control the problem indefinitely.

145
Evaluate
Monitoring of the vegetation in and around wetlands should be on going.
3.7 PRIORITISATION OF WETLANDS FOR REHABILITATION AND INTERVENTION
��
Pre-Feasibility
In recognition that resources for the rehabilitation of wetlands are limited, it is necessary to prioritise interventions so that maximum impact may be achieved by the interventions initiated. The tool that is available for wetland prioritisation is WET-Prioritise (Rountree et al., 2009). WET-Prioritise may be used at national, regional or local scale. There may be times when resources need to be assigned at the national level, but there may, equally, be times when wetlands on a single site need to be prioritised. This tool can cope with this variation in scale.
The steps to be considered in the prioritisation of wetlands for rehabilitation are to identify the role of the wetland/s in the catchment and whether the catchment has it been earmarked for conservation (Driver et al., 2011). And, for instance, is the aim to address structural rehabilitation, water quality or some other wetland function? Or is there a need to consider applying for a wetland offset (or off-site mitigation – See relevant section below).
Feasibility
Decisions on which interventions are the most important may have to be made on a national, regional or local scale. This section focuses on the local scale.
In consideration of the health of the wetland, the nature of the impacts on the wetland and the stream of ecosystem services which the wetland should deliver together with the nature and extent of rehabilitation required, interventions on the wetlands on a site may be prioritised.
Business Plan
Wetlands prioritised for rehabilitation should be listed in the Business Plan for the appropriate action.
The strategic partnership with Working for Wetlands should cover this aspect as well.
Contracting and Procurement
Contracting and procurement should be done in conjunction with Working for Wetlands.
Operation
The aim(s) of the wetland management, as articulated in the prioritisation process, should be recorded in the EMS documentation which will be reviewed in the cycle of adaptive management.

146
Evaluate
A suitable indicator(s) should be identified for use in the adaptive management cycle to monitor the success of the prioritisation process in achieving the original aim(s) of the intervention.
3.8 REHABILITATION OF IMPACTS
���
Pre-Feasibility
During the pre-feasibility assessment, the wetlands on site should be examined to see whether they need to be rehabilitated and how they can be conserved. In a situation where impacting on a wetland is inevitable the options for wetland management as laid out by SANBI should be investigated. The ideal is “no net loss” of wetlands. Firstly, wetlands should be avoided as far as possible. If it is not possible to avoid the wetlands, then any impact should be minimised. Only as a last resort should residual impacts be compensated by wetland offsets (Dini, undated).
Working for Wetlands should be consulted for advice on addressing the rehabilitation of impacts on wetlands.
Feasibility
Planning of when and how to rehabilitate wetlands should be addressed. Those which may be
Construction
Wetland crossings and culverts should be designed in such a way as to cause minimal disturbance to the wetland. One thing to avoid as far as possible is the channelling of flow as this will disrupt the diffuse flow through the wetland and is likely to cause a channel to develop which will lead to erosion and the loss of wetland function.
Commissioning and Hand-over
Ensure that all construction material has been removed from wetlands and that any damage has been rehabilitated.
Operation
Ensure that, during the course of operation, the conditions of the WUL and RoD are followed. If changes in operation will influence the wetlands, then determine the effects and implement any necessary rehabilitation.
147
3.9 BIODIVERSITY CORRIDORS
���
Pre-Feasibility
Determine where biodiversity corridors are necessary and plan for these. Biodiversity corridors should be planned together with buffer zones.
Planning and Design
Mark out the biodiversity corridors as required.
Construction
Ensure that the biodiversity corridors are laid out and respected.
Operation
Biodiversity corridors should be kept clear of disruption and disturbance as this will reduce their effectiveness.
Evaluate
The Adaptive management process should monitor two aspects: 1) the integrity/disturbance of the corridor, and 2) the usage, against the foreseen usage.
3.10 BUFFER ZONES
���� Pre-Feasibility
The width of a buffer zone around a wetland will vary depending on the land use and the level of protection required. General agricultural activities may require a buffer zone of 30 meters. Forestry activities will require a buffer zone of a minimum of 20 m. The ROD or the WUL may give guidance on the actual width required. There is currently a WRC-funded project on buffer zones and this will give further guidance on this topic.
Feasibility
Ensure that the required buffer zone is included in the planning of developments.
Construction
Ensure that the buffer zones around wetlands are protected in the same way that wetlands are protected.

148
3.11 INDICATORS AND EARLY WARNING SYSTEMS
���
Pre-Feasibility
Monitoring can become expensive and so indicators need to be selected to accurately give the required information as inexpensively as possible. For instance, the invasion of a wetland by terrestrial vegetation will indicate that the wetland is drying.
The location of the indicator in the DPSIR framework will then guide the management response to the change. In the above example, for instance, the indicator indicates a change in state with the reason for the change (or Driver) being a change in the hydrology of the wetland. Therefore the management intervention should be aimed at the hydrology.
Determine the aspects of wetland management which need to be monitored and design effective indicators to detect change. Some indicators, such as erosion or head cuts, may need to be monitored annually or more often during the wet season. Others, such as the invasion of terrestrial vegetation, may only need to be monitored every 3 to 5 years unless there has been a change in the catchment or operation of the site which poses a threat to, for instance, the wetland hydrology.
Indicators may be structural, for instance, the example of the indicator given above, or functional.
Feasibility
Design, with the help of experts where necessary, indicators appropriate to the wetland situation with which you are confronted. Some ideas for indicators are given in ‘Eskom’s wetland classification and risk assessment index field guide’.
Operation
Indicators should form part of an adaptive management programme which is designed to monitor progress towards achieving the vision or desired future state for the wetland (See relevant below).
3.12 VEGETATION MANAGEMENT
��� Pre-Feasibility
Eskom has well defined guidelines for the management of vegetation on its property and servitudes. These guidelines include managing vegetation in wetlands. These guidelines should guide activities in two ways:
i. All personnel responsible for vegetation management should be fully trained in the implementation of the guidelines, and

149
ii. The guidelines should be revised at appropriate intervals to ensure that they address all statutory requirements for management of vegetation.
Operation
Vegetation management on Eskom property should be supervised by a competent person.
3.13 ECOSYSTEM SERVICES
��� Pre-Feasibility
The ecosystem services delivered by the wetlands need to be assessed. It is recommended that assessment of ecosystem services be undertaken by an expert. While this can be done for the Eskom property alone, it will be of more use if the system is taken as a whole, i.e. assess the Eskom property in conjunction with the neighbouring properties that are part of the same system. In this way, the overall ecosystem will be considered, and the areas where the wetland condition is less than optimal will be identified for appropriate intervention. The key general reference to the identification of ecosystem services is the Millennium Assessment (MA, 2005) and references specific to the Olifants River Basin in the North-East of South Africa are the report on the nature, distribution and value of aquatic ecosystem services of the Olifants, Inkomati and Usutu to Mhlatuze Water Management Areas (DWA, 2010). This content of this report has been further developed by the reports from the Directorate Water Resource Classification (2011a; 2011b). Knowledge of the ecosystem services provided by the wetlands on the site and neighbouring properties will assist in prioritising the aspects of wetland management that have been identified as needing attention. Some other useful references in this respect are Ginsburg et al. (2010); Kotze et al. (2010); Turpie (2010a; 2010b); Turpie and Kleynhans (2010); Turpie et al. (2010).
Once the ecosystem services delivered by the wetlands have been assessed it will be possible to plan for any interventions necessary to restore or enhance these. In planning this, it is necessary to take the requirements of the WUL and ROD into account.
Useful Resources
Directorate Water Resource Classification, 2011a. Department of Water Affairs, South Africa, May 2011.
Classification Of Significant Water Resources In The Olifants Water Management Area (WMA 4): Report 3a: Report on IUAs and Report on Socio‐economic evaluation framework and the decision‐analysis framework. Report 3b: Analysis scoring system. RDM/WMA04/00/CON/CLA/0311 DWAF (2004).
Development of a framework for the assessment of wetland ecological integrity in South Africa. Phase 1: Situation Analysis. by MC Uys. Contributors G Marneweck and P Maseti. Report No. 0000/00/REQ/0904 ISBN No.: 0-621-35474-0. Resource Quality Services, Department of Water Affairs and Forestry, Pretoria, South Africa.

150
Directorate Water Resource Classification, 2011b. Department of Water Affairs, South Africa, July 2011. Classification Of Significant Water Resources In The Olifants Water Management Area (WMA 4): Report on Socio-economic evaluation and the decision-analysis framework. RDM/WMA04/00/CON/CLA/0411
Ginsburg, A.E., J.G. Crafford and K.R. Harris. 2010. Framework and Manual for the evaluation of aquatic ecosystems services for the Resource Directed Measures. WRC Report TT 462/10. Water Research Commission, Pretoria.
DWA, 2010. The nature, distribution and value of aquatic ecosystem services of the Olifants, Inkomati and Usutu to Mhlatuze Water Management Areas. Contract Report by Anchor Environmental Consultants for Department: Water Affairs, 362pp.
Kotze D, H Malan, W Ellery, I Samuels and L Saul: Series Editor: H Malan, 2009. Wetland Health And Importance Research Programme 7: Assessment of the environmental condition, ecosystem service provision and sustainability of use of two wetlands in the Kamiesberg uplands. Report to the Water Research Commission
MA, 2005. Millennium Ecosystem Assessment: Ecosystems and human well-being: synthesis. Island Press, Washington, DC
Turpie J, K. Lannas, N. Scovronick and A. Louw., 2010. Wetland valuation. Vol I: Wetland ecosystem services and their valuation: a review of current understanding and practice. Series editor H Malan: Wetland Health and importance Research Programme 8. WRC Report No. TT 440/09.
Turpie J, 2010a. Wetland valuation. Vol II: Wetland valuation case studies. Series editor H Malan: Wetland Health and importance Research Programme 9. WRC Report No. TT 441/09.
Turpie. J 2010b. Wetland valuation. Vol III: A tool for the assessment of the livelihood value of wetlands Series editor H Malan: Wetland Health and importance Research Programme 10. WRC Report No. TT 442/09.
Turpie and M. Kleynhans. 2010. Wetland valuation. Vol IV: A protocol for the quantification and valuation of wetland ecosystem services. Series editor H Malan: Wetland Health and importance Research Programme 11. WRC Report No. TT 443/09.
3.14 WETLAND OFFSETTING
��
Pre-Feasibility
Wetland offsetting should be considered only after measures have been taken to, firstly, avoid wetlands and, secondly, to minimise any impacts. Only then will permit applications for offsetting (onsite or offsite) be considered. SANBI has developed the document entitled ‘Towards a best practice guideline for wetland offsets in South Africa’ (SANBI and DWS, 2014) out for review. It is intended for DWA and DEA to endorse this document so that when the need for wetland offsetting is permitted, it will be done in terms of this guideline.
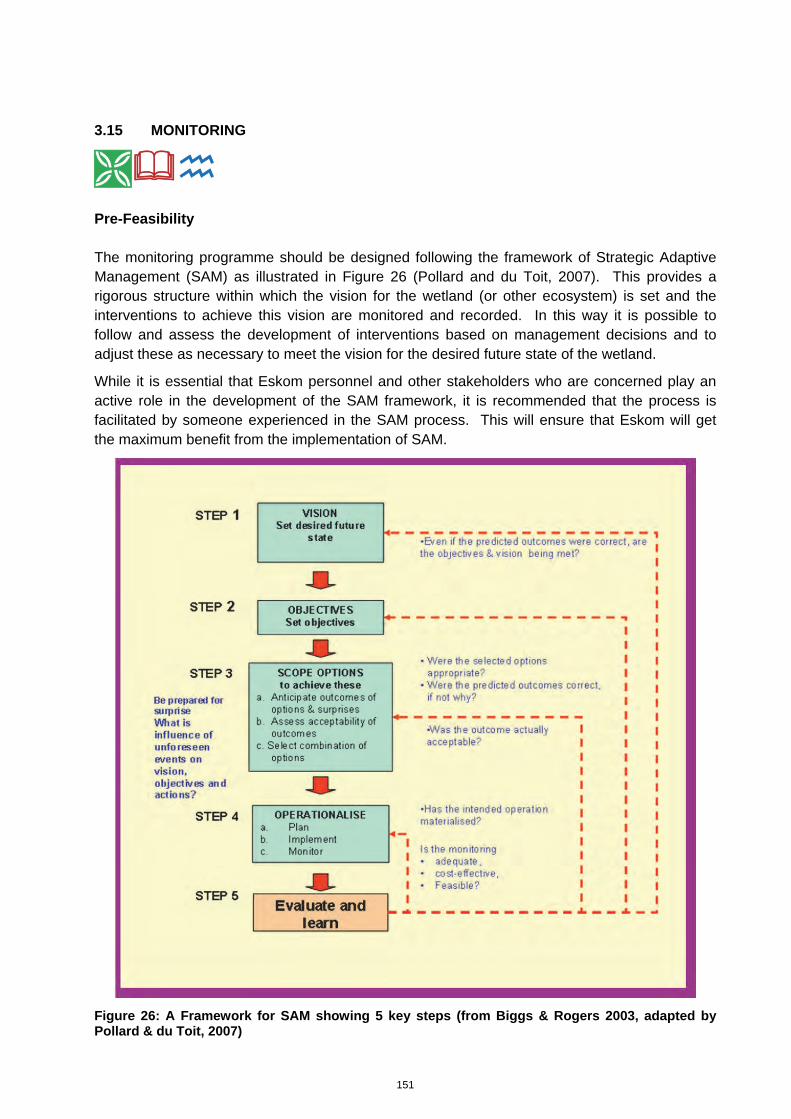
151
3.15 MONITORING
Pre-Feasibility
The monitoring programme should be designed following the framework of Strategic Adaptive Management (SAM) as illustrated in Figure 26 (Pollard and du Toit, 2007). This provides a rigorous structure within which the vision for the wetland (or other ecosystem) is set and the interventions to achieve this vision are monitored and recorded. In this way it is possible to follow and assess the development of interventions based on management decisions and to adjust these as necessary to meet the vision for the desired future state of the wetland.
While it is essential that Eskom personnel and other stakeholders who are concerned play an active role in the development of the SAM framework, it is recommended that the process is facilitated by someone experienced in the SAM process. This will ensure that Eskom will get the maximum benefit from the implementation of SAM.
Figure 26: A Framework for SAM showing 5 key steps (from Biggs & Rogers 2003, adapted by Pollard & du Toit, 2007)

152
Operation
The rigour of the SAM process requires that records be kept of each step taken and that each decision and its outcome are followed over time to ensure that the interventions taken will achieve the desired state.
3.16 ECOSYSTEM SERVICES FOR COMMUNITIES
Purpose of this sub-framework:
This sub-framework will set out the process for identifying and evaluating the value of the ecosystem services used by communities and how these will be affected by Eskom activities. Where the impact may be negative, the framework will include feedback loops to assess mitigation measures where these are appropriate. At the same time, opportunities will be identified to promote access to wetland goods and services by surrounding communities, in support of Eskom’s social responsibility initiatives.
High-level overview:
An investigation into the reliance of surrounding communities for their livelihood on wetlands is required. In some instances, continued access to land to continue using the services that wetlands provide, will impact positively on sustainable livelihoods of communities reliant on wetland services. At the same time, the sustainable use of wetlands provides opportunities for wetland conservation whilst balancing corporate social responsibilities. The compilation of a Management Plan for wetlands associated with sustainable livelihoods will promote wise and sustainable use.
Useful Resources
Abbot Grobicki (Pty) Ltd, 2002. Cultivation of plants in restored urban wetlands for income generation in local communities. WRC Report No 1054/1/02.
J Turpie Wetland Valuation. Vol iii: A Tool for the Assessment of the Livelihood Value of Wetlands, 2010. WRC Report No TT 442/09.
Sharon Pollard, Derick du Toit, Tessa Cousins, Donovan Kotze, Edward Riddell and Claire Davis, 2010. Sustainability indicators in communal wetlands and their catchments: Lessons from Craigieburn wetland, Mpumalanga. WRC Report No. 1709/1/10.
D Kotze, H Malan, W Ellery, I Samuels and L Saul, 2010, Assessment of the environmental condition, ecosystem service provision and sustainability of use of two wetlands in the Kamiesberg Uplands. WRC Report No. TT 439/09.
Biodiversity GIS (BGIS), http://bgis.sanbi.org/
W Ellery, S Grenfell, M Grenfell, C Jaganath, 2010. A method for assessing cumulative impacts on wetland functions at the catchment or landscape scale, WRC Report No. TT 437/09.

153
Prefeasibility
Perform Concept design
A. As a first step, it will be required to ascertain whether any wetland will be affected by the proposed project as well as its conservation and health status.
a) Available data (such as those from BGIS) can be consulted to determine if wetlands occur on site
b) A site visit may be required to identify any wetlands on site. Note that during dry seasons/periods it may be difficult to identify wetlands
c) Reports from Consultants may contain the required information d) The environmental services associated with the wetland should be identified, using
the appropriate tools (Refer to the section on wetland identification and assessment). B. If wetlands are present on site, it will be required to determine in what way its presence will
influence the concept design as well whether any social or economic dependencies exists. The methodology is discussed in the section below. (Any modifications of on-site hydrology, might affect wetlands on adjacent properties or downstream in the catchment. This must be taken into consideration.)
Perform Stakeholder Needs Assessment
The extent (spatial and ecosystem services as well as wetland hydrology) of wetland impacts/modification must be understood in order to identify and engage with stakeholders. Affected owners and/or users of land should be considered as potential stakeholders.
Ascertaining the level of direct reliance on wetland goods and services to sustain livelihoods will be an important step to understand the needs of communities in particular who use wetlands for a variety of social, cultural and economic benefits. The steps that need to be undertaken in the assessment process are as follows (based on J. Turpie, 2010):
a. Define the objectives and level of study b. Define the study area boundaries and wetland dependent community; c. Describe habitats and provision of services d. Score benefits derived from wetland(s) e. Assess vulnerability of local community f. Assess current level of dependence on the wetland(s) g. Calculate Wetland Livelihood Value Index h. Assess sustainability of the community-wetland relationship.
Perform Base Infrastructure Assessment
New infrastructure related to supply of services or access to the site, should also be investigated in the same manner, in order to determine whether any wetlands and associated social and economic reliance on goods and services from them will be affected.

154
Legal and Regulatory Requirements
The legal implications of any impact on or proposed use of wetlands must be ascertained. Refer to the relevant section providing an overview of the legal matters pertaining to wetlands. Legal Counsel can be obtained, or the matter discussed with the relevant authorities.
Legal implications may impact on:
− Project time frames and project budget due to the need for environmental authorization − Project feasibility in cases where wetlands have been classified as a high priority for
conservation − Project budget due to the need for rehabilitation of impacts associated with the proposed
project − Project time frames due to the need to execute specialist studies and consult with
stakeholders
It must also be noted that South African legislation does not distinguish between natural and artificial wetlands. Wetlands that are or have been artificially created will after a certain number of years have the same legal status as naturally occurring wetlands.
Partner Selection
Depending on the nature of the proposed project, a wetland partner may be required. For example in the case of rehabilitation, Working for Wetlands is a suitable partner. The local Wetland Management Forum of the relevant catchment will be a good source of information on potential partners.
In instances of community livelihoods and wetlands, community representatives will have to be selected. Wetlands and their hydrological regime oven stretch over property boundaries and it is therefore important to ensure that landowners in such cases be involved in the initiative as partners.
Commercial and Financial Structure
The appropriate commercial and financial vehicle has to be identified with relevance the matter at hand. For example:
− Providing funding for rehabilitation − Providing and managing of seed funding for community initiatives − Managing contributions from landowners and grant funding − Providing for and management of funding for the execution of studies and research − Holding land in trust for communities − Compensating communities for loss of livelihoods.

155
Business Case and Risk Assessment
Should it be found that livelihoods will be negatively affected, it should be understood in what way this will happen, in order to compensate communities for their loss. For example if access to a wetland is cut off and with it the opportunity to harvest materials for roofing or making baskets, in what way can communities still access the raw materials needed or can supplementary materials be supplied?
If opportunities have been identified to actively support wetland conservation through sustainable livelihoods, the nature of the particular wetland will dictate the services that it can provide in a sustainable manner. The report by Kotze et al. (see “Useful Resources” above) provides detail on how to execute studies of this nature. For example, it is possible to cultivate economically valuable plants at high density in wetlands, and if growing conditions are optimized then it should be possible for such a project to become a sustainable source of employment and wetland protection. Cultivation practices should be promoted which rehabilitate wetland function and be of a non-automated nature. The cultivation site must be actively monitored over the long-term, to detect and manage the environmental impacts of the project. It is recommended that pristine wetlands be promoted for the least invasive forms of livelihood support. Altered degraded wetlands can be considered for cultivation (where planting will enhance the ecological and hydrological functioning of the wetland) as well as harvesting of natural vegetation/resources. It will be vital to discuss any proposed cultivation and other uses with the relevant authorities.
Stakeholder Management
Given that issues of livelihoods are by nature emotive, it is advisable that a stakeholder management plan be compiled, setting out who must be consulted in what way, as well as the frequency there-off. Stakeholder management might involve aspects of education, training and awareness.
For the purposes of education, training and awareness, especially in circumstances requiring behaviour change, the required assessments have to be done in order to ensure that education and awareness interventions are effective. KAP studies (Knowledge, Attitude, Practice) provide a good indication of the manner in which
Project Development Planning
Given that this phase of the PCLM represent an investigation with a greater amount of detail, the same guidelines can be used as is explained above in this section.

156
Screen, Prioritise and Approval
During this phase, it will be determined to establish whether any new decisions have been taken that will necessitate a repeat of the processes described above. The final decisions and their related wetland implications must be talked forward into the next phase.
Assess Stage and Plan Next Stage
The final decisions and their related wetland implications must be talked forward into the next phase.
3.17 POLLUTION ATTENUATION FOR ESKOM AND THEIR MINES WITH RELEVANCE TO RQOS OF FEEDER CATCHMENTS
Eskom generates a variety of wastes, some of which are air-borne, some water-borne and some solid. Each of these categories of waste will stress the environment and negatively impact on the biodiversity. This sub-framework will guide the effective management of the various treatment methods that may be selected. The Eskom policy of zero liquid effluent discharge will be progressively implemented, but this sub-framework will guide waste management under the current waste management regime.
Wetlands have adapted to more acidic and higher salt loads due to their position in the landscape. Wetlands therefore are worthy of conservation given that they act as natural sinks for the products (within limits) of mine water effluents.
The potential of wetlands (both natural and artificial) to attenuate pollution levels in surface water could be harnessed by Eskom to promote water quality in the catchments within which it operates. Understanding and incorporating this within the initial wetland inventory, will ensure that the criteria and targets related to wetland conservation take cognisance of this important wetland function.
Based on the pollution attenuation potential of wetlands, Eskom can set strategic conservation and rehabilitation targets to improve catchment water quality.
Useful Resources
Environmental Protection Agency, U.S. Army Corps of Engineers: Guiding Principles for Constructed Treatment Wetlands: Providing for Water Quality and Wildlife Habitat.
Waste Treatment
Although wetlands have long been recognized for their flood control and water quality improvement functions, the unrestricted use of natural wetlands as receptacles for point and nonpoint sources of pollution may have adverse effects on wetlands and wetland biota. If natural wetlands are the ultimate receiver of polluted runoff, the potential impacts of such discharges must be investigated and appropriate management practices designed to minimize

157
any impacts. Pre-treated effluent however, may be used to restore degraded wetland systems, provided that the source water meets all applicable water quality standards and criteria and the practice would result in a net environmental benefit to the wetland being restored. The requirement for legal compliance and authorisations before commencing such a practice, must however be investigated.
Artificial Wetlands
Although it takes a certain length of time for an artificial wetland to function at an optimal level and that a certain level of routine maintenance is required to support continued optimum functioning. Artificial wetlands have been used successfully in a variety of situations. As with any system (natural or manmade) it must be acknowledged that due to its nature as an open system, it should not be viewed in isolation from surrounding landscapes and ecosystems, as well as social and economic needs. The ecosystem goods and services associated with artificial wetlands are not limited to pollution attenuation only, but can supply refuge for biodiversity and supply for example reeds and grasses for thatching and crafts. When developing a constructed treatment wetland, consideration should be given to its role within the relevant catchment, as well as within the broader ecosystem context of the region, such as location of the wetland in relation to wildlife corridors and potential threats from the introduction of alien invasive species. Constructed wetlands should also mimic natural features as far as possible.
The decision to proceed with the creation of artificial wetlands is dependent on a variety of factors. Artificial wetlands can be considered should it be found that:
a) A specific non-point or point source of pollution upstream impact negatively on water quality (for example an informal settlement inadequately serviced with sanitation) artificial wetlands can be created to attenuate pollution levels
b) Interventions of a low/passive technological nature are feasible, artificial wetlands can provide a “polishing” factor to effluents or run-off (from example coal storage areas where problems are experienced with sediment loads to catchment)
c) Habitat suitable for wetland associated species are diminishing in the catchment and artificial wetlands can supplement existing habitat
d) A constructed wetland is a cost-effective alternative when compared to other alternatives that could potentially treat the same or similar problems
e) Monitoring and maintenance requirements f) Size of land required g) Quality and quantity of effluent to be treated h) Nature of waste to be treated, e.g. biodegradability i) Nature of available land, e.g. undisturbed and of high conservation value j) Unauthorised access and access by undesirable animals k) Potential linkages with existing systems to supplement or to improve issues of
connectivity l) Socio-economic potential, e.g. harvesting of wetland products m) Vector breeding, e.g. mosquitoes n) Opportunities of the effluent to restore the hydrology of natural wetlands.
Given discouraging trends observed in the literature with respect to South African case studies (in strong contrast with findings elsewhere) it is advisable that a pilot project be undertaken before large-scale rollout of artificial wetlands.

158
The nature of the wastes generated by Eskom and their supply chain has to be classified and analysed in order to determine whether artificial/constructed wetlands are a feasible option with reference to pollution attenuation.
The wastes typically generated by Eskom and its suppliers are:
Type of waste Potential of constructed wetlands to attenuate pollution related to waste type
Boiler ash slurry Run-off and leaching from storage facilities: Yes
Brine No
Hydro carbon contaminated soil and water No
Coal fines slurry Run-off and leaching from storage facilities: Yes
Overburden and waste rock from mining operations (Spoil)
Run-off and leaching from storage facilities: Yes
Mine pit dewatering effluent Yes, depending on PH levels or after appropriate pre-treatment
Storm water contaminated by run-off from hard surfaces typically containing a variety of substances such as:
− Hydro carbons − Coal dust − Coarse fly ash − Sewage sludge
Run-off and leaching from storage facilities: Yes
Nitrates leached into ground water from blasting operations
Yes
Laboratory waste No
Solid waste from households and offices Run-off and leaching from storage facilities: Yes
Sewage sludge Run-off and leaching from storage facilities: Yes
Treated sewage effluent Yes
Acid water from waste rock (ARD) and mine workings (AMD)
Run-off and leaching: Yes
A mixture of hazardous wastes such as batteries, paint, solvents and used oils, etc.
No
Asbestos No
Flue Gas Desulfurization (FGD) Wastes: Wet FGD systems resulting in waste slurry of hydrated calcium sulphate and sulphite, and unreacted lime, stabilized with
Run-off and leaching from storage facilities: Yes

159
Type of waste Potential of constructed wetlands to attenuate pollution related to waste type
fly ash and co-disposed with boiler ash slurry
Blow-down from boilers and recirculating cooling water systems and cooling tower sludge
Run-off and leaching from storage facilities: Yes
Poly Chlorinated Biphenyls (PCBs) from transformer oil No
Radio-active waste No
Methane releases from collieries No
Discarded coarse rock (high ash content) Run-off and leaching from storage facilities: Yes
Coal Washery rejects and coal wash water Depending on PH and level of pre-treatment: Run-off and leaching from storage facilities: Yes
Demineralization regenerant products, e.g. Polycarboxylic Acid.
No
Determination of the Risk Associated with Wastes
Determination of the risk associated with a particular waste, will aid in the determination of appropriate management actions. The section below provides an overview of the methodology to assess risk significance.
Significance is the product of probability and severity rating divided by the mitigation potential:
Significance = Probability x Severity
Mitigation
Probability and Severity will be determined based on the following:
Determining the Severity of an Impact
Determination of the severity of an impact is a function of intensity, duration and extent, divided by the extent to which mitigation can successfully be applied:
Severity = intensity + duration + extent
Each of the 4 factors used to determine the severity of an impact, are described below:
• INTENSITY FACTOR
The level of intensity is the sum of volume, toxicity, social impact and ecological impacts.
Note that either Volume A or Volume B is used (refer to the description) but never both at the same time.

160
Low (1) Medium (3) High (5) Sub Total
(Sum)
Volume (A) (refers to process input and output substances/material or products)
Less than 80 m3 at any one time (or low volumes relative to industry/commercial standards)
Between 80 and 300 m3 at any one time (or medium volumes relative to industry/commercial standards)
In excess of 300 m3 at any one time (or high volumes relative to industry/ commercial standards)
Volume (B) (refers to natural resources)
Relatively small Medium Large
Toxicity Toxicity is on par with everyday goods in wide-spread use and is biodegradable.
Toxicity can be compared to those that have to be handled with some caution and are non-biodegradable.
Toxicity is on par with toxic/dangerous/ flammable substances that are non-biodegradable.
Social No or very limited impact
Some impact on immediate communities, but cannot be considered as disruptive
Major disruptive impact on surrounding communities
Ecological Natural functions not affected or negligible.
Environment affected but natural functions and processes continue (Some damage or wildlife injury may occur). Impact is reversible or irreplaceable loss will not occur
Environment affected to the extent that natural functions are altered to the extent that it will permanently or over the long term cease (Major damage or wildlife injury could occur).
Irreplaceable loss will occur.
Total

161
• DURATION
Duration is assessed and a factor awarded in accordance with the following:
Table: 1. Duration factor rating and description
Duration of Impact Duration factor
Short term The duration of the is impact is 1 Year or less Factor 1
Medium term The duration of the is impact is 1-5 Years Factor 3
Long term The duration of the is impact is 5 to 25 years Factor 4
Permanent The duration of the is impact is longer than 25 years and can be considered as permanent
Factor 5
• EXTENT
Describes the physical extent the impact and factors are awarded according to the following:
Table: 2. Extent factor rating and description
Extent of the impact Extent factor
Site The impact only exists within the activity’s footprint Factor 1
Local The impact could impact on the whole or a considerable portion of the properties on which the activity is undertaken as well as neighbouring properties
Factor 3
Regional The impact could affect the area, neighbouring as well as other areas further away than the immediate neighbours
Factor 5
• PROBABILITY
Probability describes the likelihood of the impact actually occurring, and is rated as follows:
Table: 3. Probability factor rating and description
Possibility that impact will occur Rating
Improbable Low possibility of impact occurring due to design or history
1
Probable Distinct possibility that impact will occur 2
Highly probable Most likely that impact will occur 3
Definite Impact will definitely occur 5

162
• SIGNIFICANCE RATING
Following from the above, the Significance rating can now be determined as follows:
Significance = severity x probability
The significance rating thus determined should influence the proposed project as described below:
Negligible (calculated Significance Rating < 25)
− Positive and negative impacts of negligible significance are unsubstantial and should have little or no influence on the proposed development project.
Low (calculated Significance Rating 25 < 50)
− The impact is limited and should not have a material effect on the decision to continue. Management intervention is required.
Moderate (calculated Significance Rating 50 < 90)
− Positive impact: Should weigh towards a decision to continue, should be enhanced in final design.
− Negative impact: Should weigh towards a decision to terminate proposal, or mitigation should be performed to reduce significance to a low significance rating.
−
High (calculated Significance Rating > 90)
− Positive impact: Continue
− Negative impact: If mitigation cannot be implemented effectively (into the moderate category), proposal should be terminated.
Table 23 below provides an example of how the unmitigated significance ratings are calculated:
Table 23: Calculation of unmitigated ratings
Probability
Severity Severity Rating
Significance Rating
(Probability x Severity rating)
Intensity Duration Extent
Probable 2 Low 4 Short Term
1 Local 2 7 14 Negligible
Probable 2 Low 4 Medium Term
3 Regional 3 10 20 Low
Definite 5 Medium 12 Medium
Term 3 Local 2 19 85 Moderate
Definite 5 High 20 Permanent 5 Site 1 26 180 High

163
MITIGATION
Mitigation will be calculated as follows:
Mitigation factor rating and description
Description Factor Allocated
Mitigation is not possible or positive impact of mitigation is negligible. Impact remains irreversible.
1
Mitigation is possible to some extent with moderate levels of positive impact. Impact is largely reversible with only a small portion that remains as irreversible.
2
Mitigation is possible with moderate to high levels of positive impact. Impact is reversible.
3
Mitigation is possible to such an extent that all negative impacts are reduced significantly or eliminated. Impact is completely reversible.
4
Significance = intensity + duration + extent
Mitigation potential
Natural Wetlands
Collectively, wetlands in a catchment can have a positive impact on water quality. The extent of wetland surface area required to maintain or improve water quality in a catchment is dependent on a large number of variables, such as:
a) The nature of the water quality problems experienced in the catchment b) The hydro-geomorphic position of wetlands in the landscape c) The relative position of wetlands with reference to any pollution sources in a catchment.
The RQOs set for a catchment can also provide further guidance as to the critical extent of wetland surface area that will be required in especially a developing catchment. It is acknowledged that at this stage, the matter of required wetland surface area vs. catchment surface area with respect to the delivery of ecosystem goods and services are “blue sky” and that each catchment being unique and dynamic, will require dedicated studies.
An observation of the levels of development in a catchment as well as the temporal and spatial nature of water quality constituents is an important starting point. Should any of the aforementioned criteria have a significant negative trend, a joint investigation with suitable stakeholders should be undertaken to determine the optimal wetland surface area, wetland types as well as levels of wetland health that will be required to sustain or improve water resource quality in a catchment.
A useful method in this regard is to link wetland health and the provision of ecosystem services to national land cover change data sets, which are readily available. Land cover is used as an indicator of impacts on hydrological functioning and through consulting numerical metrics predefined by Ellery et al; loss of wetland functionality can be deducted. Using coarse-resolution land cover categories as a basis to assess impacts to wetlands is a very basic tool,

164
however given the broad scale at which it will be applied, it will generally be sufficiently accurate for the purpose of strategic assessments (Ellery et al., 2010).
3.18 CARBON STORAGE IN WETLANDS
� With a global and national focus on climate change, the role of wetlands in carbon storage and sequestration has received increasing attention. This sub-framework provides an overview of important steps to promote and to protect the carbon sequestration abilities of wetlands during the PLCM.
Wetlands in general, but particularly peat lands, store large quantities of carbon (see Figure 8, page 39). Wetlands may, thus, contribute to the adaptation and mitigation strategies that Eskom of South Africa may commit to in the future.
Useful Resources
Adhikari, S., Bajracharaya, R.M. & Sitaula, B.K. 2009. A Review of Carbon Dynamics and Sequestration in Wetlands. Journal of Wetlands Ecology. Vol. 2, pp. 42-46.
Donovan, P. 2012. Measuring soil carbon change: A flexible, practical, local method. The soil carbon coalition.
Environment and Natural Resources Committee. 2010. Inquiry into Soil Carbon Sequestration in Victoria. Parliament of Victoria. Parliamentary Paper. No. 362 Session 2006-10.
JuFeng, Z., Kun, C., GenXing, P., SMITH, P. LianQing, L., XuHui, Z., JinWei, Z., XiaoJun, H., YanLing, D. 2011. Perspectives on studies on soil carbon stocks and the carbon sequestration potential of China. Chinese Science Bulletin. Vol. 56, nr. 35: 3748-3758.
Kayranli, B., Scholz, M. Mustafa, A. & Hedmark, A. 2010. Carbon Storage and Fluxes within Freshwater Wetlands: a Critical Review.2010.Carbon Storage and Fluxes within Freshwater Wetlands: a Critical Review. Wetlands. Vol 30:111-124.
Mitra, S., Wassmann, R. & Vlek, P. 2005. An appraisal of global wetland area and its organic carbon stock. Current Science. Vol. 88, No. 1.
Potter, C., Klooster, S., Hiatt, S., Fladeland, M., Genovese, V., & Gross, P. 2006. Methane Emissions from Natural Wetlands in the United States: Satellite-Derived Estimation Based on Ecosystem Carbon Cycling. Earth Interactions. Volume 10, no. 22.
Powell, K., Wynn, J., Rains, M., Stewart, M. 2008. Towards a soil-property-based index of wetland “harm”. Unpublished presentation.
Sulaeman, Y., Budiman, M. & McBratney, A.B. 2010. Monitoring Spatio-Temporal Changes of Soil Carbon in Java Using Legacy Soil Data. Proceedings of Inernational Workshop on Evaluation and Sustainable Management of Soil Carbon Sequestration in Asian Countries. Bogor, Indonesia.

165
Victoria, R., Banwart, S., Black, H., Ingram, J., Joosten, H., Milne, E., & Noellemeyer, E. 2012. The benefits of Soil Carbon: Managing soils for multiple economic, societal and environmental benefits. UNEP yearbook.
Wylynko, D. 1999. Prairie wetlands and carbon sequestration Assessing sinks under the Kyoto Protocol. International Institute for Sustainable Development.
Pre-feasibility
Determine whether there are existing data sets that relates to the wetlands on site, and acquire those available. Relevant datasets include topographic data such as contours, water quality and -level monitoring data, soil data, land-use history, and climate and rainfall data.
The need
In order to understand the functioning and dynamics of the wetlands on site, a good understanding of baseline data is required. Wetlands are tremendously variable – in terms of carbon stock wetlands are sensitive to large-scale factors such as climate variation, as well as local scale factors such as water quality and hydro-period.
The process
The following sources can be consulted for information:
• The South African Weather Service or specific weather monitoring stations such as the ARC-ISCW, for climate and rainfall data
• The Geological Society, for baseline geological maps (if not already in Eskom’s possession). Eskom will probably be in possession of more detailed geological information for the area.
• The Department of Water Affairs, for any data relating to water level monitoring such as borehole data or water quality data
• The ARC-ISCW for data relating to the soil in the area • The South African National Biodiversity Institute, for information on the vegetation in the
area • The Surveyor General, for topographical data (if possible more detailed land surveyor
data is preferable) • The Surveyor General, for aerial imagery, current and historical • Universities that might have done research in the area, for any information regarding the
wetland on site • Eskom, for any specialist reports that might already be available such as
geohydrological reports
Feasibility
A soil scientist or wetland specialist (or preferably a wetland pedologist) should be appointed to determine the carbon stock of the wetland. The wetland delineation should be utilized to demarcate the area for which carbon stock will be calculated. The results of this analysis should be a separate report from the wetland delineation report as this data will be used in the future to compare against the monitoring data. In this report, any impacts to the wetlands on site that might affect carbon emissions must be clearly indicated and described.
166
The need
Carbon plays an integral part in the chemical and physical functioning of wetlands, which is an important ecosystem in terms of carbon sequestration. Carbon is easily lost when a wetland is degraded or impacted on. Very little information is available in South Africa regarding the carbon stock in different types of wetlands under different land-uses. There is therefore a large opportunity for Eskom to be on the forefront of research of carbon pools in wetlands in South Africa.
Additionally, South Africa is a signatory to the United Nations Framework Convention on Climate Change (UNFCCC) and the Kyoto Protocol, and is committed to sustainable development. Eskom is currently responsible for almost half of South Africa’s carbon emissions, and has a responsibility to investigate manners in which to alleviate the negative effects that their practices are having. The use of wetlands to sequester carbon for the purpose of carbon offsetting or trading is thus an attractive option, and it is recommended that this Management Framework is used as a first stepping stone in the management of wetlands occurring in Eskom’s catchments to promote soil organic carbon research with the possibility of utilizing this as carbon offsetting and trading.
The carbon stock of the wetland must be determined. These results will be used:
• in conjunction with the impact inventory and results of the health, EIS and PES assessments to assign a ranking value to the wetland.
• as a benchmark to compare carbon monitoring values to.
The process
A soil scientist, whom has had some experience in wetland work, will be best qualified to determine the carbon pool of the wetlands on site. This report should also discuss wetland type and the various impacts to the wetland – current and envisaged; and include a management plan to ensure the optimum functioning of the wetland during Eskom’s activities. The report must include water level data monitoring and pH measurements as well.
A ranking value will be assigned to each wetland depending on its ability to function like a healthy wetland, wetland type, and size of the carbon pool. For example, a peatland will immediately receive the highest ranking possible as this type of system is known to sequester carbon very efficiently. A wetland driven by alluvial processes will receive a considerably lower ranking. The EIS and PES scores will be used to further guide the ranking process. Existing impacts to the system will further determine the ranking, as impacts such as drainage and tillage have a massive effect on GHG emissions. These types of wetlands will be earmarked for rehabilitation. Envisaged impacts to the wetland must also be taken into consideration. A wetland that is going to be impacted severely by Eskom’s activities will attain a low ranking, but will immediately be flagged for rehabilitation and mitigation measures.
Business Plan
Ensure that all documents related to the findings of the wetland delineation, Carbon pool report, PES and EIS determinations have been made available to the business planning process, and are accounted for in this process. If intensive rehabilitation is or wetland offset required, ensure that funds are set aside from the beginning of the project for these activities.

167
The need
The implications that the management of the wetlands on site might have on the financial and business management sector of Eskom should be transparent and included into their business strategy
The process
All the information regarding the wetlands on site should be compiled and made available to the business planning process
Planning and Design
The ranking of the wetlands on site based on the previous sections must be used to guide the management programme that each wetland requires. A long-term monitoring plan for the carbon pool of the wetlands must be put into place.
The process
The carbon pool should be monitored twice a year, once per year in the rainy season and once per year in the dry season. The exact same plots must be sampled. A centralized database must be available where the monitoring data (raw as well as processed data) can be stored. It is important that the wetland is earmarked with a specific goal in mind, as this will give value to the monitoring data. For instance, if a wetland is earmarked from the beginning to be impacted upon, this should be reflected in the carbon pool database, as this information will be used to interpret the data gained. If a wetland is earmarked to be conserved effort should be made to enhance the carbon sequestration potential of the wetland.
Construction
It is important that the monitoring plots in the wetland not be disturbed.
If the wetland is impacted upon by construction activities a detailed report of this should be given and added into the monitoring database as this can influence the interpretation of the data. Emergency protocol must be at hand to follow in cases such as these.
Commissioning and Hand-over
Ensure that the process of wetland management and monitoring is running smoothly, effectively and streamlined during and following the hand-over phase.
Operation
The personnel on site must be trained to recognize negative impacts on the wetlands as a result of catchment activities, so that they may report on any unwanted incidences or – impacts to the wetlands; as well as be familiarized with emergency protocol. This does not only refer to Eskom’s activities, but also other potentially detrimental activities elsewhere in the catchment.

168
Close out
Ensure that the process of wetland management and monitoring is running smoothly, effectively and streamlined during and following the hand-over phase.
Evaluate
Following the project life cycle the monitoring data should be compiled into a scientifically defendable report. As this type of long-term research into carbon pools is rare in South Africa, the potential exist of contributing to wetland and soil science. The project should also be evaluated for its efficiency and shortcomings in the project in order to better the strategies and management during the next project.

169
4 SELECTED CASE STUDIES TO TEST THE ROBUSTNESS OF THE WETLAND MANAGEMENT FRAMEWORK
4.1 PILOT SITE SELECTION
Introduction
The Research Team recognized the need for a justifiable methodology in the selection of pilot sites for the purposes of testing the Wetland Management Framework (WMF). For this reason a cooperative and transparent approach involving relevant personnel from Eskom was followed.
Based on this recognition, two joint workshops were held. The first took place on 24 May 2013, and the second on 26 July 2013. The main points of these meetings are provided below.
Meeting held on 24 May 2013
Overview of meeting
The meeting agreed that and the study done on Adaptive Management Frameworks by Kotze (2004) is suitable for application by Eskom and that the WMF should be based on Eskom’s Project Lifecycle Model (PLCM).
Consensus was reached to include one Eskom project from each Phase of the PLCM (if possible and including different renewable projects). Eskom also indicated that Mpumalanga needs to be prioritised in site selection as most of their Power Stations are situated in this region.
The following Guiding Principles were agreed upon in terms of selection of pilot sites:
1. What is practical 2. What is achievable within the time frames 3. Where are the main challenges/gaps that are being experienced by the specific site and
how relevant are they to the WMF 4. What is cost effective 5. Travelling time and distance from Gauteng 6. Availability of assistance on site 7. Eskom must be the owner of the site.
Overview of proposed methodology
EON Consulting developed a site selection methodology including a scoring tool developed as per Eskom PLCM phase (Pre-planning to Project Closure).
Eskom’s assets were divided into eight broad categories, namely
1. Coal-fired Power Stations 2. Nuclear Power Stations 3. Pumped storage 4. Hydroelectric Power Stations 5. Open cycle gas turbine Power Stations 6. Renewable Energy 7. Transmission and sub-stations 8. Mines
170
The activities and associated environmental impacts of each category of asset were identified with a view to prioritise those with the highest potential for wetland impacts.
Sites are then to be scored based on the following criteria:
1. Whether it is existing facilities 2. Whether it is existing facilities with plans for extensions 3. The nature of ecosystem services rendered by wetlands onsite 4. The nature of other ecosystem services of importance associated with the site, such as
biodiversity corridors 5. The dependence of communities on wetlands for their livelihoods 6. Availability of data and information related to the site and its wetlands 7. Uniqueness of site/surrounding area 8. Position in the landscape – physical 9. Position in the landscape – societal 10. Supply lines 11. Extent of waste disposal – solid 12. Extent of waste disposal – liquid 13. Extent of waste disposal – airborne 14. Opportunities for wetland rehabilitation.
Agreement of the site selection committee
After much debate, Eskom advised a simpler process than the selection methodology proposed by EON Consulting (The original proposed site selection methodology is included as Annexure A to this document). The meeting concluded that a focus on a Systems and Phases Approach is advisable:
1. Focus on a Systems Approach – this will be wetland focused and based on national priorities.
2. Phases Approach where one project within each of Eskom PLCM phase will be selected.
The meeting then advised that the following projects should be focused on for final site selection:
1. Kusile (execution phase) and Ingula (have good wetlands for comparison) 2. Medupi (execution phase) 3. Koeberg 4. Matla and Kriel – both still operational (cumulative impacts as are close to each other) 5. Majuba – due to the presence of hillslopes that feed into the wetlands on site.
Meeting held on 26 July 2013
Overview of meeting
After some deliberation, it was agreed that due to budget limitations only 3 sites would be chosen.
The sites would need to cater for broad applications and studies. It was agreed that the sites would fall under each one of the following sub-sections of the Eskom PLCM:
1. Construction

171
2. Operational 3. Closure
In choosing the sites the team agreed to keep in mind:
1. The presence of on-site multiple wetlands 2. Eskom’s existing work in the area and the possibility of collaboration or duplication of
work 3. Prevalence of both natural and artificial sites 4. Gaining a broad spectrum of understanding/learning from individual sites.
The sites as indicated in Table 24 were consequently recommended as potential options and Eskom will draw up a generation matrix and decide on the final site selection.
Table 24: Recommended site selection options
Section Proposed options
Construction Kusile
• Numerous wetlands • Class B river in immediate surroundings
Operational Matla
Kriel
Arnot
• Linked to a coal mine so all scenarios are likely to be catered for. • Ash dam situated in flood line
Closure Kilbarchan – Newcastle (Ingagane power station)
• Going through closure • SASS/Fish and toxicology study currently been performed • Closure and rehabilitation report
Return to service plant – Grootvlei
It was agreed that Eskom will have an internal review of the suggested sites and confirm with EON which of the sites have been selected for the pilot study. The EON research team will then review information supplied and/or visits the suggested sites to confirm suitability of the selection.
Agreement of the site selection committee
Eskom confirmed via e-mail that the three final sites are:
1. Operational phase: Matla and Kriel Coal Fired Power Stations 2. Construction phase: Kusile Coal Fired Power Station 3. Decommissioned and re-commissioned phase: Grootvlei Coal Fired Power Station.
Kilbarchan could not be selected because the land, as per Eskom feedback received, no longer belongs to Eskom. Matla and Kriel were selected in favour of Arnot due to the recent challenges

172
being experienced by Matla and Kriel. Matla and Kriel are also in close proximity to each other and would present an opportunity in terms of cumulative impacts (both positive and negative).
The map below indicates the locations of the final four sites that were selected for the pilot phase.
Figure 27: The location of the four sites selected for the pilot study.
Kusile, Kriel and Matla are situated in the Olifants River catchment, whilst Grootvlei is situated in the Vaal River Catchment.

173
Figure 28: The primary and quaternary catchments associated with the 4 power stations selected for the pilot study
4.2 PILOT SITE SITUATION ANALYSIS
Introduction
Following on the selection of the four pilot sites as indicated above, the EON team arranged to visit each of the sites. Visits took place on:
1. Matla: 4 September 2013 2. Kriel: 4 September 2013 3. Grootvlei: 5 September 2013 4. Kusile: 16 September 2013
Overview of the findings of the site visits
Table 25 below provides an overview of the main findings of the site visits with reference to the legends contained and described below.

174
Tab
le 2
5: S
um
mar
y o
f fi
nd
ing
s o
f th
e si
te v
isit
s
Gen
eral
Fac
ts
Des
crip
tio
n o
f si
te is
sues
rel
evan
t to
w
etla
nd
man
agem
ent
Ref
eren
ce t
o t
he
WM
F
Co
ncl
usi
on
Mat
la:
Op
erat
ion
al P
has
e
Upp
er O
lifan
ts C
atch
men
t
Inst
alle
d C
apac
ity:
3 60
0 M
W
In
oper
atio
n si
nce
July
19
83 (
22 y
ears
)
− T
he a
sh d
am i
s si
tuat
ed i
n th
e pi
t of
an
old
open
cas
t co
alm
ine.
T
his
old
open
ca
st
min
e w
as
site
d ov
er
an
exis
ting
drai
nage
line
with
wet
land
s.
− A
lea
king
wat
er p
ipe
has
been
rel
easi
ng
appr
oxim
atel
y 25
m3 o
f w
ater
per
day
for
th
e pa
st 3
yea
rs.
Fix
ing
the
leak
wou
ld
mea
n un
dert
akin
g of
an
exca
vatio
n in
a
wet
land
an
d un
cert
aint
y as
to
re
quire
men
ts b
y D
WA
has
lef
t th
e is
sue
unre
solv
ed.
It is
pos
sibl
e th
at t
he w
ater
le
ak
crea
ted
or
cont
ribut
ed
to
the
form
atio
n of
the
wet
land
in t
he f
irst
plac
e.
If in
deed
the
cas
e, t
he m
aint
enan
ce g
ap
crea
ted
the
prob
lem
−
A r
oad
runs
thr
ough
a h
ill s
lope
see
p an
d w
etne
ss
is
obse
rved
on
th
e ro
ad.
Per
sonn
el a
re u
nsur
e of
the
orig
in o
f th
e w
ater
, w
hich
co
uld
be
from
na
tura
l ca
uses
or
em
anat
ing
from
th
e w
et
stor
age
dam
uph
ill.
− S
ever
al a
rtifi
cial
wet
land
s w
ere
obse
rved
on
site
−
Hyd
rolo
gy
of
stor
m
wat
er
run-
off
has
been
al
tere
d by
re
late
d in
fras
truc
ture
, w
ith
the
ash
dam
ha
ving
th
e la
rges
t im
pact
and
hav
e im
pact
s bo
th o
n- a
nd
− W
etla
nds
have
no
t be
en
delin
eate
d (T
he
rese
arch
te
am
has
been
inf
orm
ed r
ecen
tly t
hat
a w
etla
nd s
peci
alis
t is
in
proc
ess
of
bein
g ap
poin
ted
to d
elin
eate
one
of
the
wet
land
s on
site
) −
No
obje
ctiv
es a
nd t
arge
ts r
elat
ed
to
wet
land
m
anag
emen
t ha
ve
been
set
−
No
inve
stig
atio
ns w
ith r
efer
ence
to
wet
land
ec
olog
y an
d fu
nctio
ning
by
ide
ntify
ing
and
desc
ribin
g th
e ra
nge
of
natu
ral
varia
bilit
y in
w
etla
nd e
colo
gica
l sy
stem
s in
the
ar
eas
whe
re
Esk
om
and
its
supp
liers
ope
rate
s.
− S
ever
al le
gacy
issu
es
− T
he c
reat
ion
and
man
agem
ent
of
artif
icia
l w
etla
nds
are
caus
ing
unce
rtai
nty
with
re
spec
t to
th
e m
anag
emen
t of
th
e w
etla
nds
onsi
te.
M
ain
focu
s of
per
sonn
el, b
ut r
oom
for
impr
ovem
ent
No
focu
s
N
o fo
cus
No
Foc
us

175
Gen
eral
Fac
ts
Des
crip
tio
n o
f si
te is
sues
rel
evan
t to
w
etla
nd
man
agem
ent
Ref
eren
ce t
o t
he
WM
F
Co
ncl
usi
on
offs
ite
− T
he
coal
m
ines
su
pply
ing
Esk
om
with
co
al,
does
no
t be
long
to
E
skom
an
d pe
rson
nel
wer
e he
sita
nt t
o in
clud
e th
ese
site
s in
the
site
vis
its
Kri
el:
Op
erat
ion
al P
has
e
Upp
er O
lifan
ts C
atch
men
t
Inst
alle
d C
apac
ity:
3 00
0 M
W
In o
pera
tion
sinc
e 19
79 (
26
year
s)
− A
tre
nch
was
dug
thr
ough
a w
etla
nd (
with
w
ater
dra
inin
g in
to t
he t
renc
h) w
ithou
t th
e kn
owle
dge
of
the
envi
ronm
enta
l pe
rson
nel o
n si
te
− S
ever
al a
rtifi
cial
wet
land
s w
ere
obse
rved
on
site
−
Hyd
rolo
gy
of
stor
m
wat
er
run-
off
has
been
alte
red
by r
elat
ed in
fras
truc
ture
and
ha
ve im
pact
s bo
th o
n- a
nd o
ffsite
. −
Loca
l pe
ople
wer
e ob
serv
ed c
lose
to
the
site
util
izin
g w
etla
nd a
reas
as
graz
ing
for
a fe
w c
attle
−
The
co
al
min
es
supp
lyin
g E
skom
w
ith
coal
, do
no
t be
long
to
E
skom
an
d pe
rson
nel
wer
e he
sita
nt t
o in
clud
e th
ese
site
s in
the
site
vis
its
− W
etla
nds
have
no
t be
en
delin
eate
d −
No
obje
ctiv
es a
nd t
arge
ts r
elat
ed
to
wet
land
m
anag
emen
t ha
ve
been
set
−
Sev
eral
lega
cy is
sues
−
The
cre
atio
n an
d m
anag
emen
t of
ar
tific
ial
wet
land
s ar
e ca
usin
g un
cert
aint
y w
ith
resp
ect
to
the
man
agem
ent
of
the
wet
land
s on
site
.
M
ain
focu
s of
per
sonn
el, b
ut r
oom
for
impr
ovem
ent
No
focu
s
N
o fo
cus
No
Foc
us
Gro
otv
lei:
Clo
sure
ph
ase
(an
d r
e-o
pen
ed)
Vaa
l Cat
chm
ent
Inst
alle
d C
apac
ity:
1 20
0 M
W
− E
nviro
nmen
tal
pers
onne
l w
ere
not
avai
labl
e on
th
e da
y to
as
sist
th
e re
sear
ch te
am
− W
etla
nds
have
no
t be
en
delin
eate
d −
No
obje
ctiv
es a
nd t
arge
ts r
elat
ed
to
wet
land
m
anag
emen
t ha
ve
M
ain
focu
s of
per
sonn
el, b
ut r
oom
for
impr
ovem
ent
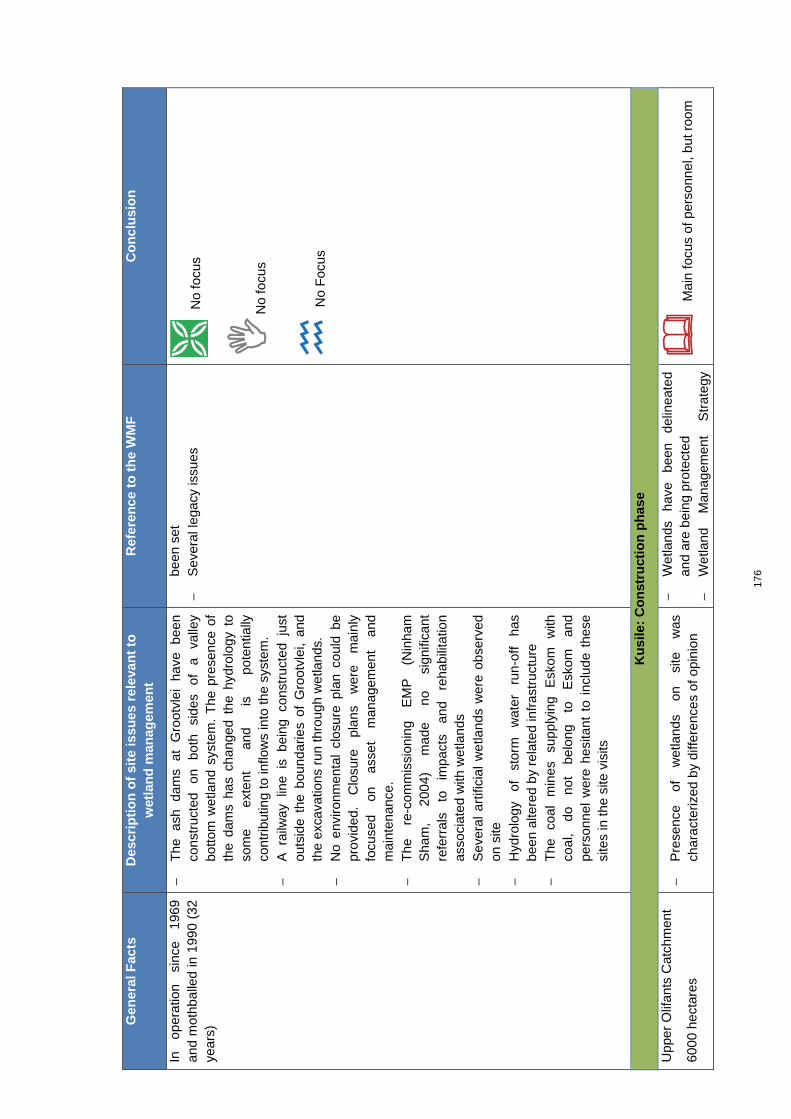
176
Gen
eral
Fac
ts
Des
crip
tio
n o
f si
te is
sues
rel
evan
t to
w
etla
nd
man
agem
ent
Ref
eren
ce t
o t
he
WM
F
Co
ncl
usi
on
In
oper
atio
n si
nce
1969
an
d m
othb
alle
d in
199
0 (3
2
year
s)
− T
he
ash
dam
s at
G
root
vlei
ha
ve
been
co
nstr
ucte
d on
bo
th
side
s of
a
valle
y bo
ttom
wet
land
sys
tem
. T
he p
rese
nce
of
the
dam
s ha
s ch
ange
d th
e hy
drol
ogy
to
som
e ex
tent
an
d is
po
tent
ially
co
ntrib
utin
g to
inflo
ws
into
the
syst
em.
− A
rai
lway
lin
e is
bei
ng c
onst
ruct
ed j
ust
outs
ide
the
boun
darie
s of
Gro
otvl
ei,
and
the
exca
vatio
ns r
un th
roug
h w
etla
nds.
−
No
envi
ronm
enta
l cl
osur
e pl
an c
ould
be
prov
ided
. C
losu
re
plan
s w
ere
mai
nly
focu
sed
on
asse
t m
anag
emen
t an
d m
aint
enan
ce.
− T
he
re-c
omm
issi
onin
g E
MP
(N
inha
m
Sha
m,
2004
) m
ade
no
sign
ifica
nt
refe
rral
s to
im
pact
s an
d re
habi
litat
ion
asso
ciat
ed w
ith w
etla
nds
− S
ever
al a
rtifi
cial
wet
land
s w
ere
obse
rved
on
site
−
Hyd
rolo
gy
of
stor
m
wat
er
run-
off
has
been
alte
red
by r
elat
ed in
fras
truc
ture
−
The
co
al
min
es
supp
lyin
g E
skom
w
ith
coal
, do
no
t be
long
to
E
skom
an
d pe
rson
nel
wer
e he
sita
nt t
o in
clud
e th
ese
site
s in
the
site
vis
its
been
set
−
Sev
eral
lega
cy is
sues
No
focu
s
N
o fo
cus
No
Foc
us
Ku
sile
: C
on
stru
ctio
n p
has
e
Upp
er O
lifan
ts C
atch
men
t
6000
hec
tare
s −
Pre
senc
e of
w
etla
nds
on
site
w
as
char
acte
rized
by
diffe
renc
es o
f opi
nion
− W
etla
nds
have
be
en
delin
eate
d an
d ar
e be
ing
prot
ecte
d −
Wet
land
M
anag
emen
t S
trat
egy
Mai
n fo
cus
of p
erso
nnel
, but
roo
m

177
Gen
eral
Fac
ts
Des
crip
tio
n o
f si
te is
sues
rel
evan
t to
w
etla
nd
man
agem
ent
Ref
eren
ce t
o t
he
WM
F
Co
ncl
usi
on
Cap
acity
: 4 8
00 M
W
− S
ome
inci
denc
es
wer
e re
port
ed
of
cont
ract
ors
dam
agin
g w
etla
nds
− Is
suin
g of
Wat
er U
se L
icen
ses
has
led
to
dela
ys
− T
heir
Wat
er U
se L
icen
se i
s on
e of
the
fir
st t
o be
iss
ued
with
offs
ets,
but
the
re
are
not
a lo
t of
op
tions
as
th
e of
fset
s ha
ve
to
be
in
the
sam
e qu
ater
nary
ca
tchm
ent,
whi
ch is
sm
all
− K
usile
dev
elop
ed a
wet
land
man
agem
ent
stra
tegy
to
he
lp
them
m
anag
e th
e di
fficu
lties
tha
t th
ey a
re h
avin
g w
ith t
heir
wet
land
s, w
hich
mak
e up
abo
ut 1
7% o
f th
eir
area
. −
The
co-
disp
osal
site
has
a s
mal
l pa
n in
th
e m
iddl
e, w
ith t
he r
esul
t th
at t
he s
ite i
s no
w k
idne
y-sh
aped
.
− K
usile
is
th
e fir
st
pow
er
stat
ion
with
a
wet
land
str
ateg
y. T
he s
trat
egy
is m
ainl
y fo
cuse
d on
con
stru
ctio
n-re
late
d im
pact
s
has
been
com
pile
d w
ith a
foc
us o
n m
anag
emen
t of
co
nstr
uctio
n im
pact
s an
d of
fset
ting
for
impr
ovem
ent
W
etla
nd m
anag
emen
t str
ateg
y
deve
lope
d
N
o fo
cus
So
me
focu
s he
re; e
spec
ially
in
reco
gniti
on th
at th
e W
ilge
Riv
er is
to b
e m
aint
aine
d in
Cla
ss II
, but
all
the
com
pone
nts
of th
e W
MF
hav
e no
t bee
n ad
dres
sed.

178
Conclusion
With reference to the respective phases of the pilot sites, the following was found:
Table 26: Summary of findings of the site visits
Pilot Site and PLCM phase
Site visit findings Conclusion
Operational phase: Matla and Kriel Coal Fired Power Stations
Matla and Kriel are not adequately prepared for the operational phase of the WMF, because wetlands have not yet been delineated. No other components of the WMF have been addressed.
As a way forward it was agreed that a detailed wetland management plan (WMP), based on the WMF will be developed for the Matla Power Station (based on the needs of the staff and their eagerness to get involved). Both Kriel and Grootvlei will benefit from the WMP
Construction phase: Kusile Coal Fired Power Station
Kusile is prepared for wetland impacts related to the construction phase, with a focus on legal compliance. Although much work has been done on the wetlands of Kusile, there are aspects of the WMF that have not yet been addressed.
Kusile will benefit from certain components of the WMP that is being developed for Matla
Decommissioned and re-commissioned phase: Grootvlei Coal Fired Power Station
Grootvlei was not adequately prepared for the closure phase nor prepared for the operation phase of the WMF, because wetlands have not yet been delineated. No other components of the WMF have been addressed.
Grootvlei will benefit from the WMP that is being developed for Matla
Conclusion of the Pilot Studies
The main conclusion reached is that the Draft Wetland Management Framework is relative to the status of Eskom’s wetland management, somewhat ambitious at this stage. However, the WMF represents best practice and it is advised that a phased approach to the rollout of the WMF be taken. The creation and management of artificial wetlands are a further matter identified during the pilot studies and the WMF should be updated to provide guidelines in this regard.
Based on the categories of focus as set out in the WMF, it is advised that implementation starts with a focus on legal compliance, followed by livelihoods, ecosystem services and a catchment perspective.

179
The following phase of the pilot project consisted of the development of a detailed Wetland Management Plan (WMP) for Matla Power Station. The plan is based on a workshop with personnel from the Matla Power Station, held on 19 September 2013.
4.3 WETLAND MANAGEMENT PLAN FOR MATLA POWER STATION (PS)
Situation analysis of Matla PS
Matla Power Station and its associated land are situated in the Upper Olifants catchments and straddle two quaternary catchments (B11E and B11D) (Figure 29).
Figure 29: An overview of the NFEPA wetlands associated with the Matla Power Station area (SANBI, 2012)
Eskom provided the boundaries for the map illustrated by Figure 29 above. The map below was obtained from SANBI’s website (www.sanbi.org) (Figure 30A) in which the NFEPA wetlands have been overlaid over an image of the power stations’ (left-hand side) infrastructure. The figure also provides the same image of the Matla Power Station, but with the wetland layer turned off, in order to be able to see the water bodies beneath the wetland layer (Figure 30B). As can be seen from the image, some of the wetlands are artificial and associated with man-made holding structures, or were in existence prior to the ash dams being built. The ash dam was built across the path of the unchanneled valley bottom system.

180
Figure 30: Images associated with Matla PS with reference to the National Wetland Inventory (SANBI, 2013) (Figure 30A: Wetlands on the Matla Power Station property with the NFEPA overlay and Figure 30B: Wetlands on the Matla Power Station property without the NFEPA overlay)
4.4 ANALYSIS OF WETLANDS ASSOCIATED WITH MATLA PS WITH REFERENCE TO ITS CATCHMENT
This section of the document presents the results of an analysis of wetland types associated with the Matla PS property and its associated 2 quaternary catchments. Table 27, Table 28 and Table 29 provide an overview of the respective surface areas and the results.

181
Table 27: Surface area associated with Matla property and the two associated quaternary catchments
Catchment Size (km2) Total size (km2)
B11D 551 1017.7
B11E 466.7
Matla 39
Table 28: Surface area of wetlands in the total catchment
Total Catchment (B11D and B11E)
Wetland category Size (km2) Density‡
Natural 136 0.13
Artificial 13 95.75
Total 149 95.89
Natural Wetlands
Wetland type Size (km2) % of catchment
Channelled Valley bottom 47.81 4.70
Depression 5.71 0.56
Flat 11.79 1.16
Floodplain wetland 45.26 4.45
Seep 22.41 2.20
Unchannelled valley bottom 2.08 0.20
Valleyhead seep 0.88 0.09
Artificial wetlands
Wetland type Size (km2) % of catchment
Unchannelled valley-bottom wetland 0.91 0.001
Seep 4.22 0.004
Floodplain wetland 1.70 0.002
Flat 1.44 0.001
Channelled valley-bottom wetland 4.46 0.004
‡ Density: Number of Wetlands per km2 of a Quaternary Catchment

182
Table 29: Surface area of wetlands within the Matla PS boundaries
Matla
Matla surface area 39
Wetland category Size (km2) Density‡
Natural 4.2 0.11
Artificial 0.5 0.12
Total 4.7 0.23
Natural wetlands
Wetland type Size (km2) % of total catchment
Depression 1.54 27.0
Flat 0.47 4.0
Seep 0.40 1.8
Unchanneled valley bottom 0.39 18.6
Valley head 0.01 1.5
Artificial Wetlands
Wetland type Size (km2) % of total catchment
Channelled valley-bottom wetland 0.07 6.9
Flat 0.15 5.3
Seep 0.23 0.0
Unchanneled valley-bottom wetland 0.06 10.3
‡ Density: Number of Wetlands per km2 of Matla PS’s surface area
Table 30 below provides an overview of the average wetland situation in South Africa (SANBI, 2012). It is useful to compare the figures with the situation in the catchments where Matla PS operates. Based on a comparison between number of wetlands per quaternary catchment and density, it appears as if wetlands in B11 E and D tend to be smaller in size.
Table 30: Overview of the average wetland situation in South Africa
B11E and B11D
Total Surface Area of Wetlands in S.A (km2) 196 545.76 149
Percentage Coverage of Wetlands Area in S.A 15.30
13.36
Density: Number of Wetlands per km2 of a Quaternary Catchment 0.10
95.89
Average number of wetlands per Quaternary 62.7125 (for two catchments)
1504

183
The graph below illustrates the relative contribution from the different wetland types (natural) contained within the boundaries of Matla PS to the two quaternary catchments. It is important to acknowledge that these figures would change significantly if Matla PS were positioned in one catchment only. The finding of this analysis then underlies the importance of the Matla PS wetlands as containing a significant portion of depression and unchanneled valley bottom wetlands from a representivity point of view.
Note that the X-axis refers to two units of measure, namely percentage and surface area in km2.
The analysis of the wetland types as illustrated by the tables (29, 30 and 31) above is that the distribution of the different wetland types is dependent on the geomorphology of quaternaries. For instance, depression wetlands are only found in areas with very low gradient (normally less than 1%) so tend to occur on watershed areas, and comprise 27% of the wetland, by area, of the wetlands occurring on the Matla property as opposed to 0.56% of the wetland types in the two quaternaries. In the same way, unchannelled valley-bottom wetlands occur more frequently in the upper reaches of a watercourse, with 18.6% of the wetland area on the Matla property, as opposed to 0.2% of the wetland area in the two quaternaries. This makes the management of these wetland types on the Matla property all the more important, as they represent a substantial part of the land surface suitable for the formation of these wetland types. The absence of channelled valley bottom wetlands and floodplain wetlands from the Matla site indicates that these occur lower down in the catchment where the watercourses are generally larger and likely to carry higher flows during flood events. This spatial separation of wetland types based on the geomorphology, which tend to be related to position of the site in the catchment, should be noted in the delineation of wetlands on site and related to the wetlands in the surrounding area in order to develop a plan for conserving the diversity of wetland types.
Table 31 below indicates measures to be taken to protect these wetlands. Definition of the wetland types is provided by SANBI (2012). In addition, note should be taken of the level of threat to which each wetland type is exposed when planning conservation measures. Figure 31 illustrates this level (from Nel and Driver, 2011). In all cases, wetlands on Eskom property should not be seen in isolation, but should be reviewed and managed together with those upstream and downstream as part of the whole ecosystem. This is particularly important when the wetlands are continuous with those on neighbouring properties.

184
Table 31: Measures that are to be taken to protect the Matla wetlands
Wetland type Measures to conserve/protect the specific type
Depression − The catchment area of depression wetlands is normally local and, as far as possible, this should not be disturbed by developments that will change the hydrology‡. In some cases, the catchment may extend beyond the immediate vicinity and this should be taken into account.
− Sediment-generating activities should be avoided as far as possible, but where these cannot be avoided, sediment generation should be controlled.
− Buffer zones should be respected.
− Where depression wetlands are important to the biodiversity of the general area, such as loafing areas for waterfowl, disturbance around the wetland should, as far as possible, be minimised.
Flat − Ensure that channels do not form in the wetland. Possible causes of channels may be cattle paths or vehicle tracks. This is particularly important near their edges as the formation of such a channel could drain the wetland, causing the erosion of the wetland.
− Maintain the hydrological regime. ‡
− Avoid cultivation of flats.
Seep − Hillslope seeps provide better grazing than surrounding areas and care should be taken to avoid the development of paths which may lead to erosion.
− Care should be taken not to interrupt the passage of the interflow which feeds the seep. ‡
− Care of the upslope areas will ensure that the seep continues to deliver ecosystem service benefits.
− Diffuse flow of water through the wetland should be maintained. ‡
Unchannelled valley bottom
− Care should be taken not to disrupt the hydrology. In particular, roads or paths constructed across unchannelled valley bottoms should be designed to maintain the diffuse flow of water through the wetland and avoid channelling of the flow. ‡
− Any interventions in unchannelled valley bottom wetlands should be designed to allow for the passage of migrating fauna.
Valley head − Diffuse flow of water through the wetland should be maintained. ‡
− Avoid disturbance of the surface both within and upslope of the wetland ‡
− Care should be taken not to interrupt the passage of the interflow which feeds the seep. ‡
‡ Some examples of interventions which may change the hydrology. Culverts under a road concentrate the flow and may cause channels to develop with associated erosion problems. Cattle paths or vehicle tracks can channel water which may give rise to erosion. Cultivation destabilises the wetland and alters the hydrological characteristics.

185
Figure 31: Level of threat to which various wetlands are exposed in South Africa (Nel and Driver, 2011). CR = critically endangered; EN = endangered; VU = vulnerable; LT = least threatened.
4.5 WETLAND ECOSYSTEM SERVICES
For the purposes of the catchment perspective, it is important to note that the wetlands identified above provide specific ecosystem services and that the protection of these services should be incorporated in to the WMP for Matla PS.
Brief background that will lay the basis of integrated wetland management from a
catchment perspective
Wetlands are an important part of the aquatic ecological infrastructure which, in turn, is part of the landscape which delivers the basket of ecosystem services to the socio-economy. For the purpose of the benefits derived by the socio-economy they should be viewed and managed as an integrated whole, not be viewed ‘piecemeal’ from other wetlands (or ecosystems) in the catchment, but should be seen as a whole system delivering a complete set of services. Three of the four power stations selected for case studies are situated in the Olifants catchment. The following paragraph is extracted from the Kusile Wetland Management Strategy (Harris et al., 2013), who also undertook the economic component of the DWA study for the Water Resource Classification of the Olifants Water Management Area.
Wetland habitat in the Wilge Catchment (a tributary of the Olifants River) is important because it is a component of the ecological infrastructure comprising the aquatic ecosystem of the Olifants River Catchment. DWA (2012) estimated that the value of aquatic ecosystem services (within which wetland ecological infrastructure plays an important role) was approximately R3 billion per year. Moreover, more than 55% of the GDP contributing sectors in the Olifants River Catchment are directly dependent on water use licenses. The economy and people of the Olifants River Catchment are thus highly dependent upon the water resources of the catchment.

186
4.6 STATUS OF WETLAND MANAGEMENT AT MATLA PS
The following section provides an overview of the current status of wetland management at Matla PS. The information is based on findings of the site visit as well as discussions and a workshop with relevant personnel of the PS.
The research team compiled a checklist of critical points in order to evaluate the status quo. The checklist and the findings of the application of the checklist are provided below in Table 32.
Table 32: Findings of the Matla PS site visit with reference to critical elements of the WMF
Focus area
Criteria Status
General A Wetland management strategy/plan is in place
Wetlands have been delineated; buffer zones assigned and demarcated as no-go zones.
.
Relevant legal requirements are adhered to (e.g. water use license conditions)
Wetland health has been assessed and an understanding is in place with regards to ecosystem services. Measures are taken to protect/restore wetland health.
Measures have been put in place to safeguard wetlands to protect Eskom’s water resources
Wetlands are monitored based on a predefined set of risk indicators
An analysis has been done to understand livelihood dependency
Wetlands from a catchment perspective have been analyzed in order to understand the relative importance of wetland on site. Active measures are put in place to promote wetland conservation in the catchment
Based on the aforementioned it became evident that a wetland management plan, based on the WMF, for Matla would need to be developed. The environmental staff at Matla have limited expertise related to wetlands and have expressed a need for such a document.

187
The suggested vision for Matla PS is related to Figure 32 below, viewing wetlands as a continuum of ecosystem services, with Eskom on the receiving end as well as fulfilling its obligations to downstream users to continue receiving ecosystem services from wetlands.
Essentially, the WMP should address the following fundamental questions:
• Where are the wetlands on Matla’s property and what is their health status? How do Matla’s activities impact on the flow of ecosystem services?
• Is Matla compliant with all wetland related legislation?
• What is the broad picture with reference to wetlands in the catchment within which Matla operates? How does the status of these wetlands impact on ecosystem services received by Matla? And how do Matla’s activities impact on the status of wetlands in the catchment?
• How might the situation change and values be lost (what threats apply)?
• What are the priority areas for intervention?
• What is the plan of action to manage, restore, improve and/or sustain wetlands?
• Who are the role-players that should be involved and how will progress be measured?
Based on the aforementioned starting point, the WMP for Matla PS is unpacked in the sections below and indicated relevant actions that must be taken by Matla PS’s personnel.
Figure 32: A conceptual overview of the approach to the WMP for Matla PS

188
Based on Figure 32, a process flow for the compilation of a WMP for Matla PS is provided below.
The process has to start off with wetland identification and delineation in order to compile a wetland inventory. Based on the proposed implementation sequence (as indicated below), actions has been set based on a phased approach.
*RWQO = Resource Water Quality Objectives
Figure 33: Step by step development of generic wetland management plan for Matla PS (Starting at the bottom and being influenced by the WMF from the top)

189
Tab
le 3
3: T
he
WM
P f
or
Mat
la P
S
C
ateg
ory
of
acti
on
S
ub
act
ion
s D
escr
ipti
on
/Rem
arks
R
elev
ant
org
anis
atio
nal
el
emen
t
Ind
icat
or
. Ph
ase
1: P
repa
ratio
n, S
tatu
s Q
uo A
naly
sis
on s
ite a
nd A
ctio
n Pl
an #
1
Out
com
e: P
rese
rve
the
stat
us q
uo o
n si
te
1
Vis
ion
C
ompi
le a
sui
tabl
e vi
sion
and
obt
ain
the
buy-
in fr
om to
p m
anag
emen
t at t
he P
S.
A d
raft
visi
on h
as b
een
incl
uded
in
the
WM
F w
hich
cou
ld b
e co
nsid
ered
.
Com
mun
icat
ion
Cor
pora
te r
epor
ting
Sig
ned
visi
on
cert
ifica
te
by
the
gene
ral
man
ager
di
spla
yed
at
the
entr
y po
int
2
Del
inea
te
wet
land
s on
si
te
Det
erm
ine
boun
darie
s of
pr
opos
ed
asse
ssm
ent
area
(e
.g.
tran
smis
sion
re
late
d in
fras
truc
ture
)
Del
inea
te
all
wet
land
s an
d th
eir
hydr
olog
ical
zon
es.
Und
erst
and
and
desc
ribe
the
flow
of
wat
er th
roug
h th
e la
ndsc
ape
on
whi
ch
wet
land
s ar
e de
pend
ent
to e
nsur
e th
at f
low
s ca
n be
mai
ntai
ned.
Allo
cate
app
ropr
iate
buf
fer
zone
s
Com
preh
ensi
vely
de
scrib
e ec
osys
tem
ser
vice
s, i
nclu
ding
tho
se
prov
ided
by
artif
icia
l wet
land
s
Det
erm
ine
wet
land
hea
lth s
tatu
s
Iden
tify
risks
an
d th
reat
s in
clud
ing
thos
e or
igin
atin
g fr
om
near
by
prop
ertie
s
Idea
lly,
wet
land
s sh
ould
be
delin
eate
d an
d as
sess
ed
by
a w
etla
nd
man
agem
ent s
peci
alis
t.
Obt
ain
a G
IS s
uppo
rted
map
of
the
site
(in
clud
ing
the
shap
efile
dat
a)
Sup
ply
chai
n m
anag
emen
t
Fin
anci
al s
yste
ms
Dat
a an
d In
form
atio
n m
anag
emen
t
Ski
lls d
evel
opm
ent
Com
mun
icat
ion
Cor
pora
te r
epor
ting
Det
aile
d w
etla
nd
map
in
dica
ting
wet
land
hy
drol
ogic
al z
ones
, ty
pes
and
buffe
r zo
nes
Mar
kers
set
out
on
site
to
indi
cate
the
bu
ffer
zone
bo
unda
ries
Wet
land
he
alth
ch
art
for
each
in
divi
dual
wet
land
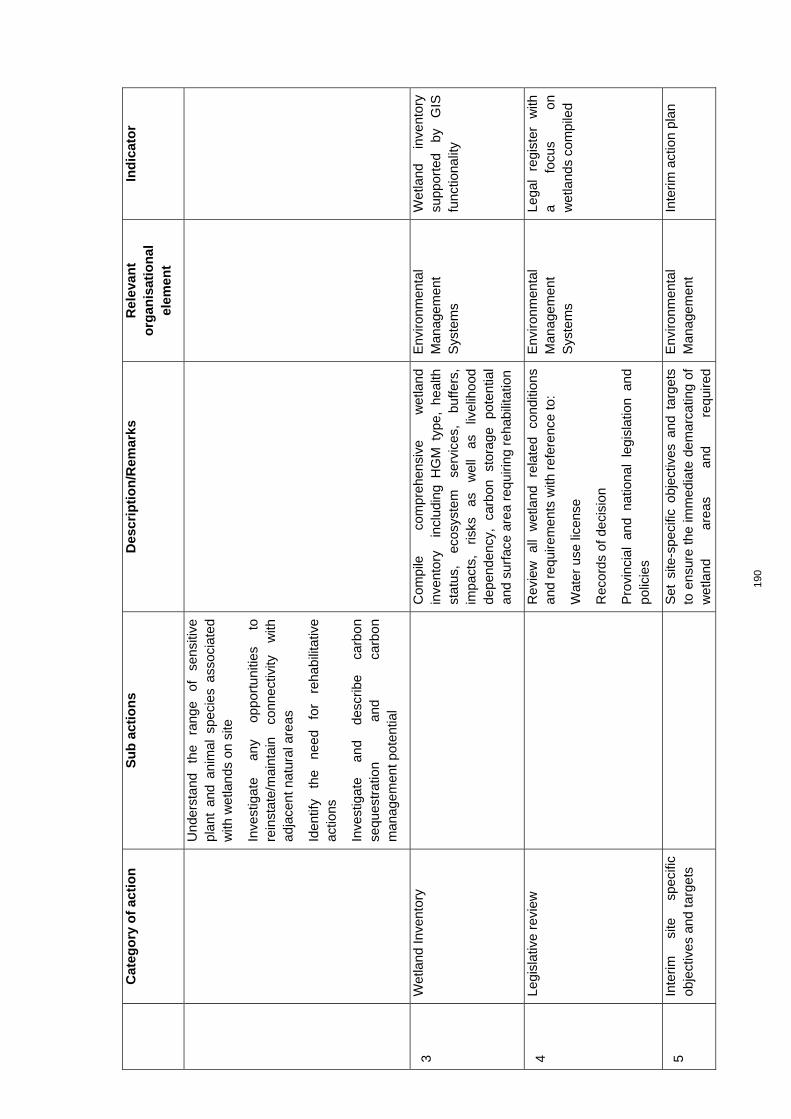
190
C
ateg
ory
of
acti
on
S
ub
act
ion
s D
escr
ipti
on
/Rem
arks
R
elev
ant
org
anis
atio
nal
el
emen
t
Ind
icat
or
Und
erst
and
the
rang
e of
se
nsiti
ve
plan
t an
d an
imal
spe
cies
ass
ocia
ted
with
wet
land
s on
site
Inve
stig
ate
any
oppo
rtun
ities
to
re
inst
ate/
mai
ntai
n co
nnec
tivity
w
ith
adja
cent
nat
ural
are
as
Iden
tify
the
need
fo
r re
habi
litat
ive
actio
ns
Inve
stig
ate
and
desc
ribe
carb
on
sequ
estr
atio
n an
d ca
rbon
m
anag
emen
t pot
entia
l
3
Wet
land
Inve
ntor
y
Com
pile
co
mpr
ehen
sive
w
etla
nd
inve
ntor
y i
nclu
ding
HG
M t
ype,
hea
lth
stat
us,
ecos
yste
m
serv
ices
, bu
ffers
, im
pact
s,
risks
as
w
ell
as
livel
ihoo
d de
pend
ency
, ca
rbon
st
orag
e po
tent
ial
and
surf
ace
area
req
uirin
g re
habi
litat
ion
Env
ironm
enta
l M
anag
emen
t S
yste
ms
Wet
land
in
vent
ory
supp
orte
d by
G
IS
func
tiona
lity
4
Legi
slat
ive
revi
ew
R
evie
w
all
wet
land
re
late
d co
nditi
ons
and
requ
irem
ents
with
ref
eren
ce to
:
Wat
er u
se li
cens
e
Rec
ords
of d
ecis
ion
Pro
vinc
ial
and
natio
nal
legi
slat
ion
and
polic
ies
Env
ironm
enta
l M
anag
emen
t S
yste
ms
Lega
l re
gist
er
with
a
focu
s on
w
etla
nds
com
pile
d
5
Inte
rim
site
sp
ecifi
c ob
ject
ives
and
targ
ets
S
et s
ite-s
peci
fic o
bjec
tives
and
tar
gets
to
ens
ure
the
imm
edia
te d
emar
catin
g of
w
etla
nd
area
s an
d re
quire
d
Env
ironm
enta
l M
anag
emen
t In
terim
act
ion
plan
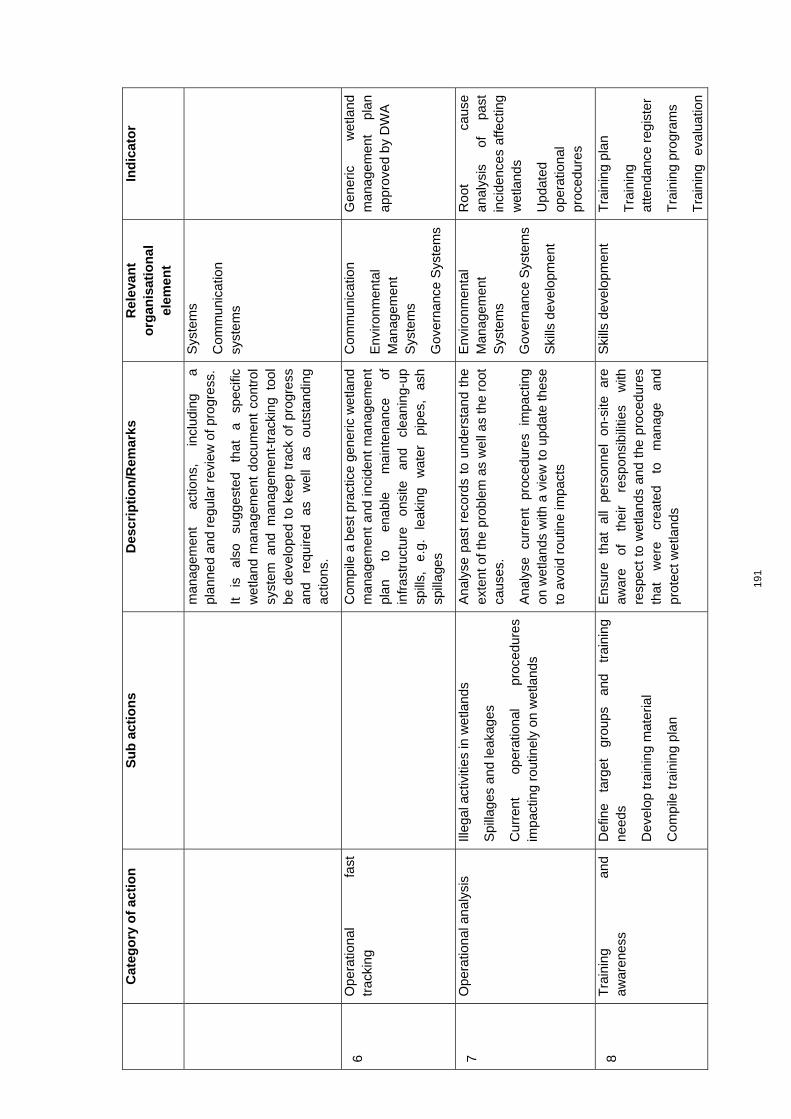
191
C
ateg
ory
of
acti
on
S
ub
act
ion
s D
escr
ipti
on
/Rem
arks
R
elev
ant
org
anis
atio
nal
el
emen
t
Ind
icat
or
man
agem
ent
actio
ns,
incl
udin
g a
plan
ned
and
regu
lar
revi
ew o
f pro
gres
s.
It is
al
so
sugg
este
d th
at
a sp
ecifi
c w
etla
nd m
anag
emen
t do
cum
ent
cont
rol
syst
em a
nd m
anag
emen
t-tr
acki
ng t
ool
be d
evel
oped
to
keep
tra
ck o
f pr
ogre
ss
and
requ
ired
as
wel
l as
ou
tsta
ndin
g ac
tions
.
Sys
tem
s
Com
mun
icat
ion
syst
em
s
6
Ope
ratio
nal
fast
tr
acki
ng
C
ompi
le a
bes
t pra
ctic
e ge
neric
wet
land
m
anag
emen
t an
d in
cide
nt m
anag
emen
t pl
an
to
enab
le
mai
nten
ance
of
in
fras
truc
ture
on
site
an
d cl
eani
ng-u
p sp
ills,
e.
g.
leak
ing
wat
er
pipe
s,
ash
spill
ages
Com
mun
icat
ion
Env
ironm
enta
l M
anag
emen
t S
yste
ms
Gov
erna
nce
Sys
tem
s
Gen
eric
w
etla
nd
man
agem
ent
plan
ap
prov
ed b
y D
WA
7
Ope
ratio
nal a
naly
sis
Illeg
al a
ctiv
ities
in w
etla
nds
Spi
llage
s an
d le
akag
es
Cur
rent
op
erat
iona
l pr
oced
ures
im
pact
ing
rout
inel
y on
wet
land
s
Ana
lyse
pas
t re
cord
s to
und
erst
and
the
exte
nt o
f the
pro
blem
as
wel
l as
the
root
ca
uses
.
Ana
lyse
cu
rren
t pr
oced
ures
im
pact
ing
on w
etla
nds
with
a v
iew
to
upda
te t
hese
to
avo
id r
outin
e im
pact
s
Env
ironm
enta
l M
anag
emen
t S
yste
ms
Gov
erna
nce
Sys
tem
s
Ski
lls d
evel
opm
ent
Roo
t ca
use
anal
ysis
of
pa
st
inci
denc
es a
ffect
ing
wet
land
s
Upd
ated
op
erat
iona
l pr
oced
ures
8
Tra
inin
g an
d aw
aren
ess
Def
ine
targ
et
grou
ps
and
trai
ning
ne
eds
Dev
elop
trai
ning
mat
eria
l
Com
pile
trai
ning
pla
n
Ens
ure
that
al
l pe
rson
nel
on-s
ite
are
awar
e of
th
eir
resp
onsi
bilit
ies
with
re
spec
t to
wet
land
s an
d th
e pr
oced
ures
th
at
wer
e cr
eate
d to
m
anag
e an
d pr
otec
t wet
land
s
Ski
lls d
evel
opm
ent
Tra
inin
g pl
an
Tra
inin
g at
tend
ance
reg
iste
r
Tra
inin
g pr
ogra
ms
Tra
inin
g ev
alua
tion

192
C
ateg
ory
of
acti
on
S
ub
act
ion
s D
escr
ipti
on
/Rem
arks
R
elev
ant
org
anis
atio
nal
el
emen
t
Ind
icat
or
and
feed
back
loop
9
Reh
abili
tatio
n an
d m
itiga
tion
C
ompi
le
a w
etla
nd
reha
bilit
atio
n st
rate
gy a
nd p
lan
Lega
l re
view
of
ob
ligat
ions
re
late
d to
re
habi
litat
ion.
Agr
eem
ent
with
DW
A o
n re
habi
litat
ion
proc
edur
es
Com
men
ce
with
re
habi
litat
ion
and
miti
gatio
n of
impa
cts
W
etla
nd
reha
bilit
atio
n pl
an
Phas
e 2:
Loo
king
bey
ond
the
fenc
e lin
e
Out
com
e: In
tegr
ated
wet
land
man
agem
ent
10
Li
velih
ood
impa
cts
U
nder
stan
d w
hich
co
mm
uniti
es
and
in
divi
dual
s in
the
vic
inity
are
rel
iant
on
wet
land
s fo
r th
eir
livel
ihoo
ds.
Det
erm
ine
whe
ther
E
skom
im
pact
s in
an
y w
ay o
n th
e su
stai
nabi
lity
of t
heir
livel
ihoo
ds
Com
pile
an
actio
n pl
an w
ith m
itiga
tion
mea
sure
s
Com
pile
a
proa
ctiv
e pl
an
for
the
cont
rolle
d us
e of
res
ourc
es o
n E
skom
pr
oper
ty w
here
rel
evan
t
Gov
erna
nce
Sys
tem
s
Sup
ply
chai
n m
anag
emen
t
Fin
anci
al s
yste
ms
Com
mun
icat
ion
syst
em
s
Sta
keho
lder
m
anag
emen
t
Live
lihoo
d ac
tion
plan
with
miti
gatio
n m
easu
res
11
C
atch
men
t an
alys
is:
Tot
al v
iew
Rev
iew
ca
tchm
ent
wet
land
da
ta
and
com
pare
w
etla
nd
surf
ace
area
s an
d nu
mbe
rs w
ith t
hose
und
er t
he c
ontr
ol o
f
Sup
ply
chai
n m
anag
emen
t S
trat
egic
ana
lysi
s

193
C
ateg
ory
of
acti
on
S
ub
act
ion
s D
escr
ipti
on
/Rem
arks
R
elev
ant
org
anis
atio
nal
el
emen
t
Ind
icat
or
Mat
la P
S.
Und
erst
and
the
impo
rtan
ce o
f M
atla
PS
w
etla
nds
and
the
pote
ntia
l im
pact
of
w
etla
nd a
ltera
tion
at M
atla
on
the
flow
of
eco
syst
em s
ervi
ces
to a
nd f
rom
the
ca
tchm
ent
Und
erst
and
the
RQ
O’s
and
the
rol
e of
w
etla
nds
Fin
anci
al s
yste
ms
Dat
a an
d In
form
atio
n m
anag
emen
t
12
C
atch
men
t pr
ofile
up
stre
am
R
evie
w
thre
ats
to
wet
land
in
tegr
ity
upst
ream
of
w
etla
nd
PS
, e.
g.
coal
m
inin
g, e
rosi
on.
Inve
stig
ate
pote
ntia
l im
pact
s be
yond
th
e fe
nce
line
whi
ch c
ould
dis
turb
the
hy
drol
ogic
al
regi
me
of
wet
land
s on
E
skom
’s
site
an
d cr
eate
th
e re
quire
d pa
rtne
rshi
ps
and
com
mun
icat
ion
chan
nels
to e
nsur
e pr
even
tive
actio
ns.
Sup
ply
chai
n m
anag
emen
t
Fin
anci
al s
yste
ms
Dat
a an
d In
form
atio
n m
anag
emen
t
Str
ateg
ic a
naly
sis
13
C
atch
men
t pr
ofile
do
wns
trea
m
U
nder
stan
d th
e ne
eds
of d
owns
trea
m
user
s an
d th
e im
pact
of
Esk
om a
ctiv
ity
on t
he f
low
of
ecos
yste
m s
ervi
ces,
e.g
. al
terin
g th
e hy
drol
ogic
al
regi
me,
cr
eatin
g ar
tific
ial w
etla
nds
Sup
ply
chai
n m
anag
emen
t
Fin
anci
al s
yste
ms
Dat
a an
d In
form
atio
n m
anag
emen
t
Str
ateg
ic a
naly
sis
14
C
onne
ctiv
ity
R
evie
w
ecol
ogic
al
corr
idor
s to
de
term
ine
in w
hich
way
site
wet
land
s ca
n se
rve
as a
con
nect
ing
poin
t.
Tak
e co
gniz
ance
of
ne
ighb
ourin
g
Sup
ply
chai
n m
anag
emen
t
Fin
anci
al s
yste
ms
Str
ateg
ic a
naly
sis
Act
ion
plan
, ta
rget
s an
d ob
ject
ives
.
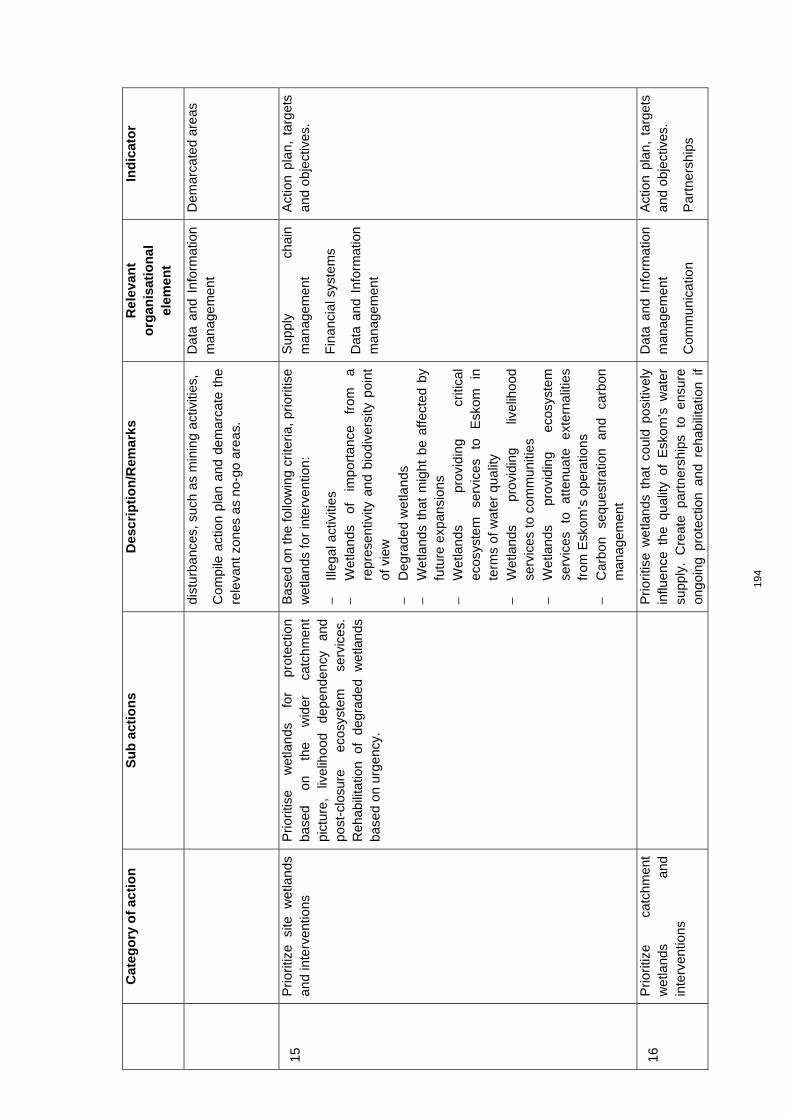
194
C
ateg
ory
of
acti
on
S
ub
act
ion
s D
escr
ipti
on
/Rem
arks
R
elev
ant
org
anis
atio
nal
el
emen
t
Ind
icat
or
dist
urba
nces
, suc
h as
min
ing
activ
ities
,
Com
pile
act
ion
plan
and
dem
arca
te t
he
rele
vant
zon
es a
s no
-go
area
s.
Dat
a an
d In
form
atio
n m
anag
emen
t D
emar
cate
d ar
eas
15
P
riorit
ize
site
w
etla
nds
and
inte
rven
tions
P
riorit
ise
wet
land
s fo
r pr
otec
tion
base
d on
th
e w
ider
ca
tchm
ent
pict
ure,
liv
elih
ood
depe
nden
cy
and
post
-clo
sure
ec
osys
tem
se
rvic
es.
Reh
abili
tatio
n of
de
grad
ed
wet
land
s ba
sed
on u
rgen
cy.
Bas
ed o
n th
e fo
llow
ing
crite
ria,
prio
ritis
e w
etla
nds
for
inte
rven
tion:
− Ill
egal
act
iviti
es
− W
etla
nds
of
impo
rtan
ce
from
a
repr
esen
tivity
and
bio
dive
rsity
poi
nt
of v
iew
−
Deg
rade
d w
etla
nds
− W
etla
nds
that
mig
ht b
e af
fect
ed b
y fu
ture
exp
ansi
ons
− W
etla
nds
prov
idin
g cr
itica
l ec
osys
tem
se
rvic
es
to
Esk
om
in
term
s of
wat
er q
ualit
y −
Wet
land
s pr
ovid
ing
livel
ihoo
d se
rvic
es to
com
mun
ities
−
Wet
land
s pr
ovid
ing
ecos
yste
m
serv
ices
to
at
tenu
ate
exte
rnal
ities
fr
om E
skom
’s o
pera
tions
−
Car
bon
sequ
estr
atio
n an
d ca
rbon
m
anag
emen
t
Sup
ply
chai
n m
anag
emen
t
Fin
anci
al s
yste
ms
Dat
a an
d In
form
atio
n m
anag
emen
t
Act
ion
plan
, ta
rget
s an
d ob
ject
ives
.
16
P
riorit
ize
catc
hmen
t w
etla
nds
and
inte
rven
tions
P
riorit
ise
wet
land
s th
at c
ould
pos
itive
ly
influ
ence
the
qua
lity
of E
skom
’s w
ater
su
pply
. C
reat
e pa
rtne
rshi
ps t
o en
sure
on
goin
g pr
otec
tion
and
reha
bilit
atio
n if
Dat
a an
d In
form
atio
n m
anag
emen
t
Com
mun
icat
ion
Act
ion
plan
, ta
rget
s an
d ob
ject
ives
.
Par
tner
ship
s

195
C
ateg
ory
of
acti
on
S
ub
act
ion
s D
escr
ipti
on
/Rem
arks
R
elev
ant
org
anis
atio
nal
el
emen
t
Ind
icat
or
requ
ired.
Car
bon
sequ
estr
atio
n an
d ca
rbon
m
anag
emen
t
syst
em
s
Cor
pora
te r
epor
ting
crea
ted.
17
W
etla
nd
man
agem
ent
plan
upd
ate
to i
nclu
de
inte
grat
ed
wet
land
m
anag
emen
t act
ions
S
et c
atch
men
ts s
peci
fic o
bjec
tives
and
ta
rget
s to
en
sure
pr
otec
tion
and
reha
bilit
atio
n of
w
etla
nd
area
s an
d liv
elih
oods
an
d
the
asso
ciat
ed
man
agem
ent a
ctio
ns
Cre
ate
the
requ
ired
part
ners
hips
Env
ironm
enta
l M
anag
emen
t S
yste
ms
Com
mun
icat
ion
syst
em
s
Upd
ated
ac
tion
plan
re
flect
ing
a ca
tchm
ent
and
livel
ihoo
d pe
rspe
ctiv
e
Par
tner
ship
s
Ph
ase
3: T
akin
g it
a s
tep
fu
rth
er
Ou
tco
me:
En
gag
ing
th
e su
pp
ly c
hai
n, i
mp
lem
ent
bes
t p
ract
ices
an
d p
lan
nin
g f
or
clo
sure
18
S
uppl
y ch
ain
inte
rven
tions
Com
pile
a l
ist
of c
ritic
al s
uppl
iers
in
the
proc
urem
ent
valu
e ch
ain
with
a v
iew
to
incl
ude
wet
land
man
agem
ent
mea
sure
s in
con
trac
tual
obl
igat
ions
Sup
ply
chai
n m
anag
emen
t
Sta
ndar
d m
easu
res
defin
ed
and
inco
rpor
ated
in
a
gene
ric c
ontr
act
19
P
lann
ing
for
clos
ure
Iden
tify
natu
ral
and
artif
icia
l w
etla
nds
that
may
be
affe
cted
onc
e op
erat
ions
ce
ase
(e.g
. re
duce
d w
ater
flo
ws
to
artif
icia
l wet
land
s)
Def
ine
way
s in
w
hich
co
mm
uniti
es
Det
erm
ine
wha
t th
e re
sidu
al
impa
cts
will
be
on w
etla
nds
both
on-
and
off-
site
.
Rev
iew
op
tions
fo
r pa
ssiv
e tr
eatm
ent
(con
stru
cted
w
etla
nds
for
seep
age
Fin
anci
al s
yste
ms
Dat
a an
d In
form
atio
n m
anag
emen
t
Ski
lls d
evel
opm
ent
Inpu
ts
into
cl
osur
e pl
anni
ng

196
C
ateg
ory
of
acti
on
S
ub
act
ion
s D
escr
ipti
on
/Rem
arks
R
elev
ant
org
anis
atio
nal
el
emen
t
Ind
icat
or
can
beco
me
invo
lved
in
w
etla
nd
man
agem
ent a
nd jo
b cr
eatio
n
Res
idua
l ris
k
Con
curr
ent r
ehab
ilita
tion
Car
bon
sequ
estr
atio
n
cont
rol a
nd w
ater
qua
lity
impr
ovem
ent
Ens
ure
that
th
e cr
eatio
n of
ar
tific
ial
wet
land
s is
don
e pu
rpos
eful
ly a
nd t
hat
a m
easu
re
of
sust
aina
bilit
y is
in
corp
orat
ed in
to it
s cr
eatio
n.
Dep
osits
site
s ar
e co
nstr
ucte
d w
ith t
he
end
land
form
in
min
d in
ord
er t
hat
they
ca
n be
co
ncur
rent
ly
reha
bilit
ated
w
ithou
t ne
edin
g to
re
shap
e th
em
at
clos
ure.
Mea
sure
men
t sy
ste
ms
20
A
ltern
ativ
e te
chno
logi
es
Con
stru
cted
wet
land
s In
vest
igat
e op
tions
to in
stal
l con
stru
cted
w
etla
nds
to a
ttenu
ate
pollu
tion
from
ash
da
ms,
se
epag
e zo
nes,
co
ntam
inat
ed
run-
off,
sew
age
wor
ks, e
tc.
Sup
ply
chai
n m
anag
emen
t
Str
ateg
ic a
naly
sis
D
o no
t for
get t
he b
asic
s as
par
t of e
very
pha
se:
Out
com
e: E
nsur
ing
data
man
agem
ent,
mon
itorin
g, c
onsi
sten
cy, e
valu
atio
n an
d up
datin
g th
e W
MF
A.
D
ata
and
Info
rmat
ion
man
agem
ent
C
reat
e a
repo
sito
ry f
or d
ata
in o
rder
to
abst
ract
mea
ning
ful
info
rmat
ion
rela
ted
to w
etla
nd m
anag
emen
t
Dat
a an
d in
form
atio
n m
anag
emen
t D
ata
and
info
rmat
ion
plan
an
d pr
oced
ures
B.
A
udit
prot
ocol
s an
d ch
eckl
ists
Com
pile
aud
it pr
otoc
ols
and
chec
klis
t to
en
sure
th
at
wet
land
m
onito
ring
are
com
preh
ensi
ve a
nd e
ffect
ive
Ens
ure
that
ris
k ba
sed
mea
sure
s ar
e in
clud
ed
Env
ironm
enta
l M
anag
emen
t S
yste
ms
Gov
erna
nce
Sys
tem
s
Ski
lls d
evel
opm
ent
Aud
it pr
otoc
ols
and
chec
klis
ts

197
C
ateg
ory
of
acti
on
S
ub
act
ion
s D
escr
ipti
on
/Rem
arks
R
elev
ant
org
anis
atio
nal
el
emen
t
Ind
icat
or
C.
T
rain
ing
and
awar
enes
s D
efin
e ta
rget
gr
oups
an
d tr
aini
ng
need
s
Dev
elop
trai
ning
mat
eria
l
Com
pile
trai
ning
pla
n
Ens
ure
that
al
l pe
rson
nel
on-s
ite
are
awar
e of
th
eir
resp
onsi
bilit
ies
with
re
spec
t to
wet
land
s an
d th
e pr
oced
ures
th
at
wer
e cr
eate
d to
m
anag
e an
d pr
otec
t wet
land
s
Ens
ure
that
com
mun
ities
are
edu
cate
d w
ith r
espe
ct t
o w
etla
nd p
rote
ctio
n an
d m
anag
emen
t
Ski
lls d
evel
opm
ent
Sup
ply
chai
n sy
ste
ms
Tra
inin
g pl
an
Tra
inin
g at
tend
ance
reg
iste
r
Tra
inin
g pr
ogra
ms
Par
tner
ship
s w
ith
NG
O’s
to
pr
ovid
e co
mm
unity
aw
aren
ess
21
M
onito
ring
Tar
gets
and
obj
ectiv
es
Rol
es a
nd r
espo
nsib
ilitie
s
Tim
e fr
ames
Bud
getin
g an
d pr
ocur
emen
t
Ski
lls d
evel
opm
ent
Indi
cato
rs fo
r m
onito
ring
purp
oses
Fee
dbac
k lo
ops
to u
pdat
e W
MP
and
W
MF
as
w
ell
as
effe
ctiv
enes
s of
tr
aini
ng
Com
pile
a
com
preh
ensi
ve
SM
AR
T
actio
n pl
an
to
mon
itor
iden
tifie
d pr
iorit
ies
and
inte
rven
tions
Env
ironm
enta
l M
anag
emen
t S
yste
ms
Gov
erna
nce
Sys
tem
s
Ski
lls d
evel
opm
ent
Com
plet
ed
actio
n pl
an c
omm
unic
ated
to
and
acc
epte
d by
ro
le p
laye
rs

198
4.7 PILOT PHASE: CONCLUSION AND RECOMMENDATIONS
The pilot phase of the project found that the selected sites for implementation of the WMF are not ready to adopt the plan in full, due to the absence of basic information, such as the delineation and demarcation of wetlands in site.
Eskom personnel are positive in their support for the WMF. During our communication with the various personnel on site, the main problems conveyed to the research team are:
1. Uncertainty with respect to the distinctions between natural and artificial wetlands and the management of these
2. Legislative uncertainty and the best way to solve operational problems associated with wetlands are hampering progress
With respect to the WMF, it was found that the framework is mostly comprehensive but that a few matters are to be included or strengthened in the WMF:
1. Addressing of legacy issues 2. Management of artificial wetlands 3. Closure management 4. Ease of implementation (for which purpose the WMP developed for Matla PS will be of
assistance) 5. An overview of best practice tools to ensure effective wetland management.

199
5 THE CATCHMENT PERSPECTIVE
As described in Chapter 1, Eskom has a national footprint. Figure 2 shows the distribution of Eskom’s infrastructure. The coal-fired power stations are concentrated on the Mpumalanga Highveld, and area rich in wetlands. Eskom also has approximately 30 000 km of power line servitudes covering the country. In addition to Eskom’s own infrastructure, there is also other infrastructure which contributes to or supports the generation of power by the coal-fired power stations such as coalmines, some of which belong to Eskom, and interbasin transfers to provide the power stations with the water that they require.
Figure 3 shows the volumes of water moved between water management areas by interbasin transfers (IBT) in the Northeastern part of South Africa. These IBTs are managed by the Department of Water and Sanitation. Eskom is one of the beneficiaries of these IBTs, being a principle beneficiary in the areas which supply the coal-fired power stations.
The Department of Water and Sanitation are currently developing the water resource classification system (WRCS) for both the Olifants and the Upper Vaal WMAs. The role of the WRCS within the IWRM environment ‘is to facilitate finding a balance between resource protection and resource development and utilisation. A complex institutional environment surrounds this process, both in terms of the systems and procedures of Integrated Water Resource Management (IWRM), and the division of roles and responsibilities between DWS and the Catchment Management Agencies (CMAs)’. This process will evaluate the trade-offs between the economic, social and ecological requirements for water in the river basin and will lead to the development of the allocation schedule, including the management class, the reserve, the resource quality objectives and the catchment management strategy. The WRCS forms part of the compulsory licensing process and the management class has significant implications for the allocation schedule.
Within the WRCS process and in addition to straddling more than a single WMA, Eskom’s interests are both WMA-wide in catchments where there are a number of power stations and related activities such as coal mining as well as a local interest where the footprints of the individual power stations and other related activities are concerned. The sustainable environmental planning framework developed below takes these scales into account.
5.1 THE FRAMEWORK
The use of the frameworks
Two frameworks have been used to provide a basis for the development and testing of a sustainable environmental framework within the catchments where Eskom operates. The overarching framework employed is that developed by Anderies et al. (2004) which provides a structured process for assessing the robustness of the social-ecological system (SES) under consideration (Figure 34). The framework needs to address the robustness of the socio-ecological system. It also needs to be scale independent so that it may be used at scales varying between the local, on site, through the catchment and WMA scales to the scale of multiple WMAs. The framework developed by Anderies et al. (2004) meets these conditions. A description of the components of the framework is provided as well as a series of questions which will guide the user in using the framework.

200
In this case, the Resource (Box A, Figure 34) is bounded in terms of the ecosystem services it delivers from which the SES derives benefit as defined by the Millennium ecosystem Assessment (Figure 34).
Figure 34: A Framework illustrating a social-ecological system as conceptualised by Anderies et al. (2004)
Description of the components for the Anderies et al. (2004) framework
(Taken from Hay et al., 2012): For ease of reference, this framework will be referred to as the Anderies Framework.
The arrows indicating the relationships between the entities of the framework are bi-directional, which takes account of the feedback from the interactions between the components of the framework.
Figure 34 explains the components involved in social ecological systems and in Table 35 the links between the entities.

201
Table 34: The entities involved in social ecological systems (from Anderies et al., 2004)
Entities Examples Potential problems
A. Resource Water source
Fishery
Uncertainty
Complexity/Uncertainty
B. Resource users Farmers using irrigation
Fishers harvesting form inshore fishery
Stealing water, getting a free ride on maintenance
Overharvesting
C. Public infrastructure providers
Executive and council of local users association
Government bureau
Internal conflict or indecision about which policies to adopt
Information loss
D. Public infrastructure
(Physical)
Engineering works Wear-out over time
D. Public infrastructure (Social – institutional rules)
Laws, conventions, etc. Memory loss over time, deliberate cheating
External environment Weather, economy, political system
Sudden changes as well as slow changes that are not noticed.
Table 35: The links between the entities of a social-ecological system (from Anderies et al., 2004)
Link Examples Potential Problems
(1) Between resource and resource users
Availability of water at time of need/availability of fish
Too much or too little water/too many uneconomic fish – too many valued fish
(2) Between users and public infrastructure providers
Voting for providers
Contributing resources Recommending policies
Monitoring performance of providers
Indeterminacy/lack of participation
Free riding
Rent seeking
Lack of information/free riding
(3) Between public infrastructure providers and public infrastructure
Building initial structure
Regular maintenance
Monitoring and enforcing rules
Overcapitalization or undercapitalization
Shirking disrupting temporal and spatial patterns of resource use
Cost/corruption
(4) Between public infrastructure and
Impact of infrastructure on the resource level
Ineffective

202
Link Examples Potential Problems
resource
(5) Between public infrastructure and resource dynamics
Impact of infrastructure on the feedback structure of the resource – harvest dynamics
Ineffective, unintended consequences
(6) Between resource users and public infrastructure
Coproduction of infrastructure itself, maintenance of works, monitoring and sanctioning
No incentives/free riding
(7) External forces on resource and infrastructure
Severe weather, earthquake, landslide, new roads
Forces a change of state in the resource and destroys infrastructure
(8) External forces on social actors
Major changes in political system, migration, commodity prices, and regulation
Conflict, uncertainty, migration, greatly increased demand
Questions to the components informing the Anderies framework
(Modified from Hay et al., 2012).
The questions are designed to help users of the framework to include the full complexity of the socio-ecological system (SES) in their assessment of the system with which they are working. All questions will not necessarily apply in every instance, but they are designed to provide insight into the dynamics of the system under consideration.
The resource (A)
• What are the ecosystem services of relevance to the SES?
• What are the asset base/ecological infrastructure that are providing these ecosystem services?
• What does it comprise? (What are its key biophysical features?)
• How big is it?
• How does it connect to other resources?
• What are its history and its significance to people living at or around it?
• Are there any obvious trends (focus on the resource)
• What is the status of the resource in terms of ecological integrity?
The users (B)
• Who makes use of the aquatic ecosystem services?
• Where are they from?
• What is the state (or states) of well-being of people using these services, how does the particular use affect the state, and are there any obvious trends?
The public infrastructure providers (C)
• Who is responsible for governing the system?

203
• What government departments, systems of traditional leadership and other agencies are involved?
• Who makes the rules or laws that dictate how people use the resource under consideration?
• Who supplies the infrastructure, services and equipment that allow the use of the resource under consideration?
The public infrastructure (D)
• What are the rules, conventions and norms that govern use?
• Are there formal rights of access that govern use?
• What infrastructure and services are in place to support use of the resource under consideration?
• The relationship between the users and the resource (Arrow 1)
• Who is using the resource?
• What is being used and what is it being used for? (What ecosystem services are being supplied by the system?)
• How important are the uses? (What is the contribution of various ecosystem services to the well-being of people in and beyond the system and at what scale?)
• How are the various uses changing over time and what is causing these changes?
• How are the various uses organised and allocated to people? (What property rights regime is in place for each ecosystem service?)
• How does one use of the system affect another use or other uses of the system? (Are there conflicting or contradictory property rights regimes in place?)
• How are the uses of the system affecting its health? (What is the impact of use on the ecosystem?)
• Are there potential uses that have been thought of that would benefit people but are not being used?
• How would these potential uses benefit people?
• What is the trajectory of change? (rapid, slow, gradual, erratic, large spatial scale, small spatial scale)
The relationship between users and public infrastructure providers (Arrow 2)
• How are rules of use made?
• How is infrastructure and service delivery planned and implemented?
• How are decisions recorded and circulated?
• Do the users play a role in making decisions? If so, how does this happen?
• Does the system work?
• What are the problems that are encountered?
• How might these problems be solved?
The relationship between public infrastructure providers and public infrastructure (Arrow 3)
• How do the governors make the rules?
• How do the service providers plan the infrastructure and service delivery?
• Are rules monitored and regulated? If so, how?
• How does maintenance of infrastructure and services take place?
204
The relationship between public infrastructure and the resource (Arrow 4)
• What impact are the rules having on resource levels/condition?
• What impact are the physical infrastructure and services having on resource levels/condition?
The relationship between public infrastructure, and the resource and the users (Arrow 5 and 6)
• Do the users think that the rules of use are fair?
• Do the users think that the infrastructure and services are adequate?
• Are the users involved in making the rules, and managing and governing the system?
• Are the users involved in developing and maintaining infrastructure and services?
The impact of external driving forces on any component or any relationship within the system (Arrows 7 and 8)
• What are external forces impacting on the system?
• How are they impacting on the system?
• How are they affecting people’s well-being?
The Millennium Ecosystem Assessment Framework
The Millennium Ecosystem Assessment (2005) provides insight into how ecosystem services contribute to human well-being (Figure 35). In this case study the Resource is defined in terms of the ecosystem services it delivers. This definition integrates the ecosystem services from which the SES derives benefits with the health of the ecological infrastructure which provides these benefits. While this approach is still being developed, the concept is helpful because it relates easily to the way in which people interpret their use of resources. The relationship between ecosystem services and human wellbeing is illustrated in Figure 35.
The framework illustrated in Figure 35 is useful in that it attempts to explicitly link ecosystem services to the various constituents of well-being. However, the starting point in this framework is the ecosystem service supply, not the well-being of the resource users. To quote Fish (2011) “Advocates of the ecosystem services framework need to develop a more elaborate understanding of how a rich and variegated term such as ‘well-being’ maps back onto the services that nature provides.” There is a need to appreciate the demand for the ecosystem services and understand how the demand will influence the development of the resource.
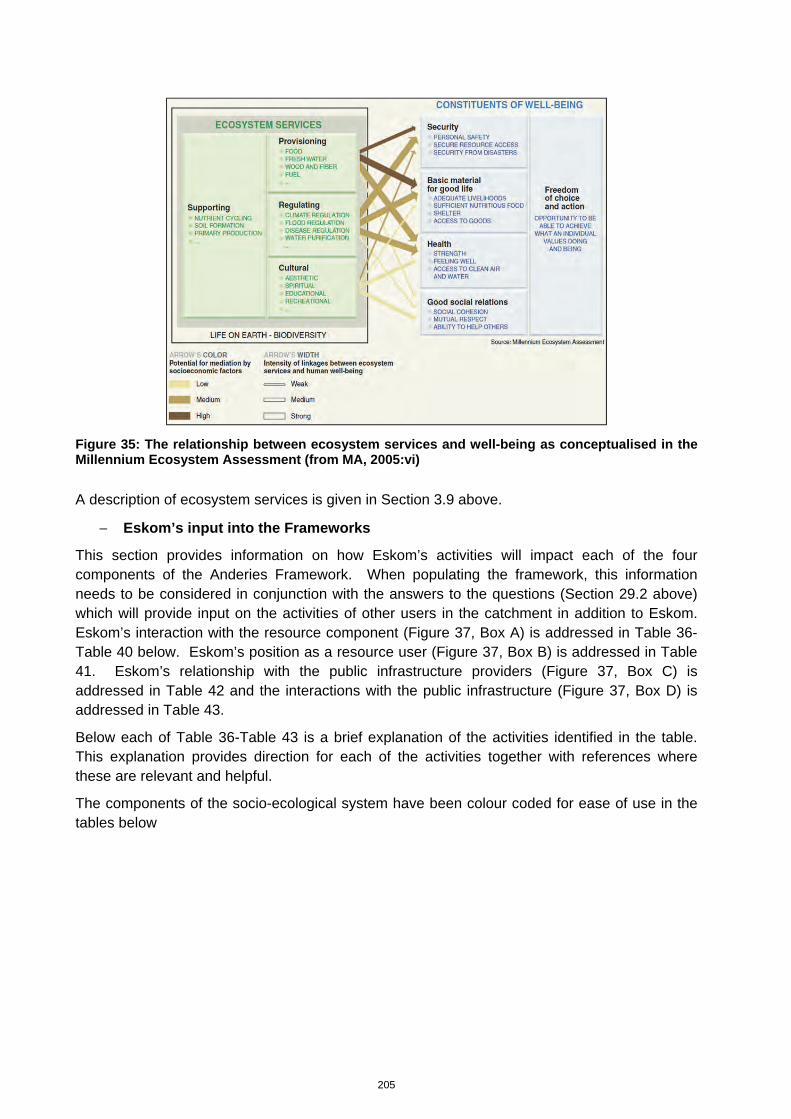
205
Figure 35: The relationship between ecosystem services and well-being as conceptualised in the Millennium Ecosystem Assessment (from MA, 2005:vi)
A description of ecosystem services is given in Section 3.9 above.
− Eskom’s input into the Frameworks
This section provides information on how Eskom’s activities will impact each of the four components of the Anderies Framework. When populating the framework, this information needs to be considered in conjunction with the answers to the questions (Section 29.2 above) which will provide input on the activities of other users in the catchment in addition to Eskom. Eskom’s interaction with the resource component (Figure 37, Box A) is addressed in Table 36-Table 40 below. Eskom’s position as a resource user (Figure 37, Box B) is addressed in Table 41. Eskom’s relationship with the public infrastructure providers (Figure 37, Box C) is addressed in Table 42 and the interactions with the public infrastructure (Figure 37, Box D) is addressed in Table 43.
Below each of Table 36-Table 43 is a brief explanation of the activities identified in the table. This explanation provides direction for each of the activities together with references where these are relevant and helpful.
The components of the socio-ecological system have been colour coded for ease of use in the tables below

206
Figure 36: The colour coded elements of the SES for ease of reference
5.2 THE RESOURCE – DEFINING ESKOM’S INTERFACE
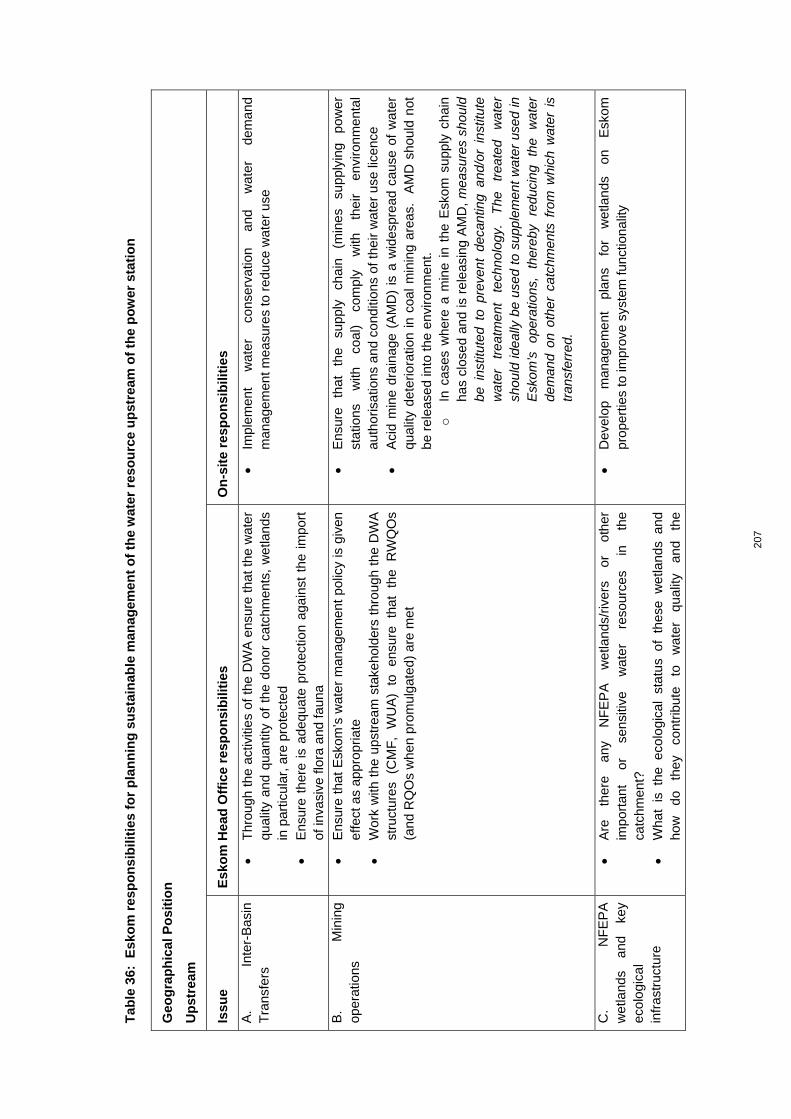
207
Tab
le 3
6: E
sko
m r
esp
on
sib
iliti
es f
or
pla
nn
ing
su
stai
nab
le m
anag
emen
t o
f th
e w
ater
res
ou
rce
up
stre
am o
f th
e p
ow
er s
tati
on
Geo
gra
ph
ical
Po
siti
on
Up
stre
am
Issu
e E
sko
m H
ead
Off
ice
resp
on
sib
iliti
es
On
-sit
e re
spo
nsi
bili
ties
A.
In
ter-
Bas
in
Tra
nsfe
rs
• T
hrou
gh t
he a
ctiv
ities
of
the
DW
A e
nsur
e th
at t
he w
ater
qu
ality
and
qua
ntity
of
the
dono
r ca
tchm
ents
, w
etla
nds
in p
artic
ular
, are
pro
tect
ed
• E
nsur
e th
ere
is a
dequ
ate
prot
ectio
n ag
ains
t th
e im
port
of
inva
sive
flor
a an
d fa
una
• Im
plem
ent
wat
er
cons
erva
tion
and
wat
er
dem
and
man
agem
ent m
easu
res
to r
educ
e w
ater
use
B.
M
inin
g op
erat
ions
•
Ens
ure
that
Esk
om’s
wat
er m
anag
emen
t po
licy
is g
iven
ef
fect
as
appr
opria
te
• W
ork
with
the
ups
trea
m s
take
hold
ers
thro
ugh
the
DW
A
stru
ctur
es
(CM
F,
WU
A)
to
ensu
re
that
th
e R
WQ
Os
(and
RQ
Os
whe
n pr
omul
gate
d) a
re m
et
• E
nsur
e th
at
the
supp
ly
chai
n (m
ines
su
pply
ing
pow
er
stat
ions
w
ith
coal
) co
mpl
y w
ith
thei
r en
viro
nmen
tal
auth
oris
atio
ns a
nd c
ondi
tions
of t
heir
wat
er u
se li
cenc
e •
Aci
d m
ine
drai
nage
(A
MD
) is
a w
ides
prea
d ca
use
of w
ater
qu
ality
det
erio
ratio
n in
coa
l m
inin
g ar
eas.
A
MD
sho
uld
not
be r
elea
sed
into
the
envi
ronm
ent.
o
In
cas
es w
here
a m
ine
in t
he E
skom
sup
ply
chai
n ha
s cl
osed
and
is r
elea
sing
AM
D,
mea
sure
s sh
ould
be
ins
titut
ed t
o pr
even
t de
cant
ing
and/
or i
nstit
ute
wat
er
trea
tmen
t te
chno
logy
. T
he
trea
ted
wat
er
shou
ld id
eally
be
used
to
supp
lem
ent
wat
er u
sed
in
Esk
om’s
op
erat
ions
, th
ereb
y re
duci
ng
the
wat
er
dem
and
on o
ther
cat
chm
ents
fro
m w
hich
wat
er i
s tr
ansf
erre
d.
C
.
NF
EP
A
wet
land
s an
d ke
y ec
olog
ical
in
fras
truc
ture
• A
re
ther
e an
y N
FE
PA
w
etla
nds/
river
s or
ot
her
impo
rtan
t or
se
nsiti
ve
wat
er
reso
urce
s in
th
e ca
tchm
ent?
•
Wha
t is
the
eco
logi
cal
stat
us o
f th
ese
wet
land
s an
d ho
w
do
they
co
ntrib
ute
to
wat
er
qual
ity
and
the
• D
evel
op
man
agem
ent
plan
s fo
r w
etla
nds
on
Esk
om
prop
ertie
s to
impr
ove
syst
em fu
nctio
nalit
y

208
Geo
gra
ph
ical
Po
siti
on
Up
stre
am
Issu
e E
sko
m H
ead
Off
ice
resp
on
sib
iliti
es
On
-sit
e re
spo
nsi
bili
ties
prov
isio
n of
oth
er e
colo
gica
l ser
vice
s in
the
cat
chm
ent?
If
requ
ired,
as
sist
w
ith
wet
land
pr
otec
tion
and
reha
bilit
atio
n.
D.
Mai
ntai
n ha
bita
t co
ntin
uity
•
Look
at
an
d al
ign
activ
ities
w
ith
biod
iver
sity
co
nser
vatio
n pl
ans
and
othe
r G
IS l
ayer
s hi
ghlig
htin
g st
rate
gica
lly im
port
ant a
nd s
ensi
tive
wat
er r
esou
rces
.
• M
aint
ain
cont
inui
ty
and
wat
er
and
biod
iver
sity
co
rrid
ors
linki
ng w
ith n
eigh
bour
ing
wet
land
s
Geo
gra
ph
ical
Po
siti
on
Up
stre
am
A.
Inte
r-b
asin
tra
nsf
ers
Esk
om
Hea
d O
ffic
e re
sp
on
sib
iliti
es
Mak
e in
put
into
the
WR
CS
of
the
dono
r ca
tchm
ents
to
ensu
re t
hat
the
wat
er r
esou
rce
(bot
h qu
ality
and
qua
ntity
) is
ass
ured
. I
n pa
rtic
ular
, m
ake
sure
tha
t th
e ec
olog
ical
infr
astr
uctu
re,
wet
land
s in
par
ticul
ar,
are
ad
equa
tely
pr
otec
ted
so
that
th
ey
ma
y su
stai
nabl
y pr
ovid
e th
e
ecos
yste
m
serv
ices
re
quire
d of
th
em
in
the
face
of
fu
ture
de
velo
pmen
ts.
Do
wha
t is
pos
sibl
e to
min
imis
e th
e tr
ansf
er o
f un
desi
rabl
e flo
ra a
nd
fa
una
by m
ean
s of
the
inte
r-ba
sin
tran
sfer
.
On
-sit
e re
sp
on
sib
iliti
es
Wat
er c
onse
rvat
ion
and
wat
er d
em
and
man
age
men
t m
easu
res
shou
ld
be i
mpl
emen
ted
in o
rder
to
redu
ce t
he v
olum
e of
wat
er u
sed
by t
he
PS
.
B.
Min
ing
op
erat
ion
s
Esk
om
Hea
d O
ffic
e re
sp
on
sib
iliti
es
Esk
om’s
w
ater
m
anag
emen
t po
licy
lists
a
num
ber
of
area
s w
here
E
skom
’s a
ctiv
ities
int
erac
t w
ith t
he e
nviro
nme
nt.
The
pol
icy
shou
ld
give
gui
danc
e to
thes
e in
tera
ctio
ns.
See
k to
inf
luen
ce u
pstr
eam
sta
keho
lder
s, i
n te
rms
of t
he U
N C
EO
W
ater
Man
date
, to
wor
k to
geth
er t
hrou
gh t
he s
truc
ture
s pr
ovid
ed b
y D
WA
and
oth
ers
as r
elev
ant
to e
nsur
e th
at t
he w
ater
res
ourc
e is

209
prot
ecte
d fo
r th
e lo
ng t
erm
in t
he f
ace
of c
urre
nt m
inin
g de
velo
pmen
ts
as w
ell a
s th
ose
whi
ch m
ay o
ccur
in th
e fu
ture
.
On
-sit
e re
sp
on
sib
iliti
es
Wor
k to
geth
er w
ith t
he e
nviro
nmen
tal
man
ager
s of
the
min
ing
hous
es
in
the
pow
er
stat
ion’
s su
pply
ch
ain
to
ensu
re
that
th
e ne
cess
ary
envi
ronm
enta
l au
thor
isat
ions
and
wat
er u
se l
icen
se a
re i
n pl
ace
and
th
at t
he m
ines
are
com
plyi
ng w
ith t
hem
. T
his
shou
ld b
e do
ne b
oth
with
Esk
om-o
wne
d m
ines
as
wel
l as
thos
e ow
ned
by o
ther
com
pani
es
but w
hich
sup
ply
Esk
om.
Aci
d m
ine
drai
nage
(A
MD
) is
a w
ides
prea
d ca
use
of w
ater
qua
lity
dete
riora
tion
in c
oal m
inin
g ar
eas.
W
ith m
ines
tha
t ar
e ac
tive,
eff
ectiv
e
step
s sh
ould
be
ta
ken
to
prev
ent
the
rele
ase
of
AM
D
into
th
e en
viro
nmen
t (t
here
ar
e te
chno
logi
es
to
trea
t A
MD
).
Esk
om
shou
ld
inve
stig
ate
and
impl
emen
t co
mbi
ned
activ
e an
d pa
ssiv
e tr
eatm
ent
of
AM
D.
The
pos
sibl
e re
-use
of
trea
ted
AM
D e
ither
on
the
coal
min
e or
po
wer
sta
tion
shou
ld b
e in
vest
igat
ed.
Esk
om s
houl
d en
sure
thr
ough
the
ir co
ntra
ct w
ith t
heir
supp
liers
tha
t th
e m
ine
abi
des
by i
ts e
nviro
nme
ntal
aut
horis
atio
ns a
nd w
ater
use
lic
ense
dur
ing
its li
fe a
nd t
hat,
upo
n cl
osur
e, t
here
is a
dequ
ate
finan
cial
pr
ovis
ion
for
reha
bilit
atio
n an
d po
st-c
losu
re m
anag
emen
t.
C.
NF
EP
A w
etla
nd
s an
d k
ey
eco
log
ical
infr
astr
uct
ure
Esk
om
Hea
d O
ffic
e re
sp
on
sib
iliti
es
Ens
ure,
wor
king
thr
ough
the
sta
keho
lder
str
uctu
res
prov
ided
by
DW
A,
that
NF
EP
A w
etla
nds
are
iden
tifie
d an
d ad
equa
tely
pro
tect
ed.
Det
erm
ine
the
cont
ribut
ion
of w
etla
nds
in t
he d
onor
cat
chm
ent
to w
ate
r qu
ality
and
hyd
rolo
gy.
Whe
re n
eces
sary
, as
sist
with
the
con
serv
atio
n
and
reha
bilit
atio
n of
wet
land
s in
don
or c
atch
men
ts.
As
not
all
land
is
gove
rnm
ent
owne
d th
ere
is a
n op
port
unity
for
Esk
om t
o en
ter
into
ar
rang
emen
ts w
ith l
ando
wne
rs f
or t
he p
aym
ent
of e
cosy
stem
ser
vice
s th
roug
h w
hich
la
ndow
ners
ar
e as
sist
ed
for
mai
ntai
ning
ec
olog
ical
in
fras
truc
ture
in a
hea
lthy
stat
e.
On
-sit
e re
sp
on
sib
iliti
es
Whe
re
wet
land
s id
entif
ied
thro
ugh
the
NF
EP
A
proc
ess
occu
r on
E
skom
pro
pert
y, t
hese
sho
uld
be n
oted
in
the
part
icul
ar m
anag
emen
t pl
an fo
r th
e po
wer
sta
tion.
D.
Mai
nta
in h
abit
at c
on
tin
uit
y
Nat
ion
al o
ffic
e re
spo
nsi
bili
ties
Ens
ure
the
prot
ectio
n of
eco
logi
cal
and
wat
er c
orrid
ors
linki
ng w
ater
re
sour
ces
to e
nsur
e ec
osys
tem
pro
cess
and
pat
tern
s ar
e m
aint
aine
d.
On
-sit
e re
sp
on
sib
iliti
es
Mai
ntai
n co
ntin
uity
of
habi
tat
in t
he li
near
dra
inag
e lin
es t
hrou
gh b
uffe
r zo
nes
and
biod
iver
sity
cor
ridor
s.
Res
ou
rces
Driv
er e
t al.,
201
1.
Kot
ze e
t al.,
200
9.

210
Tab
le 3
7: E
sko
m r
esp
on
sib
iliti
es f
or
pla
nn
ing
su
stai
nab
le m
anag
emen
t o
f th
e w
ater
res
ou
rce
on
th
e p
ow
er s
tati
on
sit
e
Geo
gra
ph
ical
Po
siti
on
On
-sit
e
Issu
e E
sko
m H
ead
Off
ice
res
po
nsi
bili
ties
O
n-s
ite
res
po
nsi
bili
ties
A.
Pro
tect
ion/
re
habi
litat
ion
of
wet
land
s on
-site
• P
ro-a
ctiv
ely
deve
lop
and
impl
eme
nt
a su
itabl
e E
MS
as
an
av
enue
fo
r w
ater
re
sour
ce
man
agem
ent
• R
ecog
nise
th
at
all
the
pow
er
stat
ions
in
a
pa
rtic
ular
ca
tchm
ent
are
subj
ect
to
the
sam
e
over
arch
ing
DW
A r
equi
rem
ents
and
str
uctu
res
o
Nee
d to
pro
vide
effe
ctiv
e re
pres
enta
tion
at
WU
A a
nd C
MF
leve
l
o
Nee
d to
en
sure
co
mpl
ianc
e w
ith
the
WR
CS
of t
he
catc
hmen
t
o
Nee
d to
pr
ovid
e tr
ain
ing
for
on-s
ite
pers
onne
l whe
re r
equi
red
• F
ocus
act
iviti
es o
n w
etla
nds
that
are
in
a po
orer
co
nditi
on (
hard
er w
orki
ng)
• A
sses
s w
etla
nds
thro
ugh
the
lens
of
the
ecos
yste
m
serv
ices
they
pro
vide
Wet
land
spe
cial
ist
– to
be
cont
ract
ed t
o pe
rfor
m t
he f
ollo
win
g fu
nctio
ns
• W
etla
nd d
elin
eatio
n
• B
uffe
r zo
ne d
elin
eatio
n
o
Dem
arca
te
the
edge
s of
th
e w
etla
nds
and
buff
er z
ones
so
that
ope
ratio
ns p
erso
nnel
can
av
oid
thes
e ar
eas
• B
iodi
vers
ity c
orrid
or w
here
nec
essa
ry
• A
sses
s th
e w
etla
nd h
ealth
• D
eter
min
e
pres
ent
ecol
ogic
al
stat
e (P
ES
) an
d ec
olog
ical
impo
rtan
ce a
nd s
ensi
tivity
(E
IS)
• Id
entif
y th
e pr
esen
ce o
f N
FE
PA
wet
land
s on
site
and
in
the
quat
erna
ry c
atch
men
t
• A
ssis
t in
ide
ntify
ing
the
ecos
yste
m s
ervi
ces
prov
ided
by
wet
land
s on
site

211
Geo
gra
ph
ical
Po
siti
on
On
-sit
e
Issu
e E
sko
m H
ead
Off
ice
res
po
nsi
bili
ties
O
n-s
ite
res
po
nsi
bili
ties
Wor
king
for
Wet
land
s
• Le
ad/h
elp
with
th
e id
entif
icat
ion
and
plan
ning
of
re
habi
litat
ion
and
the
reha
bilit
atio
n its
elf.
Thi
s w
ill
prob
ably
nee
d to
be
fund
ed b
y E
skom
.
Env
ironm
enta
l Man
ager
• P
lan
and
budg
et
for
on-g
oing
m
aint
enan
ce
of
ecol
ogic
al in
fras
truc
ture
• C
ondu
ct r
outin
e m
onito
ring
with
in t
he f
ram
ewor
k of
st
rate
gic
adap
tive
man
age
men
t (S
AM
) to
mon
itor
the
fo
llow
ing:
o
The
co
nditi
on
of
wet
land
s on
si
te.
T
he
cond
ition
of
th
ese
wet
land
s sh
ould
no
t be
al
low
ed t
o de
terio
rate
, bu
t sh
ould
pre
fera
bly
impr
ove
to t
he l
evel
stip
ulat
ed i
n th
e W
RC
S.
T
he i
ndic
ator
s gi
ven
in t
he O
berh
olst
er e
t al
. (2
014)
he
alth
an
d ris
k as
sess
men
t gu
ide
shou
ld b
e us
ed f
or t
his.
o
The
m
onito
ring
shou
ld
indi
cate
th
e le
vel
of
com
plia
nce
with
aut
horis
atio
ns
o
Ens
ure
that
oth
er a
ctiv
ities
do
not
com
prom
ise
w
etla
nd in
tegr
ity
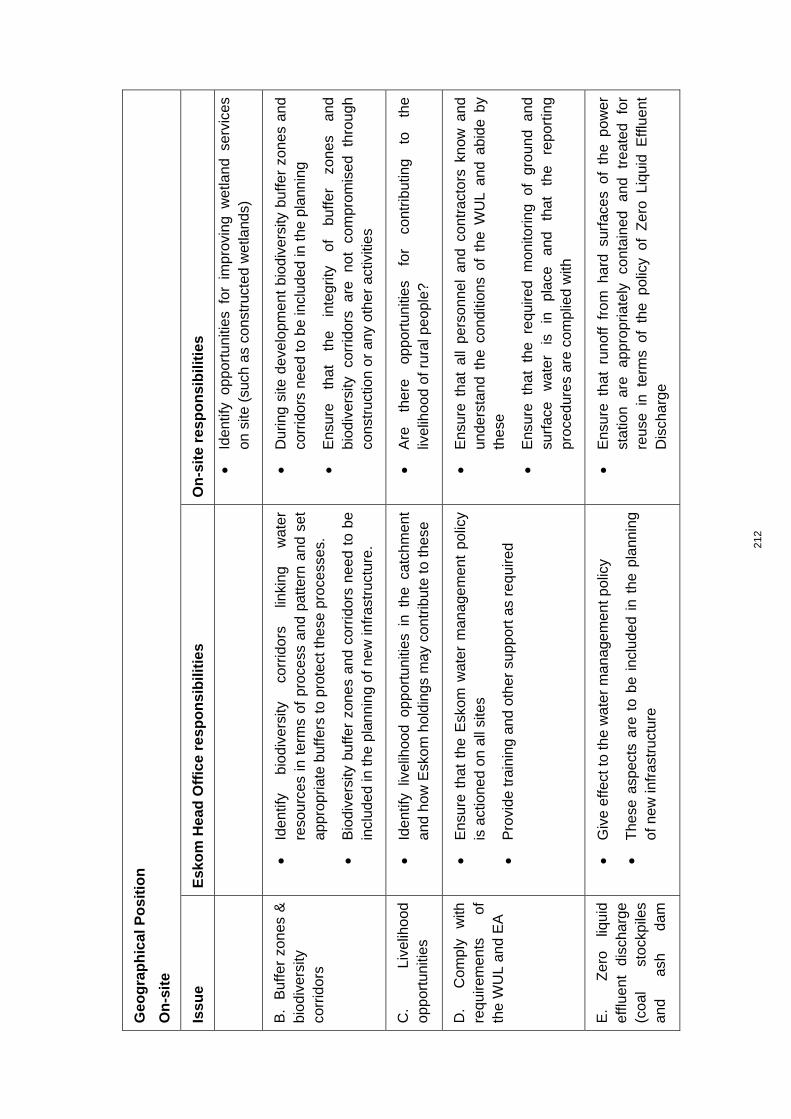
212
Geo
gra
ph
ical
Po
siti
on
On
-sit
e
Issu
e E
sko
m H
ead
Off
ice
res
po
nsi
bili
ties
O
n-s
ite
res
po
nsi
bili
ties
• Id
entif
y op
port
uniti
es f
or i
mpr
ovin
g w
etla
nd s
ervi
ces
on s
ite (
such
as
cons
truc
ted
wet
land
s)
B.
Buf
fer
zone
s &
bi
odiv
ersi
ty
corr
idor
s
• Id
entif
y bi
odiv
ersi
ty
corr
idor
s lin
king
w
ater
re
sour
ces
in t
erm
s of
pro
cess
and
pat
tern
and
set
ap
prop
riate
buf
fers
to
prot
ect
thes
e pr
oces
ses.
• B
iodi
vers
ity b
uffe
r zo
nes
and
corr
idor
s ne
ed t
o be
in
clud
ed in
the
plan
ning
of
new
infr
astr
uctu
re.
• D
urin
g si
te d
evel
opm
ent
biod
iver
sity
buf
fer
zone
s an
d
corr
idor
s ne
ed t
o be
incl
uded
in t
he p
lann
ing
• E
nsur
e th
at
the
inte
grity
of
bu
ffer
zone
s an
d bi
odiv
ersi
ty
corr
idor
s ar
e no
t co
mpr
omis
ed
thro
ugh
cons
truc
tion
or a
ny o
ther
act
iviti
es
C.
Li
velih
ood
oppo
rtun
ities
•
Iden
tify
livel
ihoo
d op
port
uniti
es i
n th
e ca
tchm
ent
and
how
Esk
om h
oldi
ngs
may
con
trib
ute
to th
ese
• A
re
ther
e op
port
uniti
es
for
cont
ribut
ing
to
the
livel
ihoo
d of
rur
al p
eopl
e?
D.
C
om
ply
with
re
quire
men
ts
of
the
WU
L an
d E
A
• E
nsur
e th
at t
he E
skom
wat
er m
anag
emen
t po
licy
is a
ctio
ned
on a
ll si
tes
• P
rovi
de tr
aini
ng a
nd o
ther
sup
port
as
requ
ired
• E
nsur
e th
at a
ll pe
rson
nel
and
cont
ract
ors
know
and
un
ders
tand
the
con
ditio
ns o
f th
e W
UL
and
abid
e by
th
ese
• E
nsur
e th
at
the
requ
ired
mon
itorin
g of
gr
ound
an
d su
rfac
e w
ater
is
in
pl
ace
and
that
th
e re
port
ing
proc
edur
es a
re c
ompl
ied
with
E.
Z
ero
liqui
d ef
fluen
t di
scha
rge
(coa
l st
ockp
iles
and
ash
dam
• G
ive
effe
ct to
the
wat
er m
anag
emen
t pol
icy
• T
hese
asp
ects
are
to
be i
nclu
ded
in t
he p
lann
ing
of n
ew in
fras
truc
ture
• E
nsur
e th
at r
unof
f fr
om h
ard
surf
aces
of
the
pow
er
stat
ion
are
appr
opria
tely
co
ntai
ned
and
trea
ted
for
reus
e in
ter
ms
of t
he p
olic
y of
Zer
o Li
quid
Eff
luen
t D
isch
arge

213
Geo
gra
ph
ical
Po
siti
on
On
-sit
e
Issu
e E
sko
m H
ead
Off
ice
res
po
nsi
bili
ties
O
n-s
ite
res
po
nsi
bili
ties
disc
harg
e)
• H
ydro
carb
ons
, fr
om w
hate
ver
sour
ce,
shou
ld n
ot b
e re
leas
ed in
to th
e en
viro
nmen
t
F.
In
cide
nt
repo
rtin
g pr
oced
ure
• A
naly
se
inci
denc
e da
ta
in
orde
r to
id
entif
y un
derly
ing
caus
e an
d ef
fect
an
d in
stitu
te
corr
ectiv
e m
easu
res
• E
nsur
e th
at
trai
ning
is
pr
ovid
ed
on
repo
rtin
g pr
oced
ures
• E
nsur
e th
at i
ncid
ent
repo
rtin
g pr
oced
ure
is i
n pl
ace
and
that
the
rel
evan
t st
aff
unde
rsta
nd a
nd c
ompl
y w
ith
it as
req
uire
d by
the
WU
L an
d ot
her
auth
oris
atio
ns
H.
E
sko
m’s
po
sitio
n •
As
sign
ator
y to
the
UN
CE
O W
ate
r M
anda
te a
nd
as a
maj
or w
ater
use
r in
the
are
a, E
skom
is
in a
po
sitio
n to
tak
e th
e le
ad i
n th
e m
anag
emen
t an
d
prot
ectio
n of
eco
logi
cal i
nfra
stru
ctur
e
• G
ive
effe
ct
to
the
Esk
om
wat
er
man
agem
ent
polic
y
• R
evie
w
rele
vant
ca
tchm
ent
repo
rts
to
mon
itor
tren
ds
and
iden
tify
oppo
rtun
ities
fo
r po
sitiv
e
inte
rven
tions
• F
ind
way
s to
pra
ctic
e th
e U
N C
EO
man
date
aim
s an
d
obje
ctiv
es o
n si
te
• G
ive
effe
ct to
the
wat
er m
anag
emen
t pol
icy

214
Geo
gra
ph
ical
Po
siti
on
On
-sit
e
A.
Pro
tect
ion
/reh
abili
tati
on
of
wet
lan
ds
on
-sit
e:
Esk
om
Hea
d O
ffic
e re
sp
on
sib
iliti
es
All
the
pow
er s
tatio
ns in
a p
artic
ular
cat
chm
ent
are
subj
ect
to t
he s
ame
ov
erar
chin
g w
ater
res
ourc
e m
anag
emen
t re
quire
men
ts a
nd s
truc
ture
s.
Esk
om H
ead
Offi
ce s
houl
d de
velo
p an
d im
ple
men
t an
en
viro
nmen
tal
man
agem
ent
stra
tegy
fo
r th
eir
hold
ings
to
en
sure
th
at
ther
e is
co
nsis
tenc
y in
env
ironm
enta
l man
agem
ent a
cros
s al
l the
ir ac
tiviti
es.
A k
ey c
hang
e in
trod
uced
in t
he N
atio
nal W
ater
Act
(A
ct 3
6 of
199
8) is
th
e ch
ange
to
Inte
grat
ed W
ater
res
ourc
e M
anag
emen
t (I
WR
M).
‘A
key
as
pect
of
IW
RM
tr
ansf
orm
atio
n in
S
outh
A
fric
a is
th
e pr
ogre
ssiv
e de
cent
ralis
atio
n of
man
y of
the
res
pons
ibili
ties
and
auth
ority
for
wat
er
reso
urce
s m
anag
em
ent
to C
MA
s an
d as
sist
ed b
y, a
t a
loca
l le
vel,
Cat
chm
ent
Man
age
men
t C
om
mitt
ees,
Wat
er U
ser
Ass
ocia
tions
and
C
atch
men
t M
anag
em
ent
For
um
s. T
hese
res
pons
ibili
ties
rela
te m
ainl
y to
allo
cata
ble
wat
er w
ithin
the
WM
A’ (
DW
AF
, 20
07:1
6).
The
wat
er q
ualit
y an
d qu
antit
y re
quire
men
ts a
re s
pelt
out
for
each
w
ater
man
age
men
t ar
ea
(WM
A)
in t
he W
ater
Res
ourc
e C
lass
ifica
tion
Pro
cess
(W
RC
S;
Des
crib
ed
abov
e un
der
Sec
tion
2 X
Y.
N
atio
nal
Pol
icy
and
Legi
slat
ion)
.
The
cat
chm
ent
man
age
men
t ag
ency
(C
MA
) is
tas
ked
with
dev
elop
ing
the
catc
hmen
t m
anag
emen
t st
rate
gy (
CM
S)
for
each
WM
A
and
the
W
RC
S is
dev
elop
ed b
y D
WA
.
As
the
CM
S a
nd t
he W
RC
S f
or a
ny o
ne W
MA
will
app
ly t
o th
e en
tire
WM
A it
is in
the
inte
rest
s of
the
Esk
om H
ead
Offi
ce t
o pr
ovid
e ef
fect
ive
repr
esen
tatio
n in
the
se p
roce
sses
and
to
ensu
re t
hat
on-s
ite p
erso
nnel
ar
e fa
mili
ar w
ith w
hat i
s re
quire
d of
them
.
DW
A r
ecog
nise
tha
t so
me
wet
land
s ar
e in
a p
oore
r co
nditi
on (
hard
er
wor
king
) th
an o
ther
s.
The
foc
us o
f ac
tiviti
es o
n th
ese
will
mai
ntai
n th
e ov
eral
l qu
ality
of
the
ecol
ogic
al i
nfra
stru
ctur
e in
bet
ter
cond
ition
and
al
so m
ean
that
miti
gatio
n or
off
set
inte
rven
tions
will
be
mor
e co
st
effe
ctiv
e.
On
-sit
e re
sp
on
sib
iliti
es
Wet
land
s sh
ould
be
as
sess
ed
thro
ugh
the
lens
of
th
e ec
osys
tem
se
rvic
es t
hat
they
pro
vide
. T
he w
etla
nd s
peci
alis
t w
ill b
e ab
le t
o as
sist
w
ith t
his.
A
s fa
r as
is
poss
ible
, th
e cu
mul
ativ
e ef
fect
s of
the
im
pact
s on
wet
land
s an
d th
e se
rvic
es th
ey d
eliv
er s
houl
d be
ass
esse
d.
Wet
lan
d s
pec
ialis
t:
One
of
the
cond
ition
s ro
utin
ely
requ
ired
in t
he
wat
er u
se l
icen
se a
pplic
atio
ns a
re t
hat
wet
land
s ar
e de
linea
ted.
T
he
task
nee
ds t
o be
und
erta
ken
by a
con
sulta
nt s
peci
alis
ing
in w
etla
nd

215
delin
eatio
n,
ofte
n in
co
njun
ctio
n w
ith
a so
il sp
ecia
list.
It is
a
requ
irem
ent
of
wet
land
co
nser
vatio
n th
at
buffe
r zo
nes
arou
nd
the
w
etla
nds
are
also
dem
arca
ted.
D
urin
g th
e co
nstr
uctio
n ph
ase
it is
ne
cess
ary
to m
ark
the
edge
of
the
wet
land
s/bu
ffer
zon
es t
o pr
even
t ac
cide
ntal
dis
turb
ance
of
the
area
. O
ne o
f th
e m
any
func
tions
of
the
buffe
r zo
ne i
s to
pro
tect
bio
dive
rsity
. W
here
nec
essa
ry,
the
on-s
ite
prot
ectio
n of
bio
dive
rsity
may
als
o r
equi
re c
orrid
ors
of u
ndis
turb
ed
habi
tat
thro
ugh
whi
ch t
o m
ove
bet
wee
n w
etla
nds.
W
hile
the
wet
land
s sp
ecia
list
is o
n si
te t
hey
shou
ld a
sses
s th
e he
alth
of
the
wet
land
s fo
llow
ing
the
met
hods
of
Mac
Far
lane
et
al.
(200
8).
Obe
rhol
ster
et
al.
(201
4) s
houl
d be
use
d by
the
env
ironm
enta
l m
anag
er t
o m
onito
r fo
r ch
ange
s in
the
wet
land
s.
If t
he P
rese
nt E
colo
gica
l S
tate
(P
ES
) an
d
the
Eco
logi
cal
Impo
rtan
ce
and
Sen
sitiv
ity
(EIS
) ha
ve
not
been
de
term
ined
, th
is s
houl
d be
don
e by
the
wet
land
spe
cial
ist
whi
le o
n si
te
as t
his
is a
req
uire
men
t of
the
WU
L a
pplic
atio
n pr
oces
s.
The
wet
land
sp
ecia
list
shou
ld
also
id
entif
y an
y N
FE
PA
(N
atio
nal
Fre
shw
ater
E
cosy
stem
P
riorit
y A
rea)
w
etla
nds
that
ar
e on
si
te
and
in
the
quat
erna
ry c
atch
men
t. T
hese
are
as r
equi
re s
peci
al c
onse
rvat
ion.
T
he
wet
land
spe
cial
ist
can
also
ass
ist
in id
entif
ying
the
eco
syst
em s
ervi
ces
whi
ch th
e w
etla
nds
on s
ite a
re d
eliv
erin
g.
Wo
rkin
g
for
Wet
lan
ds:
If
ther
e ar
e w
etla
nds
whi
ch
need
to
be
re
habi
litat
ed,
plan
s sh
ould
be
mad
e to
do
this
. T
his
shou
ld i
deal
ly b
e do
ne in
con
junc
tion
with
Wor
king
for
Wet
land
s.
Wor
king
for
Wet
land
s is
man
date
d to
do
wet
land
reh
abili
tatio
n an
d so
with
the
ir he
lp t
he
nece
ssar
y en
viro
nmen
tal
auth
oris
atio
ns w
ill b
e m
ore
easi
ly o
btai
ned.
N
eigh
bour
ing
land
owne
rs w
ith w
etla
nds
to b
e re
habi
litat
ed m
ay
be
appr
oach
ed.
In
this
way
the
are
a of
wet
land
s to
be
reha
bilit
ated
ma
y be
incr
ease
d.
En
viro
nm
enta
l man
ager
:
The
env
ironm
enta
l m
anag
er s
houl
d pl
an a
nd b
udge
t fo
r th
e on
-goi
ng
mai
nten
ance
of e
colo
gica
l inf
rast
ruct
ure.
On-
site
m
oni
torin
g:
T
hrou
gh
the
proc
ess
of
stra
tegi
c ad
aptiv
e m
anag
emen
t (S
AM
) th
e e
nviro
nme
nta
l m
anag
er s
houl
d en
sure
tha
t th
e co
nditi
on o
f w
etla
nds
on-s
ite d
oes
not
dete
riora
te,
but
pref
erab
ly
impr
oves
. T
he i
ndic
ator
s in
Obe
rhol
ster
et
al.
(201
4) s
houl
d be
use
d an
d be
gui
ded
by t
he W
RQ
O o
r R
EC
of
the
rese
rve
used
dur
ing
the
WU
L au
thor
isat
ion.
T
he m
onito
ring
done
with
in t
he S
AM
pro
cess
sh
ould
in
dica
te
the
leve
l of
co
mpl
ianc
e w
ith
wet
land
m
ana
gem
ent
requ
irem
ents
an
d th
at
cons
truc
tion
or
any
oth
er
activ
ities
do
no
t co
mpr
omis
e w
etla
nd in
tegr
ity.
If th
ere
is a
n op
port
unity
for
cons
truc
ted
wet
land
s to
enh
ance
the
eco
syst
em s
ervi
ces,
the
fea
sibi
lity
of t
his
optio
n m
ust b
e in
vest
igat
ed.
B.
Bu
ffer
zo
nes
& b
iod
iver
sity
co
rrid
ors
Esk
om
Hea
d O
ffic
e re
sp
on
sib
iliti
es
Ens
ure
the
prot
ectio
n of
eco
logi
cal
and
wat
er c
orrid
ors
linki
ng w
ater
re
sour
ces
to e
nsur
e ec
osys
tem
pro
cess
and
pat
tern
s ar
e m
aint
aine
d.
Pla
nnin
g fo
r th
e pr
otec
tion
of e
colo
gica
l an
d w
ater
cor
ridor
s lin
king
w
ater
res
ourc
es t
o en
sure
eco
syst
em p
roce
ss a
nd p
atte
rns
shou
ld b
e in
clud
ed in
the
plan
ning
of
new
infr
astr
uctu
re.

216
On
-sit
e re
sp
on
sib
iliti
es
Whi
le t
he w
etla
nd s
peci
alis
t is
on
site
del
inea
ting
the
wet
lan
ds,
ensu
re
that
the
cor
rect
buf
fer
zone
s ar
e al
so d
elin
eate
d fo
r th
e ap
prop
riate
ob
ject
ives
. B
uffe
r zo
nes
are
curr
ently
the
sub
ject
of
a D
WA
/WR
C
rese
arch
pr
ojec
t an
d th
e gu
idel
ines
fr
om
this
sh
ould
be
fo
llow
ed.
B
uffe
r zo
nes
need
to b
e in
clud
ed in
the
initi
al p
lann
ing.
In
cert
ain
inst
ance
s it
ma
y be
n
eces
sary
to
de
linea
te
and
prot
ect
biod
iver
sity
cor
ridor
s. I
t is
reco
mm
end
ed w
here
the
re is
a n
eed
for
this
th
at i
t be
don
e at
the
sam
e tim
e as
the
wet
land
del
inea
tion
by t
he
w
etla
nds
spec
ialis
t. T
he b
iodi
vers
ity c
orrid
or s
houl
d th
en b
e m
arke
d in
th
e sa
me
way
as
the
wet
land
s an
d co
nstr
uctio
n/op
erat
ions
per
sonn
el
shou
ld b
e in
form
ed o
f its
pre
senc
e an
d sh
ould
avo
id d
istu
rbin
g it.
C.
Live
lihoo
d op
port
uniti
es
Esk
om
Hea
d O
ffic
e re
sp
on
sib
iliti
es
In
conj
unct
ion
with
ot
her
stak
ehol
ders
an
d th
roug
h th
e ex
istin
g st
ruct
ures
, liv
elih
ood
oppo
rtun
ities
from
wet
land
s m
ay b
e id
entif
ied
and
whe
re fe
asib
le th
ese
may
be
deve
lope
d an
d/or
sup
port
ed.
On
-sit
e re
sp
on
sib
iliti
es
Whe
re
wet
land
s on
E
skom
pr
oper
ty
prov
ide
the
oppo
rtun
ity
for
livel
ihoo
d pr
ovis
ion,
the
se s
houl
d be
ide
ntifi
ed a
nd t
he f
easi
bilit
y of
de
velo
ping
the
oppo
rtun
ities
be
inve
stig
ated
.
D.
Co
mp
ly w
ith
req
uir
emen
ts o
f th
e W
UL
Esk
om
Hea
d O
ffic
e re
sp
on
sib
iliti
es
Ens
ure
that
en
viro
nmen
tal
offic
ers
are
up
to
spee
d w
ith
the
requ
irem
ents
of
w
ater
us
e lic
ence
an
d th
at
they
ar
e ad
equa
tely
su
ppor
ted
in th
eir
effo
rts
to c
ompl
y w
ith th
e W
UL.
On
-sit
e re
sp
on
sib
iliti
es
All
pers
onne
l an
d co
ntra
ctor
s on
si
te
need
to
ab
ide
by
the
re
quire
men
ts
of
the
WU
L in
or
der
to
ensu
re
the
pow
er
stat
ion’
s co
mpl
ianc
e.
The
env
iron
men
tal
offic
er n
eeds
to
desi
gn a
nd i
mpl
emen
t m
onito
ring
of t
he s
urfa
ce a
nd g
roun
dwat
er a
s re
quire
d by
the
WU
L.
The
res
ults
sh
ould
be
subm
itted
to th
e D
WA
in te
rms
of th
e W
UL.
Inci
dent
s on
site
sho
uld
be r
epor
ted
as r
equi
red
by t
he W
UL.
E.
R
un
off
fr
om
h
ard
su
rfac
es,
coal
st
ock
pile
s an
d
ash
d
am
dis
char
ge
(Wat
er q
ual
ity
leav
ing
th
e si
te)
Esk
om
Hea
d O
ffic
e re
sp
on
sib
iliti
es
Esk
om’s
wat
er m
anag
emen
t po
licy
give
s gu
idan
ce t
o th
e m
anag
emen
t of
wat
er o
n-si
te.
On
-sit
e re
sp
on
sib
iliti
es
Har
d su
rfac
es
alte
r th
e hy
drol
ogy
of
an
area
, ca
usin
g th
e pe
ak
disc
harg
e fr
om a
rai
nfa
ll ev
ent
to b
e m
ore
inte
nse
and
of s
hort
er
dura
tion
than
wou
ld b
e th
e ca
se f
rom
a n
atur
al a
rea.
R
unof
f fr
om
pow
er s
tatio
n pr
emis
es s
houl
d be
man
aged
in t
erm
s of
the
zer
o liq
uid
efflu
ent
disc
harg
e po
licy.
R
unof
f sh
ould
be
cont
aine
d an
d tr
eate
d to
a
qual
ity s
uita
ble
for
recy
clin
g.

217
Pot
entia
l sou
rces
of
sedi
men
t sh
ould
be
trea
ted
to
prev
ent,
or
at le
ast
subs
tant
ially
re
duce
, er
osio
n.
T
his
will
m
ake
the
trea
tmen
t fo
r re
cycl
ing
mor
e co
st e
ffec
tive.
F.
Inci
den
t re
po
rtin
g p
roce
du
re
Esk
om
Hea
d O
ffic
e re
sp
on
sib
iliti
es
The
in
cide
nts
shou
ld
be
anal
ysed
to
id
entif
y an
d th
en
corr
ect
the
un
derly
ing
caus
es.
It
mus
t al
so b
e re
port
ed t
o au
thor
ities
and
han
dled
ac
cord
ing
to th
e au
thor
ised
pro
toco
ls a
nd p
roce
dure
s.
On
-sit
e re
sp
on
sib
iliti
es
Ens
ure
that
in
cide
nt
repo
rtin
g pr
oced
ure
is
in
plac
e an
d th
at
the
re
leva
nt s
taff
unde
rsta
nd a
nd c
ompl
y w
ith it
.
H.
Esk
om
’s p
osi
tio
n
Esk
om
Hea
d O
ffic
e re
sp
on
sib
iliti
es
As
sign
ator
y to
the
UN
CE
O W
ate
r M
anda
te a
nd a
s a
maj
or w
ater
us
er,
Esk
om i
s in
a p
ositi
on t
o ta
ke t
he l
ead
in t
he m
anag
emen
t an
d
prot
ectio
n of
eco
logi
cal i
nfra
stru
ctur
e.
Cer
tain
fun
ctio
ns o
f th
is m
ay b
e
dele
gate
d to
per
sonn
el o
n si
te w
hile
oth
er f
unct
ions
may
be
bett
er
reta
ined
at t
he E
skom
Hea
d O
ffice
.
Giv
e ef
fect
to
Esk
om’s
wat
er m
anag
emen
t po
licy
whi
ch li
sts
a nu
mbe
r of
are
as w
here
Esk
om’s
act
iviti
es i
nter
act
with
the
env
ironm
ent.
The
po
licy
shou
ld g
ive
guid
ance
to th
ese
inte
ract
ions
.
Cat
chm
ent
repo
rts
shou
ld
be
revi
ewed
to
id
entif
y tr
ends
in
th
e ca
tchm
ent
and
whe
re
poss
ible
po
sitiv
e in
terv
entio
ns
may
b
e
impl
emen
ted.
On
-sit
e re
sp
on
sib
iliti
es
Whe
re a
spec
ts o
f th
e U
N C
EO
Wat
er M
anda
te h
ave
been
del
egat
ed
to P
S p
erso
nnel
, the
y sh
ould
see
k op
port
uniti
es to
impl
emen
t the
se.
Res
ou
rces
:
Cox
and
Kot
ze, 2
008.
DW
AF
, 200
7.
Elle
ry e
t al.,
200
9.
Esk
om (
Und
ated
) W
etla
nd c
lass
ifica
tion
and
risk
asse
ssm
ent
inde
x.
Pub
lishe
d by
Esk
om
Kot
ze e
t al.,
200
9.
Mac
farla
ne .
2008
.
SA
NB
I and
DW
S, 2
014.
Mill
enni
um E
cosy
stem
Ass
essm
ent,
2005
.
SU
DS
– e
.g.
http
://w
ww
.sep
a.or
g.uk
/wat
er/w
ater
_reg
ulat
ion/
regi
mes
/pol
lutio
n_co
ntr
ol/s
uds.
aspx
Tur
pie
et a
l., 2
009.

218
Tab
le 3
8: E
sko
m r
esp
on
sib
iliti
es f
or
pla
nn
ing
su
stai
nab
le m
anag
emen
t o
f th
e w
ater
res
ou
rce
do
wn
stre
am o
f th
e p
ow
er s
tati
on
Geo
gra
ph
ical
Po
siti
on
Do
wn
stre
am
Issu
e E
sko
m H
ead
Off
ice
resp
on
sib
iliti
es
On
-sit
e re
spo
nsi
bili
ties
A.
Wat
er q
ualit
y •
Ens
ure
that
pe
rson
nel
on
site
ar
e fa
mili
ar
with
th
e R
WQ
Os
for
the
catc
hmen
t in
whi
ch th
ey o
pera
te
• E
nsur
e co
mpl
ianc
e w
ith
the
zero
liq
uid
efflu
ent
disc
harg
e po
licy
of E
skom
• E
nsur
e co
mpl
ianc
e w
ith t
he z
ero
liqui
d ef
fluen
t di
scha
rge
polic
y of
Esk
om
B.
Mai
ntai
n ha
bita
t co
ntin
uity
•
Tak
e bu
ffer
zone
s an
d bi
odiv
ersi
ty c
orrid
ors
to a
djac
ent
wet
land
s in
to a
ccou
nt w
hen
plan
ning
dev
elop
men
ts
• M
aint
ain
cont
inui
ty w
ith n
eigh
bour
ing
wet
land
s by
act
ive
m
onito
ring
and
man
agem
ent
Geo
gra
ph
ical
Po
siti
on
Do
wn
stre
am
A.
Wat
er q
ual
ity
Esk
om
Hea
d O
ffic
e re
sp
on
sib
iliti
es
Ens
ure
that
env
ironm
ent
al m
anag
ers
on s
ite a
re s
uppo
rted
in
thei
r du
ties
to m
eet
the
RW
QO
s se
t fo
r th
e ca
tchm
ent
in w
hich
the
pow
er
stat
ion
is s
ituat
ed.
On
-sit
e re
sp
on
sib
iliti
es
Ens
ure
that
wat
er l
eavi
ng
the
site
com
plie
s w
ith t
he R
WQ
Os
(and
the
R
QO
s on
ce s
et).
P
artic
ular
att
entio
n sh
ould
be
give
n to
Per
sist
ent
orga
nic
pollu
tant
s (P
OP
s) a
nd o
ther
pow
er s
tatio
n-sp
ecifi
c po
lluta
nts
as c
erta
in o
f the
se a
re k
now
n he
alth
ris
ks.
Mai
nta
in h
abit
at c
on
tin
uit
y.
Esk
om
Hea
d O
ffic
e re
sp
on
sib
iliti
es
On
-sit
e re
sp
on
sib
iliti
es
Ens
ure
that
the
pla
nned
buf
fer
zone
s an
d bi
odiv
ersi
ty c
orrid
ors
are
impl
emen
ted.

219
B.
Mai
nta
in h
abit
at c
on
tin
uit
y
Esk
om
Hea
d O
ffic
e re
sp
on
sib
iliti
es
Hab
itat
cont
inui
ty,
thro
ugh
buffe
r zo
nes
and
biod
iver
sity
co
rrid
ors,
sh
ould
be
pl
anne
d to
lin
k w
ith
sim
ilar
habi
tats
on
ne
ighb
ourin
g pr
oper
ties
in o
rder
to p
rese
rve
the
attr
ibut
es o
f the
land
scap
e.
On
-sit
e re
sp
on
sib
iliti
es
Mai
ntai
n co
ntin
uity
of
habi
tat
in t
he l
inea
r dr
aina
ge l
ines
thr
ough
the
de
mar
catio
n an
d pr
otec
tion
of b
uffe
r zo
nes
and
biod
iver
sity
cor
ridor
s as
app
ropr
iate
.

220
Tab
le 3
9: E
sko
m r
esp
on
sib
iliti
es f
or
pla
nn
ing
su
stai
nab
le m
anag
emen
t o
f th
e w
ater
res
ou
rce
on
tra
nsm
issi
on
ser
vitu
des
Geo
gra
ph
ical
Po
siti
on
Tra
nsm
issi
on
Issu
e E
sko
m H
ead
Off
ice
res
po
nsi
bili
ties
O
n-s
ite
res
po
nsi
bili
ties
A.
C
ross
ing
wet
land
s •
Lim
it cr
ossi
ngs
of
sens
itive
w
ater
re
sour
ces
by
avoi
danc
e or
spe
cific
miti
gato
ry m
easu
res
mus
t be
impl
eme
nted
to r
educ
e fo
otpr
int i
mpa
cts
• E
nsur
e co
mpl
ianc
e w
ith
Esk
om
guid
elin
es
for
cros
sing
wet
land
s an
d w
ater
cou
rses
B.
Alie
n in
vasi
ve
plan
ts
• P
reve
nt a
nd m
anag
e th
e sp
read
of
alie
n in
vasi
ve
spec
ies
• R
emo
ve a
lien
inva
sive
pla
nts
follo
win
g th
e pr
oced
ures
of
the
rele
vant
Esk
om g
uide
lines
C.
B
uffe
r zo
nes
and
biod
iver
sity
co
rrid
ors
• Id
eally
pla
nnin
g fo
r di
strib
utio
n ne
twor
ks s
houl
d be
do
ne j
oint
ly w
ith c
onse
rvat
ion
auth
oriti
es l
eadi
ng
to m
utua
lly s
uppo
rtiv
e co
nser
vatio
n op
port
uniti
es
• C
omm
issi
onin
g of
new
dis
trib
utio
n sy
stem
s sh
ould
(w
here
pos
sibl
e) b
e al
igne
d w
ith p
rovi
ncia
l op
en
spac
e/bi
odiv
ersi
ty
plan
ning
in
an
ef
fort
to
su
pple
men
t bi
odiv
ersi
ty c
orrid
ors
with
pow
er l
ine
serv
itude
s.
• T
he m
aint
enan
ce o
f po
wer
lin
e se
rvitu
des
serv
ing
as
supp
lem
enta
ry
biod
iver
sity
co
rrid
ors
shou
ld
take
acc
ount
of
the
mig
rato
ry a
spe
cts
asso
ciat
ed
with
su
ch
a co
rrid
or,
e.g.
tim
e
of
year
w
hen
mig
ratio
n is
tak
ing
plac
e or
esc
ape
rout
es d
urin
g fir
es a
re p
rovi
ded
• E
nsur
e th
at
buff
er
zone
s id
entif
ied
are
prop
erly
m
aint
aine
d an
d m
anag
ed i
n te
rms
of t
he o
bje
ctiv
es
that
they
we
re s
et o
ut to
ach
ieve

221
Geo
gra
ph
ical
Po
siti
on
Tra
nsm
issi
on
Esk
om
has
deve
lope
d be
st
prac
tice
guid
elin
es
for
mai
ntai
ning
tr
ansm
issi
on
serv
itude
s.
T
he
appr
opria
te
guid
elin
es
shou
ld
be
follo
wed
by
team
s w
orki
ng o
n se
rvitu
des.
In c
ases
whe
re a
reas
of
high
eco
logi
cal i
mpo
rtan
ce a
nd s
ensi
tivity
are
pr
esen
t, t
he p
lann
ing
of d
istr
ibut
ion
infr
astr
uctu
re s
houl
d be
alig
ned
with
con
serv
atio
n in
tere
sts
as w
ell
as p
rovi
ncia
l op
en s
pace
pla
nnin
g in
ord
er t
o su
pple
men
t bi
odiv
ersi
ty c
orrid
ors
with
Esk
om s
ervi
tude
s.
The
se s
ervi
tude
s sh
ould
cat
er f
or t
he n
eeds
of
the
faun
a w
hic
h w
ill u
se
them
.
Res
ou
rces
Esk
om’s
bes
t pr
actic
e gu
idel
ines
as
upda
ted
fro
m t
ime
to t
ime.
(Ano
n,.
2010
).
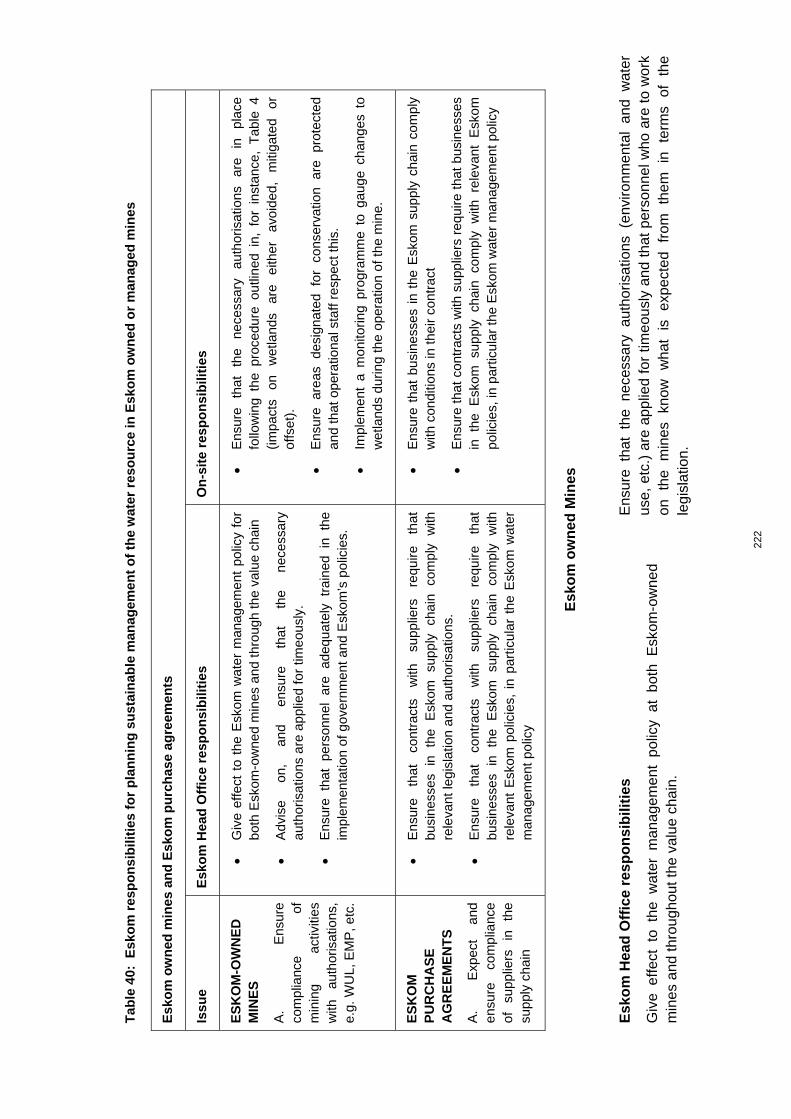
222
Tab
le 4
0: E
sko
m r
esp
on
sib
iliti
es f
or
pla
nn
ing
su
stai
nab
le m
anag
emen
t o
f th
e w
ater
res
ou
rce
in E
sko
m o
wn
ed o
r m
anag
ed m
ines
Esk
om
ow
ned
min
es a
nd
Esk
om
pu
rch
ase
agre
emen
ts
Issu
e E
sko
m H
ead
Off
ice
resp
on
sib
iliti
es
On
-sit
e re
spo
nsi
bili
ties
ES
KO
M-O
WN
ED
M
INE
S
A.
E
nsur
e co
mpl
ianc
e of
m
inin
g ac
tiviti
es
with
au
thor
isat
ions
, e.
g. W
UL,
EM
P, e
tc.
• G
ive
effe
ct t
o th
e E
skom
wat
er m
anag
emen
t po
licy
for
both
Esk
om-o
wne
d m
ines
and
thro
ugh
the
valu
e ch
ain
• A
dvis
e on
, an
d en
sure
th
at
the
nece
ssar
y au
thor
isat
ions
are
app
lied
for
timeo
usly
.
• E
nsur
e th
at p
erso
nnel
are
ade
quat
ely
trai
ned
in t
he
impl
emen
tatio
n of
gov
ernm
ent a
nd E
skom
’s p
olic
ies.
• E
nsur
e th
at
the
nece
ssar
y au
thor
isat
ions
ar
e in
pl
ace
follo
win
g th
e pr
oced
ure
outli
ned
in,
for
inst
ance
, T
able
4
(impa
cts
on
wet
land
s ar
e ei
ther
av
oide
d,
miti
gate
d or
of
fset
).
• E
nsur
e ar
eas
desi
gnat
ed
for
cons
erva
tion
are
prot
ecte
d an
d th
at o
pera
tiona
l sta
ff re
spec
t thi
s.
• Im
plem
ent
a m
onito
ring
prog
ram
me
to g
auge
cha
nges
to
wet
land
s du
ring
the
oper
atio
n of
the
min
e.
ES
KO
M
PU
RC
HA
SE
A
GR
EE
ME
NT
S
A.
E
xpec
t an
d en
sure
co
mpl
ianc
e of
su
pplie
rs
in
the
supp
ly c
hain
• E
nsur
e th
at
cont
ract
s w
ith
supp
liers
re
quire
th
at
busi
ness
es
in
the
Esk
om
supp
ly
chai
n co
mpl
y w
ith
rele
vant
legi
slat
ion
and
auth
oris
atio
ns.
• E
nsur
e th
at
cont
ract
s w
ith
supp
liers
re
quire
th
at
busi
ness
es
in
the
Esk
om
supp
ly
chai
n co
mpl
y w
ith
rele
vant
Esk
om p
olic
ies,
in
part
icul
ar t
he E
skom
wat
er
man
agem
ent p
olic
y
• E
nsur
e th
at b
usin
esse
s in
the
Esk
om s
uppl
y ch
ain
com
ply
with
con
ditio
ns in
thei
r co
ntra
ct
• E
nsur
e th
at c
ontr
acts
with
sup
plie
rs r
equi
re t
hat
busi
ness
es
in t
he E
skom
sup
ply
chai
n co
mpl
y w
ith r
elev
ant
Esk
om
polic
ies,
in p
artic
ular
the
Esk
om w
ater
man
agem
ent p
olic
y
Esk
om
ow
ned
Min
es
Esk
om
Hea
d O
ffic
e re
sp
on
sib
iliti
es
Giv
e ef
fect
to
the
wat
er m
anag
emen
t po
licy
at b
oth
Esk
om-o
wne
d
min
es a
nd th
roug
hout
the
valu
e ch
ain.
Ens
ure
that
the
nec
essa
ry a
utho
risat
ions
(en
viro
nmen
tal
and
wat
er
use,
etc
.) a
re a
pplie
d fo
r tim
eous
ly a
nd t
hat
pers
onne
l who
are
to
wor
k on
th
e m
ines
kn
ow
wha
t is
ex
pect
ed
from
th
em
in
term
s of
th
e
legi
slat
ion.

223
On
-sit
e re
sp
on
sib
iliti
es
Wor
king
with
the
rel
evan
t se
ctio
n in
the
hea
d of
fice
mon
itor
on-s
ite
oper
atio
ns
to
ensu
re
that
co
nditi
ons
set
in
the
auth
oris
atio
ns
are
com
plie
d w
ith
and
that
w
etla
nds
mar
ked
for
cons
erva
tion
are
not
impa
cted
.
Impl
emen
t a
mon
itorin
g pr
ogra
mm
e to
ens
ure
tha
t an
y ch
ange
s to
w
etla
nds
on th
e si
te w
ill b
e pi
cked
up
and
man
aged
.
Esk
om
pu
rch
ase
agre
emen
ts
Esk
om
Hea
d O
ffic
e re
sp
on
sib
iliti
es
Con
trac
ts
ente
red
into
be
twee
n E
skom
an
d th
eir
supp
liers
sh
ould
re
quire
the
sup
plie
rs t
o be
ful
ly c
ompl
iant
with
the
rel
evan
t le
gisl
atio
n an
d au
thor
isat
ions
.
On
-sit
e re
sp
on
sib
iliti
es
Env
ironm
enta
l man
gers
sho
uld
mon
itor,
as
far
as p
ossi
ble,
tha
t E
skom
su
pplie
rs c
ompl
y w
ith c
ond
ition
s of
thei
r co
ntra
ct.
Res
ou
rces
Dep
artm
ent
of
En
viro
nmen
tal
Affa
irs,
Dep
artm
ent
of
Min
eral
R
esou
rces
, C
ham
ber
of M
ines
, S
outh
Afr
ican
Min
ing
and
Bio
dive
rsity
F
orum
, and
Sou
th A
fric
an N
atio
nal B
iodi
vers
ity In
stitu
te. 2
013.
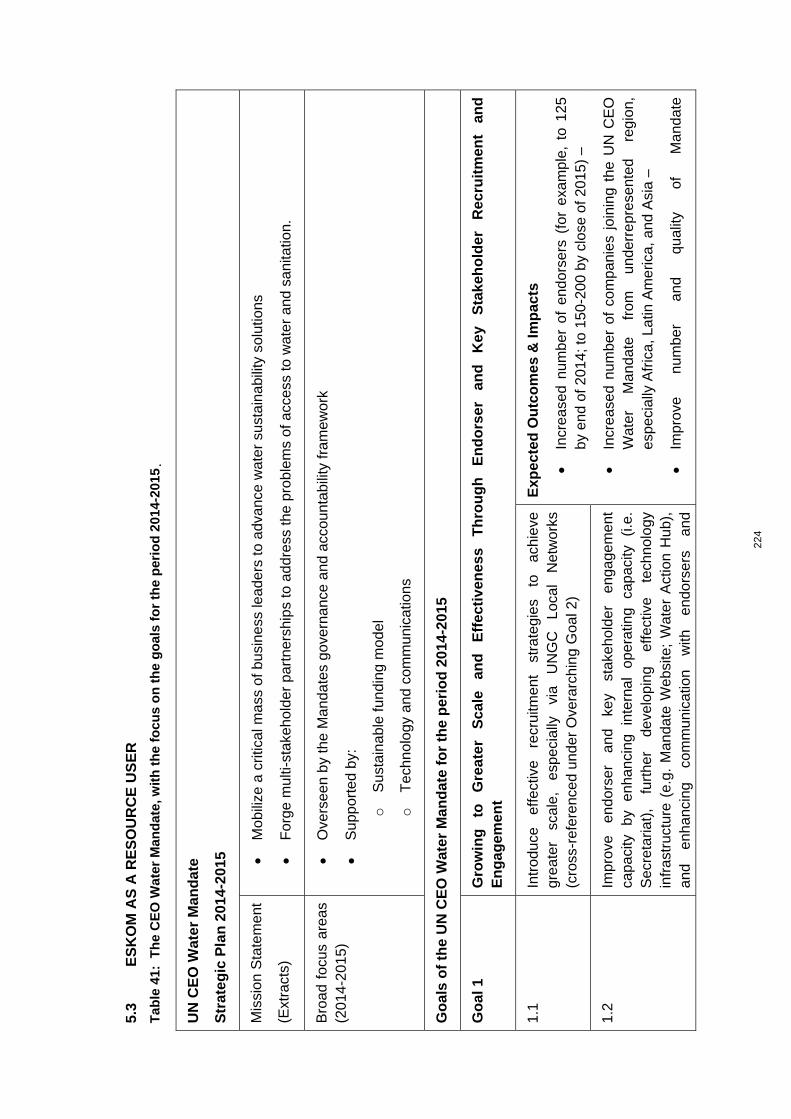
224
5.3
ES
KO
M A
S A
RE
SO
UR
CE
US
ER
Tab
le 4
1: T
he
CE
O W
ater
Man
dat
e, w
ith
th
e fo
cus
on
th
e g
oal
s fo
r th
e p
erio
d 2
014-
2015
UN
CE
O W
ater
Man
da
te
Str
ateg
ic P
lan
201
4-20
15
Mis
sion
Sta
tem
ent
(Ext
ract
s)
• M
obili
ze a
crit
ical
mas
s of
bus
ines
s le
ader
s to
adv
ance
wat
er s
usta
inab
ility
sol
utio
ns
• F
orge
mul
ti-st
akeh
olde
r pa
rtne
rshi
ps to
add
ress
the
prob
lem
s of
acc
ess
to w
ater
and
san
itatio
n.
Bro
ad f
ocus
are
as
(201
4-20
15)
• O
vers
een
by
the
Man
date
s go
vern
ance
and
acc
ount
abili
ty fr
amew
ork
• S
uppo
rted
by:
o
Sus
tain
able
fund
ing
mod
el
o
Tec
hnol
ogy
and
com
mu
nica
tions
Go
als
of
the
UN
CE
O W
ater
Man
dat
e fo
r th
e p
erio
d 2
014-
2015
Go
al 1
G
row
ing
to
G
reat
er
Sca
le
and
E
ffec
tive
nes
s T
hro
ug
h
En
do
rser
an
d
Ke
y S
take
ho
lder
R
ecru
itm
ent
and
E
ng
agem
ent
1.1
Intr
oduc
e ef
fect
ive
recr
uitm
ent
stra
tegi
es
to
achi
eve
grea
ter
scal
e,
espe
cial
ly
via
UN
GC
Lo
cal
Net
wor
ks
(cro
ss-r
efer
ence
d un
der
Ove
rarc
hin
g G
oal 2
)
Exp
ecte
d O
utc
om
es &
Imp
acts
• In
crea
sed
num
ber
of e
ndor
sers
(fo
r ex
ampl
e, t
o 12
5 by
end
of 2
014;
to 1
50-2
00 b
y cl
ose
of 2
015)
–
• In
crea
sed
num
ber
of c
ompa
nies
joi
ning
the
UN
CE
O
Wat
er
Ma
ndat
e fr
om
unde
rre
pres
ente
d re
gion
, es
peci
ally
Afr
ica,
Lat
in A
mer
ica,
and
Asi
a –
• Im
prov
e
num
ber
and
qu
ality
of
M
and
ate
1.2
Impr
ove
endo
rser
an
d ke
y st
akeh
olde
r en
gage
men
t ca
paci
ty
by
enha
ncin
g in
tern
al
oper
atin
g ca
paci
ty
(i.e.
S
ecre
taria
t),
furt
her
deve
lopi
ng
effe
ctiv
e te
chno
logy
in
fras
truc
ture
(e.
g. M
anda
te W
ebsi
te;
Wat
er A
ctio
n H
ub),
an
d en
hanc
ing
com
mun
icat
ion
with
en
dors
ers
and

225
stak
ehol
ders
(e.
g. e
-new
slet
ter,
etc
. C
omm
unic
atio
ns
on
Pro
gres
s (C
OP
),
the
prim
ary
acco
unta
bilit
y in
stru
men
t for
the
initi
ativ
e –
• In
crea
sed
num
ber
of
non-
busi
ness
st
akeh
olde
rs
invo
lved
in
ev
ents
, w
orks
trea
ms,
an
d ac
tion
area
s (e
.g. W
ater
Act
ion
Hub
) –
• C
onve
ne
ann
ual
even
ts
– e.
g.
Per
u (A
pril
2014
),
Sto
ckho
lm (
Aug
ust
2014
); T
el A
viv
(201
5),
Sto
ckho
lm
(201
5)
– in
ad
ditio
n to
sp
ecia
lty
conv
enin
g an
d
part
icip
atio
n an
d ot
her
key
wat
er-r
elat
ed f
ora
– e.
g.
U.S
. Nex
us e
vent
(Q
1 2
014)
1.3
Incr
ease
num
ber
of n
on-b
usin
ess
stak
ehol
ders
(e.
g. c
ivil
soci
ety,
U
N
agen
cies
, go
vern
men
ts,
bila
tera
l ai
d ag
enci
es,
inve
stor
s,
foun
datio
ns,
univ
ersi
ties,
et
c.)
enga
ged
in th
e in
itiat
ive
Go
al 2
E
ng
agin
g U
NG
C L
oca
l N
etw
ork
s to
Imp
rove
th
e In
itia
tive
’s “
Glo
bal
-to
-Lo
cal”
Eff
ecti
ven
ess/
Imp
act
2.1
Act
ivel
y w
ork
with
UN
GC
Loc
al N
etw
orks
to
inco
rpor
ate
Man
date
in
co
untr
y-le
vel
activ
ities
(e
spec
ially
po
licy
dial
ogue
s an
d w
orki
ng c
onfe
renc
es)
focu
sing
on
wat
er
and
sani
tatio
n ch
alle
nges
Exp
ecte
d O
utc
om
es &
Imp
acts
• In
crea
sed
num
ber
of L
ocal
Net
wor
k co
nven
ings
on
th
e U
N C
EO
Wat
er M
anda
te a
nd w
ater
ste
war
dshi
p,
lead
ing
to
impl
emen
tatio
n of
be
st
prac
tices
w
ith
posi
tive
loca
l im
pact
s
• In
crea
sed
num
ber
of
orga
niza
tion
regi
stra
tions
an
d pr
ojec
t po
stin
gs o
n W
ater
Act
ion
Hub
, fa
cilit
ated
and
su
ppor
ted
by in
divi
dual
Loc
al N
etw
orks
• In
crea
sed
num
ber
of e
ndor
sers
joi
ning
the
Man
date
fr
om u
nder
-rep
rese
nted
• co
untr
ies
and
mar
kets
(c
ross
re
fere
nced
un
der
Ove
rarc
hing
Goa
l 1)
2.2
Enc
oura
ge L
ocal
Net
wor
ks t
o m
obili
ze a
nd f
acili
tate
the
po
stin
g of
pro
ject
s on
the
Wat
er A
ctio
n H
ub w
ithin
the
ir re
gion
s an
d co
untr
ies

226
Go
al 3
A
dva
nci
ng
an
d L
aun
chin
g P
rio
rity
Wo
rkst
ream
s
3.1
Fur
ther
adv
ance
wor
k in
exi
stin
g U
N C
EO
Wat
er M
anda
te
prio
rity
wor
kstr
eam
s,
with
as
soci
ated
re
leas
e an
d di
ssem
inat
ion
of k
ey d
eliv
erab
les
Exp
ecte
d O
utc
om
es &
Imp
acts
• In
crea
sed
enga
gem
ent
in M
anda
te v
ia r
elev
ant
and
usef
ul
reso
urce
s,
guid
ance
an
d to
ols
(rei
nfor
cing
O
vera
ll G
oal 1
)
• D
isse
min
atio
n of
re
sour
ces
and
tool
s to
Lo
cal
Net
wor
ks (
rein
forc
ing
Ove
rarc
hing
Goa
l 2)
• In
crea
sed
unde
rsta
ndin
g by
po
licy
mak
ers
of
impo
rtan
ce
of
corp
orat
e w
ater
st
ewar
dshi
p an
d ef
fect
iven
ess
of
rela
ted
reso
urce
s an
d to
ols
(rei
nfor
cing
Ove
rarc
hing
Goa
l 4)
• In
Q2
2014
: la
unch
of
Man
date
’s G
loba
l G
uida
nce
on
Wat
er
and
Hum
an
Rig
hts
(link
s to
M
anda
te’s
re
cogn
ition
of
the
hum
an r
ight
to
wat
er a
nd s
anita
tion;
al
so
links
to
5
thco
re
elem
ent
of
Man
dat
e,
i.e.
Com
mun
ity E
ngag
emen
t)
• In
Q2
2014
: pu
blic
atio
n of
whi
te p
aper
on
corp
orat
e pr
actic
es
in
rela
tion
to
sani
tatio
n,
supp
ortin
g th
e
DS
G’s
spe
cial
cal
l-to-
actio
n
• In
Q3
2014
: la
unch
of
Man
date
’s G
loba
l G
uide
lines
on
C
orpo
rate
W
ater
D
iscl
osur
e (li
nks
to
6th
core
el
emen
t of
M
anda
te,
i.e.
Tra
nspa
renc
y an
d D
iscl
osur
e)
• In
Q4
2014
: la
unch
of
Gui
de t
o In
tegr
ity i
n W
ater
S
tew
ards
hip
Par
tner
ship
s (li
nks
to 3
rd a
nd 4
th c
ore
3.2
Laun
ch 1
-3 n
ew w
orks
trea
ms
in a
reas
dee
med
crit
ical
by
endo
rser
s fo
r th
e ad
vanc
emen
t of
co
rpor
ate
wat
er
stew
ards
hip,
es
peci
ally
in
fr
ontie
r is
sue
area
s –
e.g.
C
olle
ctiv
e A
ctio
n im
pact
m
easu
rem
ent;
Sup
ply
Cha
in
wat
er s
tew
ards
hip/
sust
aina
ble
agric
ultu
re
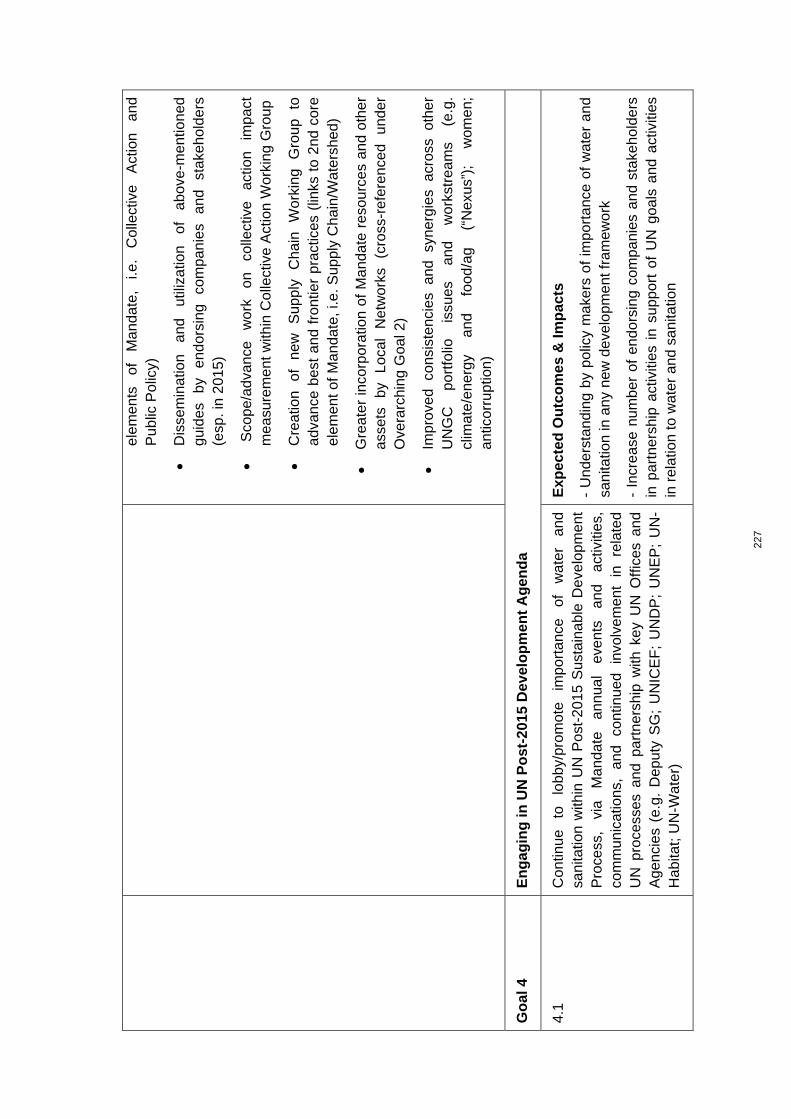
227
elem
ents
of
M
anda
te,
i.e.
Col
lect
ive
Act
ion
and
Pub
lic P
olic
y)
• D
isse
min
atio
n an
d ut
iliza
tion
of
abov
e-m
entio
ned
guid
es
by
endo
rsin
g co
mpa
nies
an
d st
akeh
olde
rs
(esp
. in
201
5)
• S
cope
/adv
ance
w
ork
on
colle
ctiv
e ac
tion
impa
ct
mea
sure
me
nt w
ithin
Col
lect
ive
Act
ion
Wor
king
Gro
up
• C
reat
ion
of
new
S
upp
ly
Cha
in
Wor
king
G
roup
to
ad
vanc
e be
st a
nd f
ront
ier
prac
tices
(lin
ks t
o 2n
d co
re
elem
ent o
f Man
date
, i.e
. Sup
ply
Ch
ain/
Wat
ersh
ed)
• G
reat
er in
corp
orat
ion
of M
anda
te r
esou
rces
and
oth
er
asse
ts
by
Loca
l N
etw
orks
(c
ross
-ref
eren
ced
unde
r O
vera
rchi
ng G
oal 2
)
• Im
prov
ed c
onsi
sten
cies
and
syn
ergi
es a
cros
s ot
her
UN
GC
po
rtfo
lio
issu
es
and
wor
kstr
eam
s (e
.g.
clim
ate/
ener
gy
and
food
/ag
(“N
exus
”);
wom
en;
antic
orru
ptio
n)
Go
al 4
E
ng
agin
g in
UN
Po
st-2
015
Dev
elo
pm
ent
Ag
end
a
4.1
Con
tinue
to
lo
bby/
prom
ote
impo
rtan
ce
of
wat
er
and
sani
tatio
n w
ithin
UN
Pos
t-20
15 S
usta
inab
le D
evel
opm
ent
Pro
cess
, vi
a M
anda
te
annu
al
even
ts
and
activ
ities
, co
mm
unic
atio
ns,
and
cont
inue
d in
volv
em
ent
in
rela
ted
UN
pro
cess
es a
nd p
artn
ersh
ip w
ith k
ey U
N O
ffic
es a
nd
Age
ncie
s (e
.g.
Dep
uty
SG
; U
NIC
EF
; U
ND
P;
UN
EP
; U
N-
Hab
itat;
UN
-Wat
er)
Exp
ecte
d O
utc
om
es &
Imp
acts
- U
nder
stan
ding
by
polic
y m
aker
s o
f im
port
ance
of
wat
er a
nd
sa
nita
tion
in a
ny n
ew d
eve
lopm
ent f
ram
ewor
k
- In
crea
se n
umbe
r of
en
dors
ing
com
pani
es a
nd s
take
hold
ers
in p
artn
ersh
ip a
ctiv
ities
in
supp
ort
of U
N g
oals
and
act
iviti
es
in r
elat
ion
to w
ater
and
san
itatio
n

228
4.2
Pos
ition
UN
CE
O W
ate
r M
anda
te a
nd e
spec
ially
Wat
er
Act
ion
Hub
as
impl
eme
ntat
ion
plat
form
s in
fut
ure
act
ions
re
late
d to
rea
lizat
ion
of w
ater
-rel
ated
glo
bal
deve
lopm
ent
goal
s (i.
e. p
ossi
ble
SD
G o
n w
ater
and
san
itatio
n; s
ee
App
endi
x 3)
- G
reat
er a
dopt
ion
and
use
of G
uide
to
Res
pons
ible
Bus
ines
s E
ngag
emen
t in
Wat
er P
olic
y
- In
crea
sed
num
ber
of o
rgan
izat
ions
reg
iste
red
and
proj
ects
po
sted
on
Wat
er A
ctio
n H
ub (
for
exam
ple,
nu
mbe
r of
pro
ject
lo
catio
ns t
o 50
0+ b
y en
d of
201
4; b
etw
een
500
and
1000
by
end
of 2
015)
4.
3 O
rient
spe
cific
Man
date
-Loc
al N
etw
ork
colla
bora
tions
and
ac
tiviti
es
arou
nd
Pos
t-20
15
agen
da
to
part
ner
mor
e
effe
ctiv
ely
with
the
priv
ate
sect
or
4.4
Enc
oura
ge
Man
date
en
dors
ers
to
dire
ctly
en
gage
w
ith
polic
y m
aker
s an
d G
over
nmen
ts o
n po
st-2
015
agen
da,
thro
ugh
bi-la
tera
l or
colle
ctiv
e ac
tion
effo
rts
UN
CE
O W
ater
Man
da
te
Ab
ou
t th
e U
N C
EO
Wat
er M
and
ate
:
Wat
er p
oses
one
of
the
grea
test
sus
tain
abili
ty c
halle
nges
of
the
21st
C
entu
ry.
Wat
er
scar
city
an
d po
llutio
n,
amon
g m
any
othe
r is
sues
, th
reat
en o
ur a
bilit
y to
gro
w s
tron
g an
d st
able
eco
nom
ies,
mee
t ba
sic
hum
an n
eeds
, an
d pr
otec
t he
alth
y ec
osys
tem
s (a
nd t
he s
ervi
ces
they
pr
ovid
e), w
hile
als
o po
sing
sev
ere
hum
an h
ealth
pro
blem
s.
Bus
ines
s or
gani
zatio
ns
are
grea
tly
affe
cted
by
–
and
also
of
ten
cont
ribut
e to
–
thes
e im
port
ant
issu
es.
Bec
ause
of
th
is,
they
ar
e
incr
easi
ngly
see
king
mor
e in
form
atio
n an
d tr
ying
to
unde
rsta
nd h
ow t
o
addr
ess
thes
e ch
alle
nges
.
Laun
ched
in
July
200
7 by
the
UN
Sec
reta
ry-G
ener
al,
the
UN
CE
O
Wat
er M
anda
te i
s a
uniq
ue p
ublic
-priv
ate
initi
ativ
e de
sign
ed t
o as
sist
co
mpa
nies
in
th
e de
velo
pmen
t,
impl
emen
tatio
n,
and
disc
losu
re
of
wat
er s
usta
inab
ility
pol
icie
s an
d pr
actic
es
Mis
sio
n S
tate
men
t:
The
UN
CE
O W
ater
Man
date
see
ks t
o m
ake
a po
sitiv
e im
pact
with
re
spec
t to
the
emer
ging
glo
bal w
ater
cris
is b
y m
obi
lizin
g a
criti
cal m
ass
of
busi
ness
le
ader
s to
ad
vanc
e w
ater
su
stai
nabi
lity
solu
tions
–
in
part
ners
hip
with
th
e U
nite
d N
atio
ns,
civi
l so
ciet
y or
gani
zatio
ns,
gove
rnm
ents
, and
oth
er s
take
hold
ers.

229
Esk
om
’s p
osi
tio
n:
Esk
om is
one
of
a sm
all n
umbe
r of
Sou
th A
fric
an c
ompa
nies
tha
t ha
ve
endo
rsed
the
UN
CE
O W
ater
Ma
ndat
e an
d so
has
und
erta
ken
to
adva
nce
wat
er s
usta
inab
ility
sol
utio
ns in
are
as w
here
it h
as in
fluen
ce.
The
Esk
om w
ater
man
agem
ent
polic
y su
ppor
ts t
he U
N C
EO
Wat
er
Man
date
.
Res
ou
rces
http
://c
eow
ater
man
date
.org
/
http
://c
eow
ater
man
date
.org
/file
s/M
anda
te_B
roch
ure.
http
://w
ww
.ung
loba
lcom
pact
.org
/

230
5.4
ES
KO
M A
ND
TH
E IN
FR
AS
TR
UC
TU
RE
PR
OV
IDE
RS
Tab
le 4
2: T
he
infr
astr
uct
ure
pro
vid
ers
Infr
astr
uct
ure
pro
vid
ers
Gov
ernm
ent D
epar
tmen
ts a
nd T
he M
anda
ted
Str
uctu
res
Suc
h as
the
CM
A, W
UA
(Ir
rigat
ion
Boa
rds)
, Sta
keho
lder
For
ums,
etc
.
Esk
om, a
s a
natio
nal e
nerg
y pr
ovid
er, h
as it
s sp
ecifi
c st
ruct
ures
and
req
uire
men
ts.
Infr
astr
uct
ure
pro
vid
ers
Res
ou
rces
Arm
stro
ng, 2
009.
Cox
and
Kot
ze, 2
008.
Dep
artm
ent
of W
ater
Affa
irs.
http
://w
ww
.dw
a.g
ov.z
a/
The
re is
a lo
t of
m
ater
ial
on
this
si
te.
T
he
sear
ch
faci
lity
is
effe
ctiv
e in
fin
ding
do
cum
ents
on
the
requ
ired
subj
ects
. D
WA
is
activ
ely
impl
emen
ting
the
NW
A s
o th
e si
tuat
ion
is n
ot s
tatic
. U
p-to
-dat
e in
form
atio
n sh
ould
be
obt
aine
d fr
om D
WA
offi
ces.
Dep
artm
ent
of
Env
ironm
enta
l A
ffairs
.
http
s://
ww
w.e
nviro
nmen
t.go
v.za
/The
re i
s a
lot
of m
ater
ial
on t
his
site
. T
he s
earc
h fa
cilit
y is
eff
ectiv
e in
fin
ding
doc
umen
ts o
n th
e re
quire
d su
bjec
ts.
SA
NB
I.
http
://w
ww
.san
bi.o
rg.z
a/
O
n th
is
site
is
a
docu
men
t ad
dres
sing
wet
land
miti
gatio
n ba
nkin
g.
The
β-v
ersi
on o
f th
e W
etla
nd O
ffse
t G
uide
line
is a
vaila
ble
on r
eque
st
from
sh
oln
ess
@n
mm
u.a
c.za
or fr
om s
teve
.mitc
hell@
eon.
co.z
a

231
5.5
ES
KO
M A
ND
TH
E P
UB
LIC
INF
RA
ST
RU
CT
UR
E
Tab
le 4
3: N
atio
nal
Po
licy
and
leg
isla
tio
n c
on
cern
ing
th
e m
anag
emen
t o
f th
e w
ater
res
ou
rce,
wit
h a
fo
cus
on
wet
lan
ds
Pu
blic
Infr
astr
uct
ure
So
cial
-In
stit
uti
on
al R
ule
s –
Nat
ion
al P
olic
y an
d L
egis
lati
on
Issu
e E
sko
m H
ead
Off
ice
res
po
nsi
bili
ties
O
n-s
ite
res
po
nsi
bili
ties
A.
Nat
iona
l Wat
er
Act
•
A n
umbe
r of
bes
t pr
actic
e gu
idel
ines
are
ava
ilabl
e
on t
he w
ebsi
te o
f th
e D
epar
tmen
t of
Wat
er A
ffairs
. R
elev
ant
doc
umen
ts
shou
ld
be
brou
ght
to
the
atte
ntio
n of
env
ironm
enta
l man
ager
s
• C
atch
men
t Man
agem
ent A
genc
y (C
MA
)
• W
ater
Use
Lic
ense
(W
UL)
o
Dev
elop
‘In
dust
ry
Spe
cific
’ G
ener
al
Aut
horis
atio
ns
o
Dev
elop
a
R
isk-
Bas
ed
App
roac
h to
w
etla
nd m
anag
emen
t
• W
RC
S
o
Thr
ough
a
subj
ect
mat
ter
expe
rt
mak
e
inpu
t in
to t
he W
RC
S i
n ea
ch o
f th
e w
ater
m
anag
emen
t are
as r
elev
ant t
o E
skom
o
Ens
ure
that
on
-site
en
viro
nmen
tal
man
ager
s ge
t th
e ne
cess
ary
supp
ort
be
• W
UL o
A
dher
ence
to
miti
gatio
n hi
erar
chy
durin
g th
e im
pact
/ris
k as
sess
men
t pha
se o
f W
ULA
’s
o
Arr
ange
for
cont
ract
or a
nd c
ontr
act
o
Ens
ure
incl
usio
n of
m
aint
enan
ce
and
emer
genc
y pr
oced
ures
o
Com
plia
nce
with
WU
L re
quire
men
ts
o
Pro
tect
wat
er q
ualit
y in
the
cat
chm
ent
– e.
g.
runo
ff fr
om a
sh d
ams
and
hard
sur
face
s
o
Ens
ure
that
ot
her
pers
onne
l ar
e aw
are
of
wet
land
s an
d th
e re
quire
men
ts o
f the
WU
L
o
Ens
ure
that
wet
land
s ar
e pr
otec
ted
in t
erm
s of
th
e W
UL
requ
irem
ents
• W
RC
S
o
Be
awar
e of
the
env
iron
men
tal r
eser
ve (
qual
ity

232
able
to
co
mpl
y w
ith
and
imp
lem
ent
requ
irem
ents
of
the
envi
ronm
enta
l re
serv
e (q
ualit
y an
d qu
antit
y)
and
the
reso
urce
w
ater
qua
lity
obje
ctiv
es (
RW
QO
s)
and
quan
tity)
an
d th
e pr
elim
inar
y re
sour
ce
clas
sific
atio
n, t
he R
WQ
Os
o
Be
awar
e of
th
e re
sour
ce
wat
er
qual
ity
obje
ctiv
es
B.
N
atio
nal
Env
ironm
enta
l M
anag
emen
t A
ct
(NE
MA
)
• C
oord
inat
e th
e ap
plic
atio
ns
of
the
nece
ssar
y au
thor
isat
ions
o
EIA
o
EM
P
• N
o ne
t lo
ss
of
wet
land
s –
how
is
th
is
to
be
impl
emen
ted?
o
Avo
id; m
itig
ate;
offs
et
• A
pply
for
the
nece
ssar
y au
thor
isat
ions
o
EIA
o
EM
P
C.
Nat
iona
l E
nviro
nmen
tal
Man
agem
ent:
Was
te A
ct
• C
ompi
le
corp
orat
e be
st
prac
tice
guid
elin
es
on
deal
ing
with
w
aste
an
d co
ntam
inat
ed
land
, th
ereb
y m
inim
isin
g im
pact
s on
w
ater
qu
ality
ac
ross
th
e ca
tchm
ents
w
ithin
w
hich
E
skom
op
erat
es
• C
oord
inat
e th
e ap
plic
atio
ns
of
the
nece
ssar
y au
thor
isat
ions
• In
corp
orat
e co
nditi
ons
rela
ted
to
any
was
te
man
agem
ent
licen
ce
into
th
e en
viro
nmen
tal
man
agem
ent s
yste
m o
f the
ope
ratio
n.
• C
omm
it to
be
st
prac
tices
re
late
d to
av
oida
nce,
m
inim
isat
ion,
re-
use
and
recy
clin
g.
Nat
iona
l E
nviro
nmen
tal
Man
agem
ent:
A
ir Q
ualit
y A
ct
• U
nder
stan
d th
e im
pact
of
E
skom
’s
stac
k em
issi
ons
on w
ater
qua
lity
due
to d
ry f
all-o
ut a
nd
was
h-ou
t
• U
nder
stan
d th
e im
pact
of
ai
rbor
ne
part
icul
ate
mat
ter/
aero
sols
or
igin
atin
g fr
om
ash
dam
s an
d co
al s
tock
pile
s on
wat
er q
ualit
y
• Im
plem
ent
requ
ired
actio
ns
as
dict
ated
by
re
leva
nt
auth
oris
atio
ns a
nd g
uida
nce
from
hea
d of
fice
• E
nsur
e op
erat
iona
l effi
cien
cy

233
Con
serv
atio
n of
A
gric
ultu
ral
Res
ourc
es
Act
, 19
83
(Act
N
o 43
of
198
3)
• U
nder
stan
d he
driv
ers
and
pres
sure
s of
Esk
om
oper
atio
ns
rela
ted
to
the
disp
ersi
on
and/
or
crea
ting
of
cond
ition
s th
at
allo
w
alie
n in
vasi
ve
spec
ies
to f
lour
ish
in c
atch
men
ts,
e.g.
cha
ngin
g hy
drol
ogic
al
flow
pa
ttern
s du
e to
la
rge
scal
e
abst
ract
ion
mig
ht
favo
ur
alie
n sp
ecie
s du
e to
di
stur
banc
e of
the
flow
reg
ime
• Im
plem
ent
wee
d m
ana
gem
ent p
rogr
ams
• E
nsur
e th
at d
istu
rbed
are
as h
ave
been
reh
abili
tate
d to
av
oid
prov
idin
g a
com
petit
ive
adva
ntag
e to
al
ien
spec
ies
Nat
iona
l E
nviro
nmen
tal
Man
agem
ent:
Bio
dive
rsity
A
ct
and
Nat
iona
l E
nviro
nmen
tal
Man
agem
ent:
Pro
tect
ed
Are
as
Act
• U
nder
stan
d th
e cu
mu
lati
ve
impa
ct
of
Esk
om’s
w
ater
foo
tprin
t on
pro
tect
ed a
nd v
ulne
rabl
e ar
eas
due
to:
o
Hab
itat/
wet
land
des
truc
tion
o
seco
ndar
y im
pact
s re
late
d to
op
erat
ions
su
ch
as
pollu
tion
and
dist
urba
nces
to
w
etla
nd a
ssoc
iate
d sp
ecie
s
• M
onito
ring
and
man
agem
ent o
f im
pac
ts
Pu
blic
Infr
astr
uct
ure
Ph
ysic
al In
fras
tru
ctu
re
Issu
e E
sko
m H
ead
Off
ice
res
po
nsi
bili
ties
O
n-s
ite
res
po
nsi
bili
ties
A.
W
ater
su
pply
pr
ovis
ion
(IB
Ts,
da
ms,
can
als,
)
• Li
aise
with
res
pons
ible
aut
horit
ies
over
pla
nnin
g an
d m
aint
enan
ce is
sues
•
Pro
per
mai
nten
ance
of
in
fras
truc
ture
. M
aint
ena
nce
shou
ld b
e do
ne i
n lin
e w
ith a
ppro
ved
envi
ronm
enta
l pr
oced
ures
.

234
• F
utur
e W
ater
Use
Lic
ence
App
licat
ions
sho
uld
incl
ude
proc
edur
es f
or t
he m
ain
tena
nce
of i
nfra
stru
ctur
e (e
.g.
wat
er
pipe
s th
roug
h w
etla
nds)
to
en
sure
th
at
imm
edia
te
actio
n ca
n be
ta
ken
to
resp
ond
to
infr
astr
uctu
re fa
ilure
s
Pu
blic
Infr
astr
uct
ure
So
cial
-In
stit
uti
on
al R
ule
s –
Nat
ion
al P
olic
y an
d L
egis
lati
on
Esk
om
Hea
d O
ffic
e re
sp
on
sib
iliti
es
DW
A:
The
re a
re a
num
ber
of b
est
pra
ctic
e gu
idel
ines
on
the
DW
A
web
site
. R
elev
ant
docu
men
ts s
houl
d be
bro
ught
to
the
atte
ntio
n of
en
viro
nmen
tal m
anag
ers.
Giv
e in
put
into
the
DW
A p
roce
dure
s w
here
rel
evan
t. T
his
may
be
do
ne th
roug
h a
subj
ect m
atte
r ex
pert
who
is a
ble
to w
ork
natio
nally
.
Ens
ure
that
the
env
ironm
enta
l m
anag
ers
get
the
nece
ssar
y su
ppor
t, in
clud
ing
trai
ning
, to
be a
ble
to c
ompl
y w
ith D
WA
req
uire
me
nts.
DE
A:
Coo
rdin
ate
the
nece
ssar
y ap
plic
atio
ns f
or t
he E
IA a
nd
EM
P a
s re
quire
d.
Nat
iona
l E
nviro
nmen
tal
Man
agem
ent
: W
aste
Act
(A
ct 5
9 of
200
8):
Com
pile
cor
pora
te b
est
prac
tice
guid
elin
es o
n de
alin
g w
ith w
aste
and
co
ntam
inat
ed la
nd,
ther
eby
min
imis
ing
impa
cts
on w
ater
qua
lity
acro
ss
the
catc
hmen
ts w
ithin
whi
ch E
skom
ope
rate
s an
d pr
ovid
e t
rain
ing
of
on-s
ite p
erso
nnel
as
nece
ssar
y.
Coo
rdin
ate
appl
icat
ions
for
the
nece
ssar
y au
thor
isat
ions
.
Nat
iona
l Env
ironm
enta
l Man
agem
ent:
Air
Qua
lity
Act
(A
ct 3
9 o
f 20
04):
U
nder
stan
d th
e im
pact
of
the
dry
fall-
out
and
was
h-ou
t of
em
issi
ons
as
wel
l as
the
im
pact
of
part
icul
ate
mat
ter
and
aero
sols
orig
inat
ing
from
E
skom
act
iviti
es o
n th
e ca
tchm
ent
SE
S,
incl
udin
g hu
man
, an
imal
and
ec
osys
tem
hea
lth.
Con
serv
atio
n of
Agr
icul
tura
l Res
ourc
es A
ct,
1983
(A
ct N
o 4
3 of
198
3):
U
nder
stan
d an
d m
anag
e n
atio
nally
the
influ
ence
of E
skom
act
iviti
es o
n th
e co
nditi
ons
whi
ch m
ay f
avo
ur t
he
infe
stat
ion
and
disp
ersi
on o
f al
ien
inva
sive
spe
cies
Nat
iona
l Env
ironm
enta
l Man
agem
ent:
Bio
dive
rsity
Act
(A
ct 1
0 of
200
4)
and
Nat
iona
l Env
ironm
ent
al M
anag
emen
t: P
rote
cted
Are
as A
ct (
Act
57
of
2003
):
B
e aw
are
of
the
cum
ula
tive
im
pact
of
E
skom
’s
wat
er
foot
prin
t an
d th
e ef
fect
of
this
on
the
cum
ulat
ive
wat
er r
eso
urce
and
aq
uatic
eco
syst
em s
ervi
ces
in t
he c
atch
men
t w
hen
the
impa
cts
of
othe
r us
ers
are
take
n in
to a
ccou
nt.
Cum
ulat
ive
impa
cts
shou
ld b
e m
anag
ed a
t the
cat
chm
ent l
evel
.

235
On
-sit
e re
sp
on
sib
iliti
es
DW
A:
Arr
ange
for
the
WU
LA t
o be
dev
elop
ed.
It
is im
port
ant
that
the
W
ULA
in
clud
es
mai
nten
ance
an
d em
erge
ncy
proc
edur
es
as
they
ap
ply
to w
etla
nds
to a
void
hav
ing
to a
pply
fo
r a
new
W
UL
whe
n
mai
nten
ance
req
uire
men
ts a
rise
in a
wet
land
. I
n ca
se w
here
a W
UL
is
alre
ady
in p
lace
the
n it
is a
dvis
able
to
appl
y fo
r am
endm
ent
toge
ther
w
ith a
n E
MP
to
perm
it ra
pid
acce
ss to
a s
ite r
equi
ring
mai
nten
ance
.
The
env
ironm
enta
l m
anag
er s
houl
d be
aw
are
of t
he R
(W)Q
Os
and
co
mpl
y w
ith t
hese
.
DE
A:
Ide
ally
, th
ere
shou
ld b
e no
net
loss
of
wet
land
s. W
here
pos
sibl
e ac
tiviti
es i
mpa
ctin
g on
wet
land
s sh
ould
be
avoi
ded.
W
here
thi
s is
not
po
ssib
le i
mpa
cts
shou
ld b
e m
itiga
ted
and
only
as
a la
st r
esor
t w
ill a
n of
fset
be
cons
ider
ed.
Ens
ure
that
EIA
and
EM
P a
re in
pla
ce a
s m
ay b
e r
equi
red.
Nat
iona
l E
nviro
nmen
tal
Man
agem
ent
: W
aste
Act
(A
ct 5
9 of
200
8):
Con
ditio
ns o
f w
aste
man
agem
ent
licen
ses/
auth
oris
atio
ns s
houl
d be
in
corp
orat
ed i
nto
the
envi
ronm
enta
l m
anag
eme
nt s
yste
m o
f th
e si
te
unde
r co
nsid
erat
ion.
Dev
elop
app
ropr
iate
sta
ndar
d op
erat
ing
proc
edur
es b
ased
on
the
best
pr
actic
e fo
r w
aste
avo
idan
ce,
min
imis
atio
n, r
e-us
e an
d re
cycl
ing,
as
laid
out
in th
e E
skom
gui
delin
es,
Nat
iona
l Env
ironm
enta
l Man
agem
ent:
Air
Qua
lity
Act
(A
ct 3
9 o
f 20
04):
Im
plem
ent
the
actio
ns r
equi
red
by r
elev
ant
auth
oris
atio
ns a
s w
ell
as
the
guid
ance
fro
m h
ead
offi
ce,
ensu
ring
effic
ienc
y of
ope
ratio
n w
here
po
ssib
le.
Con
serv
atio
n of
Agr
icul
tura
l Res
ourc
es A
ct,
1983
(A
ct N
o 4
3 of
198
3):
Im
plem
ent
alie
n in
vasi
ve m
anag
eme
nt p
rogr
amm
es in
con
junc
tion
with
W
orki
ng
for
Wat
er
and
Wor
king
fo
r W
etla
nds.
A
part
of
th
is
inte
rven
tion
shou
ld b
e to
ens
ure
that
dis
turb
ed a
reas
are
reh
abili
tate
d us
ing
vege
tatio
n in
dige
nous
to
the
area
und
er c
onsi
dera
tion.
Nat
iona
l Env
ironm
enta
l Man
agem
ent:
Bio
dive
rsity
Act
(A
ct 1
0 of
200
4)
and
Nat
iona
l Env
ironm
ent
al M
anag
emen
t: P
rote
cted
Are
as A
ct (
Act
57
of 2
003)
: I
mpl
emen
t a
mon
itorin
g sy
stem
tha
t w
ill e
ffect
ivel
y m
easu
re
the
impa
ct t
hat
Esk
om a
ctiv
ities
are
cau
sing
. W
here
pos
sibl
e, t
he
resu
lts o
f th
e m
onito
ring
prog
ram
me
ma
y be
fed
into
a c
atch
men
t-w
ide
syst
em.
Pu
blic
Infr
astr
uct
ure
Ph
ysic
al In
fras
tru
ctu
re
Esk
om
Hea
d O
ffic
e re
sp
on
sib
iliti
es
Liai
se
with
th
e re
spon
sibl
e au
thor
ities
ov
er
the
plan
ning
an
d
mai
nten
ance
of t
he in
fras
truc
ture
del
iver
ing
wat
er to
pow
er s
tatio
ns.
Liai
se w
ith t
rans
port
aut
horit
ies
on t
he c
onst
ruct
ion
and
mai
nten
ance
of
roa
d an
d ra
il in
fras
truc
ture
, esp
ecia
lly w
here
wet
land
s ar
e af
fect
ed.
Res
ou
rces
:
SA
NB
I and
DW
S, 2
014.
WR
CS
– h
ttp:
//ww
w.d
waf
.gov
.za/
RD
M/d
ocu
me
nts/
vol0
1com
plet
e.pd
f

236
5.6 USING THE FRAMEWORKS
The information contained in Table 36 to Table 40 (The resource), Table 41 (The resource users), Table 42(The Infrastructure providers) and Table 43 (The public infrastructure;) provides guidance into the contribution that Eskom may make to the sustainable planning and management of a socio-ecological system (SES), be it catchment-wide or confined to a more limited area.
Notes on populating the Framework
Define the boundaries of the SES which is to be assessed. This may be a single wetland, a sub-catchment or it may be a larger area.
Once the system has been bounded, then the resource should be defined in terms of the ecosystem services provided by the wetlands within the bounded area. Those services either used by Eskom or which Eskom’s activities can influence need to be noted.
The resource users in the SES need to be identified. The public infrastructure providers make the rules which govern the resource users. A point to be noted is the opportunity for input by the resource users to the governance process.
The public infrastructure consists of two components. The social-institutional rules (laws and conventions) may be mandated by government departments or stakeholder organisations (such as the Olifants River Forum). The physical infrastructure consists of the IBTs, dams, canals and other physical infrastructure related, in this case, to water supply and distribution. Both components of the public infrastructure need to be identified.
Having identified the component parts of the SES the relationships between them may be defined.
The quantity of ecosystem services that can be provided by an ecosystem is finite, but the services may be distributed in different ways. Thus, increasing the use of some services will decrease the availability of others. The questions probing the relationship between the resource and its users (Arrow 1) will highlight these options and provide some insight into which services are more important within the SES under consideration. While the public infrastructure may alter the resource (Arrow 4) and impact the resource users directly (Arrow 6), the relationship between the resource and resource users is influenced by the way in which the public infrastructure is managed (Arrow 5).
The role played by Eskom should be noted for each part of the framework. From this it will be possible to assess the role of Eskom within the SES being assessed and to see how this may be changed as required.

237
Figure 37: An overview of the steps involved in using the Framework
Define SES boundary
Define ecosystem services of the SES
Identify resource users of the SES
Understand the rules of and involve the public infratructure providers
Define the interrelationships
Define how resource use by one user will impact on resource availbaility/use of other users

238
5.7 CASE STUDY: POPULATING THE ANDERIES FRAMEWORK FOR MATLA PS AND ESKOM
Introduction
The Anderies framework (Figure 38) has been used in order to identify and link all the activities within a social ecological system (SES). This framework will enable users to locate themselves within the web of relationships of a SES and so understand the role(s) that they play in the efficient functioning of the SES. This case study has been developed as a desk-top exercise to illustrate how the Anderies framework (Figure 38) and the MEA framework (Figure 39) may be used to locate an entity (in this case the wetlands on Matla Power Station property and Eskom) in the SES within which in operates.
Figure 38: The Anderies Framework
Figure 39: The Millennium Ecosystem Assessment Framework
Documents used in this study
The following documents from this project have been used to provide the basic material for this case study:
1. Chapter 3 – Sustainable Environmental planning framework with a catchment perspective (Operational stage).
2. Chapter 4 – Reports of selected case studies where the robustness of the environmental conservation framework was tested – Wetland management plan for Matla Power Station.

239
3. Chapter 5 – the interactions described in the earlier sections of this chapter. It should be recognised that while some of the responsibilities will apply to all Eskom properties, others will be site specific.
The primary focus of this case study is on wetlands with a secondary focus on the water resource. The resource is defined in terms of the ecosystem services (ES) that are delivering benefits to the SES as bounded below. The level of detail for the Matla PS is much higher than that for the surrounding SES.
A full study would require on-the-ground knowledge of the SES at a sufficient level to assess the relative influences of the wetlands on the SES. This case study has been done without communication with the stakeholders of the wider SES and is given as an example only.
Summary of findings of the case studies
Defining the boundary of Matla Power Station
Matla Power Station is bounded by quaternary catchments B11E and B11D as shown in Figure. Key points of the report are summarised below.
Figure 40: The primary and quaternary catchment associated with Matla PS and the neighbouring power stations
Matla PS is situated at the very top of the Olifants catchment close to the watershed between the Olifants and the Vaal (Figure 40). Runoff from Matla drains into the Rietspruit, a tributary of the Steenkoolspruit which in turn drains into the Olifants River upstream of Witbank Dam.
In this area, the main socio-economy activities are 2 Power stations (Matla and Kriel), open-cast coal mines, urbanisation and agriculture (taken from Google Earth imagery).
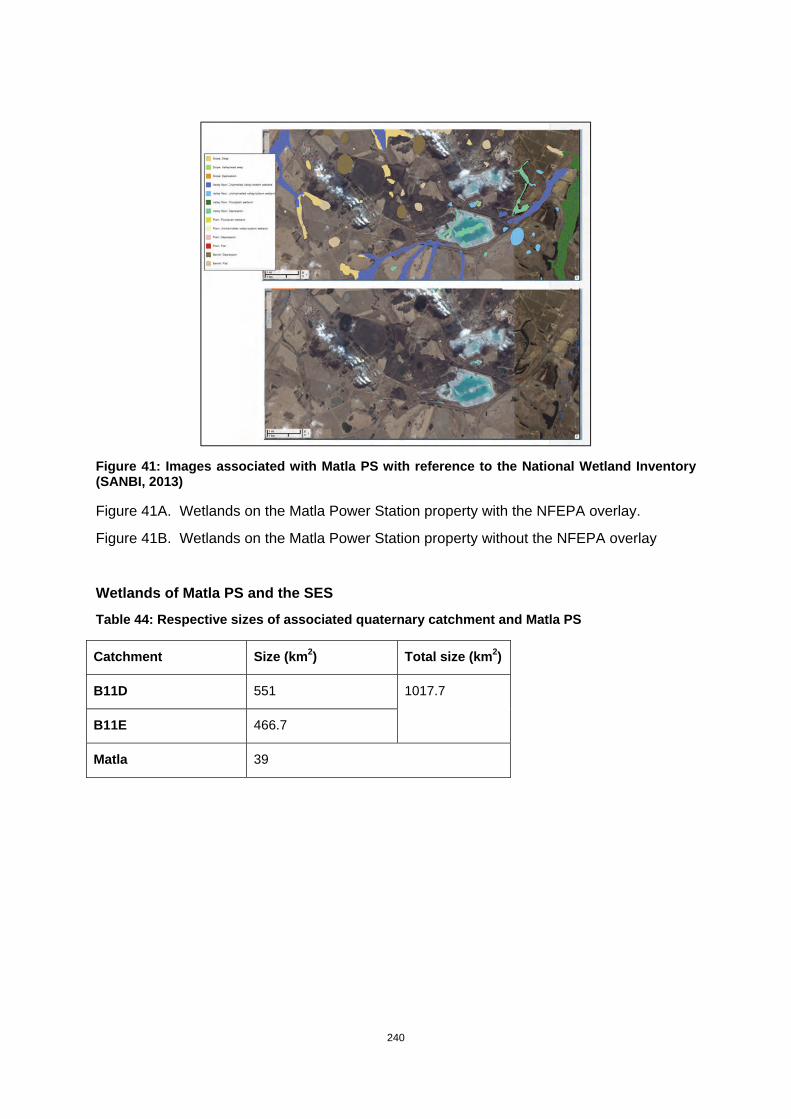
240
Figure 41: Images associated with Matla PS with reference to the National Wetland Inventory (SANBI, 2013)
Figure 41A. Wetlands on the Matla Power Station property with the NFEPA overlay.
Figure 41B. Wetlands on the Matla Power Station property without the NFEPA overlay
Wetlands of Matla PS and the SES
Table 44: Respective sizes of associated quaternary catchment and Matla PS
Catchment Size (km2) Total size (km2)
B11D 551 1017.7
B11E 466.7
Matla 39

241
Table 45: Surface area of wetlands in the SES and on the Matla property
Wetland category Area in SES (km2) Area on Matla (km2)
Natural wetlands
Channelled Valley bottom 47.81
Depression 5.71 1.54
Flat 11.79 0.47
Floodplain wetland 45.26
Seep 22.41 0.4
Unchannelled valley bottom 2.08 0.39
Valleyhead seep 0.88 0.01
Total 135.94 2.81
Artificial wetlands
Unchannelled valley-bottom wetland 0.91 0.06
Seep 4.22 0.23
Floodplain wetland 1.70
Flat 1.44 0.15
Channelled valley-bottom wetland 4.46 0.07
Total 12.73 0.51
Wetlands as a percentage of the total area 14.61 8.51
The bar chart (Figure 42) compares the distribution of the various wetland types between the Matla PS and the SES. The Matla PS is in the Olifants River basin close to the watershed with the Vaal River basin. The SES includes some larger drainage lines which accounts for the differences in occurrence as the floodplains and channelled valley bottom wetlands tend to occur on the larger drainage lines while depressions (or pans) occur only where the gradient is less than 1% (i.e. areas that are almost level). This clearly illustrates the importance of the upper catchment area in providing the depressions and unchannelled valley bottom wetlands.

242
Figure 42: A comparison of relative wetland surface area between the Matla PS property and the SES (Quaternary catchment B11D and B11E)
Note for Figure 42: Matla surface area – Area of the wetland type which occurs on Matla PS property; Matla % – The percentage of the total area of the particular type of wetland (for the SES) occurring on Matla property; Catchment surface area – the total area of the wetland type occurring in the SES.
The different types of wetlands offer different levels of ecosystem services, and wetlands in healthy condition provide more benefits than those in poor condition. For a brief description of 17 common ecosystem services see Appendix A to this document.
The population of the framework below is guided by the questions as given in Appendix B of this document.
Populating the Frameworks
This section needs to be developed in conjunction with the list of questions which give guidance on what should be considered during the population of each section of the framework. Figure 43 illustrates possible areas where Eskom may become involved in the Framework with specific reference to Matla PS where relevant.
0.00 10.00 20.00 30.00 40.00 50.00 60.00
DepressionFlat
SeepUnchannelled valley bottom
Valley headChannelled Valley bottom
Floodplain wetland
Matla Surface area (km2) Matla % Catchment Surface area (km2)

243
Fig
ure
43:
Po
ssib
le a
reas
of
invo
lve
men
t fo
r E
sko
m in
th
e M
atla
Wet
lan
ds
case
stu
dy,
as
def
ined
by
the
An
der
ies
Fra
mew
ork

244
Box A – The resource
The resource on Matla property is wetlands. The area of wetlands is small compared to the area in the SES, but the uniqueness is that large percentages of unchannelled valley bottom and depression wetlands in the SES occur on the Matla property. Unchannelled valley bottom wetlands are very effective in removing pollutants and nutrients from the water, as well as in the moderation of extreme events especially flood attenuation, as water does not pass through these wetlands rapidly and is released more slowly over a period after high flow. These wetlands, apart from the depressions, are part of the larger Olifants River system. The ES of improved water quality and flood attenuation benefit all users in the SES.
The status of the resource is not known.
Eskom’s role in the SES is the conservation of wetlands important for the maintenance of good water quality as well as the moderation of extreme events in the SES.
Box B – The resource users
The ES are used by all residents in the SES. Flood attenuation benefits water quality, soil fertility, agriculture, urban and mining investments. The influence of the IBT from the Vaal should be taken into consideration at this point.
Eskom has a dual role in the SES, that of the conservator of ecological infrastructure and that of a beneficiary of the ES.
Box C – Public infrastructure providers
National government departments are largely responsible for governing resource use in the SES, although local government has the important role of maintaining environmental quality in their areas of jurisdiction. Large industries such as Eskom and the mining houses also play a role through their in-house policies on resource management. An important role that large industries can play is that of advocacy to ensure that the wetlands and water resource in the catchment are managed sustainably.
The role of Eskom in this section is, in part, conservation of the resources on Eskom property. It could also address the activities in the supply chain to ensure that their activities considered the sustainability of their operations. Eskom is also in a strong position to provide advocacy to national and local government to ensure that the wider catchment is maintained in the desired condition.
Box D – Public infrastructure
Institutional
Wetland and water users and those whose activities impact on wetlands need to be aware of the various pieces of legislation with which they need to comply.
From the Eskom point of view Kusile PS has had to work closely with the relevant legislation and policies and the Kusile Power Station Wetland Management Strategy (Harris et al., 2013; Document No. MTPB-ESK031-0013) gives guidance in this regard (See Section 8.4 and Table 10 of the document title ‘Report on the outcome of testing the sustainable environmental planning framework within a catchment perspective’).

245
Physical infrastructure
The category ‘Physical infrastructure’ covers such infrastructure as dams, canals and pipelines. These may be on- or off-site and may serve one or more users. The physical infrastructure should be maintained in good condition to keep water loss at a minimum.
The role that Eskom could play is to ensure compliance with the institutional infrastructure as well as to ensure compliance of the organisations in its supply chain with relevant institutions. Eskom could also ensure that physical water supply infrastructure is maintained in good condition.
A point that has come to the fore with PS that have been operating since before the enforcement of the current legislation is that the water use License (WUL) for any infrastructure should include a clause permitting the repair of infrastructure without the necessity of re-applying for permission to do so. This will ensure that emergencies can be dealt with immediately.
Arrow 1 – The relationship between the users and the resource
Who else, apart from Eskom, is using the resource? In situations where an inter-basin transfer of water is occurring, users in the donor basin should also be considered. Where the resource use has changed over time, this needs to be assessed in the light of possible changes to priorities in resource use. The rights of the various users need to be considered.
In the case of Eskom the wetlands on the Matla site are not used by Matla PS to any great extent, but provide ES to other users in the basin. It is required by the legislation that these be conserved.
Arrow 2 – The relationship between users and public infrastructure providers
Do the users (Eskom included) play a role in the decision-making on the use of wetlands and the water resource on Matla PS? If not, how are the rules made?
In Eskom’s place, is there opportunity for Eskom to get involved in the activities of the Catchment Management Agency or other forums where wetland and water resource use is discussed/decided?
Arrow 3 – The relationship between public infrastructure providers and public infrastructure
Eskom could monitor the performance of infrastructure on which it depends and ensure its maintenance as necessary. Where possible, Eskom may get involved in the governance of the river basin, so having the opportunity to make input into the rules governing the service delivery.
Arrow 4 – The relationship between public infrastructure and the resource
The monitoring programme should be designed in such a way as to be able to measure changes in the resource that could result from the rules and physical infrastructure. This data may then feed back into the governance system with a view to optimising the system.
Arrow 5 and 6 – The relationship between public infrastructure, and the resource and the users
Are the rules of use fair to all users? If they are not, then how may the situation be addressed.
246
Eskom, as a major stakeholder in the catchments where it is active, may be able to lead the way in optimising the management of wetlands and the water resource, guiding the development of new rules where necessary for improved wetland and water resource management.
Arrows 7 and 8 – The impact of external driving forces on any component or any relationship within the system
The risks of external factors such as floods and droughts or climate change in the longer term (Arrow 7) or a downturn of the economy (Arrow 8) to activities within the catchment need to be taken into account, and a role that Eskom might play in this situation would be to lead the planning of contingencies to cope with these risks.
5.8 CONCLUSIONS
Eskom Holdings makes an absolutely critical contribution to the socio-economy of South and southern Africa. The footprint of Eskom’s generation and transmission infrastructure covers the entire country. Eskom is the largest single industrial water user, accounting for in the order of 1.5% of the total South African water consumption (http://www.eskom.co.za/OurCompany/SustainableDevelopment/Pages/Reduction_In_Water_Consumption.aspx). Through mechanisms such as the inter-basin transfer of water, the geographical extent of the water footprint is much greater than just the river basins in which power stations are sited. In addition, atmospheric circulation spreads the impact of the coal-fired power stations on air quality beyond the catchments in which the power-generating infrastructure is sited. Although Eskom anticipates that its water use will increase in coming years as a result of increasing demand, it is committed to reducing the volume of water required for power generation per kWh. Eskom aims to bring down water consumption per unit of electricity produced from the current 1.35 litres per kWh to 0.99 litres per kWh in 2030, representing a reduction of approximately 26%.
Eskom is signatory to the UN CEO Water Mandate and this document seeks to clarify how the commitment to use water more efficaciously may be implemented within the Holdings and within the wider socio-economic community with which it interacts. In Table 36 to Table 43 above, the document indicates how Eskom head office may provide structure to their pro-active leadership both within the Holdings and in its interactions with the other water users in the river basin active in the conservation and sustainable management of natural resources as well as water conservation and demand management. This will sanction the activities of the environmental personnel on site in the performance of their duties.
This document provides some insight into how Eskom may mesh its activities with other water users in order to improve, or at least maintain, the quality of the ecosystem services that the ecological infrastructure provides to the socio-economy. Two frameworks are provided in order to do this, and guidance is given on how to determine how Eskom’s activities fit into the frameworks as well as how to determine how the activities of the other users fit into the frameworks. This enables planners to take account of the needs of all the users in the river basins under consideration.
The water shortages projected for the country (NWRS 2, 2012) demand that South Africa implements water conservation and demand management interventions. Eskom has set the

247
ambitious target of reducing water us to 1.201 ℓ kWh-1 by 2017. As a large user of water the strict management of its water use will contribute to national water savings.

248
6 FUTURE RESEARCH NEEDS WITHIN THE WATER-ENERGY NEXUS With recommendations for further research within the green economy context, including impacts of and adaptation to climate change
6.1 FUTURE RESEARCH
Introduction
As described in the Introduction to this report (Chapter 1), the water supply crisis is ranked amongst the top five global risks both in terms of its likelihood to happen as well as its impact by the World Economic Forum 2013 report. Global freshwater demand is projected to exceed current supply by 40% by 2030. To quote the WWF (2014), ‘South Africa is a chronically water stressed country with huge economic development pressures and social upliftment challenges.
The Johnson Foundation (Johnson, 2014) report covers the result of a think tank which involved 400 water professionals and experts over a six year period to review the freshwater situation in the United States of America in recognition of the fact that ‘without significant changes, existing water systems will soon no longer be able to provide the services that citizens have come to expect’. They developed the following guiding principles for the future of US freshwater resources:
• Forge partnerships and collaborate to solve problems
• Develop integrated solutions
• Incentivise and promote innovation
• Highlight multiple benefits
• Recognise the value of water
• Plan for adaptation to and mitigation of climate change impacts
• Balance human and environmental needs
• Design infrastructure to restore ecosystem function
• Prioritize local water sources
• Redefine “waste” as valuable resources
• Right-size water systems and services
• Tap into sustainable financing streams
• Ensure accountability.
Within these guiding principles there are five key areas of recommendations changes or improvements need to be made to ensure sustainability of freshwater:
1. Optimize the use of available water supplies
2. Transition to next-generation wastewater systems
3. Integrate the management of water, energy and food production
4. Institutionalize the value of water
5. Create integrated utilities.
Each of these key areas has a number of subsections outlining actions which will contribute to the sustainability of water resources.

249
These guiding principles and key areas apply equally well to the South African situation. Where appropriate for Eskom, the guiding principles and key areas for change have been included in the recommendations for future research below.
• National Water Resource Strategy (NWRS) 2
South Africa’s water scarcity creates the imperative for increasing the efficiency of water use. Eskom is proactive in this and, in addition to being signatory to the UN CEO Water Mandate, has formed water management task teams to improve the efficiency of water usage. The current target for water use, utility-wide, is 1.32 ℓ kWh-1. The target set for 2017 is 1.20 ℓ kWh-1 (Divisional Report Key indicators, 2012). This target puts pressure on Eskom Holdings to implement effective water conservation and water demand management across all their activities. However, dry cooling power stations use considerably less water, with Matimba Power Station, the largest dry-cooled power station in the world, using 0.1 ℓ kWh-1. Medupi PS and Kusile PS will both use dry-cooling technology. In the face of climate change projections, the imperative to increase the efficiency of water use may be a higher priority than is accorded by these figures.
Eskom is a strategic water user, but this does not absolve Eskom Holdings from using water responsibly. The NWRS 2 (2012) recognises the cardinal role of water in the South African socio-ecological system and has articulated a number of core strategies as given in Text Box 1. All of these are relevant to Eskom’s business. It should be noted that both water quality and water quantity are seen as critically important for the sustainable growth of the country as proposed in the National Development Plan and the New Growth Plan.
Text Box 1
Core strategies (NWRS 2, 2012)
1. Implementation of Equity Policy;
2. Putting water at the centre of integrated development planning and decision-making;
3. Ensuring water for equitable growth and development;
4. Contributing to a just and equitable South Africa;
5. Prioritising and ensuring the implementation of water conservation and demand management;
6. Optimizing and stretching of our available water resources (groundwater, water re-use, desalination (including seawater), water systems optimization and rainwater harvesting);
7. Committing to the protection of our water resources and ecosystems;
8. Achieving effective and smarter water governance;
9. Embedding sustainable business principles and practices in water resources and systems management;
10. Implementing a water sector investment framework for infrastructure, human resource capacity and institutions;
11. Engaging the private and water use sectors.

250
Collectively, wetlands in a catchment can have a positive impact on water quality, with the degree of impact varying with the type of wetland. Bullock & Acreman (2003), in a review of published results from 439 wetlands in 169 studies found that while wetlands had a strong influence on the hydrology of the drainage, the actual effect depended on factors such as the type of wetland and its position in the drainage line.
The extent of wetland surface area required to maintain or improve water quality in a catchment is dependent on a large number of variables, such as:
a) The nature of the water quality problems experienced in the catchment
b) The hydro-geomorphic position of wetlands in the landscape
c) The relative position of wetlands with reference to any pollution sources in a catchment.
The Resource Quality Objectives set for a catchment can also provide further guidance as to the critical extent of wetland surface area that will be required. It is acknowledged that at this stage, the matter of required wetland surface area vs. catchment surface area with respect to the delivery of ecosystem services is “blue sky” and that each catchment being unique and dynamic, will require dedicated studies.
An observation of the levels of development in a catchment as well as the temporal and spatial nature of water quality constituents is an important starting point. Should any of the aforementioned criteria have a significant negative trend, a joint investigation with suitable stakeholders should be undertaken to determine the optimal wetland surface area, wetland types as well as levels of wetland health that will be required to sustain or improve water resource quality in a catchment.
A useful method in this regard is to link wetland health and the provision of ecosystem services to national land cover change data sets, which are readily available. Land cover is used as an indicator of impacts on hydrological functioning and through consulting numerical metrics predefined by Ellery et al., loss of wetland functionality can be deduced. Using coarse-resolution land cover categories as a basis to assess impacts to wetlands is a very basic tool, however given the broad scale at which it will be applied, it will generally be sufficiently accurate for the purpose of strategic assessments (Ellery et al., 2009).
The matter of surface water pollution is by default a critical issue in catchments such as the Upper Olifants, Inkomati and Upper Vaal, given the extent of both point and non-point sources of pollution. Mitch and Gosselink (2000) stated that on average at least 5% of temperate-zone watersheds should consist of wetlands in order to optimise ecosystem services derived from wetlands (This figure will vary, however, depending on wetland type, catchment characteristics and water resource objectives). Palmer et al. (2002) estimated that 9.9% of land surface of the upper Olifants (Mpumalanga) is covered by wetlands. Bullock and Acreman (2003) state that, globally, wetlands cover about 6% of the land surface.
Whilst several authors have indicated the importance of the integration of wetlands into catchment planning (see, for instance, Dickens et al., 2003), an explicit methodology linking the Resource Directed Measures (RDM) or Resource Quality Objectives (RQO) to a percentage of wetland surface area in a catchment is largely lacking. The same can be said of other ecosystem services provided by wetlands, such as flood attenuation in urban

251
catchments with extensive hard surfaces that have replaced permeable surfaces for ground water infiltration.
A range of land cover classes based on the National Land Cover database for South Africa have been identified with respect to their impacts on water inputs to, and retention of water within, wetlands. If present in the catchment, these land cover classes can either increase or decrease water inputs to a wetland, or if present in a wetland itself, they can increase direct water losses from the wetland, reduce surface roughness, impede the flow of water in a wetland or enhance the flow of water in a wetland. The effect of each category of land cover change from the natural condition on each of these parameters has been assigned an intensity of impact score. The loss of function metric (Ellery et al., 2009) describes the relationship between the magnitude of impact score and wetland functionality for a total of 6 ecosystem services: flood attenuation, stream-flow regulation, sediment trapping, nitrogen removal, phosphate removal and toxicant removal. The authors determined numerical relationships between intensity of impact scores and impact on wetland services which are consulted in order to determine the loss of function metric.
6.2 IDENTIFICATION OF FUTURE RESEARCH NEEDS
It has been said there are two ways to achieve change — through crisis or through leadership. Freshwater is too important to our ecosystems, communities and national security to wait for a crisis.
Johnson Foundation, 2014
Gone are the days when individual economic sectors could plan their developments in isolation from other sectors. Pressure on the resources has reached the point where the use by one activity will impact on the availability of the resource to others.
There is a need to investigate ways in which economic growth may be decoupled, at least partially, from resource availability.
In recognition of the projected water shortages in the USA the Johnson Foundation convened a series of working conferences in which they brainstormed the challenges facing the social-ecological system and how these may be addressed. The report lists a number of guiding principles as well as a number of specific recommendations (Text box 2). It would be worthwhile for South Africa to benchmark against these principles and recommendations. The legislation and the institutions are in place but the implementation is not yet complete.
Text box 2
Recommendations to catalyse change and Key Ideas for improving water management (Johnson Foundation, 2014)
Each of these recommendations to catalyse change and key ideas is described in detail in the Johnson (2014) report.
1. Optimize the use of available water supplies
a. Increase the Efficiency of Water Distribution Systems

252
b. Establish Water Rates and Other Fees that Drive Conservation and Efficiency
c. Implement Policies and Programs to Stimulate Efficient Water Use
d. Expand Adoption of Water-Wise Agricultural Practices
e. Diversify Supply Portfolios with underused Water Sources
f. Reclaim and Reuse Water from Wastewater
g. Match the Right Quality Water to the Right Use
2. Transition to next-generation wastewater systems
a. Prevent Clear Water from Entering Sewer Systems
b. Complement Centralized Wastewater Infrastructure with Distributed Systems
c. Maximize Resource Removal and Recovery from Wastewater
d. Develop Energy-Positive Wastewater Treatment Facilities
3. Integrate the management of water, energy and food production
a. Improve Energy Management at Water and Wastewater Utilities
b. Prioritize Water-Smart Electric Power
c. Recover nutrients and energy from agriculture
d. Plan for sustainable rural water supplies
4. Institutionalise the value of water
a. Tap New Sources of Capital and Use Innovative Financing Mechanisms for Infrastructure Upgrades
b. Institute Sustainable Pricing for Water Services
c. Leverage Market Mechanisms to Account for the Value of Ecosystem Services
d. Create a Culture in Which Water Services Are Highly Valued
5. Create integrated utilities
a. Create New Design Principles and Evaluation Criteria
b. Transform Utilities from Service Providers into Resource Managers
c. Develop New Business Models and Regulatory Schemes
d. Cultivate Resource Management Partners and Customers of the Future
Some of the ideas below will require new research, others will require the repackaging (data mining) of existing research and presentation in a way that enables their implementation. Both of these are valid. Again, some of the research needs presented below would be implemented within Eskom while others will entail Eskom working with other stakeholders. Although the ideas have been listed and introduced separately, it may well be pragmatic to combine some of them.

253
6.3 ON ESKOM PROPERTY
The role of ecological infrastructure
What is the actual and potential role that ecological infrastructure can play in supporting, enhancing and sustaining Eskom’s built infrastructure for energy generation? Such an approach should look all the way along the supply chain. Water quality is one aspect, together with topics such as the impact of sediment on hydropower generation, the management of servitudes, etc. The costs and benefits of maintaining ecological infrastructure and the potential costs of not addressing the risks posed by degraded ecological infrastructure should form part of the study. This study should consider how maintaining ecological infrastructure can contribute to the transition to a green economy.
Soil carbon
Wetlands are important agents of carbon sequestration. As an example, carbon sequestration is one ecosystem service provided by wetlands and Euliss et al. (2006) found that wetlands in the prairie regions of North America sequestered twice the carbon as no-till cropland on 17% of the area. Also, carbon may be released when wetlands are disturbed. Eskom’s emissions account for nearly half South Africa’s total carbon emissions. The role of South African wetlands in carbon sequestration is not known, although international literature informs us that it is important, with peatlands being the most important of all.
The need is for knowledge of the carbon content of wetland soils on Eskom sites, and how this needs to be managed so that the sequestration capacity is improved, not lost.
The benefits and costs of rehabilitation
Ecological restoration is becoming regarded as a major strategy for increasing the provision of ecosystem services as well as reversing biodiversity losses and the benefits of restoration can outweigh the costs (Bullock et al., 2011).
What are the benefits and costs of rehabilitation/restoration of wetlands, and is there a case for making the rehabilitation/restoration of wetlands (and the wider environment) not negotiable?
(I ask this question because a common response to the need to rehabilitate environmental impacts (including treating waste before discharge to the environment) is that it is not cost effective).
Impacts on Ramsar sites
Eskom has a national footprint. Most of the coal-fired power stations are situated on the Mpumalanga Highveld, but the distribution system is national, with approximately 30 000 km of power line servitudes as well as strategically placed substations. The most efficacious route for the servitudes to follow is the direct route. This means that servitudes will cross any rivers or wetlands that may lie in their path.

254
South Africa has 21 Ramsar sites totalling 554 136 ha (2014). South Africa’s policy regarding development in or around wetlands is firstly to avoid impacts, secondly, to mitigate impacts and thirdly, to offset impacts where either of options 1 or 2 are unachievable. The Ramsar Convention offers a number of guidelines on wetland management and the management of impacts.
Best practice guidelines need to be developed for addressing this situation when and where it arises. These guidelines should consider both the requirements of the Ramsar Convention and the national policy and legislation.
Consideration of possible future changes in wetland or water policy and legislation
Water policy, legislation and management is dynamic and evolving. In relation to wetlands there are currently WRC projects that are potentially leading into ways of managing the challenges that we recognise. The projects K5/2200 (Development of a methodology to determine the appropriate buffer zone width and type for developments associated with wetlands, watercourses and estuaries (Short Title: Wetland Buffer Zones)), K5/2269 (Development of a national wetland monitoring programme (Phase 1)) and K5/2281 (Develop and test a landscape-based multidisciplinary and multi-sectoral decision support system to support Integrated Water Resource Management in Mpumalanga), amongst others, are likely to influence the way wetlands and water are managed, and these new ideas will need to be actioned in a way that is practical and will achieve the desired end as efficiently as possible.
In terms of national instruments for managing water the progressive implementation of, for example, the environmental reserve and the waste discharge charge system are likely to influence Eskom activities.
Research will foresee the challenges that need to be addressed and develop methods to address these. These ideas will, however, need to be developed into ways in which they can be practically applied by resource users.
There is a need to conduct a strategic review of the challenges in water resource management as these affect Eskom. This would include a review of the research needs and the ongoing research that is addressing these needs. It should also take the identified needs to a point that addresses implementation challenges within Eskom and the social-ecological system.
Eskom water strategy
Eskom’s water strategy outlines the planned reduction of the volume of water to generate 1 kW of electricity from 1.32 ℓ kWh-1 in 2012 to 1.20 ℓ kWh-1 in 2017 (Divisional Report Key indicators, 2012). In addition, the Water Management Policy states that all coal-fired power stations shall comply with the Zero Liquid Effluent Discharge (ZLED) policy.
There are two aspects to this research need. The first is the on-going improvement of on-site water conservation and water demand management and the second is the treatment and reuse of effluents. While both of these are already embedded in Eskom policy, the refinement and implementation of the activities to achieve these two goals should be

255
addressed. As the dynamics of each power station differ, this will require the development of generic as well as site-specific guidelines.
Water conservation and demand management
Water conservation and demand management was a priority strategy in the NWRS (2004) and in the NWRS 2 (2012) its importance has been elevated to one of the core strategies of water management policy. There needs to be an on-going drive to improve water conservation and demand management. This drive will start with a thorough audit of water use on site at power stations as well as in the supply chain and will then need to examine methods and behaviours that could or should be changed and how these changes may be brought about cost-effectively. The priority would be the areas of the power generating process where a lot of water is used such as the selective catalytic reducing process (SCR) or flue gas desulphurization.
Improvements in water conservation and demand management would both help Eskom to achieve the aim of reducing the volume of water per unit of electricity generated and would also free up more water for growth, development and the environment.
Wetland responsibilities on mines
The responsibilities of mines with regard to wetlands should comply with national policy and legislation. However, more than this, in the past it has been the practice to mine opencast in the bottom of valleys, as the coal seams are closer to the surface at these localities. With the new emphasis on wetland conservation, this practice should change. In addition, the DEA, the DMR, the Chamber of Mines and SANBI have published the Mining and Biodiversity Guideline (2013).
The various sources of knowledge need to be brought together into a single guideline document that is accessible and useable by environmental staff on site while at the same time providing guidance to policy formation to the Eskom policy makers.
Procurement chain of Eskom-owned mines
The increasingly rigorous implementation of water and environmental legislation at national and provincial level makes it important that Eskom, mining houses and other activities that take place in the landscape are aware of their allocated responsibilities.
Guidelines need to be developed which address these allocated responsibilities in a way that will enable planners and decision makers to understand how enacting these responsibilities will influence the on-the-ground operation of, for instance, operational imperatives, purchasing agreements and the environmental assurances that are required by the policy and legislation. This should be developed in such a way as to enable the planners and decision makers to gauge the funding requirements of addressing the increasingly rigorous implementation of water and environmental legislation.
256
New agreements with mines
New agreements with mines should use the Eskom Project Life Cycle Model (PLCM). The Wetland Management Framework (Deliverable 3 of this project) may then be implemented within the PLCM.
There is place for guidelines on how wetlands, water and environmental management issues should be addressed in new agreements with mines. The format followed by the recently published ‘Mining and Biodiversity Guideline: mainstreaming biodiversity into the mining sector’ (DEA et al., 2013) may give guidance on how this may be developed.
Decommissioning of mines and power stations and their impacts on wetlands
Guidelines for the decommissioning of power stations and mines need to be developed. The guidelines should include the control of acid mine drainage as well as any sources of leachate from the sites. They should include methods of ensuring ash dams/spoil dumps are stable and rehabilitated as far as possible in the time available. Employing constructed wetlands as part of the strategy to achieve this is an option, but a precautionary note is that the capacity of wetlands to sequester pollution is not unlimited and so needs to be monitored and managed. If the pollutants reach a point where they break through the capacity of the wetlands to absorb them, then a situation similar to what happened in the town of Carolina recently may arise.
The guidelines should also provide for a follow-up programme which includes monitoring (within an adaptive management framework) and management of the technologies employed. The duration and intensity of the follow-up programme should be outlined, although there would need to be some flexibility to allow for the feedback of the results to be incorporated into the programme. This is particularly relevant when facilities such as the water and wastewater treatment works remain active to provide services to surrounding settlements.
Constructed wetlands
There is a need for guidelines on the construction and management of constructed wetlands. These guidelines need to cover topics such as when they may be employed and what are the legal and permitting requirements to implement them. They should also address the structure and functioning of the wetland itself, as some types of constructed wetlands are more efficient than others in certain circumstances, adding value to the existing ecological infrastructure.
Monitoring programme
A monitoring programme should be developed within the framework of adaptive management (learning by doing). While the initial focus of the monitoring programme should be on wetlands, the programme should be developed in such a way that it can be expanded to include all aspects of environmental management as well as water use on the site.

257
It is seen that the monitoring programme will have a core of generic activities, but that there will also be sufficient flexibility to allow for the individual needs of each power station, transmission line servitude and substation to be accommodated.
Recovery of water vapour from Eskom cooling towers
A large quantity of water is lost to the atmosphere through the cooling towers on coal-fired power stations. South Africa is a water scarce country and the demand for the existing water is increasing. The recovery of all or a portion of the water evaporated from cooling towers will help Eskom meet the target of reducing the volume of water required to generate a unit of electricity. It will also release some of the water currently allocated to Eskom for growth, development and the environment. This additional water will contribute to increasing national water security.
There is an international project entitled ‘Capture of evaporated water with novel membranes’, acronym CapWa, investigating the possibility of recovering evaporated water from industrial processes (http://www.watercapture.eu/).
The need is for an investigation into innovative technologies which may be retrofitted to Eskom coal-fired power station cooling towers to condense the water vapour which currently is being lost to the atmosphere. For each potential technology the investigation should develop estimates of the benefits and costs of the technology. The estimates of the benefits and costs to be investigated for envisaged innovative technologies should include, but not be limited to, the following:
• The percentage of water that may be recovered,
• The cost per litre of water recovered,
• Changes to the efficiency of the functioning of the cooling towers.
Waste as a resource
There is need for a thorough audit of the waste streams emanating from Eskom with a view to investigating what resources may be recovered and what waste streams may be reduced.
• Data mining of existing research
Eskom organisational responsibilities
The organisational responsibilities of Eskom have been broadly outlined in Deliverable 5 of this project. Responsibilities range from the generation of company policy to on-the-ground implementation of this policy as well as national and provincial legislation, including training to enable personnel at the various levels to carry out their duties effectively. The increasing realisation of the importance of the role of water and the environment is leading to increasing rigour of implementation of water and environmental legislation.
There is a need for the organisational responsibilities to be reviewed. The review will need to take account of projected changes in national policy and legislation, global (climate, economic, demographic) change and the needs of new technologies which may be
258
employed by Eskom. The review should examine the effect that these changes are likely to have on Eskom and its functioning.
Wetland indicators
Indicators of wetland health and the contribution of wetlands to the socio-economy are available from a number of sources. The Water Research Commission has funded the development of specific indicators, particularly those by Pollard and Cousins (2008) and Pollard and du Toit (2009; 2010). Ramsar have also developed indicators for wetlands. In addition, the Water Research Commission is currently funding a project entitled ‘Development of a national wetland monitoring programme (Phase 1)’ (WRC Project Number K5/2269) which is developing a suite of indicators which cover the position of wetlands in the socio-ecological system. This project is due to finish after the current project.
Once the WRC project K5/2269 has been completed it will be necessary to incorporate indicators relevant to wetlands under Eskom’s jurisdiction into an adaptive management framework which will then feed into the Wetland Management Framework developed in this project.
Presentation and training of the WRC wetlands framework to Eskom managers and
staff
During the current project training in the application of the Wetland Management Framework has been developed. This needs to be incorporated into the electronic courseware system of the Eskom Learning Academy. Once this is available online the course will need to be presented to relevant managers and staff to empower them to use the WMF.
Guidance for Eskom policy makers
Eskom is faced with the need to generate more power in a socio-economic environment where there is an increasing demand for resources. There is also a swing, internationally and nationally, towards a sustainable green economy. This increasing demand for resources leads to an increase in the need to comply with policies and legislation designed to ensure the sustainability of these resources. In the face of this Eskom needs to develop policies which will ensure the sustainability of its operations while at the same time complying with the changing landscape of national management of natural resources, particularly water.
Guidelines need to be developed, drawn from international and national experience, to guide Eskom policy makers in the formulation of policy which will ensure the sustainability of Eskom’s activities.
Fast tracking of best wetlands management practices
There is a considerable bank of local knowledge on wetland management which has been developed over the years by the Department of Water Affairs, the Department of Environmental Affairs, the Water Research Commission and postgraduate research in various universities. Equally, there is a large bank of knowledge on wetland management

259
internationally. The management of wetlands is addressed in various Eskom policies and the wetland management strategy has been developed for Kusile Power Station. The Wetland Management Framework developed in this project provides a step-by-step guide to the management of wetlands during the various phases of the Eskom Project life Cycle Model.
Collation of this bank of knowledge into a resource that will make it readily accessible to Eskom managers and staff, accompanied by training, will be a step towards the fast tracking the implementing of best practice in wetland management.
Such a resource has the potential to be widely used by all stakeholders in a catchment, bringing best practices to agriculture, mining, urban and industrial land users.
6.4 RESEARCH NEEDS IN THE CATCHMENTS WHERE ESKOM IS ACTIVE
Eskom is one of a community of resource users within a catchment, and the resilience of natural resources is enhanced when the area under good management is increased.
Hierarchy of conservation targets
Given the varied nature and role of wetlands in the landscape, it is necessary to take cognisance of and set conservation targets for each type of wetland affected by Eskom’s operations. Conservation targets need to be aligned with provincial and national biodiversity conservation plans and other strategic planning documents highlighting sensitive and important water resource areas while recognising Eskom’s particular needs at the same time.
Conservation targets need to integrate ‘land health’ (land use including urbanisation) and ‘aquatic ecosystem health’, so linking terrestrial and aquatic activities.
Wetland connectivity
Habitat corridors are considered an important feature of biodiversity conservation because they facilitate movement of organisms between patches, thereby increasing species richness in those patches. Biodiversity corridors allow species to traverse habitat that is not necessarily suitable for permanent residency. Species often rely on biodiversity corridors to disperse from the area from which they originated, escape predation, locate better habitat, find a mate, or access habitat they need at a specific life history stage. Without the connectivity provided by corridors, many species cannot perform their essential life functions and thus eventually become locally extinct. Separation of previously connected natural habitats resulting from anthropogenic land use changes is one of the most important drivers behind biodiversity loss (Bergsten, 2012).
Resource Quality Objectives (RQO) of feeder catchments
The water resource classification system (WRCS) is in process of being developed for some of the catchments in which Eskom is active and will eventually cover the entire country. The WRCS sets the water resource management targets, including the resource quality objectives (RQO) and at a finer scale the water resource quality objectives (WRQO) for each IUA in the catchment.

260
Based on the pollution attenuation potential of wetlands on Eskom property, Eskom can set strategic conservation and rehabilitation targets to manage or improve catchment water quality. This will require knowledge of the pollution attenuation potential of different types of wetland for different pollutants. Some of this knowledge exists but it is likely that some may need to be developed.
Hydrological integrity
It is vital to understand water use by different role players within a catchment to ensure that the hydrological integrity of wetlands is maintained. In order to set realistic conservation targets, an understanding of current and future water use in the catchment is required. This will require modelling projections of changes to the demographics and economic activities. In view of the water scarcity in the region, the modelling should provide clear decision support capability.
Greenhouse Gas (GHG) sinks
Wetlands are considered to be important sinks for GHG. Wetlands under Eskom’s jurisdiction may be ranked in terms of their GHG attenuation potential. This will ensure that the criteria and targets related to wetland conservation take cognisance of this wetland function. The capacity of wetlands to attenuate pollution may be employed is to be one of the suite of technologies towards realising a clean development mechanism (CDM), or the development of cleaner technologies as is currently being implemented by industry.
The effectiveness of wetlands to perform the functions of carbon sequestration (WRC project K5/2346: Investigation of peatland characteristics and processes as well as understanding of their contribution to the South African wetland ecological infrastructure) and to be employed as a CDM needs to be researched and where practical, the pathway to implementation should be developed.
Ecosystem services for communities
Develop a process (a framework) for identifying and evaluating the value of the ecological services used by communities and how these will be affected by Eskom activities. Where the impact may be negative, the framework should include feedback loops to assess mitigation measures where these are appropriate. At the same time, opportunities will be identified to promote access to wetland services by surrounding communities, in support of Eskom’s social responsibility initiatives.
Integrated natural resource management for the benefit of ecosystem services
Water quality cannot be effectively managed if the sources of diffuse pollution are not addressed. As part of the overall strategy to improve the IWRM in a catchment it is necessary to assess the contribution of activities contributing to diffuse pollution together with those point sources which may be more easily managed. Mining, agriculture and urban runoff are land-based contributors to diffuse pollution, affecting the catchment in which they are situated. Quantification of the relationship between land-based activities and aquatic

261
ecosystem services will guide the management of land use in order to improve the flow of ecosystem services from the wetlands on Eskom properties.
Diffuse pollution from aerial discharges is more complex as the impact has the potential to go beyond the catchment of origin. Knowledge of how aerial discharges affect the terrestrial and aquatic ecosystems and the services they deliver exists internationally, but specific knowledge of the extent and effect of Eskom’s aerial discharges on ecosystem services will guide policy and management decisions on aerial discharges.
Management of the water quality in a catchment ultimately will require a holistic initiative involving the management of point and diffuse sources of pollution. This requires, firstly, knowledge of the sources of pollution and how existing instruments of national policy, such as the Waste Discharge Charge System, may be brought to bear on the situation. Secondly, it will require an integrated effort from all stakeholders involved if it is to be fully implemented. The possibility of rolling out the existing strategy into the catchments in which Eskom operates should be investigated.
Differing baskets of ecosystem services
Improved understanding of the differences in the baskets of ecosystem services offered by different types of wetlands will guide the prioritisation of wetland management and rehabilitation. For instance, unchannelled valley bottom wetlands are better at upgrading water quality than channelled valley bottom wetlands. This understanding would also guide the design of constructed wetlands where they are to be used.
One specific question which may be answered is ‘What is the benefit/cost ratio of rehabilitating an unchannelled valley bottom wetland into which a channel has been eroded through the presence of, for instance, flow being concentrated through a culvert?’
6.5 IN THE SOCIAL ECOLOGICAL SYSTEM
Benefits and costs to power generation, water use and food production
The costs of the use of coal for energy production in terms of water use and impact on quality, impact on the environment and impact on food production are known. What is less clear is the costs and benefits of alternate energy production technologies on water use and impact on quality, impact on the environment and impact on food production for different regions and under varying degrees of water scarcity.
There is a need to develop a decision support system based on costs and benefits to power generation, water use and impact on quality, impact on the environment and impact on food production for different technologies (e.g. solar, wind, biomass – where biomass may be seen as virtual water) for regions of differing water availability, using figures for coal as the benchmark. The development of a model should serve as a decision support system for policy makers and decision makers.
This may become one of the determining factors guiding future decisions and of transitioning towards a green economy.

262
The water energy food nexus
The triple challenge of energy supplies, water stress and food security is becoming increasingly important at a global level. In a recent live chat on the water-energy-food nexus, experts from the World Economic Forum shared positive, practical examples of policy and on-the-ground projects and commented on what the future holds. Williams and Pittock (undated) presented the following quotes:
In 1911, John Muir observed, ‘When we try to pick out anything by itself in nature, we find it hitched to everything else in the Universe.’
A century later, a gathering of the World Economic Forum discovered the same phenomenon. Four hundred top decision-makers listed the myriad looming threats to global stability, including famine, terrorism, inequality, disease, poverty, and climate change. Yet when we tried to address each diverse force, we found them all attached to one universal security risk: fresh water. (Margaret Catley-Carlson, Patron, Global Water Partnership, 2008-2010, Chair of World Economic Forum Global Agenda Council on Water Security) (quoted from Williams and Pittock, undated).
As a major and strategic user of water, Eskom should be in a position to contribute to the development of strategy to address the management of this nexus in a country that is subject to water scarcity and where the demographics and growth projections indicate a growing demand for water, food and energy.
The energy, agriculture and water nexus
A valid research question is ‘On the one hand, how does the availability of electricity influence agriculture and how does Eskom’s use of water influence agriculture and on the other hand, how does the use of water in agriculture impact Eskom’s activities?’ This should consider both water quantity (including the timing of flow) and water quality. Ecosystem-based adaptation to climate change
Ecosystems in good condition are resilient and better able to resist shocks than built infrastructure. While the natural variability of the climate in southern Africa tends to mask trends, any initiatives to address the adaptation to climate change will assist in the coping with the inherent climate variability. Wetlands are key providers of aquatic ecosystem services and maintaining them in good condition will increase the sustainability of the socio-ecological system (SES), but they need to be managed at the catchment level. The benefits of improved resilience and sustainability will be realised by the whole catchment SES, not just Eskom. Subsistence users, the “voiceless”, who depend directly on the ecosystem services for their livelihoods will be amongst the first to benefit from this improvement in sustainability. Improving the resilience of ecosystems will also contribute to the transition towards a green economy.
The question is: ‘What form could Eskom’s input into catchment-wide wetland management take?’ Aspects to be considered when answering this question would be the projected changes in wetlands under the climate change projections and how the projected changes would work out into changes in wetlands in the landscape and how these changes would

263
influence the ecosystem services currently realised from wetlands. This would then need to be worked into the catchment management strategy of the relevant CMA.
Use of reclaimed water
In a situation of water scarcity, what are the benefits and costs of using reclaimed water from a source external to the power station itself (e.g. municipal effluent) for power generation? Currently, for instance, the Kleinkoppie coal mine is treating AMD as required in its water use license and then selling the treated water to Emalahleni Municipality. Duvha PS is not far from Emalahleni, which has a serious problem with its WWTW, could there be some form of cooperation here? And similarly elsewhere? It would also save untreated sewage from being discharged into the environment, so releasing the wetlands downstream to polish the water in an already overused catchment and in the longer term, helping to protect the water quality used in the Groblersdal irrigation scheme downstream from Loskop Dam. Questions that could be addressed in this regard are:
• What is the feasibility and what are the limitations (geographic, technological, economic) to implementing the recycling of reclaimed effluent from a non-Eskom service provider;
• What are the sustainability issues that would need to be addressed, and how could these be addressed;
• How could the findings of the WRC research programme on the use of primary sewage sludge to sequester sulphur from effluents (under Prof P Rose, Rhodes University, patents held in conjunction with ERWAT) be implemented in such a situation.
This has the potential to improve the delivery of ecosystem services in the catchment
• Addressing International Questions
Projections of the use of energy and water into the future
At a global level, it is critical to remain aware of future projections concerning water supply alternatives that could shift overall energy consumption. For instance, between 2006 and 2011 global desalination production (an energy intensive technology) increased from 25 million m3 to 72 million m3 per day. By 2015, the projection stands at 100 million m3 (Olsson, 2012).
What are the longer term projections for (A) the use of power in water management and (B) the use of water in power generation in South Africa?
• Alternate technologies
What is the cost and lead time of viable energy alternatives which may use less water, leaving more for the environment and other uses such as food production. And what is the impact of these alternate energy sources on the long term sustainability of the environment (i.e. once the technology has been decommissioned)? There is an urgent need for R&D to investigate alternate technologies which will reduce the volume of water used and the volume of waste generated by the suite of technologies currently used in South Africa.

264
Shale gas
Natural gas extraction: South Africa has extensive fields of shale gas and the process of investigating the development of these is underway. Apart from the concerns around the availability of sufficient water for the extraction process and the contamination of shallow aquifers, the handling of the effluent from the wells will need to be addressed. Where fracking is practised in water-rich areas the effluent is stored in large, open, surface reservoirs. If this practice is followed in the semi-arid areas of South Africa it will result in the creation of wetlands where none existed previously. The reservoirs containing the water of poor quality will attract wildlife which will become affected by the toxins in the effluent.
This aspect also needs to be addressed in the planning for the process.
Nuclear energy
Nuclear energy has had bad press following accidents from the early-generation technologies. Newer generation technologies are safer. What is the relative efficiency and reliability of nuclear energy, and what is the cost per KWh? There is a need for a review of the experience from elsewhere in the world. Water use and greenhouse gas emissions must be taken into consideration. The costings need to be benchmarked against South African standards so that accurate and unbiased comparisons may be drawn. This will help decision makers to choose the most cost effective technologies. Off grid technologies
There is a need to look at off-grid technologies. This is relevant for rural areas as well as urban areas. Of particular importance is the understanding of the social aspects. Rural people may regard off-grid technologies as ‘second best’, and where this perception exists it needs to be managed. In the wealthier urban areas these technologies may be more readily accepted as the people may be more ready to accept the need for adopting off-grid technologies.
Some examples of off-grid technologies follow:
Solar energy
South Africa is richly endowed with solar energy, particularly in the arid West. What is the relative water use efficiency of solar energy compared to, for instance, coal which is currently the main source of energy? Are there other costs to the social-ecological system which are not currently recognised?
Wind energy
What is the relative efficiency and reliability of wind energy, and what is the cost per KWh? There is a need for a review of the experience from elsewhere in the world. Water use and greenhouse gas emissions must be taken into consideration. The costings need to be benchmarked against South African standards so that accurate and unbiased comparisons may be drawn. This will help decision makers to choose the most cost effective technologies.

265
Energy from biomass
What is the relative efficiency and reliability of energy from biomass, and what is the cost per KWh? There is a need for a review of the experience from elsewhere in the world. Water use and greenhouse gas emissions must be taken into consideration. The costings need to be benchmarked against South African standards so that accurate and unbiased comparisons may be drawn. This will help decision makers to choose the most cost effective technologies.
Energy generated from gas.
There are large fields of natural gas being developed in the SADC region and this is coming available for use in South Africa. What is the relative efficiency and reliability of energy from natural gas, and what is the cost per KWh? There is a need for a review of the experience from elsewhere in the world. Water use and greenhouse gas emissions must be taken into consideration. The costings need to be benchmarked against South African standards so that accurate and unbiased comparisons may be drawn. This will help decision makers to choose the most cost effective technologies.
Beneficiation of waste
Are there technologies which could reduce the footprint of power generation? Would, for instance, the re-working coal discard dumps to produce coal pellets for coal fired power generation be an option? And can any of the pollutants (e.g. sulphur) be recovered for recycling? Are there other waste streams which could be beneficiated, so reducing the overall volume of waste generated by the power station?
The principle of cleaner production is that resources are used more efficiently and so the waste stream is reduced. Using the principles of cleaner production as implemented in other industries, how can Eskom improve its efficiency in the use of the resources necessary for energy generation while at the same time reducing its footprint
The Water Research Commission has, over the years, funded research to develop cleaner production guidelines for industry (TT 139/00; 1898/1/11), petroleum industry (1673/1/08), the mining industry ( TT 485/11; 1553/1/11) and industrial complexes (TT 544/12; TT 545/12; TT 546/12; TT 547/12; TT 548/12), amongst others. Where cleaner production principles have been implemented there has been an improvement in efficiency and a decrease in waste generated.
There is a need for a similar guide for the power generation industry. This would not be limited to the coal-fired power generation, but should address all the technologies used in South Africa.
266
6.6 PRELIMINARY ASSESSMENT OF RESEARCH PRIORITIES
• Technical Research o Soil carbon (paragraph: Soil carbon) o Water conservation and demand management (water use efficiency)
(paragraph: Water conservation and demand management) o Development of a generic monitoring programme for use on Eskom
properties (paragraph: Monitoring programme) o Integrated natural resource management (paragraph: Integrated natural
resource management for the benefit of ecosystem services) • Social/economic research
o The benefits and costs of alternate technologies available to power generation, water use and impact on quality, impact on the environment and impact on food production (paragraph: Benefits and costs to power generation, water use and food production)
o Ecosystem-based adaptation to climate change for Eskom-specific activities (paragraph: The energy, agriculture and water nexus)
• Legal/policy research o Possible future changes in in wetland or water policy and legislation
(paragraph: Consideration of possible future changes in wetland or water policy and legislation).

267
7 CONCLUSION
South Africa is a water-stressed country and the water resource will potentially limit the economic growth if it is not well managed. Society relies on the benefits that ecosystem services provide and when ecosystems become degraded they are no longer able to provide the services at the level of their potential. Table 3 (Page 34) gives the mean global values of the ecosystem services per the world’s biomes (De Groot et al., 2012). These were derived from a number of published studies (see ‘Sample Size’ in the table). These figures show that, of the inland systems, inland wetlands deliver the highest value per hectare. The regulating services are difficult to value but provide the resilience to the system, and these form a major part of the contribution to the value of inland wetlands.
Wetland habitat in the Olifants River catchment is important because it is a component of the ecological infrastructure comprising the aquatic ecosystem of the Catchment. DWA (2012) estimated that the value of aquatic ecosystem services (within which wetland ecological infrastructure plays an important role) was approximately R3 billion per year. Moreover, more than 55% of the GDP contributing sectors in the Olifants River Catchment are directly dependent on water use licences. The economy and people of the Olifants River Catchment are thus highly dependent upon the water resources of the catchment (quoted from Harris et al., 2013). This catchment has a number of coal-fired power stations as well as coal mines and other economic activities. Thus, the loss of aquatic ecosystem services in this catchment would have a severe impact on the economy of the catchment. The Olifants River catchment (in Gauteng, Mpumalanga and Limpopo Provinces) provides an example of the value of aquatic ecosystem services to the country. For this reason it is important that aquatic ecosystems are maintained in good condition.
The wetland management framework was developed with the importance of the aquatic ecosystem services in mind.
The wetland management framework (WMF) has been developed as a practical, ‘how to’, guide for on-the-ground wetland management. It is designed to provide detailed guidance to environmental managers, but also to provide the knowledge needed by managers and planners on the legal and ecological aspects of managing wetlands on Eskom properties. It gives insight into the complexity of managing wetlands under the current legal requirements while at the same time working into the maintenance of the ecosystems that provide the benefits on which society relies, both on Eskom property as well as in the catchments in which Eskom is active.
The WMF has been structured to mesh with Eskom’s Project Life Cycle Model (PLCM). This informs the planning and management teams about the relevant wetland management tasks that need to be included at each stage of the process to ensure compliance with the requirements of legislation as well as the conservation of the desired ecosystem services. It also includes the corporate responsibility to the wider community where relevant.

268
Although the WMF focuses on Eskom’s business processes, it will also serve to guide other organisations which are working in and around wetlands such as mining activities and municipal developments. It addresses the essentials of wetland management in a way that will provide the essential guidance to how to interact with wetlands.

269
8 REFERENCES
NOTE: Not all these references are referred to in the report, but some have been included as they provide relevant supplementary information.
Abbot Grobicki (Pty) Ltd, 2002. Cultivation of plants in restored urban wetlands for income generation in local communities. WRC Report No 1054/1/02.
Abrahamse, 2012. Ecosystems as Infrastructure: Life’s fundamental building blocks. Dialogue on Ecological Infrastructure. SANBI, Pretoria, South Africa. http://www.dbsa.org/EN/About-Us/Publications/Documents/Ecosystems%20as%20Infrastructure%20by%20T%20Abrahamse.pdf
Adhikari, S., Bajracharaya, R.M. & Sitaula, B.K. 2009. A Review of Carbon Dynamics and Sequestration in Wetlands. Journal of Wetlands Ecology. Vol. 2, pp. 42-46
Anderies, J. M., M. A. Janssen, and E. Ostrom. 2004. A framework to analyze the robustness of social-ecological systems from an institutional perspective. Ecology and Society 9(1): 18. [online] URL: http://www.ecologyandsociety.org/vol9/iss1/art18
Anon., 2010. Environmental procedure. Procedure for vegetation clearance and maintenance within overhead powerline servitudes and Eskom owned land. Eskom Enterprises.
Armstrong A, 2009. WET-Legal: wetland rehabilitation and the law in South Africa. WRC TT 338/09. Published by the Water Research Commission, Pretoria.
Bergsten A. 2012. Fragmented landscapes – Assessment and communication of landscape connectivity in human-dominated landscapes. Licentiate in Philosophy Thesis 2012:2. Natural resource management. ISSN 1401-4106.
Biodiversity GIS (BGIS), http://bgis.sanbi.org/
Bird M, 2010. Aquatic invertebrates as indicators of human impacts in South African wetlands. WRC TT 435/09. Published by the Water Research Commission, Pretoria.
Bullock A and M Acreman, 2003. The role of wetlands in the hydrological cycle. Hydrology and Earth system Sciences 7(3) 358-389.
Bullock JM, J Aronson, AC Newton, RF Pywell and JM Rey-Benayas, 2011. Restoration of ecosystem services and biodiversity: conflicts and opportunities. Trends in Ecology and Evolution 26 (10) 542-549.
Chan, K.Y., Cowie, A., Kelly, G., Singh, B., and Slavich, P. 2008. Scoping paper: Soil Organic Carbon sequestration potential for Agriculture in NSW. NSW Department of Primary Industries.
Cox D and D Kotze, 2008. Assessing the appropriateness of wetland mitigation banking as a mechanism for securing aquatic biodiversity in the grassland biome of South Africa. WRC Research Report No. KV 200/08
Dada, R., Kotze, D., Ellery, W., and Uys, M. 2007. Wet-Roadmap. WRC Report No. TT 321/07, Water Research Commission, Pretoria.

270
Day J, E Day, V Ross-Gillespie, and A Ketley, 2010. The assessment of temporary wetlands during dry conditions. WRC TT 434/09. Published by the Water Research Commission, Pretoria.
De Groot R, L Brander, S van der Ploeg, R Costanza, F Bernard, L Braat, M Christie, N Crossman, A Ghermandi, L Hein, S Hussain, P Kumar, A McVittie, R Portelal, LC.Rodriguez, P ten Brink, P van Beukering, 2012. Global estimates of the value of ecosystems and their services in monetary units. Ecosystem Services 1 (2012) 50-61.
Department of Agriculture, Fisheries and Forestry 2012, Guidelines and template for preparing a wetland management plan. For primary producers (grazing, dryland cropping) in Queensland’s inland catchments, Queensland Government, Brisbane.
DFN, 2009. Expert Workshop Meeting Report, ed. Nick Davidson. Danone Group/IUCN/ Ramsar Convention Secretariat, Gland, Switzerland. 87pp.
DFN 2010. Danone Fund for Nature. 2010. Achieving Carbon Offsets through Mangroves and Other Wetlands. November
Davidson N, 2010. The Ramsar convention, carbon storage science and wetland offsets. CBD COP 10 “Wet Carbon” side event. Nagoya, 20 October 2010.
DEA et al., 2013. Department of Environmental Affairs, Department of Mineral Resources, Chamber of Mines, South African Mining and Biodiversity Forum, and South African National Biodiversity Institute. 2013. Mining and Biodiversity Guideline: Mainstreaming biodiversity into the mining sector. Pretoria.100 pages.
Development of a framework for the assessment of wetland ecological integrity in South Africa. Phase 1: Situation Analysis. by MC Uys. Contributors G Marneweck and P Maseti. Report No. 0000/00/REQ/0904 ISBN No.: 0-621-35474-0. Resource Quality Services, Department of Water Affairs and Forestry, Pretoria, South Africa.
Dickens C, D Kotze, S Mashigo, H MacKay and M Graham, 2003. Guidelines for integrating the protection, conservation and management of wetlands into catchment management planning. WRC Report number TT 220/03. Report to the Water Research Commission, Pretoria.
Directorate Water Resource Classification, 2011a. Department of Water Affairs, South Africa, May 2011. Classification Of Significant Water Resources In The Olifants Water Management Area (WMA 4): Report 3a: Report on IUAs and Report on Socio‐economic evaluation framework and the decision‐analysis framework. Report 3b: Analysis scoring system. RDM/WMA04/00/CON/CLA/0311
Directorate Water Resource Classification, 2011b. Department of Water Affairs, South Africa, July 2011. Classification of Significant Water Resources in the Olifants Water Management Area (WMA 4): Report on Socio-economic evaluation and the decision-analysis framework. RDM/WMA04/00/CON/CLA/0411
Directorate Water Resource Classification. Department of Water Affairs, South Africa, March 2012. Classification of Significant Water Resources in the Olifants Water Management Area (WMA 4): Ecologically Sustainable Base Configuration (ESBC) Scenario Report. Report No: RDM/WMA04/00/CON/CLA/0611

271
Driver A, JL Nel, K Snaddon, K Murray, DJ Roux, L Hill, ER Swartz, J Manuel & N Funke, 2011. Implementation Manual for Freshwater Ecosystem Priority Areas. WRC Report No. 1801/1/11 (3 volumes). Report to the Water Research Commission, Pretoria.
Du Preez, C.C., Van Huyssteen, C.W., Pearson N.S., and Mnkeni, M. (2011) Land use and soil organic matter in South Africa 1: A review on spatial variability and the influence of rangeland stock production. South African Journal of Science 107 (5/6).
DWAF, 2007. Department of Water Affairs and Forestry. 2007. Guidelines for the Development of Catchment Management Strategies: Towards equity, efficiency and sustainability in water resources management. By S.R. Pollard, D. du Toit, Y. Reddy and T. Tlou. Department of Water Affairs and Forestry, Pretoria, South Africa.
DWAF, 2007. Department of Water Affairs and Forestry. 2007. Guidelines for the Development of Catchment Management Strategies: Towards equity, efficiency and sustainability in water resources management. By S.R. Pollard, D. du Toit, Y. Reddy and T. Tlou. Department of Water Affairs and Forestry, Pretoria, South Africa.
DWAF. 2008. Updated Manual for the Identification and Delineation of Wetland and Riparian Areas (Draft Report). September 2008. Prepared by M. Rountree, A. L. Batchelor, J. MacKenzie and D. Hoare. Stream Flow Reduction Activities, Department of Affairs and Forestry, Pretoria.
DWA, 2010. The nature, distribution and value of aquatic ecosystem services of the Olifants, Inkomati and Usutu to Mhlatuze Water Management Areas. Contract Report by Anchor Environmental Consultants for Department: Water Affairs, 362pp.
DWA, 2012. Department of Water Affairs, South Africa, November 2012. Classification of Significant Water Resources in the Olifants Water Management Area (WMA 4): Evaluation of Scenarios Report No: RDM/WMA04/00/CON/CLA/0212
Ellery W, S Grenfell, M Grenfell, C Jaganath, 2010. A method for assessing cumulative impacts on wetland functions at the catchment or landscape scale, WRC Report No. TT 437/09.
Emerton L and E Bos, 2004. Value, counting ecosystems as an economic part of water infrastructure. IUCN Gland, Switzerland and Cambridge, UK. 88 pp.
Environment and Natural Resources Committee. 2010. Inquiry into Soil Carbon Sequestration in Victoria. Parliament of Victoria. Parliamentary Paper. No. 362 Session 2006-10.
Eskom 2009a. Eskom’s response to Water for Growth & Development Growth & Development Framework. http://www.dwaf.gov.za/WFGD/documents/2009Summit/Eskom.pdf
Eskom, 2009b. Water pathway. http://www.dwaf.gov.za/masibambane/documents/structures/wsslg/jun09/WSLG_WaterPathway.pdf
Eskom, 2012. Divisional Report Key indicators, 2012. http://integratedreport.eskom.co.za/iir2014/integrated_report_2013/divisional/div-generation.php

272
Eskom, 2013. Water Management Policy. Document identifier 32/1163.
Euliss NH, R.A. Gleason, A. Olness, R.L. McDougal, HR Murkin, RD Robarts, RA Bourbonniere and BG Warner, 2006. North American prairie wetlands are important nonforested land-based carbon storage sites. Science of the Total Environment 361: 179-188
Ewart-Smith JL, DJ Ollis, JA Day and HL Malan, 2006. National wetland inventory: development of a wetland classification system for South Africa. WRC report KV 174/06. Published by the Water Research Commission, Pretoria.
Ginsburg, A.E., J.G. Crafford and K.R. Harris. 2010. Framework and Manual for the evaluation of aquatic ecosystems services for the Resource Directed Measures. WRC Report TT 462/10. Water Research Commission, Pretoria.
Harris, KR, JG Crafford and A Burger, 2013. Kusile Power Station wetland management strategy. Eskom document number MTPB-ESK031-0013.
Job N, 2008. Application of the Department of Water Affairs and Forestry (DWAF) wetland delineation method to wetland soils of the Western Cape. WRC report KV 218/08. Published by the Water Research Commission, Pretoria.
Johnson Foundation, 2014. Navigating to New Shores: Seizing the Future for Sustainable and Resilient U.S. Freshwater Resources. Racine, WI: The Johnson Foundation at Wingspread.
JuFeng, Z., Kun, C., GenXing, P., SMITH, P. LianQing, L., XuHui, Z., JinWei, Z., XiaoJun, H., YanLing, D. 2011. Perspectives on studies on soil carbon stocks and the carbon sequestration potential of China. Chinese Science Bulletin. Vol. 56, nr. 35: 3748-3758.
Kayranli, B., Scholz, M. Mustafa, A. & Hedmark, A. 2010. Carbon Storage and Fluxes within Freshwater Wetlands: a Critical Review.2010.Carbon Storage and Fluxes within Freshwater Wetlands: a Critical Review. Wetlands. Vol 30:111-124.
Kleynhans, CJ, Thirion, C and Moolman, J (2005). A Level I River Ecoregion classification System for South Africa, Lesotho and Swaziland. Report No. N/0000/00/REQ0104. Resource Quality Services, Department of Water Affairs and Forestry, Pretoria, South Africa.
Kotze D, G Marneweck, A Batchelor, D Lindley and N Collins, 2009. WET-Ecoservices: A technique for rapidly assessing ecosystem services supplied by wetlands. WRC report TT 339/09. Published by the Water Research Commission, Pretoria.
Kotze D, H Malan, W Ellery, I Samuels and L Saul: Series Editor: H Malan, 2009. Wetland Health And Importance Research Programme 7: Assessment of the environmental condition, ecosystem service provision and sustainability of use of two wetlands in the Kamiesberg uplands. WRC Report TT 439/09. Report to the Water Research Commission
Macfarlane DM, Kotze DC, Ellery WN, Walters D, Koopman V, Goodman P and Goge C. 2008. WET-Health: A technique for rapidly assessing wetland health. Report submitted to the Water Research Commission, Pretoria.

273
MacFarlane DM, IP Bredin, JB Adams, GC Bate and CWS Dickens, in press. Development of a methodology to determine the appropriate buffer zone for developments associated with wetlands, rivers and estuaries. Water Research Commission report on project number K5/2200. Water Research Commission, Pretoria.
Manuel J, 2012. Ecological Infrastructure: Key considerations for planning. Dialogue on Ecological Infrastructure. SANBI, Pretoria, South Africa.
Mitch, W.J., and Gosselink, J.G. 2000. The value of wetlands: importance of scale and landscape setting, Ecological Economics 35, 25-33.
Millennium Ecosystem Assessment (2005) Ecosystems and human well-being: synthesis. Island Press, Washington, DC
Mitch, W.J., and Gosselink, J.G. 2000. The value of wetlands: importance of scale and landscape setting, Ecological Economics 35, 25-33.
Mitchell SA, JG Crafford, KR Harris, M Wilkinson and A Burger, 2013. Dynamic, Evidence-Based, Ecosystem Services Decision-Support Model for Climate Change Adaptation: Comparative Risk Assessment Workshop Starter Document. Interim report to the WRC project K8/1009.
Mitra, S., Wassmann, R. & Vlek, P. 2005. An appraisal of global wetland area and its organic carbon stock. Current Science. Vol. 88, No. 1.
Nel JL, A Driver, WF Strydom, A Maherry, C Petersen, L Hill, DJ Roux, S Nienaber, H van Deventer, E Swartz and LB Smith-Adao, 2011. Atlas of Freshwater Ecosystem Priority Areas in South Africa: Maps to support sustainable development of water resources. WRC Report No. TT 500/11a. Report to the Water Research Commission, Pretoria.
Nel JL, KM Murray, AM Maherry, CP Petersen, DJ Roux, A Driver, L Hill, H van Deventer, N Funke, ER Swartz, LB Smith-Adao, N Mbona, L Downsborough & S Nienaber, 2011b. Technical Report for the National Freshwater Ecosystem Priority Areas project. WRC Report No. 1801/2/11. Report to the Water Research Commission, Pretoria.
Nel J.L. and Driver A. 2012. South African National Biodiversity Assessment 2011: Technical Report. Volume 2: Freshwater Component. CSIR Report Number CSIR/NRE/ECO/IR/2012/0022/A, Council for Scientific and Industrial Research, Stellenbosch.
Nelson, D.W., and Sommers, L.E. 1982. Total carbon, organic carbon and organic matter. In: Methods of soil analysis, Part 2 (eds A.L. Page et al.). 539-579. American Society of Agronomy, Madison, WI.
NPC, 2011. National Development Plan: Vision for 2030. National Planning Commission. Pretoria, South Africa. 430 pp.
NWRS 1, 2004. National Water Resource Strategy: First Edition. Department of Water Affairs Forestry.
NWRS 2, 2012. National Water Resource Strategy 2. Department of Water Affairs.
Oberholster PJ, P. McMillan, K. Durgapersad, A. M. Botha and A. R. de Klerk, 2014. The Development of a Wetland Classification and Risk Assessment Index (WCRAI) for Non-
274
Wetland Specialists for the Management of Natural Freshwater Wetland Ecosystems. Water Air Soil Pollut (2014) 225:1833: 15 pages
Olivier JGJ, G Janssens-Maenhout, M Muntean, JAHW Peters, 2013. Trends in global CO2 emissions: 2013 Report. PBL Netherlands Environmental Assessment Agency publication number: 1148, The Hague, 2013, 64 pages.
Olsson, G. (2012), Water and Energy: Threats and Opportunities. London, UK: IWA Publishing
Palmer RW; Turpie J; Marneweck GC; Batchelor AL, 2002. Ecological and economic evaluation of wetlands in the Upper Olifants River catchment, South Africa. WRC Report 1162/1/02. Water Research Commission, Pretoria.
Pollard S and T Cousins, 2008. Towards integrating community-based governance of water resources with the statutory frameworks for IWRM: A review of community-based governance of freshwater resources in southern Africa to inform governance arrangements of communal wetlands. WRC Report number 328/08. Water Research Commission, Pretoria.
Pollard S and D du Toit, 2010. The Shared River Initiative Phase I: Towards the sustainability of freshwater systems in South Africa: An exploration of factors that enable or constrain meeting the Ecological Reserve within the context of Integrated Water Resources Management in the catchments of the Lowveld. WRC Report number TT 477/10. Water Research Commission, Pretoria.
Pollard S, D du Toit, T Cousins, D Kotze, E Riddell and C Davis, 2010. Sustainability indicators in communal wetlands and their catchments: Lessons from Craigieburn wetland, Mpumalanga. WRC Report No. 1709/1/10.
Potter, C., Klooster, S., Hiatt, S., Fladeland, M., Genovese, V., & Gross, P. 2006. Methane Emissions from Natural Wetlands in the United States: Satellite-Derived Estimation Based on Ecosystem Carbon Cycling. Earth Interactions. Volume 10, no. 22.
Powell, K., Wynn, J., Rains, M., Stewart, M. 2008. Towards a soil-property-based index of wetland “harm”. Unpublished presentation.
Ramsar, viewed 2014. http://www.ramsar.org/cda/en/ramsar-about-about-ramsar/main/ramsar/1-36%5E7687_4000_0__
Rivers-Moore NA, 2011. Deriving conservation targets for rivers. WRC Report No. 1796/1/10. Pretoria: Water Research Commission.
Rountree M, A. L. Batchelor, J. MacKenzie and D. Hoare. Stream Flow Reduction Activities, Department of Affairs and Forestry, Pretoria.
Roux DJ, Nel JL, MacKay HM and Ashton PJ (2006). Cross-Sector Policy Objectives for Conserving South Africa’s Inland Water Biodiversity. WRC Report No. TT 276/06. Pretoria: Water Research Commission.
Ollis, D.J., Snaddon, C.D., Job, N.M. & Mbona, N. 2012. Classification System for wetlands and other aquatic ecosystems in South Africa. User Manual: Inland Systems. SANBI Biodiversity Series 22. South African National Biodiversity Institute, Pretoria.

275
SANBI and DWS, 2014. Wetland Offsets: A best practice guideline for South Africa. South African National Biodiversity Institute and the Department of Water and Sanitation. First Edition. Pretoria
SOER, 2005. South Africa Environment outlook. Department of Environmental Affairs and Tourism, South Africa
Stephens A, 2012. Harnessing ecological infrastructure and adapting to risk. Dialogue on Ecological Infrastructure. SANBI, Pretoria, South Africa.
Sulaeman, Y., Budiman, M. & McBratney, A.B. 2010. Monitoring Spatio-Temporal Changes of Soil Carbon in Java Using Legacy Soil Data. Proceedings of Inernational Workshop on Evaluation and Sustainable Management of Soil Carbon Sequestration in Asian Countries. Bogor, Indonesia.
TEEB. The economics of ecosystems and biodiversity. http://www.teebweb.org/resources/ecosystem-services/
Turpie J, 2010a. Wetland valuation. Vol II: Wetland valuation case studies. Series editor H Malan: Wetland Health and importance Research Programme 9. WRC Report No. TT 441/09.
Turpie. J 2010b. Wetland valuation. Vol III: A tool for the assessment of the livelihood value of wetlands Series editor H Malan: Wetland Health and importance Research Programme 10. WRC Report No. TT 442/09.
Turpie and M. Kleynhans. 2010. Wetland valuation. Vol IV: A protocol for the quantification and valuation of wetland ecosystem services. Series editor H Malan: Wetland Health and importance Research Programme 11. WRC Report No. TT 443/09.
UN CEO Water mandate. http://ceowatermandate.org/about/ (viewed July 2014)
Van Vuuren L, 2014. Mpumalanga wetland rehab partnership a win for ecological infrastructure. Water Wheel 13 (4): 21-25.
Victoria, R., Banwart, S., Black, H., Ingram, J., Joosten, H., Milne, E., & Noellemeyer, E. 2012. The benefits of Soil Carbon: Managing soils for multiple economic, societal and environmental benefits. UNEP yearbook.
Williams J and Pittock J. The water, food and energy nexus. Australian National University. http://www.wrc.org.za/FreshWater/Documents/09H30%20Williams%20Tues%20Monks%20Cowl.pdf
World Economic Forum. http://www.weforum.org/content/global-agenda-council-water-security-2012-2014 (viewed July 2014)
WWF, 2014. http://www.wwf.org.za/what_we_do/freshwater/water_balance/
Wylynko, D. 1999. Prairie wetlands and carbon sequestration Assessing sinks under the Kyoto Protocol. International Institute for Sustainable Development.

276
APPENDIX
Figure 44: Pathways and milestones for the period 2009 to 2015 related to water (Eskom, 2009b)
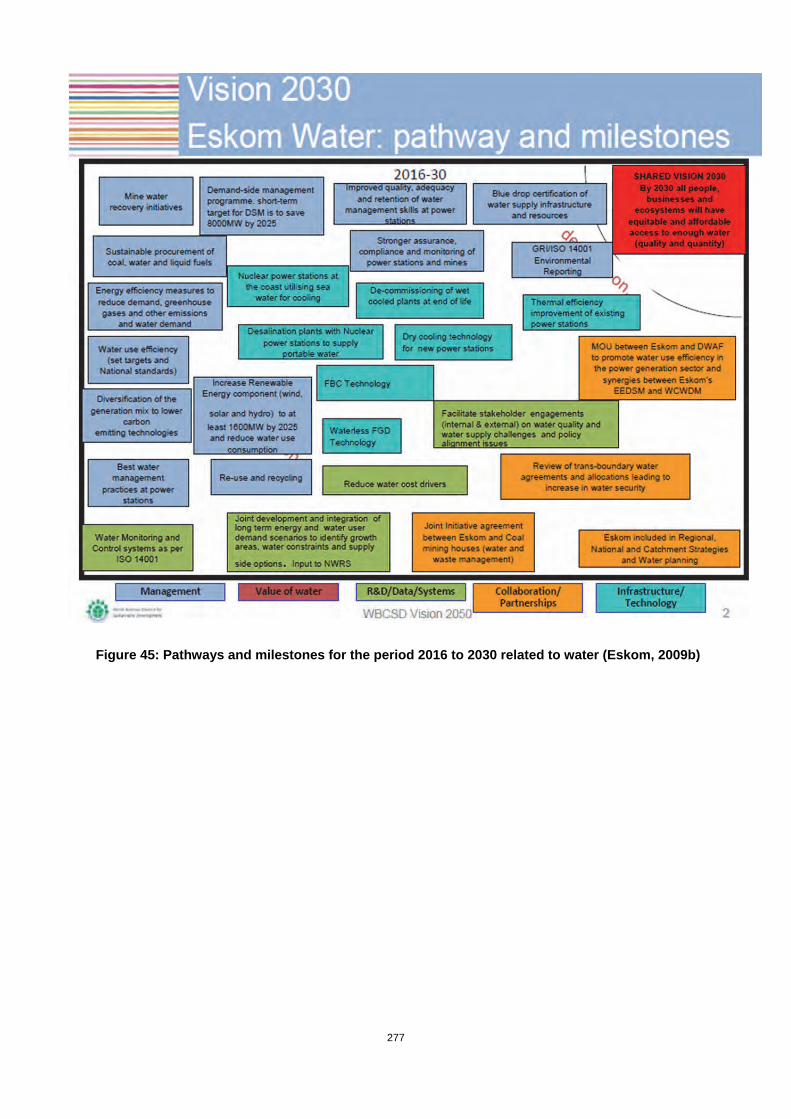
277
Figure 45: Pathways and milestones for the period 2016 to 2030 related to water (Eskom, 2009b)

278
PILOT SITE SELECTION
The Research Team recognized the need for a justifiable methodology in the selection of pilot sites for the purposes of testing the Wetland Management Framework (WMF).
Tables 46 and 47 provide the names and organisations of the persons attending two such meetings as well as those from whom an apology was received.
Table 46: Attendees of the site selection meeting on 24 May 2013
Attendees Name Organisation/Business Unit
Contact Details
Present Wietsche Roets DWA 082 604 7730
Kaajial Durgapersad Eskom 082 389 2350
Felicia Tiba Eskom 083 297 4328
Tefo Tshabidi Eskom: Sustainability 082 879 9286
Siven Naidoo Eskom: TS & RM 083 258 3786
Florence Radebe Eskom: Construction 082 389 2233
Michael Michael Eskom: RT & D 084 664 0747
Daphney Ramaphosa Eskom: Construction 073 315 1117
Levania Moodley EON Consulting 081 270 9328
Adri Venter EON Consulting 082 372 8186
Apologies Meera Ormea Eskom: PED 083 2700 659
Esther Appleyard Eskom: PED
Steve Mitchell EON Consulting

279
Table 47: Attendees of the site selection meeting on 26 July 2013
Attendees Organisation/ Business Unit
Contact details
Kaajial Durgerpaersad Eskom 082 389 2350
Felicia Tiba Eskom 083 297 4328
Tefo Tshabidi Eskom: Sustainability 082 879 9286
Michael Michael Eskom: RT & D 084 664 0747
Adri Venter Eon Consulting 082 372 8186
Steve Mitchell Eon Consulting
Michillay Brown Student accompanying Eskom
Kishaylin Chetty Eskom
Theresa Ferguson Eon Consulting
Apologies
Wietsche Roets DWA 082 604 7730