framework for implementing systems engineering measures … · framework for implementing systems...
TRANSCRIPT

Framework for Implementing Systems Engineering Measures at Technical Reviews and Audits
Chris Orlowski
GWU Advisors: Timothy Blackburn, Ph.D. Paul Blessner, Ph.D. Bill Olson, Ph.D., CSEP-Acq
NDIA Systems Engineering
Conference October 26-29, 2015
Springfield, Virginia

• Changing environment and threats
• More emphasis on multi-mission capability,
adaptability and resiliency
• Results in increased complexity in functional
architecture and resulting physical solution
• Complex interfaces with multiple components
• Increased software and electronics footprint
• Demand for effective systems engineering
Increased Complexity in Today’s Systems
1 The George Washington University
Systems engineers solve challenging, complex problems

The George Washington University
Patient Diagnostics
• Blood Pressure
• Temperature
• Weight
• Other MD vitals
Is There a Doctor in the House?
2
Program Diagnostics
• TPMs
• Risk Exposure
• Requirements
• Other SE vitals
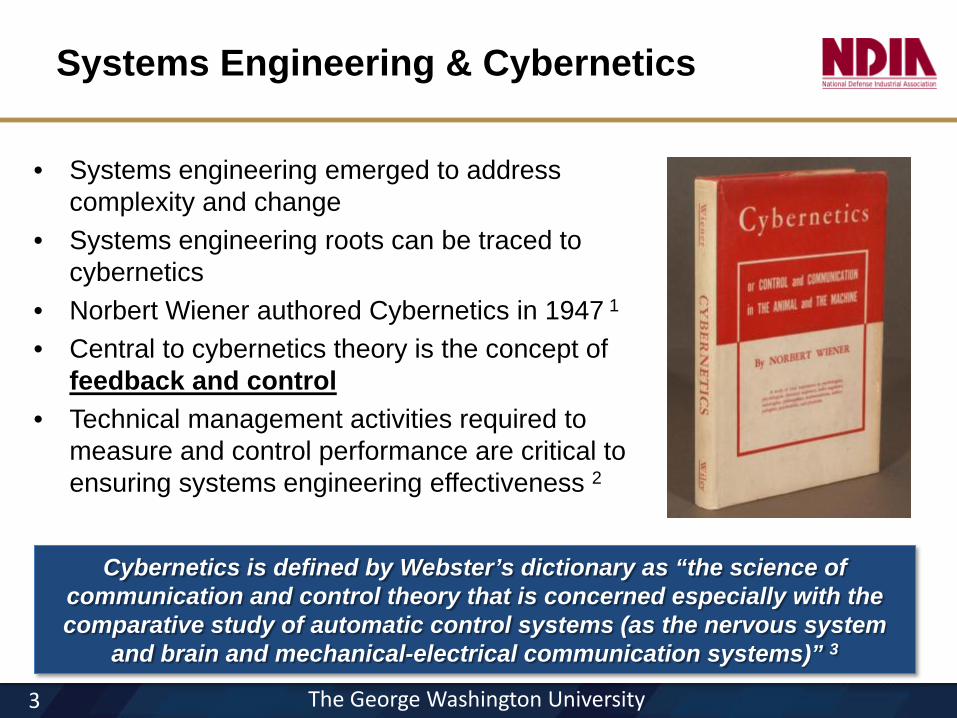
• Systems engineering emerged to address complexity and change
• Systems engineering roots can be traced to cybernetics
• Norbert Wiener authored Cybernetics in 1947 1 • Central to cybernetics theory is the concept of
feedback and control • Technical management activities required to
measure and control performance are critical to ensuring systems engineering effectiveness 2
Systems Engineering & Cybernetics
3
Cybernetics is defined by Webster’s dictionary as “the science of communication and control theory that is concerned especially with the comparative study of automatic control systems (as the nervous system
and brain and mechanical-electrical communication systems)” 3
The George Washington University

• SEI & NDIA surveyed 148 development projects and found clear and significant relationships between systems engineering best practices and performance on those projects
• Projects that contained high level of systems engineering best practices performed much better than projects with low SE capability
Systems Engineering Effectiveness 4
4
For the projects that did the most SE, 56% delivered the best project performance
For the projects that did the least SE, only 15% delivered the best project performance.
The George Washington University
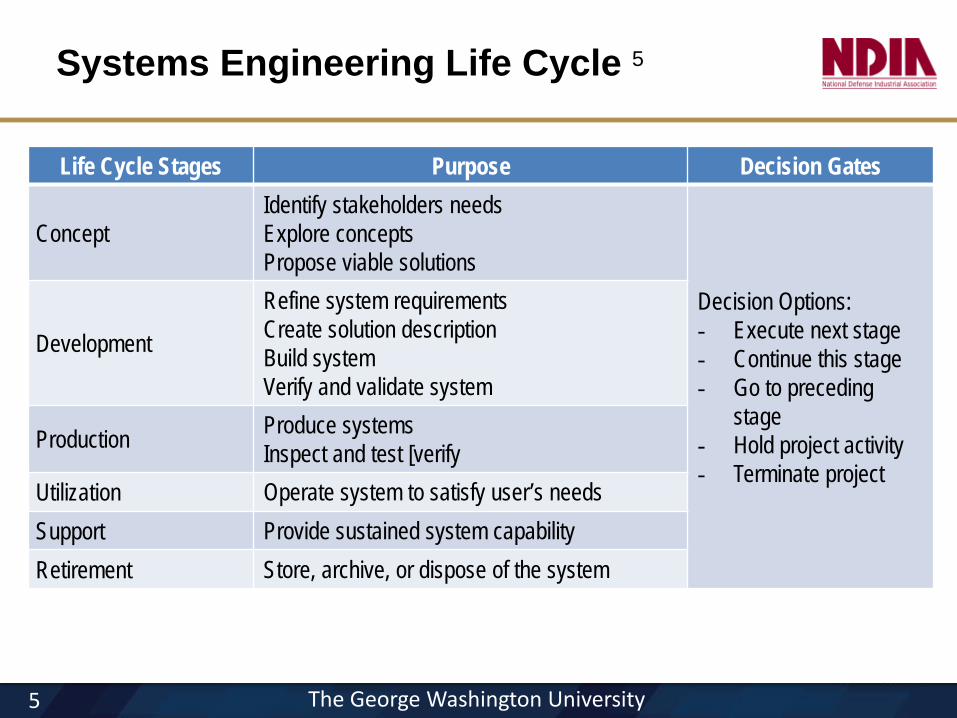
Systems Engineering Life Cycle 5
5
Life Cycle Stages Purpose Decision Gates
Concept Identify stakeholders needs Explore concepts Propose viable solutions
Decision Options: - Execute next stage - Continue this stage - Go to preceding
stage - Hold project activity - Terminate project
Development
Refine system requirements Create solution description Build system Verify and validate system
Production Produce systems Inspect and test [verify
Utilization Operate system to satisfy user’s needs Support Provide sustained system capability Retirement Store, archive, or dispose of the system
The George Washington University

Technical Reviews and Audits 6
6
Review or Audit Description Alternative Systems Review (ASR)
Recommendation that the preferred materiel solution can affordably meet user needs with acceptable risk. System parameters defined; balanced with cost, schedule, and risk.
System Requirements Review (SRR)
Recommendation to proceed into development with acceptable risk. Level of understanding of top-level system requirements is adequate to support further requirements analysis and design activities.
System Functional Review (SFR)
Recommendation that functional baseline fully satisfies performance requirements and to begin preliminary design with acceptable risk. Functional baseline established and under formal configuration control.
Preliminary Design Review (PDR)
Recommendation that allocated baseline fully satisfies user requirements and developer ready to begin detailed design with acceptable risk. TPM data and analyses are assessed and typically 15% of production drawings have been released by PDR
Critical Design Review (CDR)
Recommendation to start fabricating, integrating, and testing test articles with acceptable risk. Product design is stable. Initial product baseline established. all configuration items (CIs) are evaluated. As another rule of thumb, the design is approximately 80 - 85% complete by this review
System Verification Review (SVR) (i.e. Functional Configuration Audit (FCA))
Recommendation that the system as tested has been verified (i.e., product baseline is compliant with the functional baseline) and is ready for validation (operational assessment) with acceptable risk.
Production Readiness Review (PRR)
Recommendation that production processes are mature enough to begin limited production with acceptable risk.
Physical Configuration Audit (PCA) Recommendation to start full-rate production and/or full deployment with acceptable risk.
The George Washington University

Example Technical Review Timeline 7
7 The George Washington University

• Process to collect, analyze, and report data relating to products developed • Measured results support decision management across the system life cycle • Provides insight into the health of the respective measured activities
Systems Engineering Measurement 8
8
“Are we on track to meet CDR?” “Will we achieve the desired reliability performance by FCA?”
“Have we matured the detail design properly to support PRR?”
Lagging Leading
The George Washington University

The George Washington University
INCOSE’s Systems Engineering Leading Indicators Guide Version 2.0 defines SE leading indicators as: • A measure for evaluating the effectiveness of how a specific activity is
applied on a project in a manner that provides information about impacts that are likely to affect the system performance objectives
• May be an individual measure, or collection of measures and associated analysis that are predictive of future systems engineering performance before the system is fully realized.
• Systems engineering performance itself could be an indicator of future project execution and system performance (see SEI/NDIA’s The Business Case for Systems Engineering Study: Results of the Systems Engineering Effectiveness Survey dated November 2012 – Special Report CMU/SEI-2012-SR-011)
Leading Indicators Defined 9
9

Technical Measurement Trends Example: Reliability Growth Curve
MTB
F (h
ours
)
Goal MTBF (MG)
IOC
10 The George Washington University Time
Mean Time Between Failure
(MTBF) Measurement
Phase I Phase II Phase III
Initial MTBF (MI)
SVR CDR PDR

The George Washington University
Technical Review Dashboard 10
11
• Provides representation of measure driven gauges that depict trends • Provide value by representing the collecting, analyzing and
synthesizing the data into a format that aids decision making • In much better position to characterize progress, compare
alternatives, assess risk and predict future outcomes • Objectively assess readiness & RISK with moving forward (exit)
Insert Key Leading Indicators into Dashboard (i.e. CDR Dashboard)

The George Washington University
Example Framework for Planning LIs
12
Leading Indicator ASR SRR PDR CDR SVR FCA PRR PCA Requirements Trends ⊕ ⊕ ⊕
System Definition Change Backlog ⊕ ⊕
Interface Trends ⊕ ⊕
Requirements Validation Trends ⊕ ⊕
Requirements Verification Trends ⊕ ⊕
Work Product Approval Trends ⊕ ⊕ ⊕ ⊕ ⊕ ⊕ ⊕ ⊕ Review Action Closure Trends ⊕ ⊕ ⊕ ⊕ ⊕ ⊕ ⊕ ⊕ Technology Maturity Trends ⊕ ⊕ Risk Exposure Trends ⊕ ⊕ Risk Handling Trends ⊕ ⊕ Systems Engineering Staffing & Skills Trends ⊕ ⊕ ⊕ ⊕ ⊕ ⊕
Process Compliance Trends ⊕ ⊕ ⊕ ⊕ ⊕ ⊕ ⊕ ⊕
Technical Measurement Trends ⊕ ⊕ ⊕ ⊕ ⊕ Facility and Equipment Availability Trends ⊕ ⊕ ⊕ ⊕ ⊕ ⊕
Defect and Error Trends ⊕ ⊕ System Affordability Trends ⊕ ⊕ Architecture Trends ⊕ ⊕ ⊕ Schedule and Cost Pressure ⊕ ⊕ ⊕ ⊕ ⊕ ⊕ ⊕ ⊕

Technical Measurement TrendsExample: Reliability Growth Curve
MTB
F (h
ours
)
Goal MTBF(MG)
IOC
10 The George Washington UniversityTime
Mean Time Between Failure
(MTBF) Measurement Phase I Phase II Phase III
Initial MTBF(MI)
SVRCDRPDR
The George Washington University
Plan
Ris
k M
anag
emen
t
Risk Documentation
Identify Risks
Perform Risk Analysis
Plan Risk Responses
Monitor and Control Risks
5
Risk Management Activities 13
Leading Indicators Provide Valuable Insight into Execution Risk
13
Like
lihoo
d
Consequence
34
Risk Item #34 Reliability Performance

The George Washington University
S –Curve: (Cumulative Distribution Function) • Using statistical analysis to assess cost
and create a risk-adjusted point estimate • Depicts the program’s range of potential
outcomes based on risks/opportunities • Each point on the curve indicates the
cumulative probability (y-value) that the cost will be < that amount (x-value)
• Very useful in portraying the uncertainty implications of various cost estimates
8
6 General Accounting Office (GAO). (2009). GAO Cost Estimating and Assessment Guide – Best Practices for Developing and Managing Capital Program Costs. (GAO-09-3SP). Washington D.C.
S-Curve Analysis14
Bottom Line – What is the Cost Confidence (to Execute)?
14

The George Washington University
Road Forward - Scientific Hypothesis
• Are there key systems engineering metrics that can be monitored that will increase the prediction of a program’s ability to meet cost, schedule and technical performance requirements?
– Example question: Are we at risk of meeting the planned CDR?
• Can these factors be evaluated at key decision gates to build confidence in the successful execution of a program?
• Is there a standard scorecard for technical reviews?
H1: A correlation exists between systems engineering leading indicators and performance
H2: Those programs that use a defined set of systems engineering measures will perform better
15

The George Washington University
References
16
1. Wiener, N. Cybernetics – or Control and Communication in the Animal and the Machine. Second Edition. Cambridge, MA: M.I.T. Press, 1961.
2. Defense Acquisition University Press. Systems engineering fundamentals book. Fort Belvoir, VA: Defense Acquisition University Press. January 2001.
3. Webster’s Ninth New Collegiate Dictionary, Merriam-Webster, Springfield, MA, 1987.
4. Elm, J. and Goldenson, D. The business case for systems engineering study: results of the systems engineering effectiveness survey. November 2012.
5. Haskins, C. (Ed.) International Council on Systems Engineering (INCOSE). (2006, June). International council on systems engineering handbook: a guide for system life cycle processes and activities, version 3.0, Seattle, WA: INCOSE.
6. Defense Acquisition University Press. (2013). Defense Acquisition Guidebook. Retrieved from https://acc.dau.mil/dag.
7. Department of Defense. Naval Systems Engineering Technical Review Handbook, Version 1.0.
8. ISO/IEC/IEEE Systems and software engineering - system life cycle processes," IEEE STD 15288-2008 , vol., no., pp.c1,84, Jan. 31 2008.
9. Roedler, G. and Rhodes, D.H. Systems engineering leading indicators guide, version 2.0. Massachusetts Institute of Technology, Cambridge, MA. January 2010.
10. Selby, R. Analytics-Driven Dashboards Enable Leading Indicators for Requirements and Designs of Large-Scale Systems. IEEE Software. January/February 2009.
11. Oehmen, J. (2012). The Guide to Lean Enablers for Managing Engineering Programs. (Version 1.0) Massachusetts Institute of Technology, Cambridge, MA.
12. ISO/IEC/IEEE (2010). Systems and Software Engineering Vocabulary. (ISO/IEC/IEEE 24765). New York, NY.
13. IEEE. (2011). Adoption of the Project Management Institute (PMI ®) Standard. IEEE Std 1490TM – 2011. New York, NY.
14. General Accounting Office (GAO). (2009). GAO Cost Estimating and Assessment Guide – Best Practices for Developing and Managing Capital Program Costs. (GAO-09-3SP). Washington D.C.

BACKUP SLIDES

The George Washington University
INCOSE’s 18 Leading Indicators (1 of 2) 9
18
Leading Indicator Description
Requirements Trends Rate of maturity of the system definition against the plan. Additionally, characterizes the stability and completeness of the system requirements that could potentially impact design, production, operational utility, or support.
System Definition Change Backlog Trends
Change request backlog which, when excessive, could have adverse impact on the technical, cost and schedule baselines.
Interface Trends Interface specification closure against plan. Lack of timely closure could pose adverse impact to system architecture, design, implementation and/or V&V any of which could pose technical, cost and schedule impact.
Requirements Validation Trends
Progress against plan in assuring that the customer requirements are valid and properly understood. Adverse trends would pose impacts to system design activity with corresponding impacts to technical, cost & schedule baselines and customer satisfaction.
Requirements Verification Trends
Progress against plan in verifying that the design meets the specified requirements. Adverse trends would indicate inadequate design and rework that could impact technical, cost and schedule baselines. Also, potential adverse operational effectiveness of the system.
Work Product Approval Trends
Adequacy of internal processes for the work being performed and also the adequacy of the document review process, both internal and external to the organization. High reject count would suggest poor quality work or a poor document review process each of which could have adverse cost, schedule and customer satisfaction impact.
Review Action Closure Trends
Responsiveness of the organization in closing post-review actions. Adverse trends could forecast potential technical, cost and schedule baseline issues.
Technology Maturity Trends
Risk associated with incorporation of new technology or failure to refresh dated technology. Adoption of immature technology could introduce significant risk during development while failure to refresh dates technology could have operational effectiveness/customer satisfaction impact.

The George Washington University
INCOSE’s 18 Leading Indicators (2 of 2) 9
19
Leading Indicator Description
Risk Exposure Trends Effectiveness of risk management process in managing / mitigating technical, cost & schedule risks. An effective risk handing process will lower risk exposure trends.
Risk Treatment Trends Effectiveness of the systems engineering organization in implementing risk mitigation activities. If the systems engineering organization is not retiring risk in a timely manner, additional resources can be allocated before additional problems are created.
SE Staffing & Skills Trends
Quantity and quality of systems engineering personnel assigned, the skill and seniority mix, and the time phasing of their application throughout the project lifecycle.
Process Compliance Trends
Quality and consistency of the project defined systems engineering process as documented in SEP/SEMP. Poor/inconsistent systems engineering processes and/or failure to adhere to SEP/SEMP, increase project risk.
Technical Measurement Trends
Progress towards meeting the Measures of Effectiveness (MOEs) / Performance (MOPs) / Key Performance Parameters (KPPs) and Technical Performance Measures (TPMs). Lack of timely closure is an indicator of performance deficiencies in the product design and/or project team’s performance.
Facility & Equipment Availability Trends Availability of non-personnel resources (infrastructure, capital assets, etc.) needed throughout the project lifecycle.
Defect/Error Trends Progress towards the creation of a product or the delivery of a service that meets the quality expectations of its recipient. Understanding the proportion of defects being found and opportunities for finding defects at each stage of the development process of a product or the execution of a service.
System Affordability Trends
Progress towards a system that is affordable for the stakeholders. Understanding the balance between performance, cost, and schedule and the associated confidence or risk.
Architecture Trends Maturity of an organization with regards to implementation and deployment of an architecture process that is based on an accept set of industry standards and guidelines.
Schedule and Cost Pressure Impact of schedule and cost challenges on carrying out a project
