fracture toughness and r-curve behavior of laminated brittle
TRANSCRIPT
METALLURGICAL AND MATERIALS TRANSACTIONS A VOLUME 29A, OCTOBER 1998—2483
Fracture Toughness and R-Curve Behavior of LaminatedBrittle-Matrix Composites
D.R. BLOYER, K.T. VENKATESWARA RAO and R.O. RITCHIE
The fracture toughness and resistance-curve behavior of relatively coarse-scale, niobium/niobiumaluminide (Nb/Nb3Al) laminated composites have been examined and compared to other Nb/Nb3Alcomposites with (in situ) Nb particulate or microlaminate reinforcements. The addition of high aspect-ratio Nb reinforcements, in the form of 20 vol. pct of 50- to 250-mm-thick layers, was seen toimprove the toughness of the Nb3Al intermetallic matrix by well over an order of magnitude, withthe toughness increasing with Nb layer thickness. The orientation of the laminate had a small effecton crack-growth resistance with optimal properties being found in the crack arrester, as comparedto the crack divider, orientation. The high fracture toughness of these laminates was primarily at-tributed to large (;1- to 6-mm) crack-bridging zones formed by intact Nb layers in the crack wake;these zones were of sufficient size that large-scale bridging (LSB) conditions generally prevailed inthe samples tested. Resistance-curve modeling using weight function methods permitted the deter-mination of simple approximations for the bridging tractions, which were then used to make small-scale bridging (SSB) predictions for the steady-state toughness of each laminate.
I. INTRODUCTION
IN recent years, several intermetallic compounds havebeen developed with many desirable properties for potentialuse in structural and aerospace applications;[1] these prop-erties include high melting points (typically ;15007C to20007C), low densities (typically 4 to 8 g/cm3), and goodcreep resistance.[2–5] However, the disadvantage of thesematerials is that they are often very brittle due to a highresistance to dislocation motion resulting from their rela-tively complex, ordered crystal structures. For example, incomparison to toughnesses of ;50 to 100 MPa shown=mby traditional Ti- and Ni-based alloys, intermetallics suchas Nb3Al and MoSi2 typically display fracture toughness,Kc, values below ;4 MPa ; in fact, even in the more=m‘‘ductile’’ compounds such as g-TiAl, intrinsic toughnessesare typically ;10 MPa .=m
To improve the low intrinsic toughnesses of intermetal-lics, extrinsic toughening techniques that invoke crack-tipshielding mechanisms are often used in alloy and micro-structural development. Such mechanisms, which includecrack bridging via ductile or brittle reinforcements, primar-ily act behind the crack tip and locally screen the crackfrom the applied (far-field) driving force.[6,7] Using ductilereinforcements, the principle is to promote crack-particleinteractions to create bridging ligaments in the crack wake,which deform plastically and impart closing tractions onthe crack faces.
D.R. BLOYER, Postdoctoral Researcher, and R.O. RITCHIE,Professor, are with the Department of Materials Science and MineralEngineering, University of California, and the Materials SciencesDivision, Lawrence Berkeley National Laboratory, Berkeley, CA 94720-1760. K.T. VENKATESWARA RAO, formerly Research Engineer withthe Department of Materials Science and Mineral Engineering, Universityof California, is Manager of R&D, Vascular Intervention Group, GuidantCorporation, Santa Clara, CA 95052.
Manuscript submitted December 9, 1997.
Under small-scale bridging (SSB) conditions,* the in-
*Small-scale bridging conditions apply where the bridging tractions actover a distance that is small relative to the crack length and in-planespecimen dimensions; in this regime, Gb is independent of crack lengthand specimen geometry. With larger bridging zones, the tractioncontribution is a function of crack length and geometry; this is referredto as large-scale bridging (LSB).
crease in fracture energy due to ductile reinforcements, Gb,can be formulated in terms of the physical properties of thereinforcement and interface by relating it to a nondimen-sional work of rupture, x:[8,9,10]
u*/rus( /r)
ux 5 * z d( /r) [1]s00
where s(u) is the stress-displacement function of the bridgingtractions; u* is the displacement at failure of the bridgingligament; and s0 and r are, respectively, the flow stress andcharacteristic dimension of the reinforcement, such that[8]
G 5 f z r z s z x [2]b 0
where f is the volume fraction of reinforcement interceptedby the crack. This additional energy to fracture the bridgingligaments is typically exhibited in the form of resistance-curve (R-curve) behavior, where the (crack-growth) tough-ness increases with crack extension, commensurate with thedevelopment of a bridging zone in the crack wake.
Alternatively, the toughening can be described in termsof stress intensities, where the steady-state toughness, Kss,can be modeled by superposing (using G and then convert-ing back to K) the reinforcement toughening contributionwith the intrinsic fracture toughness of the composite, K0
(i.e., the matrix or crack-initiation toughness*):[8,9,10]
*The crack-initiation toughness of the composite can be markedlyhigher than the matrix toughness, for example, where the crack mustrenucleate across a second phase.[30,33]
2=K 5 K 1 E 'fs rx [3]ss 0 0
2484—VOLUME 29A, OCTOBER 1998 METALLURGICAL AND MATERIALS TRANSACTIONS A
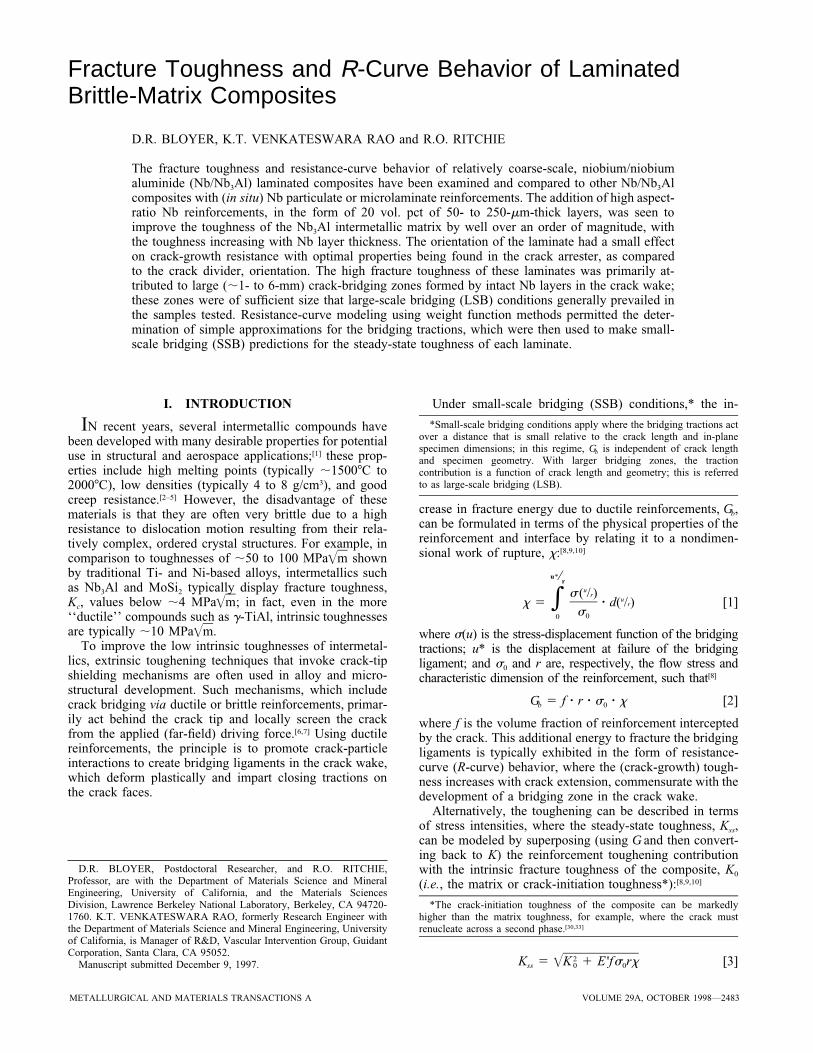
Fig. 1—Schematic of achievable trends in toughness for various compositereinforcement geometries.
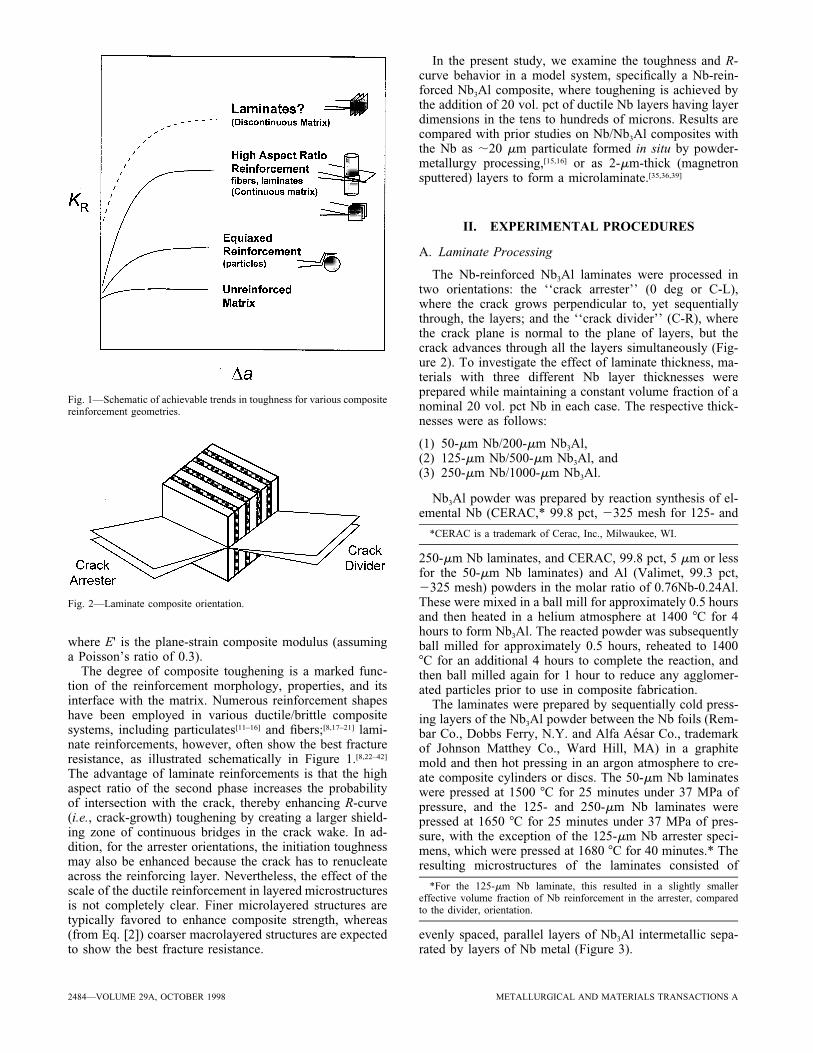
Fig. 2—Laminate composite orientation.
where E' is the plane-strain composite modulus (assuminga Poisson’s ratio of 0.3).
The degree of composite toughening is a marked func-tion of the reinforcement morphology, properties, and itsinterface with the matrix. Numerous reinforcement shapeshave been employed in various ductile/brittle compositesystems, including particulates[11–16] and fibers;[8,17–21] lami-nate reinforcements, however, often show the best fractureresistance, as illustrated schematically in Figure 1.[8,22–42]
The advantage of laminate reinforcements is that the highaspect ratio of the second phase increases the probabilityof intersection with the crack, thereby enhancing R-curve(i.e., crack-growth) toughening by creating a larger shield-ing zone of continuous bridges in the crack wake. In ad-dition, for the arrester orientations, the initiation toughnessmay also be enhanced because the crack has to renucleateacross the reinforcing layer. Nevertheless, the effect of thescale of the ductile reinforcement in layered microstructuresis not completely clear. Finer microlayered structures aretypically favored to enhance composite strength, whereas(from Eq. [2]) coarser macrolayered structures are expectedto show the best fracture resistance.
In the present study, we examine the toughness and R-curve behavior in a model system, specifically a Nb-rein-forced Nb3Al composite, where toughening is achieved bythe addition of 20 vol. pct of ductile Nb layers having layerdimensions in the tens to hundreds of microns. Results arecompared with prior studies on Nb/Nb3Al composites withthe Nb as ;20 mm particulate formed in situ by powder-metallurgy processing,[15,16] or as 2-mm-thick (magnetronsputtered) layers to form a microlaminate.[35,36,39]
II. EXPERIMENTAL PROCEDURES
A. Laminate Processing
The Nb-reinforced Nb3Al laminates were processed intwo orientations: the ‘‘crack arrester’’ (0 deg or C-L),where the crack grows perpendicular to, yet sequentiallythrough, the layers; and the ‘‘crack divider’’ (C-R), wherethe crack plane is normal to the plane of layers, but thecrack advances through all the layers simultaneously (Fig-ure 2). To investigate the effect of laminate thickness, ma-terials with three different Nb layer thicknesses wereprepared while maintaining a constant volume fraction of anominal 20 vol. pct Nb in each case. The respective thick-nesses were as follows:
(1) 50-mm Nb/200-mm Nb3Al,(2) 125-mm Nb/500-mm Nb3Al, and(3) 250-mm Nb/1000-mm Nb3Al.
Nb3Al powder was prepared by reaction synthesis of el-emental Nb (CERAC,* 99.8 pct, 2325 mesh for 125- and
*CERAC is a trademark of Cerac, Inc., Milwaukee, WI.
250-mm Nb laminates, and CERAC, 99.8 pct, 5 mm or lessfor the 50-mm Nb laminates) and Al (Valimet, 99.3 pct,2325 mesh) powders in the molar ratio of 0.76Nb-0.24Al.These were mixed in a ball mill for approximately 0.5 hoursand then heated in a helium atmosphere at 1400 7C for 4hours to form Nb3Al. The reacted powder was subsequentlyball milled for approximately 0.5 hours, reheated to 14007C for an additional 4 hours to complete the reaction, andthen ball milled again for 1 hour to reduce any agglomer-ated particles prior to use in composite fabrication.
The laminates were prepared by sequentially cold press-ing layers of the Nb3Al powder between the Nb foils (Rem-bar Co., Dobbs Ferry, N.Y. and Alfa Aesar Co., trademarkof Johnson Matthey Co., Ward Hill, MA) in a graphitemold and then hot pressing in an argon atmosphere to cre-ate composite cylinders or discs. The 50-mm Nb laminateswere pressed at 1500 7C for 25 minutes under 37 MPa ofpressure, and the 125- and 250-mm Nb laminates werepressed at 1650 7C for 25 minutes under 37 MPa of pres-sure, with the exception of the 125-mm Nb arrester speci-mens, which were pressed at 1680 7C for 40 minutes.* Theresulting microstructures of the laminates consisted of
*For the 125-mm Nb laminate, this resulted in a slightly smallereffective volume fraction of Nb reinforcement in the arrester, comparedto the divider, orientation.
evenly spaced, parallel layers of Nb3Al intermetallic sepa-rated by layers of Nb metal (Figure 3).

METALLURGICAL AND MATERIALS TRANSACTIONS A VOLUME 29A, OCTOBER 1998—2485
(a)
(b)
(c)
Fig. 3—Micrographs of the composite microstructures for the (a) 50-mmNb/200-mm Nb3Al laminate, (b) 125-mm Nb/500-mm Nb3Al laminate, and(c) 250-mm Nb/1000-mm Nb3Al laminate.
Table I. Effective Reinforcement Thickness and VolumeFraction
Nominal NbThickness (mm)
Effective NbThickness (mm)
Effective NbVolume Fraction
50 40 (40)* 0.16 (0.16)125 85 (95) 0.14 (0.15)250 218 (218) 0.17 (0.17)
*Numbers in parentheses represent divider specimens.
B. Microstructural Evaluation
The grain sizes of the metallic and intermetallic layerswere determined by metallographically etching polished
specimens using a standard Nb etch taken from the 1992ASTM Standard E407 (etch no. 164). The average Nb3Algrain sizes, estimated using a simple line-intercept method,were ;4 and 10 mm for the laminates processed at 1500 7Cand 1650 7C to 1680 7C, respectively. Corresponding grainsizes in the Nb were ;100, 220, and 300 mm for the 50-,125-, and 250-mm-thick Nb layers, respectively. Duringprocessing, the Nb grains grew in such a manner that theyencompassed the entire thickness of the metal layer, butthere were many grains along the length of the layer. As aresult, the grain sizes were measured as a ‘‘linear’’ grainsize along the length of the metal layer, and the grain thick-ness was that of the Nb reinforcing layer.
X-ray line scans indicated there was some diffusion ofaluminum into the Nb reinforcing layers, which created adiffusion layer between the metal and intermetallic. Thepresence of the reaction layer was considered to reduce theeffective thickness of the Nb layer and increase the thick-ness of the matrix layer; this, in turn, resulted in slightdifferences in the effective volume fractions of reinforce-ment for the different laminates. Table I lists the effectiveNb layer thickness and volume fraction measurements forthe laminates prepared in this study.
C. Mechanical Testing
Single-edged notched bend beams, SE(B), with a loadingspan of 35 to 40 mm, were used to study the R-curve be-havior of all the arrester laminates. The specimens had athickness of B 5 3.5 mm and a width of W 5 9.3 mm inthe 50-mm Nb/200-mm Nb3Al laminates. Correspondingspecimen sizes in the 125-mm Nb/500-mm Nb3Al laminateswere B 5 3.5 mm and W 5 12.5 mm and B 5 3.6 mmand W 5 13.3 mm for the 250-mm Nb/1000-mm Nb3Allaminates.
Divider laminates, conversely, were assessed using 33-mm-wide, disc-shaped compact-tension, DC(T), specimens.Sample thicknesses were 2.8 mm in the 50-mm Nb/200-mmNb3Al laminates and 3.5 to 3.6 mm in the other two mi-crostructures.
Prior to testing, all specimens were fatigue precracked toa crack length to width ratio, a/W, of at least 0.3. Precrack-ing was conducted on servohydraulic testing machines atnear-threshold stress-intensity ranges (with a load ratio of0.1) in order to minimize microstructural damage ahead ofthe crack tip. The objective was to obtain a sharp crack,yet at the same time to minimize any bridging zones thatmay form in the crack wake prior to R-curve testing. R-curve testing was performed under manual displacementcontrol at a displacement rate of 5 to 10 mm/min, with cracklengths monitored in situ using compliance and, principally,optical techniques. The data presented represent typical re-sults from at least two samples.
III. RESULTS AND DISCUSSION
A. Fracture Toughness and R-Curve Behavior
1. Divider orientationThe R-curve results, plotted in Figure 4(a) for the divider
orientation, illustrate that the addition of high aspect-ratio
2486—VOLUME 29A, OCTOBER 1998 METALLURGICAL AND MATERIALS TRANSACTIONS A
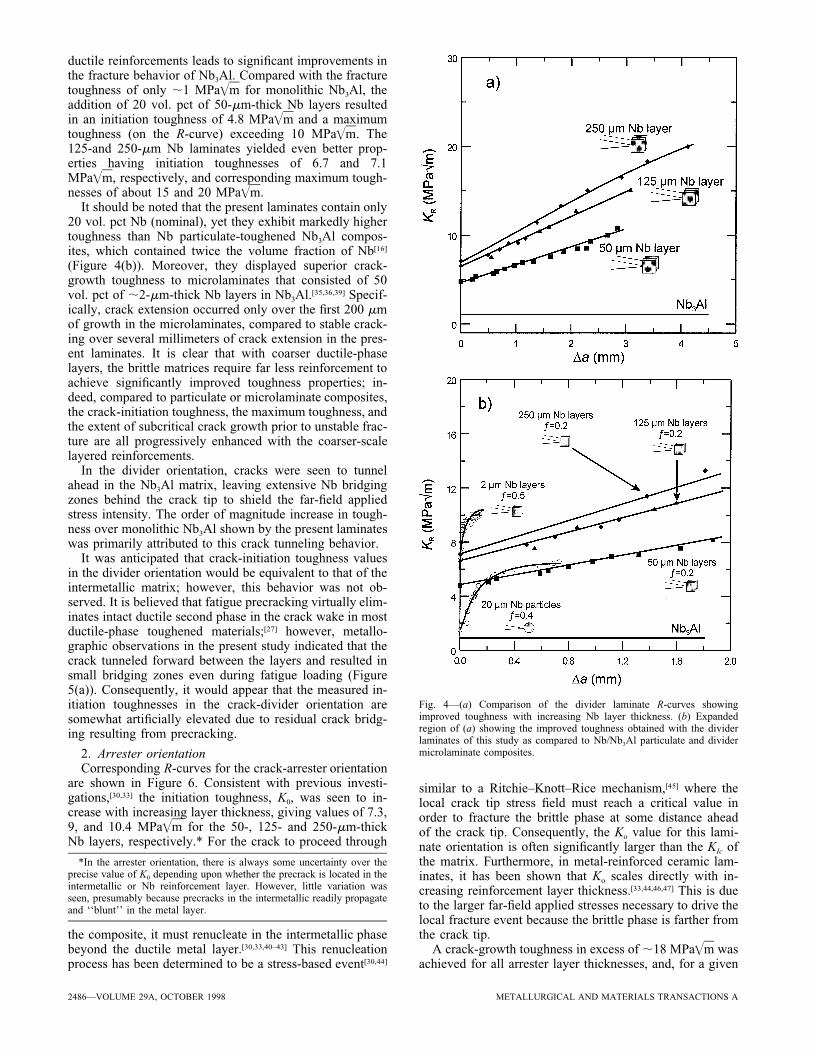
Fig. 4—(a) Comparison of the divider laminate R-curves showingimproved toughness with increasing Nb layer thickness. (b) Expandedregion of (a) showing the improved toughness obtained with the dividerlaminates of this study as compared to Nb/Nb3Al particulate and dividermicrolaminate composites.
ductile reinforcements leads to significant improvements inthe fracture behavior of Nb3Al. Compared with the fracturetoughness of only ;1 MPa for monolithic Nb3Al, the=maddition of 20 vol. pct of 50-mm-thick Nb layers resultedin an initiation toughness of 4.8 MPa and a maximum=mtoughness (on the R-curve) exceeding 10 MPa . The=m125-and 250-mm Nb laminates yielded even better prop-erties having initiation toughnesses of 6.7 and 7.1MPa , respectively, and corresponding maximum tough-=mnesses of about 15 and 20 MPa .=m
It should be noted that the present laminates contain only20 vol. pct Nb (nominal), yet they exhibit markedly highertoughness than Nb particulate-toughened Nb3Al compos-ites, which contained twice the volume fraction of Nb[16]
(Figure 4(b)). Moreover, they displayed superior crack-growth toughness to microlaminates that consisted of 50vol. pct of ;2-mm-thick Nb layers in Nb3Al.[35,36,39] Specif-ically, crack extension occurred only over the first 200 mmof growth in the microlaminates, compared to stable crack-ing over several millimeters of crack extension in the pres-ent laminates. It is clear that with coarser ductile-phaselayers, the brittle matrices require far less reinforcement toachieve significantly improved toughness properties; in-deed, compared to particulate or microlaminate composites,the crack-initiation toughness, the maximum toughness, andthe extent of subcritical crack growth prior to unstable frac-ture are all progressively enhanced with the coarser-scalelayered reinforcements.
In the divider orientation, cracks were seen to tunnelahead in the Nb3Al matrix, leaving extensive Nb bridgingzones behind the crack tip to shield the far-field appliedstress intensity. The order of magnitude increase in tough-ness over monolithic Nb3Al shown by the present laminateswas primarily attributed to this crack tunneling behavior.
It was anticipated that crack-initiation toughness valuesin the divider orientation would be equivalent to that of theintermetallic matrix; however, this behavior was not ob-served. It is believed that fatigue precracking virtually elim-inates intact ductile second phase in the crack wake in mostductile-phase toughened materials;[27] however, metallo-graphic observations in the present study indicated that thecrack tunneled forward between the layers and resulted insmall bridging zones even during fatigue loading (Figure5(a)). Consequently, it would appear that the measured in-itiation toughnesses in the crack-divider orientation aresomewhat artificially elevated due to residual crack bridg-ing resulting from precracking.
2. Arrester orientationCorresponding R-curves for the crack-arrester orientation
are shown in Figure 6. Consistent with previous investi-gations,[30,33] the initiation toughness, K0, was seen to in-crease with increasing layer thickness, giving values of 7.3,9, and 10.4 MPa for the 50-, 125- and 250-mm-thick=mNb layers, respectively.* For the crack to proceed through
*In the arrester orientation, there is always some uncertainty over theprecise value of K0 depending upon whether the precrack is located in theintermetallic or Nb reinforcement layer. However, little variation wasseen, presumably because precracks in the intermetallic readily propagateand ‘‘blunt’’ in the metal layer.
the composite, it must renucleate in the intermetallic phasebeyond the ductile metal layer.[30,33,40–43] This renucleationprocess has been determined to be a stress-based event[30,44]
similar to a Ritchie–Knott–Rice mechanism,[45] where thelocal crack tip stress field must reach a critical value inorder to fracture the brittle phase at some distance aheadof the crack tip. Consequently, the Ko value for this lami-nate orientation is often significantly larger than the KIc ofthe matrix. Furthermore, in metal-reinforced ceramic lam-inates, it has been shown that Ko scales directly with in-creasing reinforcement layer thickness.[33,44,46,47] This is dueto the larger far-field applied stresses necessary to drive thelocal fracture event because the brittle phase is farther fromthe crack tip.
A crack-growth toughness in excess of ;18 MPa was=machieved for all arrester layer thicknesses, and, for a given
METALLURGICAL AND MATERIALS TRANSACTIONS A VOLUME 29A, OCTOBER 1998—2487
(a)
(b)
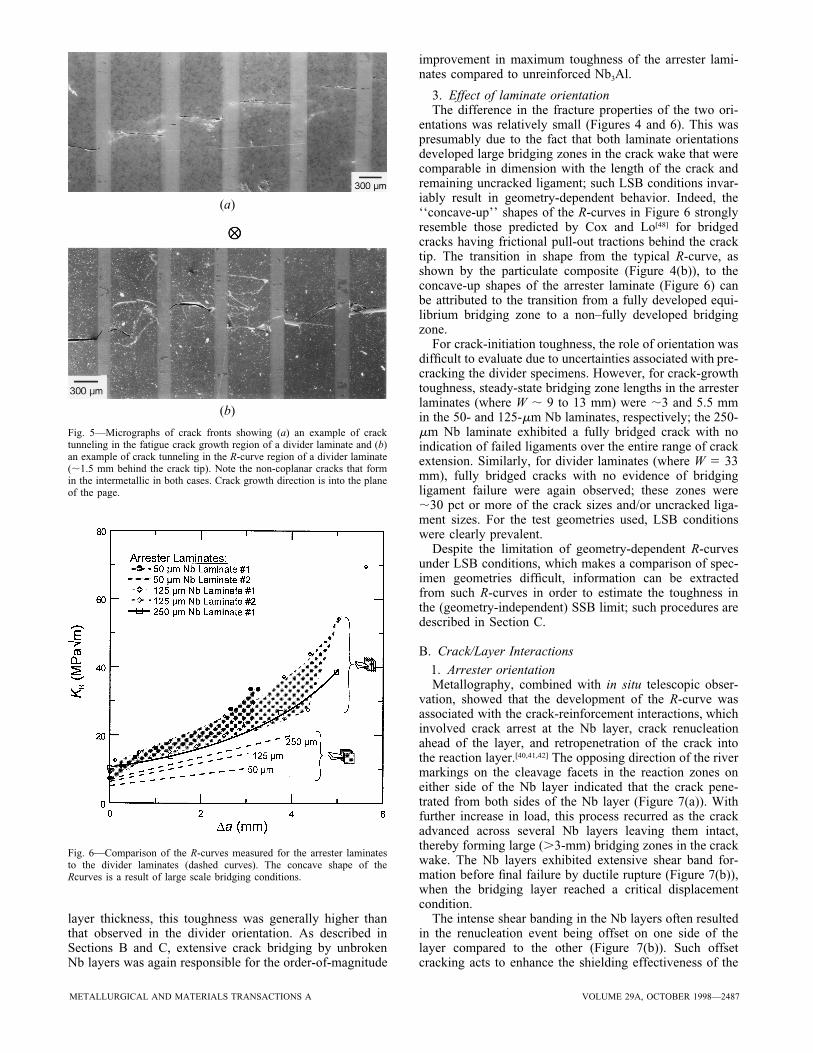
Fig. 5—Micrographs of crack fronts showing (a) an example of cracktunneling in the fatigue crack growth region of a divider laminate and (b)an example of crack tunneling in the R-curve region of a divider laminate(;1.5 mm behind the crack tip). Note the non-coplanar cracks that formin the intermetallic in both cases. Crack growth direction is into the planeof the page.
Fig. 6—Comparison of the R-curves measured for the arrester laminatesto the divider laminates (dashed curves). The concave shape of theRcurves is a result of large scale bridging conditions.
layer thickness, this toughness was generally higher thanthat observed in the divider orientation. As described inSections B and C, extensive crack bridging by unbrokenNb layers was again responsible for the order-of-magnitude
improvement in maximum toughness of the arrester lami-nates compared to unreinforced Nb3Al.
3. Effect of laminate orientationThe difference in the fracture properties of the two ori-
entations was relatively small (Figures 4 and 6). This waspresumably due to the fact that both laminate orientationsdeveloped large bridging zones in the crack wake that werecomparable in dimension with the length of the crack andremaining uncracked ligament; such LSB conditions invar-iably result in geometry-dependent behavior. Indeed, the‘‘concave-up’’ shapes of the R-curves in Figure 6 stronglyresemble those predicted by Cox and Lo[48] for bridgedcracks having frictional pull-out tractions behind the cracktip. The transition in shape from the typical R-curve, asshown by the particulate composite (Figure 4(b)), to theconcave-up shapes of the arrester laminate (Figure 6) canbe attributed to the transition from a fully developed equi-librium bridging zone to a non–fully developed bridgingzone.
For crack-initiation toughness, the role of orientation wasdifficult to evaluate due to uncertainties associated with pre-cracking the divider specimens. However, for crack-growthtoughness, steady-state bridging zone lengths in the arresterlaminates (where W ; 9 to 13 mm) were ;3 and 5.5 mmin the 50- and 125-mm Nb laminates, respectively; the 250-mm Nb laminate exhibited a fully bridged crack with noindication of failed ligaments over the entire range of crackextension. Similarly, for divider laminates (where W 5 33mm), fully bridged cracks with no evidence of bridgingligament failure were again observed; these zones were;30 pct or more of the crack sizes and/or uncracked liga-ment sizes. For the test geometries used, LSB conditionswere clearly prevalent.
Despite the limitation of geometry-dependent R-curvesunder LSB conditions, which makes a comparison of spec-imen geometries difficult, information can be extractedfrom such R-curves in order to estimate the toughness inthe (geometry-independent) SSB limit; such procedures aredescribed in Section C.
B. Crack/Layer Interactions
1. Arrester orientationMetallography, combined with in situ telescopic obser-
vation, showed that the development of the R-curve wasassociated with the crack-reinforcement interactions, whichinvolved crack arrest at the Nb layer, crack renucleationahead of the layer, and retropenetration of the crack intothe reaction layer.[40,41,42] The opposing direction of the rivermarkings on the cleavage facets in the reaction zones oneither side of the Nb layer indicated that the crack pene-trated from both sides of the Nb layer (Figure 7(a)). Withfurther increase in load, this process recurred as the crackadvanced across several Nb layers leaving them intact,thereby forming large (.3-mm) bridging zones in the crackwake. The Nb layers exhibited extensive shear band for-mation before final failure by ductile rupture (Figure 7(b)),when the bridging layer reached a critical displacementcondition.
The intense shear banding in the Nb layers often resultedin the renucleation event being offset on one side of thelayer compared to the other (Figure 7(b)). Such offsetcracking acts to enhance the shielding effectiveness of the
2488—VOLUME 29A, OCTOBER 1998 METALLURGICAL AND MATERIALS TRANSACTIONS A
(a)
(b)
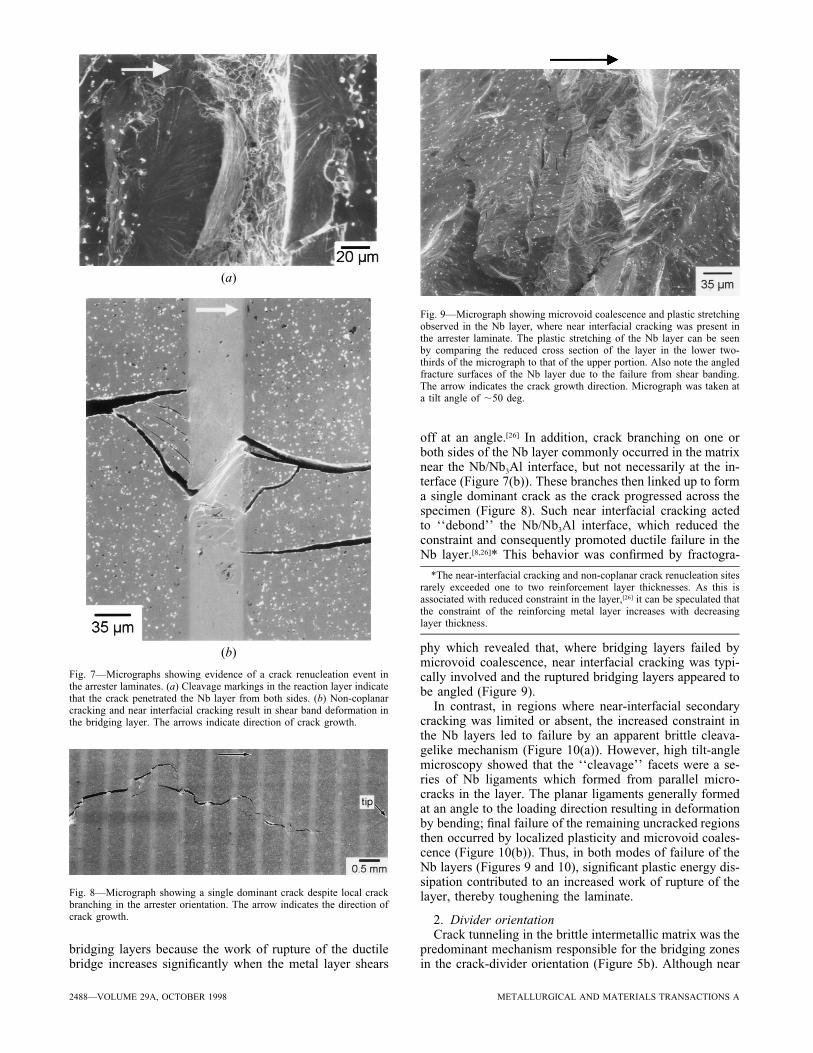
Fig. 7—Micrographs showing evidence of a crack renucleation event inthe arrester laminates. (a) Cleavage markings in the reaction layer indicatethat the crack penetrated the Nb layer from both sides. (b) Non-coplanarcracking and near interfacial cracking result in shear band deformation inthe bridging layer. The arrows indicate direction of crack growth.
Fig. 8—Micrograph showing a single dominant crack despite local crackbranching in the arrester orientation. The arrow indicates the direction ofcrack growth.
Fig. 9—Micrograph showing microvoid coalescence and plastic stretchingobserved in the Nb layer, where near interfacial cracking was present inthe arrester laminate. The plastic stretching of the Nb layer can be seenby comparing the reduced cross section of the layer in the lower two-thirds of the micrograph to that of the upper portion. Also note the angledfracture surfaces of the Nb layer due to the failure from shear banding.The arrow indicates the crack growth direction. Micrograph was taken ata tilt angle of ;50 deg.
bridging layers because the work of rupture of the ductilebridge increases significantly when the metal layer shears
off at an angle.[26] In addition, crack branching on one orboth sides of the Nb layer commonly occurred in the matrixnear the Nb/Nb3Al interface, but not necessarily at the in-terface (Figure 7(b)). These branches then linked up to forma single dominant crack as the crack progressed across thespecimen (Figure 8). Such near interfacial cracking actedto ‘‘debond’’ the Nb/Nb3Al interface, which reduced theconstraint and consequently promoted ductile failure in theNb layer.[8,26]* This behavior was confirmed by fractogra-
*The near-interfacial cracking and non-coplanar crack renucleation sitesrarely exceeded one to two reinforcement layer thicknesses. As this isassociated with reduced constraint in the layer,[26] it can be speculated thatthe constraint of the reinforcing metal layer increases with decreasinglayer thickness.
phy which revealed that, where bridging layers failed bymicrovoid coalescence, near interfacial cracking was typi-cally involved and the ruptured bridging layers appeared tobe angled (Figure 9).
In contrast, in regions where near-interfacial secondarycracking was limited or absent, the increased constraint inthe Nb layers led to failure by an apparent brittle cleava-gelike mechanism (Figure 10(a)). However, high tilt-anglemicroscopy showed that the ‘‘cleavage’’ facets were a se-ries of Nb ligaments which formed from parallel micro-cracks in the layer. The planar ligaments generally formedat an angle to the loading direction resulting in deformationby bending; final failure of the remaining uncracked regionsthen occurred by localized plasticity and microvoid coales-cence (Figure 10(b)). Thus, in both modes of failure of theNb layers (Figures 9 and 10), significant plastic energy dis-sipation contributed to an increased work of rupture of thelayer, thereby toughening the laminate.
2. Divider orientationCrack tunneling in the brittle intermetallic matrix was the
predominant mechanism responsible for the bridging zonesin the crack-divider orientation (Figure 5b). Although near

METALLURGICAL AND MATERIALS TRANSACTIONS A VOLUME 29A, OCTOBER 1998—2489
(a)
(b)
Fig. 10—Micrographs showing (a) apparent cleavage fracture of the Nblayer in regions where there was no near interfacial cracking (0 deg tiltangle), but (b) high tilt angle microscopy (tilt angle of ;60 deg) of sureregion indicates that offset cracks form in the highly constrained Nb layer.This leads to intact ductile bridging ligaments, which dissipate plasticenergy by microvoid coalescence and shear banding during failure. Thearrow indicates the crack growth direction.
Fig. 11—Micrograph showing microvoid coalescence and plasticstretching observed in the Nb layer, where near interfacial cracking waspresent in the divider laminate. Plastic stretching of the Nb is indicatedby the reduced cross section of the layer in the center of the micrograph.Also note the angled fracture surfaces of the Nb layer that result fromshear band failure due to the non-coplanar cracking in the intermetallic.The arrow indicates the crack growth direction. Micrographs were takenat a tilt angle of ;50 deg.
Fig. 12—Micrograph of the diffuse crack branching zone observed in thedivider laminates after several millimeters of crack growth during R-curvetesting. Notice the deflection of the crack back toward the load line of theDC(T) specimen. The arrow indicates the crack growth direction.
interfacial cracking was more frequent than in the arresterspecimens, it was again observed that the cracks in theNb3Al layers propagated on a non-coplanar path (Figure5b). This led to localized shear band deformation in the Nbbridging layers and angled fracture surfaces that revealedextensive microvoid coalescence in the fractured layers(Figure 11).
Metallographic sectioning during R-curve measurementindicated that a single crack grew stably for a several mil-limeters before appearing to arrest; however, upon furtherloading, an extensive microcrack zone (with dimensions ofthe order of 100 mm) developed ahead of the crack tip,making further definition of the crack length difficult (Fig-ure 12). Measurements were typically halted at this pointas a K-based ‘‘single dominant crack’’ approach becomesinappropriate. As shown in Figure 12, the microcrackingzone envelops the main crack, extending both ahead of theoriginal crack tip and deflecting completely around suchthat microcracks appear to be propagating back toward the
mouth of the specimen. Using metallographic sectioning(perpendicular to the crack and advancing from the notchtip toward the crack tip) in order to reveal the evolution ofthe microcrack zone, multiple cracking of the Nb3Al couldbe observed as far back as ;1 to 2 mm behind the main

2490—VOLUME 29A, OCTOBER 1998 METALLURGICAL AND MATERIALS TRANSACTIONS A
Fig. 13—Cross section of the crack front in the divider R-curve specimentaken at the approximate crack tip. In this case, a dominant crack tipbecomes difficult to define. The crack growth direction is into the page.
Fig. 14—Schematic representation of the model used to determine theshielding contribution provided by the Nb bridging ligaments in the crackwake. It is important to recognize that the integration length variable, x,is measured from the load line to the crack tip.
crack tip, the extent of microcracking becoming progres-sively larger closer to the crack tip (Figure 13).*
*Whereas some of this damage clearly developed during R-curvetesting, it is believed that it was exacerbated by the additional sustainedloading period imposed to monitor the development of microcracking afterthe R-curve measurements had been halted.
C. Models for Toughening
From these experimental observations, it is apparent thatthe source of the R-curve (crack-growth) toughness in theNb/Nb3Al laminates is associated principally with thecrack-tip shielding that results from the bridging of intactNb layers in the wake of the crack. Quantitatively, the con-tribution to the toughness due to crack bridging can be ob-tained by calculating the reduction in the near-tip stressintensity, Kb, caused by the appropriate crack-surface trac-tion stress distribution. The problem depends upon thegiven traction distribution, crack length, and specimen ge-ometry; generalized solutions employ weight functions tocalculate the stress intensity reduction caused by the shield-ing zone for any form of the traction function.[48–53] Thebridging contribution is formulated as
K 5 *s(x)h(a,x)dx [4]b
L
where s(x) is the traction as a function of distance x behindthe crack tip, h(a,x) is the weight function, and the integra-tion limits are determined by the bridging zone length, L(x and L are measured from the load line or specimen edge(Figure 14)). If the shielding contribution is superposedwith the intrinsic toughness of the composite, the measuredtoughness, Kc,app, for a given loading condition can be pre-dicted by
K 5 K 1 K [5]c,app 0 b
where Ko is taken to be the crack-initiation toughness ofthe composite.
Computation of Eq. [4] requires knowledge of the trac-tion function, s(x), which in turn depends on the stress-displacement behavior, s(u), of the bridging ligaments andthe crack-opening profile, u(x). These functions are gener-
ally obtained by the direct measurement of the constrainedstress-displacement behavior of the specific composite sys-tem* or of the crack-opening profile of the system under
*More recently, self-consistent numerical techniques have beendeveloped to calculate these functions with only knowledge of the criticalpoints of s(u) and u(x);[48] however, these methods have not receivedwidespread use to date because of difficulties in obtaining stable solutionsto the integral problems required by the technique and the intensivenumerical analysis of the iterative solutions.
load.[8,17,26,54]
A simplified approach to this problem is to assume thats(x) is a constant function and uniformly active over thebridging zone;[18] the magnitude of the traction function isthen equal to some characteristic flow parameter, sc, whicheffectively is the constrained flow stress of the metal rein-forcement. Alternatively, it can be taken to be equivalentto the uniaxial yield or flow strength of the metal.[18] Thediscreteness of the reinforcement is accounted for by mul-tiplying by the volume fraction, f, of the reinforcement.With these assumptions, the function s(x) becomes fsc, andEqs. [4] and [5] can be rewritten as
K 5 K 1 fs *h(a,x)dx [6]c,app 0 c
L
Previous studies of Nb reinforcements in other intermetallicmatrices, e.g., in MoSi2
[55] and Nb5Si3,[38] indicate that theconstrained load/displacement curve for a constrained Nblayer rises rapidly to a relatively constant plateau with con-tinuing displacement. Consequently, the assumption of aconstant traction function for Nb-reinforced composites ap-pears to be reasonable and, thus, is used in the followinganalysis of R-curve behavior.
METALLURGICAL AND MATERIALS TRANSACTIONS A VOLUME 29A, OCTOBER 1998—2491
(a) (b)
(c)
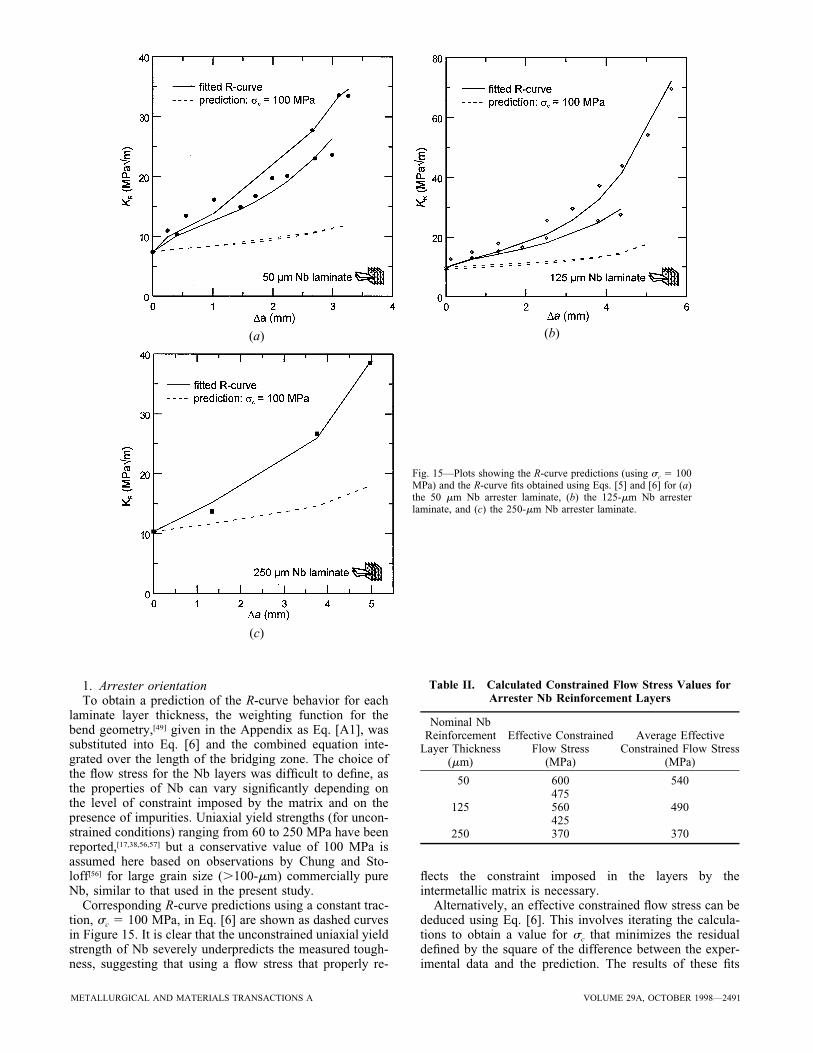
Fig. 15—Plots showing the R-curve predictions (using sc 5 100MPa) and the R-curve fits obtained using Eqs. [5] and [6] for (a)the 50 mm Nb arrester laminate, (b) the 125-mm Nb arresterlaminate, and (c) the 250-mm Nb arrester laminate.
Table II. Calculated Constrained Flow Stress Values forArrester Nb Reinforcement Layers
Nominal NbReinforcement
Layer Thickness(mm)
Effective ConstrainedFlow Stress
(MPa)
Average EffectiveConstrained Flow Stress
(MPa)
50 600 540475
125 560 490425
250 370 370
1. Arrester orientationTo obtain a prediction of the R-curve behavior for each
laminate layer thickness, the weighting function for thebend geometry,[49] given in the Appendix as Eq. [A1], wassubstituted into Eq. [6] and the combined equation inte-grated over the length of the bridging zone. The choice ofthe flow stress for the Nb layers was difficult to define, asthe properties of Nb can vary significantly depending onthe level of constraint imposed by the matrix and on thepresence of impurities. Uniaxial yield strengths (for uncon-strained conditions) ranging from 60 to 250 MPa have beenreported,[17,38,56,57] but a conservative value of 100 MPa isassumed here based on observations by Chung and Sto-loff[56] for large grain size (.100-mm) commercially pureNb, similar to that used in the present study.
Corresponding R-curve predictions using a constant trac-tion, sc 5 100 MPa, in Eq. [6] are shown as dashed curvesin Figure 15. It is clear that the unconstrained uniaxial yieldstrength of Nb severely underpredicts the measured tough-ness, suggesting that using a flow stress that properly re-
flects the constraint imposed in the layers by theintermetallic matrix is necessary.
Alternatively, an effective constrained flow stress can bededuced using Eq. [6]. This involves iterating the calcula-tions to obtain a value for sc that minimizes the residualdefined by the square of the difference between the exper-imental data and the prediction. The results of these fits
2492—VOLUME 29A, OCTOBER 1998 METALLURGICAL AND MATERIALS TRANSACTIONS A
(a)
(b)
(c)
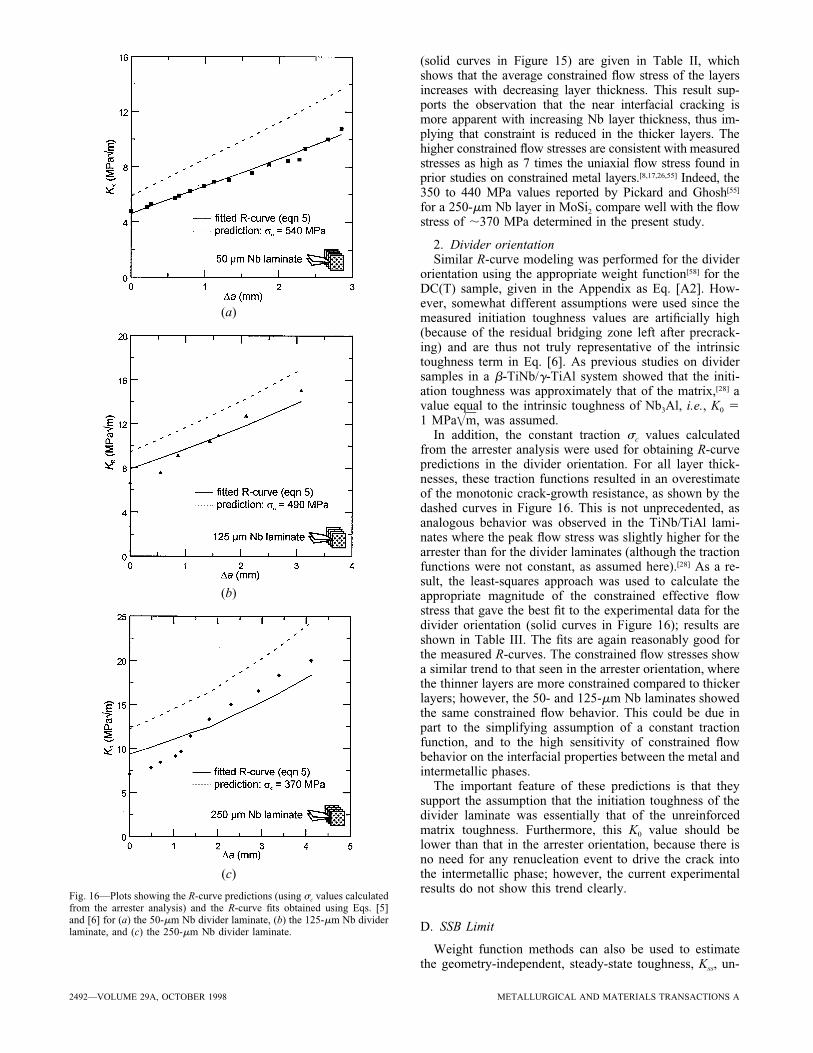
Fig. 16—Plots showing the R-curve predictions (using sc values calculatedfrom the arrester analysis) and the R-curve fits obtained using Eqs. [5]and [6] for (a) the 50-mm Nb divider laminate, (b) the 125-mm Nb dividerlaminate, and (c) the 250-mm Nb divider laminate.
(solid curves in Figure 15) are given in Table II, whichshows that the average constrained flow stress of the layersincreases with decreasing layer thickness. This result sup-ports the observation that the near interfacial cracking ismore apparent with increasing Nb layer thickness, thus im-plying that constraint is reduced in the thicker layers. Thehigher constrained flow stresses are consistent with measuredstresses as high as 7 times the uniaxial flow stress found inprior studies on constrained metal layers.[8,17,26,55] Indeed, the350 to 440 MPa values reported by Pickard and Ghosh[55]
for a 250-mm Nb layer in MoSi2 compare well with the flowstress of ;370 MPa determined in the present study.
2. Divider orientationSimilar R-curve modeling was performed for the divider
orientation using the appropriate weight function[58] for theDC(T) sample, given in the Appendix as Eq. [A2]. How-ever, somewhat different assumptions were used since themeasured initiation toughness values are artificially high(because of the residual bridging zone left after precrack-ing) and are thus not truly representative of the intrinsictoughness term in Eq. [6]. As previous studies on dividersamples in a b-TiNb/g-TiAl system showed that the initi-ation toughness was approximately that of the matrix,[28] avalue equal to the intrinsic toughness of Nb3Al, i.e., K0 51 MPa , was assumed.=m
In addition, the constant traction sc values calculatedfrom the arrester analysis were used for obtaining R-curvepredictions in the divider orientation. For all layer thick-nesses, these traction functions resulted in an overestimateof the monotonic crack-growth resistance, as shown by thedashed curves in Figure 16. This is not unprecedented, asanalogous behavior was observed in the TiNb/TiAl lami-nates where the peak flow stress was slightly higher for thearrester than for the divider laminates (although the tractionfunctions were not constant, as assumed here).[28] As a re-sult, the least-squares approach was used to calculate theappropriate magnitude of the constrained effective flowstress that gave the best fit to the experimental data for thedivider orientation (solid curves in Figure 16); results areshown in Table III. The fits are again reasonably good forthe measured R-curves. The constrained flow stresses showa similar trend to that seen in the arrester orientation, wherethe thinner layers are more constrained compared to thickerlayers; however, the 50- and 125-mm Nb laminates showedthe same constrained flow behavior. This could be due inpart to the simplifying assumption of a constant tractionfunction, and to the high sensitivity of constrained flowbehavior on the interfacial properties between the metal andintermetallic phases.
The important feature of these predictions is that theysupport the assumption that the initiation toughness of thedivider laminate was essentially that of the unreinforcedmatrix toughness. Furthermore, this K0 value should belower than that in the arrester orientation, because there isno need for any renucleation event to drive the crack intothe intermetallic phase; however, the current experimentalresults do not show this trend clearly.
D. SSB Limit
Weight function methods can also be used to estimatethe geometry-independent, steady-state toughness, Kss, un-

METALLURGICAL AND MATERIALS TRANSACTIONS A VOLUME 29A, OCTOBER 1998—2493
Table III. Calculated Constrained Flow Stress Values forDivider Nb Reinforcement Layers
Nominal ReinforcementLayer Thickness (mm)
Effective ConstrainedFlow Stress (MPa)
50 400125 400250 275
der SSB conditions, provided that both the traction functionand the bridging-zone length are known. As these featuresare known only for the 50- and 125-mm Nb arrester lami-nates, they are used here to estimate the SSB Kss values.Assuming that the bridging-zone lengths are not a functionof specimen size, Kss can be calculated from Eqs. [6] and[A1] using a specimen width that is significantly larger thanthe bridging-zone size. Given bridging-zone sizes of 3 and5.5 mm for the 50- and 125-mm Nb arrester laminates, re-spectively, it was found that specimen widths of ;80 and180 mm would be required in order to obtain R-curves thatreflected SSB conditions. The predictions, shown in Figure17, indicate that R-curves under SSB conditions display adistinct plateau, with maximum (steady-state) toughnessesof 15.5 and 18.4 MPa for the 50- and 125-mm Nb ar-=mrester laminates, respectively, indicating a clear toughnessenhancement with the thicker reinforcement layers (Figure17(c)).
Similar analyses could not be used for the other lami-nates, as no equilibrium bridging zones were found in thesamples tested. As an alternative, the energy approach ofAshby and co-workers[8] (Eq. [3]) can be used to estimatethe SSB Kss. To evaluate Eq. [3], we substitute the con-strained flow stress value, calculated from the LSB analysis,for xs0 and correct the values of half-layer thickness r andvolume fraction f of the Nb for the effect of the reaction-layer thickness to predict a SSB Kss. Table IV shows theparameters and results of these calculations for the differentlayer thicknesses and laminate orientations.
The predictions of the SSB Kss values of 17 and 22MPa obtained, respectively, for the 50- and 125-mm Nb=marrester laminates using this simple physical model comparewell with the corresponding predictions of the more rigor-ous weight function method of 15.5 and 18.4 MPa . This=msuggests that the use of the energy-based model is generallyvalid for these laminates, as maximum toughness values arereasonably consistent with measured values (Figures 4 and6) for both laminate orientations, although it does appearto overpredict the maximum toughness. It would, therefore,be more conservative to treat the predictions of this modelas an upper bound to the maximum toughness achievablefor ductile-phase reinforced brittle matrix composites.
E. Role of Microstructure
The current work indicates that laminated compositesprovide optimal toughness properties compared to other re-inforcement morphologies, as shown by Kss toughnesses inNb/Nb3Al some 2 to 3 times higher than particulate-rein-forced alloys. In particular, coarser-scale laminates appearto offer the best approach for achieving high toughness inductile-phase reinforced brittle-matrix composites for struc-
tural applications. Properties, however, are dependent onlaminate orientation and the reinforcing layer thickness.
1. Laminate orientationExperimental and modeling studies show that the crack-
arrester orientation provides the better initiation K0 andgrowth Kss toughnesses compared to the crack-divider com-posites. The higher K0 values result from the renucleationevent across the Nb reinforcing layer, which is necessaryfor crack propagation in the arrester laminates. Conversely,for the divider orientation, K0 values approach that of theNb3Al matrix, consistent with earlier investigations of lam-inate fracture toughness behavior.[28] With respect to crack-growth toughness, the difference between the two orienta-tions is not large and is again likely to be related to crackrenucleation. In the arrester orientation, renucleation eventslead to complicated, meandering crack paths that result incomplex deformation of the bridging Nb layers in the crackwake. This appears to promote enhanced crack-tip shieldingcompared to the relatively straight cracks in the divider ori-entation.
2. Reinforcement layer thicknessThe thickness of the reinforcement layer (at a fixed re-
inforcement volume fraction) also has a significant influ-ence on the toughness of the laminates. In the arresterorientation, the crack-initiation toughness is steadily in-creased with thicker Nb layers, as the renucleation eventbecomes more difficult. As the mechanism[44] of crack ren-ucleation can be associated with the local stress in the in-termetallic exceeding a critical fracture stress to effect crackadvance across the metal reinforcement, with increasingthickness of the ductile layer, the far-field stress must beincreased in order for this criterion to be met. This resultsin a higher applied stress intensity and thus a higher mea-sured K0 with thicker ductile reinforcement layers. As ren-ucleation is unnecessary in the divider orientation, K0
values approach that of the intermetallic matrix, and thereis little effect of reinforcing layer thickness on the crack-initiation toughness.
With respect to the crack-growth toughness, it is clearfrom both measurements and simple modeling that thethicker Nb reinforcing layers in the divider laminates resultin a higher maximum toughness. This trend, however, isless obvious for the arrester laminates due to the influenceof large-scale bridging. The origin of the improved tough-ness is most likely related to the larger bridging zones thatdevelop with the thicker layers, although an additional fac-tor may be associated with the lower constraint predictedby the weight function modeling in the thicker Nb bridginglayers; such reduced constraint should allow for greaterplastic deformation in the Nb bridging layers.
IV. CONCLUSIONS
Based on a study of the fracture toughness and resis-tance-curve behavior of the Nb-reinforced Nb3Al laminates,the following conclusions can be made.
1. Marked improvements in the fracture toughness of brit-tle Nb3Al intermetallics can be achieved using signifi-cantly lower volume fractions of ductile Nbreinforcements as coarse (50 to 250 mm) laminates, ascompared to reinforcement by either Nb particulates or

2494—VOLUME 29A, OCTOBER 1998 METALLURGICAL AND MATERIALS TRANSACTIONS A
(a) (b)
(c)
Fig. 17—(a) Plot of the predicted SSB R-curve for the 50 mmNb arrester laminate obtained from Eqs. [5] and [6] byassuming a W ; 80 mm. (b) Plot of the predicted SSB R-curvefor the 125-mm Nb arrester laminate obtained from Eqs. [5]and [6] by assuming a W ; 180 mm. (c) A comparison plotof the two predicted SSB R curves showed that the trend ofimproved toughness with increasing Nb layer thickness wasretained.
Table IV. SSB Toughness Predictions
Nominal NbThickness
(mm)f E'
(GPa)xs0
(MPa)r
(mm)K0
(MPa )=m
PredictedKss
(MPa )=m
MeasuredK*
ss
(MPa )=m
Arrester orientation50 0.16 143 540 20 7.3 ;17 13 to 15
125 0.14 144 490 42.5 9 ;22 15 to 20250 0.17 143 370 109 10.4 ;33 10 to 20
Divider orientation50 0.16 143 400 20 1 ;13 11
125 0.15 143 400 47.5 1 ;20 15250 0.17 143 275 109 1 ;27 20
*Estimated as the peak toughness on the R curve.
by 2-mm-thick Nb microlaminate. Toughness improve-ments of ;2 to 3 times that of a particulate-reinforcedNb/Nb3Al composite were readily achieved using 20 volpct of the coarser Nb layers.
2. The significant improvements in the toughness of thelaminates were seen to be associated primarily with the
creation of large (millimeter-sized) bridging zones of in-tact Nb layers in the crack wake.
3. The effect of laminate orientation on such measuredtoughness behavior was found to be relatively small, al-though the arrester laminates generally showed im-proved properties over the divider laminates. Higher
METALLURGICAL AND MATERIALS TRANSACTIONS A VOLUME 29A, OCTOBER 1998—2495
crack-initiation toughness K0 values were observed forthe arrester laminates, because the crack must renucleateacross the Nb layer prior to further crack extension.However, residual bridging in the crack wake (from pre-cracking) prevented accurate measurement of K0 valuesin the divider orientation, although R-curve modelingcalculations do suggest that they are approximatelyequal to the matrix toughness.
4. At a constant volume fraction of reinforcement of 20vol pct Nb, the crack-initiation and maximum toughnessproperties progressively improved with increasing thereinforcement layer thickness, the effect being more ap-parent in the crack-divider orientation.
5. Although unrealistically large samples would be re-quired in the present laminates to avoid large-scalebridging conditions, simple modeling using both weight-function and energy-based methods is found to providereasonable estimates for the geometry-independent,steady-state toughnesses under SSB conditions.
ACKNOWLEDGEMENTS
This work was funded by the United States Air ForceOffice of Scientific Research under the AASERT Program(Grant No. F49620-93-1-0441) as a supplement to GrantNo. F49620-93-1-0107, with Dr. C.H. Ward as contractmonitor. The authors thank Major Ward for his support andDrs. B.J. Dalgleish and L.C. DeJonghe for their help withthe processing.
APPENDIXWeight functions for the bend and compact tension
geometries
The weight function for the single-edge notch (three- orfour-point) bend SE(B) geometry with a half outer span-to-width ratio greater than unity can be written as follows:[49]
m a A zvm ~ ! v11W2 1 x
h(a,x) 5 z z 1 1 z 1 2 [A1]= Σ ~ !3/2(v,m)pa ax a
1 2 1 2= ~ !a W
where the coefficients, A , for the sum are given in Tablevm
AI.
Table AI. Coefficients of Fit Polynomial for SE(B) BeamWeight Function
v m 5 0 1 2 3 4
0 0.4980 2.4463 0.0700 1.3187 23.0671 0.5416 25.0806 24.3447 232.7208 18.12142 20.19277 2.55863 212.6415 19.7630 210.986
The corresponding weight function for the disk-shapedcompact tension, DC(T), specimen is given as:[58]
3/22 1 a
h(a,x) 5 z z 1 2= @~ !3/2pa Wx a1 2 z 1 2= ~ !a W [A2]
m 1 1 vx a
1 D z 1 2 zΣ vm ~ ! ~ ! #(v,m) a W
where the coefficients, D , for the sum are given in Tablevm
AII.Table AII. Coefficients of Fit Polynomial for DC(T) Weight
Function
v m 5 0 1 2 3 4
0 2.826 25.865 0.8007 20.2584 0.68561 210.948 48.095 23.839 1.280 26.7342 35.278 2143.789 6.684 25.248 25.1883 241.438 196.012 24.836 11.435 240.1404 15.191 292.787 20.7274 27.328 22.047
REFERENCES
1. G.F. Harrison and M.R. Winstone: in Mechanical Behavior ofMaterials at High Temperature, C. Moura Branco, R.O. Ritchie, andV. Sklenicka, eds., NATO ASI Series 3, Kluwer Academic Publishers,Sesimbra, Portugal, 1995, vol. 15, pp. 309-25.
2. D.L. Anton and D.M. Shah: High Temperature Ordered IntermetallicAlloys III, C.T. Liu, A.I. Taub, N.S. Stoloff, and C.C. Koch, eds.,Materials Research Society Symposia Proceedings, MaterialsResearch Society, Pittsburgh, PA, 1989, vol. 133, pp. 361-71.
3. D.L. Anton and D.M. Shah: Intermetallic Matrix Composites, D.L.Anton, P.L. Martin, D.B. Miracle, and R. McMeeking, eds., MaterialsResearch Society Symposia Proceedings, Materials Research Society,Pittsburgh, PA, 1990, vol. 194, pp. 45-52.
4. R.T. Fleischer: High Temperature Ordered Intermetallic Alloys III,C.T. Liu, A.I. Taub, N.S. Stoloff, and C.C. Koch, eds., MaterialsResearch Society Symposia Proceedings, Materials Research Society,Pittsburgh, PA, 1989, vol. 133, pp. 305-10.
5. D.M. Shah, D.L. Anton, and C.W. Musson: Intermetallic MatrixComposites, D.L. Anton, P.L. Martin, D.B. Miracle, and R.McMeeking, eds., Materials Research Society Symposia Proceedings,Materials Research Society, Pittsburgh, PA, 1990, vol. 194, pp. 333-40.
6. A.G. Evans: J. Am. Ceram. Soc., 1990, vol. 72 (2), pp. 187-206.7. R.O. Ritchie: Mater. Sci. Eng. A, 1988, vol. A103, pp. 15-28.8. M.F. Ashby, F.J. Blunt, and M. Bannister: Acta Metall., 1989, vol.
37 (7), pp. 1847-57.9. A.G. Evans and R.M. McMeeking: Acta Metall., 1986, vol. 34 (12),
pp. 2435-41.10. B. Budiansky, J.C. Amazigo, and A.G. Evans: J. Mech. Phys. Solids,
1988, vol. 36 (2), pp. 167-87.11. V.V. Krstic, P.S. Nicholson, and R.G. Hoagland: J. Am. Ceram. Soc.,
1981, vol. 64 (9), pp. 499-504.12. L.S. Sigl, P.A. Mataga, B.J. Dalgleish, R.M. McMeeking, and A.G.
Evans: Acta Metall., 1988, vol. 36 (4), pp. 945-53.13. P.A. Mataga: Acta Metall., 1989, vol. 37 (12), pp. 3349-59.14. K.T. Venkateswara Rao, W.O. Soboyejo, and R.O. Ritchie: Metall.
Trans. A, 1992, vol. 23A, pp. 2249-57.15. L. Murugesh, K.T. Venkateswara Rao, and R.O. Ritchie: Scripta
Metall. Mater., 1993, vol. 29, pp. 1107-12.16. C.D. Bencher, A. Sakaida, K.T. Venkateswara Rao, and R.O. Ritchie:
Metall. Mater. Trans. A, 1995, vol. 26A, pp. 2027-34.17. H.C. Cao, B.J. Dalgleish, H.E. Deve, C. Elliott, A.G. Evans, R.
Mehrabian, and G.R. Odette: Acta Metall., 1989, vol. 37 (11), pp.2969-77.
18. F. Zok and C.L. Hom: Acta Metall. Mater., 1990, vol. 38 (10), pp.1895-1904.
19. B.D. Flinn, C.S. Lo, F.W: Zok, and A.G. Evans: J. Am. Ceram. Soc.,1993, vol. 76 (2), pp. 369-75.
20. D.E. Alman and N.S. Stoloff: Metall. Mater. Trans. A, 1995, vol. 26A,pp. 289-304.
21. K. Badrinarayanan, A.L. McKelvey, K.T. Venkateswara Rao, andR.O. Ritchie: Metall. Mater. Trans. A, 1996, vol. 27A, pp. 3781-92.
22. C.K. Elliott, G.R. Odette, G.E. Lucas, and J.W. Sheckhard: High-Temperature/High-Performance Composites, F.D. Lemkey, A.G.Evans, S.G. Fishman, and J.R. Strife, eds., Materials Research SocietySymposia Proceedings, Materials Research Society, Pittsburgh, PA,1988, vol. 120, pp. 95-101.
23. B.J. Dalgleish, K.P. Trumble, and A.G. Evans: Acta Metall., 1989,vol. 37 (7), pp. 1923-31.
2496—VOLUME 29A, OCTOBER 1998 METALLURGICAL AND MATERIALS TRANSACTIONS A
24. H.F. Deve, A.G. Evans, G.R. Odette, R. Mehrabian, M.L. Emiliani,and R.J. Hecht: Acta Metall. Mater., 1990, vol. 38 (8), pp. 1491-1502.
25. T.C. Lu, A.G. Evans, R.J. Hecht, and R. Mehrabian: Acta Metall.Mater., 1991, vol. 38 (8), pp. 1853-62.
26. M. Bannister and M.F. Ashby: Acta Metall. Mater., 1991, vol. 39(11), pp. 2575-82.
27. K.T. Venkateswara Rao, G.R. Odette, and R.O. Ritchie: Acta Metall.Mater., 1992, vol. 40 (2), pp. 353-61.
28. G.R. Odette, B.L. Chao, J.W. Sheckhard, and G.E. Lucas: ActaMetall. Mater., 1992, vol. 40 (9), pp. 2381-89.
29. F.E. Heredia, M.Y. He, G.E. Lucas, A.G. Evans, H.E. Deve, and D.Konitzer: Acta Metall. Mater., 1993, vol. 41 (2), pp. 505-11.
30. M.Y. He, F.E. Heredia, D.J. Wissuchek, M.C. Shaw, and A.G. Evans:Acta Metall. Mater., 1993, vol. 41 (4), pp. 1223-28.
31. W.O. Soboyejo, K.T. Venkateswara Rao, S.M.L. Sastry, and R.O.Ritchie: Metall. Trans. A, 1993, vol. 24A, pp. 585-600.
32. W.O. Soboyejo and S.M.L. Sastry: Mater. Sci. Eng., 1993, vol. A171,pp. 95-104.
33. M.C. Shaw, D.B. Marshall, M.S. Dadkhah, and A.G. Evans: ActaMetall. Mater., 1993, vol. 41 (11), pp. 3311-22.
34. K.T. Venkateswara Rao, G.R. Odette, and R.O. Ritchie: Acta Metall.Mater., 1994, vol. 42 (3), pp. 893-911.
35. H.C. Cao, J.P. Lofvander, A.G. Evans, R.G. Rowe, and D.W. Skelly:Mater. Sci. Eng., 1994, vol. A185, pp. 87-95.
36. R.G. Rowe, D.W. Skelly, M. Larsen, J. Heathcote, G. Lucas, and G.R.Odette: High Temperature Silicides and Refractory Alloys, C.L.Bryant et al., eds., Materials Research Society Symposia Proceedings,Materials Research Society, Pittsburgh, PA, 1994, vol. 322, pp. 461-72.
37. Q. Ma, M.C. Shaw, M.Y. He, B.J. Dalgleish, D.R. Clarke, and A.G.Evans: Acta Metall. Mater., 1995, vol. 43 (6), pp. 2137-42.
38. J. Kajuch, J. Short, and J.J. Lewandowski: Acta Metall. Mater., 1995,vol. 43 (5), pp. 1955-67.
39. J. Heathcote, G.R. Odette, and G.E. Lucas: Acta Mater., 1996, vol.44 (11), pp. 4289-99.
40. D.R. Bloyer, K.T. Venkateswara Rao, and R.O. Ritchie: Mater. Sci.Eng. A, 1996, vol. A216, pp. 80-90.
41. D.R. Bloyer, K.T. Venkateswara Rao, and R.O. Ritchie: JohannesWeertman Symp., R.J. Arsenault, D. Cole, T. Gross, G. Kostorz, P.
Liaw, S. Parameswaran, and H. Sizek, eds., TMS, Warrendale, PA,1996, pp. 261-66.
42. D.R. Bloyer, K.T. Venkateswara Rao, and R.O. Ritchie: LayeredMaterials for Structural Applications, J.J. Lewandowski, C.H. Ward,M.R. Jackson, and W.H. Hunt, Jr., eds., Materials Research SocietySymposia Proceedings, Materials Research Society, Pittsburgh, PA,1996, vol. 434, pp. 243-48.
43. D.R. Bloyer, K.T. Venkateswara Rao, and R.O. Ritchie: Mater. Sci.Eng. A, 1997, vols. A239–A240, pp. 393-98.
44. H.C. Cao and A.G. Evans: Acta Metall. Mater., 1991, vol. 39 (12),pp. 2997-3005.
45. R.O. Ritchie, J.F. Knott, and J.R. Rice: J. Mech. Phys. Sol., 1973,vol. 21 (6), pp. 395-410.
46. Y. Huang, H.W. Zhang, and F. Wu: Int. J. Solids Struct., 1994, vol.31 (20), pp. 2753-68.
47. Y. Huang and H.W. Zhang: Acta Metall. Mater., 1995, vol. 43 (4),pp. 1523-30.
48. B.N. Cox and C.S. Lo: Acta Metall. Mater., 1992, vol. 40 (1), pp.69-80.
49. T. Fett and D. Munz: Stress Intensity Factors and Weight Functionsfor One-Dimensional Cracks, Institut fur Materialforschung:Kernforschungszentrum, Karlsruhe, Germany, 1994.
50. B.N. Cox and D.B. Marshall: Acta Metall. Mater., 1991, vol. 39 (4),pp. 579-89.
51. F. Erdogan and P.F. Joseph: J. Am. Ceram. Soc., 1989, vol. 72 (2),pp. 262-70.
52. R.M.L. Foote, Y.W. Mai, and B. Cotterell: J. Mech. Phys. Sol., 1986,vol. 34 (6), pp. 593-607.
53. A.C. Kaya and F. Erdogan: Int. J. Fract., 1980, vol. 16 (2), pp. 171-90.
54. M. Bannister, H. Shercliff, G. Bao, F. Zok, and M.F. Ashby: ActaMetall. Mater., 1992, vol. 40 (7), pp. 1531-37.
55. S.M. Pickard and A.K. Ghosh: Metall. Mater. Trans. A, 1996, vol.27A, pp. 909-21.
56. D.W. Chung and N.S. Stoloff: Metall. Trans. A, 1978, vol. 9A, pp.1387-99.
57. J.M. Meininger and J.C. Gibeling: Metall. Trans. A, 1992, vol. 23A,pp. 3077-84.
58. T. Fett: Int. J. Fract., 1993, vol. 63, pp. R81-R85.