fractional land cover classification and temporal change
TRANSCRIPT

ISSN: 2237-0722
Vol. 11 No. 4 (2021)
Received: 04.07.2021 – Accepted: 02.08.2021
4258
Fractional Land Cover Classification and Temporal Change Evaluation of Deh
Akro-II Wetland Complex and Chotiari Wetland Complex, Sindh, Pakistan, Using
Google Earth Engine
Samawia Rizwan1*; Dr. Khalid Mahmood2; Dr. Sajid Rashid Ahmad3; Dr. Shafiq Ur Rehman4 1*Lecturer, Centre of Geographic Information System, University of the Punjab, Lahore, Pakistan.
1*[email protected] 2Assistant Professor, Department of Space Science, University of the Punjab, Lahore, Pakistan.
[email protected] 3Principal, Professor CEES, Collage of Earth and Environmental Sciences, University of the Punjab, Lahore,
Pakistan. [email protected]
4Department of Botany, University of Okara, Pakistan. [email protected]
Abstract
Wetlands are one of the most important and rich eco system. Deh akro II wetland complex is unique
inland type of wetlands comprise of 35 wetlands in middle of Nara desert on bank of Nara Canal. They
face a lot of degradation because of anthropogenic activities in the surrounding areas and lack of
rainfall in last 2 decades. Chotiari wetland complex located in south east of Deh akro II wetland
complex, it comprises of several fresh water lakes converted into reservoir in year 2003 for better
irrigation purposes. This conversion of wetlands into reservoir does not did very well for surrounding
agricultural lands and natural vegetation. So in this study two technique of Fractional cover mapping
were used to classify three types of land covers in both study areas. Temporal analysis was performed
using the Landsat 7 ETM+ image of year 2000 and Landsat 8 OLI image of year 2018. For better
results NDVI, EVI and NDWI were also calculated. For Deh akro II wetland complex Kappa accuracy
statistics for year 2000 is 84% and for year 2018 its 87%. Several changes were recorded in this time
span of 18 years as 42% of water bodies area has been decreased, 48% of Agriculture area has been
increased and 68% of natural vegetation area has been increased. Increase in amount of vegetation
and agriculture indicates that with better management and planning, effects of climate change over the
area can be minimized. Kappa accuracy statistics for Chotiari Wetland complex for year 2000 is 71%
and for year 2018 it’s 73%. Enormous changes were noted in 18 years as Agriculture area has been
decreased up to 91%, water area has been increased up to 15% and vegetation has unluckily decreased
up to 98% in reservoir area. This huge decrease in Agriculture and natural vegetation is an alarming
situation for the wildlife and native population as well as authorities of Chotiari wetland complex.

ISSN: 2237-0722
Vol. 11 No. 4 (2021)
Received: 04.07.2021 – Accepted: 02.08.2021
4259
Key-words: Land Cover Classification, Temporal Change Evaluation, Deh Akro-II, Chotiari.
1. Introduction and Literature Review
Wetlands are most vital ecological part of earth’s landscape. Wetlands drive the economy,
create exclusive eco systems and unique cultures of the adjacent communities. They provide fish and
wildlife habitat, water quality protection and purification, filtering impurities in water, acting as nutrient
and sediment sinks, erosion control and protection, aquatic productivity and abundant opportunities for
hydrological and geological education and recreation. (Rai, 2008 and 2010; Liu et al). Other beneficial
functions provided by wetlands are water storing, shoreline maintenance, ground water restoration,
storm defense, flood control, ground water discharge, stabilization of local climate conditions
particularly rainfall and temperature. (Olhan et al., 2010; Munyat, 2011).
Pakistan has diverse range of wetlands from lakes in high mountains, inland lakes in plain areas,
to coastal swamps and mangroves forests, covering area of approximately 7.8 million hectors,
representing 9.7% of the total country mass. (Izhar 2016). Out of total wetlands 19 wetlands are
recognized as of international importance and therefore they are categorized under Ramsar convention.
Haleji Lake is a perennial freshwater lake in Thatta, Sindh, a Ramsar site, is presently damaged and on
a loss as a nature reserve for fauna, because of sedimentation, increase in marine flora and water
shortages that leads to degradation of the wetland. Ormara Turtle Beaches, has comprised of 10.5 km
long section of beautiful sandy seashore in Balochistan, home of significant amount of marine turtles
which includes the endangered species of green turtles and olive ridley. The famous Uchhali Complex
comprised of three salty lakes: Jahlar Lakes, Khabikki Lake and Uchhali Lake, present in Khushab
District in Punjab. It is the only conservation complex in Pakistan which is supporting the winter season
itinerant groups of White-headed duck, as well as other species of winter birds; sociable lapwing,
Cinereous vulture, Greater flamingo, Eastern imperial eagle, pied harrier, ferruginous duck and greylag
goose. Nearly all Pakistani wetlands also support neighboring humans by providing them with fresh
water for domestic, agriculture uses and for their livestock, fisheries and unique plant species which
are used for different purposes.
In Pakistan, at one time all the wetlands were the safe haven for migratory birds and other
dependent wildlife but nowadays because of embanking of river, misuse of ground water, reservoirs
construction, soil eutrophication, unregulated use of pesticides which is harmful for ecological
processes and most prominent one the climate change, unluckily these wetlands remain to be one of
the world’s most endangered bionetworks and are needed to be preserved and monitored regularly. To
ISSN: 2237-0722
Vol. 11 No. 4 (2021)
Received: 04.07.2021 – Accepted: 02.08.2021
4260
quantify the changes occurring in these wetland proper monitoring of land cover is required. Landcover
is a human struggle to change its surroundings into favorable environment such as roads, urban areas,
agricultural land, settlements and plantation. Farda 2017 has defined Land use c as "a number of human
arrangements, activities, and inputs on a particular land"(FAO 1997, FAO and UNEP 1999). Remote
sensing has developed as the utmost significant science in wetland land cover landuse (LCLU)
monitoring. Commonly wetlands are isolated and difficult to reach areas so most of the time it’s
challenging to gather information through old-style field visits. Earth-observation satellites are striking
source of monitoring information as it is continuing 24/7 data coverage. Many studies like Ozesmi and
Bauer (2002), Davranche (2009), Adam (2010), Wright and Gallant (2007) and Na et al (2010) have
shown that Geographical Information System (GIS) and Remote sensing (RS) techniques are providing
vital gears for wetland inventory tracking and update. The usage of hyperspectral and multispectral
satellite’s data produces valued results on wetland classification and delineation. Multi-temporal
Landsat data has been used in several studies for the purpose of LCLU mapping as it had advantages
of high spectral resolution and free availability of new and historical data. (Mach et al. 2017;
Gudex-Cross et al. 2017). Many studies like Jiaying et all (2018) and Julia Reschkea, Christian Hüttich
(2014) have done a mapping and LCLU of wetlands, by using a pixel-based method for wetland
delineation based on multi-temporal Landsat data
Google Earth Engine (GEE), a cloud-based computing platform, it resolves the utmost major
issues regarding land cover mapping of remote areas by using, a web-based Integrated Development
Environment (IDE) code editor, which can examine and analyze all accessible remote sensing data
without the need of downloading the data sets to the local device. This is how, operators can effortlessly
access, choose and process bulks of information. GEE also provide many packages and several
algorithms which can be simply approached by all types of experienced and fresh remote sensing
researchers. Similar to our research, based on the GEE cloud computing platform and 30-m Landsat 7
and 8 and spectral indices like NDVI, ID, NDWI, many studies have explore machine learning and its
accuracy for multi-temporal land use mapping of wetland area (Domínguez-Beisiegel, M (2016).
Bumsuk Seo, et al (2016), Farda (2017), Wand C. et. al. (2018), Md. Inzamul Haque, Rony Basak
(2017), Bian et. al. (2020). Mahdianpari, M et. al. (2020) Alam and Hussain (2020)) Zang et. al. (2020)
In this study an effort has made to identify and analyze the Land cover land use temporal changes of
Deh Akro 2 wetland complex and Chotiari Wetland complex using Fractional cover mapping
techniques on the GEE platform, over the time span of 18 years since year 2000 to 2018.

ISSN: 2237-0722
Vol. 11 No. 4 (2021)
Received: 04.07.2021 – Accepted: 02.08.2021
4261
2. Study Area
Two study area Deh Akro-II Wetlands Complex and Chotiari Wetland Complex/Reservoir have
been selected for this study. Both of them are present in Nara Desert region of Sindh province, Pakistan.
Deh Akro-II Wetlands Complex (26°49'N latitude and 68°19'E longitude) located in the
south-west of Sindh Province, comprises of 36 perennial lakes (designed by the Seepage of Jamrau
Canal and also rain fed) and contains four main habitat types: wetland, desert, agricultural land and
marshes. Total area covered by lakes is of 50 sq. km, out of which smallest one cover area of 0.5 sq.
km and largest covered 7.5 sq. km. The whole complex ranges over 205 sq. km with elevation of about
50 m. Out of 36 lakes, five has drinkable water, rest of them have brackish water with the depth of
lakes ranges between 2 to 15 m. These wetlands have been shrunk because of the canal water
diversification to the agriculture area and shortage of rainfall during last 20 years. In south west of Deh
akro 2, two large town Jam Datar (30 km) and Nawabshah at 60 km, are present. Boundaries of North
east of the wetlands complex meets with Nara Desert. From the south west, landscape is dominated by
agricultural fields. This wetland complex is also known as wild life sanctuary because it is home to an
extensive variety of flora and fauna, habitats of both wetlands and desert, supporting more than 16
classes of reptiles, 18 type of mammals, 101 kinds of birds and 14 sort of fishes. Rare fauna hosted
here includes 1. Desert cat Felis libyca, 2. Darter Anhinga melanogaster pennant, and Garganey Anas
querquedula, etc and endangered includes Marsh crocodile crocodylus palustris, Hog deer, White-eyed
pochard, and contains many native fish types. Deh akro II experience hot summers with mean
temperature of 48-52o C, in hottest months of May to July. Winters are dry, mild and short, with the
coldest month of January, they experience 11o C of temperature. Most of the rain is experienced in
Monsoon season which ranges from 88 mm to 135 mm, along with low intensity winter rains during
December to March. Fish is one of the source of food for local people. Main source of livelihood for
local people are agriculture and livestock. Main crops cultivated in this area are Cotton and wheat,
secondary crops included pulses, vegetables, oil seeds, sugarcane, fodder, oil seed and barely. Natural
resources are facing environmental degradation because of the overgrazing of vegetation and the cut
down of woods for fuel usage. Deh Akro II wetland was proclaimed as a Wildlife Sanctuary of global
prominence in 1988. On 5 November 2002, Deh Akro Wetlands Complex was declared as a Ramsar
site. (Ramsar sites information service).

ISSN: 2237-0722
Vol. 11 No. 4 (2021)
Received: 04.07.2021 – Accepted: 02.08.2021
4262
Fig. 1 - Map Showing Location of Deh Akro II Wetland Complex
The Chotiari Wetland Complex/Reservoir (26°9’15” N latitude, 69°2’48” E longitude) is
situated 30-35 km of northeast of Sanghar Town. District Sanghar, Province Sindh, Pakistan. It is
situated at an elevation of 60 meters above sea level by covering an area of about 18,000 ha. Area has
been surrounds by the Nara Canal on the south and west and Thar Desert on east, north, north-east and
south-east. The complex includes many brackish and fresh water bodies. Warm bone-dry environment
win through the space. Most sultry months are May and June with normal greatest every day
temperature of more than 40°C. Coolest months are December to February, with the most extreme day
by day temperatures scope of 25 to 30°C. Most of the rainfall is experienced between July and August
and averages 40 mm monthly and about 125 mm annually. (Rais et al., 2008; Rais et al., 2013; WWF,
2008). Chotiari Reservoir was constructed in an already existed low lying area in 2003, along the left
bank of Nara Canal. Its 58km long bank has been separated into Western Bund (14 km), Southern Bund
(16km) and South Eastern Bund (9km). Chotiari Dam is re-energized through Ranto Canal. Its water
has been supplied to areas of Mir Pur Khas, Umer Kot, Tando Mitha Khan and Khipro (WWF, 2008).
Water from the dam and Nara Canal is also used for human, livestock consumption, and irrigation

ISSN: 2237-0722
Vol. 11 No. 4 (2021)
Received: 04.07.2021 – Accepted: 02.08.2021
4263
purposes (Rais et al., 2008). Leakage from Nara Canal and Chotiari Dam has generated numerous small
wetlands which are serving a mutual purposes of ground water replanishment, flood water storing and
wintering park land for migrant birds, chiefly ducks and shorebirds. Chotiari wetland complex is also
supports a wide range of fauna and flora, mainly desert and wetland habitat including, 136 birds, 32
species of mammals, three amphibians and 32 reptiles (Rais et al., 2011).
The Chotiari reservoir project was planned and executed in order to provide irrigation for dry
but fertile land in Pakistan and increase the storage capacity of the existing lakes in the Chotiari
wetlands but this comes with pros and cons as it has affected and induced social and environmental
problems by harmfully affecting arable land, pastures, forests as well as the cruel displacement of native
populations. The upsurge of water level in the reservoir has caused seepage, which has waterlogged
nearby agricultural land. (Magsi and Torre 2014).
Fig. 2 - Map Showing Location of Chotiari Wetland Complex

ISSN: 2237-0722
Vol. 11 No. 4 (2021)
Received: 04.07.2021 – Accepted: 02.08.2021
4264
Fig. 3 - Image Showing Precipitation of Deh Akro II Wetland Complex and Chotiari Wetland Complex, Monsoon Seasons
of year 2001 to 2018
3. Materials and Methodology
Data Sets for Deh Akro II Wetland Complex
For accurate and target oriented results and to save time and cost, suitable and accurate spatial
data is the best option. (Heipke, 2004). For conventional hard classification Two Landsat ETM images
obtained in post monsoon season: Landsat 7 ETM+(Collection 1 Tier 1 calibrated top-of-atmosphere
(TOA) reflectance) image of 31st August for year 2000(Path 152, Row 42, Time of capture
10:47:36.9641269Z) and Landsat 8 ETM+ (Collection 1 Tier 1 calibrated top-of-atmosphere (TOA)
reflectance) image of 19th September for year 2018 (Path 151, Row 42, Time of capture
10:50:11.1407460Z). For linear Classification Another Two Landsat images have been obtained from
google earth engine, Landsat 7 ETM+ (calibrated top-of-atmosphere reflectance, orthorectified) image
of 2nd April for year 2000 (Path 151, Row 42) and Landsat 8 ETM+ (calibrated top-of-atmosphere
reflectance, orthorectified) image of 4th April of year 2017 (Path 151, Row 42).
Data Sets for Chotiari Wetland Complex
For conventional hard classification Two Landsat ETM images obtained in post monsoon
season: Landsat 7 ETM+(Collection 1 Tier 1 calibrated top-of-atmosphere (TOA) reflectance) image
of 08th August for year 2000(Path 151, Row 42, Time of capture 10:41:37.1835887Z) and Landsat 8

ISSN: 2237-0722
Vol. 11 No. 4 (2021)
Received: 04.07.2021 – Accepted: 02.08.2021
4265
ETM+ (Collection 1 Tier 1 calibrated top-of-atmosphere (TOA) reflectance) image of 19th September
for year 2018(Path 151, Row 42, Time of capture 10:50:11.1407460Z).
For linear Classification Another Two Landsat images have been obtained from google earth
engine, Landsat 7 ETM+ (calibrated top-of-atmosphere reflectance, orthorectified) image of 14th April
for year 2000 (Path 151, Row 42) and Landsat 8 ETM+ (calibrated top-of-atmosphere reflectance,
orthorectified) image of 20th April of year 2018 (Path 151, Row 42).
Selection Criteria
The selection of the Landsat satellite images dates was influenced by the quality of the image
especially for those with limited or low cloud cover, removal of other distortions and with the post
monsoon season also as we need image containing maximum amount of water in lakes. We need
resolution of 30 meters for the analysis, so the following bands of Landsat 7 and 8 were used.
Table 1 - Details of Spectral Bands of Landsat, used in Analysis
Landsat 7 ETM+ Bands (um) Landsat 8 OLI and TIRS Bands (um)
Band 1 30m Blue 0.44-0.51 Band 2 30m Blue 0.45-0.51
Band 2 30m Green 0.51-0.61 Band 3 30m Green 0.53-0.59
Band 3 30m Red 0.63-0.69 Band 4 30m Red 0.63-0.67
Band4 30m NIR 0.77-0.89 Band 5 30m NIR 0.85-0.87
Band 5 30m SWIR-I 1.54-1.74 Band 6 30m SWIR-I 1.56-1.65
Band 7 30m SWIR-2 2.06-2.34 Band 7 30m SWIR-2 2.10-2.29
1. Fractional Cover Mapping
In Fractional cover planning the mapping of a space that is covered by each individual from a
pre-characterized set of land cover types has been assessed. In RS the essential unit is for the most part
a pixel and the assessment of fragmentary cover is a sort of sub-pixel classification.
Various methods for assessing fractional cover from remotely-sensed data have been broadly
utilized and described by Fernandes et al. (2004) and Scanlon et al. (2002):
• Conventional “Hard” Classification - "Hard" classes are rigorously characterized as far as
their cover and arrangement and, and are by and large found in land cover maps. The
verifiably expected to be that the "pure" classes comprise of tiny fraction of the other
landform, and that the combined class contains equivalent degrees of both. Processes like
Supervised Classification or Unsupervised Classification utilized his way to deal with attempt
to straightforwardly characterize or plan the "hard" classes.

ISSN: 2237-0722
Vol. 11 No. 4 (2021)
Received: 04.07.2021 – Accepted: 02.08.2021
4266
• Linear Modeling - linear modeling endeavor to narrate field measurements of fractional
cover with reflectance data documented by a sensor, by using linear regression techniques.
For example vegetation indices like NDVI.
Other techniques include:
• Spectral Unmixing Models
• Artificial Neural Networks (ANN)
• Physical Models
In this study Two types of fractional cover mapping have been performed including
conventional hard classification and linear modeling.
2. Conventional Hard Classification
Landsat 7 (Collection 1 Tier 1 calibrated top-of-atmosphere (TOA) reflectance) and Landsat 8
imagery (Collection 1 Tier 1 calibrated top-of-atmosphere (TOA) reflectance) were called and imported
in GEE code editor. Selected reflective bands of both images were used explained in table 1. After that
samples of three land cover classes: 1. Agriculture 2. Water 3. Natural vegetation, were selected in
GEE as pure regions. Both study areas have both man made vegetation(agriculture) and natural
vegetation. Then image was further processed with the help of FCM algorithm written in code editor
and final results were generated, displayed and downloaded in the form of multi band image. Then
these classified images were exported for further analysis and accuracy assessment. Fundamental
concentration for precision appraisal or accuracy assessment tests determination was that they could be
plainly distinguished on Landsat image, Google earth and Google Map. Classified images from GEE
were reclassified band by band in Arc Map by using reclassification tool in order to identify required
Landcover clearly, vectorized by using conversion tool, clipped with study area boundary. After that
training samples were selected with the help of subset features tool for each class, tables contain values
of each polygon were prepared. Then vectorized shape file have verified with the help of Quick Bird
image. At least 65% to 70 % of total polygons were taken as training sample and get checked to get
more exact and precise outcomes. All the final maps of each classes have been assessed using spatial
overlay to get idea of change in area cover. Further total area was calculated for each class and
compared for both years. As it was expected a lot of changes were noted in each class. Final maps
showing the changes in area were created.

ISSN: 2237-0722
Vol. 11 No. 4 (2021)
Received: 04.07.2021 – Accepted: 02.08.2021
4267
3. Linear Modelling Classification
For the purpose of linear modelling classification, four auxiliary datasets, namely the
Normalized Difference Vegetation Index (NDVI), Enhanced vegetation index (EVI) and Normalized
Difference Water Index (NDWI) were derived and calculated from the Landsat 7 and Landsat 8
information to expand the precision of land cover arrangement. Formulas used are mentioned below.
NDVI (Landsat 7) =(Band 4 – Band 3)
(Band 4 + Band 3)
NDVI (Landsat 8) =(Band 5 – Band 4)
(Band 5 + Band 4)
NDWI (Landsat 7) =(Band 4 – Band 5)
(Band 4 + Band 5)
NDWI (Landsat 8) =(Band 5 – Band 6)
(Band 5 + Band 6)
EVI (Landsat 7) =2.5 × (Band 4 – Band 3)
(Band 4 + 6 × Band 3 – 7.5 × Band 1 + 1).
EVI (Landsat 8) =2.5 × (Band 5 – Band 4)
(Band 5 + 6 × Band 4 – 7.5 × Band 2 + 1).
4. Results
Remote sensing and GIS techniques end up being valuable in Landcover/landuse change
detection of Deh Akro II wetland complex and Chotiari wetland complex. The overall results of
Landcover/landuse change using temporal analysis shows significant amount of changes in given
classes. (see table 2).
Table 2 - Showing Percentage of LCLU Changes in both Study Areas
LULC Classes Study Areas
Deh Akro II wetland complex Chotiari wetland complex
Agriculture increased by 110% decreased by 91%
Water decreased by 42% decreased by 94%
Natural Vegetation increased by 49% decreased by 98.8%
5. Accuracy Assessment of Deh Akro II Wetland Complex
Accuracy assessment of classification results yield overall accuracy of 91.95% and Kappa
coefficient of 84.144% for year 2000. For year 2018 overall accuracy was 91.96% and Kappa
coefficient of 87.27 %. Producers and user’s accuracy for each class are given bellow in table.

ISSN: 2237-0722
Vol. 11 No. 4 (2021)
Received: 04.07.2021 – Accepted: 02.08.2021
4268
Table 3 - Showing Accuracies of Deh Akro II Wetland Complex of Year 2000 and Year 2018
Landcover
Classes
Producers
Accuracy 2000
Producers
accuracy 2018
Users
Accuracy 2000
Users
accuracy 2018
Agriculture 79.90599295 89.68407 64.82364156 84.30303
Water 83.35358445 83.94161 99.34829833 99.85528
Natural Vegetation 97.17465753 97.7532 95.80080186 92.53927
Accuracy assessment of Chotiari Wetland Complex
Accuracy assessment of classification results yield overall accuracy of 80.77% and Kappa
coefficient of 71% for year 2000. For year 2018 overall accuracy was 70.64% and Kappa coefficient
of 73.52 %. Producers and user’s accuracy for each class are given bellow in table 3.
Table 4 – Showing Accuracies of Deh Akro II Wetland Complex of Year 2000 and Year 2018
Landcover Classes Producers
Accuracy 2000
Producers
accuracy 2018
Users
Accuracy 2000
Users accuracy
2018
Agriculture 82.35909963 69.21405 78.78484393 68.79875
Water 72.7654217373059 76.56676 94.62482947 81.63858
Natural Vegetation 96.86452848 58.11416 66.12745098 50.72267
Maps Created by using Conventional Hard Classification for Deh Akro II Wetland Complex
Fig. 4 - Map Showing Agriculture Area Change of Deh Akro II Wetland Complex

ISSN: 2237-0722
Vol. 11 No. 4 (2021)
Received: 04.07.2021 – Accepted: 02.08.2021
4269
In year 2000 the agricultural area was 14.415 sq. km and in 2018 it is increased up to 110% by
covering the area of 30.0908 sq kms. According to the local sources, for irrigation purposes most of
the water has been taken from the canals directly. This increase of agriculture has been observed as
most of the sand dunes has been converted into agricultural fields, to cater the needs of food for humans
and animals both, and also cash crops have been cultivated for better economy of the area. As it can be
observed in the map, maximum agriculture happened away from wetlands as the most of the land near
by the lakes has been badly affected by waterlogging and salinity.
Fig. 5 - Map Showing Water Bodies Area Change of Deh Akro II Wetland Complex
In year 2000 wetlands have covered the area of 6.3544 sq. km and in year 2018 it has been
decreased to 2.6848 sq. km. 42% area of lakes has been decreased. Some lakes are officially declared
as dry. The main reason of this unfortunate change is the changing climate, as these lakes are both rain
fed and seepage fed from Jam Rao canal and Nara canal. According to historical archives of World
climate. Org the precipitation of deh akro 2 was 1-26 mm in month of August 2000 and was 0-16 mm
in the month of August 2018 as graphically represented in Figure 3. So water level of lakes has been
clearly effected by lack of precipitation, hence climate change.
ISSN: 2237-0722
Vol. 11 No. 4 (2021)
Received: 04.07.2021 – Accepted: 02.08.2021
4270
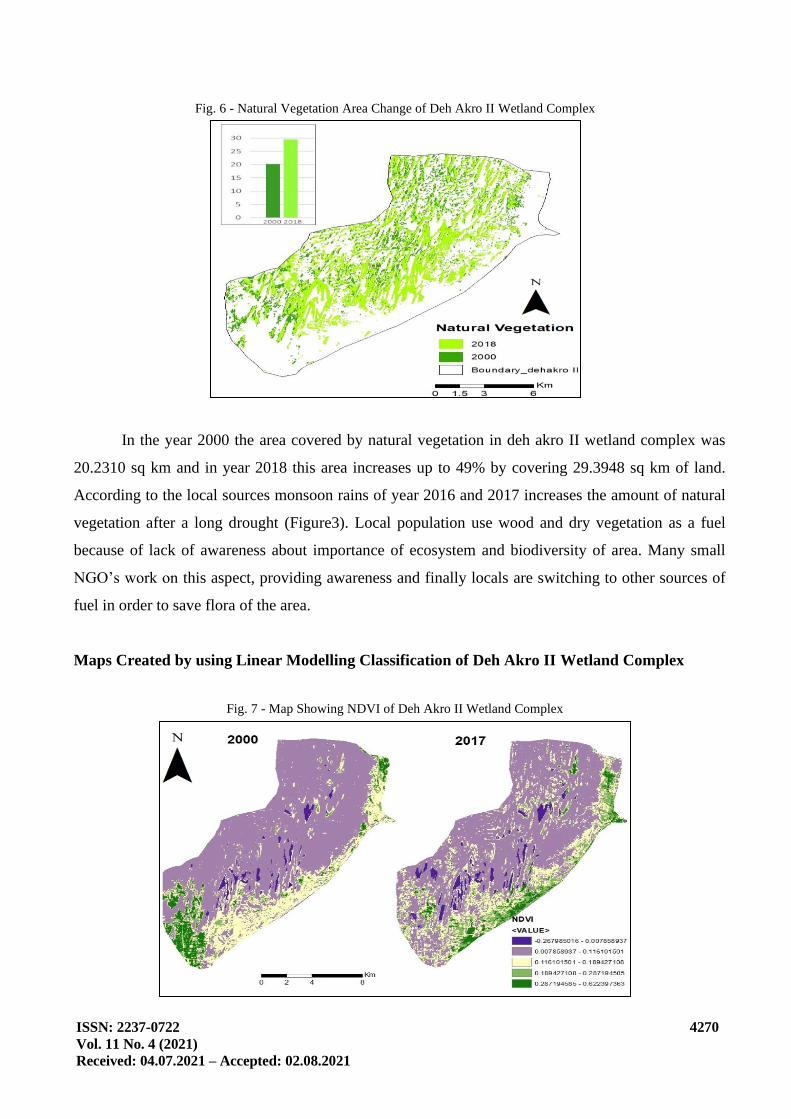
Fig. 6 - Natural Vegetation Area Change of Deh Akro II Wetland Complex
In the year 2000 the area covered by natural vegetation in deh akro II wetland complex was
20.2310 sq km and in year 2018 this area increases up to 49% by covering 29.3948 sq km of land.
According to the local sources monsoon rains of year 2016 and 2017 increases the amount of natural
vegetation after a long drought (Figure3). Local population use wood and dry vegetation as a fuel
because of lack of awareness about importance of ecosystem and biodiversity of area. Many small
NGO’s work on this aspect, providing awareness and finally locals are switching to other sources of
fuel in order to save flora of the area.
Maps Created by using Linear Modelling Classification of Deh Akro II Wetland Complex
Fig. 7 - Map Showing NDVI of Deh Akro II Wetland Complex

ISSN: 2237-0722
Vol. 11 No. 4 (2021)
Received: 04.07.2021 – Accepted: 02.08.2021
4271
Fig. 8 - Map Showing EVI of Deh Akro II Wetland Complex
By comparing both year NDVI and EVI results it can easily be assessed that amount of scattered
natural vegetation and vegetation around the lakes has been visibly increased. This increase in
vegetation is a new hope for a betterment of both locals and wildlife of the area, it will also help in
minimize the negative effects of climate change on area.
Fig. 9 - Map Showing NDWI of Deh Akro II Wetland Complex
By comparing both year NDWI results it can easily be assessed that amount of water in lakes
has decreased and more water is visible in agricultural areas, as irrigation water.

ISSN: 2237-0722
Vol. 11 No. 4 (2021)
Received: 04.07.2021 – Accepted: 02.08.2021
4272
Maps Created by using Conventional Hard Classification for Chotiari Wetland Complex
Fig. 10 - Map Showing Agriculture Area Change of Chotiari Wetland Complex
According to findings of (Magsi and Torre 2014), later the alteration of complex into dam, rise
of water level caused seepage, hence a lot of arable land has been converted into waterlogged land and
this phenomenon can be observed here as year 2000 the agricultural area was 622 sq. km and in 2018
it is decreased up to 91% by covering only the area of 55.5 sq kms.
Fig. 11 - Map Showing Water Bodies Change of Chotiari Wetland Complex

ISSN: 2237-0722
Vol. 11 No. 4 (2021)
Received: 04.07.2021 – Accepted: 02.08.2021
4273
The water surface area increased after transformation of Chotiari wetland into the artificial lake
as it is observed that the area of water was 293 sq. km in year 2000 before the construction of reservoir,
now it has been increased up to15% by covering area of 336 sq. km in year 2018. The fertile lands in
the reservoir has been flooded by the amplified water level and due to outrageous water spillage from
western and southern margins adjoining farming grounds and rangelands, beside infrequent flash floods
in the region (Rind et.al., 2018), a great deal of waterlogged, salt influenced and useless land has been
made (Raza 2009), affecting more than 50,000 acres of fertile agriculture land, because of waterlogging
and salinity produced by Chotiari Dam (Daily Times 2010).
Fig. 12 - Map Showing Change in Natural Vegetation of Chotiari Wetland Complex
In the year 2000 the area covered by natural vegetation was 138 sq km and in year 2018 this
area decreased by 98% by covering only 1.67 sq. km of reservoir land. After the change of the lake into
the repository the vegetated region has diminished to undeniably less as compare to original. The
generous upsurge in the water level have lowered trees, normal rangelands, grass species, and
furthermore destroyed the environment and biodiversity of the lake and delivered feed instability for
domesticated animals which is significant living hotspots for the local individuals. (Siddiqui, 2009).

ISSN: 2237-0722
Vol. 11 No. 4 (2021)
Received: 04.07.2021 – Accepted: 02.08.2021
4274
Maps Created by using Linear Modelling Classification of Chotiari Wetland Complex
Fig. 13 - Map Showing NDVI of Chotiari Wetland Complex
Fig. 14 - Map Showing EVI of Chotiari Wetland Complex
Fig. 15 - Map Showing NDWI of Chotiari Wetland Complex

ISSN: 2237-0722
Vol. 11 No. 4 (2021)
Received: 04.07.2021 – Accepted: 02.08.2021
4275
By comparing both years NDVI, EVI and NDWI it can easily have assessed that amount of
vegetation has been decreased as previously vegetated area has been undertaken by water of reservoir.
This increase in water have created several problems for ecosystem and local residents.
6. Conclusion
The study explores a successful use of fractional cover mapping using google earth engine for
LULC change detection. LCLU changes of both the study areas have been has been successfully
assessed with the help of google earth engine. The technique used, proved to be very effective to fulfill
the aims with effective application. Increase in vegetation and Agriculture of Deh Akro II wetland
complex proves that these changes are directly climate induced. As per our finding, decrease in amount
of water in lakes over the period of 18 years, is an alarming situation and can cause serious damage to
local ecosystem. Better monitoring and management has been required by the concerned local
authorities and departments. Conversion of Chotiari natural wetland into the manmade Chotiari
reservoir results in waterlogging, soil salinity and vegetation lose as according to present study 98% of
vegetation inside of reservoir boundary has been submerged under rising water level. Authorities and
local management needs to look out for the issue before further damage to the ecosystem and
biodiversity of the area.
References
Adam, E., Mutanga, O., Rugege, D., 2010. Multispectral and hyperspectral remote sensing for
identification and mapping of wetland vegetation: a review. Wetlands Ecology and Management, 18(3),
281–296.
Alam, S.M.R., & Hossain, M. S. (2020). A Rule-Based Classification Method for Mapping Saltmarsh
Land-Cover in South-Eastern Bangladesh from Landsat-8 OLI. Canadian Journal of Remote Sensing,
1-25.
Bian, J., Li, A., Lei, G., Zhang, Z., & Nan, X. (2020). Global high-resolution mountain green cover
index mapping based on Landsat images and Google Earth Engine. ISPRS Journal of Photogrammetry
and Remote Sensing, 162, 63-76.
Chang, M.S. (2018). Ecological and Environmental Assessment of Nara Desert Wetland Complex
(NDWC), Khairpur, Sindh-Pakistan. Community and Global Ecology of Deserts, 55.
Daily Times. (2010). “Chotiari Dam waterlogging ruins over 50,000 acres of land”. Daily Times,
Karachi. Nov. 15. https://foreverindus.org/pdf/newsnevents/inpress/151110 _chotiaridam. Pdf (Jan. 1,
2019)
Davranche, A., Poulin, B., Lefebvre, G., 2009. Wetland monitoring using classification trees and
SPOT-5 seasonal time series. Remote Sensing of Environment 114, 552–562.
ISSN: 2237-0722
Vol. 11 No. 4 (2021)
Received: 04.07.2021 – Accepted: 02.08.2021
4276
Domínguez-Beisiegel, M., Castañeda, C., Mougenot, B., & Herrero, J. (2016). Analysis and mapping
of the spectral characteristics of fractional green cover in saline wetlands (NE Spain) using field and
remote sensing data. Remote Sensing, 8(7), 590.
FAO. State of the World’s Forests. Rome, Italy, 1997.
FAO, UNEP. Terminology for Integrated Resources Planning and Management. Rome, Italy; Nairobi,
Kenya, 1999.
Farda, N.M. (2017). Multi-temporal land use mapping of coastal wetlands area using machine learning
in Google earth engine. In IOP Conference Series: Earth and Environmental Science, 98(1), 012042).
IOP Publishing.
Fernandes, R., Fraser, R., Latifovic, R., Cihlar, J., Beaubien, J., & Du, Y. (2004). Approaches to
fractional land cover and continuous field mapping: A comparative assessment over the BOREAS
study region. Remote Sensing of Environment, 89(2), 234-251.
Gudex-Cross, D., Pontius, J., Adams, A., 2017. Enhanced forest cover mapping using spectral
unmixing and object-based classification of multi-temporal Landsat imagery. Remote Sens. Environ.
196, 193–204. http://dx.doi.org/10.1016/j.rse.2017.05.006.
Haque, M., & Basak, R. (2017). Land cover change detection using GIS and remote sensing techniques:
A spatio-temporal study on Tanguar Haor, Sunamganj, Bangladesh. The Egyptian Journal of Remote
Sensing and Space Science, 20(2), 251-263.
Heipke, C. (2004). Some Requirements for Geographic Information Systems. Photogrammetric
Engineering & Remote Sensing, 70(2), 185-195.
He, J., Loboda, T.V., Jenkins, L., & Chen, D. (2019). Mapping fractional cover of major fuel type
components across Alaskan tundra. Remote Sensing of Environment, 232, 111324.
Izhar-uI-Haq, E.D., & Iqbal, J.Z. (2016). Environmental conservation of wetlands in Pakistan.
Liu, K, W. Zhao, X. Guo and J. Wang. 2010. Change Analysis of Beidagang Wetland Based on 3S
Technology. In: The 18th International Conference on Geoinformatics: GI Science in Change,
Geoinformatics 2010, Peking University, June, 18-20, Beijing, China, pp. 1-5.
10.1109/GEOINFORMATICS.2010.5568080
Mack, B., Leinenkugel, P., Kuenzer, C., Dech, S., 2017. A semi-automated approach for the generation
of a new land use and land cover product for Germany based on Landsat time-series and Lucas in-situ
data. Remote Sens. Lett., 8, 244–253. http://dx.doi.org/10.1080/2150704X.2016.1249299
Magsi, H., & Torre, A. (2014). Proximity analysis of inefficient practices and socio-spatial negligence:
Evidence, evaluations and recommendations drawn from the construction of Chotiari reservoir in
Pakistan. Land Use Policy, 36, 567-576.
Mahdianpari, M., Jafarzadeh, H., Granger, J.E., Mohammadimanesh, F., Brisco, B., Salehi, B., &
Weng, Q. (2020). A large-scale change monitoring of wetlands using time series Landsat imagery on
Google Earth Engine: a case study in Newfoundland. GI Science & Remote Sensing, 57(8), 1102-1124.
Munyat, C. 2011. Wetland change detection on the Kafue Flats, Zambia, by classification of a
multitemporal remote sensing image dataset. International Journal of Remote Sensing, 21(9),
1787-1806.
Na, X., Zhang, S., Li, X., Yu, H., Liu, C., 2010. Improved land cover mapping using random forests
combined with Landsat thematic mapper imagery and ancillary geographic data. Photogrammetric
Engineering & Remote Sensing 76 (7),833–840.

ISSN: 2237-0722
Vol. 11 No. 4 (2021)
Received: 04.07.2021 – Accepted: 02.08.2021
4277
Olhan, E., S. Gün, Y. Ataseven and H. Arisoy. 2010. Effects of agricultural activities in Seyfe Wetland.
Scientific Research and Essay 5(1), 9-14.
Ozesmi, S.L., Bauer, M.E., 2002. Satellite remote sensing of wetlands. Wetlands Ecology and
Management 10, 381–402.
Rai, V. 2008. Modeling a wetland system – The case of Keoladeo National Park (KNP), India.
Ecological Modelling, 210(3), 247-252.
Rais, M., Abbass, D., Khan, M.Z., Khan, I.S., Ghalib, S.A., Tabbassum, F., & Nawaz, R. (2008).
Changes in the avifauna of the wetlands of District Sanghar, Sindh, Pakistan. Áåðêóò, 13.
Rais, M., Khan, M.Z., Abbass, D., Akber, G., & Nawaz, R. (2011). A qualitative study on wildlife of
Chotiari Reservoir, Sanghar, Sindh, Pakistan. Pakistan Journal of Zoology, 43(2).
Rais, M., Khan, M.Z., Ghalib, S.A., Nawaz, R., Akbar, G., Islam, S.L., & Begum, A. (2013). Global
conservation significance of Chotiari Wetlands Complex, Sangahr, Sindh, Pakistan. J. of Animal and
Plant Sc, 23(6), 1609-1617.
Raza, A. (2009). “Chotiari threatened by water reservoir”. The NEWS.
https://www.thenews.com.pk/archive/print/206191-chotiari-threatened-by-water-reservoir. (Dec. 30,
2018)
Reschke, J., & Hüttich, C. (2014). Continuous field mapping of Mediterranean wetlands using sub-
pixel spectral signatures and multi-temporal Landsat data. International Journal of Applied Earth
Observation and Geoinformation, 28, 220-229.
Rind, M.A., Ansari, K., Saher, R., Shakya, S., & Ahmad, S. (2018). 2D Hydrodynamic Model for Flood
Vulnerability Assessment of Lower Indus River Basin, Pakistan. In World Environmental and Water
Resources Congress 2018: Watershed Management, Irrigation and Drainage, and Water Resources
Planning and Management - Selected Papers from the World Environmental and Water Resources
Congress 2018. https://doi.org/10.1061/9780784481400.044
Seo, B., Bogner, C., Koellner, T., & Reineking, B. (2016). Mapping fractional land use and land cover
in a monsoon region: The effects of data processing options. IEEE Journal of Selected Topics in
Applied Earth Observations and Remote Sensing, 9(9), 3941-3956.
Siddiqui, Z.M. (2009). “Chotiari reservoir – an ecological disaster”. Daily DAWN.
http://news.dawn.com/wps/wcm/connect/dawn-content-library/dawn/news/scitech/07-chotiari-
reservoir-an-ecological-disaster-ha-01. (Dec. 30, 2018)
Wang, C., Jia, M., Chen, N., & Wang, W. (2018). Long-term surface water dynamics analysis based
on Landsat imagery and the Google Earth Engine platform: A case study in the middle Yangtze River
Basin. Remote Sensing, 10(10), 1635.4
Wright, C., Gallant, A., 2007. Improved wetland remote sensing in Yellowstone National Park using
classification trees to combine TM imagery and ancillary environmental data. Remote Sensing of
Environment 107 (4), 582–605.
WWF, 2008. Detailed ecological assessment of fauna, including limnological studies at Chotiari
reservoir. World Wide fund for nature, Pakistan. 1-175.
Zeng, H., Wu, B., Wang, S., Musakwa, W., Tian, F., Mashimbye, Z.E., & Syndey, M. (2020). A
synthesizing land-cover classification method based on Google earth engine: a case study in nzhelele
and levhuvu catchments, South Africa. Chinese Geographical Science, 30(3), 397-409.