fracking & water permitting in · pdf filefracking and oil & gas water permitting in...
TRANSCRIPT

Fracking and Oil & Gas Water
Permitting in Oklahoma
Present Situation and Future
Estimates

Quick History: Fracking in Oklahoma
• 1949 first hydrologic fracturing by Haliburton
in Stephens County, OK
• In the 1950’s fracking reached 3000 wells/mo
in the US
• By 2008 there were 50,000 treatment stages
worldwide completed, mostly in US
• Horizontal drilling + fracking = “Shale Gale”
• In Woodford Shale in OK in 2004 only 24 gas
wells, by 2008 there were 750 gas wells

Present Regulatory Framework
Water Quality & Pollution:
• Corporation Commission oversees drilling
activities, pit construction & injection wells
• Surface casing to 50 ft below the base of treatable
water with cementing to the surface
• Pits with capacities to 50,000 barrels
• Special construction & operating rules near protected
wellheads (municipal water supply)
• Prohibition against any pollution to ground or surface
water

Present Regulatory Framework
• Dept. of Environmental Quality oversees
discharge permits and sets drinking water
standards including wellhead protection areas
for public water supply.

Present Regulatory Framework
Water Quantity
• Water Resources Board oversees Water Rights
& water use permitting for both groundwater
& surface water
1. Groundwater permits are indefinite & based
on property & underlying aquifer yield
2. Surface Water permits are on a seven year
use it or lose it basis and allocation based on
justification of use & availability

Water Use Permitting
Long-Term Permits
• Groundwater:
1. 10,550 active permits
2. 611 contain mining for oil & gas (by SIC Code)
3. 2010 Reported Use for oil & gas was 1514 AF
• Surface Water:
1. 1,961 active permits
2. 30 contain mining for oil & gas (by SIC Code)
3. 2010 Reported Use for oil & gas was 97 AF


Water Use Permitting
90-Day Provisional Temporary Permits provide the bulk of oil & gas mining permits
• One year total is 15,598 AF (9/2010 – 9/2011)
• Both surface & groundwater permits handled the same way
• Can be obtained same day
• Double price for “Post-use” (the only penalty)
• Requires landowner right-of-access permission
• SW 90-Day PTs can be cancelled if they interfere with domestic riparian use

Water Use Permitting
90-Day Provisional Temporary Mining Permits
2008 2009 2010 2011* 9/1/10 –
9/13/11
Groundwater 462 150 295 455 521
Surface Water 1530 723 988 988 1349
Total 1992 873 1283 1443 1870
* Jan 1, 2011 to
Oct 6, 2011

Water Use Permitting
90-Day Permits Used for Fracking *
2008 2009 2010 2011 (YTD)
Groundwater:
Number of wells 35 35 62 83
Amt. of water requested (AF) 750 934 1,289 2,338
Average amt. per permit 21.4 26.7 20.8 28.2
Surface Water:
Number of diversions 167 150 226 312
Amt. of water requested (AF) 4,290 4,156 5,833 6,646
Average amt. per permit 25.7 27.7 25.8 21.3
* Permits with requested water
amount greater or equal to 9 AF

Water Use Permitting
Problems with 90-Day PTs:
1. Penalty fees are not high enough
2. Requires monitoring of spuding records to
verify compliance – time consuming
3. Amount of water requested is often not the
amount of water actually pumped & used
4. We probably only permit ½ to 1/3 of the
actual amount used


The Perfect Storm
• Oklahoma in historic drought since 9/2010
• 1st driest for last 365 days in Panhandle, West
Central, Central & Southwest; 2nd driest in
North Central & South Central
• July was the hottest month on record for any
state since records began
• Oil & gas drilling continues to ramp up in the
same areas as the drought


Planning for the Future
• The next 50 years: Oklahoma Comprehensive
Water Plan, 2012 Update
• Includes many study group reports including
marginal water quality, artificial recharge,
instream flows & climate change
• Demand & supply estimates from 2008 to
2060
• The plan took 5 years to prepare & is set to be
approved at the October Board Meeting

Planning for the Future
Oil & Gas Drilling Present:
• In 2008 total drilling used 29,107 AF
• Estimated 2010 total drilling was 42,107 AF which
is 2% of the total state water demand
• Data from industry & other agencies included,
for greater accuracy (OIPA, OCC, BIA (for Osage
Co.) and Mid-Continental Oil & Gas Asso.)
• Drilling divided into Conventional, horizontal, and
Woodford Shale

Planning for the Future
Estimated Present & Future Water Use for Oil & Gas Drilling by Drilling Type (AF/Y)
Drilling Type 2008 2010 2020 2030 2060
Conventional 11,200 15,700 21,500 28,200 53,600
Horizontal 3,200 5,100 11,800 20,800 61,500
Woodford Shale 14,700 21,300 41,100 29,200 420
Total All Drilling 29,100 42,100 74,400 78,200 115,600
% of Total State
Demand
2% 5%
From the Oklahoma Comprehensive Water Plan, 2012 Update, Water Demand
Forecast Report, CDM, 3/2011, pg 4-14

2060 Oil & Gas Water Demand
Oklahoma Comprehensive Water Plan 2012 Update, Executive Report, Sept, 2011, pg 66
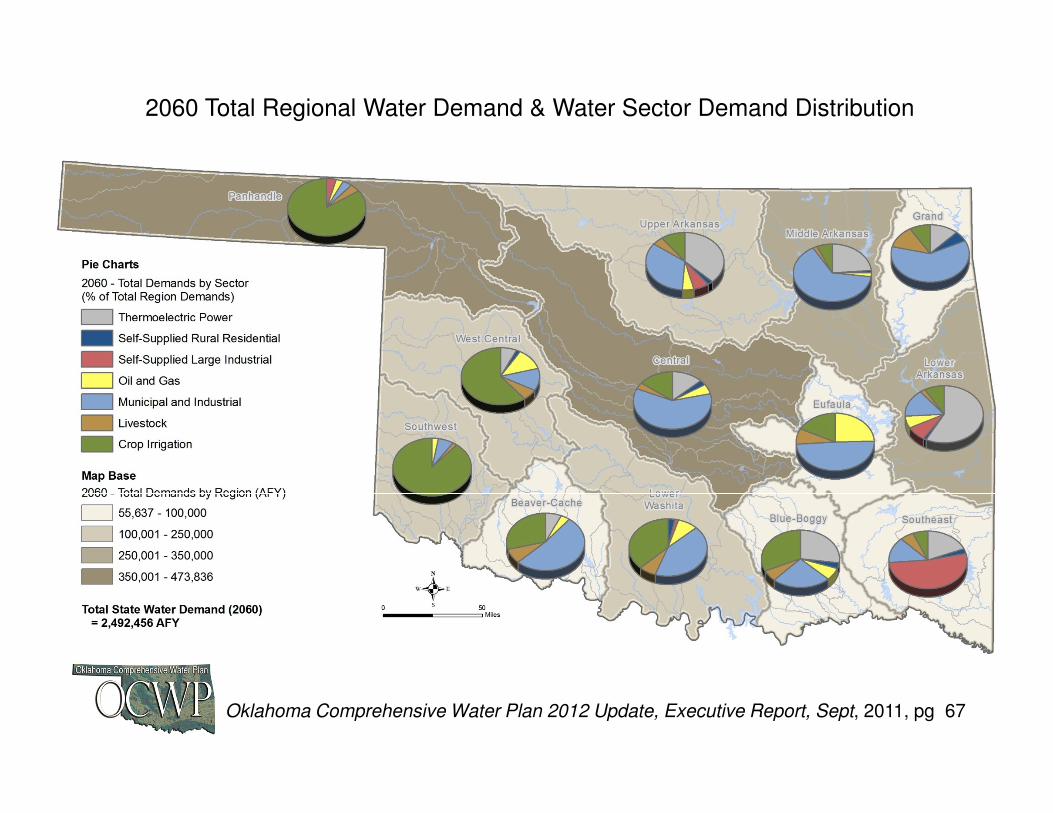
2060 Total Regional Water Demand & Water Sector Demand Distribution
Oklahoma Comprehensive Water Plan 2012 Update, Executive Report, Sept, 2011, pg 67


Planning for the future
Estimates of Water Use per Well by Drilling Type (AF)
Operation Conventional Horizontal Woodford Shale
Drilling &
Cementing
< 12,000 ft 1 1.5 1
>12,000 ft 2.7 3 2.7
Completion 3.2 10 19.3
Total 4.3 – 5.9 12 - 13 20 - 22
From Oklahoma Comprehensive Water Plan 2012 Update, Water Demand Forecast
Report, CDM, March, 2011

Conclusions
• Oil & Gas Drilling (incl. fracking) will increase
in Oklahoma by 300% over the next 50 years
• We need better mechanisms to identify
drilling sites & how much water is used
• We need more regulatory hammers with
greater penalties for non-compliance
• We have successfully navigated through the
“Perfect Storm”, but it may get worse