fpma bulletin #10 - food and agriculture organization · key messages ↗ international ... price...
TRANSCRIPT
10 November 2015
monthly report on food price trends
bulletin
Food Price Monitoring and Analysis
#10
Key messages ↗ International prices of maize and wheat generally increased in October. Maize prices were underpinned by further downward revisions of the 2015 production forecasts in key exporting countries, while lingering concerns about inadequate precipitation for planting of the 2016 winter wheat crop in the Black Sea Region and in the United States of America supported wheat prices. The FAO Rice price Index remained under pressure driven by declines in Aromatic and Japonica rice segments.
↗ In Southern Africa, prices of maize continued to increase in October, reaching levels well above those of a year earlier, particularly in South Africa and Malawi, reflecting tight market supplies due to a sharp subregional production decline this year.
↗ In Central America, prices of white maize decreased sharply in October with the completion of the 2015 main season harvests and imports improving supplies. Prices, however, remained above their year-earlier levels in most countries supported by the reduced first season outputs and concerns about second season harvest prospects.
↗ Weak national currencies continued to put upward pressure on domestic cereal prices in countries of the CIS and South America, with largest depreciations recorded in Kazakhstan and Brazil over the past few months.
Price warning level: High Moderate [Based on GIEWS analysis]
ContentsIntErnatIonal cErEal PrIcES ............................. 2
DoMEStIc PrIcE WarnInGS .................................. 3
WESt afrIca ........................................................... 7
SoutHErn afrIca .................................................. 8
EaSt afrIca ............................................................ 9
EaSt aSIa .............................................................. 11
cIS - aSIa anD EuroPE ......................................... 14
cEntral aMErIca anD tHE carIBBEan ............. 16
SoutH aMErIca ................................................... 17
Dominican Republic | Beans
El Salvador | White maize
Honduras | White maize
Indonesia | Rice
Malawi | Maize
Myanmar | Rice
Nicaragua | White maize
South Africa | Maize
Tajikistan | Wheat flour
Uganda | Maize
United Republic of Tanzania | Maize
Domestic price warnings
The designations employed and the presentation of material in the map do not imply the expression of any opinion whatsoever on the part of FAO concerning the legal or constitutional status of any country, territory or sea area, or concerning the delimitation of frontiers.
2 Food Price Monitoring and Analysis 10 November 2015
for more information visit the fPMa website here
INTeRNaTIONaL CeReaL PRICes
Export prices of maize from the united States of america, the world’s largest maize producer and exporter, increased for the second consecutive month in october. the international benchmark uS maize (no.2, Yellow) price averaged uSD 172 per tonne, nearly 4 percent higher than in September and 4.5 percent up from the corresponding period last year. the increase follows further downward revisions of 2015 production forecasts in key exporting countries, notably ukraine. Stronger wheat quotations also provided some support. However, seasonal downward pressure with the bulk of the 2015 harvest nearing completion and sluggish exports limited the increase. In South america, maize export prices in october were supported by strong export demand, while in the Black Sea region quotations declined on seasonal harvest pressure.
Export prices of wheat increased further in october, with the benchmark uS wheat (no.2 Hard red Winter) price averaging uSD 218 per tonne, up 1 percent from September but still more than 20 percent lower than its year-earlier value. Despite some beneficial precipitation in the second half of the month, lingering concerns about overall dry
weather conditions affecting winter wheat plantings in ukraine, the russian federation and in some areas of the united States of america continued to underpin prices. overall, however, ample global supplies and strong export competition continued to weigh on prices.
the fao Rice Price Index dropped again in october, shedding 7 points, or 3.3 percent, from September. the decrease was mainly driven by the aromatic and Japonica rice, which saw their respective price sub-indices retrenching by 8 percent and 5 percent, respectively. on the other hand, the lower Quality Indica rice sub-index was substantially unchanged, while that of Higher Quality Indica prices rebounded by 1 percent. the white rice benchmark quotation (thai 100%B) was among those firming, increasing by almost 3 percent to uSD 376 per tonne in october. Most quotations were up in thailand, but also in Viet nam, reflecting anticipated or confirmed new sales to Indonesia, the Philippines and Malaysia. By contrast, export prices in India and Pakistan remained under pressure on limited buying interest pending the arrival of new harvested crops. Prices in South america were stable to lower, as competition among exporters remained stiff.
International prices of maize and wheat generally increased in October, those of rice remained under downward pressure
Latest Price(Oct-15) 1M 3M 1Y
International maize prices
Percent Change
140
160
180
200
220
240
260
Oct-13 Jan-14 Apr-14 Jul-14 Oct-14 Jan-15 Apr-15 Jul-15 Oct-15
US (Gulf), Maize (US No. 2, Yellow)
Brazil (Paranagua), Maize (feed)
Argentina, Maize (Argentina, Up River, f.o.b.)
Black Sea, Maize (feed)
USD per tonne
Source(s): USDA; International Grains Council
172.04
168.25
163.75
168.00
3.7
1.2
1.6
-1.4
-3.8
-7.2
-7.1
-13.2
4.5
-7
-4.1
-2.9
Latest Price(Oct-15) 1M 3M 1Y
International wheat prices
Percent Change
150
200
250
300
350
400
Oct-13 Jan-14 Apr-14 Jul-14 Oct-14 Jan-15 Apr-15 Jul-15 Oct-15
US (Gulf), Wheat (US No. 2, Hard Red Winter)
EU (France), Wheat (grade 1)
Black Sea, Wheat (milling)
Argentina, Wheat (Argentina, Trigo Pan, Up River, f.o.b.)
USD per tonne
Source(s): International Grains Council
220.75
192.75
196.50
223.50
1.1
7.2
7.5
0.1
-7.1
-5.9
-0.3
-2.2
-23.7
-11.9
-17.8
-7.5
Price warning level: High Moderate
3Food Price Monitoring and Analysis
for more information visit the fPMa website here
10 November 2015
DOmesTIC PRICe WaRNINgs
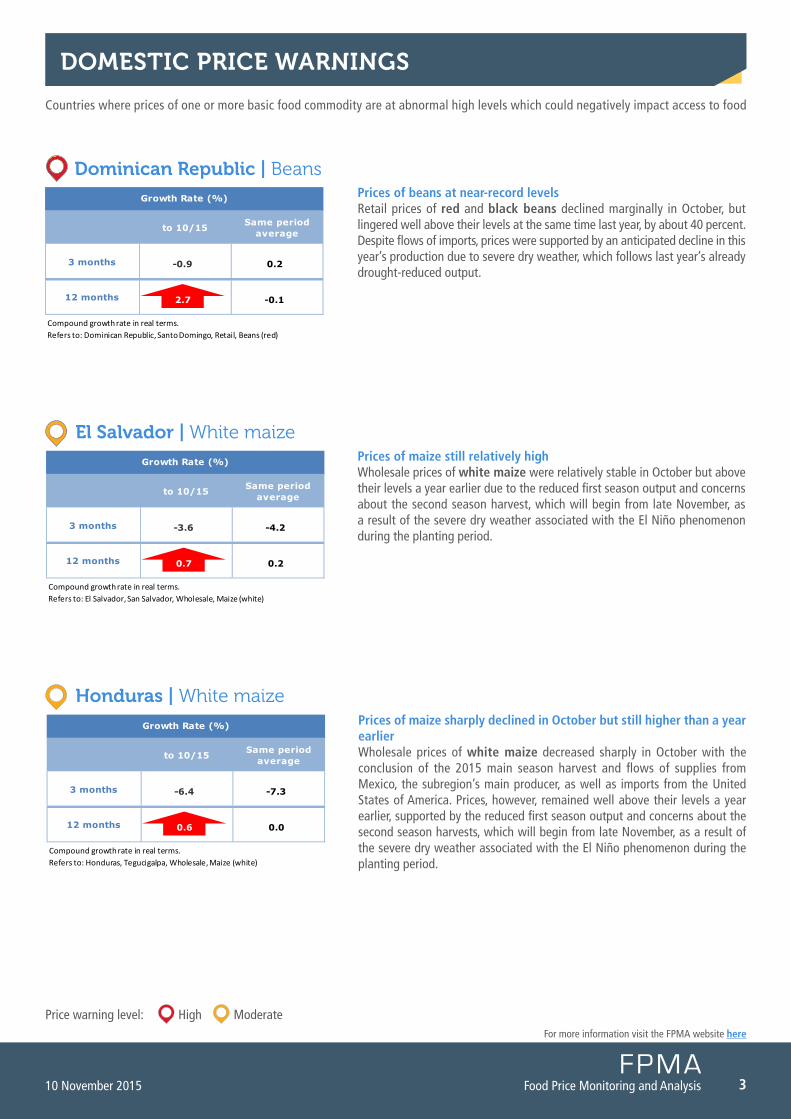
Prices of beans at near-record levelsretail prices of red and black beans declined marginally in october, but lingered well above their levels at the same time last year, by about 40 percent. Despite flows of imports, prices were supported by an anticipated decline in this year’s production due to severe dry weather, which follows last year’s already drought-reduced output.
Dominican Republic | Beans
countries where prices of one or more basic food commodity are at abnormal high levels which could negatively impact access to food
Honduras | White maize
el salvador | White maize
Prices of maize sharply declined in October but still higher than a year earlier Wholesale prices of white maize decreased sharply in october with the conclusion of the 2015 main season harvest and flows of supplies from Mexico, the subregion’s main producer, as well as imports from the united States of america. Prices, however, remained well above their levels a year earlier, supported by the reduced first season output and concerns about the second season harvests, which will begin from late november, as a result of the severe dry weather associated with the El niño phenomenon during the planting period.
Prices of maize still relatively high Wholesale prices of white maize were relatively stable in october but above their levels a year earlier due to the reduced first season output and concerns about the second season harvest, which will begin from late november, as a result of the severe dry weather associated with the El niño phenomenon during the planting period.
to 10/15 Same periodaverage
3 months
12 months
Growth Rate (%)
2.7
-0.9
Compound growth rate in real terms.Refers to: Dominican Republic, Santo Domingo, Retail, Beans (red)
0.2
-0.1
to 10/15 Same periodaverage
3 months
12 months
Growth Rate (%)
0.7
-3.6
Compound growth rate in real terms.Refers to: El Salvador, San Salvador, Wholesale, Maize (white)
-4.2
0.2
to 10/15 Same periodaverage
3 months
12 months
Growth Rate (%)
0.6
-6.4
Compound growth rate in real terms.Refers to: Honduras, Tegucigalpa, Wholesale, Maize (white)
-7.3
0.0
Price warning level: High Moderate
4 Food Price Monitoring and Analysis 10 November 2015
for more information visit the fPMa website here
DOmesTIC PRICe WaRNINgs contd.
Indonesia | Rice
malawi | Maize
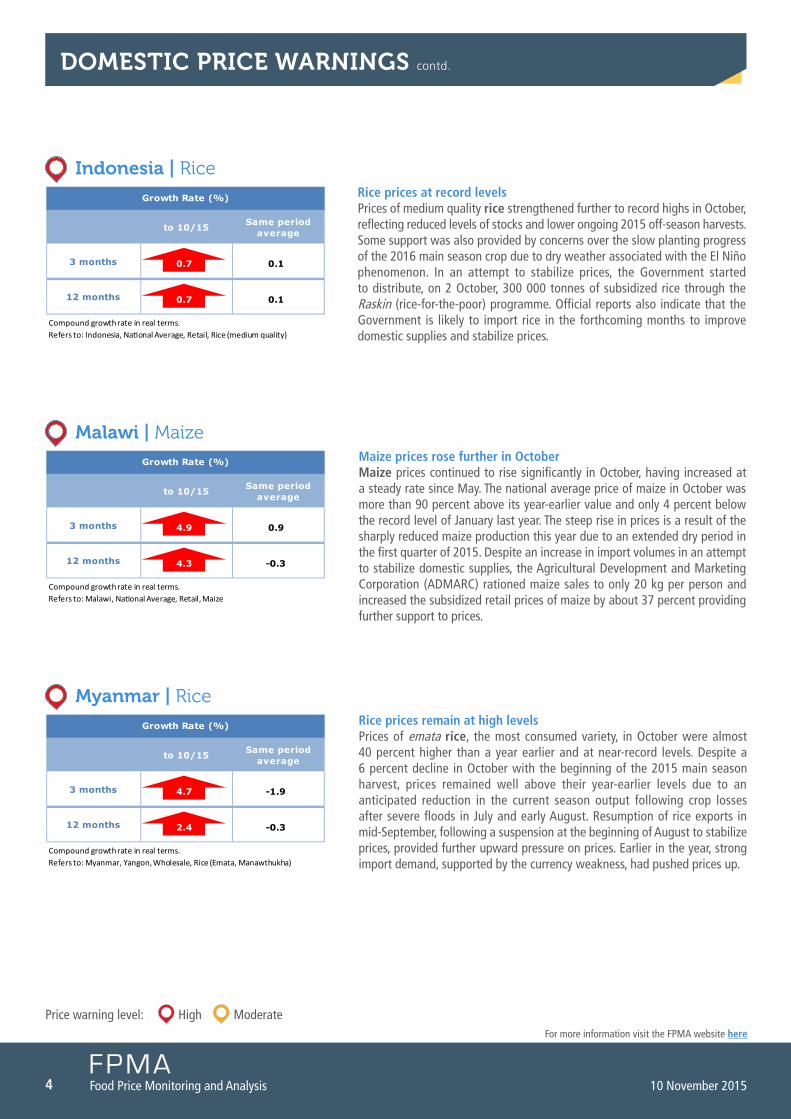
Rice prices at record levelsPrices of medium quality rice strengthened further to record highs in october, reflecting reduced levels of stocks and lower ongoing 2015 off-season harvests. Some support was also provided by concerns over the slow planting progress of the 2016 main season crop due to dry weather associated with the El niño phenomenon. In an attempt to stabilize prices, the Government started to distribute, on 2 october, 300 000 tonnes of subsidized rice through the raskin (rice-for-the-poor) programme. official reports also indicate that the Government is likely to import rice in the forthcoming months to improve domestic supplies and stabilize prices.
myanmar | RiceRice prices remain at high levels Prices of emata rice, the most consumed variety, in october were almost 40 percent higher than a year earlier and at near-record levels. Despite a 6 percent decline in october with the beginning of the 2015 main season harvest, prices remained well above their year-earlier levels due to an anticipated reduction in the current season output following crop losses after severe floods in July and early august. resumption of rice exports in mid-September, following a suspension at the beginning of august to stabilize prices, provided further upward pressure on prices. Earlier in the year, strong import demand, supported by the currency weakness, had pushed prices up.
to 10/15 Same periodaverage
3 months
12 months
Growth Rate (%)
0.7
0.7
Compound growth rate in real terms.Refers to: Indonesia, National Average, Retail, Rice (medium quality)
0.1
0.1
to 10/15 Same periodaverage
3 months
12 months
Growth Rate (%)
4.3
4.9
Compound growth rate in real terms.Refers to: Malawi, National Average, Retail, Maize
0.9
-0.3
to 10/15 Same periodaverage
3 months
12 months
Growth Rate (%)
2.4
4.7
Compound growth rate in real terms.Refers to: Myanmar, Yangon, Wholesale, Rice (Emata, Manawthukha)
-1.9
-0.3
Maize prices rose further in OctoberMaize prices continued to rise significantly in october, having increased at a steady rate since May. the national average price of maize in october was more than 90 percent above its year-earlier value and only 4 percent below the record level of January last year. the steep rise in prices is a result of the sharply reduced maize production this year due to an extended dry period in the first quarter of 2015. Despite an increase in import volumes in an attempt to stabilize domestic supplies, the agricultural Development and Marketing corporation (aDMarc) rationed maize sales to only 20 kg per person and increased the subsidized retail prices of maize by about 37 percent providing further support to prices.
Price warning level: High Moderate
5Food Price Monitoring and Analysis
for more information visit the fPMa website here
10 November 2015
DOmesTIC PRICe WaRNINgs contd.
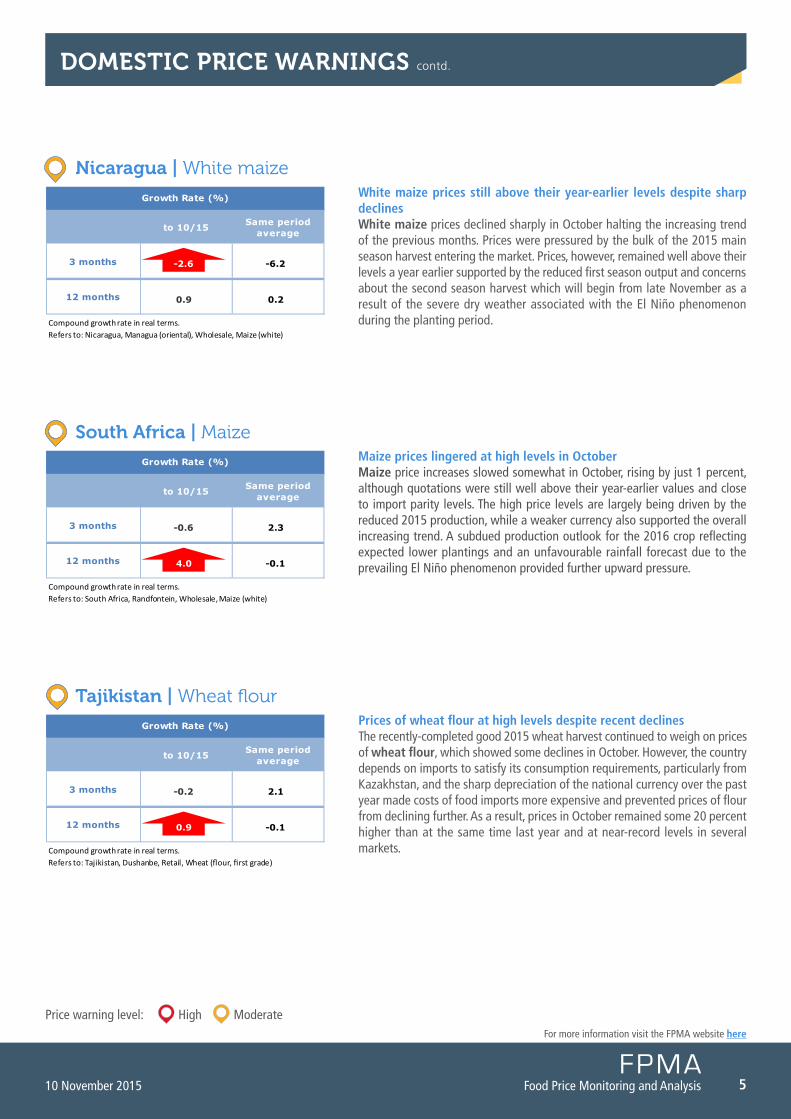
Nicaragua | White maize White maize prices still above their year-earlier levels despite sharp declinesWhite maize prices declined sharply in october halting the increasing trend of the previous months. Prices were pressured by the bulk of the 2015 main season harvest entering the market. Prices, however, remained well above their levels a year earlier supported by the reduced first season output and concerns about the second season harvest which will begin from late november as a result of the severe dry weather associated with the El niño phenomenon during the planting period.
south africa | Maize Maize prices lingered at high levels in OctoberMaize price increases slowed somewhat in october, rising by just 1 percent, although quotations were still well above their year-earlier values and close to import parity levels. the high price levels are largely being driven by the reduced 2015 production, while a weaker currency also supported the overall increasing trend. a subdued production outlook for the 2016 crop reflecting expected lower plantings and an unfavourable rainfall forecast due to the prevailing El niño phenomenon provided further upward pressure.
Tajikistan | Wheat flourPrices of wheat flour at high levels despite recent declinesthe recently-completed good 2015 wheat harvest continued to weigh on prices of wheat flour, which showed some declines in october. However, the country depends on imports to satisfy its consumption requirements, particularly from Kazakhstan, and the sharp depreciation of the national currency over the past year made costs of food imports more expensive and prevented prices of flour from declining further. as a result, prices in october remained some 20 percent higher than at the same time last year and at near-record levels in several markets.
to 10/15 Same periodaverage
3 months
12 months
Growth Rate (%)
0.9
-2.6
Compound growth rate in real terms.Refers to: Nicaragua, Managua (oriental), Wholesale, Maize (white)
-6.2
0.2
to 10/15 Same periodaverage
3 months
12 months
Growth Rate (%)
4.0
-0.6
Compound growth rate in real terms.Refers to: South Africa, Randfontein, Wholesale, Maize (white)
2.3
-0.1
to 10/15 Same periodaverage
3 months
12 months
Growth Rate (%)
0.9
-0.2
Compound growth rate in real terms.Refers to: Tajikistan, Dushanbe, Retail, Wheat (flour, first grade)
2.1
-0.1
Price warning level: High Moderate
6 Food Price Monitoring and Analysis 10 November 2015
for more information visit the fPMa website here
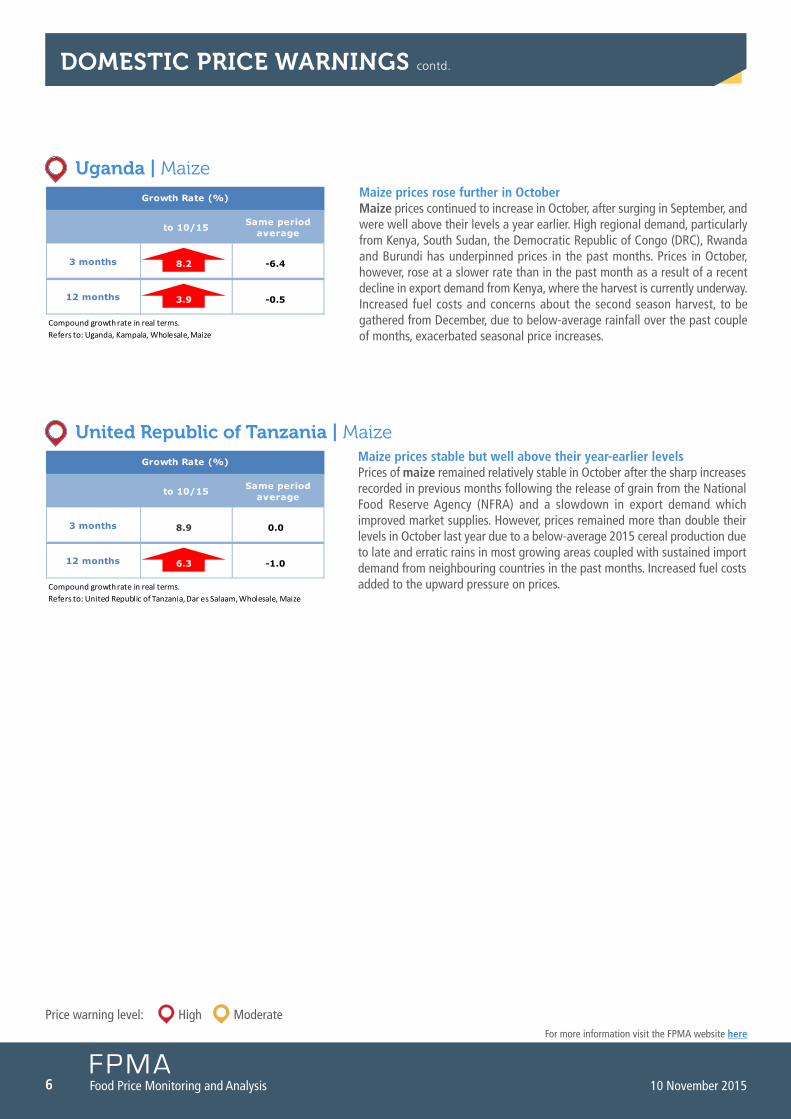
Uganda | Maize Maize prices rose further in OctoberMaize prices continued to increase in october, after surging in September, and were well above their levels a year earlier. High regional demand, particularly from Kenya, South Sudan, the Democratic republic of congo (Drc), rwanda and Burundi has underpinned prices in the past months. Prices in october, however, rose at a slower rate than in the past month as a result of a recent decline in export demand from Kenya, where the harvest is currently underway. Increased fuel costs and concerns about the second season harvest, to be gathered from December, due to below-average rainfall over the past couple of months, exacerbated seasonal price increases.
United Republic of Tanzania | MaizeMaize prices stable but well above their year-earlier levels Prices of maize remained relatively stable in october after the sharp increases recorded in previous months following the release of grain from the national food reserve agency (nfra) and a slowdown in export demand which improved market supplies. However, prices remained more than double their levels in october last year due to a below-average 2015 cereal production due to late and erratic rains in most growing areas coupled with sustained import demand from neighbouring countries in the past months. Increased fuel costs added to the upward pressure on prices.
DOmesTIC PRICe WaRNINgs contd.
to 10/15 Same periodaverage
3 months
12 months
Growth Rate (%)
3.9
8.2
Compound growth rate in real terms.Refers to: Uganda, Kampala, Wholesale, Maize
-6.4
-0.5
to 10/15 Same periodaverage
3 months
12 months
Growth Rate (%)
6.3
8.9
Compound growth rate in real terms.Refers to: United Republic of Tanzania, Dar es Salaam, Wholesale, Maize
0.0
-1.0
7Food Price Monitoring and Analysis
for more information visit the fPMa website here
10 November 2015
WesT afRICa
Coarse grain prices continued to show mixed trends in coastal countries, but remained generally stable in the sahel
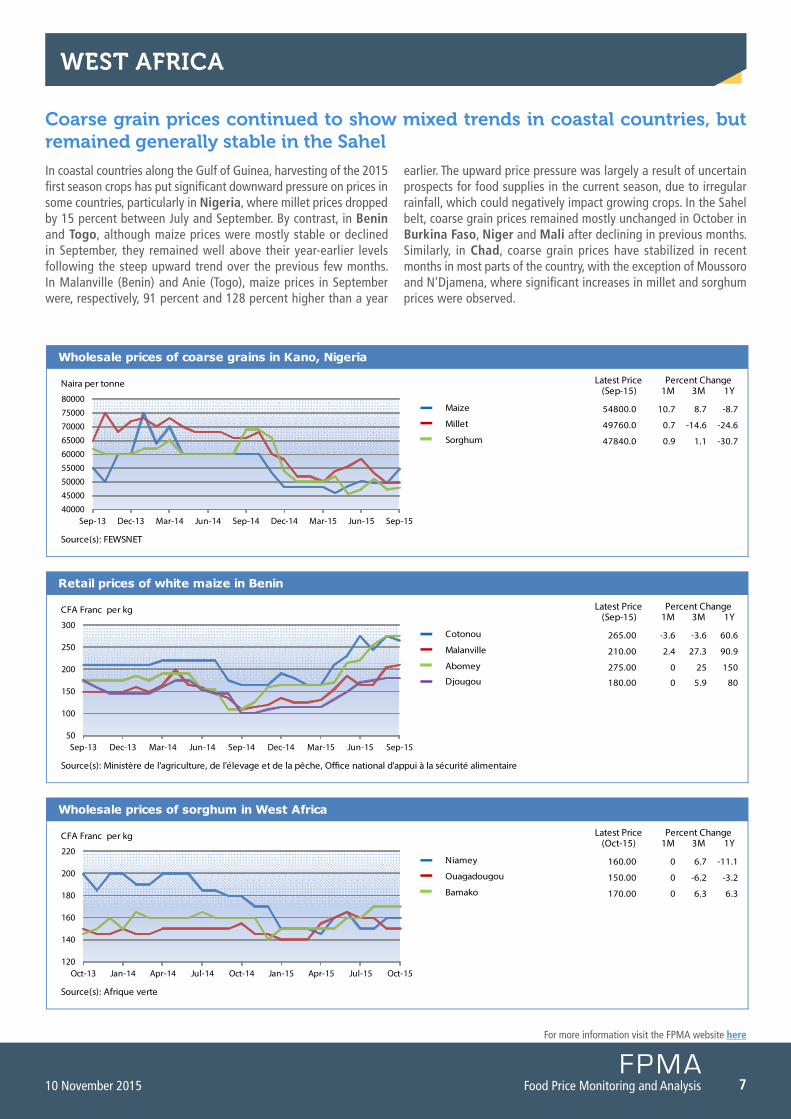
In coastal countries along the Gulf of Guinea, harvesting of the 2015 first season crops has put significant downward pressure on prices in some countries, particularly in Nigeria, where millet prices dropped by 15 percent between July and September. By contrast, in Benin and Togo, although maize prices were mostly stable or declined in September, they remained well above their year-earlier levels following the steep upward trend over the previous few months. In Malanville (Benin) and anie (togo), maize prices in September were, respectively, 91 percent and 128 percent higher than a year
earlier. the upward price pressure was largely a result of uncertain prospects for food supplies in the current season, due to irregular rainfall, which could negatively impact growing crops. In the Sahel belt, coarse grain prices remained mostly unchanged in october in Burkina Faso, Niger and Mali after declining in previous months. Similarly, in Chad, coarse grain prices have stabilized in recent months in most parts of the country, with the exception of Moussoro and n’Djamena, where significant increases in millet and sorghum prices were observed.
Latest Price(Sep-15) 1M 3M 1Y
Wholesale prices of coarse grains in Kano, Nigeria
Percent Change
40000
45000
50000
5500060000
65000
70000
75000
80000
Sep-13 Dec-13 Mar-14 Jun-14 Sep-14 Dec-14 Mar-15 Jun-15 Sep-15
Maize
Millet
Sorghum
Naira per tonne
Source(s): FEWSNET
54800.0
49760.0
47840.0
10.7
0.7
0.9
8.7
-14.6
1.1
-8.7
-24.6
-30.7
Latest Price(Oct-15) 1M 3M 1Y
Wholesale prices of sorghum in West Africa
Percent Change
120
140
160
180
200
220
Oct-13 Jan-14 Apr-14 Jul-14 Oct-14 Jan-15 Apr-15 Jul-15 Oct-15
Niamey
Ouagadougou
Bamako
CFA Franc per kg
Source(s): Afrique verte
160.00
150.00
170.00
0
0
0
6.7
-6.2
6.3
-11.1
-3.2
6.3
Latest Price(Sep-15) 1M 3M 1Y
Retail prices of white maize in Benin
Percent Change
50
100
150
200
250
300
Sep-13 Dec-13 Mar-14 Jun-14 Sep-14 Dec-14 Mar-15 Jun-15 Sep-15
Cotonou
Malanville
Abomey
Djougou
CFA Franc per kg
Source(s): Ministère de l'agriculture, de l'élevage et de la pêche, O�ce national d'appui à la sécurité alimentaire
265.00
210.00
275.00
180.00
-3.6
2.4
0
0
-3.6
27.3
25
5.9
60.6
90.9
150
80
8 Food Price Monitoring and Analysis 10 November 2015
for more information visit the fPMa website here
sOUTHeRN afRICa
maize prices continue to rise supported by tight supplies
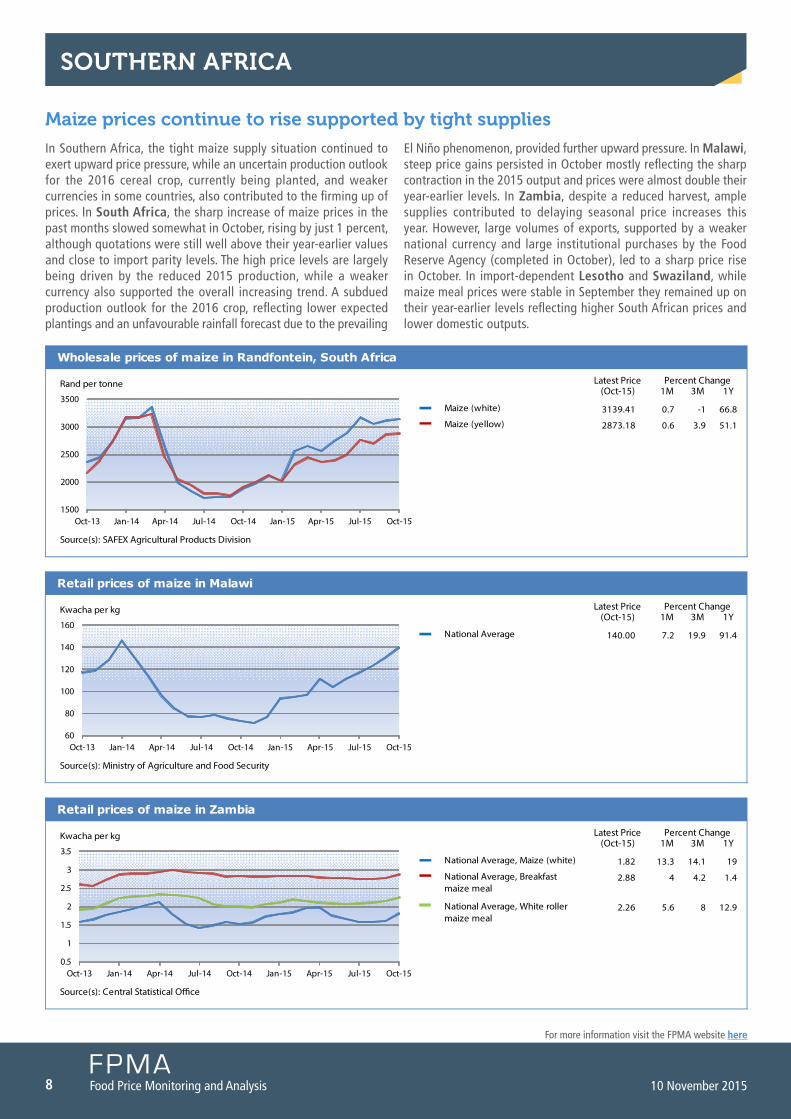
In Southern africa, the tight maize supply situation continued to exert upward price pressure, while an uncertain production outlook for the 2016 cereal crop, currently being planted, and weaker currencies in some countries, also contributed to the firming up of prices. In South Africa, the sharp increase of maize prices in the past months slowed somewhat in october, rising by just 1 percent, although quotations were still well above their year-earlier values and close to import parity levels. the high price levels are largely being driven by the reduced 2015 production, while a weaker currency also supported the overall increasing trend. a subdued production outlook for the 2016 crop, reflecting lower expected plantings and an unfavourable rainfall forecast due to the prevailing
El niño phenomenon, provided further upward pressure. In Malawi, steep price gains persisted in october mostly reflecting the sharp contraction in the 2015 output and prices were almost double their year-earlier levels. In Zambia, despite a reduced harvest, ample supplies contributed to delaying seasonal price increases this year. However, large volumes of exports, supported by a weaker national currency and large institutional purchases by the food reserve agency (completed in october), led to a sharp price rise in october. In import-dependent Lesotho and Swaziland, while maize meal prices were stable in September they remained up on their year-earlier levels reflecting higher South african prices and lower domestic outputs.
Latest Price(Oct-15) 1M 3M 1Y
Retail prices of maize in Malawi
Percent Change
60
80
100
120
140
160
Oct-13 Jan-14 Apr-14 Jul-14 Oct-14 Jan-15 Apr-15 Jul-15 Oct-15
National Average
Kwacha per kg
Source(s): Ministry of Agriculture and Food Security
140.00 7.2 19.9 91.4
Latest Price(Oct-15) 1M 3M 1Y
Retail prices of maize in Zambia
Percent Change
0.5
1
1.5
2
2.5
3
3.5
Oct-13 Jan-14 Apr-14 Jul-14 Oct-14 Jan-15 Apr-15 Jul-15 Oct-15
National Average, Maize (white)
National Average, Breakfast maize meal
National Average, White roller maize meal
Kwacha per kg
Source(s): Central Statistical O�ce
1.82
2.88
2.26
13.3
4
5.6
14.1
4.2
8
19
1.4
12.9
Latest Price(Oct-15) 1M 3M 1Y
Wholesale prices of maize in Randfontein, South Africa
Percent Change
1500
2000
2500
3000
3500
Oct-13 Jan-14 Apr-14 Jul-14 Oct-14 Jan-15 Apr-15 Jul-15 Oct-15
Maize (white)
Maize (yellow)
Rand per tonne
Source(s): SAFEX Agricultural Products Division
3139.41
2873.18
0.7
0.6
-1
3.9
66.8
51.1
9Food Price Monitoring and Analysis
for more information visit the fPMa website here
10 November 2015
easT afRICa
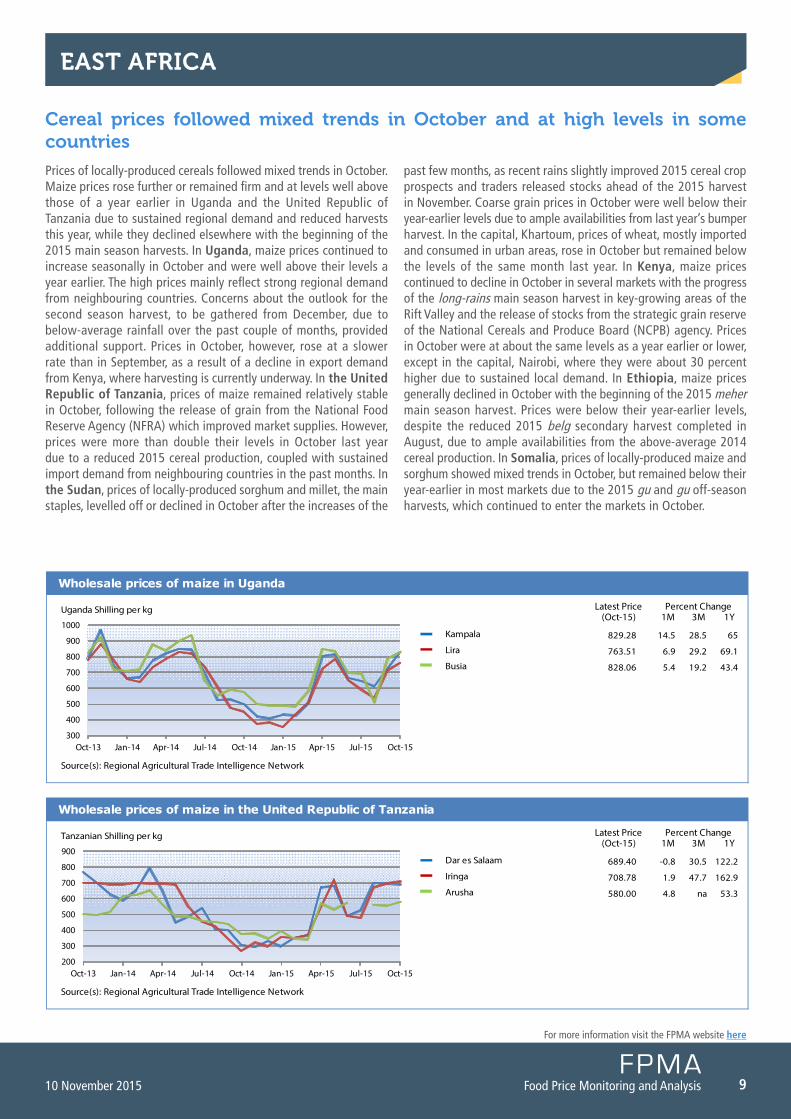
Cereal prices followed mixed trends in October and at high levels in some countries
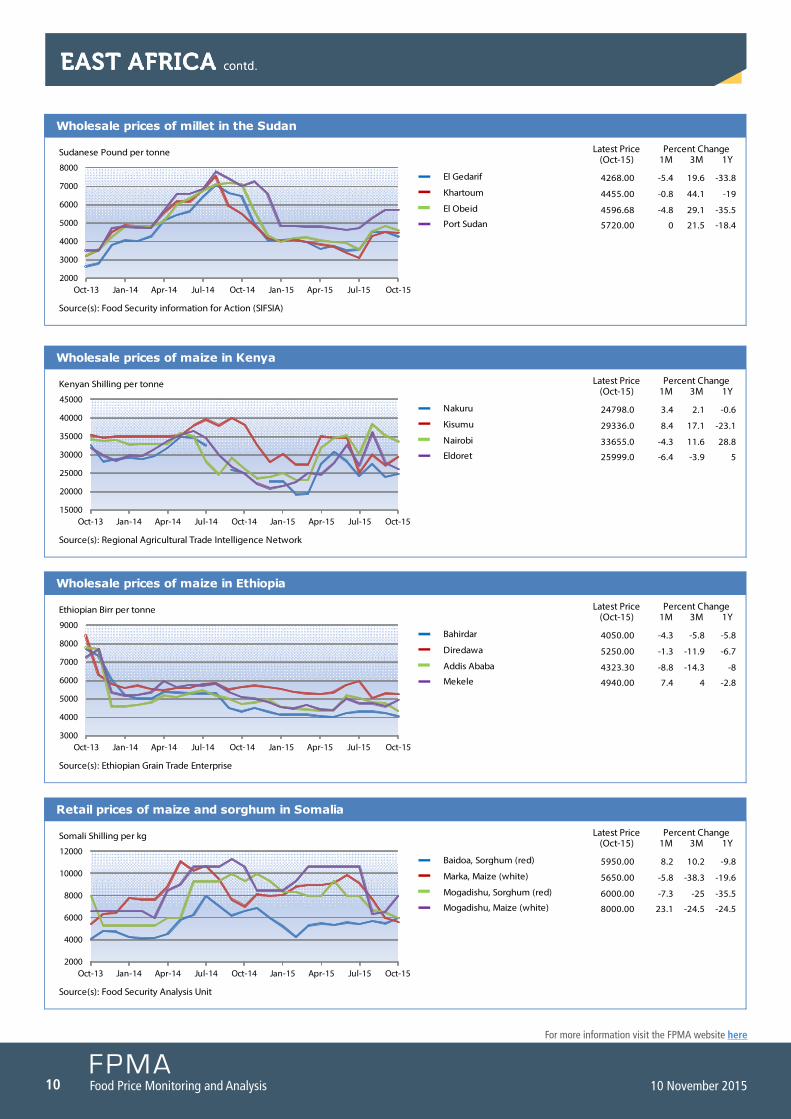
Prices of locally-produced cereals followed mixed trends in october. Maize prices rose further or remained firm and at levels well above those of a year earlier in uganda and the united republic of tanzania due to sustained regional demand and reduced harvests this year, while they declined elsewhere with the beginning of the 2015 main season harvests. In Uganda, maize prices continued to increase seasonally in october and were well above their levels a year earlier. the high prices mainly reflect strong regional demand from neighbouring countries. concerns about the outlook for the second season harvest, to be gathered from December, due to below-average rainfall over the past couple of months, provided additional support. Prices in october, however, rose at a slower rate than in September, as a result of a decline in export demand from Kenya, where harvesting is currently underway. In the United Republic of Tanzania, prices of maize remained relatively stable in october, following the release of grain from the national food reserve agency (nfra) which improved market supplies. However, prices were more than double their levels in october last year due to a reduced 2015 cereal production, coupled with sustained import demand from neighbouring countries in the past months. In the Sudan, prices of locally-produced sorghum and millet, the main staples, levelled off or declined in october after the increases of the
past few months, as recent rains slightly improved 2015 cereal crop prospects and traders released stocks ahead of the 2015 harvest in november. coarse grain prices in october were well below their year-earlier levels due to ample availabilities from last year’s bumper harvest. In the capital, Khartoum, prices of wheat, mostly imported and consumed in urban areas, rose in october but remained below the levels of the same month last year. In Kenya, maize prices continued to decline in october in several markets with the progress of the long-rains main season harvest in key-growing areas of the rift Valley and the release of stocks from the strategic grain reserve of the national cereals and Produce Board (ncPB) agency. Prices in october were at about the same levels as a year earlier or lower, except in the capital, nairobi, where they were about 30 percent higher due to sustained local demand. In Ethiopia, maize prices generally declined in october with the beginning of the 2015 meher main season harvest. Prices were below their year-earlier levels, despite the reduced 2015 belg secondary harvest completed in august, due to ample availabilities from the above-average 2014 cereal production. In Somalia, prices of locally-produced maize and sorghum showed mixed trends in october, but remained below their year-earlier in most markets due to the 2015 gu and gu off-season harvests, which continued to enter the markets in october.
Latest Price(Oct-15) 1M 3M 1Y
Wholesale prices of maize in the United Republic of Tanzania
Percent Change
200
300
400
500
600
700
800
900
Oct-13 Jan-14 Apr-14 Jul-14 Oct-14 Jan-15 Apr-15 Jul-15 Oct-15
Dar es Salaam
Iringa
Arusha
Tanzanian Shilling per kg
Source(s): Regional Agricultural Trade Intelligence Network
689.40
708.78
580.00
-0.8
1.9
4.8
30.5
47.7
na
122.2
162.9
53.3
Latest Price(Oct-15) 1M 3M 1Y
Wholesale prices of maize in Uganda
Percent Change
300
400
500
600
700
800
900
1000
Oct-13 Jan-14 Apr-14 Jul-14 Oct-14 Jan-15 Apr-15 Jul-15 Oct-15
Kampala
Lira
Busia
Uganda Shilling per kg
Source(s): Regional Agricultural Trade Intelligence Network
829.28
763.51
828.06
14.5
6.9
5.4
28.5
29.2
19.2
65
69.1
43.4
10 Food Price Monitoring and Analysis 10 November 2015
for more information visit the fPMa website here
easT afRICa contd.easT afRICa contd.
Latest Price(Oct-15) 1M 3M 1Y
Wholesale prices of millet in the Sudan
Percent Change
2000
3000
4000
5000
6000
7000
8000
Oct-13 Jan-14 Apr-14 Jul-14 Oct-14 Jan-15 Apr-15 Jul-15 Oct-15
El Gedarif
Khartoum
El Obeid
Port Sudan
Sudanese Pound per tonne
Source(s): Food Security information for Action (SIFSIA)
4268.00
4455.00
4596.68
5720.00
-5.4
-0.8
-4.8
0
19.6
44.1
29.1
21.5
-33.8
-19
-35.5
-18.4
Latest Price(Oct-15) 1M 3M 1Y
Wholesale prices of maize in Kenya
Percent Change
15000
20000
25000
30000
35000
40000
45000
Oct-13 Jan-14 Apr-14 Jul-14 Oct-14 Jan-15 Apr-15 Jul-15 Oct-15
Nakuru
Kisumu
Nairobi
Eldoret
Kenyan Shilling per tonne
Source(s): Regional Agricultural Trade Intelligence Network
24798.0
29336.0
33655.0
25999.0
3.4
8.4
-4.3
-6.4
2.1
17.1
11.6
-3.9
-0.6
-23.1
28.8
5
Latest Price(Oct-15) 1M 3M 1Y
Wholesale prices of maize in Ethiopia
Percent Change
3000
4000
5000
6000
7000
8000
9000
Oct-13 Jan-14 Apr-14 Jul-14 Oct-14 Jan-15 Apr-15 Jul-15 Oct-15
Bahirdar
Diredawa
Addis Ababa
Mekele
Ethiopian Birr per tonne
Source(s): Ethiopian Grain Trade Enterprise
4050.00
5250.00
4323.30
4940.00
-4.3
-1.3
-8.8
7.4
-5.8
-11.9
-14.3
4
-5.8
-6.7
-8
-2.8
Latest Price(Oct-15) 1M 3M 1Y
Retail prices of maize and sorghum in Somalia
Percent Change
2000
4000
6000
8000
10000
12000
Oct-13 Jan-14 Apr-14 Jul-14 Oct-14 Jan-15 Apr-15 Jul-15 Oct-15
Baidoa, Sorghum (red)
Marka, Maize (white)
Mogadishu, Sorghum (red)
Mogadishu, Maize (white)
Somali Shilling per kg
Source(s): Food Security Analysis Unit
5950.00
5650.00
6000.00
8000.00
8.2
-5.8
-7.3
23.1
10.2
-38.3
-25
-24.5
-9.8
-19.6
-35.5
-24.5

11Food Price Monitoring and Analysis
for more information visit the fPMa website here
10 November 2015
easT asIa
Domestic rice and wheat prices stable or slightly on the increase and mostly at low levels
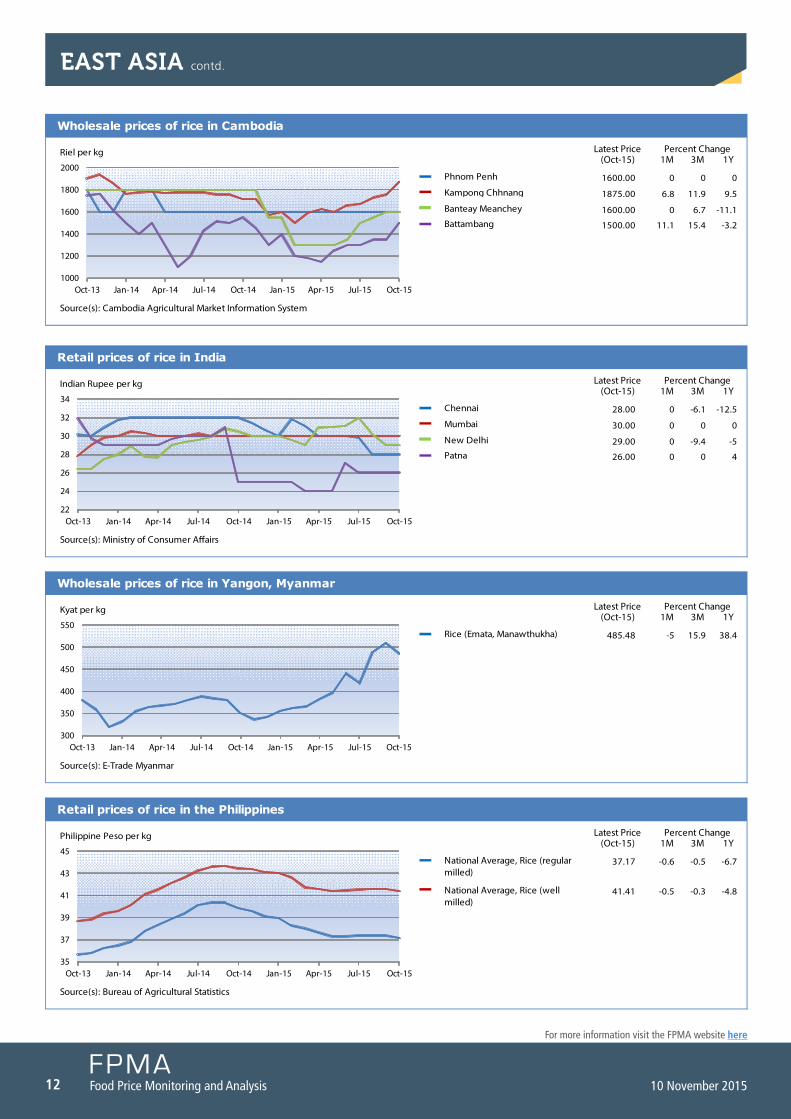
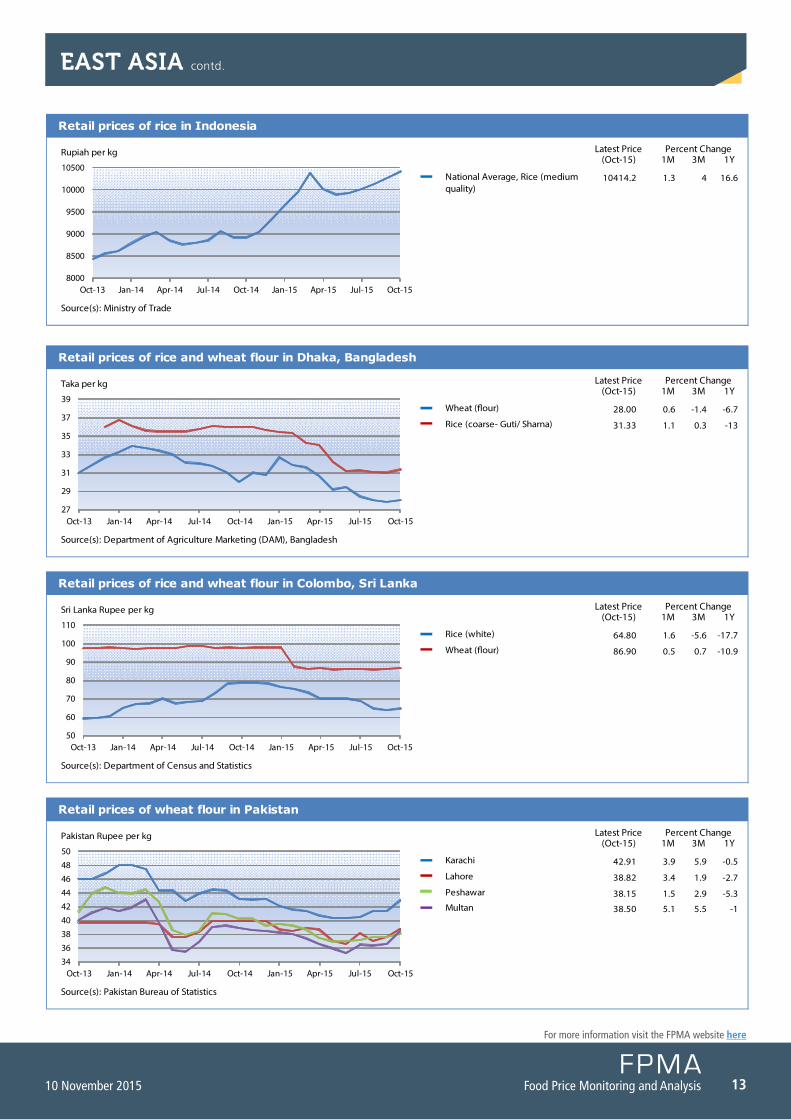
Domestic rice prices remained overall stable or increased in some countries in october and were in general below their year-earlier levels. concerns about weather-related 2015 main season crop losses, currently being harvested, limited seasonal declines or pushed up prices. In main exporters, Viet Nam and Thailand, anticipated and committed large purchases from key regional importers, namely Indonesia and the Philippines, provided further support. In Cambodia, rice prices remained stable or increased in some markets supported by export demand and an expected decrease in the 2015 main season output, following the prolonged dry weather in the first part of the season. In India, prices remained unchanged in most markets with the downward pressure from the ongoing 2015 main kharif season harvest offset by the recently-started government purchases at prices, 4 percent higher than in the previous season. By contrast, in Myanmar, rice prices declined after the sustained increase of the past few months, with the beginning of the 2015 main season harvest. Prices, however, remained well above their year-earlier levels, due to an anticipated reduction in the current season output following crop losses after severe floods in July and early august. In China, retail prices of Japonica rice were unchanged in october and slightly
higher than a year earlier. In the Philippines, rice quotations eased somewhat in recent weeks, with the progress of the 2015 main season harvest and large imported volumes in the previous months. However, downward price pressure was limited by the overall tight supply outlook in view of a reduction in this season’s output. rice prices increased further to record highs in Indonesia, reflecting reduced levels of stocks and lower 2015 off-season production. concerns over the slow planting progress of the 2016 main season crop, due to dry weather, associated with the El niño phenomenon, also provided support. Some strengthening in prices was reported in Bangladesh and Sri Lanka, although quotations remained well below their year-earlier levels, mainly reflecting adequate supplies from the 2015 good harvests. retail prices of wheat and wheat flour remained unchanged in most countries of the subregion. However, in Pakistan, wheat flour prices rose due to the increasing cost of locally-produced wheat. In Afghanistan, wheat grain quotations showed seasonal trends in october with stronger increases in areas more dependent on imports, reflecting a weak local currency. overall, however, prices were lower than a year earlier in most countries, mainly as a result of good availabilities from the 2015 harvests and adequate imports.
Latest Price(Oct-15) 1M 3M 1Y
Wholesale prices of rice in Viet Nam
Percent Change
6000
6500
7000
7500
8000
8500
9000
Oct-13 Jan-14 Apr-14 Jul-14 Oct-14 Jan-15 Apr-15 Jul-15 Oct-15
An Giang, Rice (25% broken)
An Giang, Rice (20% broken)
Dong Thap, Rice (20% broken)
Dong Thap, Rice (25% broken)
Dong per kg
Source(s): Agroinfo
6800.00
6700.00
7083.33
7000.00
1.5
0
4.2
3.7
3
0
3.4
3.7
-15.7
-20.8
-13.6
-11.4
Latest Price(Oct-15) 1M 3M 1Y
Wholesale prices of rice in Bangkok, Thailand
Percent Change
9
10
11
12
13
14
Oct-13 Jan-14 Apr-14 Jul-14 Oct-14 Jan-15 Apr-15 Jul-15 Oct-15
Rice (25% broken)
Rice (5% broken)
Baht per kg
Source(s): Department of Internal Trade, Ministry of Commerce
11.42
11.99
4.4
4.5
0.9
-0.9
-2.3
-4.4
12 Food Price Monitoring and Analysis 10 November 2015
for more information visit the fPMa website here
easT asIa contd.
Latest Price(Oct-15) 1M 3M 1Y
Wholesale prices of rice in Cambodia
Percent Change
1000
1200
1400
1600
1800
2000
Oct-13 Jan-14 Apr-14 Jul-14 Oct-14 Jan-15 Apr-15 Jul-15 Oct-15
Phnom Penh
Kampong Chhnang
Banteay Meanchey
Battambang
Riel per kg
Source(s): Cambodia Agricultural Market Information System
1600.00
1875.00
1600.00
1500.00
0
6.8
0
11.1
0
11.9
6.7
15.4
0
9.5
-11.1
-3.2
Latest Price(Oct-15) 1M 3M 1Y
Retail prices of rice in India
Percent Change
22
24
26
28
30
32
34
Oct-13 Jan-14 Apr-14 Jul-14 Oct-14 Jan-15 Apr-15 Jul-15 Oct-15
Chennai
Mumbai
New Delhi
Patna
Indian Rupee per kg
Source(s): Ministry of Consumer A�airs
28.00
30.00
29.00
26.00
0
0
0
0
-6.1
0
-9.4
0
-12.5
0
-5
4
Latest Price(Oct-15) 1M 3M 1Y
Wholesale prices of rice in Yangon, Myanmar
Percent Change
300
350
400
450
500
550
Oct-13 Jan-14 Apr-14 Jul-14 Oct-14 Jan-15 Apr-15 Jul-15 Oct-15
Rice (Emata, Manawthukha)
Kyat per kg
Source(s): E-Trade Myanmar
485.48 -5 15.9 38.4
Latest Price(Oct-15) 1M 3M 1Y
Retail prices of rice in the Philippines
Percent Change
35
37
39
41
43
45
Oct-13 Jan-14 Apr-14 Jul-14 Oct-14 Jan-15 Apr-15 Jul-15 Oct-15
National Average, Rice (regular milled)
National Average, Rice (well milled)
Philippine Peso per kg
Source(s): Bureau of Agricultural Statistics
37.17
41.41
-0.6
-0.5
-0.5
-0.3
-6.7
-4.8
13Food Price Monitoring and Analysis
for more information visit the fPMa website here
10 November 2015
easT asIa contd.
Latest Price(Oct-15) 1M 3M 1Y
Retail prices of rice in Indonesia
Percent Change
8000
8500
9000
9500
10000
10500
Oct-13 Jan-14 Apr-14 Jul-14 Oct-14 Jan-15 Apr-15 Jul-15 Oct-15
National Average, Rice (medium quality)
Rupiah per kg
Source(s): Ministry of Trade
10414.2 1.3 4 16.6
Latest Price(Oct-15) 1M 3M 1Y
Retail prices of rice and wheat flour in Dhaka, Bangladesh
Percent Change
27
29
31
33
35
37
39
Oct-13 Jan-14 Apr-14 Jul-14 Oct-14 Jan-15 Apr-15 Jul-15 Oct-15
Wheat (�our)
Rice (coarse- Guti/ Sharna)
Taka per kg
Source(s): Department of Agriculture Marketing (DAM), Bangladesh
28.00
31.33
0.6
1.1
-1.4
0.3
-6.7
-13
Latest Price(Oct-15) 1M 3M 1Y
Retail prices of rice and wheat flour in Colombo, Sri Lanka
Percent Change
50
60
70
80
90
100
110
Oct-13 Jan-14 Apr-14 Jul-14 Oct-14 Jan-15 Apr-15 Jul-15 Oct-15
Rice (white)
Wheat (�our)
Sri Lanka Rupee per kg
Source(s): Department of Census and Statistics
64.80
86.90
1.6
0.5
-5.6
0.7
-17.7
-10.9
Latest Price(Oct-15) 1M 3M 1Y
Retail prices of wheat flour in Pakistan
Percent Change
34
36
38
4042
44
46
48
50
Oct-13 Jan-14 Apr-14 Jul-14 Oct-14 Jan-15 Apr-15 Jul-15 Oct-15
Karachi
Lahore
Peshawar
Multan
Pakistan Rupee per kg
Source(s): Pakistan Bureau of Statistics
42.91
38.82
38.15
38.50
3.9
3.4
1.5
5.1
5.9
1.9
2.9
5.5
-0.5
-2.7
-5.3
-1
14 Food Price Monitoring and Analysis 10 November 2015
for more information visit the fPMa website here
CIs - asIa aND eUROPe
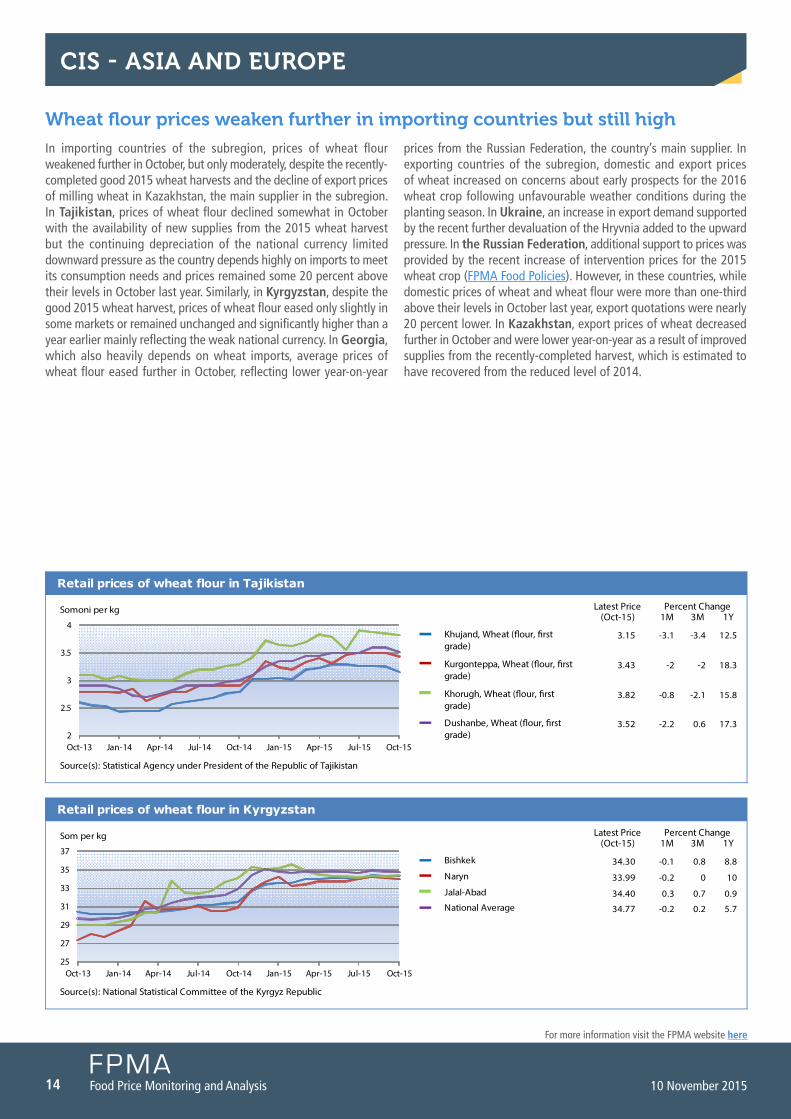
Wheat flour prices weaken further in importing countries but still high
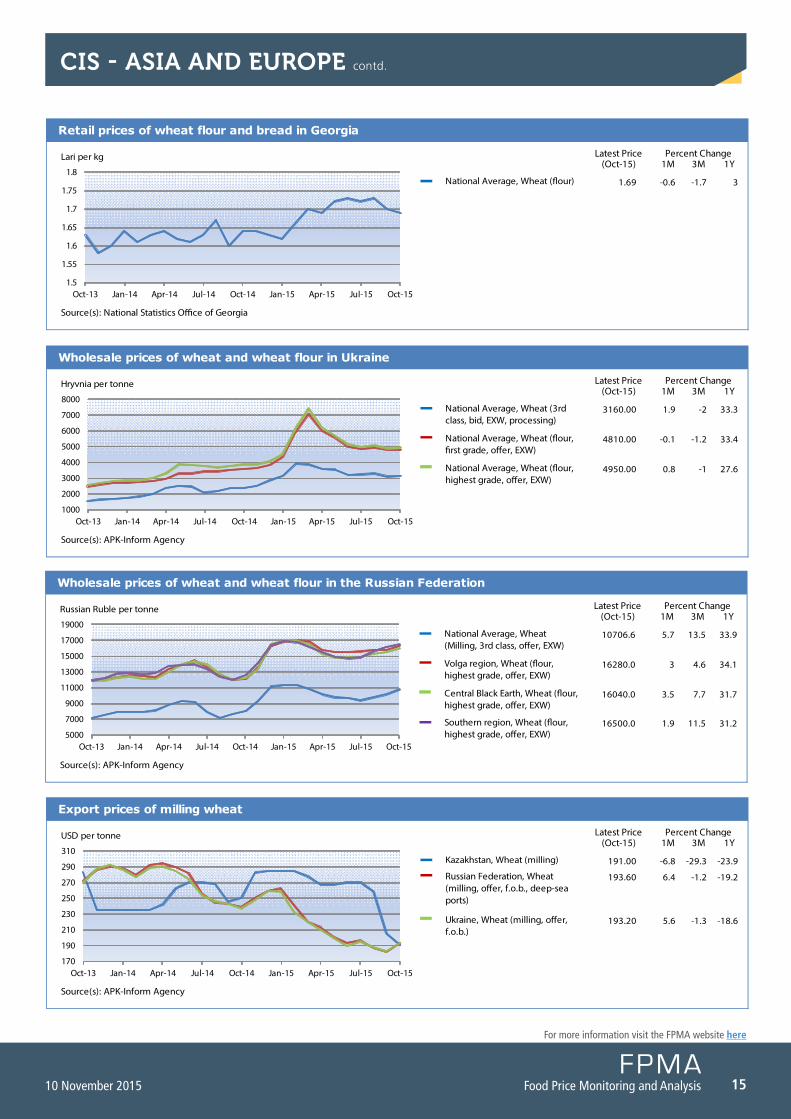
In importing countries of the subregion, prices of wheat flour weakened further in october, but only moderately, despite the recently-completed good 2015 wheat harvests and the decline of export prices of milling wheat in Kazakhstan, the main supplier in the subregion. In Tajikistan, prices of wheat flour declined somewhat in october with the availability of new supplies from the 2015 wheat harvest but the continuing depreciation of the national currency limited downward pressure as the country depends highly on imports to meet its consumption needs and prices remained some 20 percent above their levels in october last year. Similarly, in Kyrgyzstan, despite the good 2015 wheat harvest, prices of wheat flour eased only slightly in some markets or remained unchanged and significantly higher than a year earlier mainly reflecting the weak national currency. In Georgia, which also heavily depends on wheat imports, average prices of wheat flour eased further in october, reflecting lower year-on-year
prices from the russian federation, the country’s main supplier. In exporting countries of the subregion, domestic and export prices of wheat increased on concerns about early prospects for the 2016 wheat crop following unfavourable weather conditions during the planting season. In Ukraine, an increase in export demand supported by the recent further devaluation of the Hryvnia added to the upward pressure. In the Russian Federation, additional support to prices was provided by the recent increase of intervention prices for the 2015 wheat crop (fPMa food Policies). However, in these countries, while domestic prices of wheat and wheat flour were more than one-third above their levels in october last year, export quotations were nearly 20 percent lower. In Kazakhstan, export prices of wheat decreased further in october and were lower year-on-year as a result of improved supplies from the recently-completed harvest, which is estimated to have recovered from the reduced level of 2014.
Latest Price(Oct-15) 1M 3M 1Y
Retail prices of wheat flour in Kyrgyzstan
Percent Change
25
27
29
31
33
35
37
Oct-13 Jan-14 Apr-14 Jul-14 Oct-14 Jan-15 Apr-15 Jul-15 Oct-15
Bishkek
Naryn
Jalal-Abad
National Average
Som per kg
Source(s): National Statistical Committee of the Kyrgyz Republic
34.30
33.99
34.40
34.77
-0.1
-0.2
0.3
-0.2
0.8
0
0.7
0.2
8.8
10
0.9
5.7
Latest Price(Oct-15) 1M 3M 1Y
Retail prices of wheat flour in Tajikistan
Percent Change
2
2.5
3
3.5
4
Oct-13 Jan-14 Apr-14 Jul-14 Oct-14 Jan-15 Apr-15 Jul-15 Oct-15
Khujand, Wheat (�our, �rst grade)
Kurgonteppa, Wheat (�our, �rst grade)
Khorugh, Wheat (�our, �rst grade)
Dushanbe, Wheat (�our, �rst grade)
Somoni per kg
Source(s): Statistical Agency under President of the Republic of Tajikistan
3.15
3.43
3.82
3.52
-3.1
-2
-0.8
-2.2
-3.4
-2
-2.1
0.6
12.5
18.3
15.8
17.3
15Food Price Monitoring and Analysis
for more information visit the fPMa website here
10 November 2015
CIs - asIa aND eUROPe contd.
Latest Price(Oct-15) 1M 3M 1Y
Wholesale prices of wheat and wheat flour in the Russian Federation
Percent Change
5000
7000
9000
11000
13000
15000
17000
19000
Oct-13 Jan-14 Apr-14 Jul-14 Oct-14 Jan-15 Apr-15 Jul-15 Oct-15
National Average, Wheat (Milling, 3rd class, o�er, EXW)
Volga region, Wheat (�our, highest grade, o�er, EXW)
Central Black Earth, Wheat (�our, highest grade, o�er, EXW)
Southern region, Wheat (�our, highest grade, o�er, EXW)
Russian Ruble per tonne
Source(s): APK-Inform Agency
10706.6
16280.0
16040.0
16500.0
5.7
3
3.5
1.9
13.5
4.6
7.7
11.5
33.9
34.1
31.7
31.2
Latest Price(Oct-15) 1M 3M 1Y
Export prices of milling wheat
Percent Change
170
190
210
230
250
270
290
310
Oct-13 Jan-14 Apr-14 Jul-14 Oct-14 Jan-15 Apr-15 Jul-15 Oct-15
Kazakhstan, Wheat (milling)
Russian Federation, Wheat (milling, o�er, f.o.b., deep-sea ports)
Ukraine, Wheat (milling, o�er, f.o.b.)
USD per tonne
Source(s): APK-Inform Agency
191.00
193.60
193.20
-6.8
6.4
5.6
-29.3
-1.2
-1.3
-23.9
-19.2
-18.6
Latest Price(Oct-15) 1M 3M 1Y
Wholesale prices of wheat and wheat flour in Ukraine
Percent Change
1000
2000
3000
4000
5000
6000
7000
8000
Oct-13 Jan-14 Apr-14 Jul-14 Oct-14 Jan-15 Apr-15 Jul-15 Oct-15
National Average, Wheat (3rd class, bid, EXW, processing)
National Average, Wheat (�our, �rst grade, o�er, EXW)
National Average, Wheat (�our, highest grade, o�er, EXW)
Hryvnia per tonne
Source(s): APK-Inform Agency
3160.00
4810.00
4950.00
1.9
-0.1
0.8
-2
-1.2
-1
33.3
33.4
27.6
Latest Price(Oct-15) 1M 3M 1Y
Retail prices of wheat flour and bread in Georgia
Percent Change
1.5
1.55
1.6
1.65
1.7
1.75
1.8
Oct-13 Jan-14 Apr-14 Jul-14 Oct-14 Jan-15 Apr-15 Jul-15 Oct-15
National Average, Wheat (�our)
Lari per kg
Source(s): National Statistics O�ce of Georgia
1.69 -0.6 -1.7 3
16 Food Price Monitoring and Analysis 10 November 2015
for more information visit the fPMa website here
CeNTRaL ameRICa aND THe CaRIbbeaN
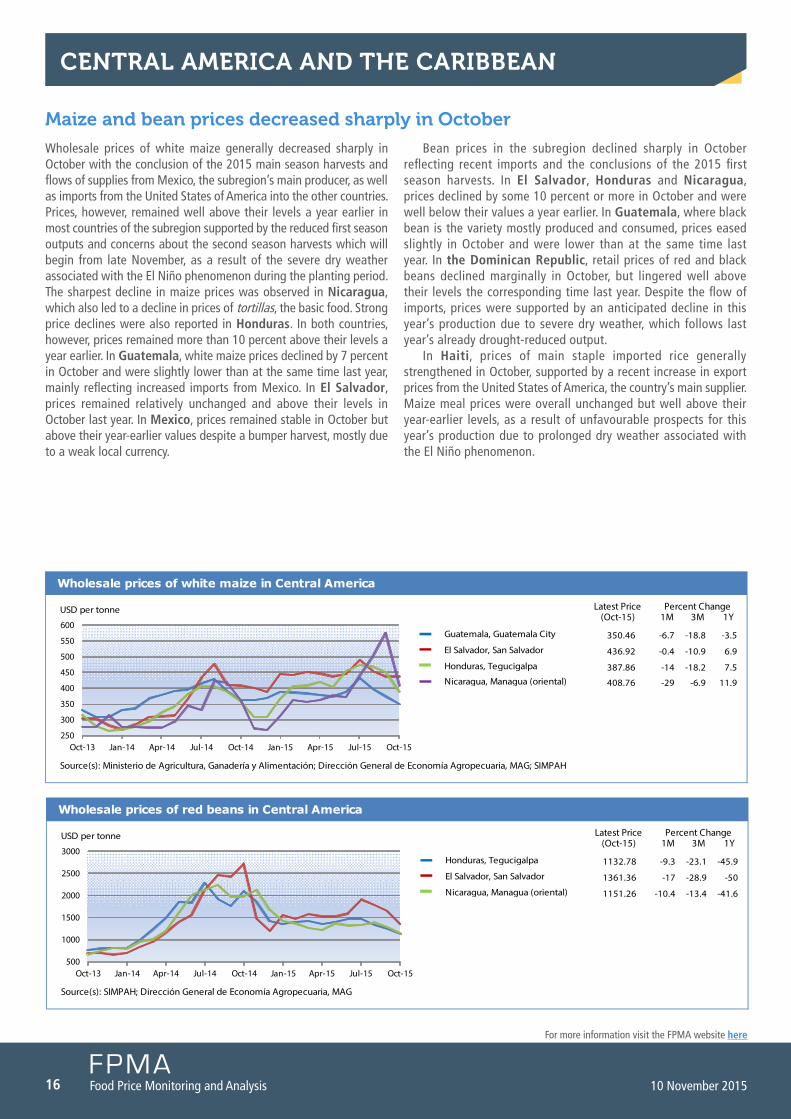
maize and bean prices decreased sharply in October
Wholesale prices of white maize generally decreased sharply in october with the conclusion of the 2015 main season harvests and flows of supplies from Mexico, the subregion’s main producer, as well as imports from the united States of america into the other countries. Prices, however, remained well above their levels a year earlier in most countries of the subregion supported by the reduced first season outputs and concerns about the second season harvests which will begin from late november, as a result of the severe dry weather associated with the El niño phenomenon during the planting period. the sharpest decline in maize prices was observed in Nicaragua, which also led to a decline in prices of tortillas, the basic food. Strong price declines were also reported in Honduras. In both countries, however, prices remained more than 10 percent above their levels a year earlier. In Guatemala, white maize prices declined by 7 percent in october and were slightly lower than at the same time last year, mainly reflecting increased imports from Mexico. In El Salvador, prices remained relatively unchanged and above their levels in october last year. In Mexico, prices remained stable in october but above their year-earlier values despite a bumper harvest, mostly due to a weak local currency.
Bean prices in the subregion declined sharply in october reflecting recent imports and the conclusions of the 2015 first season harvests. In El Salvador, Honduras and Nicaragua, prices declined by some 10 percent or more in october and were well below their values a year earlier. In Guatemala, where black bean is the variety mostly produced and consumed, prices eased slightly in october and were lower than at the same time last year. In the Dominican Republic, retail prices of red and black beans declined marginally in october, but lingered well above their levels the corresponding time last year. Despite the flow of imports, prices were supported by an anticipated decline in this year’s production due to severe dry weather, which follows last year’s already drought-reduced output.
In Haiti, prices of main staple imported rice generally strengthened in october, supported by a recent increase in export prices from the united States of america, the country’s main supplier. Maize meal prices were overall unchanged but well above their year-earlier levels, as a result of unfavourable prospects for this year’s production due to prolonged dry weather associated with the El niño phenomenon.
Latest Price(Oct-15) 1M 3M 1Y
Wholesale prices of white maize in Central America
Percent Change
250
300
350
400
450
500
550
600
Oct-13 Jan-14 Apr-14 Jul-14 Oct-14 Jan-15 Apr-15 Jul-15 Oct-15
Guatemala, Guatemala City
El Salvador, San Salvador
Honduras, Tegucigalpa
Nicaragua, Managua (oriental)
USD per tonne
Source(s): Ministerio de Agricultura, Ganadería y Alimentación; Dirección General de Economía Agropecuaria, MAG; SIMPAH
350.46
436.92
387.86
408.76
-6.7
-0.4
-14
-29
-18.8
-10.9
-18.2
-6.9
-3.5
6.9
7.5
11.9
Latest Price(Oct-15) 1M 3M 1Y
Wholesale prices of red beans in Central America
Percent Change
500
1000
1500
2000
2500
3000
Oct-13 Jan-14 Apr-14 Jul-14 Oct-14 Jan-15 Apr-15 Jul-15 Oct-15
Honduras, Tegucigalpa
El Salvador, San Salvador
Nicaragua, Managua (oriental)
USD per tonne
Source(s): SIMPAH; Dirección General de Economía Agropecuaria, MAG
1132.78
1361.36
1151.26
-9.3
-17
-10.4
-23.1
-28.9
-13.4
-45.9
-50
-41.6

17Food Price Monitoring and Analysis
for more information visit the fPMa website here
10 November 2015
sOUTH ameRICa
Wheat flour followed mixed trends in October, those of yellow maize generally on the increase
Domestic prices of wheat and wheat flour followed mixed trends in october but remained, in general, below or around their year-earlier levels reflecting adequate availabilities from last year’s good harvests. In Argentina and Chile, prices continued to seasonally increase in october and weak local currencies provided further support. However, supplies from last year’s good outputs contributed to keep prices unchanged from a year earlier. In Bolivia, Brazil, Peru and Uruguay, prices of wheat flour declined in october and were below their year-earlier levels. ample carryover stocks, adequate levels of imports and relatively good prospects for the upcoming 2015 harvests contributed to the price declines. In Colombia, the weak local currency, despite a recent strengthening, continued to support prices despite the flow of imports. In Ecuador, wheat flour prices in october remained relatively unchanged from their level of the previous month and a year earlier reflecting adequate imports.
Yellow maize prices increased in most countries of the subregion in october. In Argentina and Brazil, prices increased sharply and were well above their year-earlier levels despite bumper harvests this year and adequate carryover stocks. Prices were underpinned by a strong depreciation of the local currencies coupled with a robust export demand. In Bolivia, prices increased in the main market of Santa cruz, but remained well below their levels in october last year as a result of good supplies from the 2015 harvest and adequate import levels. Prices strengthened also in Ecuador and Chile, while they declined in Peru. overall, prices of yellow maize remained below their levels in october last year, with the exception of Colombia, which heavily depends on imports to satisfy its consumption requirements, due to the depreciation of the national currency.
Latest Price(Oct-15) 1M 3M 1Y
Wholesale prices of wheat and wheat flour in South America
Percent Change
0
200
400
600
800
1000
1200
Oct-13 Jan-14 Apr-14 Jul-14 Oct-14 Jan-15 Apr-15 Jul-15 Oct-15
Brazil, São Paulo
Bolivia, Santa Cruz
Uruguay, National Average
Argentina, Buenos Aires
USD per tonne
Source(s): Instituto de Economia Agrícola; Servicio de Información y Análisis de Mercados Agropecuarios, Bolivia; Unidad Centralizada de Adquisiciones - Ministerio de Economia y �nanzas; Bolsa de Cereales
460.00
464.86
590.00
136.58
-4.2
2.2
-13.2
4.3
-21.8
-4.3
-9.2
11.1
-42
-17.3
-20.3
-10.4
Latest Price(Oct-15) 1M 3M 1Y
Wholesale prices of yellow maize in South America
Percent Change
0
100
200
300
400
500
600
Oct-13 Jan-14 Apr-14 Jul-14 Oct-14 Jan-15 Apr-15 Jul-15 Oct-15
Ecuador, Quito
Brazil, São Paulo
Argentina, Rosario
Peru, Lima
USD per tonne
Source(s): Sistema de Información Nacional de Agricultura, Ganadería, Acuacultura y Pesca - SINAGAP; Agrolink; Bolsa de Cereales; Ministerio de Agricultura y Riego
380.00
125.52
119.55
350.00
0
12.2
18.6
-5.4
2.7
5.9
17.4
-7.9
0
-12.7
4.4
-22.2
This bulletin is prepared by the Food Price Monitoring and Analysis (FPMA) Team in the Trade and Markets Division of FAO. It contains latest information and analysis on domestic prices of basic foods mainly in developing countries, complementing FAO analysis on international markets. It provides early warning on high food prices at country level that may negatively affect food security.
This report is based on information available up to early November 2015.
All the data used in the analysis can be found in the FPMA Tool at: www.fao.org/giews/pricetool
For more information visit the FPMA Website at: www.fao.org/giews/food-prices
Enquiries may be directed to:Food Price Monitoring and Analysis (FPMA)Trade and Markets Division (EST) Food and Agriculture Organization of the United Nations (FAO)Viale delle Terme di Caracalla00153 Rome, ItalyE-mail: [email protected]
Disclaimer The designations employed and the presentation of material in this information product do not imply the expression of any opinion whatsoever on the part of the Food and Agriculture Organization of the United Nations (FAO) concerning the legal or development status of any country, territory, city or area or of its authorities, or concerning the delimitation of its frontiers or boundaries. The mention of specific companies or products of manufacturers, whether or not these have been patented, does not imply that these have been endorsed or recommended by FAO in preference to others of a similar nature that are not mentioned.
The views expressed in this information product are those of the author(s) and do not necessarily reflect the views or policies of FAO.
© FAO, 2015
Food Price Monitoring and Analysis | 10 November 2015 BB170E/1/11.15