fourier transform gabor filters and some …soe.rutgers.edu/~meer/teachtoo/fourierplus-6.pdfmartial...
TRANSCRIPT

FOURIER TRANSFORM
GABOR FILTERS
and some textons

Thank you for the slides. They come mostly from the following sources
Martial Hebert CMU
Alexei Efros CMU

2
Image sub-sampling
Throw away every other row and
column to create a 1/2 size image
- called image sub-sampling
1/4
1/8
Slide by Steve Seitz
Image sub-sampling
1/4 (2x zoom) 1/8 (4x zoom)
Why does this look so crufty?
1/2
Slide by Steve Seitz

3
Even worse for synthetic images
Slide by Steve Seitz
Really bad in video
Slide by Paul Heckbert

4
Alias: n., an assumed name
Picket fence receding
Into the distance will
produce aliasing…
Input signal:
x = 0:.05:5; imagesc(sin((2.^x).*x))
Matlab output:
WHY?
Aj-aj-aj:
Alias!
Not enough samples
Aliasing• occurs when your sampling rate is not high enough to
capture the amount of detail in your image
• Can give you the wrong signal/image—an alias
Where can it happen in graphics?
• During image synthesis: • sampling continous singal into discrete signal
• e.g. ray tracing, line drawing, function plotting, etc.
• During image processing: • resampling discrete signal at a different rate
• e.g. Image warping, zooming in, zooming out, etc.
To do sampling right, need to understand the structure of your signal/image
Enter Monsieur Fourier…

10
Questions
• How do discrete images differ from continuous images?
• How do we avoid aliasing while sampling?
Sampling an image
Examples of GOOD sampling

11
Undersampling
Examples of BAD sampling -> Aliasing
Constructing a pyramid by
taking every second pixel
leads to layers that badly
misrepresent the top layer

6
Fourier Transform
We want to understand the frequency ω of our signal. So,
let’s reparametrize the signal by ω instead of x:
)+ φωxAsin(
f(x) F(ωωωω)Fourier
Transform
F(ωωωω) f(x)Inverse Fourier
Transform
For every ω from 0 to inf, F(ωωωω) holds the amplitude A
and phase φ of the corresponding sine • How can F hold both? Complex number trick!
)()()( ωωω iIRF +=22 )()( ωω IRA +±=
)(
)(tan 1
ω
ωφ
R
I−=
We can always go back:
Frequency Spectra
Usually, amplitude is more interesting than phase:

9
Extension to 2D
in Matlab, check out: imagesc(log(abs(fftshift(fft2(im)))));

10
This is the
magnitude
transform
of the
cheetah pic
This is the
phase
transform
of the
cheetah pic

11
This is the
magnitude
transform
of the zebra
pic
12
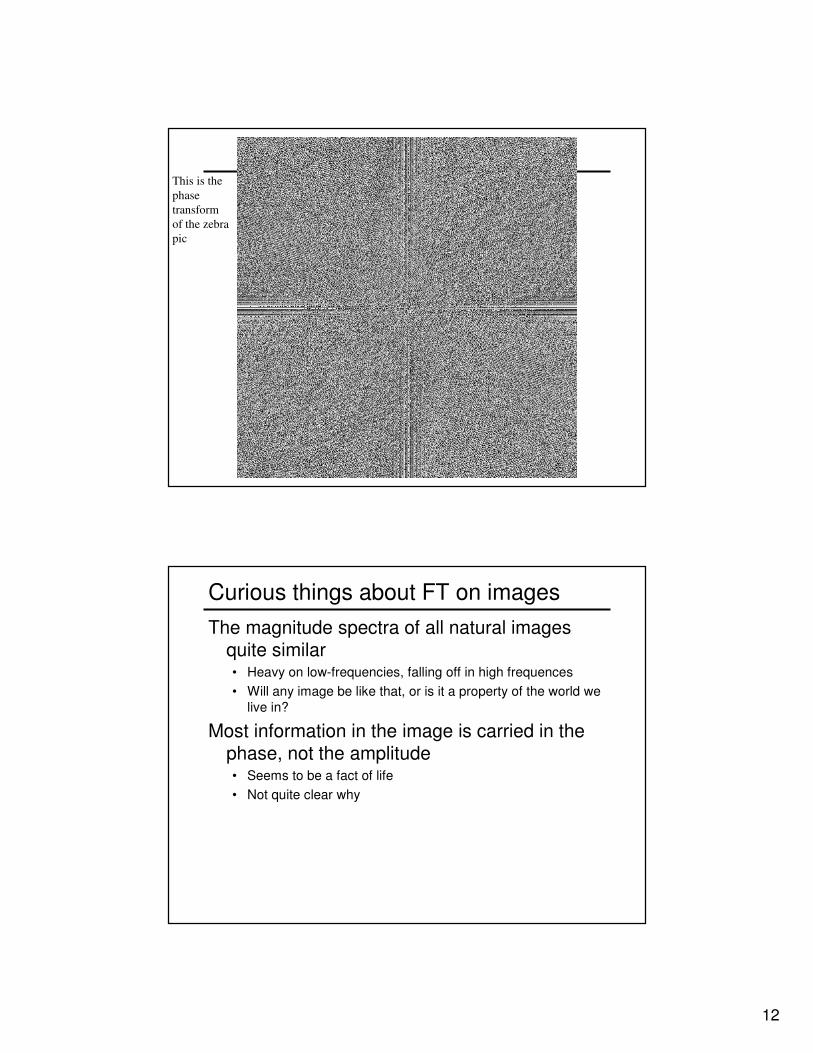
This is the
phase
transform
of the zebra
pic
Curious things about FT on images
The magnitude spectra of all natural images quite similar• Heavy on low-frequencies, falling off in high frequences
• Will any image be like that, or is it a property of the world we
live in?
Most information in the image is carried in the phase, not the amplitude• Seems to be a fact of life
• Not quite clear why

13
Reconstruction
with zebra
phase, cheetah
magnitude
Reconstruction
with cheetah
phase, zebra
magnitude
14
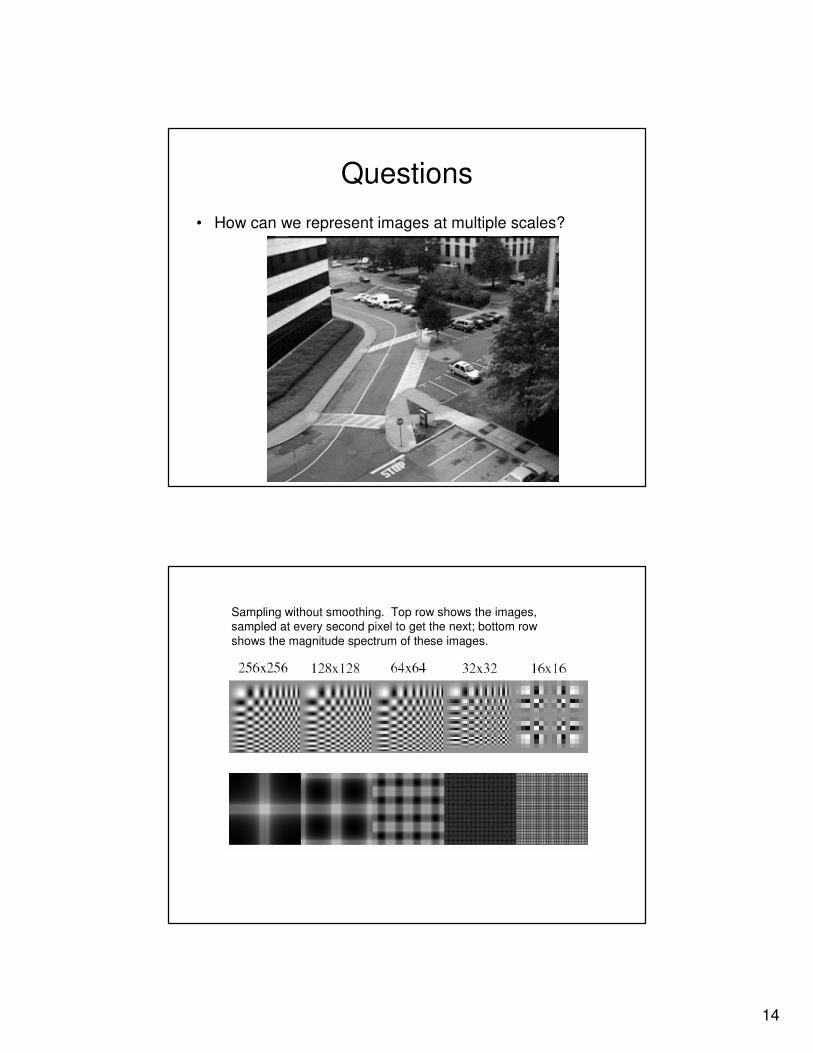
Questions
• How can we represent images at multiple scales?
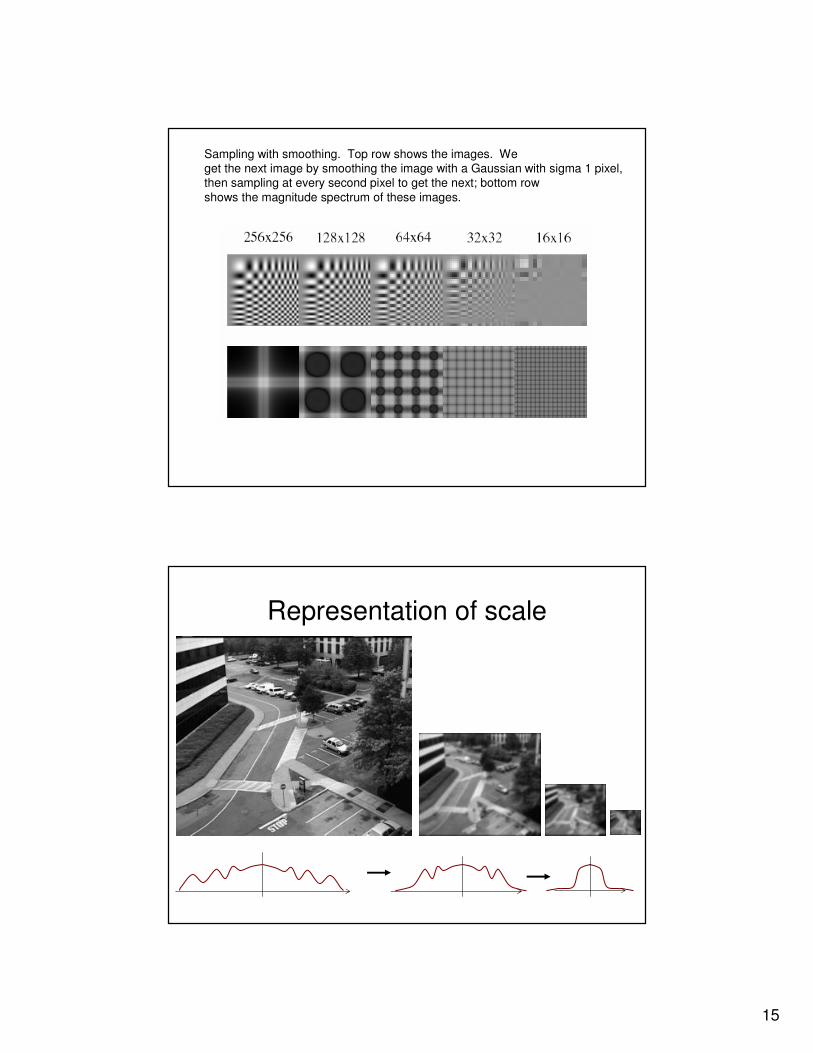
Sampling without smoothing. Top row shows the images,
sampled at every second pixel to get the next; bottom row
shows the magnitude spectrum of these images.
15
Sampling with smoothing. Top row shows the images. We
get the next image by smoothing the image with a Gaussian with sigma 1 pixel,
then sampling at every second pixel to get the next; bottom row
shows the magnitude spectrum of these images.
Representation of scale

16
Representation of scale
The Gaussian pyramid
• Smooth with gaussians, because
– a gaussian*gaussian=another gaussian
• Synthesis
– smooth and subsample
• Analysis
– Start with the top image (coarse) and move to lower (fine) image layers
Applications
• Search for correspondence
– look at coarse scales, then refine with finer scales
– Lowers computational cost
• Edge tracking
– a “good” edge at a fine scale has parents at a coarser scale

17
Laplacian Pyramids
• Given input I
• Construct Gaussian pyramid IG1,..,I
Gn
• Take the difference between consecutive levels:
• ILk = IL
k – ILk-1
• Image ILk is an approximation of the Laplacian at
scale number k
– Laplacian is a band-pass filter: Both high frequencies
(edges and noise) and low frequencies (slow
variations of intensity across the image)
Laplacian Pyramids

22
Odd Gabor filter
First Derivative
Even Gabor filter
Laplacian

28
Example: Texture Classification• Profound observation: Cows and buildings don’t look the
same!
• Basic idea: Model the distribution of “texture” over the image (or over a region) and classify in different classes based on the texture models learned from training examples.
Cow Building
The Concept of “Texton”
Multiple
training images of the same
texture
Multiple training images
of the same
texture
Filter responses over
a bank of filters
Clustering Texton
Dictionary
29
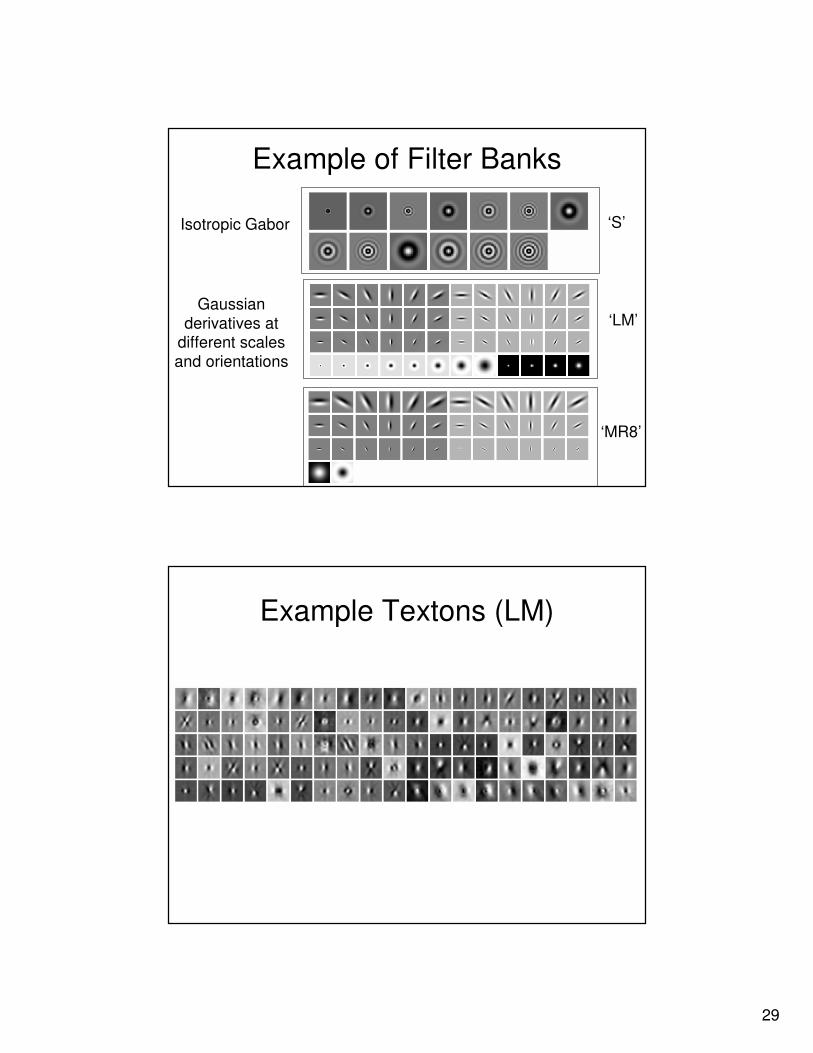
Example of Filter Banks
Isotropic Gabor
Gaussian
derivatives at different scales
and orientations
‘S’
‘LM’
‘MR8’
Example Textons (LM)

30
Example: Visual words in photographs
Images Word maps
Visual dictionary
Modeling Texton Distributions
Training
image
Filter
Responses
Texton
MapModel =
Histogram of textons
in the
image

32
Input Image
(or Region of
an Input Image)
Model
Compare with
Stored Models
from Training
Images
Models of Plastic
Models of Grass
Classification
Example Classification
Input
Region
Textons
M. Varma and A. Zisserman.Texture classification: Are filter banks necessary? In Proceedings of the IEEE Conference on Computer Vision and Pattern Recognition, volume 2, pages 691–698, Madison, Wisconsin, June 2003.
In the reading list.
The original, e.g. Brodatz, CURet textures are relative simple.For example, the CUReT database was better when done with just raw intensities of an NxN (3,5,7) neighbourhood.
So the textons may only have limited applications…