founder personality and start-up subsidies
TRANSCRIPT

Founder Personality and Start-up Subsidies
Gary Chapman1 and Hanna Hottenrott2,3
1Leicester Castle Business School, United Kingdom
2TUM School of Management, Technical University of Munich, Germany
3Centre for European Economic Research (ZEW), Germany
April 2021
Abstract
This study investigates the role of founders’ personality, as captured by the dimensions of the
‘Big 5’ traits and entrepreneurial orientation, in their start-up’s access to and use of public
subsidies. We document a limited role for the Big 5 personality traits but find a more significant
role for founders’ entrepreneurial orientation, even after controlling for observable founder and
firm characteristics and the selection decision to initially seek external financing. We also
document that founder personality influences the type (grants or loans) of subsidies that start-
ups seek and obtain. When comparing public subsidies to private sources of early-stage finance
(banks, venture capital, family and friends), we find a larger role for founders’ baseline
personality in private sources of financing and the role of founders’ entrepreneurial orientation
to vary depending on the source. Finally, when disentangling application and allocation, we
find little role for personality in explaining rejection, thus, suggesting that personality is more
important in explaining start-ups’ self-selection into subsidies, rather than policymaker award
choices. We discuss implications for research evaluating the effectiveness of subsidy programs
as well as for policymaking.
Keywords: Start-up subsidies, start-up financing, entrepreneurship policy, entrepreneurial
orientation, Big 5 personality traits, venture capital
JEL codes: G24, L26, O25, O31
Author contact details: [email protected], De Montfort University, Leicester Castle Business School,
Department of Management and Entrepreneurship, Leicester, LE2 7BY, UK. [email protected], TU Munich, School of Management, Department of Economics
& Policy, Arcisstraße 21, 80333 Munich, Germany.
Acknowledgements: We thank ZEW for access to the data and Sandra Gottschalk, Qilin Hu
Mathew Hughes, Shukhrat Nasirov, Magnus Strobel and Benedikt Schnurr for valuable feedback
and comments.
2
1. Motivation and Introduction
Start-ups can play an important role in innovation, job creation, and economic growth, and in
turn, generate significant societal benefits (Wennekers and Thurik, 1999; van Praag and
Versloot, 2007; Haltiwanger et al. 2013). Starting-up and growing a new venture is costly, and
thus, start-up success depends critically on access to finance (Cassar, 2004; Vaznyte and
Andries, 2019, Caggese, 2019). Yet, start-ups are often financially constrained due to limited
internal resources and impediments to accessing external finance, which hinders their success
(Ostgaard and Birley, 1994). Recognising the societal benefits of start-ups, governments have
implemented a plethora of subsidy programmes that aim to alleviate the financial constraints
inhibiting start-ups in recent years (Mina et al., 2021). While start-up subsidies have received
relatively little attention (see Audretsch et al., 2020), the few existing studies largely confirm
their importance as a tool to alleviate financial constraints and enhance performance (e.g.,
Colombo et al. 2011, 2012; Söderblom et al 2015; Conti, 2018; Buffart et al., 2020; Zhao and
Ziedonis, 2020; Hottenrott and Richstein, 2020). Moreover, as recent work raises concerns
about the effectiveness of alternative interventions such as angel investors tax credits (Denes et
al., 2020), the importance of subsidies as a tool for driving start-up performance has heightened.
This potential for alleviating financial constraints and supporting young firms’ development
begs the important question of what characteristics can help and hinder founders’ access to or
willingness to make use of subsidies.
The literature studying young firms’ access to finance has documented the role of
observable founder characteristics, in particular experience and firm characteristics, such as
innovative activities, in start-ups’ ability to access sources of finance in the form of venture
capital and bank loans (Colombo and Grilli, 2007; Haeussler et al., 2014; Bruneel et al., 2020;
Caliendo et al., 2020). Emerging, but still scant, work also documents their role in start-up
subsidies (Canter and Kosters, 2012; Chapman and Hewitt-Dundas, 2018; Hottenrott and

3
Richstein, 2020; Mina et al., 2021). A largely omitted variable in this literature, however, has
been the role of founder personality. Personality reflects an individual’s habitual and enduring
patterns of cognition (e.g., attitudes and motivation) and behaviour, and thus, reflects their
general orientation toward particular decisions and actions (Winter et al., 1998; Brandstätter,
2011). Personality also signals qualities about an individual to others that can influence their
decision-making and behaviour toward the individual (Pianesi et al, 2008). Start-up research
has mainly leveraged the concept to examine whether and how founders differ from managers
and the performance consequences (e.g., Rauch and Frese, 2007; Zhao et al, 2010). Their role
in start-ups’ access to finance remains largely unknown, however (Bernardino and Santos,
2016; Vaznyte and Andries, 2019); and to the best of our knowledge, no studies have examined
the role of founder personality in start-up subsidies. This omission is striking given the critical
role of access to early-stage finance and subsidies for start-up survival and subsequent
performance (e.g., Howell, 2017; Conti, 2018).
In response to this research gap, this paper investigates whether and how founder
personality matters in their start-ups’ use of and access to subsidies. We suggest that personality
influences founders’ incentives to seek subsidies by shaping their ideation processes and goals
(Vaznyte and Andries, 2019), and may influence their likelihood to obtain subsidies (once
applied) as policymakers (and other lenders) may view certain personalities as more or less
desirable (e.g., policymakers may seek more innovative or creative candidates) in their funding
decisions. In the context of new firm founders, it is important to capture both an individuals’
general personality and their propensity to be entrepreneurial (Wales et al., 2020). To this end,
we first draw on the social psychology literature to capture the general personality of an
individual. We focus on the five-factor model (Big5) as this is the most dominant configuration
of general personality (McCrae and John, 1992) and has been shown to effectively capture

4
baseline personality (Saucier and Goldberg, 1998; Hurtz and Donovan, 2000)1. Next, we focus
on the concept of entrepreneurial orientation to capture founders’ propensity to be
entrepreneurially. While traditionally conceptualised as a firm-level phenomenon, recent work
has extended entrepreneurial orientation to the individual-level (Covin et al., 2020; Krueger
and Sussan, 2017; Hughes and Morgan, 2007). Founders’ entrepreneurial orientation has been
shown to effectively represent predispositions toward innovative and entrepreneurial decision-
making and behaviour (Covin, 1991; Covin and Slevin, 1988; Anderson et al., 2015; Lumpkin
and Dess, 1996; Krueger and Sussan, 2017; Wales et al., 2020). As personality and
entrepreneurial orientation both focus on enduring patterns in cognition and behaviour (Covin
and Lumpkin, 2011; Wales et al., 2020), we capture founders’ entrepreneurial personality using
the entrepreneurial orientation construct. Considerable evidence supports the role of founder
‘Big 5’ and entrepreneurial orientation in shaping start-up decision-making and performance
(e.g., Rosenbusch et al., 2013; Zhao et al., 2010), and thus, it is crucial to investigate how these
personalities matter in start-ups access to subsidies.
While start-up subsidies have largely been considered as grant-based, an increasingly
popular approach is to provide start-up support through subsidized loans (Hottenrott and
Richstein, 2020; Zhao and Ziedonis, 2020). As founders and funders may prefer grants or loans
depending on the founders' personality (Vaznyte and Andries, 2019), we explicitly differentiate
between grants and loans to examine how founder personality may differently impact each.
Moreover, as understanding of founder personality in the broader access to early-stage finance
literature is limited, we conduct additional analyses to compare the importance of founder
1 We use the terms ‘Big Five’ and ‘Five Factor Model’ interchangeably throughout the paper. While the
models were developed independently and differ in their underlying assumptions, both models use the same
factor labels and are highly consistent, confirming their interchangeability and generalizability (Matz et al., 2016).

5
personality in important private sources (i.e., venture capital, non-subsidized bank loans and
family & friends) of start-up finance to public subsidies. This enables a more general
understanding of the importance of personality in start-up access to early-stage finance and
enables us to better understand the reliability of our measures. Finally, in our main analysis, as
with most studies, we cannot distinguish between firms’ self-selection into a programme, and
those that applied but were rejected (Dimos and Pugh, 2016). This limits our understanding as
to where in the process personality matters. To shed some light on this, we exploit a portion of
our data that provides additional information on start-ups being rejected to distinguish between
the role of founders’ personality in the two stages.
We examine access to subsidies for a large sample of start-ups founded in Germany
between 2007 and 2017 in manufacturing and service sectors. We find a limited role for
founder’s ‘Big 5’ baseline personality traits in explaining start-up subsidies, but a more
significant role for founder’s entrepreneurial orientation, even after controlling for observable
founder and firm characteristics. Thus, our results suggest that founders’ entrepreneurial
personality shapes their start-ups’ participation in subsidy programmes. Moreover, we find that
founder personality influences the type (grants or loans) of subsidies that start-ups seek and
obtain. More competitive founders are more likely to have obtained subsidized loans whereas
more innovative founders obtain grants. This suggests that different policy instruments serve
diverse needs (Giraudo et al. 2019) by targeting different entrepreneurs. Our results further
suggest that founder personality also matters for private sources of early-stage finance, with
founder ‘Big 5’ mattering more for private sources than public subsidies, and founder
entrepreneurial personality varying across the private sources. When disentangling self and
policymaker selection, we find little role for personality in explaining rejection. This suggests
that much of the role of personality is in influencing start-ups self-selection into subsidies,
rather than policymaker’s award choices.

6
Our results advance a more comprehensive understanding of founders’ access to early-
stage finance by providing novel empirical evidence on the role that founder baseline and
entrepreneurial personality play in affecting start-ups’ use of subsidies and other important
sources of early-stage finance.
The remainder of this article proceeds as follows. Section 2 discusses the characteristics
helping and hindering firms access to subsidies, and sections 2.1 and 2.2 introduce our
conceptualizations of founder personality and their role in start-ups’ access to and use of
subsidies. Section 3 discusses the data and empirical approach, section 4 discusses the empirical
results, and section 5 discusses the contributions and implications of our work for policymakers,
academics, and start-ups.
2. Start-up Subsidies
As (start-up) subsidies can alleviate firms’ financing constraints and enhance their performance
(Colombo et al. 2011; Söderblom et al. 2016; Howell, 2017; Conti, 2018; Buffart et al., 2020;
Hottenrott and Richstein, 2020), a growing literature has investigated what characteristics help
and hinder start-ups’ and other firms’ access to and use of subsidies. Studying these
characteristics is important to understand who is likely to gain access to subsidies, the existence
of potential barriers to accessing subsidies and the implicit or explicit selection criteria of
policymakers (Blanes and Busom, 2004). These have important implications for guiding start-
ups on their likelihood of being able to utilise subsidies to alleviate financing constraints, and
for policymakers, on who is acquiring their support and whether, potentially attractive
candidates are missing out; thus, reducing the effectiveness of their programme. Moreover, as
most studies examining the efficacy of subsidy programmes rely on research designs that
require an extensive understanding of the characteristics predicting participation in subsidies

7
(Blanes and Busom, 2004; Dimos and Pugh, 2016), studying these characteristics is key to
enabling robust identification of the effectiveness of subsidy programmes and thus, guiding
future policymaking.
Most of this work has focused on general subsidy programmes, rather than in the context
of start-ups. Consequently, most research has been upon the role of observable firm
characteristics (e.g., Busom and Blanes, 2004; Colombo et al., 2007; Santamaria et al., 2010;
Hottenrott and Lopes-Bento, 2014, Hottenrott et al., 2017; Chapman et al., 2018). Antonelli
and Crespi (2013) found that prior subsidies, age, size and human capital increased firms’
probability of accessing subsidies in Italy, while firm credit rating and exporting did not matter.
Busom et al (2014) found that financing constraints, human capital and performing R&D
increased the likelihood of accessing subsidies in Spain, while intellectual property protection
and exporting did not matter. Mina et al (2021) found that firm size, age, profit and sales
affected small and medium-sized firms’ (SMEs) probability of seeking E.U. subsidies, while
patents and venture capital were important in the subsidy award decisions. These studies
generally suggest that firm characteristics, particularly, human capital and R&D intensity, play
an important role in the use of and access to subsidies.
Only a small number of studies have specifically examined start-up subsidies and these
equally demonstrate the importance of firm characteristics in the use of and access to subsidies
(e.g., Canter and Kösters, 2012; Conti, 2018; Chapman and Hewitt-Dundas, 2018; Hottenrott
and Richstein, 2020). Given the significant importance of founders to their start-up’s success,
decision-making and performance (Shane and Stuart, 2002; Dencker and Gruber, 2015), it is
not surprising that observable founder characteristics explain participation in subsidy
programmes. For instance, Rojas and Huergo (2016) show that start-ups with more experienced
and educated founders have greater access to other sources of finance, and thus, be less likely

8
to seek subsidies. While insightful, an omitted variable in this work – and the broader start-up
access to finance literature – has been the role of founders’ personality (Vaznyte and Andries,
2019). Although personality has been linked to the survival and success of start-ups
(Rosenbusch et al., 2013; Zhao et al., 2010), and thus, of significant interest to policymakers
and academics, personality has received very little attention so far. In this paper, we begin to
redress this knowledge gap by examining the role of founder personality in start-ups’ access to
and use of subsidies.
2.1. Personality and Entrepreneurial Behaviour
Personality reflects dimensions of difference between individuals by capturing their enduring
and overarching patterns of cognition and behaviour (Brandstätter, 2011; McCrae and Costa,
1997; Smith et al, 2018). Personality shapes individual preferences (e.g., how favourably they
view an action or decision), information search (e.g., where they search for information),
information processing (e.g., how they interpret and judge information, and their utilisation of
it in their decision-making) and behaviour, and thus reflects their general orientation toward
particular decisions and actions (Winter et al., 1998; Brandstätter, 2011). Personality shows a
high degree of stability across time and context (Roccas et al., 2002), and thus, reflects an
individual’s general orientation and propensity to respond and act in a particular way across
various situations (McCrae and Costa, 1997; Rauch and Frese, 2007). Each type captures
different dimensions of an individual’s personality, for instance, openness to experience
captures the extent to which individuals are imaginative, curious, and open to novel and
unconventional ideas, perspectives and experiences, as opposed to preferring convention and
familiarity (McCrae and Costa, 1997; George and Zhou, 2001).
We capture both an individuals’ general personality and their propensity to be
entrepreneurial by focusing on the Big-5 personality traits and founder entrepreneurial

9
orientation (McCrae and John, 1992; Wales et al., 2020). While each has been shown to shape
and influence start-up decision-making, survival and performance (e.g., Rauch and Frese, 2007;
Rauch et al., 2009; Zhao et al., 2010; de Jong et al, 2013; Rosenbusch et al., 2013; Kerr et al,
2017), their role in start-ups access to and use of subsidies remains unclear. Moreover, this two-
construct approach enables us to capture and distinguish both the influence of the baseline and
entrepreneurial personality of founders on their access to start-up subsidies and in turn, produce
more refined insights. The five-factor model consists of an individual’s openness to experience,
conscientiousness, extraversion, agreeableness and neuroticism (Hurtz and Donovan, 2000;
McCrae and John, 1992), while entrepreneurial orientation consists of founder’s
competitiveness, innovativeness, autonomy, proactiveness, and risk tolerance (Lumpkin and
Dess, 1996; Anderson et al., 2015; Wales et al., 2020). The two configurations are summarised
in Table 1.
Table 1: Description of the Five-Factor and Entrepreneurial Orientation
Description
Five-Factor (Big5) (e.g., McCrae and John, 1992; George and Zhou, 2001; Zhao and
Seibert, 2006)
Openness to experience Extent to which founders are imaginative, curious, and open to
novel and unconventional ideas, perspectives and experiences.
Conscientiousness Extent to which a founder is diligent, persistent and motivated.
Extraversion Extent to which a founder is assertive, active and enthusiastic.
Agreeableness Extent to which a founder is altruistic, caring and emotionally
supportive.
Neuroticism Extent to which a founder is emotionally stable (e.g., calm;
anxiety) and adjusts well.
Entrepreneurial Orientation (e.g., Lumpkin and Dess, 1996; Lumpkin et al., 2009; Pearce
et al., 2010; Putninš and Sauka, 2019; Covin et al., 2020)
Competitiveness Founder’s willingness to directly challenge and risk conflict with
competitors to grow and succeed.
Innovativeness Extent to which a founder engages in and supports novelty, new
ideas and experimentation.
Autonomy Extent to which a founder acts, decides and works independently
to bring forth their vision.
Proactiveness Extent to which a founder seeks and exploits new opportunities
and innovations to be ahead of competitors.
Risk tolerance Founder’s willingness to engage in risky behaviours and make
resource commitments with uncertain outcomes.

10
2.2. Personality and Start-Up Subsidies
Founder personality may impact start-ups’ access to and use of subsidies. Accessing start-up
subsidies is the result of a two-stage decision process. First, founders seek out opportunities for
start-up subsidies and decide whether or not to apply for a subsidy (i.e., self-selection). Second,
from the pool of start-ups that apply, policymakers decide whether or not to allocate subsidies
to each start-up (i.e., policymaker selection). As founder’s role differs in both decisions, their
personality may influence both decisions differently. Thus, while our main focus is on the
overall role of founder personality in start-ups’ participation in subsidy programmes, we
distinguish the self-selection and policymaker-selection decisions in our theorising.
Start-ups must pitch and describe their project idea in their subsidy application.
Programmes typically aim to generate societal benefits by funding ideas that would not
otherwise be pursued (Falk, 2007), and thus, seek innovative and novel ideas in their design
and selection processes. We argue that founder personality will influence the novelty and type
of ideas that their start-up generates, and consequently, the fit of their idea for accessing
subsidies as a source of finance. Founder information search for solutions and new concepts is
a key input to their start-up’s ideation process (Gruber et al., 2013; Hsu and Lim, 2014).
Engagement in information search, and the breadth and depth of search efforts, is a key
determinant of their ability to access novel and non-redundant information (Laursen and Salter,
2006; Hahn et al., 2019), and in turn, develop novel and innovative ideas for their start-up to
pursue (Ahn et al, 2017).
Information search is a cognitive process heavily shaped by individuals’ personality
(Mai, 2016; Halder et al., 2017). Personality can shape whether an individual decides to search,
and how broadly and deeply they search. For instance, individuals high on openness to
experience may search more broadly and follow more unique search paths due to their curiosity

11
and imagination. Individuals high on extraversion and conscientiousness may be more likely to
engage in more thorough and persistent search efforts due to their diligence and motivation.
Thus, personality can affect the novelty and diversity of founder ideation process by shaping
the breadth and depth of their information search efforts (Ahn et al., 2017). Personality also
influences information processing by shaping motivation to allocate attention to certain
information and their predisposition to interpret (e.g., relevant, favourable) and utilise certain
information in their decision-making and actions (Humphreys and Revelle, 1984; Heinström,
2003). For instance, founders that display higher innovativeness will be more likely to attend
to and positively view information that may provide a breakthrough idea.
As personality is enduring (Rauch and Frese, 2007) and search is path dependent
(Gavetti and Levinthal, 2000), the influence of founder personality on search behaviour should
be significant and long-lasting (Hahn et al., 2019). Moreover, beyond their direct involvement,
founder personality may also signal to start-up employees about acceptable and supported
search behaviours (Chirico et al., 2011; Wales et al., 2020), and through controlling resource
seeking and allocation, determine which ideas are pursued within the start-up. Founder
personality can also influence whether founders will be willing to disclose their proprietary idea
as required in a subsidy application (Vaznyte and Andries, 2019). For instance, founders with
low risk tolerance and neuroticism may fear expropriation, while those high on openness to
new experience may view this as an opportunity to elicit feedback. Collectively, the discussion
suggests that founder personality likely influences the novelty of ideas start-ups generate and
pursue, and in turn, their likelihood to have an idea that fits with subsidies as a source of finance
and that is positively evaluated by policymakers.
Personality may also influence how founders describe and explain their idea and project,
their need for financing, the benefits it will produce, amongst other information, in their

12
application. A growing number of discourse-based approaches show how founders’ or top
managers’ personality, style and other cognition characteristics are communicated from their
and their firm’s written communications to various investors and stakeholders (Mousa et al.,
2015; McKenny et al., 2018). As Wales et al. (2020; 7) posits, founders signal their
entrepreneurial orientation “via the verbiage used in speeches and publicly available
document[s]”. Thus, we suggest that founders may communicate their personality to
policymakers via their description of the project, its worthiness and benefits, in their
application. For instance, founders high on innovativeness, risk preferences, and proactiveness
may write with a more optimistic (e.g., change, discover, imagine), ambitious (e.g., bright-idea,
game changing, revolutionize) and entrepreneurial (e.g., creator, discover, create) tones in their
subsidy application and focus their prose on more exploratory and radical paths to achieve
growth and success (Short et al., 2010; Mousa et al., 2015). Whereas those lower on these
personalities may adopt more conservative and cautious language in describing their project
and its impacts and importance. Policymakers can infer these characteristics in their decision-
making process, and thus, they may indirectly influence start-ups likelihood to obtain subsidies.
Finally, founder personality has been linked to the success and growth of their start-ups
(Rauch et al., 2009; Zhao et al., 2010; de Jong et al, 2013; Rosenbusch et al., 2013; Kerr et al,
2017). For instance, founders that are proactive are more likely to seek, identify and exploit
new opportunities and innovations that can drive their start-ups growth (Covin and Slevin,
1991; Rauch and Frese, 2007). By shaping start-up growth and performance, we suggest
founder personality may influence their perceived need to seek subsidies. For instance, founders
scoring low on innovativeness, proactiveness and openness to experience may prefer
maintaining and exploiting the status quo in their business strategies. In turn, this should reduce
their incentives to search for and seize opportunities for subsidies due to their lower resource
needs (Yin et al., 2020). Moreover, due to their lower growth orientation, they may be more

13
likely to pursue other sources of finance. This may also make them less likely to be awarded
subsidies, as policymakers may focus their resources on more innovative and growth-orientated
firms to maximise the potential for societal benefits. Whereas founders scoring high on these
characteristics may be pursuing more radical ideas and business strategies. In turn, they will be
more likely to seek out and exploit opportunities for obtaining subsidies to acquire the greater
resources needed to initiate their innovative plans and drive growth (Covin and Slevin, 1991).
Moreover, greater success in innovation efforts may not offset financial constraints as their
investment opportunities may require greater resources over time (Hottenrott and Peters, 2012);
thus, founders scoring high may have greater resource needs over the long-term, further
increasing their likelihood to seek subsidies. At the same time, their greater performance and
growth may signal their quality to other funders and thus, provide them with greater access to
private sources of finance, reducing their reliance on subsidies as a source of finance (Rojas
and Huergo, 2016). Thus, by influencing start-up growth and success, founder personality may
also indirectly influence start-ups likelihood to seek subsidies.
Our above discussion suggests that founder personality may influence both start-ups self-
selection into subsidies and policymakers’ allocation decisions. To this end, we investigate
whether, and to what extent, founder personality, as captured by the five-factor model and
entrepreneurial orientation, matter, over and above observable founder and firm characteristics,
in start-ups use of and access to subsidies.
3. Data
While start-ups are a key source of innovation, jobs and growth, Germany lags behind countries
such as the U.K. and Netherlands in Europe to rank 10th in number of start-ups per 1 million
population (State of European Tech, 2020). As access to finance is a key inhibitor for start-ups
(Cassar, 2004; Caggese, 2019), our questions on why founders do (not) make use of subsidies

14
to support their start-ups, and the role of personality, are particularly salient and policy relevant
in the German context. Thus, we investigate detailed data on newly founded, legally
independent businesses in Germany collected by the IAB/ZEW Start-up panel. A stratified
random sample of newly registered firms is interviewed via computer-aided telephone survey
each year since 2008 [see Fryges et al. (2009) for a detailed description of the survey design].
The full data set comprises information on about 26,000 start-ups founded between 2005 and
2018.
For the following analysis, we use those survey waves that contain information on
personality. The waves collected in the years 2014-2017 contain questions on entrepreneurial
orientation and the waves 2018 and 2019 the questions on the baseline personality traits. The
item ‘risk tolerance’ is also available for the years 2018 and 2019. In total, we use information
on 11,082 unique start-ups founded between 2007 and 2017. The data set contains quantitative
and qualitative information about the founder(s) such as experience, education, and gender.
Firm specific information (e.g., legal form, exporting activity, R&D expenditures, and profits)
is also collected via the questionnaire as well as the financing sources used and whether the
firm received some form of public start-up subsidy.
3.1 Variables
The key variables of interest are the measures for founder personality. As noted earlier, we
focus on two dominant categorisations of founder personality, namely the Big 5 to capture their
baseline personality, and entrepreneurial orientation to capture their entrepreneurial
personality. Theoretically, we understand founder Big 5 and entrepreneurial orientation to be
multi-dimensional constructs and thus, we construct them as each consisting of five individual
components (McAdams et al., 1992; Lumpkin and Dess, 1996; Lumpkin et al., 2009; Covin
and Wales, 2012); openness to experience, conscientiousness, extraversion, agreeableness, and

15
neuroticism for the ‘Big 5’; innovativeness, proactiveness, risk taking, autonomous and
competitiveness for entrepreneurial orientation. Both the five-factor personality traits and
entrepreneurial orientation are measured based upon previously established item scales (Covin
and Slevin, 1989; Vaznyte and Andries, 2019). The corresponding survey questions are shown
in appendix Table A.1. and Table A.2, respectively. We validate our theoretically grounded
multi-dimensional conceptualisations of both Big 5 and entrepreneurial orientation in our data
using factor analysis, with eigenvalues supporting five factor solutions. The measures used in
the main analysis are obtained as the average item score for each factor (e.g., Chapman and
Hewitt-Dundas, 2018). Tables A.3 to A.6 show the results of the principal component factor
analyses for both the 15 Big 5 items as well as the ten entrepreneurial orientation items.
We deploy three binary subsidy variables as our main dependent variables, namely, any
subsidy (whether the start-up received some form of public subsidy), grant (whether the start-
up received a subsidy in the form of a grant), and loan (whether the start-up received a
subsidized loan or a government loan guarantee). As personality may also be captured or
conveyed via observable founder and firm characteristics (e.g., the founder of a start-up with
significant R&D intensity may be capturing or inferring innovativeness, proactiveness and
openness to experience), we comprehensively account for the role of observable founder and
firm characteristics in our models to disentangle what explanatory power founder personality
characteristics add over and above the founder and firm observable characteristics that are
typically observable to the researcher.
Table 2 shows descriptive statistics for the personality measures and Table 3 for the
range of subsidy indicators as well as founder and firm characteristics that we include as
controls (see Table A.7 for a definitions table; Tables A.8 and A.9 show pair-wise correlations
between variables). The different coverage periods for each set of personality measures results
in different subsamples for the corresponding analyses consisting of 5,483 firm-year

16
observations for the Big 5 subsample (Panel A) and 11,023 firm-year observations for the
entrepreneurial orientation subsample (Panel B).
Table 2: Main personality variables (average item scores)
Note that both samples are sufficiently large for the planned analysis and comparable in terms
of sample characteristics and industry coverage (see Table A.10 for the distribution of firms
across sectors in both sectors). The share of firms receiving some form of public support is 10%
in the smaller Big 5-sample and 17.6% in the larger EO-sample; the latter provides information
on several years per firm allowing for more years for subsidies to occur. Grants are more
common than subsidized loans in both samples. In both samples only about 17% of start-ups
involve a female founder and the share of opportunity-driven firm foundation is high at about
84%. A high share of founders are relatively experienced with about 17 years of industry
experience and a relatively high share of re-starting entrepreneurs (in both samples).
Panel A: Big 5 Obs. Mean Std. Dev. Min Max
Openness 5,483 3.753 0.766 1 5 Conscientiousness 5,483 4.282 0.632 1 5
Extraversion 5,483 3.878 0.743 1 5
Agreeableness 5,483 4.029 0.668 1 5 Neuroticism 5,483 2.360 0.765 1 5
Panel B: Entrepreneurial Orientation
Competitiveness 11,023 2.517 1.373 1 5
Innovativeness 11,023 2.363 1.304 1 5
Proactiveness 11,023 3.822 1.161 1 5 Risk tolerance 11,023 2.590 1.298 1 5
Autonomy 11,023 2.244 1.188 1 5
Note: The number of observations are firm-year observations.

17
Table 3: Descriptive Statistics Variable Obs. Mean Std. Dev. Min Max
Panel A: Big 5
Subsidy information
Any subsidy 5,483 0.107 0.310 0 1
Grant 5,440 0.072 0.258 0 1
Subsidized Loan 5,397 0.047 0.212 0 1
Controls
Profit 5,483 0.690 0.463 0 1 Experience 5,483 17.33 10.60 1 58
ln(R&D expenditures) 5,483 2.431 4.428 0 15.42
Failure experience 5,483 0.033 0.178 0 1
Restarter 5,483 0.411 0.492 0 1 ln(employees) 5,483 1.319 0.674 0 5.185
Female 5,483 0.172 0.377 0 1
Opportunity driven 5,483 0.849 0.358 0 1 Academic 5,483 0.492 0.500 0 1
Founder age 5,483 45.20 11.21 18 99
Team 5,483 0.211 0.408 0 1 Exporter 5,483 0.198 0.399 0 1
East Germany 5,483 0.135 0.342 0 1
Cohort 5,483 3.438 1.753 1 7
Limited liability 5,483 0.534 0.499 0 1
Panel B: EO
Subsidy information
Any subsidy 11,023 0.176 0.381 0 1 Grant 10,895 0.120 0.325 0 1
Subsidized Loan 10,764 0.079 0.269 0 1
Controls
Profit 11,023 0.653 0.476 0 1
Experience 11,023 16.61 10.23 1 61
ln(R&D expenditures) 11,023 2.550 4.514 0 18.84 Failure experience 11,023 0.061 0.240 0 1
Restarter 11,023 0.427 0.495 0 1
ln(employees) 11,023 1.358 0.662 0 5.228 Female 11,023 0.175 0.380 0 1
Opportunity driven 11,023 0.837 0.369 0 1
Academic 11,023 0.511 0.500 0 1 Founder age 11,023 44.13 10.92 17 98
Team 11,023 0.329 0.470 0 1
Exporter 11,023 0.194 0.396 0 1
East Germany 11,023 0.138 0.345 0 1 Cohort 11,023 2.883 1.837 1 7
Limited liability 11,023 0.561 0.496 0 1
Note: The number of observations are firm-year observations. For the distribution of observations across industry see Table A10.

18
4. Methods and Results
Method
Given the nature of start-up subsidies, and their public funders’ predominant pursuit of societal
benefits and additionality, we expect that – besides founders’ personality – observable founder
and firm characteristics that reflect the start-ups innovation potential likely play an important
role in start-up subsidies. In a first step, we therefore investigate the role of a founder’s
personality for the likelihood to receive some form of public subsidy (any subsidy, grant,
subsidized loan). As we utilise two panels because of the variable coverage, we thereby estimate
separate models for the five baseline personality traits and the five entrepreneurial orientation
indicators. We start by including only those key variables of interest and then add in two
subsequent steps, founder and company characteristics which have been linked to the receipt of
public start-up subsidies in previous studies (e.g., Rojas and Huergo, 2016; Hottenrott et al.,
2018; Chapman and Hewitt-Dundas, 2018; Hottenrott and Richstein, 2020). Most of these
characteristics are time-invariant and the others are measured in t.
With regard to the sources of start-up financing, the subsequent analysis proceeds as follows:
We first investigate the role of personality for participating in subsidy programs and distinguish
thereby between grants and subsidized loans. Second, we look at other sources of financing to
investigate differences in the role of personality for different types of start-up financing. In
particular, we derive information from the survey on whether start-ups received some form of
Venture Capital (VC) financing2 (about 9% in both samples), bank financing not subject to
subsidized interest rates or guarantees (about 22% in both samples) or whether founders
borrowed money from family and friends (about 13% in both samples). Table 4 reports the
descriptive statistics for these alternative financing sources in both samples, with the prevalence
2 This comprises Business Angels as well as Venture Capital Funds (including Corporate Venture Capital).

19
comparable in both. Third, we consider rejected applicants and explore how personality impacts
rejection likelihood. In all cases, we estimate models suitable for discrete dependent variables
as our outcome variables of interest are binary indicators.
Table 4: Alternative financing sources
Variable Obs. Mean Std. Dev. Min Max
Panel A: Big5
VC financing 1916 0.094 0.292 0 1 Bank financing 1915 0.224 0.417 0 1
Family & Friends 1915 0.131 0.337 0 1
Panel B: EO
VC financing 4880 0.092 0.288 0 1 Bank financing 4878 0.217 0.412 0 1
Family & Friends 4880 0.134 0.341 0 1
Finally, we test the sensitivity of the results to the modelling assumptions. For doing so, we
first account for the simultaneous financing choices faced by the entrepreneur and the
interrelatedness of different sources of financing. In particular, we employ conditional mixed
process estimations (Roodman, 2011) that allow us to estimate several equations jointly
accounting for structural dependence between the different financing sources. Second, we
estimate the models using predicted factor scores from the factor analyses directly as main
explanatory variables rather than employing average item values. Finally, we estimate selection
models that account for the decision to seek external financing in the first stage (and the role of
personality in this decision) before exploring how personality relates to the choice of the
financing source including public subsides.
Results
Tables 5 and 6 show the results for the five factor personality traits and the entrepreneurial
orientation measures, respectively. Models 1-3 show the results for any type of subsidy, models
3-6 for grants and models 7-9 for subsidized loans. In Table 5 and model 1 only the openness
trait correlates positively and statistically significantly with the likelihood of receiving a
subsidy, whereas conscientiousness correlates negatively. The test for joint significance of all

20
five traits suggests that they are jointly significant [chi2(5) = 15.78**]. This persists in model 2
once founder characteristics are controlled for. However, once firm characteristics are added in
model 3, the traits are no longer statistically significant suggesting that those traits may also be
reflected in firm characteristics. For example, founders with greater openness may be more
likely to allocate their firm resources to R&D to explore new opportunities and may choose to
found firms in particular industries. The test for joint significance of all five traits in model 2
still suggests some explanatory power [chi2(5) = 10.29*], while in model 3 this is no longer the
case [chi2(5) = 2.18]. When we distinguish grants from loans, we find that the results for grants
look similar to the ones for any subsidy, while for loans the five factors do not even explain
participation in loan-based programs when we do not include any other characteristics [chi2(5)
= 4.13].
The picture looks slightly different in Table 6 when considering entrepreneurial
orientation. Here, competitiveness and proactiveness explain the likelihood to receive any type
of subsidy even after accounting for founder and firm characteristics [chi2(5) = 37.26***].
When differentiating between grants and subsidized loans, different patterns emerge. For
grants, founder innovativeness and proactiveness matter even after accounting for observable
firm and founder characteristics [chi2(5) = 17.67***]. This could also be due to a correlation
between entrepreneurial orientation and self-confidence that encourages those founders to
pursue their ideas in subsidies (Hayward et al., 2006); yet we cannot directly test this assertion.
For subsidized loans, higher proactiveness and competitiveness explain their use in all models
(7-9), even after accounting for observable founder and firm characteristics [chi2(5) =
34.24***].
4.1. Other Sources of Early-Stage Finance

21
We perform a corresponding analysis that employs alternative sources of entrepreneurial
financing as dependent variables (Venture Capital, non-subsidized bank loans, family &
friends) to investigate differences between the roles of personality for public subsidises and
those other sources. Tables 7 and 8 show the results for the alternative sources of financing.
Unlike for public subsidies, we find that for VC, higher values in the personality trait openness
significantly predicts VC financing even after accounting for observable founder and firm
characteristics (Table 7) whereas agreeableness correlated negatively. Interestingly, openness
also positively predicts borrowing from family and friends, but is negatively associated with
bank financing. In addition, a higher degree of neuroticism is associated with a higher
likelihood to borrow from family and friends. Overall, baseline personality matters more for
borrowing from family and friends after controlling for other characteristics than for any of the
other sources as indicated by the test of joint significance of the Big 5 traits [chi2(5) =
25.02***].
Still, founder baseline personality traits seem to matter more for the private sources of
finance, than for public sources. For entrepreneurial orientation (Table 8), we find that in
particular the likelihood to receive VC is associated with higher competitiveness,
innovativeness and risk tolerance even accounting for the entire set of control variables [chi2(5)
= 25.46***]. This is in line with the idea that VCs typically pursue highly innovative founders
with high growth potential. In contrast to that, bank financing is negatively related to
innovativeness and positively to proactiveness and higher risk tolerance is linked to borrowing
from family and friends.

22
Table 5: Big 5 personality traits and start-up subsidies (1) (2) (3) (4) (5) (6) (7) (8) (9) Any Subsidy Any Subsidy Any Subsidy Grants Grants Grants Loans Loans Loans
Openness 0.081*** 0.079** 0.018 0.084** 0.078** 0.014 0.036 0.047 0.029
(0.031) (0.032) (0.035) (0.036) (0.037) (0.042) (0.039) (0.040) (0.041) Conscientiousness -0.088** -0.066* -0.047 -0.111*** -0.072* -0.036 -0.023 -0.041 -0.066 (0.036) (0.037) (0.040) (0.041) (0.042) (0.047) (0.044) (0.045) (0.048) Extraversion 0.009 -0.002 0.009 -0.014 -0.013 0.003 0.061 0.039 0.031 (0.032) (0.032) (0.036) (0.037) (0.037) (0.042) (0.040) (0.041) (0.044) Agreeableness -0.053 -0.034 -0.018 -0.047 -0.025 -0.002 -0.010 -0.007 -0.001 (0.036) (0.036) (0.038) (0.041) (0.041) (0.044) (0.046) (0.047) (0.049) Neuroticism -0.023 -0.003 -0.015 -0.035 0.003 -0.002 0.021 0.000 -0.029 (0.030) (0.031) (0.034) (0.035) (0.035) (0.039) (0.038) (0.039) (0.042) Industry experience 0.000 0.004 0.001 0.004 -0.000 0.004 (0.003) (0.003) (0.003) (0.004) (0.004) (0.004) Failure experience 0.188 0.230* 0.045 0.173 0.387*** 0.248 (0.123) (0.138) (0.151) (0.173) (0.144) (0.157) Serial entrepreneur -0.008 -0.163*** 0.038 -0.161** -0.194*** -0.233*** (0.052) (0.060) (0.058) (0.069) (0.071) (0.080) Female -0.090 -0.049 -0.145* -0.075 0.048 0.020 (0.066) (0.074) (0.076) (0.087) (0.084) (0.092) Opportunity driven 0.042 -0.064 0.085 -0.037 -0.052 -0.098 (0.069) (0.076) (0.081) (0.092) (0.085) (0.090) University degree 0.247*** 0.133** 0.377*** 0.159** -0.008 0.142* (0.050) (0.063) (0.057) (0.073) (0.065) (0.080) Founder age -0.013*** -0.015*** -0.010*** -0.011*** -0.014*** -0.013*** (0.003) (0.003) (0.003) (0.004) (0.004) (0.004) ln(employees) 0.398*** 0.371*** 0.348*** (0.038) (0.042) (0.048) Team 0.116 0.114 -0.068 (0.075) (0.083) (0.113) ln(R&D) 0.060*** 0.061*** 0.028*** (0.006) (0.007) (0.009) Profit -0.305*** -0.284*** -0.217*** (0.055) (0.064) (0.069) Exporter -0.009 0.004 -0.065 (0.068) (0.078) (0.094) Firm age -0.149*** -0.107*** -0.181*** (0.018) (0.020) (0.024) Limited liability -0.164** 0.011 -0.332*** (0.064) (0.075) (0.081) East Germany 0.609*** 0.801*** 0.282*** (0.063) (0.070) (0.082) Observations 5,483 5,483 5,483 5,440 5,440 5,440 5,397 5,397 5,397 Pseudo R-square 0.004 0.020 0.176 0.010 0.030 0.220 0.021 0.043 0.137 Joint significance of Big 5 [chi2(5)]
15.78** 10.29* 2.18 15.63*** 7.89 0.670 4.13 3.78 3.64
Notes: Standard errors in parentheses * p < 0.10, ** p < 0.05, *** p < 0.01. All models contain a constant; models 3, 6, and 9 also contain the set of industry and year dummies.

23
Table 6: Entrepreneurial Orientation and start-up subsidies (1) (2) (3) (4) (5) (6) (7) (8) (9)
Any Subsidy Any Subsidy Any Subsidy Grants Grants Grants Loans Loans Loans
Competitiveness 0.047*** 0.048*** 0.029** 0.028** 0.028** 0.009 0.081*** 0.084*** 0.065***
(0.011) (0.011) (0.012) (0.012) (0.012) (0.013) (0.014) (0.014) (0.014) Innovativeness 0.056*** 0.067*** 0.014 0.088*** 0.091*** 0.027* -0.018 0.002 -0.014 (0.012) (0.012) (0.014) (0.013) (0.014) (0.015) (0.016) (0.016) (0.018) Proactiveness 0.070*** 0.075*** 0.053*** 0.068*** 0.069*** 0.045*** 0.038** 0.046** 0.031* (0.014) (0.014) (0.015) (0.016) (0.016) (0.016) (0.018) (0.018) (0.019) Risk tolerance 0.029** 0.030** 0.016 0.024* 0.021 0.003 0.020 0.026* 0.019 (0.012) (0.012) (0.013) (0.013) (0.014) (0.014) (0.015) (0.015) (0.016) Autonomy -0.004 -0.005 -0.011 -0.007 -0.004 -0.006 -0.000 -0.008 -0.019 (0.012) (0.013) (0.013) (0.014) (0.014) (0.015) (0.016) (0.016) (0.017) Industry experience -0.001 -0.000 -0.002 -0.002 0.001 0.001 (0.002) (0.002) (0.002) (0.002) (0.003) (0.003) Failure experience 0.176*** 0.213*** 0.240*** 0.298*** 0.056 0.050 (0.061) (0.064) (0.068) (0.071) (0.077) (0.079) Serial entrepreneur -0.207*** -0.281*** -0.206*** -0.288*** -0.164*** -0.192*** (0.035) (0.037) (0.039) (0.042) (0.044) (0.048) Female 0.044 0.026 0.018 0.031 0.037 -0.021 (0.040) (0.043) (0.045) (0.048) (0.051) (0.054) Opportunity driven -0.018 -0.054 -0.049 -0.084* 0.042 0.017 (0.040) (0.042) (0.044) (0.046) (0.052) (0.055) University degree 0.040 0.023 0.144*** 0.101** -0.148*** -0.094* (0.032) (0.037) (0.035) (0.041) (0.041) (0.049) Founder age -0.005*** -0.007*** -0.002 -0.004* -0.008*** -0.009*** (0.002) (0.002) (0.002) (0.002) (0.003) (0.003) ln(employees) 0.306*** 0.298*** 0.277*** (0.025) (0.028) (0.032) Team 0.081** 0.035 0.121** (0.038) (0.042) (0.048) ln(R&D) 0.031*** 0.037*** 0.010* (0.004) (0.004) (0.005) Profit -0.216*** -0.208*** -0.203*** (0.033) (0.037) (0.041) Exporter 0.121*** 0.105** 0.096* (0.041) (0.045) (0.053) Firm age -0.094*** -0.075*** -0.121*** (0.011) (0.012) (0.015) Limited liability -0.172*** -0.129*** -0.235*** (0.038) (0.043) (0.049) East Germany 0.423*** 0.558*** 0.066 (0.041) (0.044) (0.055) Observations 11023 11023 11023 10895 10895 10895 10764 10764 10764 Pseudo R-square 0.047 0.054 0.112 0.050 0.058 0.127 0.041 0.054 0.101 Joint significance of EO [chi2(5)] 142.68*** 157.36*** 37.26*** 132.09*** 127.62*** 17.67*** 57.03*** 69.41*** 34.24***
Notes: Standard errors in parentheses * p < 0.10, ** p < 0.05, *** p < 0.01. All models contain year fixed effects and a constant; models 3, 6, and 9 also contain the set of industry dummies.

24
Table 7: Big 5 personality traits and alternative sources of financing (1) (2) (3) (4) (5) (6) (7) (8) (9) VC VC VC Bank Bank Bank Family & Friends Family & Friends Family & Friends
Openness 0.167*** 0.151** 0.117* -0.143*** -0.121*** -0.083* 0.179*** 0.199*** 0.199***
(0.059) (0.061) (0.068) (0.044) (0.045) (0.047) (0.053) (0.054) (0.056) Conscientiousness -0.087 0.000 0.061 0.062 0.005 -0.035 -0.020 -0.033 -0.055 (0.063) (0.069) (0.082) (0.055) (0.056) (0.058) (0.060) (0.063) (0.064) Extraversion 0.017 0.003 0.009 0.054 0.049 0.038 0.035 0.004 0.001 (0.061) (0.062) (0.071) (0.046) (0.047) (0.048) (0.053) (0.053) (0.054) Agreeableness -0.121* -0.105 -0.145* 0.029 0.039 0.050 -0.081 -0.061 -0.073 (0.065) (0.066) (0.076) (0.051) (0.052) (0.054) (0.059) (0.060) (0.061) Neuroticism -0.097* -0.018 0.036 0.018 -0.018 -0.025 0.178*** 0.164*** 0.139*** (0.053) (0.057) (0.069) (0.043) (0.044) (0.047) (0.047) (0.049) (0.049) Industry experience -0.014*** -0.013** 0.012*** 0.007* -0.003 -0.001 (0.005) (0.005) (0.004) (0.004) (0.005) (0.005) Failure experience -0.101 0.109 -0.246 -0.133 -0.007 -0.107 (0.205) (0.238) (0.174) (0.185) (0.174) (0.179) Serial entrepreneur 0.203** -0.016 -0.010 0.044 0.006 0.084 (0.095) (0.106) (0.075) (0.078) (0.092) (0.097) Female -0.309** -0.306** -0.069 -0.119 0.107 0.058 (0.127) (0.140) (0.091) (0.095) (0.106) (0.110) Opportunity driven 0.465*** 0.329 -0.175* -0.150 -0.234** -0.173 (0.172) (0.205) (0.095) (0.099) (0.110) (0.112) University degree 0.513*** -0.001 -0.342*** -0.240*** 0.048 0.167* (0.094) (0.111) (0.072) (0.081) (0.084) (0.093) Founder age -0.002 -0.003 -0.013*** -0.013*** -0.025*** -0.023*** (0.005) (0.005) (0.004) (0.004) (0.005) (0.005) ln(employees) 0.416*** 0.261*** -0.032 (0.067) (0.054) (0.064) Team 0.254** -0.009 -0.111 (0.123) (0.105) (0.136) ln(R&D) 0.051*** -0.019** 0.004 (0.010) (0.009) (0.010) Profit -0.753*** 0.322*** -0.073 (0.122) (0.073) (0.086) Exporter -0.174 -0.022 0.181* (0.125) (0.097) (0.109) Firm age -0.063* 0.085*** -0.025 (0.033) (0.021) (0.027) Limited liability 0.464*** -0.082 -0.252** (0.146) (0.087) (0.100) East Germany 0.158 0.038 -0.036 (0.137) (0.095) (0.114) Observations 1,916 1,916 1,916 1,915 1,915 1,915 1,915 1,915 1,915 Pseudo R-square 0.031 0.091 0.299 0.006 0.036 0.092 0.028 0.069 0.096 Joint significance of Big 5 [chi2(5)] 14.21** 7.50 6.42 12.07** 8.16 4.57 30.13*** 28.71*** 25.02***
Notes: Standard errors in parentheses * p < 0.10, ** p < 0.05, *** p < 0.01. All models contain a constant; models 3, 6, and 9 also contain the set of industry dummies.

25
Table 8: Entrepreneurial orientation and alternative sources of financing (1) (2) (3) (4) (5) (6) (7) (8) (9) VC VC VC Bank Bank Bank Family & Friends Family & Friends Family & Friends
Competitiveness 0.075*** 0.075*** 0.048** 0.030* 0.031* 0.018 -0.020 -0.018 -0.012
(0.019) (0.020) (0.022) (0.016) (0.016) (0.016) (0.017) (0.018) (0.018) Innovativeness 0.202*** 0.162*** 0.078*** -0.115*** -0.090*** -0.038* -0.047** -0.011 -0.003 (0.022) (0.023) (0.026) (0.017) (0.018) (0.020) (0.019) (0.020) (0.022) Proactiveness 0.068** 0.056* 0.013 0.037* 0.048** 0.040* 0.001 0.006 0.002 (0.030) (0.030) (0.031) (0.020) (0.020) (0.021) (0.022) (0.022) (0.022) Risk tolerance 0.117*** 0.091*** 0.051** -0.030* -0.008 -0.008 0.037* 0.039** 0.044** (0.022) (0.023) (0.024) (0.017) (0.018) (0.018) (0.019) (0.020) (0.020) Autonomy -0.020 -0.002 0.010 0.009 0.000 -0.000 0.040** 0.029 0.019 (0.024) (0.025) (0.027) (0.018) (0.018) (0.018) (0.019) (0.019) (0.020) Industry experience -0.011*** -0.009** 0.014*** 0.009*** -0.006** -0.004 (0.004) (0.004) (0.003) (0.003) (0.003) (0.003) Failure experience -0.502*** -0.379*** 0.077 0.135 0.095 0.067 (0.136) (0.143) (0.085) (0.088) (0.091) (0.093) Serial entrepreneur 0.214*** 0.049 -0.080 -0.042 -0.112** -0.046 (0.063) (0.067) (0.050) (0.054) (0.054) (0.058) Female -0.019 -0.062 -0.032 -0.058 0.109* 0.096 (0.078) (0.084) (0.058) (0.060) (0.063) (0.067) Opportunity driven 0.142 0.061 -0.026 -0.044 -0.122* -0.118* (0.101) (0.105) (0.062) (0.064) (0.067) (0.068) University degree 0.497*** 0.253*** -0.267*** -0.202*** -0.207*** -0.085 (0.070) (0.079) (0.048) (0.055) (0.051) (0.056) Founder age 0.001 -0.004 -0.005** -0.006** -0.013*** -0.014*** (0.003) (0.003) (0.003) (0.003) (0.003) (0.003) ln(employees) 0.340*** 0.393*** -0.081* (0.046) (0.037) (0.044) Team 0.203*** 0.056 -0.000 (0.069) (0.054) (0.060) ln(R&D) 0.036*** -0.018*** 0.015** (0.007) (0.006) (0.006) Profit -0.579*** 0.122*** -0.135*** (0.073) (0.046) (0.051) Exporter 0.101 0.109* 0.095 (0.075) (0.060) (0.066) Firm age -0.063** 0.083*** 0.018 (0.026) (0.016) (0.019) Limited liability 0.320*** -0.155*** -0.281*** (0.092) (0.056) (0.060) East Germany -0.015 0.005 -0.034 (0.095) (0.066) (0.071) Observations 4,880 4,880 4,880 4,878 4,878 4,878 4,880 4,880 4,880 Pseudo R-square 0.099 0.139 0.239 0.027 0.045 0.106 0.007 0.037 0.058 Joint significance of EO [chi2(5)] 231.85*** 138.43*** 25.46*** 60.19*** 31.61*** 8.05 14.43** 6.58 5.82
Notes: Standard errors in parentheses * p < 0.10, ** p < 0.05, *** p < 0.01. All models contain year fixed effects and a constant; models 3, 6, and 9 also contain the set of industry dummies.

26
4.2. Distinguishing the Rejection Decision
For the most part of our data, we cannot empirically distinguish the impact of founder
personality on the self-selection and policymaker selection decisions separately as information
on rejection is only available for two most recent years in our dataset. Since the analysis so far
does not distinguish between the propensity to participate in public funding programs and the
success probability conditional on application, we estimate the likelihood of a founder being
rejected by public funders using some limited data for the two most recent years. We begin by
looking descriptively at the rejection rate in the sample and across sectors (Table 9). The mean
score for rejection of less than 3% suggests that the rejection rate for subsidies in our data is
generally low, and that most start-ups that apply seem to be awarded subsidies once they
incurred the direct and indirect application costs (e.g., time, effort, disclosure). There is,
however, some variation across sectors with higher rejection rates in knowledge-intensive
manufacturing sectors and software. This could be due to the greater levels of information
asymmetries that typically characterise these sectors and hence leave more room for uncertainty
on the side of the public funder. Alternatively, it could be due to greater numbers of applicants
and thus, intensified competition for funding in these sectors.
Table 9: Rejection rates by sector
Industry rejection
0 1 N %
Cutting-edge tech 87.84 12.16 74 2.74
High-tech 92.65 7.35 68 2.52
Tech. services 98.57 1.43 419 15.5
Software 94.06 5.94 202 7.47 Low-tech 98.06 1.94 258 9.54
Knowledge-int. services 100 0 285 10.54
Other company services 99.29 0.71 281 10.40 Creative services 98.11 1.89 212 7.84
Other services 99.52 0.48 210 7.77
Construction 99.96 1.04 385 14.24 Trade 97.09 2.91 309 11.43
Total 97.89 2.11 2,703 100

27
Turning to the models, when considering the likelihood of unsuccessfully applying for
subsidy programs, we find that higher agreeableness predicts rejection, but none of the other
baseline personality traits. Due to lack of survey questions on the full set of entrepreneurial
orientation measures, we can only test for the measure of risk tolerance and find that it
correlated positively, but statistically insignificantly, with the rejection likelihood before as well
as after founder and firm characteristics are accounted for. While it should be noted that only
very few firms report rejected application in our sample, the results suggest that founder
personality does not seem to matter much in policymakers’ decisions to reject or support an
application.
4.3 Robustness Checks and Extensions
First, we check the robustness of our results by accounting for the interdependence of the
different sources of financing. To allow for the possibility of multiple funding sources being
used simultaneously, we estimate simultaneous equation models via a conditional mixed
process estimator. The tests of correlation of errors across equations indicate that there is indeed
interdependence between financing sources. These results with regard to personality are,
however, very similar as can be seen in Table B.1 and B.2 in Appendix B.
Next, we test the robustness of the results to an alternative specification of the
personality measures. In particular, we use the predicted factor scores as regressors in the
simultaneous equation models and the results are quite similar indicating that the results
discussed so far are not driven by how we utilize the item responses. See Table B.3 and B.4 in
Appendix B.
Finally, we take into account that not all founders may seek external financing and hence
estimate two-stage selection models. The first stage captures the decision to seek access to any
type of external financing and the second stage focuses on the type of financing. Seeking

28
external financing is defined based on two types of information. First, we use information on
whether the founder indicated to have experienced problems when trying to raise external
financing. This provides us with information that the founder sought external financing also for
those founders that do not report to have any. Second, we use the observed sources of external
financing to create a binary indicator for seeking external financing. The outcome variable in
the selection stage is therefore one if either the firm reported to have obtained some form of
external financing or if it reported to have had problems raising external financing. The
identification of the model requires at least one exclusion restriction that predicts the outcome
variable in the first stage, but not in the second. Following Vaznyte and Andries (2019), we use
the information of whether founders had previously been unemployed, in particular whether
they received unemployment benefits, as exclusion restriction (ER). Founders coming out of
unemployment should have fewer own funds and may therefore be more likely to seek external
financing. The ER is indeed positive and statistically significant in the first stage.
The second stage results for the baseline personality traits are hardly impacted by the
inclusion of the section stage (see Table 11 and 12 and Tables B.5 and B.6 for the detailed
results). Yet, we see that higher values for openness are associated with a higher propensity to
seek external financing in the first place. It is, however, still negatively associated with bank
financing in the second stage. Moreover, higher scores for neuroticism still positively predict
the likelihood to borrow from family and friends. With regard to entrepreneurial orientation,
we find that all factors – except autonomy – predict the likelihood to seek external financing
positively. Still, innovativeness remains positive and significant in the second stage for grants
and VC financing (and negative for bank financing) and competitiveness predicts participating
in loan-based programs.

29
Table 10: Personality and Rejection Likelihood
(1) (2) (3) (4) (5) (6) (7)
Openness 0.186 0.209* 0.186 0.180
(0.114) (0.117) (0.131) (0.130)
Conscientiousness -0.038 0.009 -0.006 -0.003
(0.111) (0.116) (0.137) (0.139)
Extraversion -0.052 -0.080 -0.035 -0.043
(0.117) (0.113) (0.113) (0.108)
Agreeableness 0.188* 0.212** 0.238** 0.243**
(0.104) (0.098) (0.105) (0.103)
Neuroticism 0.068 0.059 0.028 0.036
(0.108) (0.112) (0.126) (0.130)
Risk tolerance 0.033 0.020 0.019 0.033
(0.064) (0.066) (0.060) (0.065)
Industry experience -0.024** -0.033*** -0.033*** -0.024** -0.031***
(0.011) (0.013) (0.013) (0.012) (0.012)
Failure experience 0.073 0.023 0.021 0.150 0.021
(0.342) (0.371) (0.371) (0.350) (0.375)
Serial entrepreneur -0.292 -0.420* -0.433* -0.449** -0.416*
(0.215) (0.233) (0.230) (0.209) (0.232)
Female -0.129 -0.143 -0.150 -0.115 -0.055
(0.236) (0.263) (0.259) (0.228) (0.248)
Opportunity driven -0.164 -0.213 -0.207 -0.101 -0.159
(0.234) (0.228) (0.232) (0.232) (0.234)
University degree 0.111 0.132 0.126 0.080 0.092 (0.183) (0.211) (0.210) (0.173) (0.208)
Founder age -0.006 -0.003 -0.002 -0.006 -0.002
(0.008) (0.009) (0.009) (0.008) (0.009)
ln(employees) 0.512*** 0.509*** 0.396*** 0.502***
(0.122) (0.122) (0.103) (0.113)
ln(R&D) 0.015 0.015 0.019
(0.021) (0.021) (0.022)
Limited liability -0.362** -0.366** -0.417**
(0.163) (0.163) (0.168)
Observations 1,325 1,325 1,191 1,190 1,325 1,325 1,191
Pseudo R-square 0.021 0.065 0.225 0.225 0.000 0.076 0.207 Joint significance of Big 5 [chi2(5)] 9.93* 12.39** 8.49 - - - - Joint significance of Big 5 and risk
tolerance [chi2(6)] - - - 9.17 - - -
Standard errors in parentheses * p < 0.10, ** p < 0.05, *** p < 0.01. All models contain a constant, exporter dummy, firm age, profit dummy and a location dummy (all statistically insignificant); models 3, 4, 6 and 7 also contain the set of industry dummies. Sector 6 and team dummy predict failure perfectly and 130 observations are not used in models 3, 4, 6 and 7.

30
Table 11: Big 5 personality traits and different sources of financing (selection model; joint estimation of
second stage)
Selection
Stage
Grant Subsidized
Loan
VC
financing
Bank
financing
Family &
Friends
Openness 0.075*** -0.010 -0.043 0.115 -0.166*** 0.181***
(0.027) (0.071) (0.064) (0.078) (0.055) (0.062)
Conscientiousness -0.026 -0.016 -0.058 0.106 -0.014 -0.047
(0.032) (0.078) (0.070) (0.098) (0.069) (0.075)
Extraversion <0.001 -0.044 -0.023 -0.032 0.052 -0.013
(0.027) (0.068) (0.066) (0.079) (0.055) (0.061)
Agreeableness -0.033 -0.021 0.006 -0.153* 0.061 -0.106
(0.030) (0.074) (0.077) (0.090) (0.064) (0.073)
Neuroticism 0.023 0.085 -0.017 0.017 -0.063 0.152***
(0.026) (0.066) (0.062) (0.083) (0.056) (0.058)
ER: Unemployed 0.195**
(0.094)
Observations 5,483
Log Likelihood -5.3e+03 Standard errors in parentheses * p < 0.10, ** p < 0.05, *** p < 0.01. The model contains the full set of controls in both stages including year and sector fixed effects and a constant. See Table B.5 in the Appendix for the full table.
Table 12: EO personality and different sources of financing (selection model; joint estimation of second
stage)
Selection
Stage
Grant Subsidized
Loan
VC financing Bank
financing
Family &
Friends
Competitiveness 0.053*** 0.007 0.044** 0.037 0.008 -0.026
(0.010) (0.020) (0.020) (0.025) (0.019) (0.020)
Innovativeness 0.024* 0.047** 0.004 0.102*** -0.048** -0.003
(0.012) (0.023) (0.025) (0.030) (0.023) (0.024)
Proactiveness 0.040*** 0.022 0.010 0.014 0.022 -0.017
(0.013) (0.026) (0.027) (0.035) (0.024) (0.026)
Risk tolerance 0.051*** -0.016 -0.009 0.031 -0.013 0.035
(0.012) (0.022) (0.023) (0.028) (0.022) (0.023)
Autonomy -0.007 -0.016 -0.017 0.002 -0.006 0.016
(0.011) (0.022) (0.024) (0.031) (0.022) (0.023)
ER: Unemployed 0.141**
(0.064)
Observations 11,023
Log Likelihood -1.3e+04 Standard errors in parentheses * p < 0.10, ** p < 0.05, *** p < 0.01. The model contains the full set of controls in both stages including year and sector fixed effects and a constant. See Table B.6 in the Appendix for the full table.

31
5. Conclusions
This paper provides new insights into the antecedents of start-up subsidies by examining
whether and how founder personality shapes start-ups’ participation in subsidy programmes. In
doing so, this study contributes to the emerging research investigating start-up subsidies
(Audretsch et al., 2020). Where current work has demonstrated their importance for alleviating
financial constraints and driving start-up performance (e.g., Buffart et al., 2020; Hottenrott and
Richstein, 2020), much remains unknown about what characteristics aid and inhibit start-ups to
access this important source of finance. We contribute to this literature with novel evidence on
the role of founders’ personality. We theorise and demonstrate that founder entrepreneurial
personality impacts start-ups use of subsidies and influences the type (grants or loans) of
subsidies that start-ups seek and obtain. Start-ups with more entrepreneurially oriented founders
seem better positioned to access subsidies, whereas those with less entrepreneurially oriented
founders may not participate in such programmes. Particularly, founder innovativeness and
competitiveness seem important for accessing start-up subsidies. Founder baseline Big 5-
personality traits however seem not to play a role once we have controlled for other observable
founder and firm-level characteristics. In providing the first evidence on personality, these
results extend our understanding of entrepreneurial ventures’ early-stage financing by showing
that, over and above the observable characteristics presently studied in the literature, founder
personality, can play a role in explaining start-ups access to subsidies. In doing so, we highlight
the important role that unobservable characteristics can play in shaping start-ups ability to
access subsidies. This is important to better inform policymakers, start-ups and academics on
the enablers and barriers to accessing important subsidy programmes.
Our work also contributes to research on the evaluation of start-up subsidies. Evaluation
studies often rely on research designs to identify the treatment effect that require a
comprehensive understanding of the characteristics impacting access to subsidies. Our results

32
suggest that not capturing founder personality may result in an omitted variable bias, and thus,
over- or under-estimate the effectiveness. Yet, our results also show that comprehensive
coverage of observable founder and firm characteristics lessens the bias substantially by
capturing some of the variance explained by personality, particularly in the case of baseline
personality characteristics.
Second, we respond to calls for examinations of alternative predictors of start-up
financing decisions (e.g., Hanssens et al., 2016) by comparing the role of personality in access
to and use of private sources of finance to public subsidies. Our results demonstrate that founder
personality shapes start-ups access to and use of private sources of finance, with entrepreneurial
personality mattering most in venture capital, and baseline personality for family and friends.
The results indicate that baseline personality traits matter more for private sources of early-
stage finance than public subsidies. For entrepreneurial personality, while some characteristics
play a similar role in the private sources and public subsidies, the results generally suggest that
the role of entrepreneurial personality differs across sources of early-stage finance. This
suggests that founder personality plays a critical role in explaining start-ups access to and use
of the key sources of early-stage finance, and they may predispose their start-up to seeking
certain forms of early-stage finance, and potentially restrict their access to others. Our insights
contribute a more comprehensive understanding of the critical (unobservable) characteristics
explaining start-ups financing decisions, and in turn, impacting their survival and performance.
This overcomes deficits in existing theory that do not explain how and why personality shapes
start-up performance and survival (Vaznyte and Andries, 2019; Yin et al., 2020) by
demonstrating that one likely path is through their critical role in shaping start-ups access to
early-stage finance. Moreover, by demonstrating the importance of founder entrepreneurial
orientation in start-up financing decisions, we contribute to a broader understanding of its

33
system of effects beyond performance (Covin and Wales, 2019) and respond to Wales et al.’s
(2020) call for greater attention to founder and top management entrepreneurial orientation.
Finally, we take a step toward distinguishing where in the subsidy process personality
matters by exploiting some information on rejection within our dataset (Huergo and Trenado,
2010; Mina et al., 2021). The descriptive data suggests that the rejection rates of start-up
subsidies are low (<3%). Some sectoral variation is observed with greater rejection rates in
higher technology and software industries, but these remain generally low (<13%). Empirically
our results provide little evidence for founder personality impacting policymakers’ rejection
decision. The descriptive and empirical evidence suggests that the role of founder personality
for start-up subsidies may be more important in influencing their self-selection into subsidies,
rather than policymaker award decisions. The selection model also provided support for this
interpretation by demonstrating the significant role of personality in shaping whether start-ups
seek any source of external finance.
These results have important implications for start-ups and policymakers. First, our
results may be of interest to policymakers designing start-up subsidies by providing insights
into the types of start-ups that they attract with their programmes. Our results on entrepreneurial
personality suggest that it is largely more innovative and growth-oriented start-ups that are
accessing their start-up subsidies. This is contrary to concerns that subsidies may sustain low-
quality start-ups (Colombo et al., 2007) and reassuring by suggesting that start-ups with high
entrepreneurial orientation founders - which typically are more innovative and growth oriented
(Engelen et al., 2015; Rosenbusch et al, 2013) and thus, more likely to produce societal benefits
- are more likely to make use of subsidies. Second, our results suggest that different founder
personalities may favour seeking subsidies in the form of loans or grants. For policymakers,
this suggests that the two instruments are targeting different founder profiles augmenting recent

34
insights that that there is ‘task segmentation’ in the portfolio of start-up policy instruments
(Giraudo et al. 2019). Finally, our results suggest that baseline personality traits matter for
firms’ access to private sources of finance, and thus, may act as an enabler or constraint on their
access to VC, banks and family and friends.
Our study has several limitations that in turn, provide opportunities for future research.
First, we have focused on two dominant configurations of founder personality in illustrating the
importance of founder personality in shaping start-ups access to subsidies. A broad range of
personality traits have been identified in the literature (Kerr et al, 2017), however, and we
believe future research should consider the importance of other personality traits (such as
altruism, cooperativeness, honesty, trust, or optimism/pessimism for example) in start-up
access to subsidies and finance more generally. Second, we draw our data from a single
advanced western country, namely, Germany. As innovation policy mixes and systems can vary
significantly across countries (Magro and Wilson, 2019), we believe extending our insights to
other countries and contexts is valuable in understanding their role within different innovation
policy mixes and systems. Finally, while we take an important first step toward distinguishing
the selection and award components of accessing subsidies, our data is limited in this respect
as the information is only available two years and for entrepreneurial orientation, only the
information for risk is available in these years. Thus, we believe an interesting avenue for future
work is to explore this distinction and the role of founder personality– and other characteristics
– in the application and award decisions.

35
References
Ahn, J.M., Minshall, T. and Mortara, L., 2017. Understanding the human side of openness: the fit
between open innovation modes and CEO characteristics. R&D Management, 47(5), 727-740.
Anderson, B.S., Kreiser, P.M., Kuratko, D.F., Hornsby, J.S. and Eshima, Y., 2015. Reconceptualizing entrepreneurial orientation. Strategic Management Journal, 36(10), 1579-1596.
Antonelli, C. and Crespi, F., 2013. The" Matthew effect" in R&D public subsidies: The Italian evidence. Technological Forecasting and Social Change, 80(8), 1523-1534.
Audretsch, D., Colombelli, A., Grilli, L., Minola, T. and Rasmussen, E., 2020. Innovative start-ups and policy initiatives. Research Policy, 49(10), 104027.
Bernardino S, Santos J.F., 2016. Financing social ventures by crowdfunding: The influence of
entrepreneurs’ personality traits. The International Journal of Entrepreneurship and Innovation 17 (3), 173-183.
Blanes, J.V. and Busom, I., 2004. Who participates in R&D subsidy programs? The case of Spanish manufacturing firms. Research Policy, 33(10), 1459-1476.
Brandstätter, H., 2011. Personality aspects of entrepreneurship: A look at five meta-analyses. Personality and Individual Differences, 51(3), 222-230.
Bruneel, J., Clarysse, B., Bobelyn, A. and Wright, M., 2020. Liquidity events and VC-backed academic
spin-offs: The role of search alliances. Research Policy, 49(10), 104035.
Buffart, M., Croidieu, G., Kim, P.H. and Bowman, R., 2020. Even winners need to learn: How
government entrepreneurship programs can support innovative ventures. Research Policy, 49(10), 104052.
Busom, I., Corchuelo, B. and Martínez-Ros, E., 2014. Tax incentives or subsidies for business
R&D? Small Business Economics, 43(3), 571-596.
Caggese, A., 2019. Financing constraints, radical versus incremental innovation, and aggregate
productivity. American Economic Journal: Macroeconomics 11(2), 275–309.
Caliendo, M., Künn, S. and Weissenberger, M., 2020. Catching up or lagging behind? The long-term
business and innovation potential of subsidized start-ups out of unemployment. Research Policy, 49(10), 104053.
Cantner, U. and Kösters, S., 2012. Picking the winner? Empirical evidence on the targeting of R&D
subsidies to start-ups. Small Business Economics, 39(4), 921-936.
Cassar, G., 2004. The financing of business start-ups. Journal of Business Venturing, 19(2), 261-283.
Chapman, G. and Hewitt-Dundas, N., 2018. The effect of public support on senior manager attitudes to
innovation. Technovation, 69, 28-39.
Chapman, G., Lucena, A. and Afcha, S., 2018. R&D subsidies & external collaborative breadth:
Differential gains and the role of collaboration experience. Research Policy, 47(3), 623-636.
36
Chirico, F., Sirmon, D.G., Sciascia, S. and Mazzola, P., 2011. Resource orchestration in family firms:
Investigating how entrepreneurial orientation, generational involvement, and participative strategy affect performance. Strategic Entrepreneurship Journal, 5(4), 307-326.
Colombo, M.G., Grilli, L., and Verga, C. 2007. High-tech start-up access to public funds and venture
capital: Evidence from Italy. International Review of Applied Economics 21(3), pp. 381-402.
Colombo, M. G., Grilli, L. and Murtinu, S., 2011. R&D subsidies and the performance of high-tech
start-ups. Economics Letters 112(1), 97 – 99.
Colombo, M. G., Giannangeli, S. and Grilli, L., 2012. Public subsidies and the employment growth of
high-tech start-ups: assessing the impact of selective and automatic support schemes. Industrial and Corporate Change 22(5), 1273–1314.
Conti, A., 2018. Entrepreneurial finance and the effects of restrictions on government R&D subsidies.
Organization Science 29(1), 134–153.
Covin, J.G. and Lumpkin, G.T., 2011. Entrepreneurial orientation theory and research: Reflections on
a needed construct. Entrepreneurship Theory and Practice 35(5), 855-872.
Covin, J. G., & Slevin, D. P. 1988. The influence of organization structure on the utility of an
entrepreneurial top management style. Journal of Management Studies, 25, 217–234.
Covin, J.G. and Slevin, D.P., 1989. Strategic management of small firms in hostile and benign
environments. Strategic Management Journal 10(1), 75-87.
Covin, J.G. and Slevin, D.P., 1991. A conceptual model of entrepreneurship as firm
behavior. Entrepreneurship Theory and Practice 16(1), 7-26.
Covin, J. G. (1991). Entrepreneurial versus conservative firms: A comparison of strategies and
performance. Journal of Management Studies, 28, 439–462.
Covin, J.G. and Wales, W.J., 2012. The measurement of entrepreneurial orientation. Entrepreneurship Theory and Practice 36(4), 677-702.
Covin, J.G. and Wales, W.J., 2019. Crafting high-impact entrepreneurial orientation research: Some suggested guidelines. Entrepreneurship Theory and Practice 43(1), pp.3-18.
Covin, J.G., Rigtering, J.C., Hughes, M., Kraus, S., Cheng, C.F. and Bouncken, R.B., 2020. Individual and team entrepreneurial orientation: Scale development and configurations for success. Journal of
Business Research, 112, 1-12.
de Jong, A., Song, M. and Song, L.Z., 2013. How lead founder personality affects new venture performance: The mediating role of team conflict. Journal of Management 39(7), 1825-1854.
Dencker, J.C. and Gruber, M., 2015. The effects of opportunities and founder experience on new firm performance. Strategic Management Journal 36(7), 1035-1052.
Denes, M., Howell, S.T., Mezzaanotti, F., Wang, X. and Xu, T., 2020. Investor tax credits and entrepreneurship: Evidence from U.S. states. Available from:
https://papers.ssrn.com/sol3/papers.cfm?abstract_id=3596342. Accessed: 24/02/2021.
Dimos, C. and Pugh, G., 2016. The effectiveness of R&D subsidies: A meta-regression analysis of the
evaluation literature. Research Policy 45(4), 797-815.

37
Engelen, A., Gupta, V., Strenger, L. and Brettel, M., 2015. Entrepreneurial orientation, firm
performance, and the moderating role of transformational leadership behaviours. Journal of Management 41(4), 1069-1097.
Falk, R., 2007. Measuring the effects of public support schemes on firms’ innovation activities: Survey
evidence from Austria. Research Policy, 36(5), pp.665-679.
Fryges, H., Gottschalk, S. and Kohn, K. (2009), The KfW/ZEW start-up panel: design and research
potential, ZEW-Centre for European Economic Research Discussion Paper (09-053).
Gavetti, G. and Levinthal, D., 2000. Looking forward and looking backward: Cognitive and experiential
search. Administrative Science Quarterly 45(1), 113-137.
Giraudo, E. Giudici, G. and Grilli, L., (2019), Entrepreneurship policy and the financing of young
innovative companies: Evidence from the Italian Startup Act. Research Policy 48(9), 103801.
George, J.M. and Zhou, J., 2001. When openness to experience and conscientiousness are related to
creative behaviour: an interactional approach. Journal of Applied Psychology 86(3), 513.
Gruber, M., MacMillan, I.C. and Thompson, J.D., 2013. Escaping the prior knowledge corridor: What
shapes the number and variety of market opportunities identified before market entry of technology
start-ups? Organization Science 24(1), 280-300.
Haeussler, C., Harhoff, D. and Mueller, E., 2014. How patenting informs VC investors–The case of
biotechnology. Research Policy 43(8), 1286-1298.
Hahn, D., Minola, T. and Eddleston, K.A., 2019. How do Scientists Contribute to the Performance of
Innovative Start‐ups? An Imprinting Perspective on Open Innovation. Journal of Management
Studies 56(5), 895-928.
Halder, S., Roy, A. and Chakraborty, P.K., 2017. The influence of personality traits on information
seeking behaviour of students. Malaysian Journal of Library & Information Science 15(1), 41-53.
Haltiwanger, J., Jarmin, R. S. and Miranda, J., 2013. Who creates jobs? Small versus large versus
young. The Review of Economics and Statistics 95(2), 347–361.
Hanssens, J., Deloof, M. and Vanacker, T., 2016. The evolution of debt policies: New evidence from business startups. Journal of Banking & Finance 65, 120-133.
Hayward, M.L.A., Shepherd, D.A., & Griffin, D. 2006. A hubris theory of entrepreneurship. Management Science. 52(2), pp. 160-172.
Heinström, J., 2003. Five personality dimensions and their influence on information
behaviour. Information Research 9(1), 9-1.
Hottenrott, H. and Peters, B., 2012. Innovative capability and financing constraints for innovation: more money, more innovation? Review of Economics and Statistics 94(4), 1126-1142.
Hottenrott, H. and Lopes-Bento, C., 2014. (International) R&D collaboration and SMEs: The effectiveness of targeted public R&D support schemes. Research Policy 43(6), 1055-1066.
Hottenrott, H., Lins, E., and Lutz, E., 2018. Public subsidies and new ventures’ use of bank loans.
Economics of Innovation and New Technology 27, 786-808.

38
Hottenrott, H. and Richstein, R., 2020. Start-up subsidies: Does the policy instrument matter?’,
Research Policy 49(1), 103888.
Hottenrott, H., Lopes-Bento, C. and Veugelers, R., 2017. Direct and cross scheme effects in a research
and development subsidy program. Research Policy 46(6), 1118-1132.
Howell, S. T., 2017. Financing innovation: Evidence from R&D grants, American Economic Review
107(4), 1136–64.
Hsu, D.H. and Lim, K., 2014. Knowledge brokering and organizational innovation: Founder imprinting
effects. Organization Science 25(4), 1134-1153.
Huergo, E. and Trenado, M., 2010. The application for and the awarding of low-interest credits to
finance R&D projects. Review of Industrial Organization, 37(3), 237-259.
Hughes, M. and Morgan, R.E., 2007. Deconstructing the relationship between entrepreneurial
orientation and business performance at the embryonic stage of firm growth. Industrial Marketing
Management, 36(5), 651-661.
Humphreys, M.S. and Revelle, W., 1984. Personality, motivation, and performance: a theory of the
relationship between individual differences and information processing. Psychological
Review 91(2), 153.
Hurtz, G.M. and Donovan, J.J., 2000. Personality and job performance: The Big Five revisited. Journal of Applied Psychology 85(6), 869.
Kerr, S.P., Kerr, W.R., and Xu, T. 2017. Personality traits of entrepreneurs: A review of recent literature. Available from:
https://www.nber.org/system/files/working_papers/w24097/w24097.pdf. Accessed:
11/12/2020.
Krueger, N. and Sussan, F., 2017. Person-level entrepreneurial orientation: clues to the 'entrepreneurial
mindset'? International Journal of Business and Globalisation 18(3), 382-395.
Laursen, K. and Salter, A., 2006. Open for innovation: the role of openness in explaining innovation
performance among UK manufacturing firms. Strategic Management Journal 27(2), 131-150.
Lumpkin, G.T. and Dess, G.G., 1996. Clarifying the entrepreneurial orientation construct and linking
it to performance. Academy of Management Review 21(1), 135-172.
Lumpkin, G.T., Cogliser, C.C. and Schneider, D.R., 2009. Understanding and measuring autonomy:
An entrepreneurial orientation perspective. Entrepreneurship Theory and Practice 33(1), 47-69.
Magro, E. and Wilson, J.R., 2019. Policy-mix evaluation: Governance challenges from new place-based
innovation policies. Research Policy 48(10), 103612.
Mai, J.E., 2016. Looking for information: A survey of research on information seeking, needs, and
behavior. Emerald Group Publishing.
Matz S., Chan Y.W.F., Kosinski M. (2016) Models of Personality. In: Tkalčič M., De Carolis B., de
Gemmis M., Odić A., Košir A. (eds) Emotions and Personality in Personalized Services. Human–
Computer Interaction Series. Springer, Cham. https://doi.org/10.1007/978-3-319-31413-6_3.

39
McAdams, D.P., 1992. The five‐factor model in personality: A critical appraisal. Journal of
Personality 60(2), 329-361.
McCrae, R. R., & Costa, P. T. (1997). Conceptions and correlates of openness to experience. In
R.Hogan, J.Johnson, & S.Briggs (Eds.), Handbook of Personality Psychology (pp. 825–847). San
Diego, CA: Academic Press.
McCrae, R.R. and John, O.P., 1992. An introduction to the five‐factor model and its
applications. Journal of Personality 60(2).
McKenny, A.F., Aguinis, H., Short, J.C. and Anglin, A.H., 2018. What doesn’t get measured does exist:
Improving the accuracy of computer-aided text analysis. Journal of Management 44(7), 2909-2933.
Mina, A., Di Minin, A., Martelli, I., Testa, G. and Santoleri, P., 2021. Public funding of innovation:
Exploring applications and allocations of the European SME Instrument. Research Policy 50(1),
104131.
Mousa, F.T., Wales, W.J. and Harper, S.R., 2015. When less is more: EO's influence upon funds raised
by young technology firms at IPO. Journal of Business Research 68(2), 306-313.
Ostgaard, T. A. and Birley, S., 1994. Personal networks and firm competitive strategy—a strategic or
coincidental match? Journal of Business Venturing 9(4), 281–305.
Pearce, J.A., Fritz, D.A. and Davis, P.S., 2010. Entrepreneurial orientation and the performance of
religious congregations as predicted by rational choice theory. Entrepreneurship Theory and
Practice 34(1), 219-248.
Pianesi, F., Mana, N., Cappelletti, A., Lepri, B. and Zancanaro, M., 2008, October. Multimodal
recognition of personality traits in social interactions. In Proceedings of the 10th international conference on Multimodal interfaces, 53-60.
Putniņš, T.J. and Sauka, A., 2020. Why does entrepreneurial orientation affect company
performance? Strategic Entrepreneurship Journal 14(4), 711-735.
Rauch, A., & Frese, A. 2000. Psychological approaches to entrepreneurial success: A general model
and an overview of findings. In C. L. Cooper & I. T. Robertson (Eds.), International review of industrial and organizational psychology (pp. 100–135). Chichester Sussex: Wiley.
Rauch, A. and Frese, M., 2007. Let's put the person back into entrepreneurship research: A meta-analysis on the relationship between business owners' personality traits, business creation, and
success. European Journal of Work and Organizational Psychology 16(4), 353-385.
Rauch, A., Wiklund, J., Lumpkin, G.T. and Frese, M., 2009. Entrepreneurial orientation and business
performance: An assessment of past research and suggestions for the future. Entrepreneurship
Theory and Practice 33(3), 761-787.
Roccas, S., Sagiv, L., Schwartz, S.H. and Knafo, A., 2002. The big five personality factors and personal
values. Personality and Social Psychology Bulletin 28(6), 789-801.
Rojas, F. and Huergo, E., 2016. Characteristics of entrepreneurs and public support for NTBFs. Small
Business Economics 47(2), 363-382.
Roodman, D. 2011. Estimating fully observed recursive mixed-process models with cmp. Stata Journal
11(2), 159-206.

40
Rosenbusch, N., Rauch, A. and Bausch, A., 2013. The mediating role of entrepreneurial orientation in
the task environment–performance relationship: A meta-analysis. Journal of Management 39(3),
633-659.
Santamaría, L., Barge-Gil, A. and Modrego, A., 2010. Public selection and financing of R&D
cooperative projects: Credit versus subsidy funding. Research Policy 39(4), 549-563.
Saucier, G. and Goldberg, L.R., 1998. What is beyond the Big Five?. Journal of Personality 66, 495-
524.
Shane, S. and Stuart, T., 2002. Organizational endowments and the performance of university start-ups. Management Science 48(1), 154-170.
Short, J. C., Broberg, J. C., Cogliser, C. C., & Brigham, K. H. (2010). Construct validation using computer-aided text analysis (CATA): An illustration using entrepreneurial orientation.
Organizational Research Methods 13, 320–347.
Smith, M.B., Hill, A.D., Wallace, J.C., Recendes, T. and Judge, T.A., 2018. Upsides to dark and
downsides to bright personality: A multidomain review and future research agenda. Journal of
Management 44(1), 191-217.
Söderblom, A., Samuelsson, M., Wiklund, J. and Sandberg, R. 2015. Inside the black box of outcome
additionality: Effects of early-stage government subsidies on resource accumulation and new venture performance. Research Policy 44(8), 1501 – 1512.
State of European Tech. 2020. Investments by Geography & Industry. Available from:
https://2020.stateofeuropeantech.com/chapter/investments/article/investments-geo-
industry/. Accessed (04/01/2021).
van Praag, C. M. and Versloot, P. H., 2007. What is the value of entrepreneurship? A review of recent
research. Small Business Economics 29, 351–382.
Vaznyte, E. and Andries, P., 2019. Entrepreneurial orientation and start-ups' external financing. Journal
of Business Venturing 34(3), 439-458.
Wales, W.J., Covin, J.G. and Monsen, E., 2020. Entrepreneurial orientation: The necessity of a
multilevel conceptualization. Strategic Entrepreneurship Journal 14, 639– 660.
Wennekers, S. and Thurik, R., 1999. Linking entrepreneurship and economic growth. Small Business
Economics 13(1), 27-56.
Winter, D. G., John, O. P., Stewart, A. J., Klohnen, E. C., & Duncan, L. E., 1998. Traits and motives: Toward and integration of two traditions in personality research. Psychological Review 105, 230-
250.
Yin, M., Hughes, M. and Hu, Q., 2020. Entrepreneurial orientation and new venture resource
acquisition: why context matters. Asia Pacific Journal of Management, 1-30.
Zhao, B. and Ziedonis, R., 2020. State governments as financiers of technology start-ups: Evidence
from Michigan’s R&D loan program, Research Policy 49(4), 103926.
Zhao, H. and Seibert, S.E., 2006. The big five personality dimensions and entrepreneurial status: A meta-analytical review. Journal of Applied Psychology 91(2), 259.

41
Zhao, H., Seibert, S.E. and Lumpkin, G.T., 2010. The relationship of personality to entrepreneurial intentions and performance: A meta-analytic review. Journal of Management 36(2), 381-404.

42
Appendix A:
Table A.1: Personality survey questions Big 5 measures (OCEAN)
Openness
Item 1: I am someone who is original and who brings up new ideas.
Item 2: I am someone who values artistic experiences.
Item 3: I am someone who has vivid fantasies and a good imagination.
Conscientiousness
Item 4: I am someone who works thoroughly.
Item 5: I am someone who is rather lazy.
Item 6: I am someone who gets things done effectively and efficiently.
Extraversion
Item 7: I am someone who is communicative and talkative
Item 8: I am someone who can get out and be sociable.
Item 9: I am someone who is reserved.
Agreeableness
Item 10: I am someone who is at times a little rude to others.
Item 11: I am someone who can forgive.
Item 12: I am someone who is considerate and kind to others.
Neuroticism
Item 13: I am someone who worries often.
Item 14: I am someone who gets nervous easily. Item 15: I am someone who is relaxed and can handle stress well. Note: Original questions presented in German. Likert scale from 1 to 5 [1: does not apply to me at all, and 5: fully applies to me]; items 5, 9, 10, 15 enter the analysis in reversed scale.

43
Table A.2: Entrepreneurial Orientation survey questions
Risk tolerance
Item 1: In order to achieve
corporate goals even in uncertain situations, my
company proceeds…
a) ...rather cautiously, in a wait
and see approach, in order to avoid wrong decisions.
b) ...rather bravely and
aggressively so as not to miss any business opportunities.
Item 2: My company has a
strong inclination for projects with...
a) ...low risk and thus normal
but secure returns.
b)...high risk and thus
opportunities for very high returns.
Proactiveness Item 3: In dealing with the
competition, my company
pursues the strategy…
a)… of reacting to the actions
of competitors.
b)… of taking the initiative
itself, to which competitors
must then react.
Item 4: When introducing new products or services, business
processes or technologies, in
my market environment…
a)… I do not necessarily want to be one of the first with my
company.
b)… I want to be one of the first with my company
Autonomy
Item 5: I generally believe that the best results come about
when …
a) … employees have a say in which business ideas and
projects are pursued.
A: b)… as Managing Director, I alone decide which business
ideas and projects are pursued.
Item 6: In my company … a) … employees make
decisions on their own without constantly checking back with
me.
b)… Employees must always
check with me when making decisions.
B:
Innovativeness
Item 7: My strategy is to make
changes to my products or services …
a)… in a small and
incremental way.
b)… that are as far-reaching
and fundamental.
Item 8: My company focuses
on…
a)… marketing proven
products or services.
b)… innovation, technology
leadership and research and
development.
Competitiveness
Item 9: My company … a)… does not make any specific efforts to win sales
from competitors.
b)… is very aggressive and competitive.
Item 10: My company … A: a)… avoids conflicts with
competitors whenever possible and follows the motto "live
and let live".
A: b)… does not shy away from
conflict in order to challenge competitors’ market positions.
Note: Original questions presented in German. Likert scale from 1 to 5 [1: completely a), 2: rather a), 3: undecided, 4: rather b), 5: completely b].

44
Table A.3: Factor analysis personality traits (Big 5)
Factor Eigenvalue Difference Proportion Cumulative Factor1 2.803 1.150 0.187 0.187 Factor2 1.653 0.018 0.110 0.297 Factor3 1.635 0.239 0.109 0.406 Factor4 1.396 0.275 0.093 0.499 Factor5 1.121 0.236 0.075 0.574 Factor6 0.885 0.070 0.059 0.633 Factor7 0.815 0.096 0.054 0.687 Factor8 0.719 0.046 0.048 0.735 Factor9 0.673 0.037 0.045 0.780 Factor10 0.636 0.045 0.042 0.822 Factor11 0.592 0.039 0.040 0.862 Factor12 0.553 0.011 0.037 0.899 Factor13 0.542 0.038 0.036 0.935 Factor14 0.504 0.032 0.034 0.969 Factor15 0.472 . 0.032 1.000 Note: LR test: independent vs. saturated: chi2(105) = 13,000 Prob>chi2 = 0.000.
Table A.4: Rotated factor loadings (pattern matrix) and unique variances
Variable Factor1 Factor2 Factor3 Factor4 Factor5 Uniqueness Openness 1 0.063 0.732 0.082 -0.118 -0.117 0.411 Openness 2 -0.156 0.713 -0.175 0.136 0.076 0.487 Openness 3 0.053 0.796 -0.021 -0.097 -0.031 0.367 Conscientiousnes
s 1
-0.092 -0.049 0.820 0.054 0.076 0.340 Conscientiousnes
s 2
0.054 -0.181 0.662 -0.016 -0.046 0.567 Conscientiousnes
s 3
-0.003 0.060 0.787 -0.112 -0.066 0.384 Extraversion 1 0.774 0.068 0.022 0.160 0.067 0.332 Extraversion 2 0.791 0.024 -0.004 0.131 0.100 0.355 Extraversion 3 0.738 -0.124 -0.092 -0.241 -0.134 0.389 Agreeableness 1 -0.018 -0.155 -0.089 0.786 -0.162 0.404 Agreeableness 2 0.148 0.139 -0.034 0.483 -0.033 0.694 Agreeableness 3 0.109 0.055 0.104 0.735 0.068 0.361 Neuroticism 1 0.004 0.025 0.134 0.023 0.751 0.419 Neuroticism 2 0.025 -0.009 -0.069 -0.019 0.779 0.391 Neuroticism 3 0.057 -0.160 -0.109 -0.228 0.641 0.490
Table A.5: Factor analysis entrepreneurial orientation Factor Eigenvalue Difference Proportion Cumulative Factor1 2.512 1.274 0.251 0.251 Factor2 1.238 0.143 0.124 0.375 Factor3 1.095 0.144 0.110 0.485 Factor4 0.951 0.089 0.095 0.580 Factor5 0.863 0.069 0.086 0.666 Factor6 0.793 0.054 0.079 0.745 Factor7 0.739 0.062 0.074 0.819 Factor8 0.677 0.108 0.068 0.887 Factor9 0.569 0.008 0.057 0.944 Factor10 0.561 . 0.056 1.000 Note: LR test: independent vs. saturated: chi2(45) = 1.2e+04 Prob>chi2 = 0.000.
Table A.6: Rotated factor loadings (pattern matrix) and unique variances (entrepreneurial orientation) Variable Factor1 Factor2 Factor3 Factor4 Factor5 Uniqueness Proactiveness 1 0.003 -0.028 0.054 0.921 0.007 0.148 Proactiveness 2 0.593 0.092 -0.147 0.349 0.022 0.444 Innovativeness 1 0.786 -0.102 0.036 0.052 -0.054 0.375 Innovativeness 2 0.691 0.031 0.174 -0.217 0.034 0.436 Competitiveness 1 -0.065 0.847 -0.017 0.064 -0.004 0.291 Competitiveness 2 -0.021 0.859 0.018 -0.126 -0.003 0.295 Risk tolerance 1 -0.047 0.093 0.776 0.146 -0.007 0.320 Risk tolerance 2 0.288 -0.003 0.687 -0.072 0.019 0.358 Autonomy 1 -0.111 -0.065 0.238 0.025 0.796 0.317 Autonomy 2 0.119 0.066 -0.296 -0.015 0.744 0.357

45
Table A.7: Description of variables
Name Unit of Measurement Description
Subsidy Indicators
Any subsidy Binary (yes/no) Takes the value one if firm received a public
grant, subsidized loan or loan guarantees
Grant Binary (yes/no) Takes the value one if firm received a public grant Subsidized Loan Binary (yes/no) Takes the value one if firm received a subsidized
loan or loan guarantees
Other financing sources Venture Capital Binary (yes/no) Takes the value one if the firm received some
form of venture capital in the reference year
Bank financing Binary (yes/no) Takes the value one if the firm finances its
business activities (at least partly) with commercial bank loans
Family & Friends Binary (yes/no) Takes the value one if the firm finances its
business activities (at least partly) with money borrowed from family members or friends
Controls
Profit Binary (yes/no) Takes the value one if the firm is at least at break even or makes profits in the reference year. Zero
in case of a financial loss.
Experience Years Number of years founder has worked in the same
industry as the startup ln(R&D expenditures) Euros Amount spent on R&D in the reference year
Failure experience Binary (yes/no) Takes the value one of founder had a previous
firm that closed due to liquidation or bankruptcy Restarter Binary (yes/no) Takes the value one if founder had previously
founded a firm
ln(employees) Head count Total number of employees (excluding members of the founding team)
Female Binary (yes/no) Takes the value one if at least one person in the
founding team is female
Opportunity driven Binary (yes/no) Takes the value one of the founder indicated to have founded the firm to pursue a specific
business idea, to exploit opportunity of higher
earnings, or to pursue the opportunity to work independently and self-determined.
Academic Binary (yes/no) Takes the value one if at least one the founders
has a university degree
Founder age Years Average founder age in the firm Team Binary (yes/no) Takes the value one if the firm was founded by
more than one person
Exporter Binary (yes/no) Takes the value one if the firm has sales outside of Germany
East Germany Binary (yes/no) Takes the value one if the firm’s location is in one
of the five eastern German states Cohort (firm age) Years Founding year 2017 takes the value 1 and the
earliest year takes the value eight
Limited liability Binary (yes/no) Takes the value one if the firm is a limited
liability company Industry indicators Binary (yes/no) Distinguishes between 11 different
sectors of activity. See Table A7
below for details.

46
Table A.8: Pairwise correlations (Big 5 Sample) Variables (1) (2) (3) (4) (5) (6) (7) (8) (9) (10) (11) (12) (13) (14) (15) (16) (17) (18)
(1) Extraversion 1.000 (2) Conscientiousness 0.156 1.000 (3) Openness 0.221 0.074 1.000 (4) Neuroticism -0.122 -0.070 -0.026 1.000 (5) Agreeableness 0.097 0.207 0.176 -0.128 1.000 (6) Industry experience -0.070 0.030 -0.024 0.009 0.003 1.000 (7) ln(R&D) -0.005 -0.097 0.128 -0.088 -0.035 0.011 1.000
(8) Failure experience 0.010 0.002 0.031 -0.008 -0.023 -0.025 -0.038 1.000 (9) Serial entrepreneur 0.012 -0.102 0.066 -0.053 -0.039 0.106 0.172 0.217 1.000 (10) ln(employees) 0.040 -0.034 -0.020 -0.002 -0.034 0.081 0.222 -0.062 0.111 1.000 (11) Female 0.050 0.059 0.052 0.072 0.071 -0.061 -0.068 -0.040 -0.043 0.005 1.000 (12) Opportunity driven 0.046 0.009 0.039 -0.061 0.027 -0.086 0.063 -0.002 0.079 0.032 0.020 1.000 (13) University degree -0.052 -0.139 0.006 -0.098 -0.038 -0.024 0.264 -0.022 0.169 0.096 0.052 0.050 1.000 (14) Founder age -0.091 -0.037 0.009 -0.014 0.030 0.570 0.079 -0.007 0.267 0.065 0.055 -0.085 0.206 1.000 (15) Team -0.032 -0.076 0.006 -0.018 0.024 0.082 0.190 -0.094 0.218 0.307 0.180 0.054 0.275 0.191 1.000 (16) Profit 0.008 0.064 -0.100 -0.028 -0.017 0.100 -0.161 -0.040 -0.098 0.034 -0.030 -0.050 -0.069 -0.032 -0.044 1.000
(17) Exporter -0.009 -0.071 0.027 -0.048 -0.063 0.018 0.294 -0.052 0.078 0.164 -0.034 0.017 0.198 0.093 0.129 0.021 1.000 (18) East Germany -0.009 0.003 -0.021 0.031 -0.005 -0.022 -0.003 -0.007 0.001 0.007 0.000 0.010 -0.023 -0.025 -0.014 0.022 -0.053 1.000 (19) Limited liability -0.046 -0.122 0.010 -0.105 -0.046 0.060 0.333 -0.013 0.302 0.281 -0.036 0.058 0.340 0.208 0.276 -0.187 0.228 -0.063
Table A.9: Pairwise correlations (EO sample) Variables (1) (2) (3) (4) (5) (6) (7) (8) (9) (10) (11) (12) (13) (14) (15) (16) (17) (18)
(1) Competitiveness 1.000 (2) Innovativeness 0.207 1.000 (3) Proactiveness 0.249 0.346 1.000
(4) Risk tolerance 0.284 0.374 0.281 1.000 (5) Autonomous -0.013 -0.098 -0.095 -0.085 1.000 (6) Industry experience -0.051 -0.060 -0.063 -0.114 0.023 1.000 (7) ln(R&D) 0.128 0.452 0.254 0.247 -0.090 -0.006 1.000 (8) Failure experience 0.000 0.006 0.017 0.027 -0.008 -0.021 -0.021 1.000 (9) Serial entrepreneur 0.046 0.169 0.111 0.134 -0.033 0.101 0.176 0.295 1.000 (10) ln(employees) 0.151 0.092 0.131 0.117 -0.042 0.106 0.216 -0.050 0.115 1.000 (11) Female -0.031 -0.052 -0.003 -0.039 0.018 -0.036 -0.069 -0.011 -0.019 0.036 1.000
(12) Opportunity driven 0.058 0.104 0.078 0.098 -0.020 -0.111 0.085 0.012 0.114 0.058 0.013 1.000 (13) University degree 0.088 0.220 0.136 0.180 -0.105 -0.047 0.259 -0.041 0.187 0.121 0.063 0.083 1.000 (14) Founder age -0.005 0.041 0.012 -0.045 -0.012 0.587 0.115 -0.009 0.269 0.118 0.068 -0.086 0.214 1.000 (15) Team 0.084 0.132 0.110 0.109 -0.023 0.041 0.176 0.012 0.258 0.331 0.203 0.092 0.305 0.176 1.000 (16) Profit -0.098 -0.171 -0.099 -0.136 0.023 0.126 -0.150 -0.031 -0.119 0.062 -0.037 -0.069 -0.107 -0.019 -0.081 1.000 (17) Exporter 0.092 0.165 0.110 0.111 -0.044 0.028 0.305 -0.015 0.088 0.164 -0.028 0.029 0.169 0.090 0.114 0.031 1.000 (18) East Germany -0.031 -0.035 -0.026 -0.050 0.050 0.006 -0.018 -0.002 -0.011 -0.003 -0.002 -0.013 -0.023 -0.010 -0.024 0.013 -0.058 1.000 (19) Limited liability 0.155 0.270 0.176 0.190 -0.098 0.015 0.330 0.011 0.296 0.295 -0.004 0.102 0.375 0.219 0.314 -0.192 0.222 -0.055

47
Table A.10: Subsidy status by industry (left panels: Big 5 sample, right panels: EO sample) Big 5 sample EO sample
Industry Classification subsidy subsidy
0 1 Total 0 1 Total
Cutting-edge tech manufacturing 622 197 819 209 78 287
75.95 24.05 100.00 72.82 27.18 100.00
6.85 10.17 7.43 4.27 13.24 5.23
High-tech manufacturing 508 182 690 229 49 278
73.62 26.38 100.00 82.37 17.63 100.00 5.59 9.40 6.26 4.68 8.32 5.07
Tech. services 1975 341 2316 928 103 1031
85.28 14.72 100.00 90.01 9.99 100.00
21.74 17.60 21.01 18.96 17.49 18.80
Software 828 200 1028 419 76 495
80.54 19.46 100.00 84.65 15.35 100.00
9.11 10.33 9.33 8.56 12.90 9.03
Low-tech manufacturing 934 277 1211 453 79 532
77.13 22.87 100.00 85.15 14.85 100.00
10.28 14.30 10.99 9.26 13.41 9.70
Knowledge-int. services 924 130 1054 517 21 538
87.67 12.33 100.00 96.10 3.90 100.00 10.17 6.71 9.56 10.56 3.57 9.81
Other company services 762 134 896 406 27 433
85.04 14.96 100.00 93.76 6.24 100.00
8.39 6.92 8.13 8.30 4.58 7.90
Creative services 573 121 694 389 24 413
82.56 17.44 100.00 94.19 5.81 100.00
6.31 6.25 6.30 7.95 4.07 7.53
Other services 363 37 400 344 32 376
90.75 9.25 100.00 91.49 8.51 100.00
4.00 1.91 3.63 7.03 5.43 6.86
Construction 983 217 1200 531 46 577 81.92 18.08 100.00 92.03 7.97 100.00
10.82 11.20 10.89 10.85 7.81 10.52
Trade 614 101 715 469 54 523
85.87 14.13 100.00 89.67 10.33 100.00
6.76 5.21 6.49 9.58 9.17 9.54
Total 9086 1937 11023 4894 589 5483
82.43 17.57 100.00 89.26 10.74 100.00
100.00 100.00 100.00 100.00 100.00 100.00
First row has frequencies; second row has row percentages and third row has column percentages
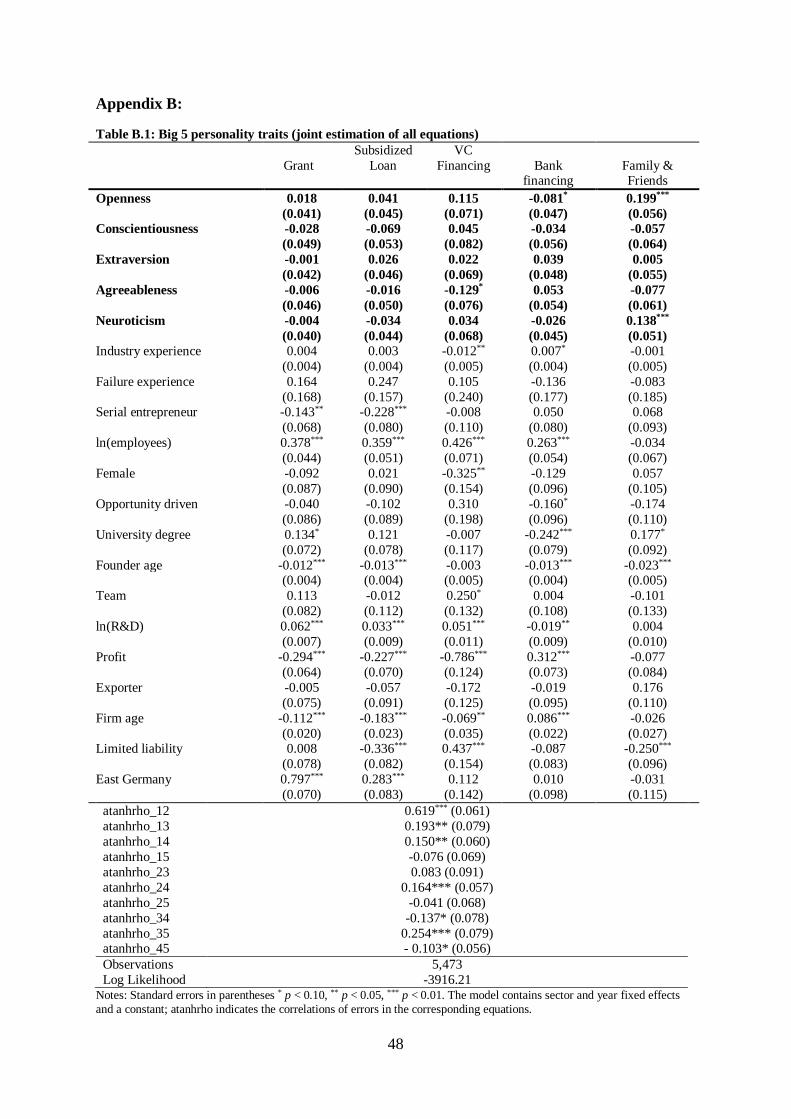
48
Appendix B:
Table B.1: Big 5 personality traits (joint estimation of all equations)
Subsidized VC
Grant Loan Financing Bank financing
Family & Friends
Openness 0.018 0.041 0.115 -0.081* 0.199***
(0.041) (0.045) (0.071) (0.047) (0.056)
Conscientiousness -0.028 -0.069 0.045 -0.034 -0.057
(0.049) (0.053) (0.082) (0.056) (0.064)
Extraversion -0.001 0.026 0.022 0.039 0.005
(0.042) (0.046) (0.069) (0.048) (0.055)
Agreeableness -0.006 -0.016 -0.129* 0.053 -0.077
(0.046) (0.050) (0.076) (0.054) (0.061)
Neuroticism -0.004 -0.034 0.034 -0.026 0.138***
(0.040) (0.044) (0.068) (0.045) (0.051)
Industry experience 0.004 0.003 -0.012** 0.007* -0.001
(0.004) (0.004) (0.005) (0.004) (0.005)
Failure experience 0.164 0.247 0.105 -0.136 -0.083
(0.168) (0.157) (0.240) (0.177) (0.185) Serial entrepreneur -0.143** -0.228*** -0.008 0.050 0.068
(0.068) (0.080) (0.110) (0.080) (0.093)
ln(employees) 0.378*** 0.359*** 0.426*** 0.263*** -0.034
(0.044) (0.051) (0.071) (0.054) (0.067)
Female -0.092 0.021 -0.325** -0.129 0.057
(0.087) (0.090) (0.154) (0.096) (0.105)
Opportunity driven -0.040 -0.102 0.310 -0.160* -0.174
(0.086) (0.089) (0.198) (0.096) (0.110)
University degree 0.134* 0.121 -0.007 -0.242*** 0.177*
(0.072) (0.078) (0.117) (0.079) (0.092)
Founder age -0.012*** -0.013*** -0.003 -0.013*** -0.023*** (0.004) (0.004) (0.005) (0.004) (0.005)
Team 0.113 -0.012 0.250* 0.004 -0.101
(0.082) (0.112) (0.132) (0.108) (0.133)
ln(R&D) 0.062*** 0.033*** 0.051*** -0.019** 0.004
(0.007) (0.009) (0.011) (0.009) (0.010)
Profit -0.294*** -0.227*** -0.786*** 0.312*** -0.077
(0.064) (0.070) (0.124) (0.073) (0.084)
Exporter -0.005 -0.057 -0.172 -0.019 0.176
(0.075) (0.091) (0.125) (0.095) (0.110)
Firm age -0.112*** -0.183*** -0.069** 0.086*** -0.026
(0.020) (0.023) (0.035) (0.022) (0.027) Limited liability 0.008 -0.336*** 0.437*** -0.087 -0.250***
(0.078) (0.082) (0.154) (0.083) (0.096)
East Germany 0.797*** 0.283*** 0.112 0.010 -0.031
(0.070) (0.083) (0.142) (0.098) (0.115)
atanhrho_12 0.619*** (0.061)
atanhrho_13 0.193** (0.079)
atanhrho_14 0.150** (0.060)
atanhrho_15 -0.076 (0.069)
atanhrho_23 0.083 (0.091)
atanhrho_24 0.164*** (0.057)
atanhrho_25 -0.041 (0.068)
atanhrho_34 -0.137* (0.078)
atanhrho_35 0.254*** (0.079) atanhrho_45 - 0.103* (0.056)
Observations 5,473
Log Likelihood -3916.21 Notes: Standard errors in parentheses * p < 0.10, ** p < 0.05, *** p < 0.01. The model contains sector and year fixed effects
and a constant; atanhrho indicates the correlations of errors in the corresponding equations.

49
Table B.2: Entrepreneurial Orientation (joint estimation of all equations)
Grant Subsidized
Loan
VC
Financing
Bank
Financing
Family &
Friends
Competitiveness 0.011 0.064*** 0.049** 0.019 -0.012
(0.013) (0.014) (0.022) (0.016) (0.018)
Innovativeness 0.027* -0.010 0.076*** -0.038* -0.004
(0.015) (0.017) (0.026) (0.020) (0.022)
Proactiveness 0.047*** 0.034* 0.015 0.041** 0.002
(0.016) (0.018) (0.032) (0.021) (0.023)
Risk preference 0.005 0.020 0.051** -0.006 0.045**
(0.015) (0.016) (0.025) (0.018) (0.020)
Autonomy -0.008 -0.018 0.010 0.001 0.020
(0.014) (0.016) (0.026) (0.018) (0.020)
Industry experience -0.002 0.002 -0.009*** 0.008*** -0.004
(0.002) (0.002) (0.003) (0.003) (0.003)
Failure experience 0.296*** 0.064 -0.378*** 0.139 0.071
(0.071) (0.080) (0.140) (0.087) (0.095)
Serial entrepreneur -0.291*** -0.191*** 0.053 -0.036 -0.044
(0.041) (0.047) (0.068) (0.052) (0.059)
ln(employees) 0.297*** 0.279*** 0.342*** 0.392*** -0.080* (0.028) (0.032) (0.048) (0.035) (0.043)
Female 0.035 -0.001 -0.066 -0.048 0.099
(0.046) (0.052) (0.080) (0.058) (0.063)
Opportunity driven -0.087* 0.007 0.055 -0.035 -0.117*
(0.046) (0.053) (0.103) (0.061) (0.067)
University degree 0.096** -0.091** 0.248*** -0.205*** -0.086
(0.041) (0.046) (0.075) (0.052) (0.057)
Founder age -0.004* -0.010*** -0.004 -0.006** -0.014***
(0.002) (0.002) (0.003) (0.003) (0.003)
Team 0.035 0.124*** 0.199*** 0.049 -0.001
(0.041) (0.046) (0.066) (0.052) (0.060) ln(R&D) 0.038*** 0.011** 0.036*** -0.018*** 0.015**
(0.004) (0.005) (0.007) (0.006) (0.006)
Profit -0.205*** -0.195*** -0.577*** 0.112** -0.137***
(0.037) (0.041) (0.071) (0.046) (0.051)
Exporter 0.107** 0.104** 0.107 0.109* 0.093
(0.044) (0.052) (0.073) (0.059) (0.066)
Firm age -0.074*** -0.120*** -0.068*** 0.083*** 0.018
(0.012) (0.015) (0.026) (0.016) (0.019)
Limited liability -0.121*** -0.229*** 0.321*** -0.155*** -0.281***
(0.043) (0.048) (0.093) (0.054) (0.060)
East Germany 0.558*** 0.080 -0.015 0.002 -0.033 (0.043) (0.054) (0.087) (0.062) (0.069)
atanhrho_12 0.480*** (0.032)
atanhrho_13 0.107** (0.044)
atanhrho_14 0.095*** (0.033)
atanhrho_15 0.044 (0.036)
atanhrho_23 0.066 (0.047)
atanhrho_24 0.253*** (0.032)
atanhrho_25 0.014 (0.037)
atanhrho_34 0.053 (0.043)
atanhrho_35 0.087* (0.048)
atanhrho_45 -0.066* (0.034)
Observations 11,017
Log Likelihood -11,221.53 Standard errors in parentheses * p < 0.10, ** p < 0.05, *** p < 0.01. The model contains year and sector fixed effects and a constant; atanhrho indicates the correlations of errors in the corresponding equations.

50
Table B.3: Big 5 personality traits and different sources of financing (predicted scores from factor
analysis; joint estimation)
Grant Subsidized
Loan
VC
financing
Bank
financing
Family &
Friends
Factor Score Openness 0.021 0.037 0.095* -0.063* 0.145***
(0.033) (0.036) (0.057) (0.038) (0.045)
Factor Score Conscientiousness -0.018 -0.045 0.026 -0.018 -0.051
(0.032) (0.036) (0.055) (0.037) (0.043)
Factor Score Extraversion -0.001 0.016 0.005 0.034 -0.009
(0.032) (0.035) (0.053) (0.036) (0.042)
Factor Score Agreeableness -0.011 -0.034 0.034 -0.017 0.119***
(0.031) (0.034) (0.052) (0.035) (0.039)
Factor Score Neuroticism -0.022 -0.002 -0.090* 0.042 -0.057
(0.030) (0.033) (0.050) (0.036) (0.042)
Observations 5,431
Log Likelihood -3,894.03 Standard errors in parentheses. * p < 0.10, ** p < .05, *** p < 0.01. The model contains the same set of variables as in the full joint estimations presented in Table B.1.
Table B.4: EO personality and different sources of financing (predicted scores from factor analysis; joint
estimation)
Grant Subsidized
Loan
VC
financing
Bank
financing
Family &
Friends
Factor Score Competitiveness 0.013 0.093*** 0.068** 0.033 -0.007
(0.018) (0.020) (0.031) (0.023) (0.025)
Factor Score Innovativeness 0.047** 0.006 0.112*** -0.047* 0.020
(0.020) (0.023) (0.035) (0.025) (0.028)
Factor Score Proactiveness 0.052*** 0.026 0.000 0.052** -0.002
(0.018) (0.020) (0.035) (0.023) (0.025)
Factor Score Risk tolerance 0.011 0.018 0.063** -0.007 0.032
(0.018) (0.020) (0.031) (0.023) (0.025)
Factor Score Autonomy -0.007 -0.021 0.010 0.003 0.021
(0.017) (0.019) (0.031) (0.021) (0.024)
Observations 11,017
Log Likelihood -11,222.086 Standard errors in parentheses. * p < 0.10, ** p < .05, *** p < 0.01. The model contains the same set of variables as in the full joint estimations presented in Table B.2.

51
Table B.5: Big5 personality traits and different sources of financing (selection model; joint estimation of
second stage)
Selection
Stage
Grant Subsidized
Loan
VC
financing
Bank
financing
Family &
Friends
Openness 0.075*** -0.010 -0.043 0.115 -0.166*** 0.181***
(0.027) (0.071) (0.064) (0.078) (0.055) (0.062)
Conscientiousness -0.026 -0.016 -0.058 0.106 -0.014 -0.047
(0.032) (0.078) (0.070) (0.098) (0.069) (0.075)
Extraversion 0.000 -0.044 -0.023 -0.032 0.052 -0.013
(0.027) (0.068) (0.066) (0.079) (0.055) (0.061)
Agreeableness -0.033 -0.021 0.006 -0.153* 0.061 -0.106
(0.030) (0.074) (0.077) (0.090) (0.064) (0.073)
Neuroticism 0.023 0.085 -0.017 0.017 -0.063 0.152***
(0.026) (0.066) (0.062) (0.083) (0.056) (0.058)
Profit -0.567*** -0.194* -0.114 -0.833*** 0.364*** -0.107
(0.042) (0.109) (0.112) (0.138) (0.091) (0.101)
Industry experience -0.007*** 0.007 0.012** -0.016*** 0.010** -0.001
(0.002) (0.006) (0.006) (0.006) (0.005) (0.006)
ln(R&D) 0.029*** 0.059*** 0.026** 0.056*** -0.024** 0.006
(0.005) (0.012) (0.013) (0.011) (0.010) (0.011) Failure experience 0.105 0.263 0.115 -0.093 -0.223 -0.195
(0.107) (0.249) (0.222) (0.269) (0.216) (0.204)
ln(employees) 0.243*** 0.304*** 0.201*** 0.360*** 0.156** -0.170**
(0.032) (0.071) (0.077) (0.081) (0.063) (0.075)
Opportunity driven 0.086 0.155 0.063 0.400* -0.061 -0.121
(0.085) (0.159) (0.131) (0.219) (0.115) (0.126)
Founder age -0.004 -0.011* -0.015** 0.003 -0.007 -0.021***
(0.002) (0.007) (0.007) (0.006) (0.005) (0.006)
Female 0.008 -0.014 0.101 -0.348** -0.140 0.064
(0.055) (0.140) (0.133) (0.149) (0.107) (0.121)
University degree -0.061 0.234** 0.296** 0.064 -0.240** 0.228** (0.047) (0.118) (0.116) (0.124) (0.093) (0.105)
Team -0.050 0.085 -0.213 0.237* -0.097 -0.199
(0.059) (0.131) (0.168) (0.143) (0.119) (0.151)
Serial entrepreneur 0.016 -0.330*** -0.114 0.070 0.112 0.138
(0.045) (0.114) (0.118) (0.121) (0.090) (0.109)
Exporter 0.068 -0.105 -0.114 -0.223 -0.068 0.132
(0.053) (0.127) (0.137) (0.142) (0.111) (0.122)
East Germany 0.073 0.782*** 0.367*** 0.103 -0.043 -0.181
(0.056) (0.122) (0.122) (0.159) (0.108) (0.129)
Firm age -0.074*** -0.102*** -0.179*** -0.099*** 0.072*** -0.040
(0.013) (0.032) (0.036) (0.038) (0.026) (0.030) Limited liability -0.056 0.072 -0.339*** 0.513*** -0.047 -0.241**
(0.048) (0.121) (0.125) (0.161) (0.103) (0.113)
ER: Unemployed 0.195**
(0.094)
Observations 5,483
Log Likelihood -5.3e+03 Standard errors in parentheses * p < 0.10, ** p < 0.05, *** p < 0.01. The model contains year and sector fixed effects and a constant; atanhrho indicating the correlations of errors in the corresponding equations are omitted from this table.

52
Table B.6: EO personality and different sources of financing (selection model; joint estimation of second
stage)
Selection
Stage
Grant Subsidized
Loan
VC financing Bank
financing
Family &
Friends
Competitiveness 0.053*** 0.007 0.044** 0.037 0.008 -0.026
(0.010) (0.020) (0.020) (0.025) (0.019) (0.020)
Innovativeness 0.024* 0.047** 0.004 0.102*** -0.048** -0.003
(0.012) (0.023) (0.025) (0.030) (0.023) (0.024)
Proactiveness 0.040*** 0.022 0.010 0.014 0.022 -0.017
(0.013) (0.026) (0.027) (0.035) (0.024) (0.026)
Risk tolerance 0.051*** -0.016 -0.009 0.031 -0.013 0.035
(0.012) (0.022) (0.023) (0.028) (0.022) (0.023)
Autonomy -0.007 -0.016 -0.017 0.002 -0.006 0.016
(0.011) (0.022) (0.024) (0.031) (0.022) (0.023)
Profit -0.548*** -0.141** -0.067 -0.570*** 0.199*** -0.083
(0.029) (0.061) (0.066) (0.081) (0.057) (0.061)
Industry experience -0.003** 0.002 0.007* -0.009** 0.010*** -0.004
(0.002) (0.003) (0.004) (0.004) (0.003) (0.004)
ln(R&D) 0.023*** 0.029*** 0.001 0.028*** -0.023*** 0.010
(0.004) (0.007) (0.007) (0.008) (0.007) (0.007) Failure experience 0.070 0.361*** 0.006 -0.492*** 0.165 -0.013
(0.058) (0.106) (0.112) (0.161) (0.105) (0.109)
ln(employees) 0.260*** 0.182*** 0.198*** 0.237*** 0.325*** -0.263***
(0.023) (0.045) (0.049) (0.053) (0.043) (0.051)
Opportunity driven 0.024 -0.092 0.015 0.140 -0.011 -0.108
(0.056) (0.072) (0.078) (0.116) (0.073) (0.076)
Founder age -0.004** -0.004 -0.011*** -0.003 -0.004 -0.015***
(0.002) (0.003) (0.004) (0.004) (0.003) (0.004)
Female 0.012 0.004 -0.089 -0.048 -0.089 0.119
(0.038) (0.073) (0.077) (0.093) (0.070) (0.076)
University degree -0.021 0.207*** -0.025 0.284*** -0.188*** -0.052 (0.034) (0.065) (0.069) (0.087) (0.064) (0.066)
Team -0.006 0.125* 0.139** 0.216*** 0.016 -0.028
(0.033) (0.065) (0.069) (0.078) (0.063) (0.068)
Serial entrepreneur 0.016 -0.381*** -0.243*** 0.111 0.005 -0.008
(0.032) (0.066) (0.067) (0.074) (0.063) (0.067)
Exporter 0.031 0.016 0.075 0.130 0.065 0.110
(0.037) (0.072) (0.072) (0.083) (0.069) (0.073)
East Germany 0.022 0.590*** 0.113 -0.024 -0.017 -0.079
(0.040) (0.070) (0.080) (0.106) (0.076) (0.080)
Firm age -0.058*** -0.080*** -0.137*** -0.105*** 0.042** -0.012
(0.010) (0.020) (0.022) (0.028) (0.018) (0.021) Limited liability -0.192*** -0.067 -0.137* 0.421*** -0.055 -0.210***
(0.034) (0.069) (0.073) (0.099) (0.067) (0.071)
ER: Unemployed 0.141**
(0.064)
Observations 11,023
Log Likelihood -1.3e+04 Standard errors in parentheses * p < 0.10, ** p < 0.05, *** p < 0.01. The model contains year and sector fixed effects and a constant; atanhrho indicating the correlations of errors in the corresponding equations are omitted from this table.