foundations of invasive hemodynamics
TRANSCRIPT

Principles of Invasive Hemodynamics
Contact Hours: 1.0 First Published: April 17, 2013
Course revise: December 18, 2016 Course Expires: December 30, 2019
Copyright © 2016 by RN.com All Rights Reserved
Reproduction and distribution of these materials are prohibited without the express
written authorization of RN.com
Acknowledgements RN.com acknowledges the valuable contributions of… …Suzan Miller-Hoover DNP, RN, CCNS, CCRN Conflicts of Interest and Commercial Support RN.com strives to present content in a fair and unbiased manner at all times, and has a full and fair disclosure policy that requires course faculty to declare any real or apparent commercial affiliation related to the content of this presentation. Note: Conflict of Interest is defined by ANCC as a situation in which an individual has an opportunity to affect educational content about products or services of a commercial interest with which he/she has a financial relationship. The author of this course does not have any conflict of interest to declare. The planners of the educational activity have no conflicts of interest to disclose. There is no commercial support being used for this course. Purpose The purpose of this course is to inform the healthcare provider about the fundamentals of hemodynamic monitoring and the devices used to evaluate these vital functions. Learning Objectives After successful completion of this course, you will be able to:
1. Discuss the indications for invasive hemodynamic monitoring. 2. Delineate hemodynamic values for pulmonary artery catheter, arterial line, and central
venous pressure monitoring. 3. Describe three steps to ensure waveform accuracy. 4. Compare preload, afterload, and contractility when determining cardiac function.
Introduction Hemodynamics is a term to describe intravascular pressure, oxygenation, and blood flow occurring within the cardiovascular system.
Hemodynamic monitoring is an essential part of critical care nursing. The primary goals of hemodynamic monitoring are to:
• Maintain adequate tissue perfusion by assessing the body’s response to tissue oxygen demands
• Alert the healthcare team of an impending cardiovascular crisis before organ injury occur
• Evaluate immediate response to treatment modalities
Because organ blood flow cannot be directly measured; non-invasive and invasive mechanical methods must be used. These non-invasive and invasive methods include manual blood pressure, arterial blood pressure, central venous pressure, left atrial pressure, pulmonary wedge pressure, SVO2, and cardiac output measurement. Using non-invasive and invasive methods provide quantitative information about vascular capacity blood volume pump effectiveness and tissue perfusion. Indications: The indications for hemodynamic monitoring include:
• All shock states (cardiogenic, neurogenic, anaphylactic, septic, and hypovolemic) • Loss of cardiac function • Decreased cardiac output
Hemodynamic Concepts: The critical care nurse should recognize and understand the building blocks of hemodynamics. These building blocks include:
• Heart rate • Stroke volume • Cardiac output • Blood pressure/Systemic vascular resistance/Pulmonary vascular resistance • Central venous pressure/Pulmonary wedge pressure • Determinants of stroke volume
o Preload o Afterload o Contractility
• Mixed venous oxygen saturation (SVO2) Cardiac output (CO) Cardiac output: Cardiac output is the amount of blood that is pumped out of the ventricles in one minute. A normal cardiac output is between 4-8 L/minute. To determine cardiac output multiply heart rate X stroke volume. There is a direct relationship between cardiac output, heart rate, and
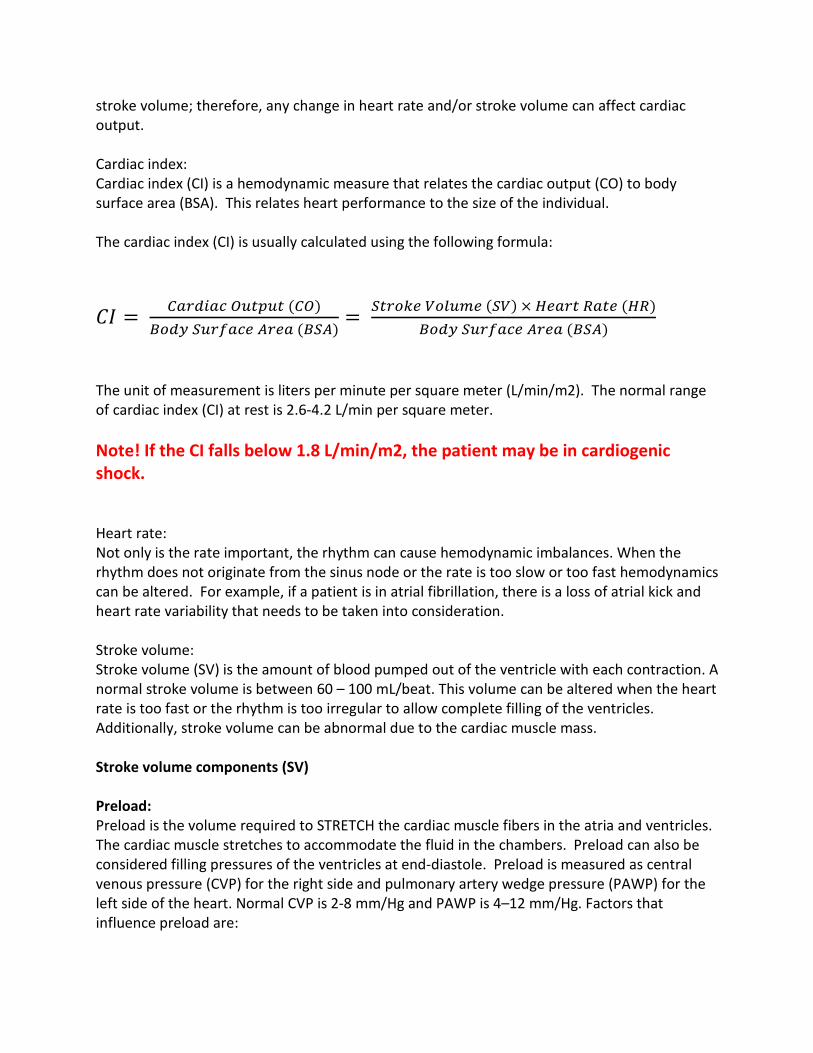
stroke volume; therefore, any change in heart rate and/or stroke volume can affect cardiac output. Cardiac index: Cardiac index (CI) is a hemodynamic measure that relates the cardiac output (CO) to body surface area (BSA). This relates heart performance to the size of the individual. The cardiac index (CI) is usually calculated using the following formula:
𝐶𝐶𝐶𝐶 = 𝐶𝐶𝐶𝐶𝐶𝐶𝐶𝐶𝐶𝐶𝐶𝐶𝐶𝐶 𝑂𝑂𝑂𝑂𝑂𝑂𝑂𝑂𝑂𝑂𝑂𝑂 (𝐶𝐶𝑂𝑂)𝐵𝐵𝐵𝐵𝐶𝐶𝐵𝐵 𝑆𝑆𝑂𝑂𝐶𝐶𝑆𝑆𝐶𝐶𝐶𝐶𝑆𝑆 𝐴𝐴𝐶𝐶𝑆𝑆𝐶𝐶 (𝐵𝐵𝑆𝑆𝐴𝐴)
= 𝑆𝑆𝑂𝑂𝐶𝐶𝐵𝐵𝑆𝑆𝑆𝑆 𝑉𝑉𝐵𝐵𝑉𝑉𝑂𝑂𝑉𝑉𝑆𝑆 (𝑆𝑆𝑉𝑉) × 𝐻𝐻𝑆𝑆𝐶𝐶𝐶𝐶𝑂𝑂 𝑅𝑅𝐶𝐶𝑂𝑂𝑆𝑆 (𝐻𝐻𝑅𝑅)𝐵𝐵𝐵𝐵𝐶𝐶𝐵𝐵 𝑆𝑆𝑂𝑂𝐶𝐶𝑆𝑆𝐶𝐶𝐶𝐶𝑆𝑆 𝐴𝐴𝐶𝐶𝑆𝑆𝐶𝐶 (𝐵𝐵𝑆𝑆𝐴𝐴)
The unit of measurement is liters per minute per square meter (L/min/m2). The normal range of cardiac index (CI) at rest is 2.6-4.2 L/min per square meter. Note! If the CI falls below 1.8 L/min/m2, the patient may be in cardiogenic shock. Heart rate: Not only is the rate important, the rhythm can cause hemodynamic imbalances. When the rhythm does not originate from the sinus node or the rate is too slow or too fast hemodynamics can be altered. For example, if a patient is in atrial fibrillation, there is a loss of atrial kick and heart rate variability that needs to be taken into consideration. Stroke volume: Stroke volume (SV) is the amount of blood pumped out of the ventricle with each contraction. A normal stroke volume is between 60 – 100 mL/beat. This volume can be altered when the heart rate is too fast or the rhythm is too irregular to allow complete filling of the ventricles. Additionally, stroke volume can be abnormal due to the cardiac muscle mass. Stroke volume components (SV) Preload: Preload is the volume required to STRETCH the cardiac muscle fibers in the atria and ventricles. The cardiac muscle stretches to accommodate the fluid in the chambers. Preload can also be considered filling pressures of the ventricles at end-diastole. Preload is measured as central venous pressure (CVP) for the right side and pulmonary artery wedge pressure (PAWP) for the left side of the heart. Normal CVP is 2-8 mm/Hg and PAWP is 4–12 mm/Hg. Factors that influence preload are:

Increases Preload
Decreases Preload
Increased circulating volume Decrease circulating volume Mitral valve insufficiency Mitral valve stenosis Tap vasoconstrictor use Vasodilator use
Heart failure Asynchrony of atria and ventricles Aortic insufficiency
Contractility: Contractility is the strength of the cardiac muscle to push blood from the ventricles against the systemic vascular resistance/blood pressure of the patient. Any condition affecting the strength of the cardiac muscle, hypertrophy, will affect stroke volume. Factors that influence contractility are:
Increases (SQUEEZE)
Contractility Decreases (RELAX)
Contractility
Medications Positive inotropes (digoxin, dopamine, dobutamine)
Negative inotropes (beta-blockers, calcium channel
blockers, lidocaine, barbiturates)
Electrolytes
Hypercalcemia (calcium stimulates the heart to
contract) Hyperglycemia
Decreases magnesium, sodium, calcium, increases potassium
O2 & CO2 Hypoxemia, acidosis,
hypercapnia
Myocardial infarction/cardiomyopathy
“Stunned” heart, scar tissue, hypertrophied muscle
HR & Rhythm Increased HR Sustained tachycardia leads to decompensation
Autonomic nervous system Sympathetic stimulation Parasympathetic stimulation Vagal stimulation
Afterload: Afterload is the RESISTANCE or pressure the ventricular heart muscle must overcome to open aortic valve and eject volume. Afterload is also known as systemic vascular resistance (SVR); and pulmonary vascular resistance (PVR), the resistance of blood flow through the pulmonary circulation. A normal SVR is 800 – 1200 dynes/sec/cm. A normal PVR is 100-250 dynes/sec/cm. An easy way to estimate increased or decreased afterload is by measuring blood pressure. Hypertension indicates increased SVR and hypotension indicates decreased SVR. Factors that increase afterload are:
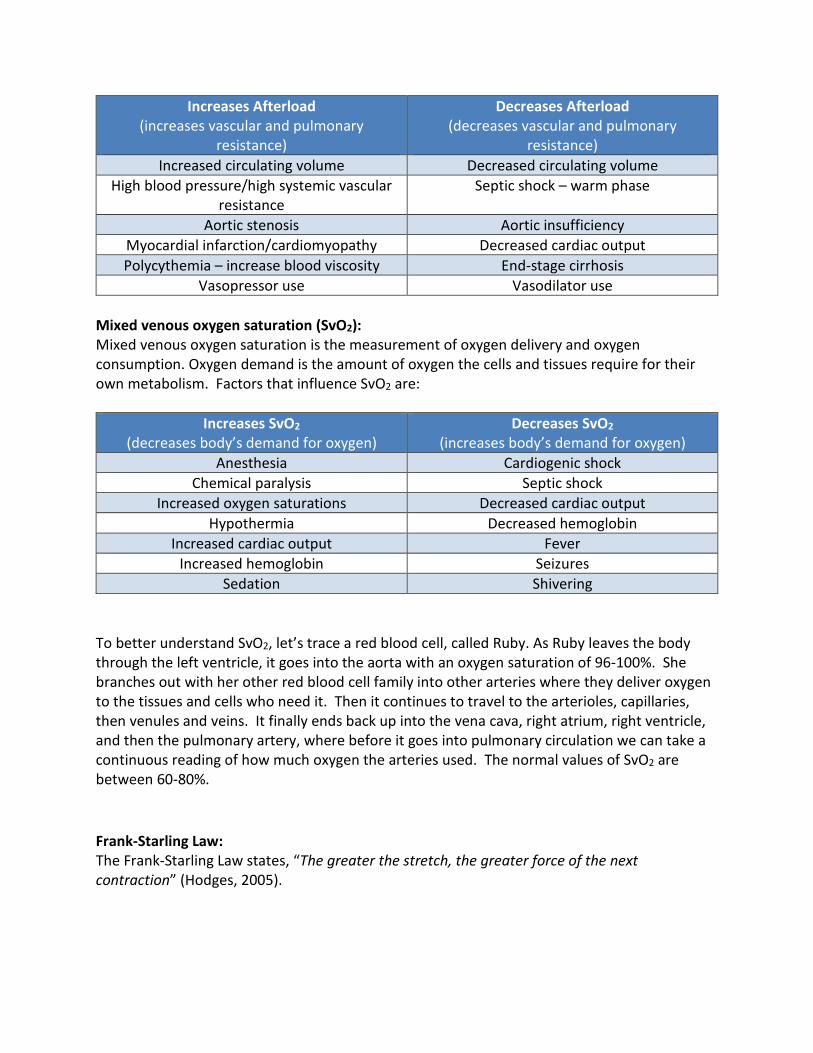
Increases Afterload (increases vascular and pulmonary
resistance)
Decreases Afterload (decreases vascular and pulmonary
resistance) Increased circulating volume Decreased circulating volume
High blood pressure/high systemic vascular resistance
Septic shock – warm phase
Aortic stenosis Aortic insufficiency Myocardial infarction/cardiomyopathy Decreased cardiac output Polycythemia – increase blood viscosity End-stage cirrhosis
Vasopressor use Vasodilator use Mixed venous oxygen saturation (SvO2): Mixed venous oxygen saturation is the measurement of oxygen delivery and oxygen consumption. Oxygen demand is the amount of oxygen the cells and tissues require for their own metabolism. Factors that influence SvO2 are:
Increases SvO2 (decreases body’s demand for oxygen)
Decreases SvO2 (increases body’s demand for oxygen)
Anesthesia Cardiogenic shock Chemical paralysis Septic shock
Increased oxygen saturations Decreased cardiac output Hypothermia Decreased hemoglobin
Increased cardiac output Fever Increased hemoglobin Seizures
Sedation Shivering To better understand SvO2, let’s trace a red blood cell, called Ruby. As Ruby leaves the body through the left ventricle, it goes into the aorta with an oxygen saturation of 96-100%. She branches out with her other red blood cell family into other arteries where they deliver oxygen to the tissues and cells who need it. Then it continues to travel to the arterioles, capillaries, then venules and veins. It finally ends back up into the vena cava, right atrium, right ventricle, and then the pulmonary artery, where before it goes into pulmonary circulation we can take a continuous reading of how much oxygen the arteries used. The normal values of SvO2 are between 60-80%. Frank-Starling Law: The Frank-Starling Law states, “The greater the stretch, the greater force of the next contraction” (Hodges, 2005).
To better understand the Frank Starling Law, let’s use the example of the rubber band being the heart’s muscle. The less the rubber band is stretched the less it will propel in the air. The further the rubber band is stretched the greater the force and it will propel in the air further. As this relates to preload, if there is too little preload (stretch) as in hypovolemia, the heart will not have enough stretch to propel the blood (cardiac output) through the body. If volume increases, the more preload (stretch) the heart will have and will contract with more force. In the same manner if the rubber band is continually, excessively stretched over time it will lose it elasticity. The heart muscle will wear out and lead to heart failure. Invasive Hemodynamic Monitoring Devices The three most common monitoring devices are:
• Arterial lines • Central venous lines • Swan-Ganz lines/PA lines
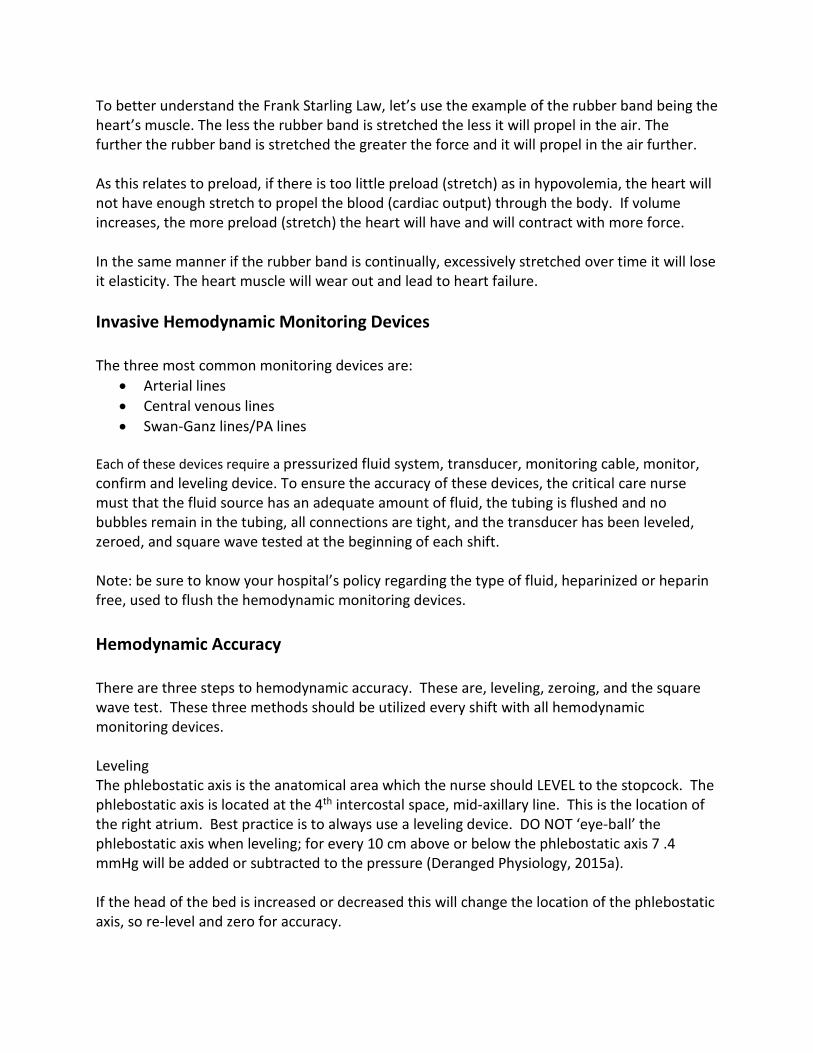
Each of these devices require a pressurized fluid system, transducer, monitoring cable, monitor, confirm and leveling device. To ensure the accuracy of these devices, the critical care nurse must that the fluid source has an adequate amount of fluid, the tubing is flushed and no bubbles remain in the tubing, all connections are tight, and the transducer has been leveled, zeroed, and square wave tested at the beginning of each shift. Note: be sure to know your hospital’s policy regarding the type of fluid, heparinized or heparin free, used to flush the hemodynamic monitoring devices. Hemodynamic Accuracy There are three steps to hemodynamic accuracy. These are, leveling, zeroing, and the square wave test. These three methods should be utilized every shift with all hemodynamic monitoring devices. Leveling The phlebostatic axis is the anatomical area which the nurse should LEVEL to the stopcock. The phlebostatic axis is located at the 4th intercostal space, mid-axillary line. This is the location of the right atrium. Best practice is to always use a leveling device. DO NOT ‘eye-ball’ the phlebostatic axis when leveling; for every 10 cm above or below the phlebostatic axis 7 .4 mmHg will be added or subtracted to the pressure (Deranged Physiology, 2015a). If the head of the bed is increased or decreased this will change the location of the phlebostatic axis, so re-level and zero for accuracy.
Zeroing Zeroing is defined as the use of atmospherics pressure as a reference standard against which all other pressures are measured or a process which confirms that atmospheric pressure results in a zero reading by the measurement system. This ensures the pressure values we see on the monitor are only those values which are reflected in the vessel or heart. After leveling the transducer to the phlebostatic axis, then turn the stop-cock off to the patient and remove the cap. Be certain not to contaminate the cap. Press the ‘zero’ button on the monitor and wait for the number ‘0’ to appear. Replace the cap and return the stop-cock to its original position. (Deranged Physiology, 2015a) Note: Be sure to check the manufacturer’s recommendations regarding removing the cap during zeroing. Changes in the manufacturing of transducers have made cap removal unnecessary with some devices. Hemodynamic Accuracy Square Wave Testing Square wave test is done by fast-flushing the system for 1-2 seconds and noting the waveform or the ‘square wave’ producing a waveform that rises sharply, plateaus, and drops off sharply, and the oscillations that immediately follow the square wave. There are three types of square waves; optimally damped system, over-dampened system, and under-dampened system:
1. Optimally dampened system correlates with a properly working system and does not require any interventions.
a. When looking at the waveform on the monitor the nurse should see one or two oscillation waves after the square wave.
2. Over-dampened waveform is the most common and this may be caused from not enough pressure in the pressure bag, flush bag is empty, blood clots or air bubbles in the non-compliant tubing.

a. When looking at the waveform on the monitor the nurse should see only one oscillation wave and then a flat line after the square wave.
3. Under-dampened waveform will overestimate the systolic pressure and underestimate the diastolic pressure; however, the mean arterial pressure will remain accurate.
a. When looking at the waveform on the monitor the nurse should see multiple oscillation waveforms after the square wave.
(Deranged Physiology, 2015b) For more information and images regarding square wave testing go to the following website: http://www.derangedphysiology.com/main/core-topics-intensive-care/haemodynamic-monitoring/Chapter%201.1.4/arterial-line-dynamic-response-testing Arterial Line: The arterial line is used to monitor systemic blood pressure/systemic vascular resistance. The radial artery is most commonly used for arterial line placement. However, other arteries such as the brachial, axillary, or femoral may be used depending on patient condition and physician's preference. This line should be used for monitoring only. Infusion of fluids other than the Flushing fluid, should not be done. When inserting a radial arterial line, an Allen’s Test should be performed to ensure there is blood supply to the hand if the radial artery becomes occluded. Allen’s Test Procedure
1. Raise the patient’s hand and ask them to make a fist. Occlude both radial and ulnar arteries by applying pressure with your fingers.
2. Instruct the patient to clench their fist a few times and take note of blanching or paleness that will occur.
3. Release pressure from the ulnar artery, while maintaining pressure on the radial artery. If the ulnar artery is patent, you will see the hand color return (then release pressure from the radial artery).
4. If it takes more than 5-10 seconds for color to return after you have released pressure from the ulnar artery, the Allen’s Test is considered negative and that radial artery should not be used.
(Segen’s Medical Dictionary, 2012) Central Venous and Pulmonary Artery Catheters The CVP and PA catheters are essential to measure preload and other cardiac functions. Both lines are placed into a central vein, internal jugular, subclavian, or femoral locations. The CVP line is most commonly used and measures right atrial pressures or preload. The PA catheter is utilized when more information is required; such as left heart preload and cardiac output. Besides monitoring hemodynamic parameters these lines may be used for fluid and medication infusions. Radiographic confirmation of catheter tip placement should be done after insertion
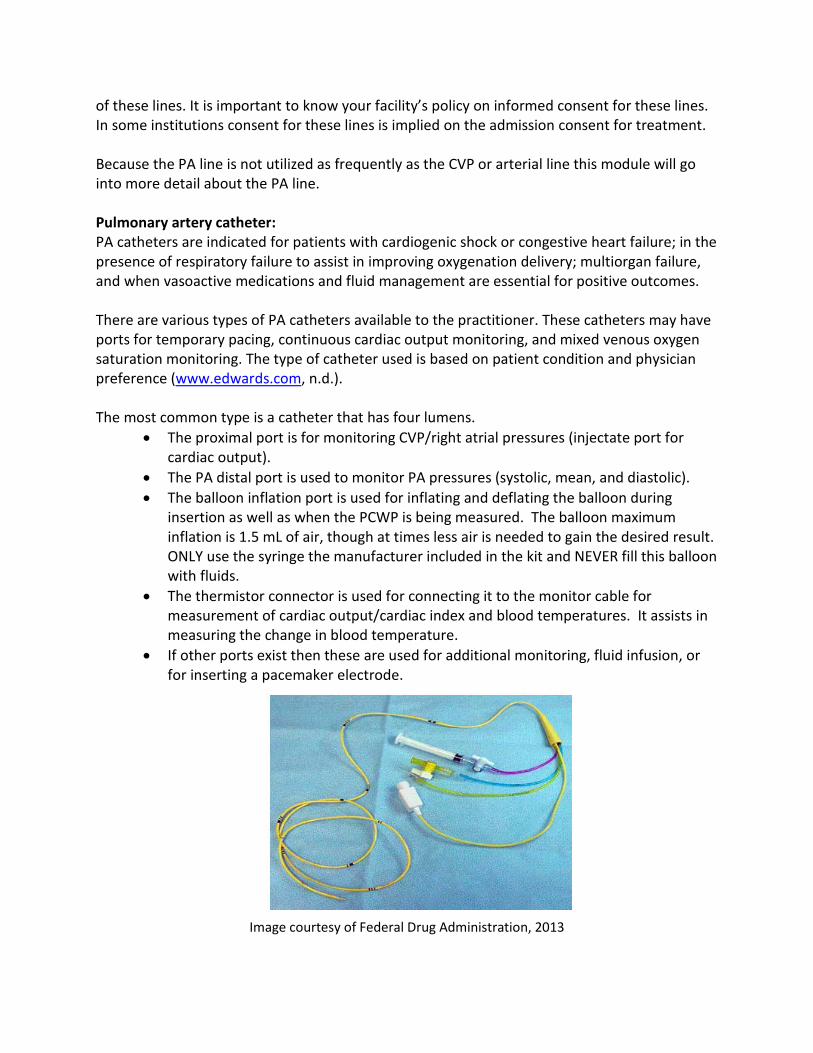
of these lines. It is important to know your facility’s policy on informed consent for these lines. In some institutions consent for these lines is implied on the admission consent for treatment. Because the PA line is not utilized as frequently as the CVP or arterial line this module will go into more detail about the PA line. Pulmonary artery catheter: PA catheters are indicated for patients with cardiogenic shock or congestive heart failure; in the presence of respiratory failure to assist in improving oxygenation delivery; multiorgan failure, and when vasoactive medications and fluid management are essential for positive outcomes. There are various types of PA catheters available to the practitioner. These catheters may have ports for temporary pacing, continuous cardiac output monitoring, and mixed venous oxygen saturation monitoring. The type of catheter used is based on patient condition and physician preference (www.edwards.com, n.d.). The most common type is a catheter that has four lumens.
• The proximal port is for monitoring CVP/right atrial pressures (injectate port for cardiac output).
• The PA distal port is used to monitor PA pressures (systolic, mean, and diastolic). • The balloon inflation port is used for inflating and deflating the balloon during
insertion as well as when the PCWP is being measured. The balloon maximum inflation is 1.5 mL of air, though at times less air is needed to gain the desired result. ONLY use the syringe the manufacturer included in the kit and NEVER fill this balloon with fluids.
• The thermistor connector is used for connecting it to the monitor cable for measurement of cardiac output/cardiac index and blood temperatures. It assists in measuring the change in blood temperature.
• If other ports exist then these are used for additional monitoring, fluid infusion, or for inserting a pacemaker electrode.
Image courtesy of Federal Drug Administration, 2013

Know and follow your institution's procedure for insertion, maintenance, and discontinuation of a PA catheter. Waveforms
Arterial Line
Deranged physiology, 2015c
CVP
Deranged physiology, 2015d

PA
Image courtesy of Federal Drug Administration, 2013
Case Study: Introduction A 76-year-old was admitted to the medical floor with two days of nausea and vomiting. He has a history of diabetes, myocardial infarction five years ago, with a drug-eluting stent placed in his right coronary artery (RCA). At that time, he had an ejection fraction (EF) of 40%. On admission is vital signs were:
Day 1 1400 BP 100/60 HR 124 RR 22 SaO2 93%
• Physician ordered 0.9% NS to infuse at 125 mL/hour x 12 hours, then a maintenance
infusion at 75 mL/hour • Labs were drawn • CXR was completed • Cardiac telemetry shows sinus tachycardia • All home medications were held • Ondansetron (Zofran) 4mg IV every six hours was ordered • Patient remains NPO • No supplemental oxygen is ordered

Day 2 0200 BP 88/52 HR 130 RR 28 SaO2 92%
12 hours after admission the patient’s blood pressure was dropping, heart rate was elevated, and as saturations had dropped. You review the patient’s labs and find the following significant values.
• White count: 14,000, no left shift • Potassium: 5.2 • BUN/creatinine: 22/2
Based on these findings you anticipate the physician will order which of the following:
1. Oxygen 2. Fluid bolus 3. Vasoconstrictors
If you selected oxygen and fluid bolus you are correct. However, to know if vasoconstrictors are necessary what else might you want to know? Urine output, respiratory status, cardiac output, and/or peripheral perfusion? A thorough physical assessment will help ensure the practitioner has all the information needed to order the appropriate treatment. Your assessment shows that the patient is not in respiratory distress, his prior 12-hour intake and output was 1500 mL/50mL, and his extremities are cool to the touch with weak pulses. The practitioner orders a 500 mL 0.9% NS bolus and to continue the fluids at 125 mL/hour after the bolus is completed. An hour after the bolus was infused the patient’s vital signs and assessment have not improved. You notify the practitioner and receive orders for another 500mL 0.9% NS bolus. The bolus is infused and at 0500 his vital signs are as follows:
Day 2 0400 0500 BP 90/48 120/82 HR 140 140 RR 24 24 SaO2 92% 90%
What are your concerns?
Although the blood pressure has improved, the patient’s heart rate remains elevated and the saturations continue to fall. The practitioner makes rounds at 0630. You inform the practitioner that in addition to the above findings the patient is complaining of shortness of breath. On auscultation, the physician hears crackles bilaterally. Due to a history of a prior MI and an EF of 40%, the patient was transferred to the cardiac intensive care unit for additional monitoring. In addition, 12-Lead ECG, ECHO and cardiac enzymes were ordered. A central line was placed in the right internal jugular (IJ) and can arterial line is inserted in the right radial artery. What steps would you take to ensure the accuracy of the readings?
• Tubing and transducer flushed without bubbles in tubing • Transducer leveled at the phlebostatic axis • Transducer and monitor zeroed • Square wave form test completed
The initial readings of the CVP were 18-20. His blood pressure is 110/70. An echocardiogram was completed and showed a decrease in ejection fraction to 20%. The 12-Lead showed some ischemia in the anterior leads, which correlates to the coronary arteries which supply blood to the left ventricle. What do you think is happening and what is the practitioner likely to order? The patient appears to be fluid overloaded/elevated preload and the heart’s ability to move the fluid efficiently is decreased. Because the patient is having respiratory difficulties and on auscultation rales are heard in the bases of the lungs; you anticipate diuretics. The practitioner orders furosemide 40 mg IV x 1, keep NPO, and decrease the IV fluids to 25 mL/hour. It is now 1400 on day two of his hospitalization. The 40 mg of furosemide was administered at 0800 and the patient voided 400 mL. His vital signs are:
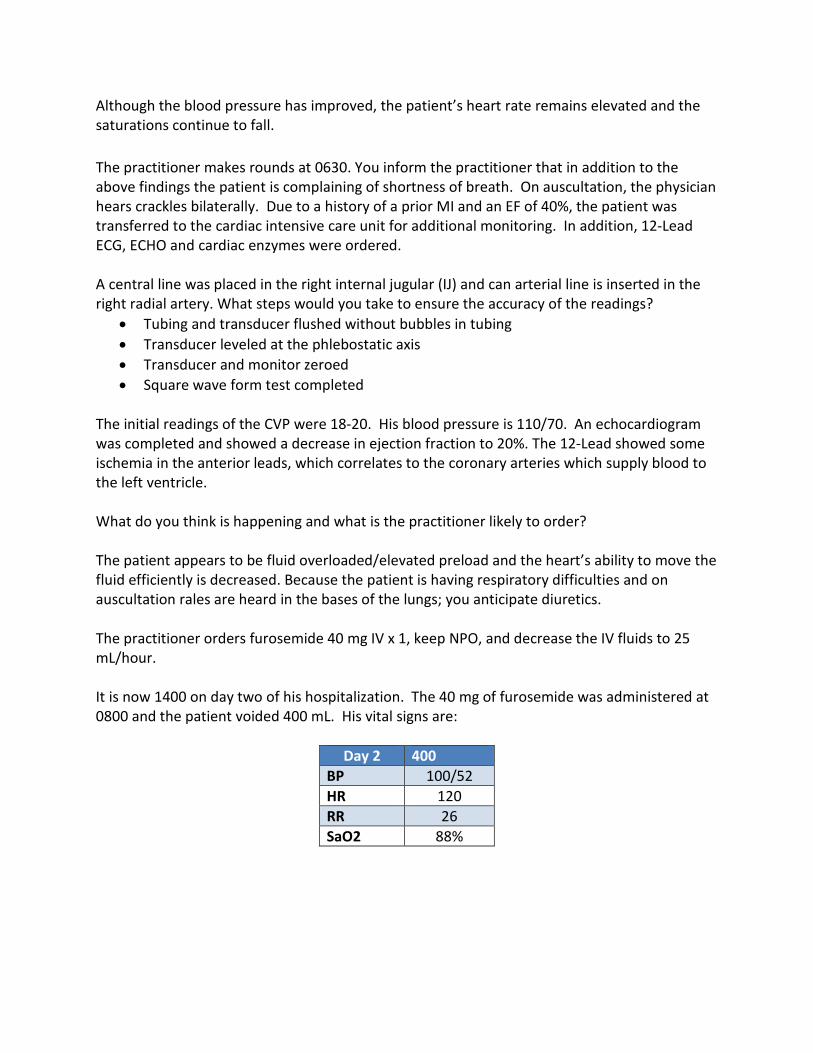
Day 2 400 BP 100/52 HR 120 RR 26 SaO2 88%
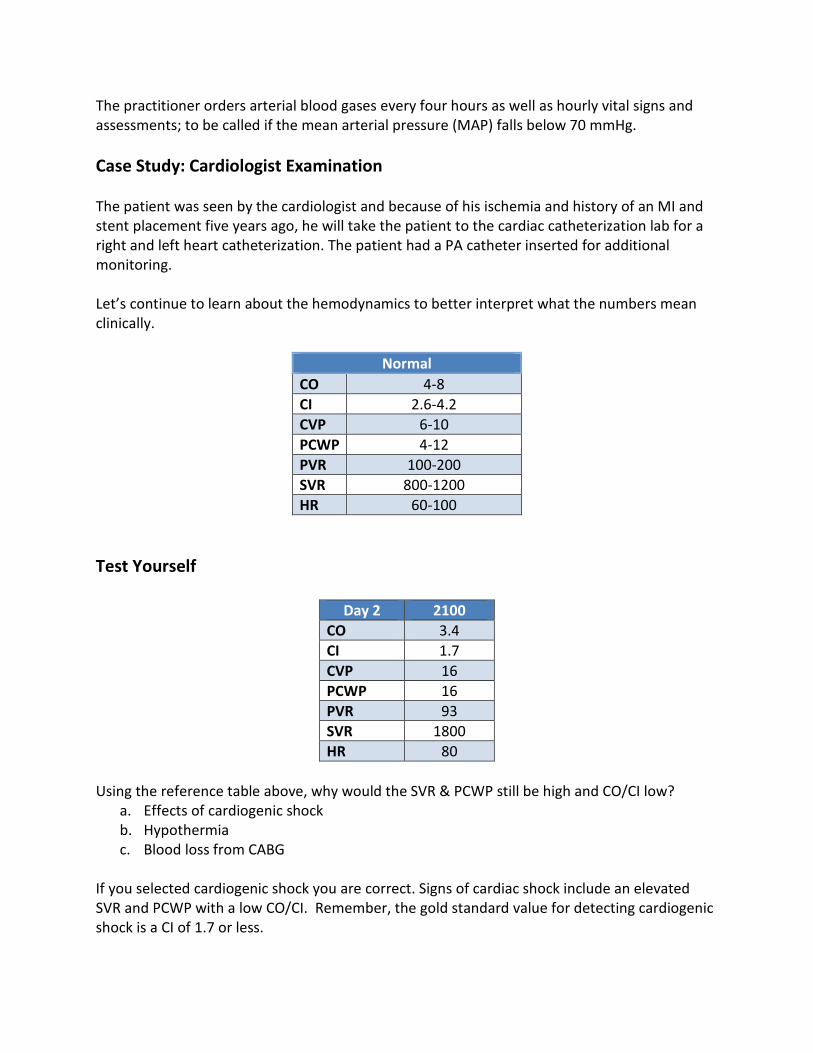
The practitioner orders arterial blood gases every four hours as well as hourly vital signs and assessments; to be called if the mean arterial pressure (MAP) falls below 70 mmHg. Case Study: Cardiologist Examination The patient was seen by the cardiologist and because of his ischemia and history of an MI and stent placement five years ago, he will take the patient to the cardiac catheterization lab for a right and left heart catheterization. The patient had a PA catheter inserted for additional monitoring. Let’s continue to learn about the hemodynamics to better interpret what the numbers mean clinically.
Normal CO 4-8 CI 2.6-4.2 CVP 6-10 PCWP 4-12 PVR 100-200 SVR 800-1200 HR 60-100
Test Yourself
Day 2 2100 CO 3.4 CI 1.7 CVP 16 PCWP 16 PVR 93 SVR 1800 HR 80
Using the reference table above, why would the SVR & PCWP still be high and CO/CI low?
a. Effects of cardiogenic shock b. Hypothermia c. Blood loss from CABG
If you selected cardiogenic shock you are correct. Signs of cardiac shock include an elevated SVR and PCWP with a low CO/CI. Remember, the gold standard value for detecting cardiogenic shock is a CI of 1.7 or less.
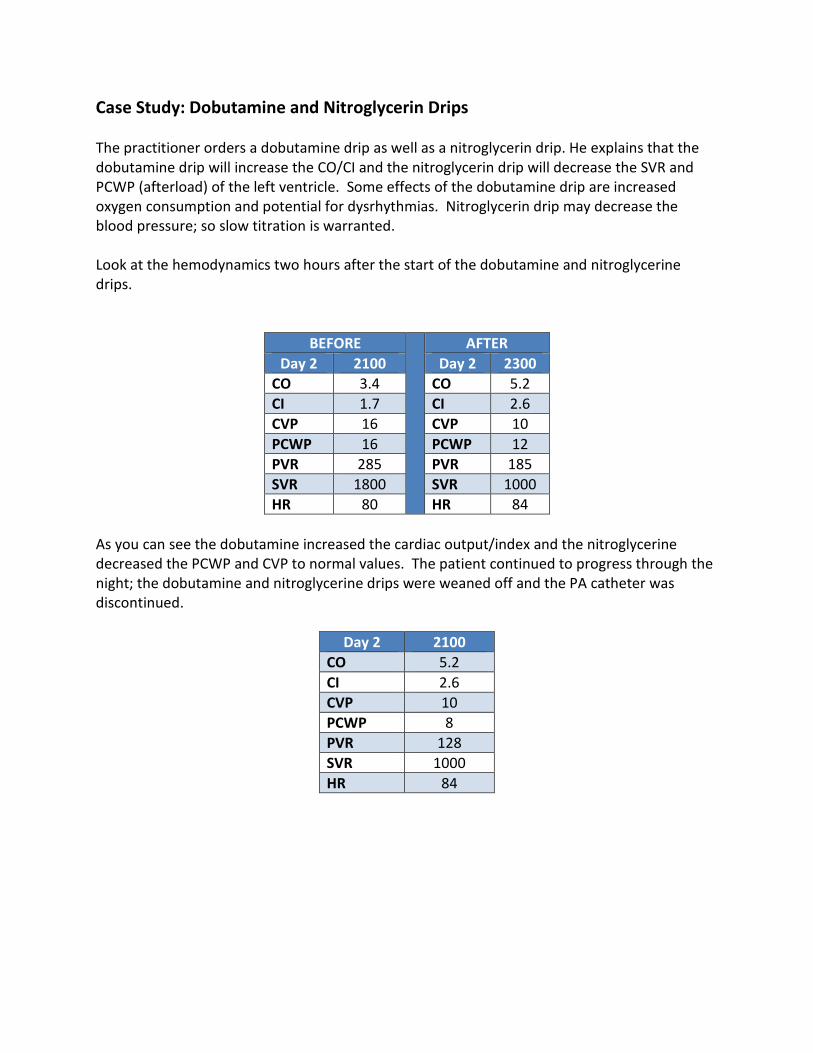
Case Study: Dobutamine and Nitroglycerin Drips The practitioner orders a dobutamine drip as well as a nitroglycerin drip. He explains that the dobutamine drip will increase the CO/CI and the nitroglycerin drip will decrease the SVR and PCWP (afterload) of the left ventricle. Some effects of the dobutamine drip are increased oxygen consumption and potential for dysrhythmias. Nitroglycerin drip may decrease the blood pressure; so slow titration is warranted. Look at the hemodynamics two hours after the start of the dobutamine and nitroglycerine drips.
BEFORE AFTER Day 2 2100 Day 2 2300
CO 3.4 CO 5.2 CI 1.7 CI 2.6 CVP 16 CVP 10 PCWP 16 PCWP 12 PVR 285 PVR 185 SVR 1800 SVR 1000 HR 80 HR 84
As you can see the dobutamine increased the cardiac output/index and the nitroglycerine decreased the PCWP and CVP to normal values. The patient continued to progress through the night; the dobutamine and nitroglycerine drips were weaned off and the PA catheter was discontinued.
Day 2 2100 CO 5.2 CI 2.6 CVP 10 PCWP 8 PVR 128 SVR 1000 HR 84

References Deranged Physiology. (2015 a). The arterial line pressure transducer set up. Retrieved from: www.derangedphysiology.com/main/core.../arterial-line-pressure-transducer-setup
Deranged Physiology. (2015 b). Arterial line dynamic response testing. Retrieved from: http://www.derangedphysiology.com/main/core-topics-intensive-care/haemodynamic-monitoring/Chapter%201.1.4/arterial-line-dynamic-response-testing Deranged Physiology. (2015 c). Normal arterial line waveforms. Retrieved from: http://www.derangedphysiology.com/main/core-topics-intensive-care/haemodynamic-monitoring/Chapter%201.1.5/normal-arterial-line-waveforms Deranged Physiology. (2015 d). Anatomy of the CVP waveform. Retrieved from: http://www.derangedphysiology.com/main/core-topics-intensive-care/haemodynamic-monitoring/Chapter%202.1.3/interpretation-central-venous-pressure-waveform Segen’s Medical Dictionary. (2012). Allen’s test. Retrieved from: http://medical-dictionary.thefreedictionary.com/Allen's+test Edwards Lifesciences, n.d. Swan-Ganz Catheters retrieved from http://www.edwards.com/products/pacatheters/Pages/PACategory.aspx. Disclaimer This publication is intended solely for the educational use of healthcare professionals taking this course, for credit, from RN.com, in accordance with RN.com terms of use. It is designed to assist healthcare professionals, including nurses, in addressing many issues associated with healthcare. The guidance provided in this publication is general in nature, and is not designed to address any specific situation. As always, in assessing and responding to specific patient care situations, healthcare professionals must use their judgment, as well as follow the policies of their organization and any applicable law. This publication in no way absolves facilities of their responsibility for the appropriate orientation of healthcare professionals. Healthcare organizations using this publication as a part of their own orientation processes should review the contents of this publication to ensure accuracy and compliance before using this publication. Healthcare providers, hospitals and facilities that use this publication agree to defend and indemnify, and shall hold RN.com, including its parent(s), subsidiaries, affiliates, officers/directors, and employees from liability resulting from the use of this publication. The contents of this publication may not be reproduced without written permission from RN.com. Participants are advised that the accredited status of RN.com does not imply endorsement by the provider or ANCC of any products/therapeutics mentioned in this course. The information
in the course is for educational purposes only. There is no “off label” usage of drugs or products discussed in this course. You may find that both generic and trade names are used in courses produced by RN.com. The use of trade names does not indicate any preference of one trade named agent or company over another. Trade names are provided to enhance recognition of agents described in the course. Note: All dosages given are for adults unless otherwise stated. The information on medications contained in this course is not meant to be prescriptive or all-encompassing. You are encouraged to consult with physicians and pharmacists about all medication issues for your patients.