foundations in factors - northern trust · 2019-07-12 · foundations in factors the quest to...
TRANSCRIPT

Northern Trust Asset Management 1
FOUNDATIONS IN FACTORS
THE QUEST TO CAPTURE EFFICIENT ALPHA MEANS CHALLENGING MODERN PORTFOLIO THEORY
Style factors have been shown to historically deliver superior risk-adjusted returns than passive capitalization weighted indexes and more persistent performance than traditional active management, making them a compelling alternative for investors. The benefits of style factors come with the cost of cyclicality, exposing investors to the risk of sustained underperformance.
Although the efficacy of style factors conflicts with modern financial theory, they have been successfully employed for more than 40 years to improve upon passive capitalization weighted equity portfolios. Empirical studies have repeatedly shown style factors outperform capitalization weighted benchmarks across most global markets. These results are considered anomalous because they are inconsistent with the concept that expected return is determined solely by an investment’s sensitivity to the broader market, traditionally referred to as market beta.
When considering the role style factors can play in a portfolio, it is helpful to understand their origin, theoretical justification, and relationship with traditional active management. The first section of this paper provides an overview of these topics and establishes style factors as a compelling alternative to passive capitalization weighted investing.
Like all investment strategies, style factors are not without potential drawbacks. The second section of this paper demonstrates that style factor investing is susceptible to prolonged periods of poor relative performance. This cyclicality is problematic given that investors commonly evaluate strategies on a three-to-five year horizon and style factors are prone to underperform over such short holding periods, ultimately leading to divestment.
In light of these obstacles, we conclude with an illustration of using factor diversification to improve the likelihood that investors realize the benefits of style factors. Although diversification is useful, it is only one method of improving the investor experience. Given the magnitude of the challenge style factor cyclicality presents, we recommend investors seek out portfolios designed explicitly to address this risk.
MICHAEL HUNSTAD, PHD Head of Quantitative Strategies Northern Trust Asset Management
ROBERT LEHNHERR, CFA Quantitative Research Analyst Northern Trust Asset Management
Exploring Key Topics Page
History and Evolutions of Style Factors 2
Implications for Investors 6
The Perils of Factor Cyclicality 9
Diversity Within and Across Factors 13
Northern Trust Asset Management 2
FOUNDATIONS IN FACTORS
In 1964, The Capital Asset Pricing Model (CAPM), a single factor model identifying Beta emerges.
HISTORY AND EVOLUTION OF STYLE FACTORS
William Sharpe introduced the first factor model in 1964 – the Capital Asset Pricing Model (CAPM). It only included a single factor (beta), and was therefore quite straightforward:
Ε(Ri) = Rf + βi(E(Rm) – Rf)
Or commonly,
Ε(Ri) – Rf = βi(E(Rm) – Rf)
Where:
• Ε(Ri) is the expected return of asset i
• Rf is the risk-free rate of interest
• E(Rm) is the expected return of the aggregate market portfolio
• βi is the sensitivity of asset i to the expected excess return of the aggregate market portfolio over the risk-free rate of interest1
Even though the CAPM encompasses all financial assets, equity markets are commonly used as a proxy for the aggregate market portfolio. In this context, the CAPM tells us a stock’s expected excess return is determined entirely by its beta (βi) and the only reliable manner to outperform the market is by holding stock(s) with higher systematic risk, i.e. a beta to the market greater than one. However, according to the CAPM, investors would be foolish to do so since a superior alternative exists – the use of leverage. By borrowing at the risk-free rate and investing in the market portfolio, investors can increase beta beyond one and achieve a higher expected return than an unlevered portfolio of the same volatility. Investor either unwilling or unable to employ leverage must therefore accept lower Sharpe Ratios2 if they wish to outperform the market.
The importance of the CAPM to passive capitalization weighted investing cannot be overstated, as it provides the theoretical justification for holding the market portfolio. Though introduced over 50 years ago, the popularity of passive investing is a testament to the sustained relevance of the CAPM. Despite its wide acceptance, there are two assertions of the CAPM that have been consistently challenged through time:
1. Market beta is the only systematic risk factor
2. The market portfolio offers the highest attainable Sharpe Ratio
CAPM Assertion #1) Market Beta is the Only Systematic Risk Factor
If we accept the CAPM as the true market model, we must reject the possibility of other factors. Sharpe’s model does not state we should be compensated for anything other than market beta. If portfolios reliably generate high (low) excess returns, it must be solely the result of higher (lower) beta and nothing else. Unfortunately for the CAPM, there is plenty of evidence to suggest otherwise.
1 From this point forward, excess return refers to the return earned above the risk-free rate of interest
2 Sharpe Ratio is the average return earned in excess of the risk-free rate per unit of excess return volatility

Northern Trust Asset Management 3
FOUNDATIONS IN FACTORS
Exhibit 1 shows the average annualized equally weighted returns3, betas, and alphas for portfolios formed by dividend yield in three distinct large cap4 markets:
1. United States (Russell 1000 Index)
2. Developed markets excluding the United States (MSCI World ex US Index)
3. Emerging markets (MSCI Emerging Markets Index)
Each quarter index stocks are sorted by dividend yield and assigned to one of three portfolios. The stocks in the top 30th percentile are assigned to the “Top” portfolio, the middle 40th percentile to the “Middle” portfolio, and the bottom 30th percentile to the “Bottom” portfolio. The CAPM coefficients are obtained by regressing the excess returns of the monthly dividend yield portfolios against the excess returns of the respective market:
(Rt,i – Rt,f) = αi + βi(Rt,m – Rt,f) + εt,i
Where αi represents the excess return of portfolio i not explained by the model (assumed to be zero).
EXHIBIT 1: EQUALLY WEIGHTED AVERAGE ANNUALIZED RETURNS AND CAPM COEFFICIENTS OF DIVIDEND YIELD PORTFOLIOS
Slope coefficients and test statistics from regressions of the form: (Rt,i – Rt,f) = αi + βi(Rt,m – Rt,f) + εt,i
Russell 1000 (1980 – 2018)
CAPM coefficients
MSCI World ex US (1997 – 2018)
CAPM coefficients
MSCI Emerging Markets (1999 – 2018)
CAPM coefficients
Variable PortfolioAvg EW Return
α [t-stat] β
Avg EW Return
α [t-stat] β
Avg EW Return
α [t-stat] β
Dividend Yield Top 15.9% 4.4% [3.40]
0.83 11.7% 4.7% [2.75]
1.00 18.3% 7.4% [4.39]
0.91
Middle 13.7% 1.0% [1.07]
1.00 7.9% 1.3% [1.19]
0.96 12.5% 1.8% [1.50]
0.94
Bottom 13.8% -1.5% [-1.23]
1.33 4.1% -2.9% [-3.24]
1.09 10.7% -1.2% [-0.70]
1.10
SOURCE: Northern Trust Quantitative Research, FTSE Russell, MSCI, Worldscope, Compustat, Kenneth French Data Library
The results show that the average returns of top (high) dividend yield portfolios are greater than those of bottom (low) dividend portfolios, but this difference in returns is not attributable to beta. In fact, the betas of the top dividend yield portfolios are actually lower than those of the bottom dividend yield portfolios, which directly conflicts with the CAPM.
3 Equally weighted returns are utilized since the question is whether the cross section of stock returns are being adequately explained by the CAPM
4 For the purpose of illustration we analyze the most liquid markets

Northern Trust Asset Management 4
FOUNDATIONS IN FACTORS
Dividend yield is only one of several well-documented CAPM inconsistencies, some of which are highlighted in Exhibit 2 (see Appendix A and B for variable definitions and complete results).
EXHIBIT 2: EQUALLY WEIGHTED RETURN AND CAPM REGRESSION STATISTICS AVERAGED ACROSS RUSSELL 1000, MSCI WORLD EX US, AND MSCI EMERGING MARKETS INDEXES
VariableTop minus
Bottom returnTop
αTop
α t-statTop
βBottom
αBottom α t-stat
Bottom β
Book to Price 4.3% 3.5% [1.77] 1.09 0.0% [-0.17] 1.02
Earnings to Price 5.5% 4.7% [2.96] 1.03 -1.1% [-0.81] 1.13
Dividend Yield 5.8% 5.5% [3.51] 0.91 -1.8% [-1.72] 1.17
Size -3.2% 0.4% [0.70] 0.98 2.5% [1.24] 1.10
Momentum 5.2% 4.1% [2.92] 0.97 -2.0% [-0.95] 1.17
Volatility -1.2% -2.2% [-1.11] 1.41 4.2% [3.66] 0.69
ROE 2.1% 2.5% [2.32] 1.01 -0.2% [-0.14] 1.12
ROE Variability -0.9% 0.1% [-0.01] 1.17 3.3% [2.95] 0.85
ROIC 2.3% 2.6% [2.35] 1.00 -0.3% [-0.18] 1.11
Gross Profitability 3.7% 3.4% [3.03] 0.96 -0.4% [-0.26] 1.01
SOURCE: Northern Trust Quantitative Research, FTSE Russell, MSCI, Worldscope, Compustat, Kenneth French Data Library
These results reveal that the: • Spread in returns between the top and bottom portfolios is appreciable• Top portfolio alphas are large and positive for book to price, earnings to
price, dividend yield, momentum, ROE, ROIC, and gross profitability• Bottom portfolio alphas are large and positive for size, volatility, and
ROE variability
The fact that many of the alpha terms are significantly different from zero5 is particularly troubling for the CAPM, as it implies that beta alone is not sufficiently capturing the variation in the portfolios’ excess returns. Because these findings are incongruent with the classical notion that return is solely a function of market risk (beta), they are termed anomalies in financial literature.
While this type of evidence began piling up almost immediately after the publication of Sharpe’s paper, it took almost 30 years for a serious CAPM competitor to emerge. In 1992 Eugene Fama and Kenneth French introduced a three factor model that had much better success in explaining historic stock returns than the CAPM. Although Fama and French’s model included Sharpe’s original beta factor, it rejected market beta as the only systematic risk factor and addressed the more prevalent CAPM issues by including factors for size and value6.
E(Ri) = Rf + βi(E(Rm) – Rf) + λi(Size) + θi (Value)
Where: • λi and θi are sensitivities to the size and value factors, respectively
In addition to improving upon the CAPM, Fama and French also popularized the use of the Fama-MacBeth (1973) regression framework as a robust method for testing the predictive ability of variables among a cross-section of security returns over time (see Appendix C for application to the anomalies presented thus far).
5 As a shorthand, a |t-stat| > 1.65 is regarded to be different from zero with 90% probability
6 The authors used book to price to represent value
In 1992, Eugene Fama and Kenneth French introduced a three-factor model to explain stock returns, beta, size and value.

Northern Trust Asset Management 5
FOUNDATIONS IN FACTORS
In 1997 Carhart extended the Fama and French model to include a fourth factor - momentum. Although the Fama French three factor model could explain over 90% of the variation in diversified portfolio returns, momentum was a statistically robust addition that increased the model’s predictive power. Perhaps more importantly, Carhart’s model explained the three most prevalent equity market anomalies in one succinct package – value, size and momentum.
Value, size and momentum are among dozens of anomalies described in financial literature over the past few decades. The tendency for low-beta and low-volatility stocks to generate positive alpha was first reported in the early 1970s by Jensen, Black, and Scholes (1972), Fama and MacBeth (1973), and Haugen and Heins (1975). Quality, in numerous forms, was documented around the same time by Brennan (1970) and Litzenberger (1982). Although the number of anomalies is large and growing, academics and practitioners have coalesced on a set of widely accepted factors – value (dividend yield7), size, momentum, volatility, and quality.
CAPM Assertion #2) The Market Portfolio Offers the Highest Attainable Sharpe Ratio
The existence of factors beyond market beta is of great interest to academics, but not necessarily investors. If these insights cannot be applied to achieve superior risk-adjusted returns relative to a passive market index, they have little relevance beyond the classroom.
To evaluate the merits of these factors to investors we repeated the same procedure as before. However, this time capitalization weighted8 portfolios were formed and analysis was limited to portfolios with the highest (positive) alpha. The average annualized capitalization weighted returns and Sharpe Ratios are reported in Exhibit 3.
EXHIBIT 3: PERFORMANCE OF CAPM ANOMALIES
Russell 1000 (1980-2018)
MSCI World ex US (1997 - 2018)
MSCI Emerging Markets (1999 - 2018)
Avg CW Return
Sharpe Ratio
Avg CW Return
Sharpe Ratio
Avg CW Return
Sharpe Ratio
Panel A: Capitalization weighted index performance
Market Index 12.5% 0.53 6.2% 0.25 11.8% 0.45
Panel B: Portfolio performance
Book to Price (Value) 13.2% 0.52 8.6% 0.32 14.5% 0.49Earnings to Price (Value) 14.6% 0.65 9.1% 0.39 16.8% 0.60Dividend Yield (Value) 13.7% 0.69 9.1% 0.42 16.2% 0.68
Low Size 15.4% 0.56 8.0% 0.31 14.6% 0.54Momentum 14.2% 0.55 6.7% 0.28 14.0% 0.53Low Volatility 11.9% 0.71 6.6% 0.34 11.5% 0.56ROE (Quality) 13.6% 0.57 7.0% 0.30 12.2% 0.46Low ROE Variability (Quality) 13.3% 0.65 7.2% 0.33 11.5% 0.49ROIC (Quality) 13.7% 0.58 7.1% 0.32 12.7% 0.50Gross Profitability (Quality) 15.1% 0.67 7.7% 0.39 13.0% 0.53
SOURCE: Northern Trust Quantitative Research, FTSE Russell, MSCI, Worldscope, Compustat
7 Dividend yield is commonly considered separately from other valuation ratios since many investors target dividend yield specifically
8 Although the analysis is being performed within large cap markets, capitalization weighting is a better representation of performance as it reflects capacity considerations

Northern Trust Asset Management 6
FOUNDATIONS IN FACTORS
These results overwhelmingly support factor investing vis-à-vis a passive market index. Analysis reveals that 27 of the 30 portfolios outperformed the market index by an average active return9 of 1.6%. More importantly, 29 of the 30 portfolios outperformed the market index on a risk-adjusted basis. The Sharpe Ratios of the factor portfolios were 24% higher on average than the Sharpe Ratios of the respective market indexes, an outcome deemed impossible by the CAPM.
IMPLICATIONS FOR INVESTORS
The implications of these findings to passive investors are rather obvious. Style factors offer a simple, systematic alternative to generating higher risk-adjusted returns than capitalization weighted indices. Perhaps a less obvious outcome is the disruptive effect this research has had on traditional active investors. Recall that from the CAPM, alpha represents excess return that cannot be explained by market beta. While the CAPM offers no insight into the source of alpha, conventional wisdom has attributed it to the ability of the portfolio manager. Managers who consistently generated positive alpha were thought to have superior stock-picking abilities and were highly coveted by investors as evidenced by their fees. However, the advent of multi-factor pricing models has changed this dynamic. As the explanatory power of multi-factor models increased, unexplained active manager alpha necessarily decreased. This introduced the possibility that manager skill could be explained by other systematic factors.
This topic was thoroughly explored in the landmark paper by Carhart (1997), in which he examined the performance of more than 1800 mutual funds between 1962 and 1992. Initially he found strong persistence in active returns, supporting the notion that managers with superior insights can consistently generate positive alpha. However, after the returns were subsequently adjusted for style factors10, the persistence disappeared. More importantly, after adjusting for style factors, alpha was found to be negative, indicating that manager “skill” actually decreased returns on average.
Carhart is by no means the only academic to find persistence in manager returns, nor was he the first (or last) to attribute persistence to style factors. Bollen and Busse (2001) confirmed all the findings of Carhart, as did Daniel, Grinblatt, Titman and Wermers (1997). A number of other studies that were published during this time period drew similar conclusions11.
The interest in style factor investing should not be surprising given its appeal to both passive and active investors. Similar to capitalization weighted investing, style factors offer a systematic, diversified, and transparent source of return, but with the added benefit of higher Sharpe Ratios. Like traditional active investing, style factors offer the ability to outperform the market, but in a more reliable and cost-effective manner.
9 Active return refers to return earned above a passive capitalization weighted benchmark (index)
10 Analysis was done with the Fama-French-Carhart model including size, value, momentum, and beta
11 Other research includes Hendricks, Patel and Zeckhauser (1993), Goetzmann and Ibbotson (1994), Brown and Goetzmann (1995), Gurber (1996), Nofsinger (1999 ) and Sias, Grinblatt and Keloharju (2000)
Style factors offer a simple, systematic alternative to generating higher risk-adjusted returns than capitalization weighted indices.

Northern Trust Asset Management 7
FOUNDATIONS IN FACTORS
Of course, these potential benefits presuppose that style factors will continue to behave similarly in the future as they have in the past. This assumption lacks consensus and represents a key consideration for investors. Despite their success in explaining historic stock returns, multi-factor models face some theoretical difficulties. In particular, they do not address why a premium should result from investing in high value, small size, high momentum, low volatility, and high quality stocks. Unlike the CAPM, which provides an intuitive justification for returns (high systematic risk = high return), the connection between style factors and returns is not so clear. Even Fama and French question their own model’s theoretical underpinnings. In a 1996 paper they wrote:
“[have] we simply found three [factors] that provide a parsimonious description of returns and average returns, and so can absorb most of the CAPM anomalies? In other words, without knowing why, have we stumbled on… the three factor model?”
The genesis of style factor return premia is still open to interpretation, but explanations generally fall into one of three categories:
• Risk-Based explanations imply that volatility alone is not enough to describe risk and that measures like Sharpe Ratio do not offer true representations of risk-adjusted performance. In other words, style factor investors earn a premium because they are actually bearing more risk.
• Structural explanations assert there are constraints that prevent the CAPM assumptions from holding. The most common of these explanations is that if investors are unable to use leverage, but have high return requirements, they have no choice but to invest in high beta assets. This creates inefficiencies as high beta assets become mispriced relative to the market.
• Behavioral explanations suggest that investors are prone to persistent behavioral biases that ultimately manifest as factor anomalies.

Northern Trust Asset Management 8
FOUNDATIONS IN FACTORS
Table 1 contains a curated list of selected research representing the three categories of factor rationale.
TABLE 1: COMMON STYLE FACTOR INTERPRETATIONS
Factor Rationale
Value “Loss Aversion” bias is the source of the value anomaly. Stocks that have performed poorly recently are perceived to be more risky and therefore receive a higher discount rate, pushing their price below equilibrium. This mispricing eventually reverts, leaving value stocks with higher returns (Barberis and Huang, 2001 and Lakonishok, Shleifer, and Vishney, 1994).
Value firms have less flexibility to adapt to unfavorable economic conditions due in part to higher financial leverage and uncertainty in future earnings (Cochrane, 1991, 1996, and Zhang, 2005)
Value stocks are “neglected” and may not be sought after by all groups of investors even though they are mispriced (Arbel, Carvell and Strebel, 1983)
Small Size Small stocks earn a premium due to lower liquidity (Amihud, 2002) and greater default risk (Vassalou and Xing, 2004)
Only certain investors have the resources to gather information on small, relatively opaque companies. Concerns about asymmetric information could be an important reason why some investors do not invest at all in small firms (Klein and Bawa, 1977 and Merton, 1987).
Equity funds have a preference towards stocks with high visibility and low transaction costs, causing small-cap stocks to be undervalued relative to large caps (Falkenstein, 1996)
Momentum Momentum can be viewed as an under-reaction to new information (Hong, Lim and Stein, 2000)
Institutional constraints and long lead times can lead to momentum under certain conditions – related to information diffusion (Vayanos and Woolley, 2011)
Herding mentality and the behavioral tendency to chase past performance can also explain momentum (Dasgupta, Prat and Verardo, 2011)
Low Volatility Investor overconfidence and willingness to pay a premium for a small chance of earning large returns (known as the “lottery effect”) leads to a demand for high-volatility stocks that is not warranted by fundamentals (Baker, Bradley and Wurgler, 2011, and Blitz and van Vliet, 2007)
Fixed-benchmark mandates discourage investment in low-volatility and low-beta stocks that have high marginal contributions to active risk. As a result, demand for low-beta stocks tends to lag (Baker, Bradley and Wurgler, 2011).
Investors are leverage constrained and seek higher returns in riskier stocks. This causes the price of high-beta assets to be bid up. In other words, low-beta assets would have higher required risk-adjusted returns (Frazzini and Pedersen, 2014).
Quality Empire building can be a significant headwind to stock prices. Evidence suggests that companies that are overly aggressive in their expansionary efforts tend to underperform (Titman, Wei and Xie, 2004).
Other aspects of high quality companies, including high earnings quality, are underappreciated by investors who are drawn to low quality and non-sustainable earnings (Sloan, 1996, Dechow, Ge and Schrand, 2010, and Perotti and Wagenhofer, 2014).
Among the rationales put forth, behavioral interpretations are arguably the most debated. Critics contend that investor behavior may change as they become aware of their own biases or savvy investors will find ways to arbitrage the mispricing away (or both). While certainly plausible, the natural rebuttal to this critique is to ask why this has not happened yet. Value investing traces back to Graham and Dodd’s seminal book Security Analysis (1934), while quality and low volatility anomalies have been documented since the early 1970s. A skeptic

Northern Trust Asset Management 9
FOUNDATIONS IN FACTORS
may claim that style factors were still relatively unknown until Fama and French popularized them in the early 1990s. While this may be true, evidence of factor anomalies is still prevalent following the publication of the Fama and French three factor model in 1993. This resilience makes it difficult to denounce style factors as a transient occurrence and compels investors to consider the merits of factors relative to traditional forms of active and passive investing.
THE PERILS OF FACTOR CYCLICALITY
Although the benefits of style factor investing are enticing to investors they should not be viewed as a free lunch. There are three deterrents that collectively create a high hurdle for style factor adoption:
1. Style factors are prone to sustained periods of underperformance
2. Investors commonly evaluate strategies on a three-to-five year horizon
3. Investors tend to resent losses more than they value gains of an equal amount
These considerations suggest style factor investors will be inclined to abandon the strategy at some point during the holding period, potentially to their detriment. To illustrate the challenge style factor investors face, we evaluate a hypothetical investment in the size factor12 depicted in Exhibit 4. The chart shows the cumulative return of the size factor strategy relative to the passive capitalization weighted index. Upward sloping periods coincide with the size strategy outperforming the passive index, while downward sloping periods denote times when the passive index performed better.
EXHIBIT 4: CUMULATIVE RELATIVE RETURN – SIZE STRATEGY PERFORMANCE (MSCI WORLD INDEX 1997-2018)
50
70
90
110
130
150
Size Strategy / MSCI World Index
Dec
-18
Dec
-17
Dec
-16
Dec
-15
Dec
-14
Dec
-13
Dec
-12
Dec
-11
Dec
-10
Dec
-09
Dec
-08
Dec
-07
Dec
-06
Dec
-05
Dec
-04
Dec
-03
Dec
-02
Dec
-01
Dec
-00
Dec
-99
Dec
-98
Dec
-97
Dec
-96
SOURCE: Northern Trust Quantitative Research, MSCI, Worldscope
Suppose for this example there were two investors on December 31, 1996, each of whom invested $100. The factor investor selected the size factor strategy, while the passive investor chose the market capitalization weighted index. By December 31, 2018, the factor investor had $521 compared to the passive investor’s $382, totaling 36% greater wealth. Upon initial review it appears the factor investor made a much better choice, but Exhibit 5 cautions a hasty conclusion.
12 The methodology for the size factor strategy mirrors the “Low Size” portfolios shown in Exhibit 3. The stocks belonging to the smallest 30th percentile of the MSCI World Index are capitalization weighted and rebalanced quarterly.
Longer investment horizons and diversification can smooth periods of underperformance.

Northern Trust Asset Management 10
FOUNDATIONS IN FACTORS
EXHIBIT 5: SIZE STRATEGY RELATIVE DRAWDOWN (MSCI WORLD INDEX 1997-2018)
-50%
-40%
-30%
-20%
-10%
0%
Dec
-18
Dec
-17
Dec
-16
Dec
-15
Dec
-14
Dec
-13
Dec
-12
Dec
-11
Dec
-10
Dec
-09
Dec
-08
Dec
-07
Dec
-06
Dec
-05
Dec
-04
Dec
-03
Dec
-02
Dec
-01
Dec
-00
Dec
-99
Dec
-98
Dec
-97
Dec
-96
SOURCE: Northern Trust Quantitative Research, MSCI, Worldscope
Immediately after initial investment, the passive investor began accruing more wealth than the factor investor. Three years into the investment, the factor investor had 40% less wealth ($103 vs. $172). After 64 months (April 2002), the factor investor finally caught up with the passive investor, and subsequently enjoyed higher wealth for the remainder of the holding period (the cumulative relative return stays above 100 beyond this point). This assumes, of course, that the factor investor remained invested. If the factor investor reassessed the size strategy within the first five years of investment, it is hard to imagine an outcome other than divestment. During the first 60 months, the factor investor was never better off than the passive investor, and at one point had as little as 60% of the passive investor’s wealth. In the unlikely event the factor investor stayed the course, their conviction was tested again during another severe drawdown exceeding 20% and lasting 37 months from March 2007 to April 2010.
Whether an investor chooses to stay invested or divest is not simply a matter of relative performance, though it is undoubtedly of chief concern. However, the role active return plays in the decision is more nuanced than it seems. The notion that investors resent losses more than they value gains of an equal amount is a key tenant of Prospect Theory (Kahneman and Tversky, 1979), which has seen wide application in finance. The authors define a utility function for returns, where λ is a measure of relative risk aversion:
U(r) = rα, for r ≥ 0
U(r) = λ(–r)β, for r < 0
Where 0 < α ≤ 1, 0 < β ≤ 1, λ > 1
The utility function13 for the size strategy is charted in both time-series and scatter-plot forms in Exhibit 6, where r represents the three year active return14 of the size strategy relative to the passive index; α = 0.5, β = 0.5, and λ = 2 (typical values used in Prospect Theory studies).
13 Utility is scaled by 100 for readability
14 A three year window was chosen to align with a typical frequency of investment manager review

Northern Trust Asset Management 11
FOUNDATIONS IN FACTORS
EXHIBIT 6: SIZE STRATEGY INVESTOR UTILITY (MSCI WORLD INDEX 2000-2003)
Rolli
ng 3
Yea
r Act
ive
Retu
rn
Rolli
ng 3
Yea
r Util
ity
-20%
-15%
-10%
-5%
0%
5%
10%
15%
20%
Active return
Dec-03Dec-02Dec-01Dec-00Dec-99-100
-75
-50
-25
0
25
50
75
100
Investor utility
SOURCE: Northern Trust Quantitative Research, MSCI, Worldscope
SIZE STRATEGY
-20% -15% -10% -5% 0% 5% 10% 15% 20%
-100
-60
-20
20
60
100
Rolling 3 Year Active Return
Rolli
ng 3
Yea
r Util
ity
SOURCE: Northern Trust Quantitative Research, MSCI, Worldscope

Northern Trust Asset Management 12
FOUNDATIONS IN FACTORS
The asymmetric nature of investor utility is apparent during this sample period, as the investor utility plots near the active return initially, but diverges once the active returns turn positive (April 2001). Exhibit 7 shows the average utility the factor investor experienced during this same time period in relation to the cumulative relative return.
EXHIBIT 7: AVERAGE SIZE STRATEGY INVESTOR UTILITY (MSCI WORLD INDEX 2000-2003)
Cum
ulat
ive
Rela
tive
Retu
rn
Ave
rage
3 Y
ear U
tility
50
60
70
80
90
100
110
120
130
140
150
Cumulative Relative Return
Dec-03Dec-02Dec-01Dec-00Dec-99-100
-75
-50
-25
0
25
50
75
100
Average Investor Utility
SOURCE: Northern Trust Quantitative Research, MSCI, Worldscope
So what do we make of this and how does it relate to the divestment decision? Consider April 2002 from the perspective of the factor investor (Exhibit 7). At this point in time, the investor has the same amount of wealth as the passive investor as denoted by a cumulative relative return value of 100. Thus, the investor should be neither satisfied nor dissatisfied with the strategy relative to the passive alternative. However, the average utility experienced during this period is negative (-23), suggesting the investment experience has been disappointing. This is intuitive, given the investor has weathered severe underperformance and has yet to experience greater relative wealth. If we have ever known an investor to declare “as soon as I make my money back I’m selling!”, then we can likely relate to the style factor investor’s psyche. Less than two years later, the investor has accrued almost 18% more wealth than the passive investor, yet the average utility over the life of the investment is barely positive (+1). This suggests, remarkably, that the style factor investor is indifferent about the strategy up to this point despite achieving an annualized active return of 2.5% since inception, due to the “pain” harbored from past losses.
We may conclude from this example that long-term performance alone is not a sufficient condition for successful style factor investing. The manner in which it is realized seems as much, if not more, important to investors. For this reason, cyclicality represents the biggest risk to style factor investors.
Unfortunately, the issue is pervasive among style factors. Table 2 details some of the most relevant metrics pertaining to cyclicality15.
15 Hit rate reflects the number of positive active return periods divided by the total number of periods

Northern Trust Asset Management 13
FOUNDATIONS IN FACTORS
TABLE 2: RELATIVE RISK SUMMARY FOR CAPM ANOMALIES (MSCI WORLD INDEX 1997 – 2018)
Book to Price
Earnings to Price
Dividend Yield Size Momentum
Low Volatility ROE
ROE Variability ROIC
Gross Profitability
Active Return 0.3% 3.2% 2.6% 1.5% 0.5% 0.4% 1.2% 0.9% 1.4% 2.0%
Tracking Error 7.0% 5.3% 6.0% 7.5% 6.1% 6.7% 2.8% 3.5% 4.1% 4.5%
Information Ratio 0.04 0.60 0.43 0.20 0.08 0.07 0.43 0.25 0.35 0.45
Deepest Relative -28.8% -12.7% -25.1% -40.0% -23.9% -23.6% -8.0% -11.7% -18.5% -19.7%
Drawdown [months] [50] [15] [31] [63] [126] [55] [68] [195] [106] [69]
Longest Relative -18.4% -9.0% -10.7% -40.0% -23.9% -18.4% -8.0% -11.7% -18.5% -19.7%
Drawdown [months] [94] [115] [84] [63] [126] [118] [68] [195] [106] [69]
Average Relative -7.3% -2.1% -3.5% -5.7% -6.5% -16.0% -2.1% -2.8% -3.1% -3.7%
Drawdown [months] [19.9] [7.1] [11.5] [13.3] [24.7] [63.3] [12.2] [19.9] [16.0] [12.7]
Rolling 3 Year Hit Rate 52.0% 70.3% 73.4% 65.9% 49.8% 57.6% 74.7% 64.2% 66.4% 70.7%
Rolling 5 Year Hit Rate 61.0% 78.0% 83.9% 82.9% 46.8% 72.7% 71.2% 67.8% 71.2% 71.2%
Average 3 year utility -3.3 9.6 8.0 5.4 -4.9 -2.7 3.5 1.0 1.4 3.3
Average 5 year utility 2.0 15.8 16.9 17.2 -7.7 3.8 4.1 2.8 3.1 4.4
SOURCE: Northern Trust Quantitative Research, MSCI, Worldscope
The first line of Table 2 is promising, as all anomalies report positive active return over the 22 year period. The rest of the data shows cause for concern. Apart from ROE, all anomalies have a relative drawdown in excess of -19% or a recovery period in excess of 100 months (or both). Investors who evaluate strategy performance on a three year horizon would be, on average, unhappy with book to price, momentum, and low volatility factors despite earning positive active return over the holding period. Collectively, the data paints a grim picture for style factor investors, as the length and depth of drawdowns threaten to force divestment. If style factors are to be useful for investors, the downturns must become shorter and shallower.
DIVERSIFY WITHIN AND ACROSS FACTORS
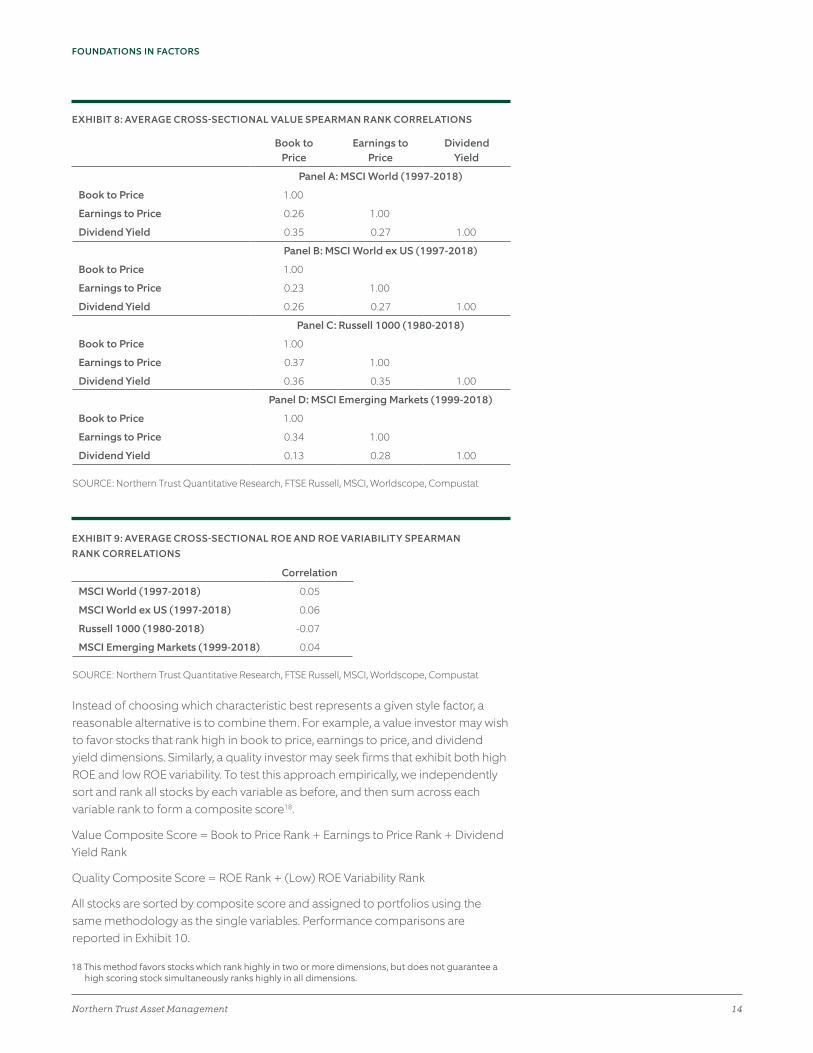
Fortunately for investors there are a number of techniques to mitigate the risk of cyclicality. One of the most prominent methods involves a concept that predates style factor investing itself – diversification. Among the anomalies presented thus far, three are related to value (book to price, earnings to price, and dividend yield) and four are related to quality (ROE, ROE variability, ROIC, and gross profitability). The question of which anomaly, or group of anomalies, best represents a given style factor is a topic of much debate and beyond the scope of this paper, as it is as much a theoretical matter as an empirical one. Yet from a statistical perspective, the correlations16 reported in Exhibits 8 and 9 suggest the variables are not largely redundant, and therefore, may be useful in combination. In order to simplify cross comparability, ROIC and gross profitability are omitted since they are not computed for financials17.
16 Spearman’s rank correlation coefficient assesses how well two variables can be described using a monotonic function. It is chosen in this context because it maps directly to the sorting procedure used for portfolio formation, and is therefore a parsimonious metric for describing how similar sorted portfolios are across variables.
17 The insights offered by these ratios do not apply to financial firms. For example, cost of goods sold has little meaning for a retail bank or insurance company.
Northern Trust Asset Management 14
FOUNDATIONS IN FACTORS
EXHIBIT 8: AVERAGE CROSS-SECTIONAL VALUE SPEARMAN RANK CORRELATIONS
Book to Price
Earnings to Price
Dividend Yield
Panel A: MSCI World (1997-2018)
Book to Price 1.00
Earnings to Price 0.26 1.00
Dividend Yield 0.35 0.27 1.00
Panel B: MSCI World ex US (1997-2018)
Book to Price 1.00
Earnings to Price 0.23 1.00
Dividend Yield 0.26 0.27 1.00
Panel C: Russell 1000 (1980-2018)
Book to Price 1.00
Earnings to Price 0.37 1.00
Dividend Yield 0.36 0.35 1.00
Panel D: MSCI Emerging Markets (1999-2018)
Book to Price 1.00
Earnings to Price 0.34 1.00
Dividend Yield 0.13 0.28 1.00
SOURCE: Northern Trust Quantitative Research, FTSE Russell, MSCI, Worldscope, Compustat
EXHIBIT 9: AVERAGE CROSS-SECTIONAL ROE AND ROE VARIABILITY SPEARMAN RANK CORRELATIONS
Correlation
MSCI World (1997-2018) 0.05
MSCI World ex US (1997-2018) 0.06
Russell 1000 (1980-2018) -0.07
MSCI Emerging Markets (1999-2018) 0.04
SOURCE: Northern Trust Quantitative Research, FTSE Russell, MSCI, Worldscope, Compustat
Instead of choosing which characteristic best represents a given style factor, a reasonable alternative is to combine them. For example, a value investor may wish to favor stocks that rank high in book to price, earnings to price, and dividend yield dimensions. Similarly, a quality investor may seek firms that exhibit both high ROE and low ROE variability. To test this approach empirically, we independently sort and rank all stocks by each variable as before, and then sum across each variable rank to form a composite score18.
Value Composite Score = Book to Price Rank + Earnings to Price Rank + Dividend Yield Rank
Quality Composite Score = ROE Rank + (Low) ROE Variability Rank
All stocks are sorted by composite score and assigned to portfolios using the same methodology as the single variables. Performance comparisons are reported in Exhibit 10.
18 This method favors stocks which rank highly in two or more dimensions, but does not guarantee a high scoring stock simultaneously ranks highly in all dimensions.
Northern Trust Asset Management 15
FOUNDATIONS IN FACTORS
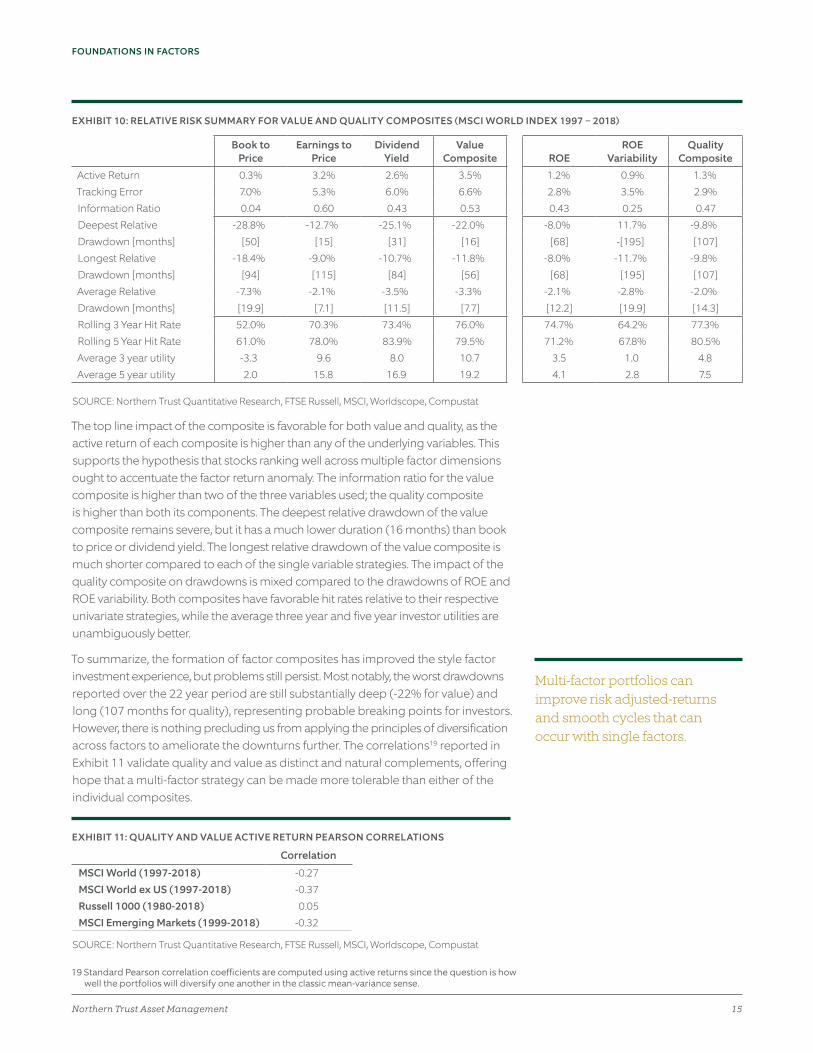
EXHIBIT 10: RELATIVE RISK SUMMARY FOR VALUE AND QUALITY COMPOSITES (MSCI WORLD INDEX 1997 – 2018)
Book to Price
Earnings to Price
Dividend Yield
Value Composite ROE
ROE Variability
Quality Composite
Active Return 0.3% 3.2% 2.6% 3.5% 1.2% 0.9% 1.3%Tracking Error 7.0% 5.3% 6.0% 6.6% 2.8% 3.5% 2.9%Information Ratio 0.04 0.60 0.43 0.53 0.43 0.25 0.47Deepest Relative -28.8% -12.7% -25.1% -22.0% -8.0% 11.7% -9.8%Drawdown [months] [50] [15] [31] [16] [68] -[195] [107]Longest Relative -18.4% -9.0% -10.7% -11.8% -8.0% -11.7% -9.8%Drawdown [months] [94] [115] [84] [56] [68] [195] [107]Average Relative -7.3% -2.1% -3.5% -3.3% -2.1% -2.8% -2.0%Drawdown [months] [19.9] [7.1] [11.5] [7.7] [12.2] [19.9] [14.3]Rolling 3 Year Hit Rate 52.0% 70.3% 73.4% 76.0% 74.7% 64.2% 77.3%Rolling 5 Year Hit Rate 61.0% 78.0% 83.9% 79.5% 71.2% 67.8% 80.5%Average 3 year utility -3.3 9.6 8.0 10.7 3.5 1.0 4.8Average 5 year utility 2.0 15.8 16.9 19.2 4.1 2.8 7.5
SOURCE: Northern Trust Quantitative Research, FTSE Russell, MSCI, Worldscope, Compustat
The top line impact of the composite is favorable for both value and quality, as the active return of each composite is higher than any of the underlying variables. This supports the hypothesis that stocks ranking well across multiple factor dimensions ought to accentuate the factor return anomaly. The information ratio for the value composite is higher than two of the three variables used; the quality composite is higher than both its components. The deepest relative drawdown of the value composite remains severe, but it has a much lower duration (16 months) than book to price or dividend yield. The longest relative drawdown of the value composite is much shorter compared to each of the single variable strategies. The impact of the quality composite on drawdowns is mixed compared to the drawdowns of ROE and ROE variability. Both composites have favorable hit rates relative to their respective univariate strategies, while the average three year and five year investor utilities are unambiguously better.
To summarize, the formation of factor composites has improved the style factor investment experience, but problems still persist. Most notably, the worst drawdowns reported over the 22 year period are still substantially deep (-22% for value) and long (107 months for quality), representing probable breaking points for investors. However, there is nothing precluding us from applying the principles of diversification across factors to ameliorate the downturns further. The correlations19 reported in Exhibit 11 validate quality and value as distinct and natural complements, offering hope that a multi-factor strategy can be made more tolerable than either of the individual composites.
EXHIBIT 11: QUALITY AND VALUE ACTIVE RETURN PEARSON CORRELATIONS
Correlation
MSCI World (1997-2018) -0.27MSCI World ex US (1997-2018) -0.37Russell 1000 (1980-2018) 0.05MSCI Emerging Markets (1999-2018) -0.32
SOURCE: Northern Trust Quantitative Research, FTSE Russell, MSCI, Worldscope, Compustat
19 Standard Pearson correlation coefficients are computed using active returns since the question is how well the portfolios will diversify one another in the classic mean-variance sense.
Multi-factor portfolios can improve risk adjusted-returns and smooth cycles that can occur with single factors.

Northern Trust Asset Management 16
FOUNDATIONS IN FACTORS
Exhibit 12 reports the results of a simple 50/50 allocation to both factors, rebalanced semi-annually.
EXHIBIT 12: RELATIVE RISK SUMMARY FOR VALUE AND QUALITY COMBINATION (MSCI WORLD INDEX 1997 – 2018)
Value Composite
Quality Composite Multi-Factor
Active Return 3.5% 1.3% 2.5%
Tracking Error 6.6% 2.9% 3.2%
Information Ratio 0.53 0.47 0.78
Deepest Relative -22.0% -9.8% -11.2%
Drawdown [months] [16] [107] [15]
Longest Relative -11.8% -9.8% -4.1%
Drawdown [months] [56] [107] [72]
Average Relative -3.3% -2.0% -1.3%
Drawdown [months] [7.7] [14.3] [6.2]
Rolling 3 Year Hit Rate 76.0% 77.3% 79.0%
Rolling 5 Year Hit Rate 79.5% 80.5% 87.3%
Average 3 year utility 10.7 4.8 10.5
Average 5 year utility 19.2 7.5 17.3
SOURCE: Northern Trust Quantitative Research, MSCI, Worldscope
The results reveal the multi-factor strategy captures the best attributes of both contributing strategies. The active return is an average of the two composites (as expected), but the diversification benefit results in a tracking error of only 3.2% relative to the passive capitalization weighted index. The increase in the information ratio corresponds to a rolling 3 year hit rate approaching 80%, and positive average utilities reflect consistent investor satisfaction. The collective improvement to these metrics is exemplified by the smooth upward trend in the cumulative relative return shown in Exhibit 13.
EXHIBIT 13: CUMULATIVE RELATIVE RETURN VALUE AND QUALITY MULTI-FACTOR STRATEGY PERFORMANCE (MULTI-FACTOR STRATEGY/MSCI WORLD INDEX)
50
75
100
125
150
175
200
Multi-Factor Strategy / MSCI World Index
Dec
-18
Dec
-17
Dec
-16
Dec
-15
Dec
-14
Dec
-13
Dec
-12
Dec
-11
Dec
-10
Dec
-09
Dec
-08
Dec
-07
Dec
-06
Dec
-05
Dec
-04
Dec
-03
Dec
-02
Dec
-01
Dec
-00
Dec
-99
Dec
-98
Dec
-97
Dec
-96
SOURCE: Northern Trust Quantitative Research, MSCI, Worldscope

Northern Trust Asset Management 17
FOUNDATIONS IN FACTORS
The deepest relative drawdown of the multi-factor strategy is only 15 months in duration, and the longest relative drawdown is substantially shallower than either of the individual composites. The average relative drawdown has been reduced to 130 basis points, lasting a little over 6 months. Exhibit 14 shows the dramatic improvement of the drawdown profile of the multi-factor strategy, mitigating both the steep drawdowns of the value strategy (2000 and 2016) and the protracted underperformance of the quality strategy (2003-2012).
EXHIBIT 14: VALUE AND QUALITY MULTI-FACTOR STRATEGY RELATIVE DRAWDOWN (MSCI WORLD INDEX 1997-2018)
-25%
-20%
-15%
-10%
-5%
0%
Multi-Factor StrategyQuality CompositeValue CompositeD
ec-1
8
Dec
-17
Dec
-16
Dec
-15
Dec
-14
Dec
-13
Dec
-12
Dec
-11
Dec
-10
Dec
-09
Dec
-08
Dec
-07
Dec
-06
Dec
-05
Dec
-04
Dec
-03
Dec
-02
Dec
-01
Dec
-00
Dec
-99
Dec
-98
Dec
-97
Dec
-96
SOURCE: Northern Trust Quantitative Research, MSCI, Worldscope
As demonstrated in this example, diversification is an effective means of mitigating style factor cyclicality, but it is only one of several tools available. A number of considerations must be taken into account in order to deliver the benefits of style factors in a manner acceptable for investors. A few of the most important determinants are listed below.
Considerations for style factor design
• Exogenous systematic risks often accompany style factor strategies, potentially creating significant tracking error. Examples include fundamental risk factors such as industries and countries, and macroeconomic risks such as growth and inflation. Factors may be designed to minimize these extraneous risks without sacrificing the style factor risk premium.
• Structural differences across sectors (industries) and regions (countries) can make cross comparing style factors difficult. Much of the academic research excludes financials for this very reason; Fama and French (1992) and Novy-Marx (2013) are notable examples. Naïve factor definitions that fail to acknowledge the unique economics or accounting standards of a particular industry group or region may become persistently biased.
Factor diversification is an effective means of mitigating style factor cyclicality.

Northern Trust Asset Management 18
FOUNDATIONS IN FACTORS
Considerations for style factor implementation
• Style factors are not perfectly independent from one another, and the relationships among them vary over time. An effective multi-factor strategy must account for this to prevent the style factor premium from becoming diluted. For example, high value stocks tend to be high volatility, and high momentum stocks become synonymous with low value during periods of valuation multiple expansion. If investors are not careful, the manner in which they diversify style factors can lead to loss of active return.
• Style factor volatilities differ significantly, which can lead to concentrated active risk. A simplistic multi-factor weighting scheme often results in the active return being heavily influenced by one or two strategies. Low volatility strategies are the most common example, as they notoriously generate high levels of tracking error relative to the other style factors and tend to dominate active risk when used in combination.
While factor cyclicality cannot be completely eliminated, factor strategies which account for these considerations exhibit downturns which are significantly shorter and shallower than naïve alternatives. Given the importance of factor cyclicality on the investment outcome, it is imperative that investors are mindful of these issues when evaluating a factor strategy.
Defining factors using multiple signals can improve the targeting of factor premium.

Northern Trust Asset Management 19
FOUNDATIONS IN FACTORS
CONCLUSION
Style factors have been shown to historically deliver superior risk-adjusted returns than passive capitalization weighted indexes and more persistent performance than traditional active management, making them a compelling alternative for investors. The benefits of style factors come with the cost of cyclicality, exposing investors to the risk of sustained underperformance.
Style factor cyclicality may be mitigated by employing multi-dimensional factor definitions and diversifying across factors, in addition to other methods of reducing risk without sacrificing return. Through intelligent factor design and implementation, drawdowns can be made less severe, which makes it easier for investors to stay the course. Given the potential benefits style factors afford, we recommend investors seek out portfolios designed explicitly to improve the investor experience and avoid divestment.
Factors can be used to deliver superior risk-adjusted returns.
Multi-dimensional factor definitions and diversifying across factors can reduce risk without sacrificing returns.
How helpful was this article?

Northern Trust Asset Management 20
FOUNDATIONS IN FACTORS
Appendix A: Stock Variable Details
Variable Definition (formula)
Book to Price Total stockholders’ equity / Total market capitalization
Total stockholders’ equity = Total common equity + Nonredeemable preferred stock
Earnings to Price T12M Earnings per share including extraordinary items / Price
Dividend Yield Indicated annual dividends per share / Price
Indicated annual dividends per share = Quarterly dividends per share including special dividends multiplied by 4
Size Log of Total market capitalization
Momentum T12M Total return - T1M Total return
Volatility T1Y Daily price volatility
Return on Equity (ROE) (T12M Net income - T12M Preferred dividends) / T12M Average total common equity
Return on Equity Variability (ROE Variability)
Standard deviation of the last 4 years of quarterly ROE
*Return on Invested Capital (ROIC) T12M Net operating profit after tax / T12M Average total invested capital
Net operating profit after tax = Earnings from continuing operations before interest expense and income taxes - Income taxes
Total invested capital = Total common equity + Total long term debt + Minority interest + Preferred stock
*Gross Profitability (T12M total revenue - T12M Cost of goods sold) / T12M Average total assets
*Only computed for non-financial stocksT12M = Trailing 12 monthT1M = Trailing 1 monthT1Y = Trailing 1 year
All United States data is sourced from Compustat; all Global data is sourced from Worldscope.
In order to limit the degree of bias on the analysis, each variable is ranked and sorted on a region and sector relative basis. Region membership is determined in accordance with Fama and French (2012), and two sector classifications are used to distinguish between financial and non-financial stocks. A stock is classified as financial if it has an MSCI GICS Sector designation of either “Financials” or
“Real Estate”, otherwise it is classified as non-financial. Any analysis reported for variables denoted as only computed for non-financial stocks should not be directly compared to other variable analysis including both sectors.

Northern Trust Asset Management 21
FOUNDATIONS IN FACTORS
Appendix B: Equally Weighted Average Annual Returns and Capm Coefficients of Anomalies
Slope coefficients and test statistics from regressions of the form:
(Rt,i – Rt,f) = αi + βi(Rt,m – Rt,f) + εt,i
Russell 1000 (1980 - 2018)
MSCI World ex US (1997 - 2018)
MSCI Emerging Markets (1999 - 2018)
CAPM coefficients CAPM coefficients CAPM coefficients
Variable PortfolioAvg EW Return
α [t-stat] β
Avg EW Return
α [t-stat] β
Avg EW Return
α [t-stat] β
Book to Price Top 16.4% 2.8% 1.08 10.3% 2.9% 1.11 17.2% 4.9% 1.08[1.71] [1.46] [2.14]
Bottom 13.2% -0.6% 1.15 5.9% -0.6% 0.97 11.8% 1.3%] 0.93[-0.68] [-0.79] [0.96
Earnings to Price Top 17.2% 4.3% 0.99 10.3% 3.1% 1.07 18.9% 6.8% 1.04[3.20] [1.82] [3.87]
Bottom 12.9% -2.3% 1.34 6.5% -0.4% 1.04 10.6% -0.6% 1.02[-1.76] [-0.35] [-0.33]
Dividend Yield Top 15.9% 4.4% 0.83 11.7% 4.7% 1.00 18.3% 7.4% 0.91[3.40] [2.75] [4.39]
Bottom 13.8% -1.5% 1.33 4.1% -2.9% 1.09 10.7% -1.2% 1.10[-1.23] [-3.24] [-0.70]
Size Top 12.9% 0.3% 1.00 6.7% 0.1% 0.98 11.6% 0.8% 0.97[0.82] [0.18] [1.12]
Bottom 15.9% 1.3% 1.21 8.9% 1.7% 1.08 15.9% 4.3% 1.01[0.82] [0.94] [1.97]
Momentum Top 16.7% 3.2% 1.07 9.4% 2.9% 0.91 17.2% 6.1% 0.94[2.84] [2.64] [3.28]
Bottom 11.9% -2.4% 1.23 4.8% -2.5% 1.17 10.9% -1.0% 1.10[-1.24] [-1.18] [-0.43]
Volatility Top 13.1% -3.9% 1.59 5.9% -2.2% 1.34 13.5% -0.5% 1.31[-1.94] [-1.18] [-0.21]
Bottom 14.0% 4.5% 0.68 9.1% 3.7% 0.70 12.9% 4.5% 0.69[4.08] [3.18] [3.72]
ROE Top 15.5% 2.0% 1.07 7.9% 1.1% 1.00 15.6% 4.4% 0.97[2.45] [1.17] [3.35]
Bottom 13.3% -1.1% 1.23 7.4% 0.4% 1.07 11.8% 0.2% 1.06[-0.77] [0.26] [0.08]
ROE Variability Top 14.5% -0.3% 1.26 7.1% -0.2% 1.12 13.2% 0.8% 1.14[-0.28] [-0.14] [0.41]
Bottom 14.9% 3.3% 0.84 8.7% 2.4% 0.88 14.1% 4.2% 0.84[3.44] [2.22] [3.20]
ROIC Top 15.5% 1.9% 1.09 8.1% 1.5% 0.97 15.1% 4.4% 0.93[2.15] [1.52] [3.37]
Bottom 13.6% -1.0% 1.25 7.6% 0.7% 1.04 10.6% -0.7% 1.04[-0.62] [0.46] [-0.39]
Gross Profitability Top 16.5% 2.9% 1.08 8.6% 2.2% 0.92 15.3% 5.0% 0.88[2.78] [2.30] [4.01]
Bottom 12.2% -0.7% 1.05 7.3% 0.6% 0.98 10.0% -1.1% 1.01[-0.60] [0.40] [-0.57]
SOURCE: Northern Trust Quantitative Research, FTSE Russell, MSCI, Worldscope, Compustat, Kenneth French Data Library

Northern Trust Asset Management 22
FOUNDATIONS IN FACTORS
Appendix C: Fama-MacBeth Regression Results of Anomalies
The Fama-MacBeth (1973) regression framework is a method of testing the predictive ability of variables among a cross-section of security returns over time. This framework has been applied to three distinct broad capitalization markets: the United States (Russell 3000 Index), developed markets excluding the United States (MSCI World ex US Investable Market Index), and emerging markets (MSCI Emerging Markets Investable Market Index). Point-in-time historical equity betas are sourced from MSCI Barra20. All other variables have been winsorized21 and standardized to limit the effect of outliers and make comparisons of coefficients meaningful.
Each table reports the average slope coefficients and Newey-West (1987) test-statistics from regressions of forward 1 month returns on equity beta and one additional variable (apart from Model 1 which only includes equity market beta). Apart from size, the test statistics demonstrate strong support for the predictive power of each variable independent of equity beta. In each market, size shows a positive coefficient, implying large stocks outperform small stocks (it is worth noting that none of the test statistics are significant at any meaningful threshold). These results are inconsistent with notion that small cap investors earn a premium over large cap investors, and have not gone unnoticed (e.g. Dichev (1998) and Horowitz, Loughran, and Savin (2000)). Though still subject to debate, it is generally accepted that the small cap premium becomes observable after controlling for other variables (Asness, Frazzini, Israel, Moskowitz, and Pedersen (2015)).
20 MSCI Barra USE3 Risk Model is used for historical betas estimates for US stocks. MSCI Barra GEM Risk Model is used for all non-US stocks.
21 Variables have been winsorized at the 1 percent level. Winsorization and standardization are applied on a region and sector relative basis.

Northern Trust Asset Management 23
FOUNDATIONS IN FACTORS
Table A: Russell 3000 (1980-2018)
Slope coefficients and test statistics from regressions of the form:
rt+1,i = βίXt + εt,i
Independent variables (Model 1) (2) (3) (4) (5) (6) (7) (8) (9) (10) (11)
Intercept 0.97 0.96 0.94 0.93 0.99 1.01 0.72 0.96 1.03 0.99 0.99
[5.14] [5.07] [4.90] [4.63] [5.16] [5.24] [3.04] [5.05] [5.94] [4.92] [5.01]
Equity market beta 0.05 0.06 0.08 0.09 0.03 0.01 0.21 0.07 0.05 0.04 0.04
[0.36] [0.46] [0.67] [0.75] [0.26] [0.10] [2.17] [0.56] [0.29] [0.33] [0.28]
Book to Price 0.08
[1.11]
Earnings to Price 0.27
[3.57]
Dividend Yield 0.12
[2.13]
Size 0.05
[0.82]
Momentum 0.32
[4.23]
Volatility -0.36
[-2.85]
ROE 0.27
[4.27]
ROE Variability -0.16
[-4.16]
ROIC 0.24
[3.25]
Gross Profitability 0.19
[4.60]
R-squared 0.02 0.03 0.03 0.02 0.03 0.03 0.04 0.03 0.03 0.03 0.02
SOURCE: Northern Trust Quantitative Research, FTSE Russell, MSCI, Compustat

Northern Trust Asset Management 24
FOUNDATIONS IN FACTORS
Table B: MSCI World ex US IMI (2004-2018)
Slope coefficients and test statistics from regressions of the form: rt+1,i = βίXt + εt,i
Independent variables (Model 1) (2) (3) (4) (5) (6) (7) (8) (9) (10) (11)
Intercept 0.76 0.82 0.74 0.79 0.78 0.83 0.49 0.73 0.73 0.78 0.76
[3.11] [3.43] [3.09] [3.29] [3.20] [3.40] [1.73] [3.00] [3.01] [3.17] [3.11]
Equity market beta -0.13 -0.18 -0.11 -0.15 -0.14 -0.20 0.16 -0.09 -0.09 -0.13 -0.12
[-0.37] [-0.58] [-0.31] [-0.47] [-0.43] [-0.64] [0.59] [-0.26] [-0.26] [-0.38] [-0.35]
Book to Price 0.07
[0.81]
Earnings to Price 0.13
[3.43]
Dividend Yield 0.15
[2.84]
Size 0.03
[0.50]
Momentum 0.29
[3.55]
Volatility -0.31
[-3.23]
ROE 0.10
[2.67]
ROE Variability -0.13
[-4.05]
ROIC 0.10
[2.35]
Gross Profitability 0.08
[1.84]
R-squared 0.02 0.03 0.02 0.02 0.02 0.03 0.03 0.02 0.02 0.02 0.02
SOURCE: Northern Trust Quantitative Research, MSCI, Worldscope

Northern Trust Asset Management 25
FOUNDATIONS IN FACTORS
Table C: MSCI Emerging Markets IMI (2004-2018)
Slope coefficients and test statistics from regressions of the form: rt+1,i = βíXt + εt,i
Independent Variables (Model 1) (2) (3) (4) (5) (6) (7) (8) (9) (10) (11)
Intercept 0.91 0.95 0.88 0.90 0.96 1.02 0.74 0.84 0.90 0.92 0.88
[2.30] [2.39] [2.24] [2.27] [2.40] [2.41] [1.53] [2.14] [2.26] [2.28] [2.13]
Equity market beta -0.04 -0.06 0.00 -0.03 -0.08 -0.13 0.14 0.04 0.01 -0.10 -0.06
[-0.13] [-0.22] [-0.01] [-0.09] [-0.29] [-0.50] [0.61] [0.12] [0.02] [-0.32] [-0.20]
Book to Price 0.17
[2.30]
Earnings to Price 0.20
[4.44]
Dividend Yield 0.20
[3.50]
Size 0.03
[0.38]
Momentum 0.26
[2.27]
Volatility -0.17
[-1.56]
ROE 0.14
[2.68]
ROE Variability -0.19
[-4.62]
ROIC 0.10
[1.85]
Gross Profitability 0.12
[2.30]
R-squared 0.01 0.02 0.01 0.01 0.02 0.02 0.02 0.01 0.01 0.01 0.01
SOURCE: Northern Trust Quantitative Research, MSCI, Worldscope

Northern Trust Asset Management 26
FOUNDATIONS IN FACTORS
REFERENCES
Amihud, Yakov, “Illiquidity and stock returns: cross-section and time-series effects”, Journal of Financial Markets, Volume 5, Issue 1, Pages 31-56, 2002
Arbel, A., Carvell, S., and Strebel, P. “Giraffes, institutions and neglected firms”, Financial Analysts Journal, 39(3), 57-63, 1983
Asness, Cliff S. and Frazzini, Andrea and Israel, Ronen and Moskowitz, Tobias J. and Pedersen, Lasse Heje, “Size Matters, If You Control Your Junk”, Fama-Miller Working Paper, 2015
Baker, Malcolm and Bradley, Brendan and Wurgler, Jeffrey, “Benchmarks as Limits to Arbitrage: Understanding the Low Volatility Anomaly”, Financial Analysts Journal, 67 (1), 2010
Barberis, N. and M. Huang, “Mental Accounting, Loss Aversion, and Individual Stock Returns.” Journal of Finance 56, 1247-1292, 2001
Blitz, David C. and van Vliet, Pim, “The Volatility Effect”, The Journal of Portfolio Management, 34 (1), 102-113, 2007
Bollen, N., and J. Busse, ‘‘On the Timing Ability of Mutual Fund Managers,’’ Journal of Finance, 56, 1075–1094, 2001
Brennan, M. J., “Taxes, Market Valuation and Corporate Financial Policy”, National Tax Journal XXIII (4): 417–428, 1970
Brown, S. and W. Goetzmann, ‘‘Performance Persistence,’’ Journal of Finance, 50, 679–698, 1995
Carhart, M. M., “On Persistence in Mutual Fund Performance”, Journal of Finance 52 (1): 57-82, 1997
Cochran, John H., “Production‐Based Asset Pricing and the Link Between Stock Returns and Economic Fluctuations”, Journal of Finance, Volume 46, Issue 1, Pages 209-237, 1991
Cochran, John H., “A Cross-Sectional Test of an Investment-Based Asset Pricing Model”, Journal of Political Economy, vol. 104, issue 3, 572-621, 1996
Daniel, K., M. Grinblatt, S. Titman, and R. Wermers, ‘‘Measuring Mutual Fund Performance with Characteristic-Based Benchmarks,’’ Journal of Finance, 52, 1035–1058, 1997
Dasgupta, Amil and Prat, Andrea and Verardo, Michela, “The Price Impact of Institutional Herding”, The Review of Financial Studies, Volume 24, Issue 3, Pages 892–925, 2011
Dechow, Patricia and Ge, Weili and Schrand, Catherine, “Understanding earnings quality: A review of the proxies, their determinants and their consequences”, Journal of Accounting and Economics, vol. 50, issue 2-3, 344-401, 2010
Dichev, Ilia D., “Is the Risk of Bankruptcy a Systematic Risk?”, Journal of Finance, Vol 53, 1998
Falkenstein, Eric G., “Preferences for Stock Characteristics as Revealed by Mutual Fund Portfolio Holdings”, Journal of Finance, Volume 51, Issue 1, Pages 111-135, 1996
Fama, Eugene F. and French, Kenneth R., “The Cross-Section of Expected Stock Returns”, Journal of Finance, Vol. 47, No. 2, 1992
Fama, Eugene F. and French, Kenneth R., “Common risk factors in the returns on stocks and bonds”, Journal of Financial Economics, Volume 33, Issue 1, Pages 3-56, 1993
Fama, Eugene F. and French, Kenneth R., “Size, Value, and Momentum in International Stock Returns”, Journal of Finance Economics, 105 (3), pp. 457-472, 2012
Fama, Eugene F. and MacBeth, James D., “Risk, return, and equilibrium: Empirical tests” Journal of political economy, 81.3, 607-636, 1973

Northern Trust Asset Management 27
FOUNDATIONS IN FACTORS
Frazzini, Andrea and Pedersen, Lasse, “Betting against beta”, Journal of Financial Economics, vol. 111, issue 1, 1-25, 2014
Goetzmann, W. and R. Ibbotson, ‘‘Do Winners Repeat? Patterns in Mutual Fund Performance”, Journal of Portfolio Management, 20, 9–18, 1994
Graham, Benjamin and Dodd, David, “Security Analysis”, Whittlesey House, McGraw-Hill Book Co., 1934
Grinblatt, M., and M. Keloharju, ‘‘The Investment Behavior and Performance of Various Investor Types: A Study of Finland’s Unique Data Set,’’ Journal of Financial Economics, 55, 43–67, 2000
Gruber, M., ‘‘Another Puzzle: The Growth in Actively Managed Mutual Funds,’’ Journal of Finance, 51, 783–810, 1996
Haugen, Robert A. and Heins, A. James, “Risk and the Rate of Return on Financial Assets: Some Old Wine in New Bottles”, The Journal of Financial and Quantitative Analysis, Vol. 10, No. 5, pp. 775-784, 1975
Hendricks, D., J. Patel, and R. Zeckhauser, ‘‘Hot Hands in Mutual Funds: Short-Run Persistence of Performance, 1974–1988,’’ Journal of Finance, 48, 93–130, 1993
Hong, Harrison, and Lim, Terence, and Stein, Jeremy C., “Bad News Travels Slowly: Size, Analyst Coverage, and the Profitability of Momentum Strategies”, Volume 55, Issue 1, Pages 265-295, 2000
Horowitz, Joel L. and Loughran, Tim and Savin, N. E., “The disappearing size effect”, Research in Economics, Vol. 54, Issue 1, 83-100, 2000
Jensen, Michael C. and Black, Fischer and Scholes, Myron S., “The Capital Asset Pricing Model: Some Empirical Tests”, STUDIES IN THE THEORY OF CAPITAL MARKETS, Praeger Publishers Inc., 1972
Klein, Roger and Bawa, Vijay S., “The effect of limited information and estimation risk on optimal portfolio diversification”, Journal of Financial Economics, vol. 5, issue 1, 89-111, 1977
Lakonishok, Josef and Vishny, Robert W. and Shleifer, Andrei, “Contrarian Investment, Extrapolation, and Risk”, Journal of Finance, Vol. XLIX, No. 5, pp. 1541-1578, 1994
Litzenberger, R. H., “The Effects of Dividends on Common Stock Prices Tax Effects or Information Effects?”, Journal of Finance XXXVI (2), 1982
Kahneman, D., and Tversky, A., “Prospect Theory: An Analysis of Decision under Risk”, Econometrica, XLVII, 263-291, 1979
Merton, Robert, “A Simple Model of Capital Market Equilibrium with Incomplete Information”, Journal of Finance, vol. 42, issue 3, 483-510, 1987
Newey, Whitney K. and West, Kenneth D., “A Simple, Positive Semi-Definite, Heteroskedasticity and Autocorrelation Consistent Covariance Matrix”, Econometrica, 55.3, 703-708, 1987
Nofsinger, J., and R. Sias, ‘‘Herding and Feedback Trading by Institutional and Individual Investors,’’ Journal of Finance, 54, 2263–2295, (1999)
Novy-Marx, Robert, “The Other Side of Value: The Gross Profitability Premium”, Journal of Financial Economics, 108(1), 1-28, 2013
Perotti, Pietro and Wagenhofer, Alfred, “Earnings Quality Measures and Excess Returns”, Journal of Business Finance and Accounting, Volume 41, Issue 5-6, Pages 545-571, 2014
Sharpe, William F., “Capital asset prices: A theory of market equilibrium under conditions of risk”, Journal of Finance XIX (3): 425-42, 1964
Sloan, Richard G., “Do Stock Prices Fully Reflect Information in Accruals and Cash Flows about Future Earnings?”, The Accounting Review, Vol. 71, No. 3, pp. 289-315, 1996

Northern Trust Asset Management 28
FOUNDATIONS IN FACTORS
IMPORTANT INFORMATION. The information contained herein is intended for use with current or prospective clients of Northern Trust Investments, Inc. The information is not intended for distribution or use by any person in any jurisdiction where such distribution would be contrary to local law or regulation. Northern Trust and its affiliates may have positions in and may effect transactions in the markets, contracts and related investments different than described in this information. This information is obtained from sources believed to be reliable, and its accuracy and completeness are not guaranteed. Information does not constitute a recommendation of any investment strategy, is not intended as investment advice and does not take into account all the circumstances of each investor.
This report is provided for informational purposes only and is not intended to be, and should not be construed as, an offer, solicitation or recommendation with respect to any transaction and should not be treated as legal advice, investment advice or tax advice. Recipients should not rely upon this information as a substitute for obtaining specific legal or tax advice from their own professional legal or tax advisors. References to specific securities and their issuers are for illustrative purposes only and are not intended and should not be interpreted as recommendations to purchase or sell such securities. Indices and trademarks are the property of their respective owners. Information is subject to change based on market or other conditions.
Investing involves risk- no investment strategy or risk management technique can guarantee returns or eliminate risk in any market environment.
Forward-looking statements and assumptions are Northern Trust’s current estimates or expectations of future events or future results based upon proprietary research and should not be construed as an estimate or promise of results that a portfolio may achieve. Actual results could differ materially from the results indicated by this information.
Past performance is no guarantee of future results. Performance returns and the principal value of an investment will fluctuate. Performance returns contained herein are subject to revision by Northern Trust. Comparative indices shown are provided as an indication of the performance of a particular segment of the capital markets and/or alternative strategies in general. Index performance returns do not reflect any management fees, transaction costs or expenses. It is not possible to invest directly in any index. Gross performance returns contained herein include reinvestment of dividends and other earnings, transaction costs, and all fees and expenses other than investment management fees, unless indicated otherwise.
Northern Trust Asset Management is composed of Northern Trust Investments, Inc., Northern Trust Global Investments Limited, Northern Trust Fund Managers (Ireland) Limited, Northern Trust Global Investments Japan, K.K., NT Global Advisors, Inc., 50 South Capital Advisors, LLC, and personnel of The Northern Trust Company of Hong Kong Limited and The Northern Trust Company.
© 2019 Northern Trust Corporation. Head Office: 50 South La Salle Street, Chicago, Illinois 60603 U.S.A. northerntrust.com
northerntrust.com Q62646 (6/19)
Titman, Sheridan, and Wei, K. C. John and Xie, Feixue, “Capital Investments and Stock Returns”, The Journal of Financial and Quantitative Analysis, Vol. 39, No. 4, pp. 677-700, 2004
Vassalou, Maria and Xing, Yuhang, “Default Risk in Equity Returns”, Journal of Finance, vol. 59, issue 2, 831-868, 2004
Vayanos, Dimitri and Woolley, Paul, “An Institutional Theory of Momentum and Reversal”, The Review of Financial Studies, Volume 26, Issue 5, Pages 1087–1145, 2013
Zhang, Lu, “The Value Premium”, The Journal of Finance, Vol. 60, No. 1, pp. 67-103, 2005