foundational and methodological issues in validity for complex
TRANSCRIPT

1
Foundational and Methodological Issues in Validity for Complex Measurement Systems
Bruno D. ZumboUniversity of British Columbia
Presentation at the 9 th annual Maryland invitational assessment conference, “The Concept of Validity:
Revisions, New Directions and Applications”, University of Maryland, College Park, MD
October 9-10, 2008
About the author: Bruno D. Zumbo is Professor of Measurement Evaluation and Research Methodology, as well as member of the Department of Statistics and the Institute of Applied Mathematics at the University of British Columbia. His primary interests are in psychometrics, statistical science, and the mathematical and philosophical foundations of measurement. For more information go to: http://www.ecps.educ.ubc.ca/faculty/b_zumbo.htm

2
Opening Remarks
� My program of research on validity has focused around four themes:– Foundations:
• I have taken a view of “validity” as the explanatio n for the test score variation, and validation as the process of developing and testing the explanation. Meta-theory being my focus (e.g., Zumbo, 2005, 2007a, 2007b).
– Statistical & methodological ideas and techniques:• Particular focus on latent variable modeling (e.g., DIF, Pratt
Indices, multi-group factor analysis, IRT invarianc e).– Multi-level construct validation (Zumbo & Forer, in
press) for assessment systems like NAEP or EDI.– The use of validity (in particular Messick’s work) as
a framework for program evaluation (book by Ruhe & Zumbo, 2009, Guilford Press).
Today >
Today >
3
Opening Remarks� My primary goal today is to describe some new
methods for validation.� However, I believe, that one needs to articulate
what they mean by “validity” to go hand-in-hand with the process of validation. So, I need to delve into the foundations.
� First, it is important to note that there is a parallel between:
Methodology ↔ Method
Validity ↔ Validation
4
Three Sections of Today’s presentation
�Section #1: Validity�Section #2: Method #1: Variable
Ordering, Pratt Index�Section #3: Method #2: Draper-Lindley-
de Finetti (DLD) framework, strength of inferences.
� Lots of material so I will pick and choose as we mo ve along.

5
Section 1Therefore, let me begin by stating what I see as “v alidity”
and then in later sections turn to some new methods to aid in the process of validation.
� What is my view of validity that my new validation methods are aimed to support … a reliance on explanation.
� Re-reading classic papers from my explanation-focus ed view

6
Opening Remarks
• I want to consider “validity” for any kind of test or measure in social, behavioral, educational or health research, testing, or assessment settings.� This general objective has me focusing on a meta-
theory of validity rather than a tailored context for only, for example, cognitive, educational, language, or behavioral measures.
� My aim is to think broadly so as to embrace and show the relation between many of the prominent views of validity with an eye toward some synthesis.

7
A brief look at various measurement approaches
� Psychometric Tradition, for example:– Correlational or Predictive (criterion)
approaches• the criterion• a criterion
– Content Validity– Construct Validity – an explanatory focus
� Abstract / Meta-Measurement Approaches:– Representational theorem
– (e.g., Suppes & Zinnes)
– Additive or conjoint measurement
Today’s focus
An alternative to “validity”.
Not dealt with.

8
Validity: An over-the-shoulder look back
� Angoff (1988), Kane (2001), Hubley and Zumbo (1996), and Jonson and Plake (1998) provide histories and overviews of validity theory.
� In brief, the early- to mid-1900s were dominated by the criterion-based model of validity, with some focus on content-based validity models.
� The early 1950s saw the introduction of, and move toward, the construct model with its emphasis on construct validity; a seminal piece being Cronbach and Meehl (1955).

9
Validity: An over-the-shoulder look back� The period post Cronbach and Meehl, mostly the 1970 s to date,
saw the construct model take root.– The measurement community delve into a moral founda tion to validity
and testing by expanding to include the consequence s of test use and interpretation (both Cronbach and Messick lead the way on this)
� Clearly, the early- to mid-1900s in the history of v alidity reflected Psychology’s focus on observed behavior and learnin g theories. – In the 1960s the precursors to what we now call the cognitive
revolution of the 1970s could be clearly seen.� It is worth noting that a subtle but important shif t happened with
Cronbach & Meehl’s (1955) publication wherein the d ominant view of measures changed from being “predictive devices” to being “signs”.– I believe that the operationalism that rest at the core of the predictive
model (prior to 1950s) was de-emphasized by Cronbac h and Meehl in favor of the nomological network as supporting mean ingfulness. (tests/measures as reflective of an unobserved phenomenon – i.e., construct).

10
Validity
� Work has still gone on, however, at the foundations of validity. Very good work in this tradition include:
• Cronbach’s later view of validity as a process of s ocial rhetorical arguments, and
• Mike Kane’s view of validity as a process of system atic arguments and chains of inferences.
• Borsboom, Mellenbergh, and Van Heerden (2004) who argue that a test is valid for measuring an attribu te if and only if the attribute exists and variations in the attribute causally produce variations in the outcomes of the measurement procedure. .

11
Validity
� I take a different position herein and elsewhere (e.g., Zumbo, 2005, 2007) than Cronbach, Kane, and Borsboom and his colleagues.
� My view is that validity is a matter of inference and the weighing of evidence, and that explanatory considerations guide our inferences.
� My current leanings are toward inferences to the best explanation … I was influenced heavily by Bill Rozeboom and hence I lean toward abductive methods.

12
Validity
� In my view, in terms of the process of validation (as opposed to validity, itself).– The statistical methods, as well as the psychologic al
and more qualitative methods of psychometrics, work to establish and support the inference to the best explanation –
– This best explanation is “validity” itself; so that validity is the explanation, whereas the process of validation involves the myriad methods of psychometrics to establish and support that explanation.
– This is an interesting meta-theoretical place from which to re-read some classic papers in validity an d to try and synthesize various views of validity.

13
Validity
Re-Reading Cronbach & Meehl (1955) from my explanation focused view
� Cronbach and Meehl were also focused on providing an explanation; however, reflecting the individual differences psychological focus of the time period, the disposition (i.e, the construct) is all that is nee ded for the explanation. The construct was the explanation. – The terms attribute or construct are seen as synony ms for
disposition. It is noteworthy that many researchers read Cronbach & Meehl as referring to pre-dispositions - - when from a general read of Cronbach and Meehl it is suf ficient to think of it as a disposition.

14
ValidityRe-Reading Cronbach & Meehl (1955) from my explanat ion focused
view� From philosophy of science one sees three basic app roaches:
– Inferential approach (Hempel, Oppenheim) – Covering Law Approach.
• An explanation is a type of argument, with sentence s expressing laws of nature occurring essentially in the premises, and t he phenomenon to be explained as the conclusion. Also included in the p remises can be sentences describing antecedent conditions.
– Causal approach (Salmon, Lewis) –• An explanation is a description of the various caus es of the
phenomenon: to explain is to give information about the causal history that led to the phenomenon.
– Pragmatic approach (van Fraassen) –• An explanation is a body of information that implie s that the
phenomenon is more likely than its alternatives, wh ere the information is of the sort deemed "relevant" in that context, a nd the class of alternatives to the phenomenon are also fixed by th e context. This approach highlights the importance of context to ex planation.
From: Lyle Zynda’s Lectures on the Philosophy of Sc ience

15
ValidityRe-Reading Cronbach & Meehl (1955) from my
explanation focused view� You will see that my own leanings are more Pragmati c,
whereas Borsboom et al. appear to be leaning toward the Causal, and Cronbach & Meehl are Inferential. – These may appear subtle but are important differenc es.
� Therefore, the strength of Cronbach and Meehl’s wor k is that they conceptualized validity as explanation rather than prediction/correlation. – This is important because, in its essence, statist ical prediction
on its own does not necessarily impart understandin g. Our ability to give explanations precedes any scientifi c knowledge.
� Over-and-above the concern for the “nomological network” notion, the major limitation of Cronbach an d Meehl’s contribution is that like its DN or coverin g law parents it treats explanations as context free.

16
What the view of validity and validation implies … Some summary remarks� It is important to highlight that, as Kane (2001)
reminds us, there are strong and weak forms of construct validity.
� The weak form is characterized by any correlation of the test score with another variable being welcomed as evidence for another “validity” of the test.
� That is, in the weak form, a test has as many “validities” and potential uses as it has correlations with other variables. – In contrast to the weak form of construct validity, the strong
form is based on a well-articulated (explanatory) t heory and well-planned empirical tests of that theory.

17
What the view of validity and validation implies … Some summary remarks� In short, the strong-form is theory-driven (à la
Cronbach & Meehl, 1955) whereas the weak form implies that a correlation with some criterion is sufficient evidence to use the test as a measure of that criterion.
� In my view (e.g., Zumbo, 2005, 2007), the strong form of construct validity should provide an explanation for the test scores, in the sense of the theory having explanatory power for the observed variation in test scores. – Pragmatic view of explanation, emphasizing the
context of explanation.

18
Transition to next section of the presentation
�Let me now turn to two methods I have developed to help with the explanatory task.

19
Section 2Method #1: Variable ordering, partitioning
the variation as a form of partitioning the validity.
Collaborative work with: Amery Wu, Yan Liu, and D. Roland Thomas.

20
Variable Ordering
� A common research question in studies using regression with latent variables (and regression more generally) is: which of the variables is most predictive of the criterion measure?
� The present study describes a series of statistical methods introduced by Thomas, Hughes, & Zumbo (1998), and Zumbo (2007) that allow one to answer this commonly found research and measurement validation question.

21
Variable Ordering
� My goal today is to whet your appetite and peak your curiosity about these methods, showing you how they may be useful to you.
� Given the range of topics in this session, I will resist my impulse to provide all the technical details and hence I will keep the equations to a minimum (one!). – I want to motivate and demonstrate these methods with
some examples … and, if time permits, maybe a bit of technical details at the end.

22
Current Problem in Regression
� In many research and test validation contexts the dependent variable is a composite of binary and/or ordinal categorical items (e.g., mathematics achievement).
� The common approach is to treat this test and/or scale scores as an observed score composite and use the composite score as variables in an analysis.
� The problem with this approach is that the regression results are biased by the measurement error in the observed composite score (e.g., Lu, Thomas, & Zumbo, 2005).
� Although widely known among statisticians, this bias is unfortunately ignored in most day-to-day research.

23
An Optimal Solution: MIMIC Models
� The more optimal statistical analysis, however, is to use latent variable multiple indicators multiple causes (MIMIC) models.
� MIMIC models, first described by Jöreskog and Goldberger (1975), – essentially posit a model stating that a set of possible
observed explanatory variables (sometimes called predictors or covariates) affects latent variables that are themselves indicated by other observed variables.

24
New MIMIC models for binary and ordinal indicator variables� Our examples highlight an important distinction between
the original MIMIC models discussed over the last three decades and the most recent developments in MIMIC methodology.
� In the original MIMIC work, the indicators of the latent variable(s) were all continuous variables. In our case, the indicators are binary or ordinal or Likert-type variables.
� This complicates the MIMIC modeling substantially and, until relatively recently, was a major impediment to using MIMIC models in (validation) research.

25
Merging of Statistical Concepts and Models: MIMIC / IRT� The recent MIMIC model for ordinal indicator variables is, in short, an
example of the merging of statistical ideas in generalized linear models (e.g., logit and probit models) and structural equation modeling into a generalized linear structural modeling framework (Jöreskog, 2002; Jöreskog, & Moustaki, 2001; Muthen, 1985, 1988, 1989).
� This new framework builds on the correspondence between factor analytic models and item response theory (IRT) models (see, for example, Lu, Thomas, & Zumbo, 2005) – and is a very general class of models that allows one to estimate group
differences, investigate predictors, and, for example, easily compute IRT with multiple latent variables (i.e., multidimensional IRT).
� Let me show you the (graphical models) from three examples from an international educational testing database -- TIMSS 2003 grade-8 mathematics tests … here they are, but I will come back to them again in this presentation.

26
Example I
Number⋮⋮⋮⋮⋮⋮⋮⋮N2
N8
N1eN1
eN2
eN8
N9eN9
binary
ordinal
Private Tutoring Time
Homework Time
Number of Books
Computer Availability

27
Example II
Number
Valuing Math
V1
eV1 eV2 eV3 eV4
ordinal
⋮⋮⋮⋮⋮⋮⋮⋮N2
N8
N1eN1
eN2
eN8
N9eN9
binary
ordinal
V2 V3 V4
Private Tutoring Time
Homework Time
Number of Books
Computer Availability

28
⋮⋮⋮⋮⋮⋮⋮⋮M1eM1
Measurement
eM6 ⋮⋮⋮⋮⋮⋮⋮⋮eG1
eG4 ⋮⋮⋮⋮⋮⋮⋮⋮eA1
eA5
Geometry
Algebra
Math
M6
G1
G4
A1
A5
eM
eG
eA
Example III
Valuing Math
Private Tutoring Time
Homework Time
Number of Books
Computer Availability
V1
eV1 eV2 eV3 eV4
V2 V3 V4
Binary and ordinal
ordinal

29
Method
Instrument� TIMSS 2003 grade-8 mathematics tests were used as our
mathematic achievement measure. A total of 12 booklets were used in the test. As for the purpose of demonstration, we only used one booklet (booklet 8) in the present study.
� Student’s questionnaire was used to obtain students’ background variables.
Sample� A total of 682 participants responding to booklet 8 with 324
boys and 358 girls.

30
What is the Pratt Index (for latent variables)
� Please see my papers for the technical details.
� The Pratt Index (Thomas, Hughes, & Zumbo, 1998) partitions the models R-squared attributable to each explanatory (predictor) variable by:
where bj is the standardized b-weight and rj is the correlation. Zumbo (2007) extended the Pratt method to latent variable regression models.
� We used Mplus 4.0 to fit the MIMIC models and get the appropriate regression and correlation coefficients using the correct correlation matrix involving binary, ordinal, and continuous observed variables.

31
Example I
Number⋮⋮⋮⋮⋮⋮⋮⋮N2
N8
N1eN1
eN2
eN8
N9eN9
binary
ordinal
Private Tutoring Time
Homework Time
Number of Books
Computer Availability

32
Results 1
Model- 1. DV: Number Knowledge
IV r Pratt
timehw 0.156 0.210 0.143
avlcompu 0.171 0.261 0.195
tutorhr -0.221 -0.245 0.236
numbook 0.275 0.355 0.426
R-squared 0.229
jb

33
Example II
Number
Valuing Math
V1
eV1 eV2 eV3 eV4
ordinal
⋮⋮⋮⋮⋮⋮⋮⋮N2
N8
N1eN1
eN2
eN8
N9eN9
binary
ordinal
V2 V3 V4
Private Tutoring Time
Homework Time
Number of Books
Computer Availability

34
Results 2
Model- 2. DV: Number Knowledge
IV r Pratt
timehw 0.157 0.210 0.072
avlcompu 0.170 0.260 0.097
tutorhr -0.219 -0.244 0.117
numbook 0.275 0.354 0.213
valuing 0.479 0.517 0.542
R-squared 0.457
jb

35
⋮⋮⋮⋮⋮⋮⋮⋮M1eM1
Measurement
eM6 ⋮⋮⋮⋮⋮⋮⋮⋮eG1
eG4 ⋮⋮⋮⋮⋮⋮⋮⋮eA1
eA5
Geometry
Algebra
Math
M6
G1
G4
A1
A5
eM
eG
eA
Example III
Valuing Math
Private Tutoring Time
Homework Time
Number of Books
Computer Availability
V1
eV1 eV2 eV3 eV4
V2 V3 V4
Binary and ordinal
ordinal

36
Results 3
Model- 3. 2nd order DV: Math
IV r Pratt
timehw 0.106 0.158 0.038
avlcompu 0.174 0.256 0.101
tutorhr -0.213 -0.240 0.116
numbook 0.269 0.337 0.205
valuing 0.489 0.535 0.592
R-squared 0.442
jb

37
Closing comments on variable ordering
� The Pratt index can be used in a variety of settings including – OLS regular regression (Thomas, Hughes, & Zumbo,
1998)– Discriminant analysis (Thomas, 1992; Thomas &
Zumbo, 1996)– Logistic regression (Thomas, Zhu, Zumbo, & Dutta,
in press) – Exploratory and confirmatory factor analysis (Wu,
2008)– Structural equation modeling -- Latent variable
regression (Zumbo, 2007, today’s presentation)

38
Section 3Method #2: Draper-Lindley-deFinetti (DLD) as an ove r-
arching framework of particular use with tests or measures that have a defined domain. Implications of the framework for modeling, model choice, invarianc e, spotlight on person sampling, expecting heterogeneity, etc..
This method has implications for content validity ( wherein we have enumeration as explanation) as well as psychometric modeling more generally.

39
Zumbo’s DLD Framework: Desired types of inferences
�Zumbo (2001, 2007) presented the following framework modeled on Draper’s (1995) approach to classifying causal claims in the social sciences and, in turn, on Lindley’s (1972) and de Finetti’s (1974-1975) predictive approach to inference.
�Unlike Draper, I focused on the inferences about items and persons made in assessment and testing.

40
DLD Framework: Desired types of inferences
�The foundation of the approach is the exchangeability of:
• Sampled and un-sampled respondents (i.e., examinees or test-takers); this could be based on the selection function for sub-populations.
• Realized and unrealized items.
�Exchangeable sub-populations of respondents and items.
41
DLD Framework: Desired types of inferences
�By exchangeability you can think of it in the purely mechanical sense.
� I have found this useful to help me think of the various possibilities, whether they happen regularly or not.
�This also helps me detail the range of conditions under which invariance is expected to hold.

42
DLD framework
� I present the DLD framework as a part of a methodological unfolding to help think about validity evidence and frame our thinking and work on validation.
�The DraperThe DraperThe DraperThe Draper----LindleyLindleyLindleyLindley----de Finetti (DLD) de Finetti (DLD) de Finetti (DLD) de Finetti (DLD) framework of measurement validity framework of measurement validity framework of measurement validity framework of measurement validity provides a useful overview of the assumptions that must be tested to validate the use of a psychometric instrument for specific research purposes.

43
Zumbo’s DLD framework
�This framework describes the the the the relationship between validity and relationship between validity and relationship between validity and relationship between validity and various forms of measurement various forms of measurement various forms of measurement various forms of measurement inference. The form of inference is inference. The form of inference is inference. The form of inference is inference. The form of inference is dependent upon: dependent upon: dependent upon: dependent upon: – 1) the degree to which the items are 1) the degree to which the items are 1) the degree to which the items are 1) the degree to which the items are
exchangeable, andexchangeable, andexchangeable, andexchangeable, and– 2) the degree to which the sampling units 2) the degree to which the sampling units 2) the degree to which the sampling units 2) the degree to which the sampling units
are exchangeableare exchangeableare exchangeableare exchangeable....

44

45
DLD: Various forms of inferences
� A distinction between four forms of inference is made:A distinction between four forms of inference is made:A distinction between four forms of inference is made:A distinction between four forms of inference is made:1)1)1)1) Initial calibrative inference: this form of inference does Initial calibrative inference: this form of inference does Initial calibrative inference: this form of inference does Initial calibrative inference: this form of inference does
not justify inferences beyond the particular sample from not justify inferences beyond the particular sample from not justify inferences beyond the particular sample from not justify inferences beyond the particular sample from which the data are obtained and the particular items that which the data are obtained and the particular items that which the data are obtained and the particular items that which the data are obtained and the particular items that were used.were used.were used.were used.
2)2)2)2) Specific sampling inference: allows for claims about the Specific sampling inference: allows for claims about the Specific sampling inference: allows for claims about the Specific sampling inference: allows for claims about the specific sample in which the measurement took place.specific sample in which the measurement took place.specific sample in which the measurement took place.specific sample in which the measurement took place.
3)3)3)3) Specific domain inference: allows for claims about what Specific domain inference: allows for claims about what Specific domain inference: allows for claims about what Specific domain inference: allows for claims about what is being measured.is being measured.is being measured.is being measured.
4)4)4)4) General measurement inference: allows for comparisons General measurement inference: allows for comparisons General measurement inference: allows for comparisons General measurement inference: allows for comparisons across measures and across different samples.across measures and across different samples.across measures and across different samples.across measures and across different samples.

46
Zumbo’s DLD Framework: Desired types of
inferencesLinking Strength of Inference to Invariance

47
A three-dimensional variant of DLD framework with Settings

48
A three dimensional variant of DLD with Time or Occurrences

49
A recent application of the DLD framework� Rick Sawatzky and Jacek Kopec recently
applied the DLD to computer adaptive testing (CAT) to highlight that CAT relies on general measurement inference because:1)The items are assumed to be interchangeable. This
is needed to ensure that the scores of individuals who answered different questions are comparable on the same scale.
2)The items parameters are assumed to be invariant. This is need to ensure that the scores of individua ls are comparable irrespective of any differences that might exist between individuals.

50
Application to computer adaptive testing (slide from Sawatzky & Kopec, 2008)
UnidimensionalityS
ampl
e ho
mog
enei
ty:
inva
rianc
e ↔
loca
l in
depe
nden
ce
Required for computer adaptive
testing
Required for computer adaptive
testing
51
DLD and CAT
� The DLD brings to the forefront the matter of sample homogeneity.– This is an important issue for all model based
measurement (and particularly IRT).– In essence this highlights that model driven
applications, like CAT, require that the sample is homogeneous with respect to the measurement model.
• For model based measurement practices, the model assumptions (such as unidimensionality and sample homogeneity) are part of the validity concerns.

52
Section 4Some concluding remarks

53
What the view of validity and validation implies … Some summary remarks� An important issue:
– When can we start using a measure? Or do we need t o establish the “validity” (i.e., the explanation for the test anditem response variation) before we can use the meas ure to make inferences and research conclusions?
• Answer: Explanation is a regulative ideal.
� What I am suggesting is that psycho-social, policy, and health studies research take on a robust and integrative research agenda in which the bounds and limitations of the inferences we can make from scor es (and hence ferreting out invalidity) becomes a core task of the research agenda.

54
What the view of validity and validation implies … Some summary remarks� The demands are high but I believe that they are in line
with the desires spelled out in the seminal paper b y Cronbach and Meehl (1955), read as a strong program of construct validity research.
� One thing that gets highlighted by the DLD framewor k is that, in general, in psychometrics do not unthinkingly assume homogeneity. – Work, where possible, with multi-level and latent c lass models.
� In the tradition of inference to the best explanati on (or abductive methods) the latent variables of factor analysis may take on an explanatory role.

55
THE END!
Thank you for your time.
For a copy of these slides and/or the forthcoming paper write to me via email at [email protected]

56
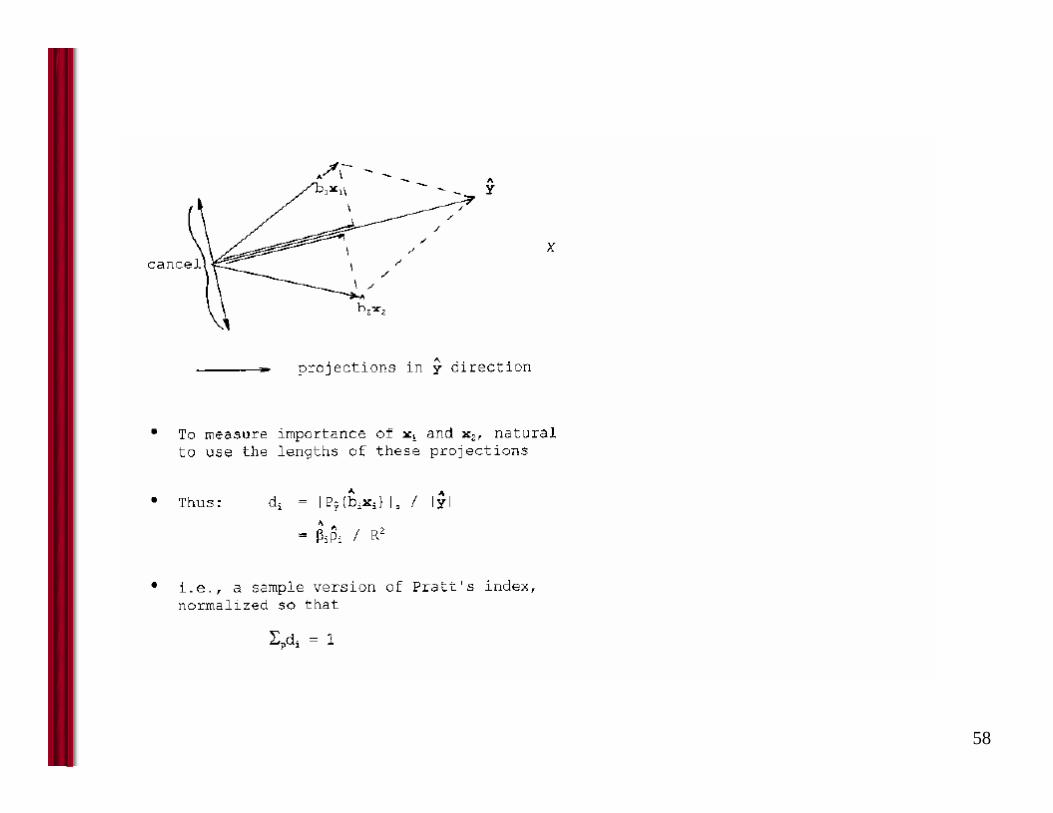
Appendix:If time permits, I cannot resist ...
� Here is a sketch of some details of what we call the “Pratt Index”.
� I was working on the geometry of least-squares and came across (a) D. Roland Thomas, and (b) what we later learned was an idea that was discussed, in a series of thick and dense analytic statements axiomatically showing variable ordering by John Pratt; hence the “Pratt Index”.
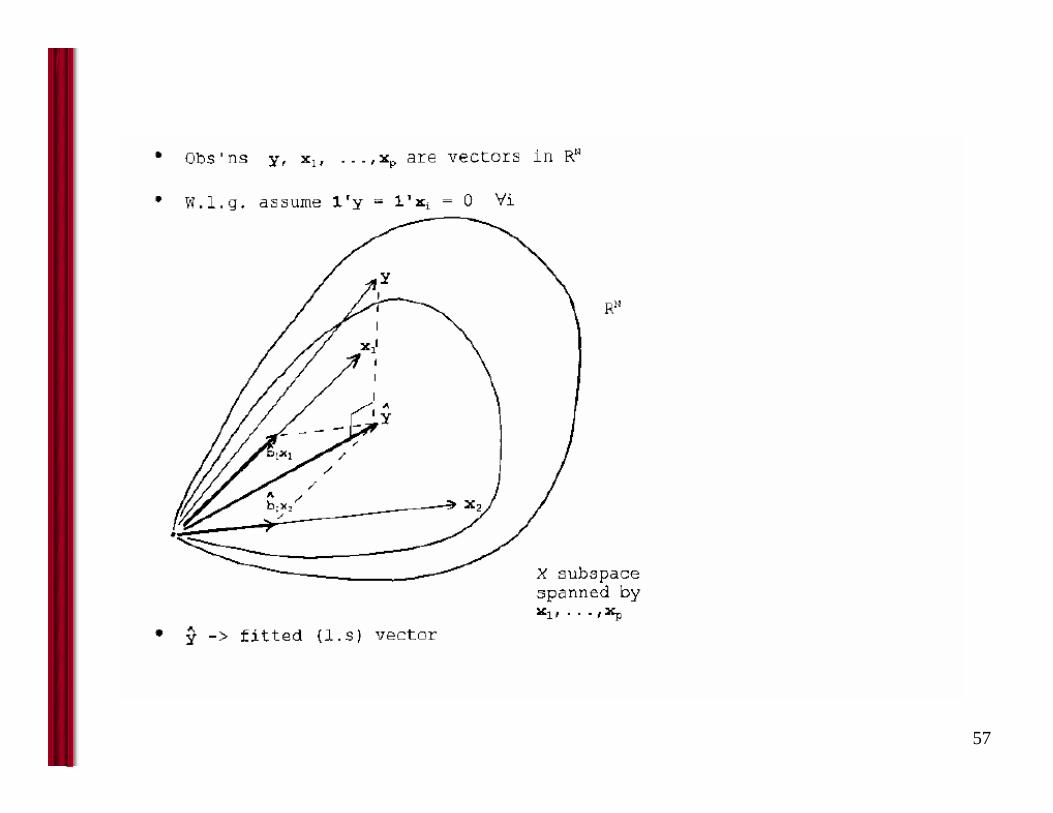
57
58

59

This docum
ent was created w
ith Win2P
DF
available at http://ww
w.w
in2pdf.com.
The unregistered version of W
in2PD
F is for evaluation or non-com
mercial use only.
This page w
ill not be added after purchasing Win2P
DF
.