foundation alternatives in dredge fill soils...
TRANSCRIPT

LOWLAND TECHNOLOGY INTERNATIONAL Vol. 15, No. 2, 1-14, December 2013International Association of Lowland Technology (IALT), ISSN 1344-9656
FOUNDATION ALTERNATIVES IN DREDGE FILL SOILS OVERLAYING ORGANIC CLAY
M. S. Islam 1, M. Nasrin 1 and A. J. Khan 1
ABSTRACT: Dhaka city has experienced a rapid growth of urban population for the last 40 years. This high population increase demands rapid expansion of the city. Unfortunately, most parts of the Dhaka city having competent subsoil for building construction are already exhausted. As such new areas are being reclaimed by both government and private agencies using dredge fill from nearby river sources. Sub-soil investigations have been carried out in different reclaimed areas within the city. It is found that top filling layer is non-plastic fine sand. Mean grain size of which varies from 0.15 to 0.20 mm. A very soft organic layer exists below the filling layer which is highly plastic and highly compressible. Field SPT N-value of filling layer and organic layer vary from 2 to 11 and 1 to 2, respectively. Attempts have been made to correlate unconfined compressive strength with SPT N-value, plasticity index, and organic content. Attempts have also been made to correlate compression index with organic content and initial void ratio of the soft organic clay. The correlations of the soil properties with organic content are variable and in most of the cases no definite correlations could be established. It has been observed that filling sand overlaying organic layer will badly affects the foundation on or having in it. Foundation alternatives have been suggested for the reclaimed areas in Dhaka city. Keywords: Dredge fill, reclaimed areas, soft organic clay, shear strength, compressibility characteristics.
1 Department of Civil Engineering, BUET, Dhaka 1000, BANGLADESH Note: Discussion on this paper is open until June 2014
INTRODUCTION Over the past 40 years, Dhaka city has experienced a
rapid growth of urban population and it will continue in the future due to several unavoidable reasons such as job opportunity, educational facilities and administrative units etc. Hence, most of the areas in Dhaka city having competent sub-soil for building construction have already been occupied. As a result, different new areas are being reclaimed inside and near Dhaka city by both government and private agencies. General practice for reclaiming such areas is to fill low lands (i.e., ditches, lakes etc.).
In most cases, the practice for developing new areas is just to fill low land by dredge fill materials. Different filling procedures are in practice to develop such land. One of them is to carry soil by vehicles from remote sources and manually dumped at the filling site. Due to huge traffic congestion, most widely used method in Dhaka is hydraulic filling procedure. In this procedure, soil is collected from riverbed by cutter-suction dredging into a barge, which is carried to the nearest river site. Soil is then pumped through the pipes in a slurry form after mixing with water, and transferred to the point of deposition, upon the surface and being filled. Large volume of fill material is required for the land filling in
reclaimed areas. Thus, fill materials are collected from riverbed and riverbank. Details about the land reclamation procedure using dredge fill material are described in Islam et al. (2010).
In most cases, the dredged material is silty sand with high fines content (Islam and Hossain 2010). The presence of fines in hydraulic fill means greater compressibility and greater difficulty in compaction of the fill. Fines also reduce permeability and hence the rate of drainage is slow. Therefore, consolidation rate is also slow. Since Dhaka city exists in seismic Zone 2 (peak ground acceleration, amax = 0.15g) of Bangladesh (BNBC, 1993), this top silty sand layer may liquefy.
Filling material is dumped directly upon the marshy low land. Generally, a soft organic layer exits on the bed of the marshy land. Again, after a certain time, the organic materials beneath the previous surface water are decomposed and a soft organic clay layer is produced. This soft organic clay layer may cause excessive settlement problem to the structures having shallow foundation on the top filling layer (Herle and Herle 2001; Zvanut 2003; Gabrys and Szymanski 2010). As well as, it may cause other foundation problems such as negative skin friction to the pile foundation. Negative skin friction produces a drag load that can be very large for long piles. Johannessen and Bjerrum (1965) and
- 1-

Islam, et al.
Bozozuk (1972) reported measurements of drag loads that exceed the allowable loads that ordinarily would have been applied to the piles in case of marine clay.
Some studies have been carried out to determine the characteristics of dredge fill layer of the reclaimed sites (Ahmed 2005; Hossain 2009 and Islam and Hossain 2010). Ahamed (2005) and Hossain (2009) investigated the liquefaction potential of some selected reclaimed areas of Dhaka city. Those studies mainly focused on the liquefaction problem/potential of such areas. To determine liquefaction potential, Ahmed (2005) used Standard Penetration Test (SPT) results. On the contrary, Hossain (2009) used both SPT results and shear wave velocity to determine the liquefaction potential. Islam and Hossain (2010) compared the liquefaction potential of Dhaka city determined based on SPT data with that of determined based on shear wave velocity. In the both cases, it is observed that there is a probability of liquefaction to occur in reclaimed areas of Dhaka city especially for the locations reclaimed by dredged soil up to the filling depth.
Again, different studies were conducted to know the characteristics of soft organic Dhaka clay (Islam et al. 2004 and Nasrin 2010) and Khulna soil (Rahman 2008; Islam et al. 2007; Ferdous 2007). However, none of these studies focused on the behaviour of soft organic layer beneath the filling layer of reclaimed areas of Dhaka city.
It is clear that the presence of the very soft clay layer beneath the filling layer, in reclaimed areas demand special attention for designing foundation systems on or through it. In Dhaka city the practice for subsoil investigation is very poor and many cases foundations are designed/constructed without proper geotechnical investigation. It is expected that this investigation will give a general picture of the subsoil characteristics of such areas and guidelines for the foundation designers. Therefore, it is felt necessary to carry out research to know the characteristics of the soft organic clay layer of such reclaimed areas and to propose suitable foundation alternatives. This paper presents the followings:
a) Sub-soil characteristics of dredge fill and soft organic layer of selected reclaimed areas of Dhaka city.
b) Correlation between different soil parameters. c) Foundation problems that may occur due to the
presence of the soft organic layer. d) Suitable foundation systems for the study areas.
STUDY AREAS
In total eight locations have been selected for this
study. However, detail sub-soil characteristics of four
locations have been presented herein. Both field and laboratory investigations were carried out at the selected four locations. These four areas have been given code name and these code names have been used subsequently in this paper instead of their original name. These are A-1, A-2, A-3 and A-4 instead of Mirpur DOHS, Banasree, Pink city and Hatir Jheel, respectively. Fig. 1 presents the locations of the study areas on Dhaka city map. These locations have been selected based on the past studies and importance of these areas.
PINK CITY
MIRPUR DOHS
BANASREE HATIR JHEEL
Study area
BASHUNDHARA
PURBACHAL
ADABOR
KAMRANGIRCHAR
Fig. 1 Locations of study areas on Dhaka city map TEST PROGRAM
Total fourteen borings have been conducted to know
the sub-soil characteristics at four locations and disturbed and undisturbed samples have been collected during boring. Two boreholes were drilled at A-1, three boreholes were drilled at A-2, four boreholes were drilled at A-3 and five boreholes were drilled at A-4 at close intervals. Field investigations have been performed in the form of Standard Penetration Test (SPT) in all the selected areas. Wash boring technique has been used for conducting SPT. Disturbed samples has been collected and SPT N-value recorded at every 1.5 m depth interval up to 20 m from Existing Ground Level (EGL). In addition, undisturbed samples have been collected from
- 2-

Foundation alternatives in dredge fill soils overlaying organic clay
black soft organic layer. Laboratory tests in terms of sieve-analysis, organic content test, Atterberg’s limit test, unconfined compression test and one-dimensional consolidation tests have been conducted in order to know the index properties, strength properties and compressibility properties of soil. Besides this, 50 boring data have been collected for six reclaimed sites (Bashundhara, Banasree, Mirpur DOHS, Purbachal, Kamrangirchar and Adabar) to estimate the liquefaction potential. All the tests were conducted according to ASTM standard (ASTM, 1989). RESULTS AND DISCUSSIONS
Field and laboratory tests have been conducted to
determine the physical and index properties of the sub-soil. During drilling the water table has been located and it was found that the water table exists between 0.6 and 7.0 m from EGL. Season of the sampling was varied. That’s why the water table varied in a wide range.
Sub-soil Characteristics
Characteristics of filling soil
In most cases, the dredged material is silty sand with high fines content. It is found that depth of filling layer varies from 1.5 to 5.5 m from EGL. The field SPT N-value of the filling layer varies from 1 to 5, 2 to 11, 1 to 5 and 2 to 12 for the areas A-1, A-2, A-3 and A-4, respectively. The field SPT N-value of the organic layer of all the study areas varies from 1 to 2. Variation of field SPT N-value with depth is presented in Fig. 2(a). Typical borelogs of the study areas are presented in Fig. 2(b).
It has been found that the value of specific gravity of the sand of the filling layer varies from 2.65 to 2.73. The physical and index properties of filling sand are summarised in Table 1. It is found that mean grain size (D50) and fines content (Fc) of the sand of the filling layer vary from 0.15 to 0.20 mm and 17.4 to 30.7%, respectively.
Characteristics of organic soil
Just below the sandy layer, a very soft layer of thickness 0.5 to 8.5 m exists. This soft soil is dark black in colour with organic content. Field SPT N-value of this layer varies from 1 to 2. More details about the characteristics of organic soil are available in Islam and Nasrin (2009).
It has been found that specific gravity of the organic layer varies from 2.29 to 2.59. Mean grain size (D50) and fines content (Fc) of organic layer shows constant value
of 0.01 mm and 100%, respectively. Index properties of organic clay are summarized in Table 2 and Table 3, respectively. It has been found that natural moisture content and dry unit weight of the soil from soft organic layer varies from 29.4 to 82.3% and 4.6 to 9.6 kN/m3, respectively. This result indicates that moisture content is very high and varies in large range. As well as, dry unit weight of this soft organic soil is very low. It has been found that organic content (OC) of the soft organic clay at A-1, A-2 and A-3 vary from 13.18 to 29.41%, 12.12 to 20.82% and 4.40 to 13.79%, respectively. Whereas, organic content of three samples were tested for the samples collected from the area A-4 and the OC was found to be same for all the three samples tested which was 14.25%.
5
10
15
20
25
30
0 25 50
A-1, BH-1A-1, BH-2A-3, BH-1A-3, BH-2A-3, BH-3A-3, BH-4A-2, BH-1A-2, BH-2A-2, BH-3A-4, BH-10A-4, BH-16
Dep
th f
rom
EG
L (m
)
SPT N-value
(a)
BH-1A-1
BH-2A-2
BH-1A-3
BH-10A-4
Filling sand
Black organic clay
Clayey silt
Grey soft silty clay
Dense fine sand
3
6
9
12
15
18
21
Depth(m)
0
(b)
Fig. 2 (a) Variation of SPT N-value with depth from EGL and (b) typical borelogs of different study areas
- 3-

Islam, et al.
Table 1 Physical properties of filling sand
Location BH No./Sample
No./Depth (m) Mean grain size, D50
(mm) Fines content, Fc
(%)
A-1 BH-1/D-1/1.5 0.180 23.6
BH-2/D-1/1.5 0.180 23.6
A-2
BH-1/D-2/3.0 0.180 28.4
BH-1/D-3/4.5 0.175 20.0
BH-2/D-2/3.0 0.148 26.7
BH-3/D-2/3.0 0.190 21.7
A-3
BH-1/D-2/3.0 0.150 27.6
BH-2/D-3/4.5 0.180 17.4
BH-3/D-2/3.0 0.170 21.7
A-4
BH-10/D-1/1.5 0.200 20.2
BH-16/D-4/6.0 0.180 29.4
BH-16/D-5/7.5 0.175 30.7
Table 2 Index properties and classification of soft organic clay
Location BH No./Sample No./
Depth (m) wn (%)
OC (%)
γd
(kN/m3) Classification
(USCS)
A-1 BH-1/UD-1/5.0 60 29.41 4.9~9.3 OH BH-2/UD-1/4.0 29 13.18 4.6~5.8 OH
A-2
BH-1/UD-1/5.5 44 20.82 8.8 OH BH-1/UD-2/7.0 84 5.05 12.1 OL BH-2/UD-1/5.5 50 14.40 8.0 OH BH-2/UD-2/7.0 64~81 12.12 8.4 OH BH-3/UD-1/5.5 69 16.40 9.0 OH BH-3/UD-2/7.0 81~82 15.10 8.8 OH
A-3
BH-1/UD-1/5.5 41~66 7.90 6.5 OL BH-1/UD-2/7.0 66 13.79 − OH BH-2/UD-1/5.5 35 12.70 − OH BH-2/UD-2/7.0 37~41 4.40 − OL BH-3/UD-1/5.5 42 8.80 9.4 OH BH-3/D-4/6.0 − − − OH
BH-3/UD-2/7.0 60~71 12.70 6.2 OH BH-4/UD-1/5.5 − − 9.5 OH
A-4
BH-3/UD-1/4.0 − − 11.5 − BH-3/UD-2/5.0 − − 11.7 − BH-9/UD-2/5.5 − − 12.5 −
BH-10/UD-1/2.0 − − 9.6 − BH-10/D-2/3.0 − 14.30 − OH BH-10/D-6/9.0 − − − OL
- 4-
Foundation alternatives in dredge fill soils overlaying organic clay
BH-15/UD-1/4.0 − − 5.4 −
BH-16/UD-1/2.0 − − 9.2 −
BH-16/D-2/3.0 − 14.20 − OH
Note: wn = Natural moisture content; OC = Organic content; d = Dry unit weight; OH = High compressibility and organic clay; OL = Medium compressibility and organic silt; ‘-’ = Data are not available.
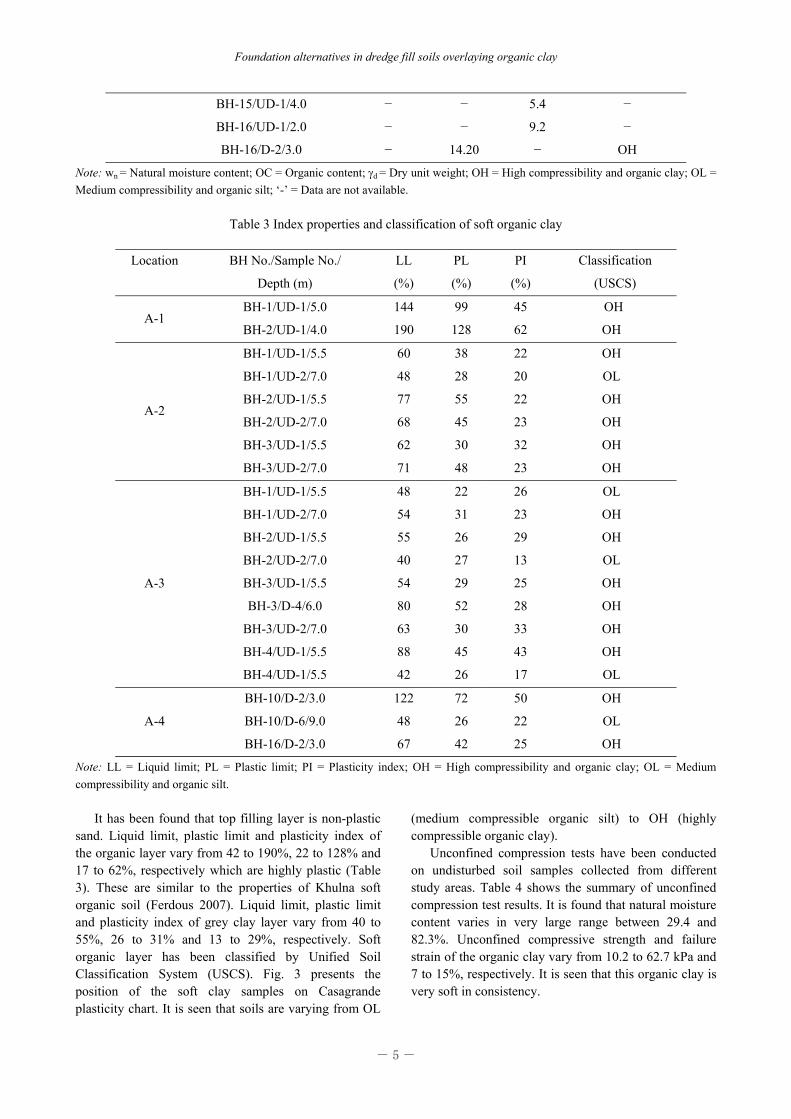
Table 3 Index properties and classification of soft organic clay
Location BH No./Sample No./
Depth (m)
LL
(%)
PL
(%)
PI
(%)
Classification
(USCS)
A-1 BH-1/UD-1/5.0 144 99 45 OH
BH-2/UD-1/4.0 190 128 62 OH
A-2
BH-1/UD-1/5.5 60 38 22 OH
BH-1/UD-2/7.0 48 28 20 OL
BH-2/UD-1/5.5 77 55 22 OH
BH-2/UD-2/7.0 68 45 23 OH
BH-3/UD-1/5.5 62 30 32 OH
BH-3/UD-2/7.0 71 48 23 OH
A-3
BH-1/UD-1/5.5 48 22 26 OL
BH-1/UD-2/7.0 54 31 23 OH
BH-2/UD-1/5.5 55 26 29 OH
BH-2/UD-2/7.0 40 27 13 OL
BH-3/UD-1/5.5 54 29 25 OH
BH-3/D-4/6.0 80 52 28 OH
BH-3/UD-2/7.0 63 30 33 OH
BH-4/UD-1/5.5 88 45 43 OH
BH-4/UD-1/5.5 42 26 17 OL
A-4
BH-10/D-2/3.0 122 72 50 OH
BH-10/D-6/9.0 48 26 22 OL
BH-16/D-2/3.0 67 42 25 OH
Note: LL = Liquid limit; PL = Plastic limit; PI = Plasticity index; OH = High compressibility and organic clay; OL = Medium compressibility and organic silt.
It has been found that top filling layer is non-plastic sand. Liquid limit, plastic limit and plasticity index of the organic layer vary from 42 to 190%, 22 to 128% and 17 to 62%, respectively which are highly plastic (Table 3). These are similar to the properties of Khulna soft organic soil (Ferdous 2007). Liquid limit, plastic limit and plasticity index of grey clay layer vary from 40 to 55%, 26 to 31% and 13 to 29%, respectively. Soft organic layer has been classified by Unified Soil Classification System (USCS). Fig. 3 presents the position of the soft clay samples on Casagrande plasticity chart. It is seen that soils are varying from OL
(medium compressible organic silt) to OH (highly compressible organic clay).
Unconfined compression tests have been conducted on undisturbed soil samples collected from different study areas. Table 4 shows the summary of unconfined compression test results. It is found that natural moisture content varies in very large range between 29.4 and 82.3%. Unconfined compressive strength and failure strain of the organic clay vary from 10.2 to 62.7 kPa and 7 to 15%, respectively. It is seen that this organic clay is very soft in consistency.
- 5-

Islam, et al.
0
20
40
60
80
100
120
140
0 50 100 150 200
A-1A-2A-3A-4
Plas
ticity
inde
x, P
I (%
)
Liquid limit, LL (%)
A-lineU-line
MH, OHCH, OH
CL,OL
ML,OL
Fig. 3 Position of the cohesive soil samples on Casagrande plasticity chart
Table 4 Strength properties of soft organic clay
Location
BH No./Sample No./Depth (m)
wn (%)
γd
(kN/m3) qu
(kPa) εf
(%)
A-1 BH-1/UD-1/6.5 60 4.9~9.3 16 15 BH-2/UD-1/4.0 29 4.6~5.8 50 13
A-2
BH-1/UD-1/5.5 81~82 8.8 10~11 1~14 BH-1/UD-2/7.0 44 12.1 42 15 BH-2/UD-1/5.5 84 8.0 13 15 BH-2/UD-2/7.0 50 8.4 39 10 BH-3/UD-1/5.5 64~81 9.0 13~62 15 BH-3/UD-2/7.0 69 8.8 50 7
A-3
BH-1/UD-1/5.5 41~66 6.5 10~33 13 BH-1/UD-2/7.0 66 − 6 13 BH-2/UD-1/5.5 35 − 66 9 BH-2/UD-2/7.0 37~41 − 12~58 14~15 BH-3/UD-1/5.5 42 9.4 36 12 BH-3/UD-2/7.0 60~71 6.2 11 9~12
Note: wn = Natural moisture content; qu = Unconfined compressive strength; su = Undrained shear strength; εf = Failure strain.
In some locations, a grey silty clay layer has been found beneath this soft organic layer. Natural moisture content of the soft grey layer varies from 34.9 to 66.1%. Unconfined compressive strength and failure strain of this layer have been found to vary from 5.7 to 66 kPa and 9 to 15%, respectively. This layer is also soft in nature (Terzaghi and Peck 1967).
One-dimensional consolidation tests have been conducted on undisturbed soil samples collected from
different study areas. Typical e-logP curves have been presented in Fig. 4. From the figure, it is seen that the elastic rebound of such samples are very low in comparison to that of inorganic soils. Table 5 and Table 6 present the one-dimensional consolidation test results. It has been found that initial void ratio (e0) and compression index (Cc) of soft clay samples vary from 1.50 to 3.88 and 0.44 to 1.25, respectively. It is also seen that e0 and Cc is very high that is similar to the properties
- 6-

Foundation alternatives in dredge fill soils overlaying organic clay
of other organic soil (Islam et al. 2004). It indicates that excessive settlement may occur to the structures having on it. Variation of recompression index (Cr) with compression index (Cc) is presented in Fig. 5. It is seen that in most of the cases compression index varies from 0.5 to 1.0. In addition, recompression index increases with increase of compression index.
Coefficient of volume compressibility (mv) varies from 0.06×10³ to 19.40×10³ kN/m2. Fig. 6(a) shows the variation of mv with effective vertical stress. It is seen that mv decreases with the increase of vertical effective stress. The coefficient of consolidation (cv) of samples have been computed using Eq. 1 (Das, 1983).
50
2848.0t
dcv (1)
where, cv = coefficient of consolidation; d = length of the maximum drainage path and t50 = time required for 50% consolidation.
The coefficient of consolidation (cv) varies from 0.20 to 17.25 m2/yr. Fig. 6(b) presents the variation of cv with effective stress. It is seen that cv also decreases with the increase of vertical effective stress. However, there are drastic variations in the values of cv. These values are very sensitive to t50 or t90, small change in time causes large change in cv value this might be the reason for such drastic variations. Coefficient of permeability, k of the soil samples has been estimated from one-dimensional consolidation tests using Eq. 2 (Taylor, 1984).
wvvmck (2)
where, cv = coefficient of consolidation; mv= coefficient of volume compressibility; w = unit weight of water.
0
1
2
3
4
10 100 1000
A-1, BH-1, D-6.7 mA-2, BH-2, D-7.3 mA-3, BH-1, D-6.4 mA-4, BH-16, D-7.5 m
Vertical effective stress (kPa)
Voi
d ra
tio, e
Fig. 4 Typical e-logP curves of organic clay samples
0
0.1
0.2
0.3
0.4
0.5
0 0.5 1 1.5
A-1A-2A-3A-4
Rec
ompr
essi
on in
dex,
Cr
Compression index, Cc
Fig. 5 Recompression index vs. compression index
Table 5 Compressibility properties of soft organic layer
Location BH No./Sample No./Depth (m)
e0 Cc Cr
A-1 BH-1/UD-1/5.5 1.50~3.70 0.44~1.25 0.16~0.44
BH-2/UD-1/4.0 2.85~3.88 0.77~1.07 0.29~0.32
BH-2/UD-2/6.0 2.02 0.73 0.13
A-2 BH-1/UD-1/5.5 1.76 0.66 0.06
BH-1/UD-2/7.0 0.87 0.33 0.03
BH-2/UD-1/5.5 1.82 0.81 0.07
BH-2/UD-2/7.0 1.82 0.53 0.06
BH-3/UD-1/5.5 1.63 0.63 0.05
BH-3/UD-2/7.0 1.63 0.78 0.07
- 7-

Islam, et al.
A-3 BH-1/UD-1/5.5 2.92 0.97 0.10
BH-3/UD-1/5.5 1.72 0.60 0.08
BH-3/UD-2/7.0 2.82 1.15 0.11
BH-4/UD-1/5.5 1.57 0.55 0.05
A-4 BH-3/UD-1/4.0 1.30 0.28 0.05
BH-3/UD-2/5.5 1.23 0.31 0.09
BH-9/UD-2/5.5 1.10 0.30 0.03
BH-10/UD-1/2.0 1.60 0.50 0.05
BH-15/UD-1/4.0 3.71 0.94 0.08
BH-16/UD-1/2.0 1.69 0.56 0.06 Note : e0 = Initial void ratio; Cc = Compression index; Cr = Recompression index
Table 6 Compressibility and permeability properties of soft organic layer
Location BH No./Sample No./ Depth (m)
cv
(m2/yr) mv
(kN/m2*103) k*10-9
(m/sec)
A-1
BH-1/UD-1/5.5 0.34~3.86 0.13~6.13 0.08~1.88
BH-2/UD-1/4.0 0.30~5.08 0.13~4.05 0.01~1.31
BH-2/UD-2/6.0 0.25~4.32 0.18~2.36 0.01~2.89
A-2
BH-1/UD-1/5.5 0.36~1.63 0.18~1.22 0.02~0.61
BH-1/UD-2/7.0 3.20~6.99 0.13~1.24 0.21~1.65
BH-2/UD-1/5.5 1.10~17.25 0.22~1.02 0.07~5.48
BH-2/UD-2/7.0 0.53~4.14 0.06~2.81 0.01~3.61
BH-3/UD-1/5.5 0.9~11.08 0.11~1.16 0.04~3.98
BH-3/UD-2/7.0 0.76~1.41 0.20~1.07 0.04~0.38
A-3
BH-1/UD-1/5.5 1.20~2.08 0.19~1.33 0.09~0.66
BH-3/UD-1/5.5 0.57~1.02 0.17~0.97 0.03~2.10
BH-3/UD-2/7.0 0.20~10.89 0.23~1.15 0.01~3.90
BH-4/UD-1/5.5 1.05~3.83 0.16~1.41 0.01~4.61
A-4
BH-3/UD-1/4.0 1.03~11.19 0.09~0.42 0.03~1.45
BH-3/UD-2/5.5 1.72~11.07 0.10~0.65 0.06~2.22
BH-9/UD-2/5.5 4.55~13.67 0.11~0.61 0.19~2.59
BH-10/UD-1/2.0 0.45~1.82 0.15~3.02 0.04~1.71
BH-15/UD-1/4.0 0.37~6.43 0.15~19.4 0.02~38.7
BH-16/UD-1/2.0 0.55~7.19 0.16~5.16 0.04~11.5
Note: cv = Coefficient of consolidation; mv= Coefficient of volume compressibility; k = Coefficient of permeability
- 8-

Foundation alternatives in dredge fill soils overlaying organic clay
10 100 1000
A-2, BH-1, UD-1A-2, BH-1, UD-2A-2, BH-2, UD-1A-2, BH-2, UD-2A-2, BH-3, UD-1A-2, BH-3, UD-2
0.0
0.5
1.0
1.5
2.0
2.5
3.0
Vertical effective stress (kPa)
Vol
ume
com
pres
sibi
lity
mv (k
N/m
2 *1
03 )
(a)
0
5
10
15
20
10 100 1000
A-2, BH1,UD1A-2, BH1, UD2A-2, BH2, UD1A-2, BH2, UD2A-2, BH3, UD1A-2, BH3, UD2
Coe
ffic
ient
of c
onso
lidat
ion
c v (m2 /y
r)
Vertical effective stress (kPa)
(b)
Fig. 6 (a) Coefficient of volume compressibility (mv) vs. vertical effective stress and (b) coefficient of consolidation (cv) vs. vertical effective stress
Permeability values of the soil samples have been presented in Table 6. It varies between 0.01×10⁻⁹ and 38.7×10⁻⁹ m/sec. This result indicates that permeability is very low, which are typical of soft clay behavior (Ferdous, 2007). Typical relationship between permeability and vertical effective stress at selected area of A-2 is presented in Fig. 7. It is seen that permeability decreases with the increase of effective stress. From Table 6, it is seen that the relationship between permeability and vertical effective stress is similar for other study areas.
Below this soft organic layer, medium stiff soft silty clay exists. Hard stratum of compacted dense sand has been found beneath this soft silty clay layer.
0
2
4
6
10 100 1000
A-2, BH-1, UD-1A-2, BH-1, UD-2A-2, BH-2, UD-1A-2, BH-2, UD-2A-2, BH-3, UD-1A-2, BH-3, UD-2
Perm
eabi
lity,
k (m
/sec
x 1
0-09 )
Vertical effective stress (kPa)
Fig. 7 Coefficient of permeability (k) vs. vertical effective stress Correlations
Correlations between unconfined compressive strength (qu) with other parameters have been presented in this section. The main objective of the development of correlation is to use these readily in future analysis for similar areas. It is to be mentioned here that the in case of the study area A-4, the thickness of the organic layer was smaller than others. The collected sample by Shelby tube from this layer was not enough to conduct both the unconfined compression test and consolidation test. It was decided to conduct only consolidation test on such samples since the strength can at least be assumed from SPT N-value.
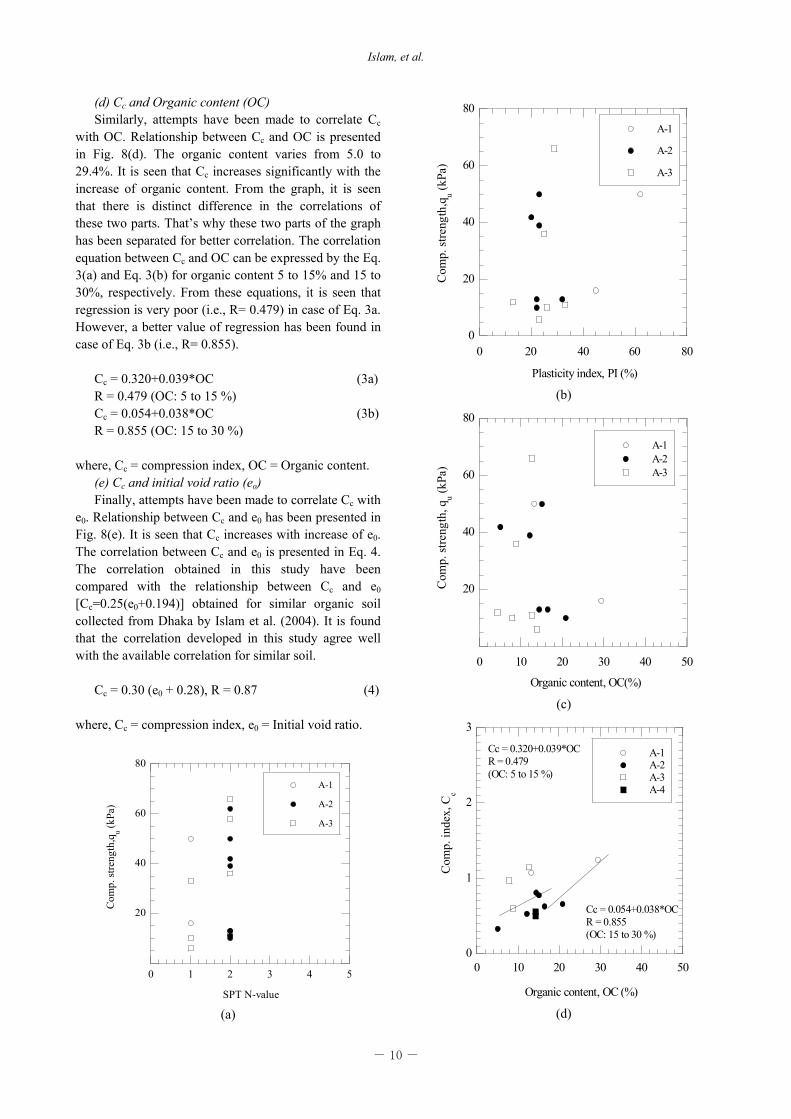
(a) qu and SPT N-value Attempts have been made to correlate qu with field
SPT N-value in this study. Relationship between qu and SPT N-value has been presented in Fig. 8(a). It is observed that the range of the SPT N-value of the soft organic layer remain between 1 and 2. qu varies from 6 to 66 kPa. No correlation could be established between qu and SPT N-value.
(b) qu and Plasticity Index (PI) Attempts have also been taken to correlate qu with PI
of this organic layer. Relationship between qu and PI been presented in Fig. 8(b). It is seen that qu increases with the increase of plasticity index. However, in this case also no definite correlation exists.
(c) qu and Organic content (OC) It has been tried to correlate qu with OC of the
organic layer. Relationship between qu and OC has been presented in Fig. 8(c). It seems that qu decreases with the increase of organic content. However, this correlation is also not clear.
- 9-
Islam, et al.
(d) Cc and Organic content (OC) Similarly, attempts have been made to correlate Cc
with OC. Relationship between Cc and OC is presented in Fig. 8(d). The organic content varies from 5.0 to 29.4%. It is seen that Cc increases significantly with the increase of organic content. From the graph, it is seen that there is distinct difference in the correlations of these two parts. That’s why these two parts of the graph has been separated for better correlation. The correlation equation between Cc and OC can be expressed by the Eq. 3(a) and Eq. 3(b) for organic content 5 to 15% and 15 to 30%, respectively. From these equations, it is seen that regression is very poor (i.e., R= 0.479) in case of Eq. 3a. However, a better value of regression has been found in case of Eq. 3b (i.e., R= 0.855).
Cc = 0.320+0.039*OC (3a) R = 0.479 (OC: 5 to 15 %) Cc = 0.054+0.038*OC (3b) R = 0.855 (OC: 15 to 30 %)
where, Cc = compression index, OC = Organic content. (e) Cc and initial void ratio (eo) Finally, attempts have been made to correlate Cc with
e0. Relationship between Cc and e0 has been presented in Fig. 8(e). It is seen that Cc increases with increase of e0. The correlation between Cc and e0 is presented in Eq. 4. The correlation obtained in this study have been compared with the relationship between Cc and e0 [Cc=0.25(e0+0.194)] obtained for similar organic soil collected from Dhaka by Islam et al. (2004). It is found that the correlation developed in this study agree well with the available correlation for similar soil.
Cc = 0.30 (e0 + 0.28), R = 0.87 (4)
where, Cc = compression index, e0 = Initial void ratio.
20
40
60
80
0 1 2 3 4 5
A-1
A-2
A-3
Com
p. st
reng
th,q
u (kPa
)
SPT N-value (a)
0
20
40
60
80
0 20 40 60 80
A-1
A-2
A-3
Com
p. st
reng
th,q
u (kPa
)
Plasticity index, PI (%)
(b)
20
40
60
80
0 10 20 30 40 50
A-1A-2A-3
Com
p. st
reng
th, q
u (kPa
)
Organic content, OC(%)
(c)
0
1
2
3
0 10 20 30 40 50
A-1A-2A-3A-4
Com
p. in
dex,
Cc
Organic content, OC (%)
Cc = 0.054+0.038*OCR = 0.855(OC: 15 to 30 %)
Cc = 0.320+0.039*OCR = 0.479(OC: 5 to 15 %)
(d)
- 10 -

Foundation alternatives in dredge fill soils overlaying organic clay
1 2 3 4 5
A-1A-2A-3A-4
0
0.5
1.0
1.5
2.0Co
mp.
inde
x, C
c
Initial void ratio, eo
Islam et.al. (2004)
Cc = 0.085 + 0.297e
o
R = 0.87
(e)
Fig. 8 (a) Correlations of unconfined compressive strength (qu) with SPT N-value; (b) correlations of unconfined compressive strength (qu) with plasticity index (PI); (c) correlations of unconfined compressive strength (qu) with organic content; (d) correlation of compression index (Cc) with organic content and (e) correlation of compression index (Cc) with initial void ratio (e0)
Foundation problems Liquefaction problem of the top filling layer
It has been found that top filling layer is silty sand that may liquefy. Liquefaction potential analysis has been conducted at about 50 borehole locations at six reclaimed sites (Bashundhara, Banasree, Mirpur DOHS, Purbachal, Kamrangirchar and Adabar). In the current analysis, the value of peak ground acceleration, amax has been taken as 0.15g (BNBC, 1993).
Liquefaction potential has been estimated based on SPT and shear wave velocity. SPT based evaluation was carried out using Seed-Idriss simplified procedure (Seed and Idriss 1971) and Japanese Code of Bridge Design (JRA, 1990). Methods proposed by Andrus and Stokoe (2000) as well as Yunmin et al. (2005) were used to evaluate the liquefaction potential based on shear wave velocity.
Typical results that have been obtained based on SPT are presented in Fig. 9. More detail about the liquefaction analyses methods and results are available at Islam and Hossain (2010). It is found that some parts of the reclaimed areas are liquefiable. Maximum liquefaction depth was found to be 13.5 m below the Existing Ground Level (EGL).
0
5
10
15
20
0 1 2 3 4 5 6 7
FL
Factor of Safety, FL
Non-liquefiableZone
Liqu
efia
ble
Zone
0
5
10
15
20
0 10 20 30 40 50
N(N
1)
60 CS
Dep
th (m
)
SPT Value
Fig. 9 Liquefaction potential evaluated based on SPT
Settlement problem of the soft organic layer Beneath the filling layer, a very soft organic layer
exists which is highly plastic and highly compressible. It has been estimated that the settlement potential of this layer is very high. This high settlement will cause damage for the structure having shallow foundation on it.
Settlements of the soft organic layer overlaying the filling have been estimated for the surcharge of the filling. Estimated results have been presented in Table 7. Consolidation settlement has been estimated using Eq. (5) as described in Das (1983).
to
c HeeS
1
(5)
where, Sc = primary consolidation settlement; Δe = changes of void ratio (=e1-e0); e0 = initial void ratio; Ht = thickness of consolidating layer.
Table 7 Settlement of soft organic layer due to the surcharge of the filling
Area/ BH No. Hf Ht Pf Cc Cv Settlement Total Time
(m) (m) (kPa) (m2/yr) (mm) (yr) A-1/ BH-1 2.0 7.0 26 1.59 0.45 1734 106.0 A-2/BH-1 5.0 5.5 90 0.66 1.00 668 30.5
A-3/BH-1 4.5 3.0 64 0.97 0.75 447 6.0 Note: Hf = filling layer thickness; Ht = thickness of the consolidating layer; Pf = surcharge from filling layer alone.
- 11 -

Islam, et al.
Surcharges for the filling layer have been found to
vary from 26 to 90 kPa. Typical time dependant settlement curve has been shown in Fig. 10. The settlement of the organic layer due to the surcharge of the filling layer varies from 447 to 1734 mm (considering single drainage) in 6 to 106 years. It is seen that the soft organic layer will experience high value of settlements due to the surcharge of the filling layer alone.
BH-1
6
12
18
Dep
th (m
)
0
20
40
60
80
100
120
0 500 1000 1500 2000
Single drainageDouble drainage
Tim
e (y
r)
Settlement (mm)
Fig. 10 Typical curves of time dependant settlement of soft organic layer due to the surcharge from filling layer (A-1/BH-1).
Negative skin friction problem of the soft organic layer
Besides the excessive settlement, this soft organic layer will also cause other geotechnical problems such as negative skin friction to the pile foundation.
In this study, a six-storied residential building has been considered to estimate negative skin friction. Negative skin friction has been found to vary between 14 and 55% of total design (pile) load. Therefore, for safety purpose, extra additional load (equals to negative skin friction) should be included with design load while pile foundations are designed. Effects of negative skin friction (NSF) on pile length in such reclaimed areas are presented in detail in Nasrin (2010).
It means that due attention should be given for reducing the negative skin friction or it should be considered in the design of deep foundation.
Foundation alternatives
At present, cast-in-situ pile foundations are generally
used for building construction. Some suitable foundation systems based on past studies (Fox and Cowell, 1998) for the study areas have been presented in this section (Fig. 11). These foundation systems can mitigate the problems that may occur to the structures in the reclaimed areas in Dhaka city. These are described in
this section. However, it is to be noted here that suitable foundation alternative is to be confirmed by the analytical result or field trial which is not included in the first phase of the research.
RAP Buoyancy raft
Deep pile
Inorganic layer
Dense sand layer
Fig. 11 Suitable foundation systems for the study area
Liquefaction problems Pile foundation is most common and widely used all
over the world for its availability. From the comparison and study of available methods, it is revealed that both pre-cast and cast-in-situ piles are applicable for the study areas. This foundation can mitigate structural damage that might be caused due to liquefaction.
Settlement problems
Spread footing with Rammed Aggregate Pier may be one of the best foundation systems for small to medium tall building in such areas. Buoyancy Raft Foundation System can be more economical for small to medium rise building for the study areas where basement is required. Excessive settlement can be reduced using these foundations in these study areas. More details about the foundations are available in Nasrin (2009).
Negative skin friction
In these study areas, negative skin friction may cause reduction in the pile-bearing capacity. Therefore, special attention should be taken for reducing negative skin friction. Both pre-cast and cast-in-situ piles might be applicable for the study areas to mitigate the problem due to negative skin friction. The suitable attempts that can reduce negative skin friction are given below.
a) Bituminous coatings can be applied on surface area that may be subjected to negative skin friction. This method can be applied only for precast and end bearing piles.
b) Piles can be designed with additional load (equals to negative skin friction) or higher factor of safety.
- 12 -
Foundation alternatives in dredge fill soils overlaying organic clay
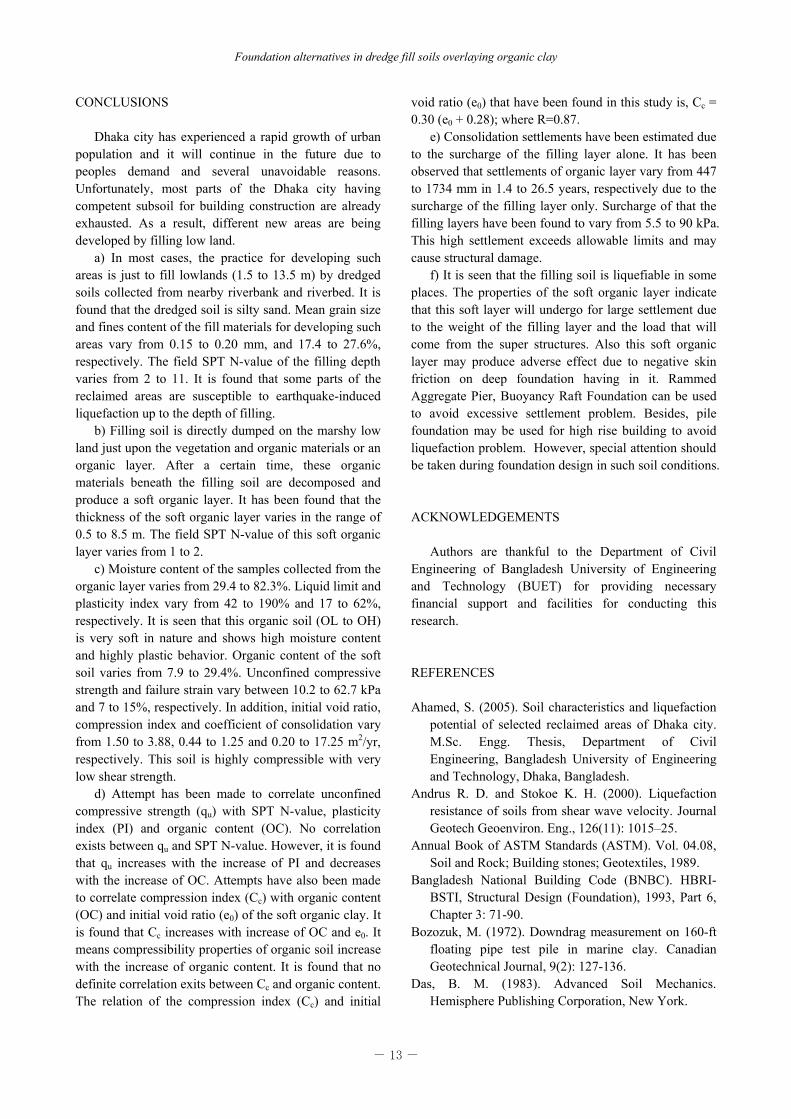
CONCLUSIONS Dhaka city has experienced a rapid growth of urban
population and it will continue in the future due to peoples demand and several unavoidable reasons. Unfortunately, most parts of the Dhaka city having competent subsoil for building construction are already exhausted. As a result, different new areas are being developed by filling low land.
a) In most cases, the practice for developing such areas is just to fill lowlands (1.5 to 13.5 m) by dredged soils collected from nearby riverbank and riverbed. It is found that the dredged soil is silty sand. Mean grain size and fines content of the fill materials for developing such areas vary from 0.15 to 0.20 mm, and 17.4 to 27.6%, respectively. The field SPT N-value of the filling depth varies from 2 to 11. It is found that some parts of the reclaimed areas are susceptible to earthquake-induced liquefaction up to the depth of filling.
b) Filling soil is directly dumped on the marshy low land just upon the vegetation and organic materials or an organic layer. After a certain time, these organic materials beneath the filling soil are decomposed and produce a soft organic layer. It has been found that the thickness of the soft organic layer varies in the range of 0.5 to 8.5 m. The field SPT N-value of this soft organic layer varies from 1 to 2.
c) Moisture content of the samples collected from the organic layer varies from 29.4 to 82.3%. Liquid limit and plasticity index vary from 42 to 190% and 17 to 62%, respectively. It is seen that this organic soil (OL to OH) is very soft in nature and shows high moisture content and highly plastic behavior. Organic content of the soft soil varies from 7.9 to 29.4%. Unconfined compressive strength and failure strain vary between 10.2 to 62.7 kPa and 7 to 15%, respectively. In addition, initial void ratio, compression index and coefficient of consolidation vary from 1.50 to 3.88, 0.44 to 1.25 and 0.20 to 17.25 m2/yr, respectively. This soil is highly compressible with very low shear strength.
d) Attempt has been made to correlate unconfined compressive strength (qu) with SPT N-value, plasticity index (PI) and organic content (OC). No correlation exists between qu and SPT N-value. However, it is found that qu increases with the increase of PI and decreases with the increase of OC. Attempts have also been made to correlate compression index (Cc) with organic content (OC) and initial void ratio (e0) of the soft organic clay. It is found that Cc increases with increase of OC and e0. It means compressibility properties of organic soil increase with the increase of organic content. It is found that no definite correlation exits between Cc and organic content. The relation of the compression index (Cc) and initial
void ratio (e0) that have been found in this study is, Cc = 0.30 (e0 + 0.28); where R=0.87.
e) Consolidation settlements have been estimated due to the surcharge of the filling layer alone. It has been observed that settlements of organic layer vary from 447 to 1734 mm in 1.4 to 26.5 years, respectively due to the surcharge of the filling layer only. Surcharge of that the filling layers have been found to vary from 5.5 to 90 kPa. This high settlement exceeds allowable limits and may cause structural damage.
f) It is seen that the filling soil is liquefiable in some places. The properties of the soft organic layer indicate that this soft layer will undergo for large settlement due to the weight of the filling layer and the load that will come from the super structures. Also this soft organic layer may produce adverse effect due to negative skin friction on deep foundation having in it. Rammed Aggregate Pier, Buoyancy Raft Foundation can be used to avoid excessive settlement problem. Besides, pile foundation may be used for high rise building to avoid liquefaction problem. However, special attention should be taken during foundation design in such soil conditions.
ACKNOWLEDGEMENTS Authors are thankful to the Department of Civil
Engineering of Bangladesh University of Engineering and Technology (BUET) for providing necessary financial support and facilities for conducting this research.
REFERENCES Ahamed, S. (2005). Soil characteristics and liquefaction
potential of selected reclaimed areas of Dhaka city. M.Sc. Engg. Thesis, Department of Civil Engineering, Bangladesh University of Engineering and Technology, Dhaka, Bangladesh.
Andrus R. D. and Stokoe K. H. (2000). Liquefaction resistance of soils from shear wave velocity. Journal Geotech Geoenviron. Eng., 126(11): 1015–25.
Annual Book of ASTM Standards (ASTM). Vol. 04.08, Soil and Rock; Building stones; Geotextiles, 1989.
Bangladesh National Building Code (BNBC). HBRI-BSTI, Structural Design (Foundation), 1993, Part 6, Chapter 3: 71-90.
Bozozuk, M. (1972). Downdrag measurement on 160-ft floating pipe test pile in marine clay. Canadian Geotechnical Journal, 9(2): 127-136.
Das, B. M. (1983). Advanced Soil Mechanics. Hemisphere Publishing Corporation, New York.
- 13 -

Islam, et al.
Ferdous, S. M. (2007). Geotechnical characterization of the subsoil in Khulna city corporation (KCC) area. M.Sc. Engg. Thesis, Department of Civil Engineering, Bangladesh University of Engineering and Technology, Dhaka, Bangladesh.
Fox, N. S. and Cowell, M. J. (1998). Geopier foundation and soil reinforcement manual, Geopier Foundation Company, Inc. Scottsdale, Arizona, USA.
Gabrys. K. and Szymanski, A. (2010). The analysis of consolidation in organic soils, Annals of Warsaw University of Life Sciences –SGGW, Land Reclamation, 42 (2): 261-270.
Herle, I. and Herle, V. (2001). Road construction on a soft organic subsoil. XVth International Conference on Soil Mechanics and Geotechnical Engineering, Istanbul, Turkey: 2081-2084.
Hossain, T. (2009). Estimation of earthquake induced liquefaction potential of selected reclaimed areas of Dhaka city based on shear wave velocity. M.Sc. Engg. Thesis, Department of Civil Engineering, Bangladesh University of Engineering and Technology, Dhaka, Bangladesh.
Islam, M. R., Alamgir, M., and Bashar, M. A. (2007). Compressibility properties of reconstituted organic soils at Khulna region of Bangladesh. Soft Soil Engineering-Chan & Law (eds.), Taylor and Francis Group, London.
Islam, M. S. and Nasrin, M. (2009). Characteristics of soft organic soil underlying dredge fills in reclaimed areas of Dhaka. Proceedings of Bangladesh Geotechnical Conference 2009, Dhaka, Bangladesh: 127-132.
Islam, M. S., and Hossain, M. T. (2010). Earthquake induced liquefaction potential of reclaimed areas of Dhaka city. Proceedings of Geoshanghai 2010, ASCE-GSP, Geotechnical Special Publication, Soil Dynamics and Earthquake Engineering, No. 201, 375(40): 326-331.
Islam, M. S., Hossain, M. T., Ameen, S. F., Hoque, E. and Ahamed, S. (2010). Earthquake induced liquefaction vulnerability of reclaimed areas of
Dhaka”, Journal of Civil Engineering, The Institution of Engineers, Bangladesh. CE 38(1): 65-80.
Islam, M. S., Siddique, A., and Muqtadir, A. (2004). Mechanical properties of soft organic Dhaka clay. Journal of Civil Engineering, the Institute of Engineers, Bangladesh. CE 32(1): 143-161.
Japan Road Association, JRA. (1990). Specification for highway bridges. Part V: seismic design, Tokyo, Japan.
Johannessen, I. J. and Bjerrum, L. (1965). Measurement of the compression of a steel pile to rock due to settlement of the surrounding clay. Proc. 6th ICSMFE, Montreal. 2: 261-264.
Nasrin, M. (2010). Foundation alternatives in fill soils overlaying organic layer. M.Sc. Engg. Thesis, Department of Civil Engineering, Bangladesh University of Engineering and Technology, Dhaka, Bangladesh.
Rahman, M. M. (2008). Investigation of strength and deformation characteristics of cement and lime treated soft clay. Ph.D. Thesis, Department of Civil Engineering, Bangladesh University of Engineering and Technology, Dhaka, Bangladesh.
Seed, H. B. and Idriss, I. M. (1971). Simplified procedure for evaluating soil liquefaction potential. Journal of Soil Mechanics and Foundations Division, ASCE, 97(SM9), Proceedings Paper 8371: 1249-1273.
Taylor, D. W. (1984). Fundamental of Soil Mechanics. John Wiley and Sons, Inc. New York.
Terzaghi, K. and Peck, R. B. (1967). Soil Mechanics in Engineering Practice, 2nd Ed., John Wiley and Sons, New York: 729.
Yunmin, C., Han, K. and Ren-peng, C. (2005). Correlation of shear wave velocity with liquefaction resistance based on laboratory tests. Soil Dynamics and Earthquake Engineering, 25: 461-469.
Zvanut, P. (2003). Settlement of an embankment founded on soft soil, Proc. 11th FIG Symposium on Deformation Measurements, Santorini, Greece.
- 14 -