foul play - le basiclebasic.com/.../06/basic-ese_foul-play-report_2016... · a report by basic...
TRANSCRIPT

FOUL PLAY
Sponsors Leave Workers on the Sidelines
A Report by BASIC (Bureau for the Appraisal of Social Impacts
and Costs) for COLLECTIF ETHIQUE SUR L’ETIQUETTE
May 2016

2

3
Summary
Next June when the UEFA European Championship kicks off in France, the world’s big sportswear brands will unveil
their new marketing campaigns, and their budgets are likely to break new records. For example, Nike’s last World Cup
campaign in Rio – “Risk Everything” – was budgeted at an estimated 68 million dollars, the highest in the brand’s
history.
In addition to their ubiquitous media presence, international football’s three main sponsors – Nike, Adidas and Puma –
have billed themselves as champions of decent working conditions in their factories. After a series of scandals made
headlines in the 1990s, they made socially responsible policies a priority and are regularly cited as examples in the
garment industry.
However, in light of persistent problems (accidents, fires, low wages), it is legitimate to wonder if the situation has
fundamentally changed for workers who eke out a meager living in the brands’ supply chains.
In order to begin to frame an answer, The Éthique sur l’étiquette Collective has launched a study to explore the
relationship between the sportswear brands’ business model and working conditions in their supply chains.
Here are the main results:
Endorsements are the growth engine…
Because of football’s media and social importance, it has become a major battleground for the world’s major
sportswear brands.
Dominated by the Big Three—Nike, Adidas and Puma—European football endorsements have reached
astronomical levels: deals made with the 10 biggest teams have risen from € 262 to more than € 405 million since
2013. The same goes for celebrity athletes. Annual contracts with Lionel Messi and Paul Pogba have reached sums
of between € 35 to € 40 million in 2015 compared with € 20 to € 25 million five years ago.
This spike also applies to national teams: according to the magazine Bild, Adidas was willing to quadruple its level
of endorsement to a billion euros over 10 years to avoid losing the team to Nike—an all-time record.
This “sneaker war” is fueled by a fight for dominance over soccer, and through it, the world athletic apparel
market.
…of a model based on the exponential increase of sales volume…
In the 1990s, the major sportswear brands laid the groundwork for a model based on the bottom line. Nike
became the industry leader, doubling its dividends since 2010 and achieving shareholder returns of 27.7% in 2015,
far above the Dow (13.9%) or the S&P 500 (19.7%). In an attempt to catch up, Adidas and Puma have reacted by
entering a race for profitability.
To increase profit margins, these brands are having to sell more products to more consumers than ever before –
Nike, the industry leader, has doubled its sales in less than 10 years. This constant growth requires large
investments in innovation and an ever-increasing media presence, notably through endorsements.
…and cost-cutting…

4
Starting in the 2000s, the big sportswear brands implemented a new system of supply chain management,
allowing them to diversify their product line while integrating technological innovations. In the footwear sector for
instance, an era of mass personalization has arrived, giving consumers the ability to customize their own shoe by
choosing materials and colors.
Nike, Adidas and Puma’s use of lean manufacturing among the majority of their suppliers allows them to remotely
manage all of their supply chains, which have become increasingly intricate and ramified (similar to what has
occurred in the auto industry).
These systems allow for optimized cost control: for each shoe model, the sportswear brands set their desired retail
price and profit margin, and from there calculate the maximum production cost for the item. They then sit down
with their supplier to determine which raw materials to use, their origin and price, as well as the exact number of
minutes allotted to manufacturing and how much workers are to be paid.
…which dictates sourcing choices…
Setting up systems of streamlined management allows sportswear brands to impact wages and working
conditions in their factories, contrary to what they have sometimes claimed to the media.
Lean explains the fact that, despite a drop in the number of supply chain partners, there are significant changes in
the list of partner factories from one year to the next.
The study also shows that sportswear brands use lean to exit certain countries and invest in others. Nike, Adidas
and Puma are thus massively shifting their sourcing from China, where wages have seen significant increases, to
Vietnam, Indonesia, and soon Myanmar, India and Pakistan, where lower wages allow for significant labor cost
savings.
In this way, they expose themselves to significant breaches in labor standards (unpaid overtime, no paid vacation,
discrimination and impediments to organized labor), which they try to curb using an increasingly sophisticated and
costly system of labor audits with uncertain results.
…and doesn’t allow workers to live in dignity…
In 2015, the price breakdown of athletic apparel is clear: on average a mere 2% of the retail price of footwear ends
up in the pockets of workers, compared with 1% of consumer or professional jerseys.
For example, workers receive less than € 0.65 to manufacture the jersey of one the Euro 2016 stars, which is sold at
about € 85 to consumers.
In most of the manufacturing countries, workers aren’t paid enough to cover their families’ basic needs.
The long-term goal of sportswear brands is to drastically cut labor costs by automating the manufacturing of their
products. The recent opening of Adidas’ first fully automated shoe factory in Germany is a sign of this coming
trend.
...undermining the brands’ stated commitment to Corporate Social Responsibility (CSR)…
This methodical search for the lowest bidder casts doubt on the brands’ stated commitment to build long-term
partnerships with a more limited number of factories, and their resolve to give contract factories the means to
improve labor and working conditions.
For example, the industry-wide strategy of pulling out of China just as wages there have begun to allow workers to
make a decent living would seem to contradict their stated pledge to ensure a living wage within their supply chain
partners.
Contrary to the stated CSR goals of sportswear makers, labor remains an adjustable value to the Big Three.
Nevertheless, the Big Three could improve the situation if they so desired…

5
Estimates realized as part of the current study show that paying workers a living wage would cost Nike, Adidas and
Puma less than their current marketing and endorsement budgets, and the dividends they pay their shareholders
each year.
Paying a living wage would represent only a few dozen cents more in the final price tag of a pair of sneakers or a
sports jersey. But it’s thanks to these infinitesimal savings on millions of items that the Big Three can invest
lavishly in their constantly ballooning marketing budgets, and their “sneaker wars” on the sports field.
According to our calculations, endorsement costs of the 10 largest European football clubs since 2013 would have
been sufficient to pay living wages to 165,000 workers in Vietnam and 110,000 workers in Indonesia.
…or even change their business model…
Low wages result not from a lack of means, but from a global business model that should be reexamined. There is
an alternative to this massive investment in marketing and communication to the detriment of supply
subcontractors. In the past few years, other brands have begun to show this by building new models that allow
workers to make a decent livelihood, from raw material producers to assembly-line workers, while offering
consumers successful products.

6
Summary ............................................................................................................................................. 3
Graphs and tables ..................................................................................................................................
List of abbreviations ..............................................................................................................................
1. The athletic brand model: a volume-based strategy that hinges on technical innovation and
investment in marketing and endorsements ...................................................................................... 10
1.1 The Big Three Sportswear Brands, a brief history .............................................................................. 10
1.1.1 The Domination of Europeans Aidas and Puma supplanted by the emergence of Nike ........................ 10
1.1.2 The sports apparel market ............................................................................. Erreur ! Signet non défini.
1.2 A business model based on increasing volumes through technical innovation, marketing and
endorsements ...................................................................................................................................... 15
1.2.1 Demand Creation through the profileration of products and marketing .............................................. 15
1.2.2 Football endorsements, at the center of Nike and Addidas' war for the European market .................. 20
2. The impacts of this model on production countries .................................................................... 25
2.1 Outsourcing of production and the reorganization of the supply chain ............................................ 25
2.1.1 Cost cutting through outsourcing: a 40 year old strategy .....................................................................25
2.1.2 Faced with brand pressure on costs, the rise of Asian transnational suppliers based in the 1990s ........25
2.2 New brand strategies to control their supply chain and optimize costs ............................................ 26
2.3 Consequences of brand sourcing strategies: volatility of supply contracts, substandard wages, and
social risks ….......................................................................................................................................31
2.3.1 Toward a reduction in the number of factories, but with persistant volatility ....................................... 31
2.3.2 The current shift in production out of China and into Vietnam and Indonesia: falling labor costs and
substandard wages .................................................................................................................................... 32
2.3.3 Toward countries with increased risk of labor violations ...................................................................... 38
2.3.4 The Big Three's long-term vision: machines to replace workers ........................................................... 41
3. Conditions of a responsible supplier ........................................................................................... 44
3.1 From the emergence of sweatshops to the development of Social Responsability .......................... 44
3.1.1 A public censure by NGOs with important repercussions .................................................................... 44
3.1.2 Important progress and strong commitments from the Big Three .......................................................45
3.2 A business model in contradiction with the CSR commitments made by the brands ....................... 45
3.3 Workers who are paid a tiny share of the value of their products .................................................... 47
3.4 Yet the Big Three could be paying decent wages ............................................................................... 53
3.4.1 In relation to their marketing budgets and their business model .......................................................... 53
3.4.2 In relation to athlete and football team endorsements ........................................................................ 55
3.5 … and other alternative models are possible ...................................................................................... 55

7
List of Illustrations
Figure 1. Market for sports apparel by region – global sales and estimated growth rates 2013-2017. ...................... 12 Figure 2. Shoe sales in the major European countries (in millions of euros). ........................................................... 13 Figure 3. Clothing sales in the European Union (in billions of euros). ...................................................................... 13 Figure 4. Major sports apparel market players ....................................................................................................... 14 Figure 5. Main players in the athletic footwear and apparel markets. ..................................................................... 15 Figure 6. Main football suppliers ............................................................................................................................ 15 Figure 7. Number of shoe models commercialized by Nike .................................................................................... 16 Figure 8. Example of a customizable model offered by Nike .................................................................................. 16 Figure 9. Financial profiles of Nike, Adidas and Puma ............................................................................................ 17 Figure 10. Evolution of Nike, Adidas and Puma’s Marketing and Sponsorship Expenses ........................................ 18 Figure 11. Incremental costs of endorsements for Nike and Adidas respectively .................................................... 18 Figure 12. Sales revenue gains for Nike, Adidas and Puma ..................................................................................... 19 Figure 13. Sales revenue for Nike, Adidas and Puma ............................................................................................ 20 Figure 14. Football spectatorship in France ............................................................................................................ 21 Figure 15. Main football sponsors cited by the French ............................................................................................ 21 Figure 16. Main partners for the Euro 2016 ............................................................................................................. 22 Figure 17. Main 10-year endorsement contracts for national football teams since 2008 ........................................... 22 Figure 18. Main sponsors of the national football championships .......................................................................... 23 Figure 19. Main endorsement contracts of the European football clubs in 2013 and 2015 .......................................... 24 Figure 20. Estimated endorsement contracts with top football stars ........................................................................ 24 Figure 21. Flow Chart Outlining the Principle of Target Costing ............................................................................ 28 Figure 22. Optimization strategy for labor costs developed by Adidas .................................................................. 28 Figure 23. Example of a technical Target Costing file for the production of sneakers ............................................ 29 Figure 24. Degree of lean implementation in Nike’s suppliers ................................................................................ 30 Figure 25. Degree of implementation of lean among Nike suppliers ...................................................................... 30 Figure 26. Number of suppliers to Nike, Adidas et Puma ....................................................................................... 31 Figure 27. Analysis of the list of factories supplying Adidas .................................................................................... 32 Figure 28. Shift in production countries for Nike and Adidas footwear (2005-2014) ............................................... 33 Figure 29. Shift in production countries for Nike and Adidas apparel (2005-2014) .................................................. 34 Figure 30. Shift of production countries for Puma footwear and apparel (2012-2014) ............................................ 34 Figure 31. Average hourly wage in the garment industry in 2014............................................................................ 35 Figure 32. Excerpts from the internal Adidas presentation on sourcing 2015-2020 ................................................. 35 Figure 33. Evolution of Adidas’ sourcing countries 2015-2020 for the manufacture of shoes and clothes ................ 36 Figure 34. Studies of the living wage used in this report ............................................................................................ 37 Figure 35. Minimum wages, average wages in the sector, and living wages in the main garment-producing
countries ............................................................................................................................................................... 38 Figure 36. Non-compliance with legal requirements concerning compensation in the factories audited by the
Better Work Program ............................................................................................................................................ 39 Figure 37. Non-compliance with labor requirements in factories audited by the Better Work Program ................. 40 Figure 38. Violation of legal health and safety requirements in factories audited by the Better Work Program ..... 40 Figure 39. First images of the robotic production line opened by Adidas in Bavaria ............................................... 42 Figure 40. Partnership between Nike and Flex to automate footwear production and stymie rising labor costs ..... 43 Figure 41. Manufacturing Index set up by Nike ..................................................................................................... 46 Figure 42. Breakdown of the retail price of a Cortez/Roshe running shoe by Nike ................................................. 48 Figure 43. Estimated price breakdown for the Nike Air Jordan 1 ........................................................................... 49

8
Figure 44. Estimate of the breakdown of Nike Cortez/Roshe running shoes sold on Nike’s online store .................50 Figure 45. Estimate of the price breakdown of a pair of Nike Air Jordan 1 sold online by Nike ................................50 Figure 46. Price breakdown for a technical T-Shirt technique like Techfit, made in Chine ...................................... 51 Figure 47. Estimated price breakdown for the technical T-Shirt like Adidas Techfit, made in Vietnam ................... 51 Figure 48. Estimated price breakdown for a National football jersey participating in the Euro 2016 .......................52 Figure 47. Average sector wages and living wages in the main garment-producing countries ................................ 53 Figure 48. Cost estimates for paying living wages for Nike, Adidas and Puma .......................................................54

9
Abbreviation Key
FIFA Fédération Internationale de Football Association
FOB Free on board
INSEE National Institute for Statistics and Economic Studies - France
MM Million
Bn Billion
ILO International Labor Organization
NGO Non-governmental Organization
GDP Gross Domestic Product
CSR Corporate Social Responsibility
UEFA Union of European Football Association
UN Comtrade UN International Trade Statistics Database
UNCTAD United Nations Conference on Trade and Development
USD US Dollars

10
1. Sportswear Brands: A High-volume Strategy Based on Technical Innovation and
Branding and Endorsement Investment
1.1 A Brief History of Athletic Apparel Brands
1.1.1 The Dominance of European Giants Adidas and Puma Supplanted by the Emergence of Nike
Adidas and Puma: The Invention of Modern Sports
The idea of manufacturing sports-specific footwear was born in the late 1920s, and was developed by the brothers
Rudolf and Adolf Dassler who founded Adidas and Puma’s common ancestor. The brothers, sports enthusiasts
from a long line of Bavarian garment makers, sought to produce light footwear that was adapted to the various
sports they practiced. This revolutionary new initiative met with no uncertain success in Germany, in a period
when modern sports practice, and in particular English running and football, was in its infancy.1
The Dassler brothers owed much of their success to partnerships with the sports clubs that were cropping up in
Germany during the inter-war period, particularly football teams. They quickly attracted attention from national
sports federations, in particular track and field clubs, who asked them to supply the German Olympic team in
Amsterdam in 1928, an acknowledgment of the fledgling business’ savoir-faire. The crowning achievement came
at the Olympic Games in 1936 when Rudolf Dassler persuaded Jesse Owens to wear his shoes despite the Nazi
government’s likely retribution. Owens’ haul of four gold medals cemented the Dassler’s international reputation.2
Like many others businesses, the company was put under Nazi control during WWII, and was only spared thanks to
the Dassler brothers’ contacts with the Nazi party. After the liberation, the Americans, discovering the company
had sponsored Jesse Owens, allowed the company to resume production starting in 1946. Growing tensions
between Rudolf and Adolf eventually burst into public view. Their relationship, which had soured during the war,
led to a permanent rift and mutual finger pointing during the postwar denazification process by the Americans.3
Adolf, who had run the technical side of things left with his production team in 1949 and created the Adidas
company (using his nickname “Adi” Dassler). He invented the three parallel bars which would become the brand’s
logo and which made his products readily identifiable to consumers.
The same year, Rudolf and his former sales team mounted their own factory on the other side of the Aurach River,
recruited technicians and created Puma whose first logo he copyrighted.
Adidas’ business boomed after the 1952 Olympics in Helsinki, where Emile Zatopek took home three Gold medals
for track-and-field wearing footwear with the 3-bar logo.4
Meanwhile Puma saw substantial success in football, where design elements like the invention of the first cleats
set the brand apart. Its partnership with the Brazilian football team starting in the 1960s helped cement its
international renown.5
Adidas and Puma became locked in a fierce competition to win endorsements from the world’s best athletes, in
particular in the Olympics and football. The family rivalry was passed down to the next generation after Horst and
Armin Dassler, the sons of the respective founders of Adidas and Puma, took over as heads of the two companies.
1 B. Smith, Pitch Invasion. Three stripes, two brothers, One feud: Adidas, Puma and the making of modern sport, Penguin books, 2007 2 Ibid. 3 Ibid. 4 Ibid. 5 Ibid.

11
During the 60s and 70s, Adidas gained ascendency over its rival sibling thanks to partnerships with the Olympics
and Germany’s National Football Team, Mannschaft. Puma struck back by paying the star Pelé to wear its shoes,
giving the brand international exposure during the 1970 World Cup in Mexico.6
From football and track and field, their rivalry extended into popular new sports, in particular tennis.
In the late 1970s, Adidas took the lead in supplying athletic equipment to the Olympic Games (over 80% at the
Montreal Games in 1976) and continued to develop its branding by inventing the international football
endorsement.
Horst Dassler signed the first such agreement in 1977 with FIFA president Joao Havelange. The deal invested
private funds – in partnership with Coca Cola – to help bring the organization to developing countries. He created
an umbrella company dubbed ISL7 to help bring private investment to the 1978 World Cup in Argentina. After this
initial success, he and FIFA’s new General Secretary Sepp Blatter set up a complete branding and sponsorship
strategy for the following World Cup organized in Spain. This included exclusive commercialization rights for
partner companies, the creation of a mascot and merchandising, and later TV broadcast rights.
Based on the success of this model, ISL succeeded in branching out into the 1980 Olympic Games thanks to the
support of newly elected IOC President, Juan Antonio Samaranch. 8
The system has only gained momentum since then.
The Rise of Nike and the End of European Dominance
In the late 1960s, young Stanford student and sports enthusiast Philip Knight took a sabbatical to Japan to test his
masters thesis on the feasibility of producing quality European-style athletic apparel in Japan at a fraction of the
cost—something that had already taken place with cameras.
In stores there, he found Adidas knock-offs bearing the Tiger logo, and decided to cold call the head of the
company, Kihachiro Onitsuka. Posing as an American importer, he secured Tiger distribution rights for the United
States.9
Back in Oregon, he founded the company “Blue Ribbon” with his former sports coach Bill Bowerman and began
commercializing Tiger running shoes in the United States—a market that had been dominated by Adidas and
Puma. With a group of friends, he began to sell shoes in his free time at track meets. Phil Knight left his job as an
accountant in 1969 to devote himself to the company full-time.10
Faced with the difficulty of selling directly to consumers, they initially focused on selling sports shoes in bulk. They
decided to rename their brand Nike and registered the “swoosh” logo in 1972. After a failed attempt to
manufacture their shoes in Mexico, they traveled throughout Japan, Taiwan and Hong Kong to build a network of
suppliers which would make the first pairs of American-designed shoes.11
The company’s sales began to boom that same year after Bowerman was named trainer of the US Olympic track
team in Munich. Nike shoes were highly successful among athletes who saw the brand as very close to them and
their concerns.12
6 France 5, Les frères Dassler, de l’amour familial à la haine viscérale, April 2014. 7 Originally called SMPI, the company became ISL (International Sports and Leisure) starting in 1982 8 B. Smith, Pitch Invasion. 2007 op. cit. 9 J. Strasser and L. Becklund, Swoosh: the unauthorized story of Nike and the men who played there, Collins, 1993 10 J. Strasser and L. Becklund, Swoosh: the unauthorized story of Nike, 1993 op. cit. 11 Ibid. 12 Ibid.

12
After developing partnerships with amateur track teams, Nike launched a similar program with basketball teams
starting in 1975. Sales doubled annually, finally reaching about 30 million dollars in 1977, and making Nike
America’s top brand of running shoes (but nonetheless lagging far behind Adidas in terms of overall US sales).13
While Adidas, Puma and Converse focused on procuring endorsements from big-name athletes, Nike built its
brand through partnerships with college track and basketball teams, and later baseball and soccer teams. Within
three years, the company had increased its sales tenfold thanks to technological innovations (the introduction of
light polyurethane souls and rigid vamps). Above all, the company benefitted from the jogging boom in the United
States. A major social phenomenon, it propelled Nike sales to 270 million dollars in 1980 and 460 millions the
following year. It was at this point that Nike decided to open its first European subsidiary and to reproduce its
American success with running shoes and later tennis shoes, thanks to endorsements by well-known athletes (like
English runner Sebastian Coe or tennis champion John McEnroe). 14
Nike’s growth stagnated in the 1980s due to problems organizing its vast production and distribution network, and
the strides made by British competitor Reebok, which had recently entered the US market, and which saw
dazzling success thanks to the step-aerobics boom, before going into running shoes. Reebok became the world’s
number one sports brand in the mid-1980s (before going into decline in the 1990s and finally being acquired by
Adidas 20 years later). To regain its edge, Nike invested heavily in athletic endorsements and scored a major
marketing success through their 1984 partnership with Michael Jordan. Air Jordan sneakers created a consumer
feeding frenzy catapulting sales to 100 million dollars in the first year. The launch of Nike Air Max in 1987 helped
Nike move ahead of its competitors, a position it holds to this day.15
1.1.2 The Sports Apparel Market
The global market for sports apparel is estimated at approximately 220 billion euros annually. It represents about
15% of total sales in the garment sector and it enjoys slightly higher growth (7.5% to 6%). North America is its
biggest market, followed by Europe and then Asia which is seeing rapid growth.16
Figure 1. Market for sports apparel by region – global sales and estimated growth rates 2013-2017.
Source : Euromonitor (2014)
13 Ibid. 14 Ibid. 15 Ibid. 16 Catalyst Corporate Finance, Global Sportswear Sector, 2014

13
The European Market for Athletic Footwear
The growing popularity of athletic footwear as a substitute for traditional shoes is one of the sector’s main growth
engines in Europe. Sales have benefited from growing consumer interest in more active and healthier lifestyles.
Other growth factors are their fashionable image and the technological innovations which constantly improve the
comfort of these shoes.17
Sneakers represent about 20% of the European shoe market , which has started growing again since 2014, mainly
in Northern and Central Europe.
Figure 2. Shoe sales in the major European countries (in millions of euros).
Source : Eurostat, Market Line, Euromonitor (2014)
The European market for sports apparel
In Europe, sports apparel is a € 5 billion a year market and represents approximately 7% of overall garment sales.
Contrary to the sector at large, sales have held steady or even increased slightly during the economic crisis (see
diagram below)18.
Figure 3. Clothing sales in the European Union (in billions of euros).
Source : Eurostat (2015)
17 CBI, Mass market sports footwear in Europe, 2015 18 CBI, Apparel Trade Statistics, 2016

14
The market shares of Nike, Adidas and Puma
The sportswear sector remains quite fragmented internationally. Nike and Adidas dominate the market with sales
revenues eight and five times higher, respectively, than their closest competitors, Puma and Asics. Their combined
sales represent about 20% of the sector (see below).
Figure 4. Major sports apparel market players
Source: BASIC, based on the Boston Globe (2015)
Analysis of the athletic shoe market (cf. below) shows that:
- Nike is by far the largest athletic footwear maker internationally, with a market share close to 23%,
followed by Adidas at almost 10%. The other direct competitors only represent a 1% to 5% market share
each.
- In the athletic apparel market, Adidas and Nike are tied for first place at about 10% of the market each. As
in the athletic footwear sector, the other makers have market shares between 1% and 5%.

15
Figure 5. Main players in the athletic footwear and apparel markets.
Source : BASIC, Merryl Lynch, Forbes, Market Realist, NPD Group and the companies’ annual reports
Certain individual sports are dominated by only a few brands. Thus, more than 70 % of football-related sales –
including shoes, apparel and equipment (balls, gloves, etc.) – are realized by only 3 companies: the leader Adidas,
followed closely by Nike, and Puma in third position (see below).
Figure 6. Main football suppliers
Source : BASIC, according to the Boston Globe (2015)
The market in its entirety was estimated at € 7.9 billion in 2015.
1.2 A business model based on sales volume through innovation, marketing and endorsements
1.2.1 Creation of demand through product diversification and marketing
The importance of technical innovation: exponential growth of product lines and expanding consumption
These past few decades, the sector’s big brands have created and maintained an athletic footwear and apparel
market in constant expansion, reinforcing the development of sports activities with an ever-increasing choice of
products for consumers.
This is illustrated by exponential growth in the range of products offered by Nike. The number of Nike footwear
items on the market has increased more than tenfold since the 1980s.

16
Figure 7. Number of shoe models commercialized by Nike
Source: BASIC, based on data by R. M. Locke (MIT, 2003) and the Nike website (2016)
This trend continues to accelerate today, ushering in an era of “mass customization.” The idea is to rethink the
mass production system to offer consumers an almost unlimited variety of customizable models at a cost that is as
close as possible to the standard models.
In practice, buyers can now design their own shoes online by choosing materials, colors and the shape and soul
type. No sooner has the consumer paid than the order is dispatched to the factory.
Figure 8. Example of a customizable model offered by Nike
Source : BASIC, according to Nike’s website (2016)
This increase in the number of models hinges on innovation, which has become the watchword of the Big Three’s
new products. It is central to their branding and market differentiation strategies.
For example, since the early 80s Nike has run its own in-house R&D lab to study the needs of athletes in
partnership with scientists in biomechanics, physics and kinesiology. Financial analysts estimate that Nike and
Adidas currently devote about 5% of their budgets to R&D, having registered 4,000 and 550 patents respectively.19
As marketing spending continues to grow so does its role in the business model
Nike, Adidas and Puma have built up a design and marketing-based business model using capital freed up by a
reduction in manufacturing costs.
From its beginnings, Nike has outsourced production to give itself financial wiggle room. In the early 80,
manufacturing costs represented only 60% of its sales revenue, compared to 75% for Adidas, whose production
lines were primarily located in Europe.20
These labor-cost savings allowed Nike to invest massively in marketing and sponsorship, spurring a sportswear
“fashion craze” that spread beyond traditional sports practitioners to a general public hungry for a new dress code.
19 S. Dong, Tech-wear: The technical aspects of Nike’s most innovative apparel, 2016 20 B. Smith, Pitch Invasion. 2007 op. cit.

17
Nike has built nothing short of an international legend based on brand storytelling, technical innovation and
celebrity endorsements that feed consumer enthusiasm and sales growth.21
The resounding success of this business model has led the other sportswear leaders to try to imitate it. To match
Nike’s marketing and endorsement spending, Adidas has gradually closed its European factories and moved to
Asia since the 1980s, eventually outsourcing all its production.22
In doing so, Nike, Adidas and Puma have entered a race over the last 30 years to reduce supply costs, grow their
marketing and endorsement budgets, and ultimately sell more footwear and apparel than their competitors.
Today only 51% to 54% of the Big Three’s sales revenue is spent on manufacturing costs (compared with 75%
when production was based in Europe). As for marketing and endorsement investment, which has become
obligatory, it has reached 10% for Nike and 14% for Adidas. It has even peaked at 21% for Puma whose current
strategy is to reinvest massively in marketing and endorsement to improve its profitability and avoid being left in
the dust by its two competitors.
Figure 9. Financial profiles of Nike, Adidas and Puma
Source : BASIC, based on reports published by the 3 companies (2015)
Over the past 10 years, marketing and endorsement budgets have only grown (see attached diagrams): an 85%
increase for Nike and more than 140% for Puma. They are now considered a necessary evil to spur sales growth
and create consumer demand.
21 BP. Bouchet et D. Hillairet, Marques de Sport : approches stratégiques et marketing, Editions de boeck, 2009 22 B. Smith, Pitch Invasion. 2007 op. cit.

18
Figure 10. Evolution of Nike, Adidas and Puma’s Marketing and Sponsorship Expenses
Source : BASIC, according to annual reports published by the 3 companies (2015)
Among these expenses, endorsement contracts have seen an even more significant rise (see below). According to
Nike, they have outpaced overall marketing expenses nearly 2 to 1 (+163% since 2005). As for Adidas, Deutsche
Bank estimates show a 60% increase in football endorsements in scarcely three years.
Figure 11. Incremental costs of endorsements for Nike and Adidas respectively
Source: BASIC, according to Nike’s Annual Report (2015) and Deutsche Bank estimates (2015)
These investments have allowed for increased sales revenue growth for Nike, Adidas and Puma in similar
proportions since 2005.

19
Figure 12. Sales revenue gains for Nike, Adidas and Puma
Source : BASIC, according to annual reports published by the 3 companies (2015)
This growth is due to higher prices as well as an increase in items sold. For example, between 2013 and 2015, the
price of Nike shoes increased by 6% and the number of units sold by 7%.23
Ultimately, these big increases allow the Big Three to pass on large profits to shareholders (see below). This is
particularly true for Nike which is presented by financial analysts as the standard-bearer in the sector. The
company has doubled its profits in the last five years and offered annual returns of 27.7 % to investors in 2015, far
above the Dow Jones Industrial Average (13.9%) and the S&P 500 (19.7%). Adidas and Puma have entered into a
race for profitability to attempt to catch up.24
23 Market Realist, Nike Moves a Step Ahead with Innovation-Driven Growth, Marche 2016 http://marketrealist.com/2016/03/nike-moves-step-ahead-innovation-driven-growth/ consulted 05/15/2016 24 Market Realist, Nike: 5-Year Returns Targets for Shareholders, October 2015 http://marketrealist.com/2015/10/nikes-5-year-returns-targets-shareholders/ consulted 05/15/2016

20
Figure 13. Sales revenue for Nike, Adidas and Puma
Source : BASIC, based on the annual reports published by the Big 3 (2015)
1.2.2 Football Endorsements, at the heart of the battle between Nike and Adidas for the European market
Football has gained undeniable social significance. It far outperforms other European sports in numbers of players,
both amateur and professional, in popularity and media attention, and in economic development and symbolic
power. It is thus a crucial battleground for the sportswear brands in their pursuit of expanding markets.25
Football, a key sector for dominance over the European market
Football has one of sports’ most storied histories in terms of endorsements. Created in England in the late 19th
century, the sport went professional in 1885, forcing early club owners to raise funds to pay players. This kicked off
the tradition of charging stadium admission, and forced owners to turn to private sponsors for liquidity.26
Meanwhile companies—first sportswear makers and later other consumer brands—quickly became interested by
this sport whose popularity was gradually spreading around the world. The sport’s value is embodied by the image
of the football star, the cornerstone of Nike, Adidas and Puma’s marketing strategies.27
Starting in the 1970s, football sponsors began to compete to put their logos on events, clubs and players. This
sport-company relationship played a major role in introducing football clubs to marketing culture and the possible
profits to be reaped from their image. Starting in the 1980s, clubs were no longer content to just sell branded
products (jerseys, bags, watches, perfume). As a result, revenue amassed by Ligue 1 French football for example
jumped from 500,000 francs in 1970-1971 to 260 millions francs in 1990-1991.28
For sportswear brands, international sports leadership plays out first and foremost on the football field. Until the
1980s, it was dominated by Adidas and Puma (sometimes indirectly like in England where Umbro was Adidas’
exclusive distributer and in France where Adidas acquired le Coq Sportif).
In 1982, Nike entered the arena after consolidating its position in Europe in running and tennis sneaker sales. It
outfitted Peter With who brought Aston Villa to victory against the Adidas-sponsored Bayern Munich team in the
European championship that year. From then on, the competition would only grow more fierce.29
25 W. Gasparini et J. F. Polo, L’espace européen du football : dynamiques institutionnelles et constructions sociales, l’Harmattan, 2012 26 J. F. Nys, La surenchère des sponsors dans le football, Géoéconomie, 2010 27 J. F. Nys, La surenchère des sponsors dans le football, 2010 op. cit. 28 A. Whal, P. Lanfranchi, Les Footballeurs professionnels des années 1930 à nos jours, Paris, Hachette, coll. “La vie quotidienne”, 1995 29 B. Smith, Pitch Invasion. 2007 op. cit.

21
The stakes are enormous for the Big Three, pulling them into a merciless war to endorse the most prestigious
clubs, players and national teams. For example, in 2006, Adidas sold more than 10 million official World Cup balls,
and both Nike and Adidas saw their jersey sales jump by 33% in Europe on account of the event alone.30
The media coverage devoted to football is also testament of this: in France for example, more than 40% of the
population reported regularly following football matches on TV, radio, the printed press and online.
Figure 14. Football spectatorship in France
Source : Sportlab Consulting – Sponsorship Yearbook (2013)
In this context, the Big Three enjoy better name recognition than any other sponsor among football fans
(according to yearly European rankings by the firm Sport+Market).31 Likewise, French polls show that Adidas and
Nike are closely linked with football in the popular imagination.
Figure 15. Main football sponsors cited by the French
30 J. F. Nys, La surenchère des sponsors dans le football, 2010 op. cit. 31 J. F. Nys, La surenchère des sponsors dans le football, Géoéconomie, 2010 op. cit.

22
Source : Sportlab Consulting – Sponsorship Yearbook (2011)
The fierce competition between Nike and Adidas for dominance over European football endorsements has spiraled out
of control
The Big Three sportswear makers have now become an integral part of European football. On the national level,
they sponsor almost all teams participating in the next UEFA European Championship.
SPONSORS NATIONAL TEAMS
Adidas* Germany; Belgium; Spain; Hungry; Northern Ireland; Wales; Sweden; Russia; Ukraine
Nike Great Britain; France; Poland ; Portugal; Turkey
Puma Austria; Switzerland; Italy; The Czech Republic; Slovakia
Joma Romania
Errea Iceland
Umbro Ireland
* Adidas is also the official sponsor of the UEFA as an organizer
Figure 16. Main partners for the Euro 2016 Source : BASIC
Figures show ballooning endorsement contracts with national football teams, which have doubled on average
over the last decade. This trend could very well continue with the next contract renewal in 2018.
NATIONAL TEAM ENDORSEMENTS
Country Sponsor Annual amount End of Contract
GERMANY Adidas/Nike ? 100 MM € ? 2028
FRANCE Nike 42.6 MM € 2018
GREAT BRITAIN Nike 34.5 MM € 2018
BRAZIL Nike 30.7 MM € 2018
GERMANY Adidas 25 MM € 2018
SPAIN Adidas 24 MM € 2018
ITALY Puma 18 MM € 2018
BRAZIL Nike 13 MM € 2008
FRANCE Adidas 10 MM € 2008
Figure 17. Main 10-year endorsement contracts for national football teams since 2008
Source: BASIC, according to Bild data (2015)

23
The jockeying between the Big Three for control of the major teams is spiraling out of control, with no end in sight.
Thus Nike, which already sponsors Brazil to the tune of € 13 million per season, succeeded in baiting the French
team away from Adidas in 2008 with a € 42.7 million contract effective until 2017-2018. (Prior to that, Adidas had
been the French Football Federation’s partner for 37 years, paying about € 10 million per season for the privilege).
While Nike has so far failed to wrestle the German team away from Adidas on its home turf, it’s not for lack of
trying. A recent investigation in the September 2015 issue of Bild reports that Nike offered Mannschaft a 10-year
contract of more than € 1 billion, or € 100 million a year (compared with the € 25 million Adidas currently spends).
If signed, this would represent the largest contract in football history.
This all-out war for dominance is present to an even greater degree during Europe’s five major championships: in
Spain, Italy, Germany, the United Kingdom and France.
Figure 18. Main sponsors of the national football championships
PR Marketing, Repucom, 2014
Here too, Nike, Adidas and Puma are still fighting for supremacy. For the first time since 2009/2010 the American
giant outperformed its German rival in 2014, outfitting a quarter (26.5%) of the clubs participating in these five
championships, while Adidas held down 18.4% of the market and Puma 9%. The 2015/16 season was a turning
point since Adidas won over two of its rival’s biggest contracts: Manchester United, the English Premier League
giant, and the Juventus FC, Italy’s most recent champion. 32
This frenzied competition has bloated endorsement contracts with European clubs like never before, bringing the
top 10 to a total of € 406 million in 2015, as opposed to € 262 million two years earlier (cf. below).
32 Repucom, Les nouveaux contrats record d’Adidas avec Manchester United et la Juventus de Turin en passe de bouleverser le paysage commercial du football européen, 2014

24
Figure 19. Main endorsement contracts of the European football clubs in 2013 and 2015 Source : BASIC, from Brand Finance data – Football 500 (2013 & 2015)
This escalation also affects individual football player endorsement contracts which have risen astronomically these
last few years. While contracts signed from 2010-2013 by Lionel Messi and Christiano Ronaldo were on par with
the “historic” contract signed by Brazilian player Ronaldo in 1997 – reaching about € 15 to 20 million a year –
recent renegotiations have seen a 50% increase according to available information (see following).
Player Sponsor Annual Amount Year
Lionel Messi Adidas 38 MM € 2015
Paul Pogba Adidas 38 MM € 2015
Christiano Ronaldo Nike 25 MM € 2014
Lionel Messi Adidas 21 MM € 2011
Christiano Ronaldo Nike 15 MM € 2011
Ronaldo Nike ~18 MM € 1997
Figure 20. Estimated endorsement contracts with top football stars
Source : BASIC, based on Brand Finance, Karl Lusbec and Sportune data (2016)

25
2. Business model impact on production and manufacturing countries
2.1 Delocalization of production and reorganization of supply chains
2.1.1 Cost-cutting through sourcing: a more than 40-year-old strategy
As explained in the first chapter, from the dawning of the industry to the 1960s, sports apparel was exclusively
manufactured in Europe.33
The change occurred with the creation of Nike in the United States, whose business model from the outset was
based on sourcing production from Japan where European-quality shoes could be produced at a fraction of the
cost. This strategic choice allowed the American brand to focus on downstream activities (design, innovation) and
to invest massively in marketing and endorsement.34
Facing the oil crisis and rising costs in Japan, Nike began to shift production to South Korea and then Taiwan
starting in 1976. After only 5 years, these two countries came to represent 82% of its supply chain. That same year,
the company closed two factories it had built in the United States to manufacture high-end products, in Maine and
New Hampshire.35
As labor costs rose in South Korea and Taiwan in the following years, Nike incited its suppliers to delocalize
factories to China, Indonesia and then Vietnam, promising them a minimum volume of orders and expert technical
support in exchange. In this way, Nike has built a wide network of suppliers all over Asia, allowing it to reduce
minimum supply costs.36
In this context, Adidas was forced to phase out large-scale production in Europe. With profit margins half of Nike’s,
the company couldn’t keep pace with the marketing and advertising dollars spent by its direct competitors.
To remedy the situation, Adidas shifted its production to Eastern Europe and Asia. By 1985, half of its footwear (40
million pairs per year) was already being manufactured in Taiwan and China by the company Riu. The supply
partner accelerated this trend in the following years by opening its own factories first in South Korea, then in
Malaysia, Thailand and China.
The decision by Adidas to maintain control over its production sites ended in failure: the organizational structure
turned out to be complex and costly without achieving the desired results. This accelerated the movement toward
total outsourcing of Adidas’ production to Asia in the 1990s.37
2.1.2 Facing cost pressure from brands, Asian-based transnational suppliers grow in the 1990s
The movement toward outsourcing spearheaded in the 1980s by the Big Three sparked the emergence of large-
scale transnational suppliers which significantly modified supply chain organization.
33 B. Smith, Pitch Invasion. 2007 op. cit. 34 J. Strasser and L. Becklund, Swoosh, 1993 op. cit. 35 R. M. Locke, The Promise and Perils of Globalization: The Case of Nike, Massachusset Institute of Technology (MIT), 2003 36 R. M. Locke, The Promise and Perils of Globalization, 2003 op. cit. 37 B. Smith, Pitch Invasion. 2007 op. cit.

26
Based in Asia, these companies manage manufacturing networks throughout the region to supply big brands, in
particular athletic ones. These suppliers positioned themselves as coordinators of transnational supply rather than
traditional manufacturers – meeting the brands’ need for cost efficiency, quality, and fast turnover.38
Based in South Korea, Taiwan, and Hong Kong, these large producers have inspired copy-cats in other Asian
countries (like Singapore, Malaysia, China, India and Sri Lanka) and in the Middle East.39
Companies like Li & Fung (Hong Kong), Esquel (Hong Kong), Ha-Meen (South Korea), Ramatex (Malaisia), Tri-Star
(Sri Lanka) and Pou Chen (Taiwan) are among the leading suppliers of Nike, Adidas and Puma. Pou Chen, for
example, employs more than 400,000 people in Asia and possesses factories in China, Indonesia and Vietnam. Its
subsidiary Yue Yuen employs 60,000 people in its Dongguan complex near Hong Kong and manufactures about
20% of sports footwear sold each year around the world.40
The emergence of these Asian corporations, unknown to the wider public, has given birth to a “triangular
structure” where intermediary suppliers, now of multinational size, are in direct contact with the brand, and
handle management of the supply chain through a network of subcontracting factories which produce individual
components which they then assemble.41
These intermediary suppliers are often also responsible for prototyping products in close collaboration with the
brand’s designers, effectively leaving the role of apparel manufacturers42 to become co-developers.43
Mainly organized in the footwear manufacturing sector, which is more concentrated, this business model is swiftly
developing in the sports apparel sector which had been much more fragmented.44
In this context, the big brands gradually lost their leverage, becoming but one of these transnational behemoths’
many clients. To contain their supply costs while controlling the quality of their products and conserving their
technical advances, Nike, Adidas, and more recently Puma, have developed new systems of management for their
network of suppliers.
2.2 New methods for sportswear brands to control suppliers and optimize costs
Starting in the 2000s, new methods of optimizing supply chain production and management have emerged in the
sportswear sector, first for footwear and gradually for apparel.45
These systems were invented at Toyota in the 1970s and grouped under the term lean manufacturing or just lean.
Highly adapted to assembly-line products with multiple components, lean management quickly spread through
the auto and electronic industries in Japan, before reaching the United States and Europe in the 1990s.
38 S. Azmeh and K. Nadvi, Asian firms and the restructuring of global value chains, London School of Economics 2014 C. Staritz, Apparel export – still a path for industrial development? Dynamics in apparel global value chains and implications for low-income
countries, OFSE, 2012 ; R. Appelbaum, Giant Transnational Contractors in East Asia: Emergent Trends in Global Supply Chains, Competition & Change, 2008 39 Ibid. 40 Reuters, http://www.reuters.com/article/yue-yuen-ind-workers-idUSL3N0N02FX20140408 consulté le 10/05/2016 New York Times http://www.clb.org.hk/content/new-york-times-workers-strike-shoe-factory-over-benefits-dispute consulté le 10/05/2016 41 S. Azmeh and K. Nadvi (2014), C. Staritz (2012) and R. Appelbaum (2008) op. cit. 42 également appelé OEM : Original Equipment Manufacturer 43 également appelé ODM : Original Design Manufacturer 44 R. M. Locke, The Promise and Perils of Globalization, 2003 op. cit.. 45 Man-Li Lin, Improving Product Development and Production with Target Cost Management: An empirical study of the Taiwanese-owned
sporting goods industry, Tunghai University, 2007

27
Guided by demand, no longer by supply, it is founded on three main pillars:
- Just-in-time production.
- Quality at all levels of the chain of production.
- Cost reduction.
In practice, the process is based on actively troubleshooting production disruptions in order to reduce buffer
stocks, fight waste, reduce defects, cut waiting time, master lead times, manage employee skills and reduce
costs.46
Facing the emergence of major Asian manufacturers, Nike and Adidas saw an opportunity to control the quality of
their products, while reducing production costs and maintaining their technical advantage.
One of the main tools used by the sportswear companies in the context of lean is target costing.
This approach extends the “setting price by value” strategy which is the norm in the athletic apparel sector. First
introduced by Nike in the 1980s, it broke with the previous practice of setting prices by adding manufacturing
costs to the desired profit margin.47
46 Ibid. 47 A. Kasanagottuwar et al., Nike Marketing Strategies, NIIT Imperia Bangalore Center, 2011 Market Realist, Understanding NIKE’s Pricing Power and Premium Products Tilt, December 2014 http://marketrealist.com/2014/12/understanding-nikes-pricing-power-and-premium-products-tilt/ consulté le 15/05/2016

28
Thanks to target costing (see the flow chart below), sportswear makers now set…
- The final retail price first.
- Then, the desired profit margin.
- To arrive at the maximum production cost of their product.
Thus, for each product they specify to their supplier the origin and price of the raw materials used, as well as the
cost allocated for workers’ salaries.48
Figure 21. Flow Chart Outlining the Principle of Target Costing
Source: Tunghai University (2007)
Today sportswear brands go even further by optimizing the number of minutes spent by workers on each shoe in
order to improve productivity and reduce associated costs, as this document from an internal Adidas presentation
illustrates.49
Figure 22. Optimization strategy for labor costs developed by Adidas
Source: Internal Adidas Presentation (2015)
48 Man-Li Lin, Improving Product Development and Production with Target Cost Management, Tunghai University, 2007 op. cit. 49 www.adidas-group.com/media/filer_public/86/a5/86a53df1-c795-4b consulté le 24/04/2016

29
In practice, the method is realized through management software, an example of which is given below. For a given
shoe, the software displays the array of components used, their cost and suppliers, and the labor costs for
assembly.
Figure 23. Example of a technical Target Costing file for the production of sneakers
Source : Sneaker Factory (2014)

30
Lean and target costing allow the sports brands to control fluctuations in their supply costs at every level of
production by optimizing all product components, including work time.
By using this method, Nike and Adidas can “remotely” manage every step in their complex and ramified supply
chain, just as the automobile industry had done before them.
It is these very systems that have paved the way for fully customizable products, which can be ordered from
suppliers directly by consumers online.
Lean has now been implemented in the great majority of the Big Three’s suppliers, whether for the production of
sportswear or apparel (below the example of Nike).
Figure 24. Degree of lean implementation in Nike’s suppliers
Source: Nike internal presentation, relayed by Market Realist (2014)
This implementation has produced big results. In its 2013 Social Responsibility Report, Nike reported that lean had
allowed for a 50% reduction of manufacturing waste in its apparel lines and a 10% to 20% productivity increase
among its footwear suppliers, even while slashing lead times by 40%.
Figure 25. Degree of implementation of lean among Nike suppliers
Source : Nike, according to Market Realist (2014)
As Nike’s COO put it during an investor meeting in October 2013:

31
“Lean has delivered an additional $.15 savings per unit through better labor productivity and less waste. Maybe most
encouraging in this area is the more work we do in lean, the more confident we are there are still significant savings to
be achieved.” 50
2.3 The impact of supply strategies: volatility of supply contractors, substandard wages and labor risks.
2.3.1 Towards a reduction of the number of factories, but with enduring instability
The implementation of lean and target costing has scaled down the number of big-brand suppliers, as traditional
garment industry tendering systems are replaced with closer relations to lean-implemented factories.
This trend is illustrated by the progressive reduction of the number of factories that supply Nike, Adidas and
Puma, visible in the lists they publish each year.
Figure 26. Number of suppliers to Nike, Adidas et Puma
Source : Basic, from supplier lists published by the companies
However, this hasn’t ended volatility in the list of factories, as is the case with Adidas.
50 Comments reported in: Credit Suisse, 2014 Apparel and Footwear Sourcing Outlook, April 2014

32
Figure 27. Analysis of the list of factories supplying Adidas
Source: Basic, based on the list of suppliers published by the company
To analyze this phenomenon, we have carefully studied the complete list of factories under contract with Adidas
from 2011 to 2015 for its three main supply countries: China, Indonesia and Vietnam.
Comparing the names and addresses of factories, the study shows that the brands continue to change suppliers
regularly from year to year. Thus, while we find a reduction in the total number of contract suppliers to 158, there
are in reality 306 factories who have stopped working for Adidas and 154 new ones that have been recruited.
2.3.2 Shifting manufacturing from China to Vietnam and Indonesia: decreasing labor costs and paying
substandard wages
By spreading lean management tools to their key suppliers in several Asian countries, these brands have
effectively continued their strategy of manufacturing relocation.
This is obvious from their continuing withdrawal from China over the past several years, and the parallel increase
in orders to Indonesia and especially Vietnam.
For athletic shoes (see below), a detailed study of Nike and Adidas’ annual reports shows that their sourcing from
China has dropped by 20% and 38% respectively since 2008, while, during the same period, sourcing from
Indonesia has increased by 20% and sourcing from Vietnam has increased by 45% and 26% respectively.

33
Figure 28. Shift in production countries for Nike and Adidas footwear (2005-2014)
Source: Corporate Social Responsibility reports
China has thus dropped from the brands’ top supplier to a tie for second place with Indonesia, while Vietnam has
become the top manufacturing country for these brands’ shoes by a big margin.
A similar trend can be seen in the supply for Nike and Adidas apparel.

34
Figure 29. Shift in production countries for Nike and Adidas apparel (2005-2014)
Source: Corporate Social Responsibility reports
While China remains these two brands’ top manufacturing country for apparel, Vietnam has climbed from third to
second place, tied with Cambodia and Thailand.
The data published by Puma, though more recent, allows us to extrapolate a deepening trend: in scarcely 3 years
(2012-2104), its sourcing of shoes and apparel in China has dropped by 23% while its purchases from Vietnam have
increased by 13%.
Figure 30. Shift of production countries for Puma footwear and apparel (2012-2014)
Source : Annual Corporate Social Responsibility Reports

35
This shift is above all motivated by an effort to get around rising wages in China, where labor costs are rapidly
approaching those of Mediterranean and Easter European countries, and are far above wage rates in Indonesia
and Vietnam.
Figure 31. Average hourly wage in the garment industry in 2014
Source: Werner, Hourly labor costs in the textile industry
Nike Inc.’s COO, Erik Sprunk, stated during an investor day in October 2013 that “It’s no secret; this model is facing
significant challenges with rising labor rates and trend source protectionism in a few key markets… As we
introduce more and more of this innovation, we expect significant increases in labor productivity. And these
innovations also create the possibility to make products closer to market so we can serve our consumer more
quickly with products that perform better.”51
The international sourcing director at Adidas, John McNamara, revealed in a 2015 internal presentation that rising
wages in China were behind their current strategy of delocalization towards countries with lower labor costs (see
below).52
Figure 32. Excerpts from the internal Adidas presentation on sourcing 2015-2020
Source : Adidas
51 Comments reported by: Credit Suisse, 2014 Apparel and Footwear Sourcing Outlook, April 2014 52 www.adidas-group.com/media/filer_public/86/a5/86a53df1-c795-4b consulté le 04/24/2016

36
He also stated at an investor’s workshop in 2015 that Adidas would reduce the amount of apparel and footwear it
sources from China, while increasing orders to Indonesia, Vietnam, Cambodia and Myanmar. "We see Myanmar as
one of the last great sourcing markets for our type of product," he said.53
The delocalization movements underway are corroborated by internal Adidas memos which describe its 2015-
2020 sourcing strategy (see below).54
They clearly show Adidas pulling out of China and moving to:
- Indonesia, India and Myanmar for footwear manufacturing;
- Vietnam, Cambodia, Indonesia and Pakistan for apparel.
Figure 33. Evolution of Adidas’ sourcing countries 2015-2020 for the manufacture of shoes and clothes
Source: internal presentation on Adidas’ sourcing strategy (2015)
Though similar information hasn’t been made public for Nike and Puma, current trends indicate they are
implementing comparable plans for transition.
To analyze the impacts of this shift, the question of workers’ wages has been studied in greater depth in each of
these countries by consolidating information on:
- The legal minimum wage in effect on 1 January 2015
- Average wages by sector in the garment industry.55
53 China Daily, December 2015: http://europe.chinadaily.com.cn/business/2015-12/11/content_22687006.htm consulted 05/12/2016 54 www.adidas-group.com/media/filer_public/86/a5/86a53df1-c795-4b consulted 04/24/2016 55 According to the study: Phu Huynh, Employment, wages and working conditions in Asia’s Garment sector, Asia-Pacific Office of the ILO, 2015

37
- The living wage recommended by the Asian Floor Wage Alliance (see below).56
- The latest available estimates of a living wage (defined as a wage allowing a worker to meet his or her
family’s basic needs).
Living Wage and the Asian Floor Wage Alliance
Figuring in the calculation of a living wage are:57
- Basic nutritional needs as outlined by the International Health Organization, taking into account the regional and
cultural context,
- The minimum cost of housing,
- Costs of other essential household needs: educating children, health, clothing, transportation, and enough
discretionary income to allow for some limited savings.
Based on this definition, in 2009 and 2013, the Asian Floor Wage Alliance calculated an estimated living wage for
the major Asian countries of production. This salary allows a worker to cover the basic needs of a “typical family”
of 4 (2 adults and 2 children) on the basis of a 48-hour work week.
It is a unique figure expressed in purchasing power parity (PPP) which takes into account differences in standard of
living between countries and may be converted into the local currency to be compared to the wages in effect.58
As a complement to the Asian Floor Wage Alliance’s work, this study is based on the latest published estimates of
the living wage for families of garment workers in several countries using baseline methodology.59
Country Year Source study
VIETNAM 2013 Vietnam General Confederation of Labor,
Ministry of Labor, Invalids and Social Affairs
INDONESIA 2015 Wage council of the Jakarta provincial government and Batam
National survey on the costs of living (Kebutuhan Hidup Layak-KHL)
CAMBODIA 2015 Solidarity Center & DC Research
BANGLADESH 2013 Center for Policy Dialogue Bangladesh & Berenschot
INDIA 2015 BSD Consulting, Fair Fashion Network & Continental Clothing
THAILAND 2015 Thai Labor Solidarity Committee
CHINA 2011 ZhongShan University
Figure 34. Studies of the living wage used in this report Source: BASIC
In order to compare the data, wages have been evaluated on a monthly basis and corrected for inflation in each
country. The amounts have been calculated in local currency and converted to euros.
These estimates clearly show that, on average, wages paid to garment workers are substantially higher than the
minimum wage in the main countries of production (see below).
56 L’Asian Floor Wage Alliance est une coalition asiatique d’ONG et syndicats soutenue par le Collectif Ethique sur l’Etiquette 57 R. Anker, A new methodology for estimating internationally comparable poverty lines and living wage rates, 2005 58 Clean Clothes Campaign, Tailored Wages: Are the big brands paying the people who make our clothes enough to live on?, 2014 59 In particular, R. Anker, A new methodology for estimating internationally comparable poverty lines and living wage rates, 2005

38
Figure 35. Minimum wages, average wages in the sector, and living wages in the main garment-producing countries
Source : BASIC, based on a combination of ILO data and living-wage studies
Nevertheless, they are below the living wage in all countries except China. This holds true whether the living wage
is calculated from estimates by the Asian Floor Wage Alliance or based on the latest national studies available.
It would thus appear that Nike, Adidas and Puma are pulling out of the only country where average worker
earnings have reached the living wage: China. The same trend is occurring in Thailand, where real wages are
quickly approaching the living wage. On the contrary, the big three sportswear brands are resolutely orienting
themselves toward countries where workers don’t earn enough to cover their families’ basic needs: wages are 33%
below the living wage Vietnam, 45% in Cambodia, and 50% in Indonesia and India.
2.3.3 Toward countries with the highest risk of labor violations
The Big Three’s search for production savings has led them to invest in low-wage countries at greater risk of labor
violations. This state of affaires has led Nike, Adidas and Puma, to utilize a system of labor auditing to stymie the
most egregious labor violations, without questioning the economic practices at their origin.
Since the results of the Big Three’s audits aren’t made public, this study is based on reports published by the
International Labor Organization (ILO) in the context of its program Better Work. The report concerns Indonesia,
Vietnam and Cambodia, the main countries where Nike, Adidas and Puma are currently headed.
In this context, the ILO has conducted annual field surveys in the garment industry that investigate problems of
non-compliance with labor standards. The study includes:
- 140 factories in Indonesia
- 193 factories in Vietnam
- 393 factories in Cambodia

39
As the latest results published by the ILO show (see the diagram below), rates of non-compliance linked to
compensation are particularly high in these three countries. They concern the non-payment of overtime (in
Vietnam and Indonesia), statutory leave (in Vietnam) and healthcare (in Indonesia). 60
Figure 36. Non-compliance with legal requirements concerning compensation in the factories audited by the Better Work Program
Source : BASIC, based on ILO data (2015)
According to the ILO, these problems have tended to improve in Indonesia and Cambodia for the last few years,
thanks to programs run jointly by the national authorities, international organizations and private actors. On the
other hand, they seem to be deteriorating in Vietnam because of pressure on prices exercised by buyers and
heightened competition between suppliers.61
What’s more, these surveys show that 40% to 50% of factories continue to use a system of “dual wage
accounting”: one set of books correspond to real compensation, while another is “cooked” to present rectified
figures that comply with required social audits.62
With regard to labor law, non-compliance appears much higher in the three countries (see below).
60 International Labor Organization, Better Work Vietnam: Garment Industry 8th Compliance Synthesis Report, July 2015 International Labor Organization, Better Work Indonesia: Garment Industry 5th Compliance Synthesis Report, September 2015 International Labor Organization Better Factories Cambodia: Garment Industry 32nd Compliance Synthesis Report, June 2015 61 International Labor Organization, Better Work Vietnam Thematic Synthesis Report on Compensation, December 2015 62 International Labor Organization, Better Work Vietnam, 2015 op. cit. International Labor Organization, Better Work Indonesia, 2015 op. cit. International Labor Organization, Better Factories Cambodia, 2015 op. cit.

40
Figure 37. Non-compliance with labor requirements in factories audited by the Better Work Program
Source : BASIC, according to the ILO (2015)
They mainly concern work-contract violations, excessive daily or weekly working hours, and non-compliance with
overtime limits. A large portion of factories declare that these violations are directly related to the tight
turnaround times imposed by buyers.63
Indonesia stands out for denying statutory leave, and Vietnam for restricting union activity—including union
busting by public agencies, and the absence of collective bargaining—which concerns more than half of audited
factories in in 2015.64
Workplace health and safety emerges as the most problematic issue according to field investigations conducted
by the ILO (see graph below).
Figure 38. Non-compliance with legal health and safety requirements in factories audited by the Better Work Program
Source : BASIC, based on ILO data (2015)
63 Ibid. 64 Ibid.

41
The majority or even the near-totality of factories in these three countries were found in violation of fire safety,
chemical handling and dangerous substance storage rules, and rules for the use of protective gear by workers.
These figures are even more striking in light of the factory accidents that have continued to occur in these
countries.65
In terms of gender inequality, ILO investigations show that all the labor issues mentioned above are magnified for
women, who constitute the majority of garment workers and are the main victims of discrimination in that sector
in Vietnam, Indonesia and Cambodia.66
According to statements by Nike, Adidas and Puma, these types of labor violations are detected by audits and
they claim to take adequate measures each time a case is found among their suppliers (see chapter 3).67
These issues are also at the origin of labor conflicts which regularly embroil the major sports brands’ suppliers (see
below).
Large-scale Labor Conflicts in The Big Three’s Supply Factories
Strikes broke out in late 2013 throughout the Cambodian garment industry around worker discontent over
minimum wage negotiations. They led to the death of one employee and the arrest of several union officials.68
In Vietnam that same year, political tensions with China touched off uprisings in garment factories near Ho Chi
Minh and led to a fire in several of them.69
In China in 2014, Yue-Yuen, the worlds top athletic-shoe manufacturer and a supplier of the Big Three became
embroiled in a strike of unprecedented proportions: 40,000 employees of the Gaobu complex near Shenzen
stopped work for several weeks to make demands regarding social insurance, housing and wages, bringing the
company’s main factory to a stand-still. Another strike in 2015 mobilized 5,000 workers in opposition to a
production shakeup planned by management after buyers ordered them to curb ballooning costs at the factory.70
2.3.4 The long-term vision of sportswear brands: machines to replace workers
In the long-term, sportswear brands hope to go beyond relocating manufacturing activities: they want to further
reduce labor costs by automating their product assembly lines and drastically reduce their workforce.
65 International Labor Organization, Better Work Vietnam, 2015 op. cit. International Labor Organization, Better Work Indonesia, 2015 op. cit. International Labor Organization, Better Factories Cambodia, 2015 op. cit. 66 Social Responsibility Reports, Nike, Adidas and Puma, 2014 et 2015 67 Ibid. 68 Puma, Annual Report, 2014 69 Ibid. 70 Reuters: http://www.reuters.com/article/yue-yuen-strike-idUSL3N0WK1PY20150318 consulté le 09/05/2016 Wall Street Journal: http://www.wsj.com/articles/SB10001424052702304163604579528504234144092 consulté le 09/05/2016

42
One of the main tools for implementing this strategy is lean management talked about earlier. Indeed, following in
the footsteps of automakers these past 30 years, Nike and Adidas want to transform their mostly manual
production workshops into robotic production lines.
The two companies are investing considerably in the development of a new generation of entirely robotic
factories.
Adidas has just opened the world’s first automated athletic shoe factory in Germany, in the Bavarian city of
Ansbach.71
Figure 39. First images of the robotic production line opened by Adidas in Bavaria
Source: Adidas website (2015)
The first lot of 500 shoes is planned for the first quarter of 2016 and large-scale production for 2017. The company
has already announced the opening of a second factory in the United States next year. Similar set-ups are also
planned in Great Britain and France, and the Mannschaft jersey could be made in Germany in the future.72
According to statements made by Adidas CEO Herbert Hainer, shoes made in automated factories would be sold
at the same price as a pair produced in Asia. This strategy is clearly a way for the company to get around
continuing wage hikes in the various production countries.73
Nike has pursued a similar strategy for the past several years.74
In October 2013 the company invested in a Silicon Valley start-up specialized in robotization, Grabit, Inc.75
It has above all created a partnership with Flextronics, the world’s second largest electronic equipment
manufacturer and supply chain solutions company, to develop new applications in the sports apparel sector.76
As described in the latest Flex report to investors (see below), the goal of their partnership is to automate footwear
production as a remedy to rising wages in the supply chain.77
71 http://news.adidas.com/us/Latest-News/-from-robots-to-your-home-adidas-first-speedfactory-lands-in-germany/s/f4d890b6-e38d-4a32-b20d-
ebc9683972ec consulted 05/12/2016 72 http://www.theguardian.com/world/2016/may/25/adidas-to-sell-robot-made-shoes-from-2017?CMP=share_btn_link consulted 05/25/2016 73 Ibid. 74 http://www.theguardian.com/world/2016/may/25/adidas-to-sell-robot-made-shoes-from-2017?CMP=share_btn_link consulted 05/25/2016 75 http://www.geekwire.com/2013/nike-invests-silicon-valley-robotics-company-grabit/ consulté le 9/05/2016 76 http://news.nike.com/news/nike-s-manufacturing-revolution-accelerated-by-new-partnership-with-flex consulted 05/10/2016 77 http://s2.q4cdn.com/065994059/files/doc_presentations/2016/April-2016-IR-Presentation-Flex.pdf consulted 05/019/2016

43
Figure 40. Partnership between Nike and Flex to automate footwear production and stymie rising labor costs
Source : Flex website (2016)
Nike and Adidas’ recent shift in strategy show that they consider general production costs, and labor costs in
particular, as reducible expenses.
This lies in stark contrast to marketing and especially endorsement costs, which are considered indispensible to
their business model and thus virtually limitless (see previous chapter).

44
3. The conditions for a responsible supplier
3.1 From the emergence of sweatshops to the development of social responsibility
3.1.1 A public censure by NGOs with major repercussions
The same factors that have allowed Nike to grow at an impressive rate by taking advantage of bargain sourcing in
Asia – and investing those savings in innovation and marketing – have also led to major problems in terms of social
impact.
During the 1990s, a series of scandals broke involving underpaid workers in Indonesia, underage workers in
Cambodia and Pakistan, and poor working conditions in Chia and Vietnam, which seriously tarnished Nike’s image
(see sidebar below).
During a May 1998 speech at the National Press Club, Nike founder Phil Knight admitted that: ''The Nike product
has become synonymous with slave wages, forced overtime and arbitrary abuse,'' he said.
Scandals Plaguing Nike in the 1990s
In Indonesia, Korean factory owners supplying Nike asked for systematic minimum wage exemptions, arguing they were
financially impractical. After a consortium of NGOs broke the story, CBS broadcast a 1994 report that made waves. The
Nike Vice-President for Asia stated that: “at Nike we know nothing about manufacturing; we’re just designers and
market specialists.” Meanwhile the head of Indonesian operations stated: “these facts concern our subcontractors, we
aren’t mandated to look into such allegations.” Facing media pressure, Nike finally announced in 1999 that wages
among its Indonesian suppliers would be raised above the minimum wage.78
In June 1996, Life magazine published an article on underage labor in Pakistan, including a photo of a 12-year-old boy
sewing a Nike football in the city of Sialkot where 70% of world production was then located. This article unleashed a
second wave of criticism against Nike and a call to boycott by consumer associations, unions and NGOs. The impact was
devastating for the company’s image. In response, Nike set up a labor auditing system in collaboration with UNICEF and
concentrated its production in centers that were easier to control.79
In November 1997, an assessment report commissioned by Nike from Ernst & Young on the subcontractor’s factories in
Vietnam was released to an NGO, and results were published in a front-page article in the New York Times. It revealed
grave health risks linked to exposure to chemical pollutants, in particular toluene, in blatant violation of Nike’s code of
conduct. Taken together, these stories created increased public doubt that the company was truly invested in ending
these practices.80
Beyond Nike, these scandals sparked a growing public awareness of the effects of delocalizing to less costly labor
markets in the industry at large.
78 International Sourcing in Athletic Footwear: Nike and Reebok, HBS Case # 9-394-189 79 K. Nadvi and S. Kazmi, “Global Standards and Local Responses,” Institute for Development Studies, Sussex, 2001 80 D. O’Rourke, “Smoke From A Hired Gun: A Critique of Nike’s Labor and Environmental Auditing in Vietnam as performed by Ernst and Young,” CorpWatch, 1997

45
This policy shift was achieved through the work of civil society actors in the United States and Europe who made
significant investments in order to study conditions in the field, work with unions in production countries, and raise
public awareness in consumer countries.
The last report was published by the coalition Clean Clothes Campaign in 2008 for the Beijing Olympics. Entitled
“Play Fair: Clearing the Hurdles,” it identifies three main problems which prevent the sportswear industry from
respecting human rights in the workplace81 :
- Lack of respect for freedom of association and the right to bargain collectively.
- The wave of factory closings following restructuration, creating a climate of insecurity among workers
and suppliers, who are thus dissuaded from working to improve conditions for fear of losing their jobs.
- Abuse of short-term labor contracts and other forms of precarious employment dissuading workers from
organizing and leading to lax application of labor law which, too often, is not applied to temporary
employees.
3.1.2 Major progress and strong commitments from the sportswear brands
Facing these mobilizations, Nike, Adidas and Puma set up a number of mechanisms which put them at the
forefront of CSR in the garment and apparel industries.
Under pressure from NGOs, Nike became the first company in the sector to publish a full list of its direct suppliers
in 2005, followed by Adidas in 2007, and then Puma. This initiative allowed workers, unions, and civil society actors
to monitor the implementation of these brands’ commitments on the ground. It should be noted that few other
companies have followed in their footsteps on this key issue of transparency in their supply chains.82
Nike, Adidas and Puma have also developed codes of conduct and standards that are enforced among suppliers.
These audits can apply to human resources management, working conditions, health, or environmental safety.
Each year they concern about 90% of supply contractors, in particular new ones, and reveal labor violations in
between 15% ad 30% of factories, which has led to actions ranging from a second audit, to warning letters, or even
total exclusion from the list of suppliers.83
These audits aren’t made public, but are rather exchanged with other brands on the platform Fair Factories
Clearinghouse. In addition, Nike, Adidas and Puma have set up systems allowing workers to report abuse and often
intervene directly in negotiations with unions and suppliers in case of strikes.84
More recently, the Big Three have committed to reducing the ranks of their suppliers and have forged long-term
relationships to work on durable solutions and create labor-sensitive supply chains.
3.2 A business model at odds with the brands’ commitments to CSR
81 Clean Clothes Campaign, Surmonter les obstacles : Mesures pour améliorer les salaires et les conditions de travail dans l’industrie mondiale des vêtements et chaussures de sport, Play Fair 2008 82 Clean Clothes Campaign, Tailored Wages, 2014 op. cit. 83 Adidas Group, Make a Difference, 2014 – Nike, Sustainable Business Performance,2013 – Puma, Annual and Sustainability Report, 2014 84 Baptist World Aid Australia, Apparel Industry Trends, 2015

46
The main tools developed by the sportswear brands to improve social conditions and workers’ wages have actually
resulted indirectly from production optimization schemes.
The best illustration of this phenomenon is the manufacturing index put into place by Nike which serves as a
benchmark for the selection of suppliers and factories: it is based on the three pillars of lean management – cost,
quality and lead time – combined with the results of labor and environmental auditing.
Figure 41. Manufacturing Index set up by Nike
Source : Nike, Sustainable Business Performance Summary (2012)
While lean – which Nike and Adidas have spun as a way of giving employees a voice – can give suppliers a bigger
role in enforcing labor standards, it is also and above all a tool for reducing production costs by controlling the
supply chain, and its overall impact has been at odds with the Big Three’s most recent CSR commitment (cf.
previous chapter). 85
Beyond the apparent reduction in the number of factories that has accompanied lean implementation, the
volatility of suppliers seems to persist, seemingly motivated by the search for the lowest bidder (as shown in the
previous chapter). This fact undermines the brands’ stated commitment to building long-term partnerships with a
smaller number of factories in order to allow them to improve working conditions.
Even worse, this system allows Nike, Adidas and Puma to continue their strategy of shifting production from China
to Indonesia, Vietnam, Cambodia, and India where labor costs are lower, while trying to minimize labor risks
through more frequent auditing.
85 G. Distelhort, J. Hainmueller & R. M. Locke, Does Lean Improve Labor Standards? Capability Building and Social Performance in Nike, 2014 Boston Consulting Group, Apparel at a crossroads, 2014
47
Sportswear brands orient their sourcing toward countries where the average wages are far below the living wage
necessary for workers to meet their family’s basic needs (see previous chapter).
This runs contrary to one of their main commitments: eventually guaranteeing payment of living wages by all
suppliers and allowing employees to earn a decent living from their work. In contrast, their websites relay the
following statements:
- Adidas : “We take living wages into account by researching fair wages and by applying our Respect-Protection-
Promotion model to the workers in our supply chains. Our concept of fair wages goes further than the living
wage: it takes into account the cost of living for workers but also the price of products and the profits of
employers.”
- Nike: “Wage levels is one of the major issues identified by our labor audits. We think it’s an important issue and
that’s why we’ve worked for years to study worker earnings. We want to do more by putting fair supply chains
into place.”
- Puma: “We are exploring methods of paying a fairer wage in partnership with the Fair Wage Network. We also
work with civil society to support workers in supply countries in their fight for fair wages.”
These elements demonstrate the deep contradiction that exists between the CSR commitments by these
sportswear brands, and a business model based on the holy trinity of innovation, marketing and endorsement –
which they can only pay for by optimizing production costs.
An example of this situation is described in an April 2014 article in the Wall Street Journal86 published following a
visit to Bangladesh by Nike’s management teams right before the Rana Plaza factory collapse. Entitled “Inside
Nike's Struggle to Balance Cost and Worker Safety in Bangladesh” it related the internal divisions within Nike’s
management team, torn between controlling costs and maintaining safe working conditions. While Nike finally
decided to end their contract with one supplier deemed “at risk,” the company has remained in the country and
continues sourcing from three factories employing more than 15,000 people (according to Nike’s website).
3.3 Workers receive a tiny fraction of the value of products they produce
This contradiction is obvious from the price breakdown of Nike, Adidas and Puma products: only a tiny fraction of
the final retail price goes to workers.
To drive the point home, data from several sources, including the industry itself, has been put together to establish
the price breakdown of the best-selling footwear and jersey items.
Estimates have been made on two Nike shoe styles (see below) :
- A mid-range shoe from the “fashion” collection like a Cortez or Roshe
- An image shoe: Nike’s Air Jordan
Data that has been gathered show that only a tiny percentage of the final retail price goes to workers: 2% for the
Cortez/Roshe and 1.6% for the Air Jordan—in other words sums estimated at between €1.60 and €2.40 of an €80
and €140 retail price, respectively (see below).
86 Wall Street Journal: http://www.wsj.com/articles/SB10001424052702303873604579493502231397942 consulted 05/09/2016

48
If we compare these estimates with those realized in 1995 by the Washington Post,87 we can see that the wage
share was about the same: about $2.75 USD (€2.40) for a pair of Nike Air Pegasus.
And yet 20 years ago those same wages represented 4% of the final retail price while they are estimated at less
than 2% today, showing the compression of labor costs made by Nike and its supply chains since 1995.
Figure 42. Breakdown of the retail price of a Cortez/Roshe running shoe by Nike
Source: BASIC
87 The Washington Post, Curriculum Guide: Sneaker supply and demand, May 2002 https://nie.washingtonpost.com/sites/default/files/Sneaker%20Supply%20and%20Demand.pdf consulted 05/19/2016

49
Figure 43. Estimated price breakdown for the Nike Air Jordan 1
Source: BASIC
These estimates correspond to the general case, in which shoes are commercialized by an independent distributer
(like Foot Locker).
The results are significantly different for direct sales to consumers (through Nike’s network of stores, or online
sales, which represented almost 25% of sales revenues for the sportswear brand in the first quarter of 2016, a
figure in constant progression). 88
When the shoes are sold online on the Nike store (whose sales have progressed by 55% between 2014 and 2015 89),
we can estimate shipping fees at about €13 per pair, making the brand’s margin the following (see the diagram
below):
- € 23.60 for the Cortez/Roshe model (or 29.5 % of the shoe price)
- € 68.70 for the Air Jordan 1 (or 49 % of the shoe’s price)
88 Market Realist, Nike Moves a Step Ahead with Innovation-Driven Growth, Mars 2016 http://marketrealist.com/2016/03/nike-moves-step-ahead-innovation-driven-growth/ consulted 05/15/2016 89 Ibid.

50
Figure 44. Estimate of the breakdown of Nike Cortez/Roshe running shoes sold on Nike’s online store
Source : BASIC
Figure 45. Estimate of the price breakdown of a pair of Nike Air Jordan 1 sold online by Nike
Source: BASIC
Similar estimates were made for a mid-range technical T-shirt from Adidas’ collection (like Techfit), this time by
comparing labor costs between China and Vietnam.

51
The results of these calculations indicate an even smaller share of worker’s wages in the final retail price of the
items: € 0.40 when the product is manufactured in China (or 1.5% of the final price) and € 0.20 when it is
manufactured in Vietnam (0.7% of the final price), compared with a retail price of € 30 on average.
Figure 46. Price breakdown for a technical T-Shirt technique like Techfit, made in Chine
Source : BASIC
Figure 47. Estimated price breakdown for the technical T-Shirt like Adidas Techfit, made in Vietnam
Source : BASIC

52
On the scale of a product, localization to Vietnam only represents about € 0.20 difference on the cost of producing
a sports jersey. By saving these small sums on millions of items, the big brands seek to free up investment for
permanent growth of their marketing and football endorsement budgets (cf. previous chapter).
Our latest estimate concerns the football sector, and specifically the price breakdown for a jersey of a premier
league national team participating in the Euro 2016 (see below).
The information we have succeeded in gleaning indicates that production costs for such a jersey come to about €
5.85 of which €0.65 are allocated for worker compensation, while its average retail price is €85. It should be noted
that, according to our sources, these figures correspond to production in countries with relatively high wages. If
manufacture is moved to cheaper countries, production costs could be reduced by about 30%.
Figure 48. Estimated price breakdown for a National football jersey participating in the Euro 2016
Source: BASIC

53
3.4 Sportswear brands could pay fair wages if they so desired…
On the basis of the analyses laid out in Chapter 2, we have tried to estimate what the cost of paying fair wages
would represent compared with the marketing and endorsement costs incurred by Nike, Adidas and Puma, in
particular in football.
3.4.1 In relation to their marketing expenses and their business model
To estimate these costs, we drew on ILO estimates of average wages in the garment industry in the main
production countries, which we then compared to living wage estimates by the Asian Floor Wage Alliance in these
same countries.
We then used these estimates to evaluate what paying fair wages would cost on the scale of companies like Nike,
Adidas and Puma, proportionally to their sourcing by country.
Figure 49. Average sector wages and living wages in the main garment-producing countries
Source : BASIC, based on ILO Asian Floor Wage Alliance data
These calculations show that, were Nike, Adidas and Puma to pay all workers a living wage in their supply
factories, it would cost them far less than their marketing and endorsement budgets – on the order of 16% of
such budgets for Nike, 8% for Adidas, and 4% for Puma.
Paying a living wage would cost less than their annual profits, even for Puma which is currently the least
profitable of the Big Three sports brands.
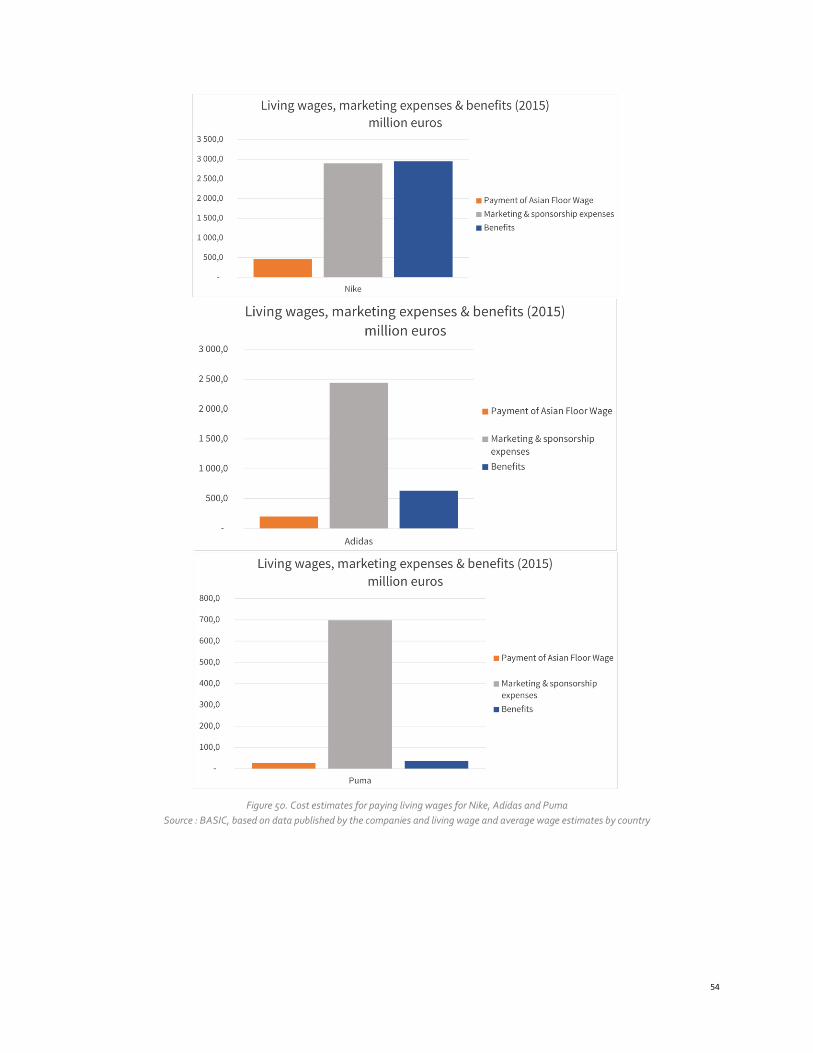
54
Figure 50. Cost estimates for paying living wages for Nike, Adidas and Puma
Source : BASIC, based on data published by the companies and living wage and average wage estimates by country

55
3.4.2 Football team and athlete endorsements
Based on these estimates, we have also investigated the cost of paying a living wage compared with the recent
rise of endorsement costs incurred by the big football sponsors.
As detailed in the first chapter, the cumulative cost of annual endorsement contracts with the 10 major European
football clubs came to more than € 406 million in 2015, compared with € 262 million two years prior, in other
words an increase of € 144 million in 2 years.
Based on the ILO and Asian Floor Wage Alliance estimates detailed previously, this sum could have allowed for
the payment of a living wage to more than 165,000 workers in Vietnam and 110,000 in Indonesia over the
same period.
Similarly, the increase of endorsement contracts for “star” football player like Lionel Messi or Paul Pogba was
estimated in the 1st chapter at about € 15 million in the last 2 years.
Based on the same ILO and Asian Floor Wage Alliance figures, we estimate that this sum could have allowed for
the payment of a living wage to more than 17,000 workers in Vietnam and 11,500 in Indonesia over the same
period.
3.5 Alternative models are possible
This study reinforces the importance of raising public awareness on living wage issues and the necessity of taking
sportswear brands to task – in particular Nike, Adidas and Puma – on the underlying contradictions between their
social responsibility commitments and their business and financial strategies.
Low wages in the sportswear sector do not result from a lack of means, they are the direct result of a business
model created to increase market share, revenue and ultimately profit. It is thus legitimate to ask the brands
how they plan to put the brakes on this vicious cycle.
This state of affairs isn’t inevitable. Indeed, new brands have begun to build alternative models over the last
several years.
In the sports apparel sector, the French sneaker brand Veja is building its supply chain and pricing based on
revenue that allows each worker to earn decent wages, from the producers of raw materials – in particular cotton
and rubber – to workers in production and distribution. In Brazil, Veja has invested in setting up organic, agro-
ecological and fair-trade suppliers for the production of raw materials. In France, the company runs a return-to-
work program whose employees manage stocks and dispatch orders. 90
Unlike Nike, Adidas and Puma, Veja has chosen not to invest in marketing or endorsements in order to free up the
necessary means for its supply chain, while proposing consumers highly successful products.
This company shows that it is possible, in the athletic shoe sector, to build a business model different from that of
the big sportswear brands.
90 http://project.veja-store.com/ consulted 05/16/2016

56
Promoting labour rights in global supply chains in labour intensive
sectors and a legally binding framework to the activities of
transnational companies.
MEMBERS :
Fédération Artisans du monde, CCFD -Terre Solidaire, Association Léo Lagrange
pour la défense des consommateurs, Athl’Ethique, CFDT, France Volontaires,
FSGT, FSU, Indecosa CGT, JOC, Oxfam France, Peuples Solidaires - ActionAid,
Ritimo, Terre des Hommes France, UFOLEP, Solidarité Laïque, CRID, La ligue de
l’enseignement, Union syndicale Solidaires.
www.ethique-sur-etiquette.org - Facebook : CollectifEthiqueSurEtiquette – Twitter : @Collectif_ESE