foul design (planning) - environmental protection agency = flow litres/day/ per person as per...
TRANSCRIPT

Project
Galway Metal Company Limited Job Ref.
051800 Section
Upgrading Foul & Surface Water Design Sheet no./rev
Calc. By
D.T./P.F.
Date
May’14
Chck’d by
P.F.
Date
May’14
App’d by
P.F.
Date
May’14
Domestic Waste water details of how the P.E. & DWF were calculated. Population Equivalent (p.e.) = 14 Maximum employees on site = 35 Flow given as 35 x 60l/day = 2100l/day BOD5 60l/day = flow litres/day/ per person as per Environmental Protection Agency Wastewater Treatment Manuals Treatment Systems for Small Communities, Business, Leisure Centres and Hotels Table 3: Recommended wastewater loading rates from an industrial commercial premises with office and/or factory with canteen. Expected Dry Weather Flow (DWF) 2.1 m3/day. Population Equivalent The pollution loading from domestic effluents should be expressed in terms of the pollution loading generated by an equivalent domestic population, referred to as the population equivalent (p.e.). 2100 l/day divided by 150 litres /person/day = 14 people. Dry Weather Flow For domestic effluents flow is expressed in terms of dry weather flow (DWF). DWF is expressed as litres/person/day and is typically given as 150 litres /person/day The domestic effluent DWF is calculated as 2100 l/day. Trade Waste water Existing Site Drainage. The surface water drainage on site is constructed in a manner which allows for the separation of the run-off from the buildings from the run-off from the yard. It is proposed that the surface water drainage from the building and car park area will continue to discharge from the site in the existing arrangement. The only area to discharge to the foul sewer shall be the working yard area. The drainage from the yard is collected in channels at the surface and is conveyed through large silt traps and is subsequently treated in a full retention separator . It is proposed that the discharge from the separator will collected and attenuated before pumping to the public sewer. The area of the site is 1.35 Ha. The area of the yard to be drained is 1.07 Ha.
For
insp
ectio
n pur
pose
s only
.
Conse
nt of
copy
right
owne
r req
uired
for a
ny ot
her u
se.
EPA Export 13-09-2016:01:55:05
Project
Galway Metal Company Limited Job Ref.
051800 Section
Upgrading Foul & Surface Water Design Sheet no./rev
Calc. By
D.T./P.F.
Date
May’14
Chck’d by
P.F.
Date
May’14
App’d by
P.F.
Date
May’14
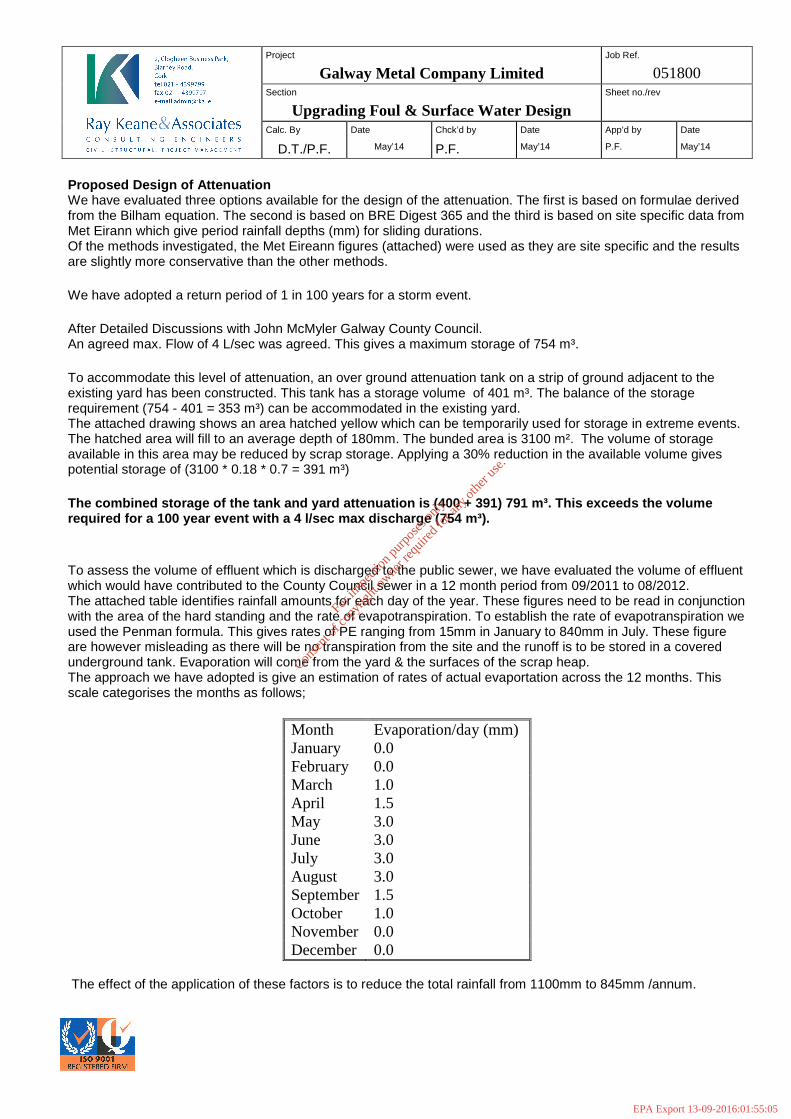
Proposed Design of Attenuation We have evaluated three options available for the design of the attenuation. The first is based on formulae derived from the Bilham equation. The second is based on BRE Digest 365 and the third is based on site specific data from Met Eirann which give period rainfall depths (mm) for sliding durations. Of the methods investigated, the Met Eireann figures (attached) were used as they are site specific and the results are slightly more conservative than the other methods. We have adopted a return period of 1 in 100 years for a storm event. After Detailed Discussions with John McMyler Galway County Council. An agreed max. Flow of 4 L/sec was agreed. This gives a maximum storage of 754 m³. To accommodate this level of attenuation, an over ground attenuation tank on a strip of ground adjacent to the existing yard has been constructed. This tank has a storage volume of 401 m³. The balance of the storage requirement (754 - 401 = 353 m³) can be accommodated in the existing yard. The attached drawing shows an area hatched yellow which can be temporarily used for storage in extreme events. The hatched area will fill to an average depth of 180mm. The bunded area is 3100 m². The volume of storage available in this area may be reduced by scrap storage. Applying a 30% reduction in the available volume gives potential storage of (3100 * 0.18 * 0.7 = 391 m³) The combined storage of the tank and yard attenuati on is (400 + 391) 791 m³. This exceeds the volume required for a 100 year event with a 4 l/sec max di scharge (754 m³). To assess the volume of effluent which is discharged to the public sewer, we have evaluated the volume of effluent which would have contributed to the County Council sewer in a 12 month period from 09/2011 to 08/2012. The attached table identifies rainfall amounts for each day of the year. These figures need to be read in conjunction with the area of the hard standing and the rate of evapotranspiration. To establish the rate of evapotranspiration we used the Penman formula. This gives rates of PE ranging from 15mm in January to 840mm in July. These figure are however misleading as there will be no transpiration from the site and the runoff is to be stored in a covered underground tank. Evaporation will come from the yard & the surfaces of the scrap heap. The approach we have adopted is give an estimation of rates of actual evaportation across the 12 months. This scale categorises the months as follows;
Month Evaporation/day (mm) January 0.0 February 0.0 March 1.0 April 1.5 May 3.0 June 3.0 July 3.0 August 3.0 September 1.5 October 1.0 November 0.0 December 0.0
The effect of the application of these factors is to reduce the total rainfall from 1100mm to 845mm /annum.
For
insp
ectio
n pur
pose
s only
.
Conse
nt of
copy
right
owne
r req
uired
for a
ny ot
her u
se.
EPA Export 13-09-2016:01:55:05

Project
Galway Metal Company Limited Job Ref.
051800 Section
Upgrading Foul & Surface Water Design Sheet no./rev
Calc. By
D.T./P.F.
Date
May’14
Chck’d by
P.F.
Date
May’14
App’d by
P.F.
Date
May’14
The table below identifies total rainfall for each month along with the number of dry days and a record of the wettest day. It can be seen that there are 175 days in the 12 month period where there was no discharge to the sewer.
Monthly summary of Oranmore rainfall
Month Total
Rainfall (mm)
Total Rainfall - evaporation
mm
Number of days with no
discharge
Highest Daily
Rainfall mm
Sep-11 119.3 87.6 13 16.7 Oct-11 135 109.8 7 16.8
Nov-11 136.6 136.6 8 29.6 Dec-11 133.6 133.6 1 9.4 Jan-12 100.8 100.8 7 11.8 Feb-12 43.2 43.2 4 8.8 Mar-12 27.6 18.8 25 7 Apr-12 55 32.9 21 10.7 May-12 49.6 25 27 10.6 Jun-12 114.6 68 19 17.8 Jul-12 92.6 47.4 23 14.6
Aug-12 94.2 41.2 20 8.2
The peak discharge for the year came on the 29th Nov. This recorded 29.6mm rainfall. The table below is taken from the automatic weather station in Oranmore. It gives the cumulative rate of rainfall over the 24 hour period. Based on this information we have prepared a graph identifying the maximum volume of storage required in the attenuation tank (see attached). The relationship between rainfall & volume of storage is as follows; The area contributing to the attenuation tank is 1.07 Ha. For every 1mm of rain that falls on site there will be ~ 10cu.m to be discharged. This identifies that on the given date a maximum storage of 85 cu.m is required just before 2 am. In our proposal to the County Council we are proposing a tank of 400 cu.m.
For
insp
ectio
n pur
pose
s only
.
Conse
nt of
copy
right
owne
r req
uired
for a
ny ot
her u
se.
EPA Export 13-09-2016:01:55:05

Project
Galway Metal Company Limited Job Ref.
051800 Section
Upgrading Foul & Surface Water Design Sheet no./rev
Calc. By
D.T./P.F.
Date
May’14
Chck’d by
P.F.
Date
May’14
App’d by
P.F.
Date
May’14
In conclusion it can be seen that the 12 month period had precipitation of 1100mm, which is close to the average. For nearly 50% of the year there will be no discharge to the foul sewer. On average the remaining wet days will contribute 4.7 cu.m . The proposed attenuation system would have comfortably dealt with the rainfall conditions
For
insp
ectio
n pur
pose
s only
.
Conse
nt of
copy
right
owne
r req
uired
for a
ny ot
her u
se.
EPA Export 13-09-2016:01:55:05

Project
Galway Metal Company Limited Job Ref.
051800 Section
Upgrading Foul & Surface Water Design Sheet no./rev
Calc. By
D.T./P.F.
Date
May’14
Chck’d by
P.F.
Date
May’14
App’d by
P.F.
Date
May’14
Connection to the Existing Foul Sewer From the attenuation tank a pair of duty and standby pumps is installed to provide a max flow of 4 l/s. This flow is metered and a display cabinet is provided in the pump house. In addition to the flow from the yard, Galway Metal have also to connected the foul effluent from their offices. The volume of this effluent is approximately 1.5 cu.m /day . The attached drawing shows the existing drainage being picked up in a 150mm foul sewer constructed at a gradient of 1 in 150. This has a capacity of 15 l/s. The rising main from the attenuation tank discharges to the head manhole.
For
insp
ectio
n pur
pose
s only
.
Conse
nt of
copy
right
owne
r req
uired
for a
ny ot
her u
se.
EPA Export 13-09-2016:01:55:05

GALWAY METAL . PROPOSED DISCHARGE TO FOUL SEWER
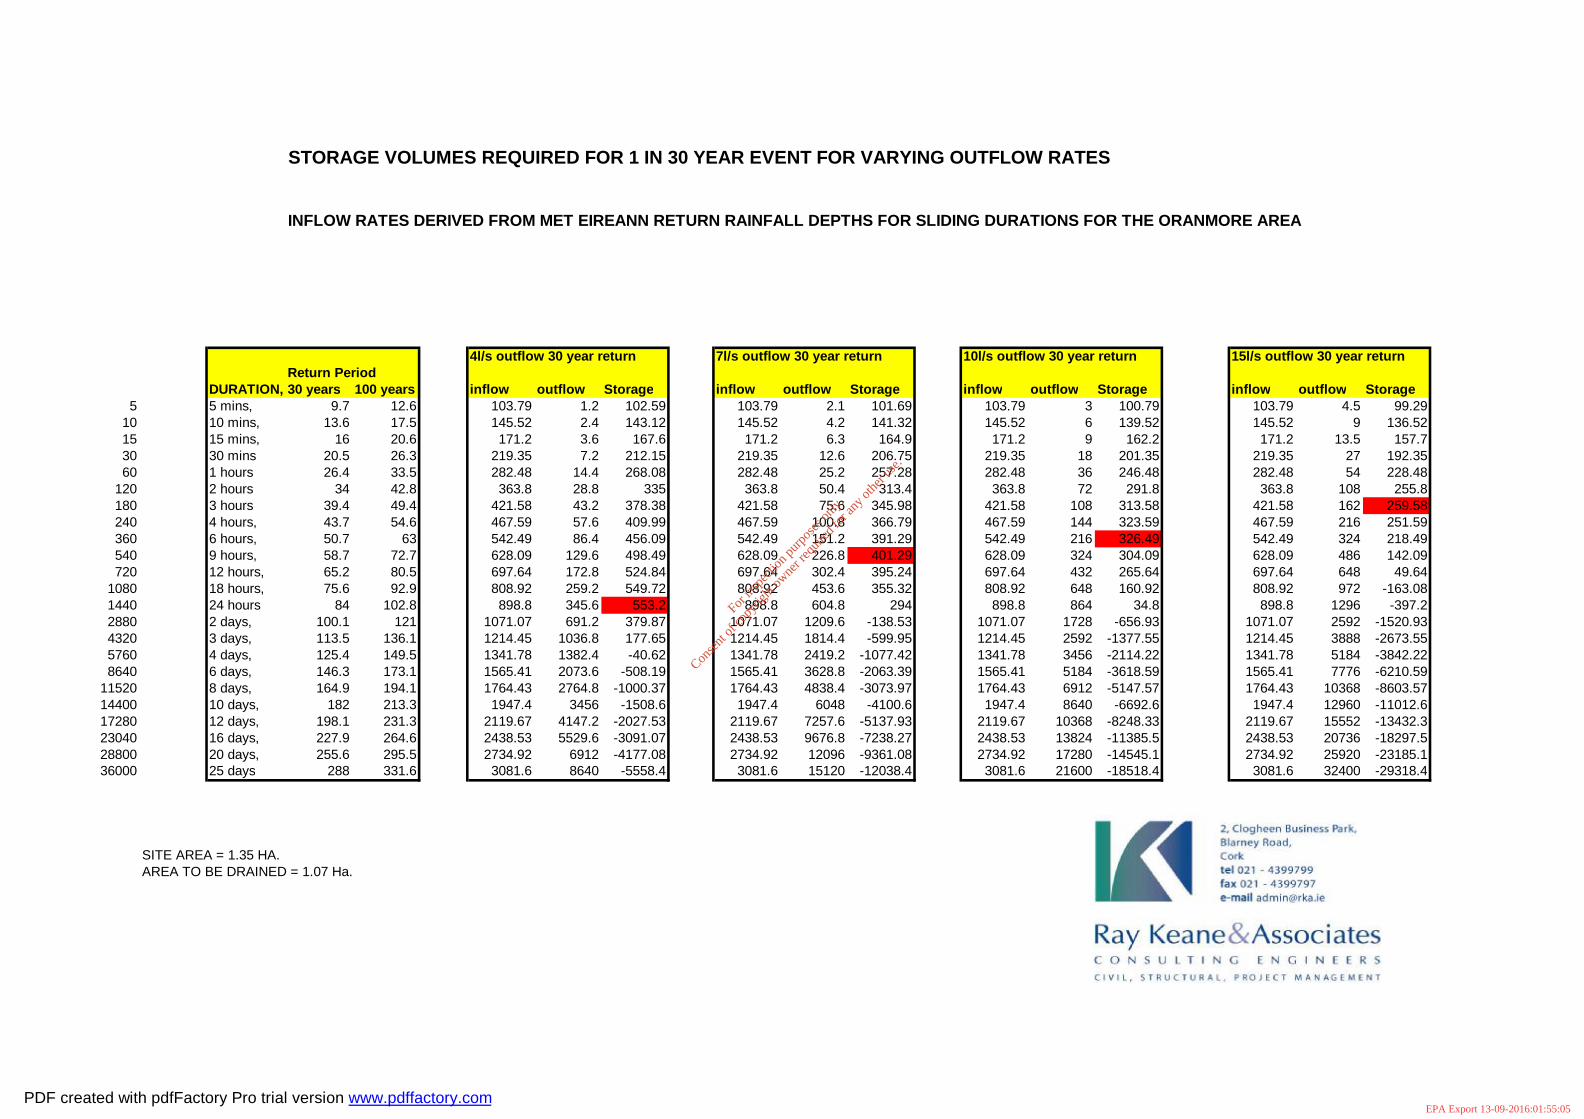
STORAGE VOLUMES REQUIRED FOR 1 IN 100 YEAR EVENT FOR VARYING OUTFLOW RATES
INFLOW RATES DERIVED FROM MET EIREANN RETURN RAINFALL DEPTHS FOR SLIDING DURATIONS FOR THE ORANMORE AREA
Depth(mm)/Return Period 4l/s outflow 100 year return 7l/s outflow 100 year return 10l/s outflow 100 year return 15l/s outflow 100 year return
DURATION, 30 years 100 years inflow outflow Storage inflow outflow Storage inflow outflow Storage inflow outflow Storage5 5 mins, 9.7 12.6 134.82 1.2 133.62 134.82 2.1 132.72 134.82 3 131.82 134.82 4.5 130.32
10 10 mins, 13.6 17.5 187.25 2.4 184.85 187.25 4.2 183.05 187.25 6 181.25 187.25 9 178.2515 15 mins, 16 20.6 220.42 3.6 216.82 220.42 6.3 214.12 220.42 9 211.42 220.42 13.5 206.9230 30 mins 20.5 26.3 281.41 7.2 274.21 281.41 12.6 268.81 281.41 18 263.41 281.41 27 254.4160 1 hours 26.4 33.5 358.45 14.4 344.05 358.45 25.2 333.25 358.45 36 322.45 358.45 54 304.45
120 2 hours 34 42.8 457.96 28.8 429.16 457.96 50.4 407.56 457.96 72 385.96 457.96 108 349.96180 3 hours 39.4 49.4 528.58 43.2 485.38 528.58 75.6 452.98 528.58 108 420.58 528.58 162 366.58240 4 hours, 43.7 54.6 584.22 57.6 526.62 584.22 100.8 483.42 584.22 144 440.22 584.22 216 368.22360 6 hours, 50.7 63 674.1 86.4 587.7 674.1 151.2 522.9 674.1 216 458.1 674.1 324 350.1540 9 hours, 58.7 72.7 777.89 129.6 648.29 777.89 226.8 551.09 777.89 324 453.89 777.89 486 291.89720 12 hours, 65.2 80.5 861.35 172.8 688.55 861.35 302.4 558.95 861.35 432 429.35 861.35 648 213.35
1080 18 hours, 75.6 92.9 994.03 259.2 734.83 994.03 453.6 540.43 994.03 648 346.03 994.03 972 22.031440 24 hours 84 102.8 1099.96 345.6 754.36 1099.96 604.8 495.16 1099.96 864 235.96 1099.96 1296 -196.042880 2 days, 100.1 121 1294.7 691.2 603.5 1294.7 1209.6 85.1 1294.7 1728 -433.3 1294.7 2592 -1297.34320 3 days, 113.5 136.1 1456.27 1036.8 419.47 1456.27 1814.4 -358.13 1456.27 2592 -1135.73 1456.27 3888 -2431.735760 4 days, 125.4 149.5 1599.65 1382.4 217.25 1599.65 2419.2 -819.55 1599.65 3456 -1856.35 1599.65 5184 -3584.358640 6 days, 146.3 173.1 1852.17 2073.6 -221.43 1852.17 3628.8 -1776.63 1852.17 5184 -3331.83 1852.17 7776 -5923.83
11520 8 days, 164.9 194.1 2076.87 2764.8 -687.93 2076.87 4838.4 -2761.53 2076.87 6912 -4835.13 2076.87 10368 -8291.1314400 10 days, 182 213.3 2282.31 3456 -1173.69 2282.31 6048 -3765.69 2282.31 8640 -6357.69 2282.31 12960 -10677.717280 12 days, 198.1 231.3 2474.91 4147.2 -1672.29 2474.91 7257.6 -4782.69 2474.91 10368 -7893.09 2474.91 15552 -13077.123040 16 days, 227.9 264.6 2831.22 5529.6 -2698.38 2831.22 9676.8 -6845.58 2831.22 13824 -10992.8 2831.22 20736 -17904.828800 20 days, 255.6 295.5 3161.85 6912 -3750.15 3161.85 12096 -8934.15 3161.85 17280 -14118.2 3161.85 25920 -22758.236000 25 days 288 331.6 3548.12 8640 -5091.88 3548.12 15120 -11571.9 3548.12 21600 -18051.9 3548.12 32400 -28851.9
SITE AREA = 1.35 HA.AREA TO BE DRAINED = 1.07 Ha.
PDF created with pdfFactory Pro trial version www.pdffactory.com
For
insp
ectio
n pur
pose
s only
.
Conse
nt of
copy
right
owne
r req
uired
for a
ny ot
her u
se.
EPA Export 13-09-2016:01:55:05
STORAGE VOLUMES REQUIRED FOR 1 IN 30 YEAR EVENT FOR VARYING OUTFLOW RATES
INFLOW RATES DERIVED FROM MET EIREANN RETURN RAINFALL DEPTHS FOR SLIDING DURATIONS FOR THE ORANMORE AREA
4l/s outflow 30 year return 7l/s outflow 30 year return 10l/s outflow 30 year return 15l/s outflow 30 year returnReturn Period
DURATION, 30 years 100 years inflow outflow Storage inflow outflow Storage inflow outflow Storage inflow outflow Storage5 5 mins, 9.7 12.6 103.79 1.2 102.59 103.79 2.1 101.69 103.79 3 100.79 103.79 4.5 99.29
10 10 mins, 13.6 17.5 145.52 2.4 143.12 145.52 4.2 141.32 145.52 6 139.52 145.52 9 136.5215 15 mins, 16 20.6 171.2 3.6 167.6 171.2 6.3 164.9 171.2 9 162.2 171.2 13.5 157.730 30 mins 20.5 26.3 219.35 7.2 212.15 219.35 12.6 206.75 219.35 18 201.35 219.35 27 192.3560 1 hours 26.4 33.5 282.48 14.4 268.08 282.48 25.2 257.28 282.48 36 246.48 282.48 54 228.48
120 2 hours 34 42.8 363.8 28.8 335 363.8 50.4 313.4 363.8 72 291.8 363.8 108 255.8180 3 hours 39.4 49.4 421.58 43.2 378.38 421.58 75.6 345.98 421.58 108 313.58 421.58 162 259.58240 4 hours, 43.7 54.6 467.59 57.6 409.99 467.59 100.8 366.79 467.59 144 323.59 467.59 216 251.59360 6 hours, 50.7 63 542.49 86.4 456.09 542.49 151.2 391.29 542.49 216 326.49 542.49 324 218.49540 9 hours, 58.7 72.7 628.09 129.6 498.49 628.09 226.8 401.29 628.09 324 304.09 628.09 486 142.09720 12 hours, 65.2 80.5 697.64 172.8 524.84 697.64 302.4 395.24 697.64 432 265.64 697.64 648 49.64
1080 18 hours, 75.6 92.9 808.92 259.2 549.72 808.92 453.6 355.32 808.92 648 160.92 808.92 972 -163.081440 24 hours 84 102.8 898.8 345.6 553.2 898.8 604.8 294 898.8 864 34.8 898.8 1296 -397.22880 2 days, 100.1 121 1071.07 691.2 379.87 1071.07 1209.6 -138.53 1071.07 1728 -656.93 1071.07 2592 -1520.934320 3 days, 113.5 136.1 1214.45 1036.8 177.65 1214.45 1814.4 -599.95 1214.45 2592 -1377.55 1214.45 3888 -2673.555760 4 days, 125.4 149.5 1341.78 1382.4 -40.62 1341.78 2419.2 -1077.42 1341.78 3456 -2114.22 1341.78 5184 -3842.228640 6 days, 146.3 173.1 1565.41 2073.6 -508.19 1565.41 3628.8 -2063.39 1565.41 5184 -3618.59 1565.41 7776 -6210.59
11520 8 days, 164.9 194.1 1764.43 2764.8 -1000.37 1764.43 4838.4 -3073.97 1764.43 6912 -5147.57 1764.43 10368 -8603.5714400 10 days, 182 213.3 1947.4 3456 -1508.6 1947.4 6048 -4100.6 1947.4 8640 -6692.6 1947.4 12960 -11012.617280 12 days, 198.1 231.3 2119.67 4147.2 -2027.53 2119.67 7257.6 -5137.93 2119.67 10368 -8248.33 2119.67 15552 -13432.323040 16 days, 227.9 264.6 2438.53 5529.6 -3091.07 2438.53 9676.8 -7238.27 2438.53 13824 -11385.5 2438.53 20736 -18297.528800 20 days, 255.6 295.5 2734.92 6912 -4177.08 2734.92 12096 -9361.08 2734.92 17280 -14545.1 2734.92 25920 -23185.136000 25 days 288 331.6 3081.6 8640 -5558.4 3081.6 15120 -12038.4 3081.6 21600 -18518.4 3081.6 32400 -29318.4
SITE AREA = 1.35 HA.AREA TO BE DRAINED = 1.07 Ha.
PDF created with pdfFactory Pro trial version www.pdffactory.com
For
insp
ectio
n pur
pose
s only
.
Conse
nt of
copy
right
owne
r req
uired
for a
ny ot
her u
se.
EPA Export 13-09-2016:01:55:05

For
insp
ectio
n pur
pose
s only
.
Conse
nt of
copy
right
owne
r req
uired
for a
ny ot
her u
se.
EPA Export 13-09-2016:01:55:05