fostering innovation development – hong kong experience
DESCRIPTION
Fostering Innovation Development – Hong Kong Experience. E. Anthony Tan Chief Executive Officer Hong Kong Science and Technology Parks Corporation. 2012 Index of Economic Freedom. Global Ranking. - PowerPoint PPT PresentationTRANSCRIPT

Global Summit of Innovation Economy CreatorsApril 2012
Fostering Innovation Development– Hong Kong Experience
E. Anthony Tan
Chief Executive Officer
Hong Kong Science and
Technology Parks Corporation

2012 Index of Economic FreedomAn annual guide published by The Wall Street Journal and The Heritage Foundation, Washington's No. 1 think tank. Hong Kong’s economy: the FreestFreest in the world (with overall score: 89.9)
(Source: http://www.heritage.org/index/country/hongkong)
World
Rank
Country Overall
Score
Change from
Previous
11 Hong Kong Hong Kong 89.989.9 +0.2 +0.2
2 Singapore 87.7 +0.3
3 Australia 83.1 +0.6
4 New Zealand 82.1 -0.2
5 Switzerland 81.1 -0.8
Global RankingGlobal Ranking
(Source: http://www.heritage.org/index/country/hongkong)
Rule of LawRule of Law Limited GovernmentLimited Government
Property
Rights
90.0 Government
Spending
91.0
Freedom
from
Corruption
84.0 Fiscal
Freedom
93.1
Regulatory EfficiencyRegulatory Efficiency Open MarketsOpen Markets
Business
Freedom
98.9 Trade
Freedom
90.0
Labor
Freedom
86.5 Investment
Freedom
90.0
Monetary
Freedom
85.8 Financial
Freedom
90.0

The New Economic Order
The rise of the BRICS nations: Brazil, Russia, India, China, South Africa
Source: IMF Data & Statistics Sept. 2011 & CIA World Fact Book 2010
GD
P (
US
$ B
illio
n)
Source: IMF Data & Statistics Sept. 2011
BRICS: •population 2.94 billion(~1/3 world)•GDP US$13.6 trillion (~21% of World US$63.04 trillion)•Reserves US$4.4 trillion (~35% of WW)

China - Key Economic Regions
(Source: http://www.zpooo.com/info/)
Shenyang
Beijing
Tianjin
NanjingShanghai
HangzhouWuhanChengdu
Chongqing
GuangzhouShenzhenHong Kong
2009 GDP Comparison
0.94
0.53
0.23
0.88
0
1
Yangtze RiverDelta
Beijing-Tanjin-Hebei
Greater PRD Hong Kong
GD
P (
US
$ T
rillio
n)
2009 GDP Per Capita Comparison
9,4026,805
32,466
13,734
0
5,000
10,000
15,000
20,000
25,000
30,000
35,000
Yangtze RiverDelta
Beijing-Tanjin-Hebei
Greater PRD Hong Kong
GD
P P
er C
apita
(U
S$)

The Greater Pearl River Delta (PRD)
Over 42% of Hong Kong companies have R&D presence in PRD
(Source: http://www.info.gov.hk/info/gprd/pdf/F_GPRD_Overview.pdf)
Area: 42,824 kmArea: 42,824 km22
Population: 470 millionPopulation: 470 million(~94% of EU population)(~94% of EU population)
9 +2 (Hong Kong & Macao)9 +2 (Hong Kong & Macao)

Success Factors for Innovation Development
Market - China
As of 2012, China has the world's second-largest nominal GDP, totaling approximately 47.2 trillion yuan (US$7.48 trillion), with rising living standards.
Capital- Global Financial Centre
Hong Kong is an international financial center with a high degree of transparency and prudent regulatory enforcement.
Stock Exchange Market Capitalization (2011)
In 2011, total equity funds raised by HKEx was US$ 62.9billion, with 101 newly listed companies on the Main Board and GEM raising US$33.3 billion - ranking first globally for the third year in terms of funds raised by initial public offers (IPOs).
Talent - From Around the World
2008 recorded over 36,000 talents from overseas/Mainland to HK.
HKU/CUHK/HKUST: 3 leading research U rank top 40 of World University Ranking 2011 (QS Quacquarelli Symonds Limited). 4 HK Engineering Schools are top 100 of global ranking.
ExchangeExchange USD bn (End-2011)USD bn (End-2011)
1 NYSE Euronext (US) 11 796
2 NASDAQ OMX (US) 3 845
3 Tokyo Stock Exchange Group 3 325
4 London Stock Exchange Group 3 266
5 NYSE Euronext (Europe) 2 447
6 Shanghai Stock Exchange 2 357
7 Hong Kong Exchanges 2 258
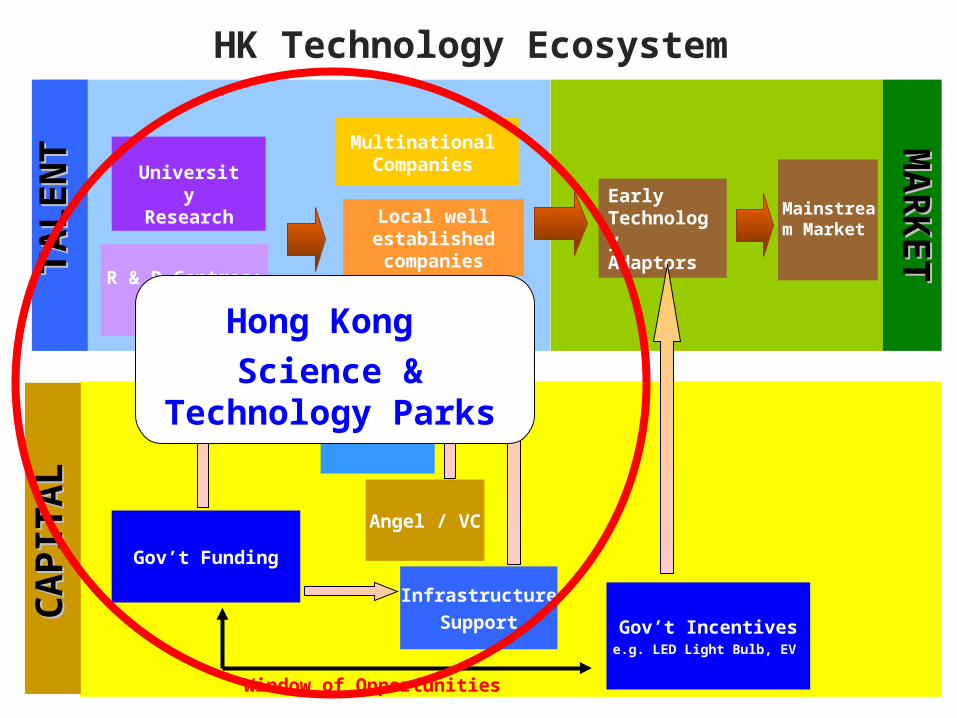
HK Technology Ecosystem
University Research
Local well established companies
Early Technology Adaptors
Mainstream Market
R & D Centres:
e.g ASTRI New Technology
Start-up
Incubation
Angel / VC
Infrastructure
Support
Gov’t Funding
Gov’t Incentivese.g. LED Light Bulb, EV
Multinational Companies
Window of Opportunities
TA
LE
NT
TA
LE
NT
CA
PIT
AL
CA
PIT
AL
MA
RK
ET
MA
RK
ET
Hong Kong
Science & Technology Parks
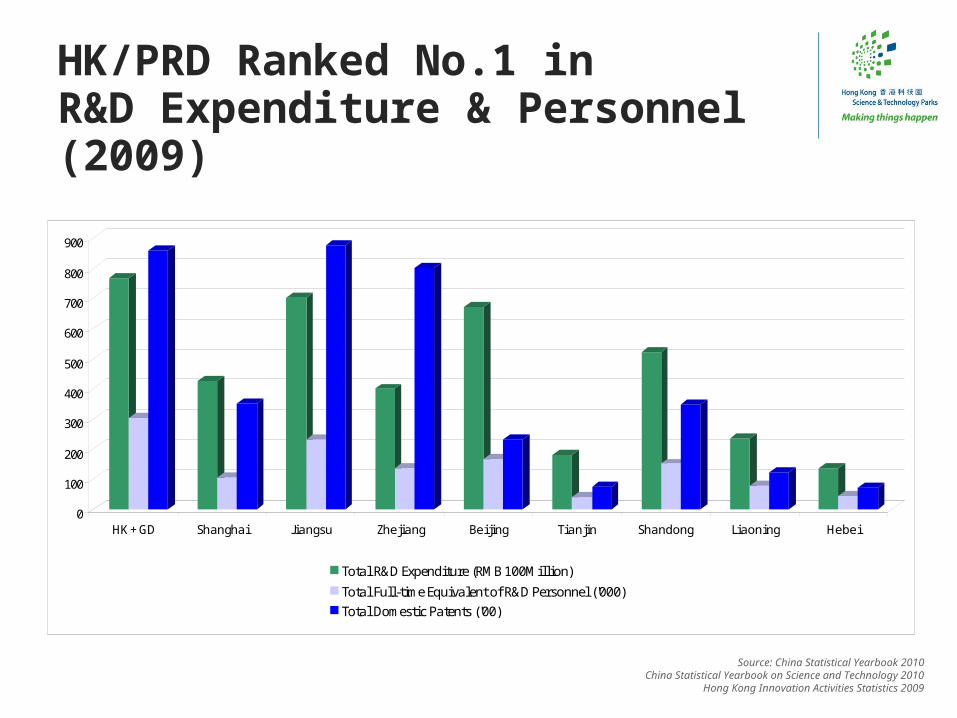
HK/PRD Ranked No.1 inR&D Expenditure & Personnel (2009)
0
100
200
300
400
500
600
700
800
900
HK + GD Shanghai Jiangsu Zhejiang Bei jing Tianjin Shandong Liaoning Hebei
Total R&D Expenditure (RMB 100Mill ion)
Total Full-time Equivalent of R&D Personnel ('000)Total Domestic Patents ('00)
Source: China Statistical Yearbook 2010China Statistical Yearbook on Science and Technology 2010
Hong Kong Innovation Activities Statistics 2009

Hong Kong Science & Technology Parks Corporation
Hong Kong Science Hong Kong Science ParkPark
InnoCentreInnoCentre
Industrial Industrial EstatesEstates

Phase 1 Phase 2 Phase 3 (Constructing)
Hong Kong Science Park (3-phase Development)
Phrase 1Information Communication
Technology
Phrase 2 Biotechnology
Phrase 3 Green Technology
Phase 3
Gross floor area: 105,000 sqm
Development Cost: US$0.6bn
Bldg occupation: End 2013- End 2015
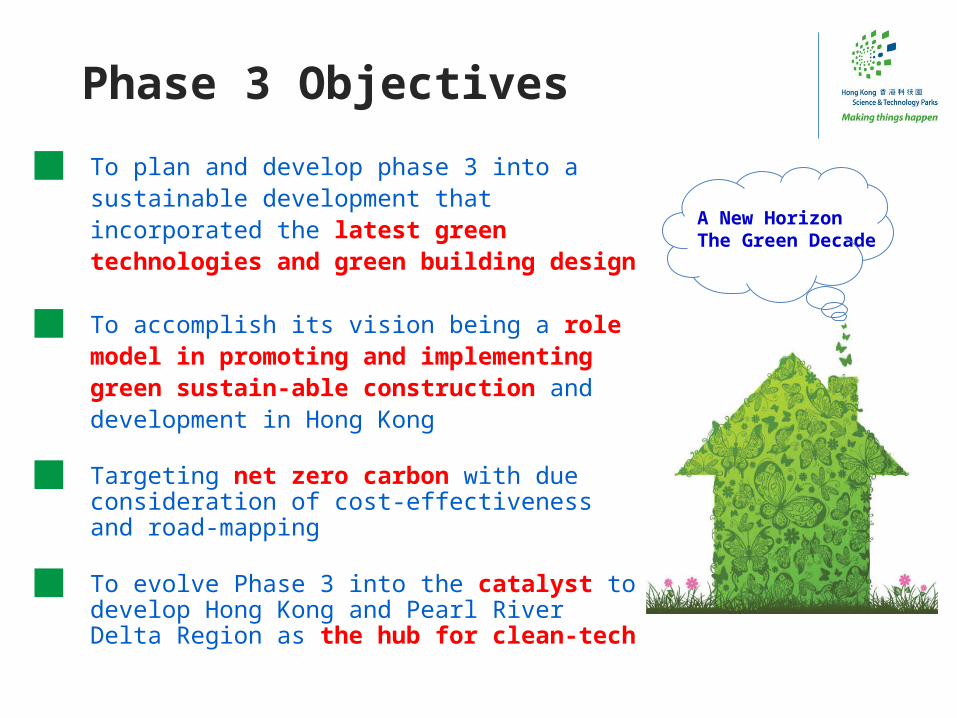
Phase 3 Objectives
To plan and develop phase 3 into a sustainable development that incorporated the latest green technologies and green building design
To accomplish its vision being a role model in promoting and implementing green sustain-able construction and development in Hong Kong
Targeting net zero carbon with due consideration of cost-effectiveness and road-mapping
To evolve Phase 3 into the catalyst to develop Hong Kong and Pearl River Delta Region as the hub for clean-tech
A New HorizonThe Green Decade

China’s Ambition in Green Technology
Improve Building Energy Saving
All new buildings are mandated to achieve
65% energy savings compared to the existing building stock
Energy and Environmental Taxes
New environmental tax plan which is likely to be levied on CO2 emissions and discharges of polluted water, has been submitted to the State Council for review
More Mandatory Green Targets
The 12th FYP maintained the existing four mandatory greentech targets while adding
6 new mandates, e.g. percentage of non-fossil fuel from primary energy consumption
Policies for Innovation Stepped Up
Strategic Emerging Industries which include new energy vehicles, energy efficiency and new energy (solar, wind and biomass) are identified to help advance economic development.
(Source: The China Greentech Report 2011)
The 12th Five Year Plan (2011-2016) further emphasises energy and environment development
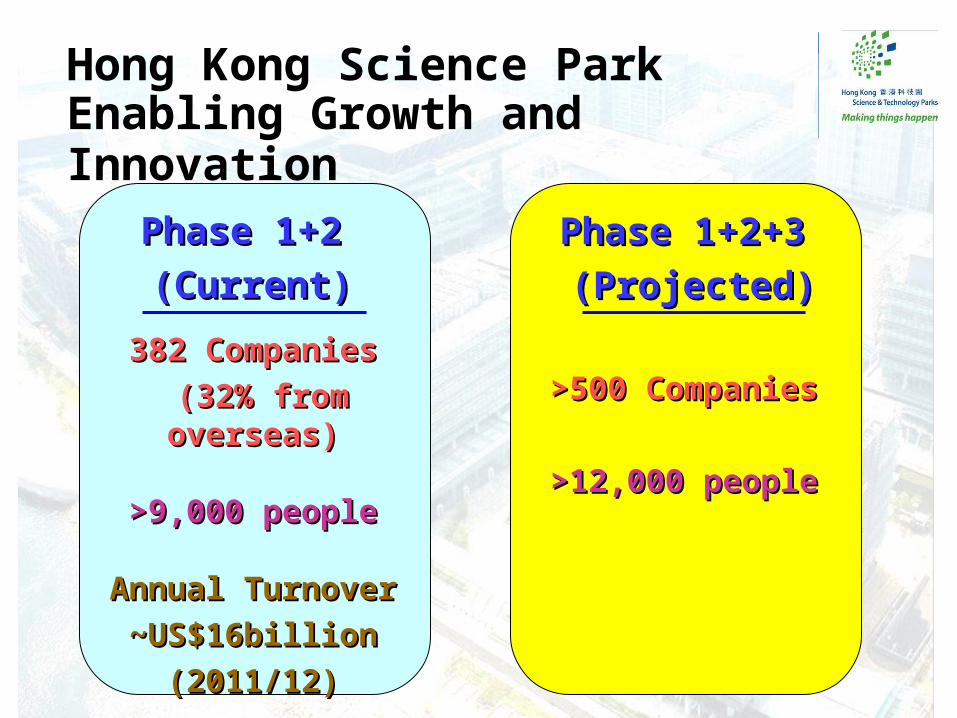
Hong Kong Science Park Enabling Growth and Innovation
Phase 1+2 Phase 1+2
(Current)(Current)
382 Companies382 Companies
(32% from overseas)(32% from overseas)
>9,000 people>9,000 people
Annual TurnoverAnnual Turnover
~US$16billion~US$16billion
(2011/12)(2011/12)
Phase 1+2+3 Phase 1+2+3
(Projected)(Projected)
>500 Companies>500 Companies
>12,000 people>12,000 people

Hong Kong
Inception of Hong Kong Inception of Hong Kong Science & Technology Parks Science & Technology Parks CorporationCorporation
HKSP now home to:HKSP now home to:382 companies382 companies>9,000 employees>9,000 employees
Russia Russia Innovation Innovation
DevelopmentDevelopment-a bright future-a bright future
