fossil fuel subsidies in thailand - asian … · fossil fuel subsidies in thailand: trends, ......
TRANSCRIPT
ASIAN DEVELOPMENT BANK
FOSSIL FuEL SuBSIDIES IN THAILANDTrENDS, IMPAcTS, AND rEFOrMS
AsiAn Development BAnk6 ADB Avenue, Mandaluyong City1550 Metro Manila, Philippineswww.adb.org
Fossil Fuel Subsidies in Thailand: Trends, Impacts, and reforms
Heavily dependent on imported energy sources, significant subsidies on fossil fuels present a heavy burden on public finances in Thailand. This study measures the size of fossil fuel subsidies such as tax breaks for diesel and natural gas, market price support for natural gas for vehicles, and free electricity for low-income consumers as well as the potential economic, energy, and environmental impacts of reducing them. With adequate reallocation of subsidy savings, the short-term adverse impacts of subsidy reform are shown to turn positive in the long term as households and industry respond to changing market realities by adjusting energy demand, supply, and production capacity. The study offers policy advice for sustainable energy use to help guide Thailand’s reform strategies.
About the Asian Development Bank
ADB’s vision is an Asia and Pacific region free of poverty. Its mission is to help its developing member countries reduce poverty and improve the quality of life of their people. Despite the region’s many successes, it remains home to the majority of the world’s poor. ADB is committed to reducing poverty through inclusive economic growth, environmentally sustainable growth, and regional integration.
Based in Manila, ADB is owned by 67 members, including 48 from the region. Its main instruments for helping its developing member countries are policy dialogue, loans, equity investments, guarantees, grants, and technical assistance.
Fossil Fuel subsidies in THAilAndTrends, impAcTs, And reForms
AsiAn deVelopmenT bAnK
Creative Commons Attribution 3.0 IGO license (CC BY 3.0 IGO)
© 2015 Asian Development Bank6 ADB Avenue, Mandaluyong City, 1550 Metro Manila, PhilippinesTel +63 2 632 4444; Fax +63 2 636 2444www.adb.org; openaccess.adb.org
Some rights reserved. Published in 2015. Printed in the Philippines.
ISBN 978-92-9257-153-5 (Print), 978-92-9257-154-2 (e-ISBN) Publication Stock No.RPT157695-2 Cataloging-In-Publication Data
Asian Development Bank. Fossil fuel subsidies in Thailand: trends, impacts, and reforms. Mandaluyong City, Philippines: Asian Development Bank, 2015.
1. Energy sector. 2. Fossil fuel subsidies. 3. Thailand. I. Asian Development Bank.
The views expressed in this publication are those of the authors and do not necessarily reflect the views and policies of the Asian Development Bank (ADB) or its Board of Governors or the governments they represent.
ADB does not guarantee the accuracy of the data included in this publication and accepts no responsibility for any consequence of their use. The mention of specific companies or products of manufacturers does not imply that they are endorsed or recommended by ADB in preference to others of a similar nature that are not mentioned.
By making any designation of or reference to a particular territory or geographic area, or by using the term “country” in this document, ADB does not intend to make any judgments as to the legal or other status of any territory or area.
This work is available under the Creative Commons Attribution 3.0 IGO license (CC BY 3.0 IGO) https://creativecommons.org/licenses/by/3.0/igo/. By using the content of this publication, you agree to be bound by the terms of said license as well as the Terms of Use of the ADB Open Access Repository at openaccess.adb.org/termsofuse
This CC license does not apply to non-ADB copyright materials in this publication. If the material is attributed to another source, please contact the copyright owner or publisher of that source for permission to reproduce it. ADB cannot be held liable for any claims that arise as a result of your use of the material.
Attribution—In acknowledging ADB as the source, please be sure to include all of the following information: Author. Year of publication. Title of the material. © Asian Development Bank [and/or Publisher].
https://openaccess.adb.org. Available under a CC BY 3.0 IGO license.
Translations—Any translations you create should carry the following disclaimer:Originally published by the Asian Development Bank in English under the title [title] © [Year of publication]
Asian Development Bank. All rights reserved. The quality of this translation and its coherence with the original text is the sole responsibility of the [translator]. The English original of this work is the only official version.
Adaptations—Any adaptations you create should carry the following disclaimer:This is an adaptation of an original Work © Asian Development Bank [Year]. The views expressed here are
those of the authors and do not necessarily reflect the views and policies of ADB or its Board of Governors or the governments they represent. ADB does not endorse this work or guarantee the accuracy of the data included in this publication and accepts no responsibility for any consequence of their use.
Please contact [email protected] or [email protected] if you have questions or comments with respect to content, or if you wish to obtain copyright permission for your intended use that does not fall within these terms, or for permission to use the ADB logo.
Note: In this publication, “$” refers to US dollars.“B” refers to Thai baht.Photos: All are ADB.
Tables, Figures, and boxes v
Foreword vi
Acknowledgments vii
Abbreviations viii
1 introduction 1
2 overview of the energy sector 3Resources and Market Structure 3Prices, Taxes, and Support Mechanisms 4
3 The size of Fuel subsidies and impact of Their reforms 7Estimating Subsidies 7Impacts of Fossil Fuel Subsidy Reform 10
On Government Finances 13On the Economy 13On Households 14On Businesses and Industry 17On the Energy Sector 17On the Environment 20
4 Fuel subsidy reforms and the need to protect the poor 21Recent Reform Initiatives 21Effects of Reforms on the Poor 22Policy Instruments Available 24
Effectiveness of Programs Associated with Fuel Subsidy Reform 24Broader Social Assistance Programs and Problems in Implementation 25Improving Social Assistance Programs for the Poor 26
5 summary of Findings 28
Contentsiv
Annexes1 Inventory of Subsidies for the Consumption of Fossil Fuels 302 Inventory of Subsidies for Natural Gas for Vehicles 323 Strengths and Weaknesses of Economics and Energy Models Used for the Analysis 334 Main Characteristics of the Reform Impact Models Used 345 Calculations to Adapt Recent-Year Subsidies to Social Accounting Matrices 356 Market Allocation Model Results 367 Major National Social Assistance Programs 38
list of background papers 40
references 41
Tables, Figures, and Boxes
Tables1 Comparison of Recent Consumer Fossil Fuel Subsidy Estimates 82 Scenarios of Removing Fossil Fuel Subsidies 113 Key Projected Macroeconomic Impacts 144 Reform Impacts on Real Household Consumption Based on SAM Model 155 Changes in Household Consumption and Poverty Incidence in CGE Analysis 166 Top 5 Sectors Impacted by Subsidy Removal in the CGE Analysis 177 Impacts of Subsidy Removal on Energy Consumption 188 Projected Medium- and Long-Term Impacts on Power Generation 209 Poverty, Subsidies, and Social Spending: Key Numbers 2110 Timeline of Recent Fossil Fuel Subsidy Reforms 2211 Programs to Target Energy Subsidies 25A5.1 Equivalent Fuel Subsidies, and Fuel Price Changes in FY2008 35A6.1 Projections for Energy Consumption by Sector and Energy Supply by Source 36A6.2 Projections for Power Capacity, Supply, and Cost 37
Figures1 Composition of Price Subsidies for LPG in Thailand 62 Major Fossil Fuel Subsidies to Producers and Consumers, FY 2012 103 Fossil Fuel Subsidies Compared to Other Expenditure and ODA, 2012 134 Final Energy Consumption Projections by Fuel 185 Final Energy Consumption Projections by Sector 196 Distribution of Average Monthly Household Energy Expenditure by Energy Type, 2011 237 Household LPG Consumption by Income Decile, 2011 24
Boxes1 The Oil Fund in Action: High-Speed Diesel 52 Direct and Indirect Subsidies to the Thai Power Sector 9
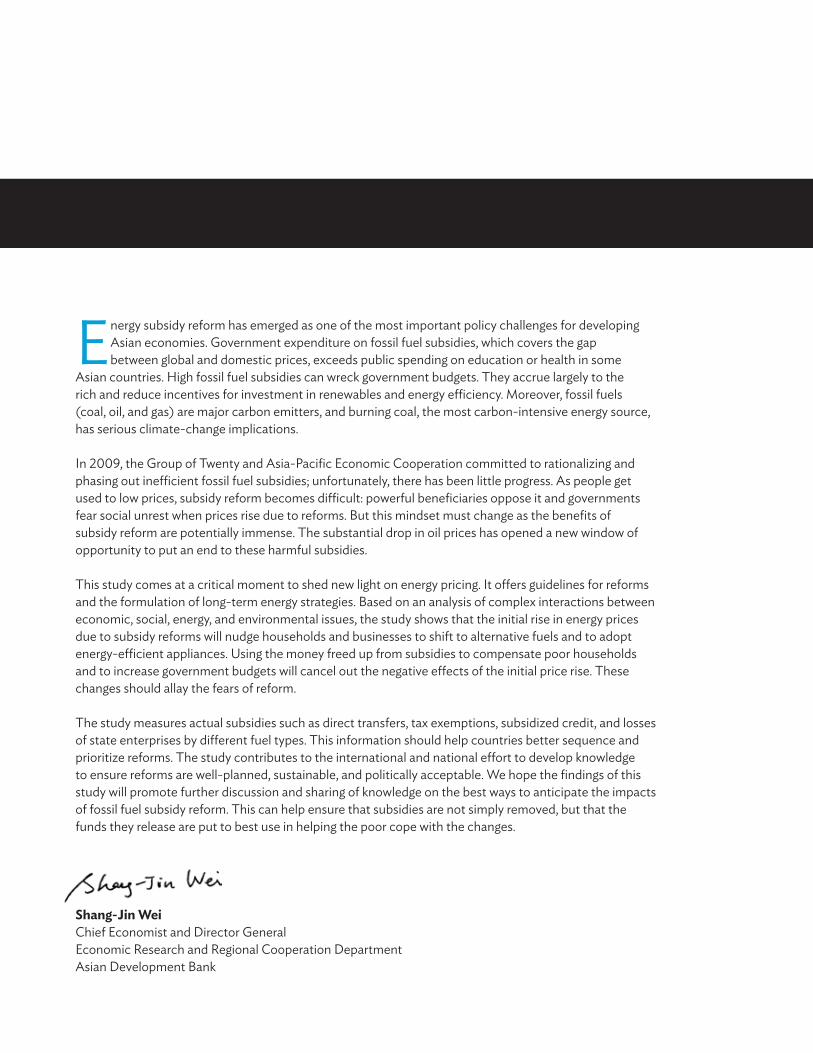
Energy subsidy reform has emerged as one of the most important policy challenges for developing Asian economies. Government expenditure on fossil fuel subsidies, which covers the gap between global and domestic prices, exceeds public spending on education or health in some
Asian countries. High fossil fuel subsidies can wreck government budgets. They accrue largely to the rich and reduce incentives for investment in renewables and energy efficiency. Moreover, fossil fuels (coal, oil, and gas) are major carbon emitters, and burning coal, the most carbon-intensive energy source, has serious climate-change implications.
In 2009, the Group of Twenty and Asia-Pacific Economic Cooperation committed to rationalizing and phasing out inefficient fossil fuel subsidies; unfortunately, there has been little progress. As people get used to low prices, subsidy reform becomes difficult: powerful beneficiaries oppose it and governments fear social unrest when prices rise due to reforms. But this mindset must change as the benefits of subsidy reform are potentially immense. The substantial drop in oil prices has opened a new window of opportunity to put an end to these harmful subsidies.
This study comes at a critical moment to shed new light on energy pricing. It offers guidelines for reforms and the formulation of long-term energy strategies. Based on an analysis of complex interactions between economic, social, energy, and environmental issues, the study shows that the initial rise in energy prices due to subsidy reforms will nudge households and businesses to shift to alternative fuels and to adopt energy-efficient appliances. Using the money freed up from subsidies to compensate poor households and to increase government budgets will cancel out the negative effects of the initial price rise. These changes should allay the fears of reform.
The study measures actual subsidies such as direct transfers, tax exemptions, subsidized credit, and losses of state enterprises by different fuel types. This information should help countries better sequence and prioritize reforms. The study contributes to the international and national effort to develop knowledge to ensure reforms are well-planned, sustainable, and politically acceptable. We hope the findings of this study will promote further discussion and sharing of knowledge on the best ways to anticipate the impacts of fossil fuel subsidy reform. This can help ensure that subsidies are not simply removed, but that the funds they release are put to best use in helping the poor cope with the changes.
Shang-Jin WeiChief Economist and Director GeneralEconomic Research and Regional Cooperation DepartmentAsian Development Bank
Acknowledgments
This project was led by Shikha Jha of the Asian Development Bank’s (ADB) Economic Research and Regional Cooperation Department. She prepared this publication with a team from the Global Subsidies Initiative of the International Institute for Sustainable Development (GSI) comprising Peter Wooders, Christopher Beaton, and Tara Laan of GSI; Andrea Bassi of KnowlEdge; and Kerryn Lang, formerly of GSI. This study draws on a report for ADB by GSI and related background material. Pilipinas Quising of the Economic Research and Regional Cooperation Department, supervised technical and research support and coordinated project administration.
This country case study draws on modeling exercises and background material prepared by Prinyarat Leangcharoen of Thailand Development Research Institute, Kridtiyaporn Wongsa of Chiang Mai University, Anan Wattanakuljarus of the National Institute of Development Administration, Jerome Hassler and Jan Kurbatsch of Bangkok University, Gary Goldstein and Shreekar Pradhan of DecisionWare Group, Les Taylor of Ecothai Consultants, Peter Warr of Australian National University, and Deb Chattopadhyay of the World Bank. David Coady of the International Monetary Fund and Stephen Howes of the Australian National University provided insightful comments on previous drafts as external peer reviewers and enriched the quality of the publication. Special thanks for detailed comments are due to Masami Kojima and Denis Medvedev of the World Bank, and James Docherty of the Overseas Development Institute. The publication also benefited from a discussion of its preliminary findings at international forums. In 2014, these were a mid-term project workshop in Indonesia and at the ADB Asia Clean Energy Forum in Manila; the Asia and the Pacific Policy Society Conference at Australian National University to inform Group of Twenty leaders, an event on the sidelines of the World Bank–International Monetary Fund fall meetings; and the International Atlantic Economic Society annual conference in Savannah, Georgia—and in 2015, at the International Energy Agency workshop on Fossil Fuel Subsidies Reform held in Indonesia.
Elenita Pura, with backing from Victoria Lacio and Emmanuel Alano, provided logistics support. Alastair McIndoe and Eric Van Zant did the manuscript editing, and layout and graphic design was by Edith Creus. The report would not have been possible without the cooperation of the Publishing Team of the Department of External Relations and the Logistics Management Unit of the Office of Administrative Services at ADB.
Abbreviations
ADB – Asian Development BankB – bahtBAU – business as usualCGE – computable general equilibriumCO2 – carbon dioxideEGAT – Electricity Generation Authority of ThailandFY – fiscal yearGDP – gross domestic productGSI – Global Subsidies InitiativeGW – gigawattIEA – International Energy Agency IISD – International Institute for Sustainable DevelopmentIMF – International Monetary FundkWh – kilowatt hourLNG – liquefied natural gas LPG – liquefied petroleum gasMARKAL – MARKet ALlocation NGV – natural gas for vehiclesOECD – Organisation for Economic Co-operation and DevelopmentPTT – PTT Public Company LimitedSAM – social accounting matrixVAT – value-added tax
NOTE
The fiscal year (FY) of the government ends on 20 September. FY before a calendar year denotes the year in which the fiscal year ends, e.g., FY2014 ends on 20 September 2014.
1 Introduction
Thailand depends heavily on natural gas and imported oil. Significant subsidies on fossil fuels and electricity—which in turn require subsidies on fuel for power generation to keep state-owned utilities financially viable—are a heavy burden on public finances. As such, energy price reforms
are being implemented in the country. As rising oil prices from the mid-2000s amid fuel subsidies threatened fiscal stability, the government capped diesel prices in mid-2008 to alleviate the impact of the rising prices. It reintroduced diesel subsidies in December 2010, committing to maintain diesel prices at around B30 per liter.
Recognizing the country’s overreliance on gas and oil, Thai policy makers have made a distinct move to promote alternative energy sources. Indeed, Thailand got early into the renewable energy space among the ASEAN-5 economies.1 In the wider region, Thailand has arguably achieved the most success in gas and electricity tariff reform, contributing to a steady flow of investment, which should provide some fiscal space. But it has had limited success removing oil subsidies, although sharply lower global oil prices in 2015 have eased the subsidy burden and helped the country recoup some of the costs incurred in years when they were high. It remains to be seen if Thailand will secure these gains and take steps to prevent subsidies from returning once world oil prices rise again.
Fossil fuel subsidies are a prominent feature of many Asian economies, including Thailand. These are categorized either as consumer subsidies—benefiting users such as transport and manufacturing industries and electricity generation—and producer subsidies, which lower costs for producers involved in the exploration, extraction, or processing of energy products. Subsidies contribute to fiscal imbalances in many countries and operating losses in utilities, in addition to other unintended negative consequences. They restrict public expenditure on development priorities such as education, health, and infrastructure; are inefficient for supporting low-income households; and encourage excessive consumption through low energy prices, increasing air pollution, and greenhouse gas emissions. The need to reform fossil fuel subsidies has increasingly been recognized, with international and national commitments to phase out inefficient subsidies.
The objective of this study is to systematically assess the prevalence of different types of fossil fuel subsidies in Thailand and analyze the potential impacts of their removal. It is hoped that this will provide detailed inputs for the ongoing efforts to reform the subsidies.
1 ASEAN-5 refers to the five Association of Southeast Asian Nations (ASEAN) member states of Indonesia, Malaysia, the Philippines, Singapore, and Thailand
Fossil Fuel Subsidies in Thailand: Trends, Impacts, and Reforms2
The following section provides an overview of the energy sector in Thailand. Section 3 presents new, estimates of fossil fuel subsidies. These go beyond the standard method of calculating the gap between a reference or cost price and final consumer price to an approach that allows quantification of a subsidy at different stages of price formation from primary resources to final consumption. Section 3 also presents the economic, energy, and environmental impacts of reforming fossil fuel subsidies. Section 4 discusses the need for shielding the poor against the potential rise in energy prices, and Section 5 presents a summary of the findings.
Overview of the Energy Sector 2
The 15-year Renewable Energy Development Plan launched in 2008 encouraged the use of renewable energy. Since then, Thailand’s energy policy has sought mainly to maintain energy prices; intensify energy development, including alternative energies to achieve and secure
adequate energy supply; push for energy efficiency and preservation in the household, industry, and transportation sectors; and encourage environmentally friendly energy procurement and consumption. Policy changes in Thailand’s energy diversification strategy are designed to have an impact on the energy mix, leaning toward coal and renewables. By 2030, it aims to increase coal to 36 million tons of oil equivalent of primary energy and stabilize gas consumption.
resources and market structure
Of Thailand’s domestic energy resources—coal, crude oil, and natural gas—the latter is most abundant, supplying about 70% of the country’s natural gas needs (PTT 2012). Domestically produced coal is mostly lignite, used primarily for electricity generation. Coal is also imported for use by electricity generators and industry. About 20% of crude-oil needs are produced domestically. Oil is refined domestically and Thailand is a net exporter of petroleum products (Energy Policy and Planning Office 2013a). The country’s oil and natural gas reserves are limited, however. The estimated reserves-to-production ratio is 3.5 years for oil and 12.5 years for natural gas. Lignite reserves are larger, with a ratio of 100 years (BP 2012).2 Thailand is increasingly relying on natural gas to generate electricity, with natural-gas-fired electricity in 2014 accounting for about two-thirds of total electricity generated by the Electricity Generating Authority of Thailand (EGAT; the state electricity generator and market operator), far ahead of coal/lignite, at about one-fifth (Energy Policy and Planning Office 2013b).
As a net energy importer, over 60% of Thailand’s energy consumption comes from imports. Discovery of oil and gas is an ongoing process, but domestic demand for energy has also grown, leaving little overall change in import dependency (Asian Institute of Technology 2010). Alongside the surge in world oil prices during the past decade, this increase in consumption pushed the cost of net energy imports to 1.2 trillion Thai baht (B) in 2011 or 11% of gross domestic product (GDP) (Energy Policy and Planning Office n.d.).3
Natural gas is the most widely consumed fuel in Thailand, at 45% of total commercial energy consumption (primarily for electricity generation), followed by petroleum products (36%), coal (12%), lignite (5%), and hydroelectricity (3%) (Energy Policy and Planning Office 2013a). Biofuels and solid
2 The reserves-to-production ratio is the time that known reserves will last at forecast consumption levels. 3 All baht–dollar conversions are made at B31.06 per $1.00.
Fossil Fuel Subsidies in Thailand: Trends, Impacts, and Reforms4
biomass are also important components.4 Electrification is high, at 100% in urban and 99% in rural areas.
Thailand’s energy industry has both public and private sector entities. The government owns 66.4% of the national oil and gas company, PTT Public Company (PTT), with a 51.1% outright stake and 15.3% through the government-supported equity fund Vayupak (Standard and Poor’s Rating Services 2013). PTT produces the majority of domestically produced oil. The oil sector is open to foreign involvement, although foreign companies often work in joint ventures with PTT. The company, likewise, has a stake in some natural gas production, although foreign companies dominate (US Energy Information Administration 2013). PTT has a monopoly on natural gas distribution. Electricity is largely produced by the 100% government-owned EGAT, which also has a monopoly on electricity distribution. Independent power producers are involved in generation. The Energy Policy and Planning Office (within the Ministry of Energy) oversees all aspects of energy policies, including the oil, natural gas, and power sectors.
prices, Taxes, and support mechanisms
Thailand subsidizes consumption of petroleum and natural gas products through the Oil Stabilization Fund (an oil price fund), tax exemptions, and caps on ex-refinery and retail prices. It caps retail prices for diesel, liquefied petroleum gas (LPG), and natural gas for vehicles (NGV),5 and subsidizes biofuel blends. For diesel and NGV, price subsidies are universal in that wealthy and poor consumers alike can access them. LPG prices vary depending on the consuming sector, and electricity prices are subsidized for low-consuming households.
The oil fund is a monetary reserve that acts as a means of reducing price volatility and for cross-subsidization (Box 1). Levies are imposed on fuels. Subsidies may be provided on a per-liter basis or as lump sum to fuel producers or distributors. Over the years, the oil fund has been used to (i) reduce price spikes; (ii) cross-subsidize fuels for economic, political, or social reasons; and (iii) encourage greater use of domestically produced energy resources. Gasoline, kerosene, and fuel oil are the petroleum products that most often face oil fund levies. The fuels most often subsidized are higher biofuel blends and LPG. Oil fund levies and subsidies are adjusted weekly, and it is not unusual for a levy to be applied one week and a subsidy the next to keep retail prices stable. This is particularly true of automotive diesel, which the government has committed to maintain at about B30 per liter since late 2010. In theory, the oil fund is revenue neutral. In practice it has required injections of government funds during periods of prolonged deficits (most recently in 2004) and borrowings from commercial banks to allow ongoing deficits (most recently in 2012) (Leangcharoen, Thampanishvong, and Laan 2013).
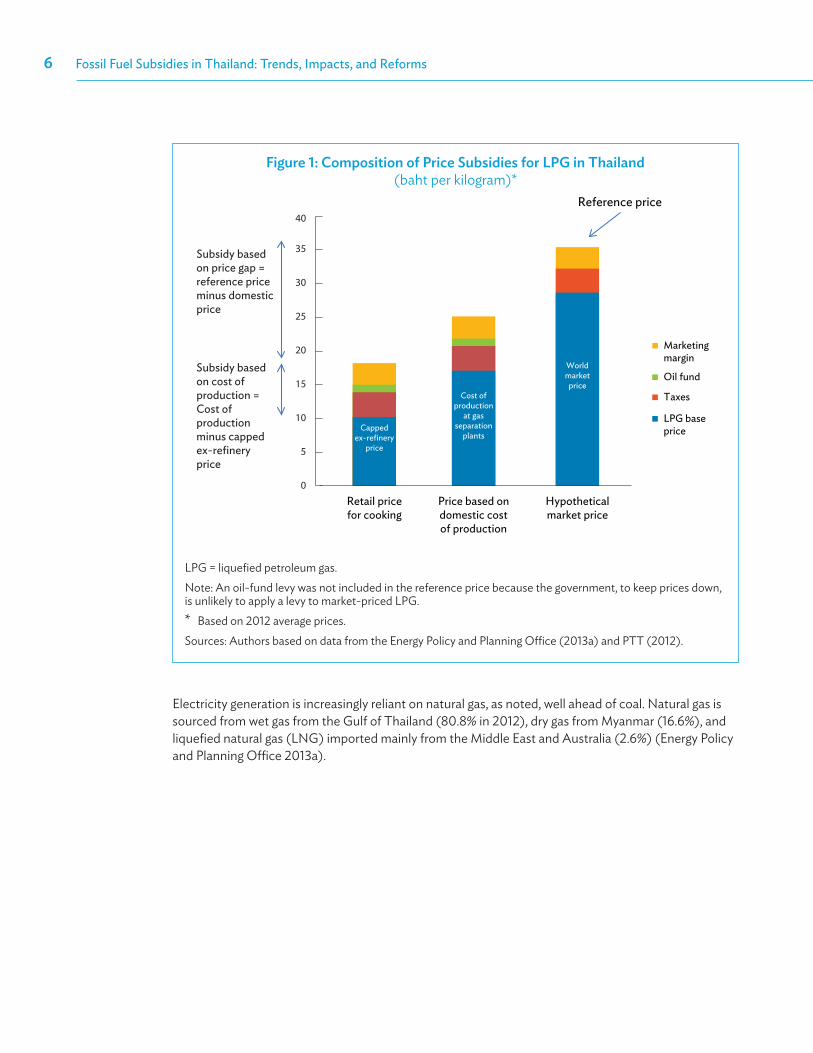
The LPG pricing mechanism is complex. The ex-refinery price has been capped at $333 per ton since 2009, significantly lower than the world price. Retail prices are also capped for all sectors except the petrochemicals industry. Oil-fund levies are applied to the cooking, transport sector, and
4 Most biomass feedstock is from sugarcane, rice husk, bagasse, wood waste, and oil palm residue, and is used in the residential and manufacturing sectors.
5 In Thailand, the abbreviation NGV refers to natural gas vehicles and natural gas for vehicles, which is more commonly referred to as compressed natural gas. Given that this study is also intended for a Thai audience, the Thai acronym is used.
Overview of the Energy Sector 5
industry sectors. Lump-sum transfers are made from the oil fund to LPG producers and importers to compensate for the capped ex-refinery price. Domestic producers of LPG are only compensated for the difference between the cost of production and the ex-refinery price. They are not compensated for the opportunity cost of selling LPG domestically rather than at the higher international price (Figure 1).
The NGV price is largely composed of the base natural gas price and an allowance for NGV infrastructure (transportation and delivery costs plus capital expenses such as NGV service stations). The retail price of NGV is fixed at B10.50 per kilogram, below the cost of production. PTT has sustained significant losses in its NGV operations, which have been only partially compensated by transfers from the oil fund, with subsidized NGV, as noted, available to all consumers. As a preliminary step to targeting the NGV subsidy, the Ministry of Energy, in collaboration with PTT, launched an Energy Credit Card Program in 2011. In addition, the government used an excise tax exemption in May 2006 to support installation of NGV equipment in passenger cars and vans. Import taxes were reduced for equipment and parts for NGV refueling and vehicles. In addition, there is an excise exemption on methane gas itself as a part of the pricing regime to keep NGV prices low.
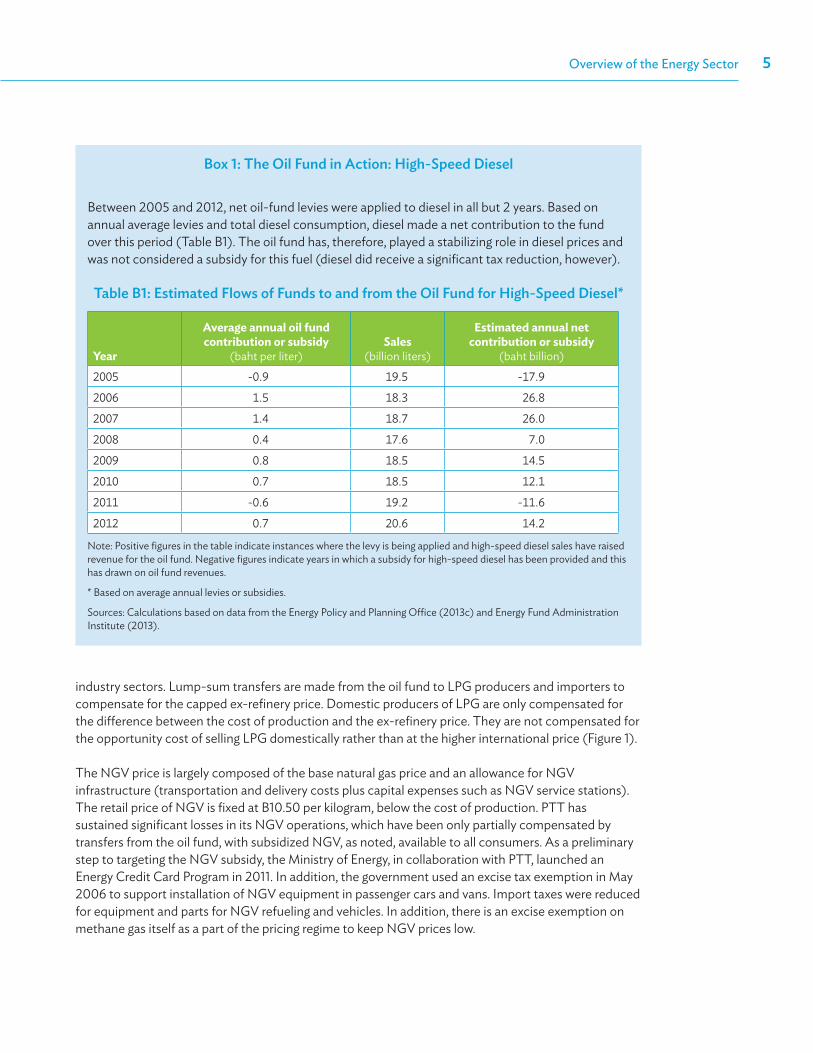
box 1: The oil Fund in Action: High-speed diesel
Between 2005 and 2012, net oil-fund levies were applied to diesel in all but 2 years. Based on annual average levies and total diesel consumption, diesel made a net contribution to the fund over this period (Table B1). The oil fund has, therefore, played a stabilizing role in diesel prices and was not considered a subsidy for this fuel (diesel did receive a significant tax reduction, however).
Table b1: estimated Flows of Funds to and from the oil Fund for High-speed diesel*
Year
Average annual oil fund contribution or subsidy
(baht per liter)Sales
(billion liters)
Estimated annual net contribution or subsidy
(baht billion)
2005 -0.9 19.5 -17.9
2006 1.5 18.3 26.8
2007 1.4 18.7 26.0
2008 0.4 17.6 7.0
2009 0.8 18.5 14.5
2010 0.7 18.5 12.1
2011 -0.6 19.2 -11.6
2012 0.7 20.6 14.2
Note: Positive figures in the table indicate instances where the levy is being applied and high-speed diesel sales have raised revenue for the oil fund. Negative figures indicate years in which a subsidy for high-speed diesel has been provided and this has drawn on oil fund revenues.
* Based on average annual levies or subsidies.
Sources: Calculations based on data from the Energy Policy and Planning Office (2013c) and Energy Fund Administration Institute (2013).
Fossil Fuel Subsidies in Thailand: Trends, Impacts, and Reforms6
Electricity generation is increasingly reliant on natural gas, as noted, well ahead of coal. Natural gas is sourced from wet gas from the Gulf of Thailand (80.8% in 2012), dry gas from Myanmar (16.6%), and liquefied natural gas (LNG) imported mainly from the Middle East and Australia (2.6%) (Energy Policy and Planning Office 2013a).
Figure 1: composition of price subsidies for lpG in Thailand (baht per kilogram)*
Reference price
Subsidy based on price gap = reference price minus domestic price
Subsidy based on cost of production = Cost of production minus capped ex-refinery price
Cost of production
at gas separation
plants
World market price
Capped ex-refinery
price
Hypothetical market price
Price based on domestic cost of production
Retail price for cooking
Marketingmargin
Oil fund
Taxes
LPG baseprice
40
35
30
25
20
15
10
5
0
LPG = liquefied petroleum gas.Note: An oil-fund levy was not included in the reference price because the government, to keep prices down, is unlikely to apply a levy to market-priced LPG.* Based on 2012 average prices.Sources: Authors based on data from the Energy Policy and Planning Office (2013a) and PTT (2012).
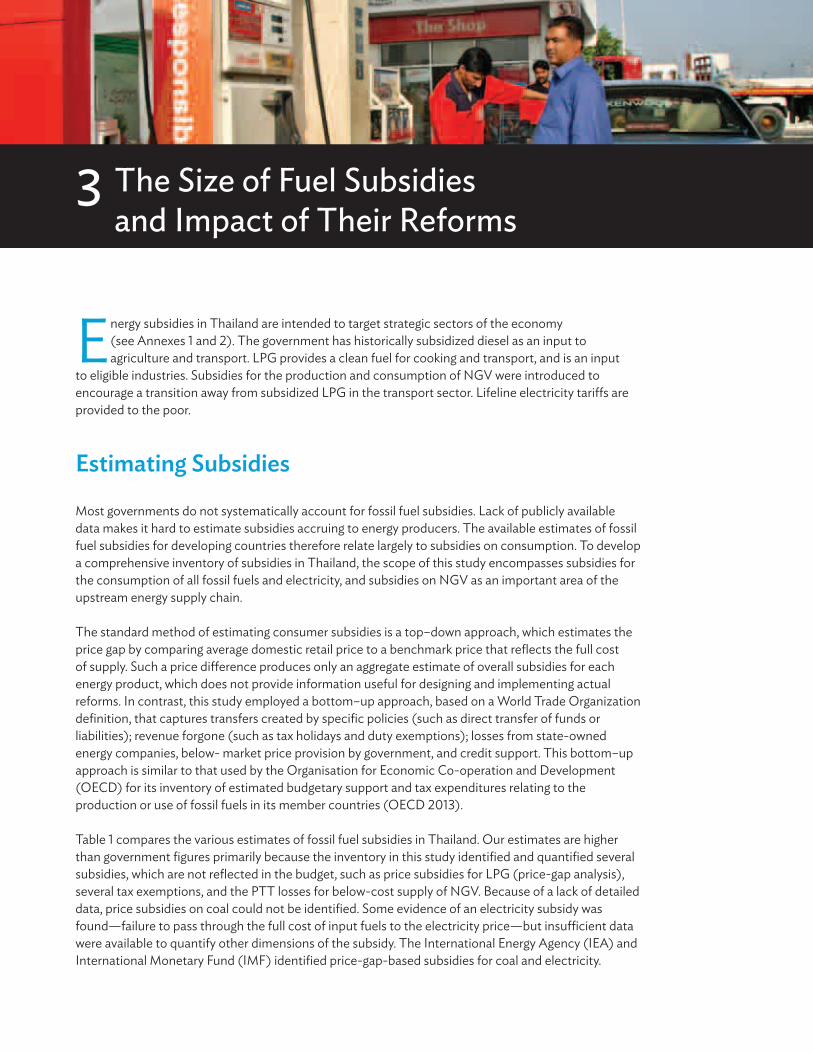
The Size of Fuel Subsidies and Impact of Their Reforms
3
Energy subsidies in Thailand are intended to target strategic sectors of the economy (see Annexes 1 and 2). The government has historically subsidized diesel as an input to agriculture and transport. LPG provides a clean fuel for cooking and transport, and is an input
to eligible industries. Subsidies for the production and consumption of NGV were introduced to encourage a transition away from subsidized LPG in the transport sector. Lifeline electricity tariffs are provided to the poor.
estimating subsidies
Most governments do not systematically account for fossil fuel subsidies. Lack of publicly available data makes it hard to estimate subsidies accruing to energy producers. The available estimates of fossil fuel subsidies for developing countries therefore relate largely to subsidies on consumption. To develop a comprehensive inventory of subsidies in Thailand, the scope of this study encompasses subsidies for the consumption of all fossil fuels and electricity, and subsidies on NGV as an important area of the upstream energy supply chain.
The standard method of estimating consumer subsidies is a top–down approach, which estimates the price gap by comparing average domestic retail price to a benchmark price that reflects the full cost of supply. Such a price difference produces only an aggregate estimate of overall subsidies for each energy product, which does not provide information useful for designing and implementing actual reforms. In contrast, this study employed a bottom–up approach, based on a World Trade Organization definition, that captures transfers created by specific policies (such as direct transfer of funds or liabilities); revenue forgone (such as tax holidays and duty exemptions); losses from state-owned energy companies, below- market price provision by government, and credit support. This bottom–up approach is similar to that used by the Organisation for Economic Co-operation and Development (OECD) for its inventory of estimated budgetary support and tax expenditures relating to the production or use of fossil fuels in its member countries (OECD 2013).
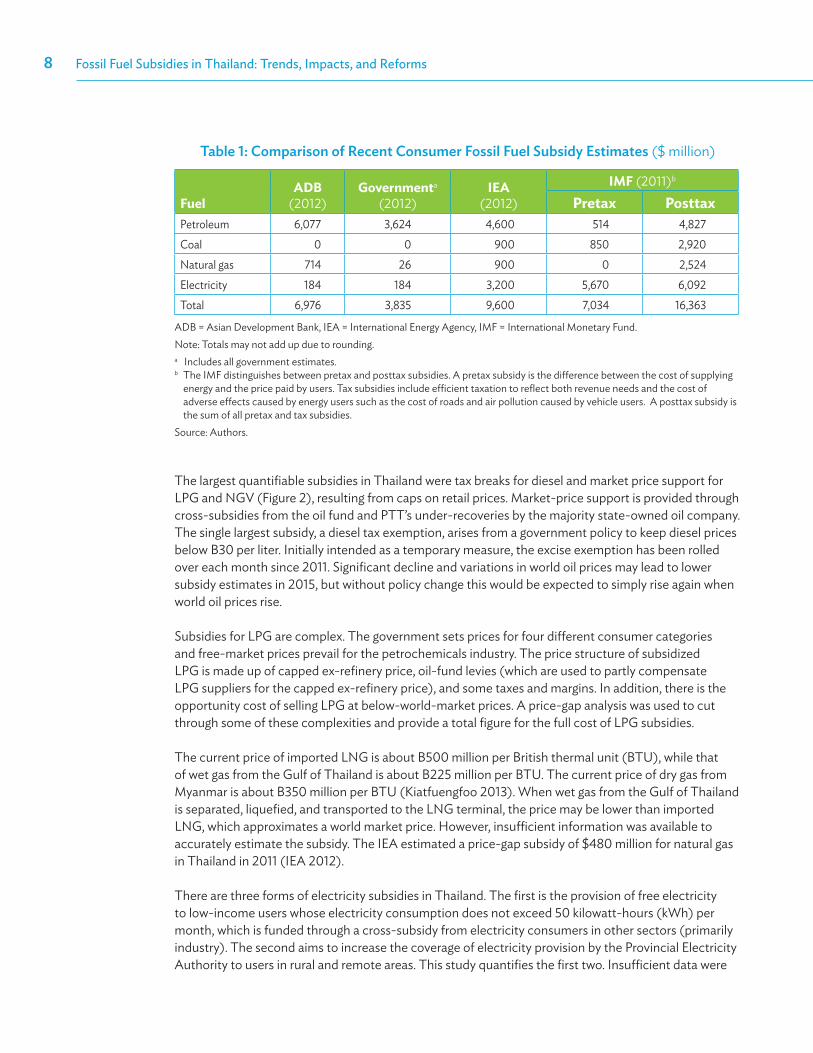
Table 1 compares the various estimates of fossil fuel subsidies in Thailand. Our estimates are higher than government figures primarily because the inventory in this study identified and quantified several subsidies, which are not reflected in the budget, such as price subsidies for LPG (price-gap analysis), several tax exemptions, and the PTT losses for below-cost supply of NGV. Because of a lack of detailed data, price subsidies on coal could not be identified. Some evidence of an electricity subsidy was found—failure to pass through the full cost of input fuels to the electricity price—but insufficient data were available to quantify other dimensions of the subsidy. The International Energy Agency (IEA) and International Monetary Fund (IMF) identified price-gap-based subsidies for coal and electricity.
Fossil Fuel Subsidies in Thailand: Trends, Impacts, and Reforms8
Table 1: comparison of recent consumer Fossil Fuel subsidy estimates ($ million)
FuelADB
(2012)Governmenta
(2012)IEA
(2012)IMF (2011)b
Pretax PosttaxPetroleum 6,077 3,624 4,600 514 4,827Coal 0 0 900 850 2,920Natural gas 714 26 900 0 2,524Electricity 184 184 3,200 5,670 6,092Total 6,976 3,835 9,600 7,034 16,363
ADB = Asian Development Bank, IEA = International Energy Agency, IMF = International Monetary Fund.Note: Totals may not add up due to rounding.a Includes all government estimates. b The IMF distinguishes between pretax and posttax subsidies. A pretax subsidy is the difference between the cost of supplying
energy and the price paid by users. Tax subsidies include efficient taxation to reflect both revenue needs and the cost of adverse effects caused by energy users such as the cost of roads and air pollution caused by vehicle users. A posttax subsidy is the sum of all pretax and tax subsidies.
Source: Authors.
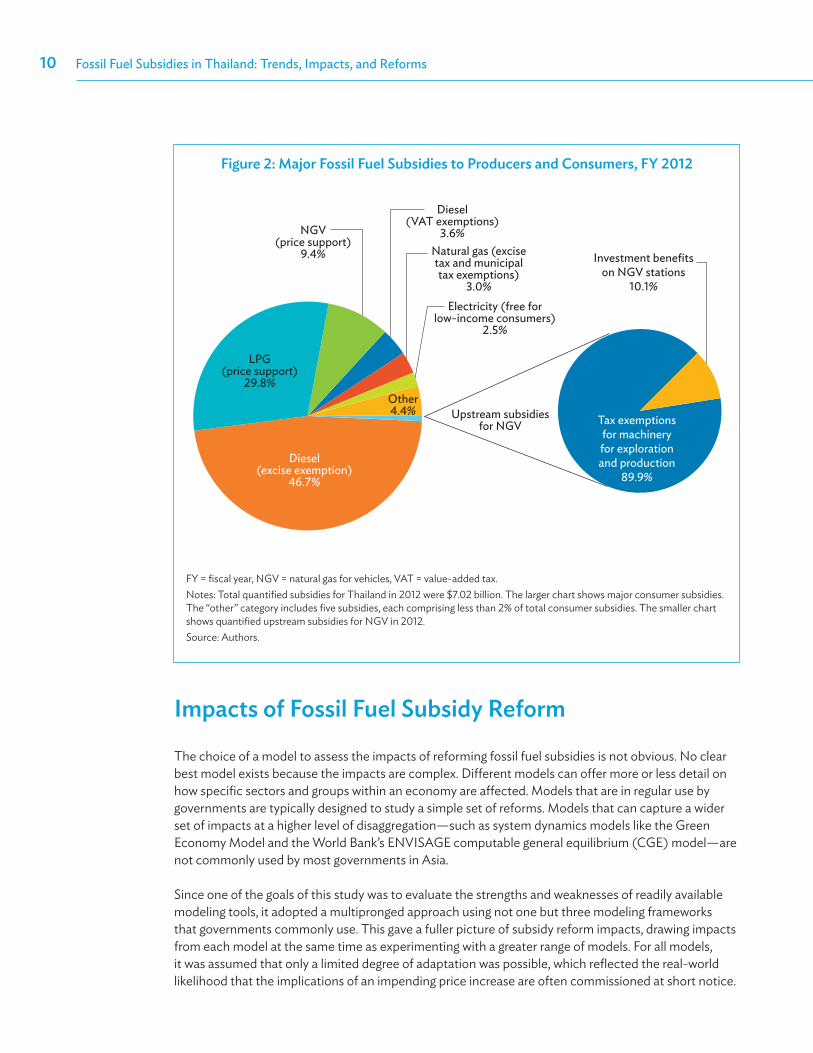
The largest quantifiable subsidies in Thailand were tax breaks for diesel and market price support for LPG and NGV (Figure 2), resulting from caps on retail prices. Market-price support is provided through cross-subsidies from the oil fund and PTT’s under-recoveries by the majority state-owned oil company. The single largest subsidy, a diesel tax exemption, arises from a government policy to keep diesel prices below B30 per liter. Initially intended as a temporary measure, the excise exemption has been rolled over each month since 2011. Significant decline and variations in world oil prices may lead to lower subsidy estimates in 2015, but without policy change this would be expected to simply rise again when world oil prices rise.
Subsidies for LPG are complex. The government sets prices for four different consumer categories and free-market prices prevail for the petrochemicals industry. The price structure of subsidized LPG is made up of capped ex-refinery price, oil-fund levies (which are used to partly compensate LPG suppliers for the capped ex-refinery price), and some taxes and margins. In addition, there is the opportunity cost of selling LPG at below-world-market prices. A price-gap analysis was used to cut through some of these complexities and provide a total figure for the full cost of LPG subsidies.
The current price of imported LNG is about B500 million per British thermal unit (BTU), while that of wet gas from the Gulf of Thailand is about B225 million per BTU. The current price of dry gas from Myanmar is about B350 million per BTU (Kiatfuengfoo 2013). When wet gas from the Gulf of Thailand is separated, liquefied, and transported to the LNG terminal, the price may be lower than imported LNG, which approximates a world market price. However, insufficient information was available to accurately estimate the subsidy. The IEA estimated a price-gap subsidy of $480 million for natural gas in Thailand in 2011 (IEA 2012).
There are three forms of electricity subsidies in Thailand. The first is the provision of free electricity to low-income users whose electricity consumption does not exceed 50 kilowatt-hours (kWh) per month, which is funded through a cross-subsidy from electricity consumers in other sectors (primarily industry). The second aims to increase the coverage of electricity provision by the Provincial Electricity Authority to users in rural and remote areas. This study quantifies the first two. Insufficient data were
The Size of Fuel Subsidies and Impact of Their Reforms 9
available to quantify the third, which results from undercharging for fuel input costs in the price buildup of electricity (Ruangrong 2012a), but it is likely to be significant. The IEA estimated a price-gap subsidy of $5.57 billion for electricity in Thailand in 2011 (IEA 2012). Subsidies on other energy types also influence the power sector (Box 2).
Consumer subsidies for NGV are primarily a loss for PTT due to selling below cost. In addition, several upstream and midstream subsidies reduce the cost of supply, including tax reductions for activities related to capital expenditure on exploration, LNG terminals, pipelines, and service stations.
Almost all NGV producers’ subsidies identified are in the form of tax breaks (Figure 2). These include exemptions on import duties for machinery and equipment employed in NGV production activities, such as exploration and production of petroleum, transmission and distribution, gas separation plants, and NGV service stations.
box 2: direct and indirect subsidies to the Thai power sectorTwo interrelated subsidy issues influence the power sector: the requirement to supply free electricity to households consuming less than 50 kilowatt-hours (kWh) per month and the requirement that state-owned Electricity Generating Authority of Thailand (EGAT) must carry its losses whenever retail prices fall short of cost. Subsidized gas and lignite are also provided to EGAT for power generation to keep it financially viable. The authority gets other subsidies on fuel for power generation for several of its long-term contracts, especially for gas. These commercial contracts are confidential and so cannot be assessed accurately. Although the total subsidy has gone up between 2011 and 2012, the electricity subsidy has actually declined drastically as the threshold for the lifeline tariff has been lowered from 90 kWh per month to 50 kWh (Ruangrong 2012a).
Direct and indirect subsidies for power generation and consumption have quite a significant impact on power generation investment. Coal-based generation has generally lagged other countries because natural gas has largely been subsidized for EGAT. However, the tariff subsidy on the one hand and the significant cost of purchase from the independent power producers on the other has limited EGAT’s financial freedom to build new capacity. This in turn has meant the share of independent power producers in the power market has grown over the years, adding to EGAT’s significant accumulated deficit.
Thailand’s tariff policy centers on a base tariff and a fuel adjustment charge. But adjustments to the fuel tariff are not automatically aligned with changes in fuel and purchased electricity prices, and EGAT needs to apply to the energy regulator for a change in tariff that reflects its costs. The regulator has discretion to grant increases or decreases, taking into account EGAT’s costs, among other things. A consequence of subsidizing the gas price for EGAT has been that the energy regulator had to ask EGAT to absorb $280 million in 2012 because the fuel tariff was lower than the actual costs of fuel and purchased electricity (Ruangrong 2012a).
The renewable policy introduced in recent years and feed-in tariffs for various technology classes that effectively represent subsidies provided to renewable energy providers have also contributed to the financial difficulties of EGAT. The solar and wind feed-in tariffs, in particular, were very significant; and, in just 18 months, more than 5,000 megawatts of solar and wind projects were in various stages of development.
Source: Chattopadhyay (2014).
Fossil Fuel Subsidies in Thailand: Trends, Impacts, and Reforms10
impacts of Fossil Fuel subsidy reform
The choice of a model to assess the impacts of reforming fossil fuel subsidies is not obvious. No clear best model exists because the impacts are complex. Different models can offer more or less detail on how specific sectors and groups within an economy are affected. Models that are in regular use by governments are typically designed to study a simple set of reforms. Models that can capture a wider set of impacts at a higher level of disaggregation—such as system dynamics models like the Green Economy Model and the World Bank’s ENVISAGE computable general equilibrium (CGE) model—are not commonly used by most governments in Asia.
Since one of the goals of this study was to evaluate the strengths and weaknesses of readily available modeling tools, it adopted a multipronged approach using not one but three modeling frameworks that governments commonly use. This gave a fuller picture of subsidy reform impacts, drawing impacts from each model at the same time as experimenting with a greater range of models. For all models, it was assumed that only a limited degree of adaptation was possible, which reflected the real-world likelihood that the implications of an impending price increase are often commissioned at short notice.
Figure 2: major Fossil Fuel subsidies to producers and consumers, FY 2012
Investment benefits on NGV stations
10.1%
Diesel(VAT exemptions)
3.6%Natural gas (excise tax and municipal tax exemptions)
3.0%Electricity (free for
low-income consumers) 2.5%
NGV(price support)
9.4%
Other4.4%
LPG(price support)
29.8%
Diesel(excise exemption)
46.7%
Upstream subsidies for NGV Tax exemptions
for machinery for exploration and production
89.9%
FY = fiscal year, NGV = natural gas for vehicles, VAT = value-added tax.Notes: Total quantified subsidies for Thailand in 2012 were $7.02 billion. The larger chart shows major consumer subsidies. The “other” category includes five subsidies, each comprising less than 2% of total consumer subsidies. The smaller chart shows quantified upstream subsidies for NGV in 2012.Source: Authors.
The Size of Fuel Subsidies and Impact of Their Reforms 11
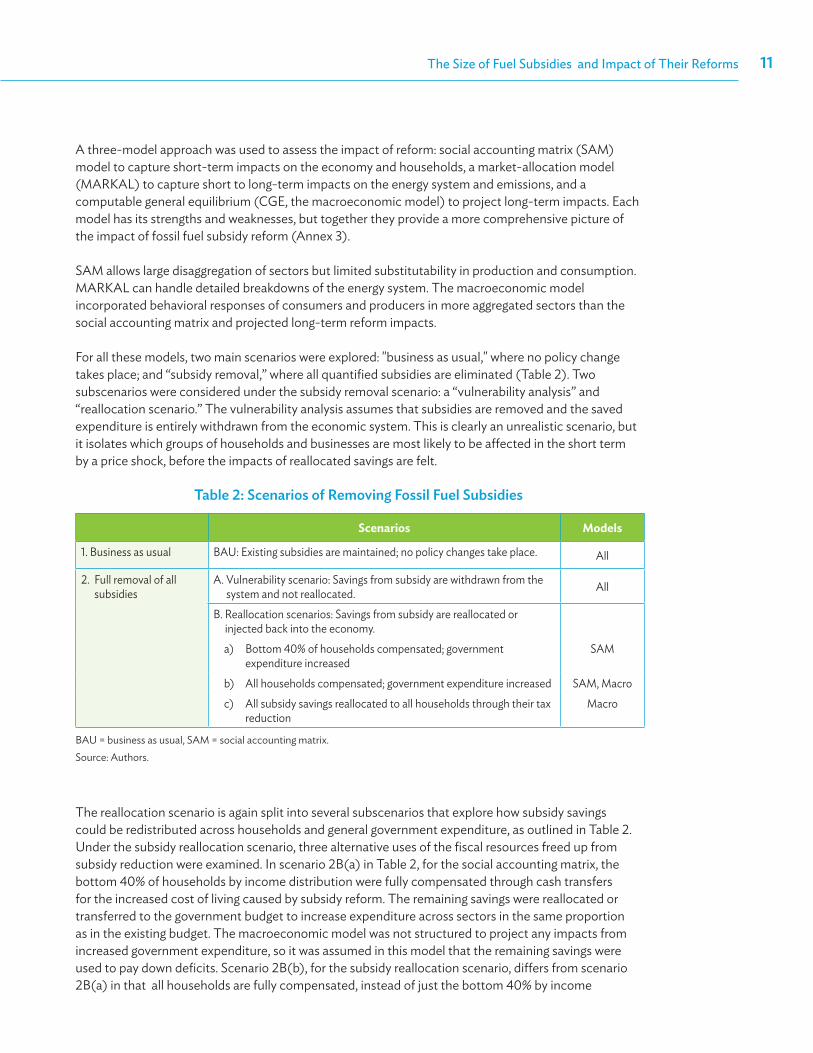
A three-model approach was used to assess the impact of reform: social accounting matrix (SAM) model to capture short-term impacts on the economy and households, a market-allocation model (MARKAL) to capture short to long-term impacts on the energy system and emissions, and a computable general equilibrium (CGE, the macroeconomic model) to project long-term impacts. Each model has its strengths and weaknesses, but together they provide a more comprehensive picture of the impact of fossil fuel subsidy reform (Annex 3).
SAM allows large disaggregation of sectors but limited substitutability in production and consumption. MARKAL can handle detailed breakdowns of the energy system. The macroeconomic model incorporated behavioral responses of consumers and producers in more aggregated sectors than the social accounting matrix and projected long-term reform impacts.
For all these models, two main scenarios were explored: "business as usual," where no policy change takes place; and “subsidy removal,” where all quantified subsidies are eliminated (Table 2). Two subscenarios were considered under the subsidy removal scenario: a “vulnerability analysis” and “reallocation scenario.” The vulnerability analysis assumes that subsidies are removed and the saved expenditure is entirely withdrawn from the economic system. This is clearly an unrealistic scenario, but it isolates which groups of households and businesses are most likely to be affected in the short term by a price shock, before the impacts of reallocated savings are felt.
Table 2: scenarios of removing Fossil Fuel subsidies
Scenarios Models
1. Business as usual BAU: Existing subsidies are maintained; no policy changes take place. All
2. Full removal of all subsidies
A. Vulnerability scenario: Savings from subsidy are withdrawn from the system and not reallocated. All
B. Reallocation scenarios: Savings from subsidy are reallocated or injected back into the economy.a) Bottom 40% of households compensated; government
expenditure increasedSAM
b) All households compensated; government expenditure increased SAM, Macroc) All subsidy savings reallocated to all households through their tax
reductionMacro
BAU = business as usual, SAM = social accounting matrix.Source: Authors.
The reallocation scenario is again split into several subscenarios that explore how subsidy savings could be redistributed across households and general government expenditure, as outlined in Table 2. Under the subsidy reallocation scenario, three alternative uses of the fiscal resources freed up from subsidy reduction were examined. In scenario 2B(a) in Table 2, for the social accounting matrix, the bottom 40% of households by income distribution were fully compensated through cash transfers for the increased cost of living caused by subsidy reform. The remaining savings were reallocated or transferred to the government budget to increase expenditure across sectors in the same proportion as in the existing budget. The macroeconomic model was not structured to project any impacts from increased government expenditure, so it was assumed in this model that the remaining savings were used to pay down deficits. Scenario 2B(b), for the subsidy reallocation scenario, differs from scenario 2B(a) in that all households are fully compensated, instead of just the bottom 40% by income
Fossil Fuel Subsidies in Thailand: Trends, Impacts, and Reforms12
distribution. The third scenario 2B(c), for the subsidy reallocation scenario, is the same as scenario 2B(b) except that instead of increasing the government budget, all subsidy savings are reallocated back to households in the form of lower tax. This scenario was conducted for the macroeconomic model only. Due to the different structures of the various models, not every subscenario could be explored by each model.
These scenarios were intended to identify vulnerable groups and potential impacts on households, the economy, and the environment once all fossil fuel subsidies were eliminated and the saved funds reallocated. Assumptions about future economic and social trends were based on outlooks for economic growth, population, and energy prices.
The future baseline growth of GDP was based on projections in the IMF’s World Economic Outlook, national development plans, and economic growth expectations. Population projections are based on the United Nations Department of Economic and Social Affairs using medium-variant estimates. Assumptions on the projected growth of fossil fuel prices are based on the IEA’s World Energy Outlook 2012 and Current Policies Scenario. For Thailand, assumptions used in projections include: GDP growth (4.6%), population growth (0.086% average), and fossil fuel growth (2.2% average).
Assumptions were also made about the nature of subsidies to simplify the analysis: all subsidies were taken to be “on budget” and, as such, subsidy reform was assumed to increase government budgets6 by the amount of the quantified subsidies.7 It was also assumed that consumers paid official prices before reforms took place. In reality, however, some consumers may pay higher prices, because the diversion of subsidized fuels constrains supply. This kind of complex relationship was not captured in the models. Changes to the supply of energy after reform were not taken into account in the macroeconomic projections. Annex 4 summarizes the main characteristics of the models and scenarios used to assess the impacts of the removal of energy subsidies.
All impacts are measured as a percentage change from scenario 1 (business as usual). Generally, the removal of large consumer subsidies for widely used energy sources can be expected to have a significant impact across areas as varied as government finances, the economy, consuming sectors (households, businesses, and industry), energy supply, the environment, and governance.
The following subsections present the impacts estimated from the models. The results were highly dependent on model assumptions and methodologies. Both the social accounting matrix and macroeconomic models concluded that reallocating a greater proportion of savings to households would deliver more positive results than allocating a greater proportion to government budgets. These results are due to structural assumptions in these models on the important role played by wealthier households in stimulating economic demand, and the relative effectiveness of household expenditure in stimulating economic growth, compared to government expenditure or debt reduction. In particular, the structure of the macroeconomic model included no relationship between increasing government expenditure or reducing debt and impacts on GDP or welfare.
6 In reality, some subsidies would not be fully returned to the government budget, such as losses by state-owned energy companies or opportunity costs. Market-based pricing would benefit government budgets by removing the need to compensate for such losses or under-recoveries and by dividends flowing from profit-making entities. But these benefits might not equal the size of the original losses or opportunity costs, as state-owned companies would be expected to keep some returns to reinvest. For partially privatized state-owned enterprises, profits would be distributed to other shareholders.
7 To model the impacts of reform, the value of subsidies was converted to the baseline year (see Annex 5).
The Size of Fuel Subsidies and Impact of Their Reforms 13
Figure 3: Fossil Fuel subsidies compared to other expenditure and odA, 2012
Fossil fuel subsidies
Fossil fuel subsidies
Total ODA from all donors
% G
DP
Government spending on
education
Government expenditure
on health
Overall deficit
$ billion
1.9
7.9
3.0 2.3
7.00.5
GDP = gross domestic project, ODA = official development assistance.Sources: ADB, Statistical Database System; OECD, International Development Statistics; World Bank, Data.
On Government Finances
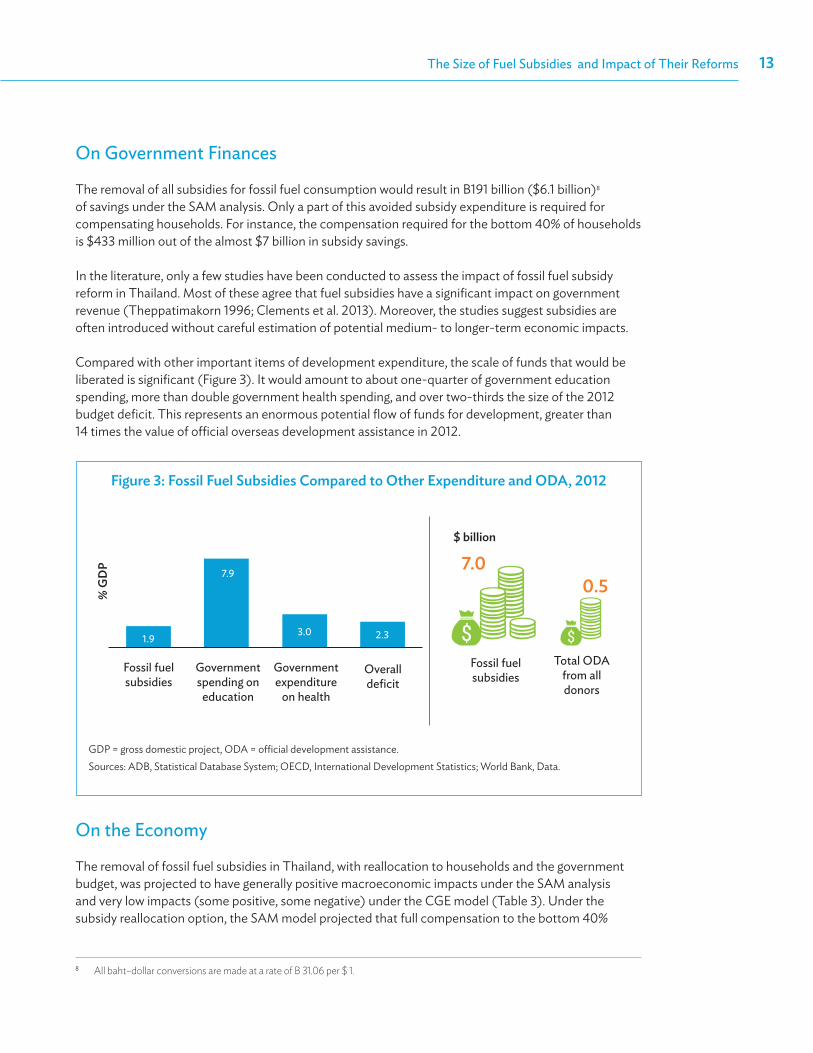
The removal of all subsidies for fossil fuel consumption would result in B191 billion ($6.1 billion)8 of savings under the SAM analysis. Only a part of this avoided subsidy expenditure is required for compensating households. For instance, the compensation required for the bottom 40% of households is $433 million out of the almost $7 billion in subsidy savings.
In the literature, only a few studies have been conducted to assess the impact of fossil fuel subsidy reform in Thailand. Most of these agree that fuel subsidies have a significant impact on government revenue (Theppatimakorn 1996; Clements et al. 2013). Moreover, the studies suggest subsidies are often introduced without careful estimation of potential medium- to longer-term economic impacts.
Compared with other important items of development expenditure, the scale of funds that would be liberated is significant (Figure 3). It would amount to about one-quarter of government education spending, more than double government health spending, and over two-thirds the size of the 2012 budget deficit. This represents an enormous potential flow of funds for development, greater than 14 times the value of official overseas development assistance in 2012.
On the Economy
The removal of fossil fuel subsidies in Thailand, with reallocation to households and the government budget, was projected to have generally positive macroeconomic impacts under the SAM analysis and very low impacts (some positive, some negative) under the CGE model (Table 3). Under the subsidy reallocation option, the SAM model projected that full compensation to the bottom 40%
8 All baht–dollar conversions are made at a rate of B 31.06 per $ 1.
Fossil Fuel Subsidies in Thailand: Trends, Impacts, and Reforms14
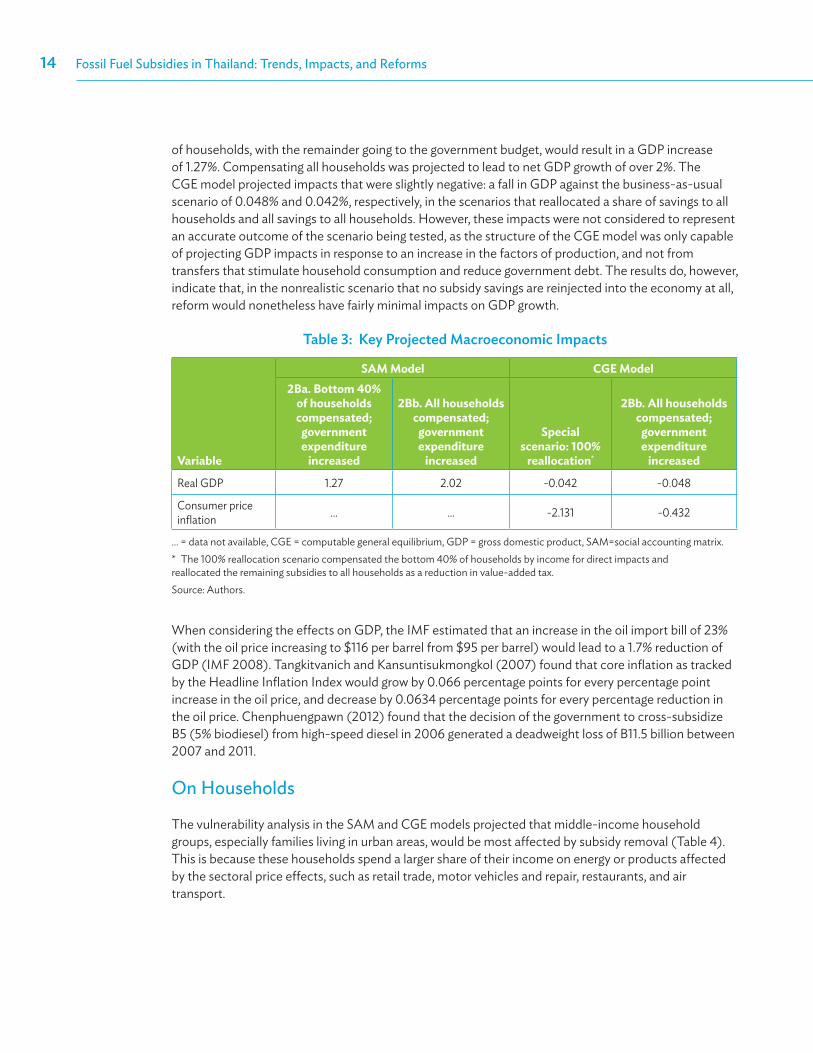
of households, with the remainder going to the government budget, would result in a GDP increase of 1.27%. Compensating all households was projected to lead to net GDP growth of over 2%. The CGE model projected impacts that were slightly negative: a fall in GDP against the business-as-usual scenario of 0.048% and 0.042%, respectively, in the scenarios that reallocated a share of savings to all households and all savings to all households. However, these impacts were not considered to represent an accurate outcome of the scenario being tested, as the structure of the CGE model was only capable of projecting GDP impacts in response to an increase in the factors of production, and not from transfers that stimulate household consumption and reduce government debt. The results do, however, indicate that, in the nonrealistic scenario that no subsidy savings are reinjected into the economy at all, reform would nonetheless have fairly minimal impacts on GDP growth.
Table 3: Key projected macroeconomic impacts
Variable
SAM Model CGE Model2Ba. Bottom 40%
of households compensated;
government expenditure
increased
2Bb. All households compensated;
government expenditure
increased
Special scenario: 100%
reallocation*
2Bb. All households compensated;
government expenditure
increased
Real GDP 1.27 2.02 -0.042 -0.048
Consumer price inflation … ... -2.131 -0.432
… = data not available, CGE = computable general equilibrium, GDP = gross domestic product, SAM=social accounting matrix.* The 100% reallocation scenario compensated the bottom 40% of households by income for direct impacts and reallocated the remaining subsidies to all households as a reduction in value-added tax. Source: Authors.
When considering the effects on GDP, the IMF estimated that an increase in the oil import bill of 23% (with the oil price increasing to $116 per barrel from $95 per barrel) would lead to a 1.7% reduction of GDP (IMF 2008). Tangkitvanich and Kansuntisukmongkol (2007) found that core inflation as tracked by the Headline Inflation Index would grow by 0.066 percentage points for every percentage point increase in the oil price, and decrease by 0.0634 percentage points for every percentage reduction in the oil price. Chenphuengpawn (2012) found that the decision of the government to cross-subsidize B5 (5% biodiesel) from high-speed diesel in 2006 generated a deadweight loss of B11.5 billion between 2007 and 2011.
On Households
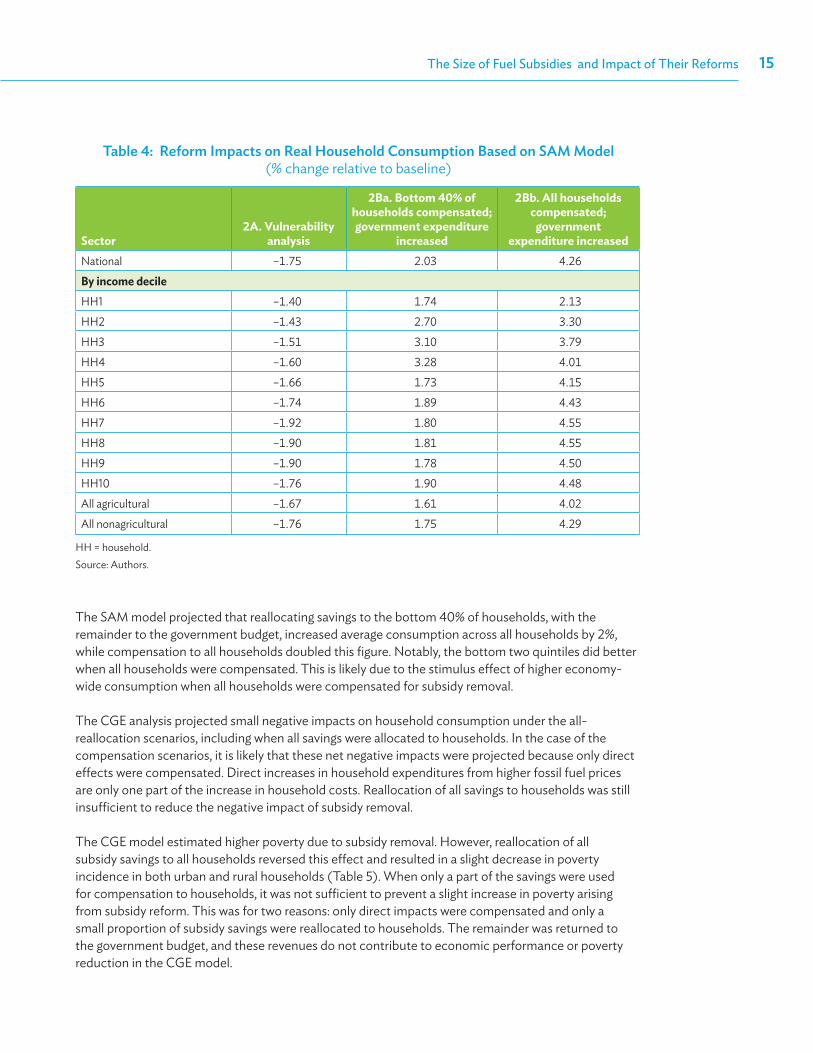
The vulnerability analysis in the SAM and CGE models projected that middle-income household groups, especially families living in urban areas, would be most affected by subsidy removal (Table 4). This is because these households spend a larger share of their income on energy or products affected by the sectoral price effects, such as retail trade, motor vehicles and repair, restaurants, and air transport.
The Size of Fuel Subsidies and Impact of Their Reforms 15
Table 4: reform impacts on real Household consumption based on sAm model (% change relative to baseline)
Sector2A. Vulnerability
analysis
2Ba. Bottom 40% of households compensated; government expenditure
increased
2Bb. All households compensated;
government expenditure increased
National –1.75 2.03 4.26By income decileHH1 –1.40 1.74 2.13HH2 –1.43 2.70 3.30HH3 –1.51 3.10 3.79HH4 –1.60 3.28 4.01HH5 –1.66 1.73 4.15HH6 –1.74 1.89 4.43HH7 –1.92 1.80 4.55HH8 –1.90 1.81 4.55HH9 –1.90 1.78 4.50HH10 –1.76 1.90 4.48All agricultural –1.67 1.61 4.02All nonagricultural –1.76 1.75 4.29
HH = household.Source: Authors.
The SAM model projected that reallocating savings to the bottom 40% of households, with the remainder to the government budget, increased average consumption across all households by 2%, while compensation to all households doubled this figure. Notably, the bottom two quintiles did better when all households were compensated. This is likely due to the stimulus effect of higher economy-wide consumption when all households were compensated for subsidy removal.
The CGE analysis projected small negative impacts on household consumption under the all-reallocation scenarios, including when all savings were allocated to households. In the case of the compensation scenarios, it is likely that these net negative impacts were projected because only direct effects were compensated. Direct increases in household expenditures from higher fossil fuel prices are only one part of the increase in household costs. Reallocation of all savings to households was still insufficient to reduce the negative impact of subsidy removal.
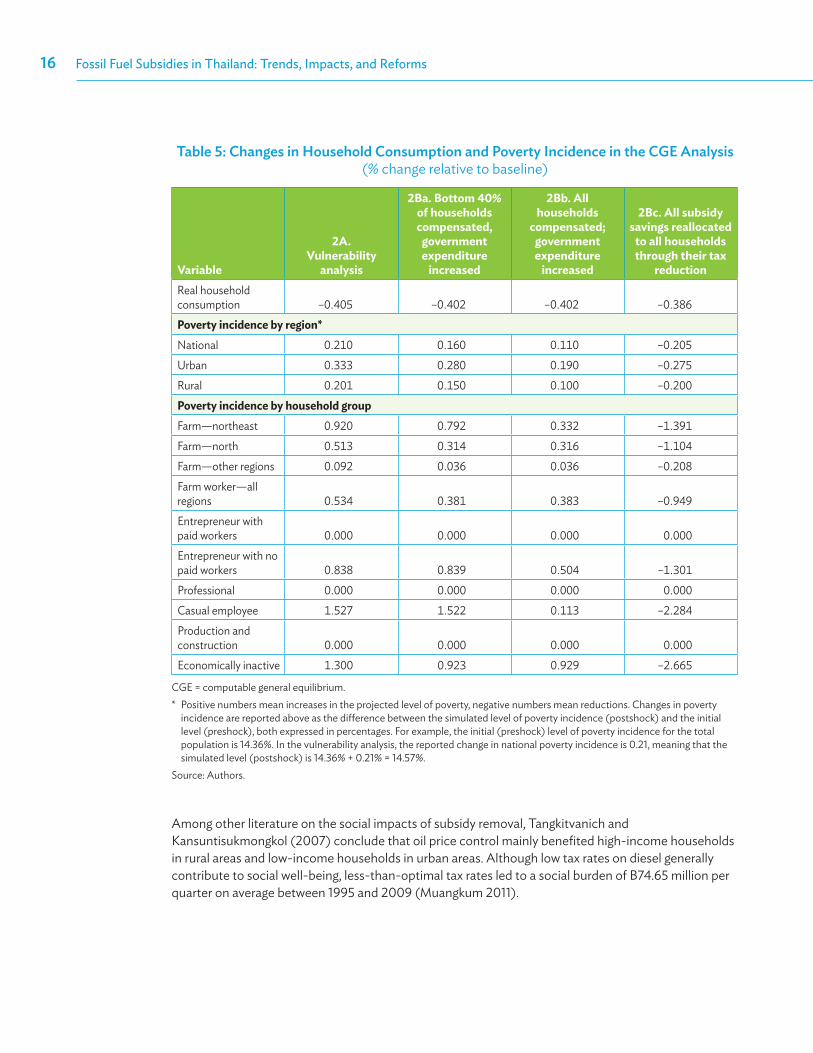
The CGE model estimated higher poverty due to subsidy removal. However, reallocation of all subsidy savings to all households reversed this effect and resulted in a slight decrease in poverty incidence in both urban and rural households (Table 5). When only a part of the savings were used for compensation to households, it was not sufficient to prevent a slight increase in poverty arising from subsidy reform. This was for two reasons: only direct impacts were compensated and only a small proportion of subsidy savings were reallocated to households. The remainder was returned to the government budget, and these revenues do not contribute to economic performance or poverty reduction in the CGE model.
Fossil Fuel Subsidies in Thailand: Trends, Impacts, and Reforms16
Table 5: changes in Household consumption and poverty incidence in the cGe Analysis (% change relative to baseline)
Variable
2A.Vulnerability
analysis
2Ba. Bottom 40% of households compensated,
government expenditure
increased
2Bb. All households
compensated; government expenditure
increased
2Bc. All subsidy savings reallocated
to all households through their tax
reductionReal household consumption –0.405 –0.402 –0.402 –0.386Poverty incidence by region*National 0.210 0.160 0.110 –0.205Urban 0.333 0.280 0.190 –0.275Rural 0.201 0.150 0.100 –0.200Poverty incidence by household groupFarm—northeast 0.920 0.792 0.332 –1.391Farm—north 0.513 0.314 0.316 –1.104Farm—other regions 0.092 0.036 0.036 –0.208Farm worker—all regions 0.534 0.381 0.383 –0.949Entrepreneur with paid workers 0.000 0.000 0.000 0.000Entrepreneur with no paid workers 0.838 0.839 0.504 –1.301Professional 0.000 0.000 0.000 0.000Casual employee 1.527 1.522 0.113 –2.284Production and construction 0.000 0.000 0.000 0.000Economically inactive 1.300 0.923 0.929 –2.665
CGE = computable general equilibrium.* Positive numbers mean increases in the projected level of poverty, negative numbers mean reductions. Changes in poverty
incidence are reported above as the difference between the simulated level of poverty incidence (postshock) and the initial level (preshock), both expressed in percentages. For example, the initial (preshock) level of poverty incidence for the total population is 14.36%. In the vulnerability analysis, the reported change in national poverty incidence is 0.21, meaning that the simulated level (postshock) is 14.36% + 0.21% = 14.57%.
Source: Authors.
Among other literature on the social impacts of subsidy removal, Tangkitvanich and Kansuntisukmongkol (2007) conclude that oil price control mainly benefited high-income households in rural areas and low-income households in urban areas. Although low tax rates on diesel generally contribute to social well-being, less-than-optimal tax rates led to a social burden of B74.65 million per quarter on average between 1995 and 2009 (Muangkum 2011).
The Size of Fuel Subsidies and Impact of Their Reforms 17
On Businesses and Industry
According to the SAM model, land and water transport were the sectors most affected by the removal of the diesel subsidy. It was not possible to estimate the sectoral impacts of reducing subsidies on LPG and NGV in the SAM model, because NGV and LPG subsidies were included in natural gas (raw and separated, respectively). The impacts on households and sectors are likely to differ from a scenario in which LPG and NGV were disaggregated. Natural gas is the primary fuel for electricity generation in Thailand. Higher prices for natural gas will affect this sector and major users of electricity (such as ice production). In reality, removing NGV subsidies would only affect the transport sector, while the removal of subsidized LPG would mostly affect households and restaurants, transport, and some industry groups (that is, those eligible for subsidized LPG).
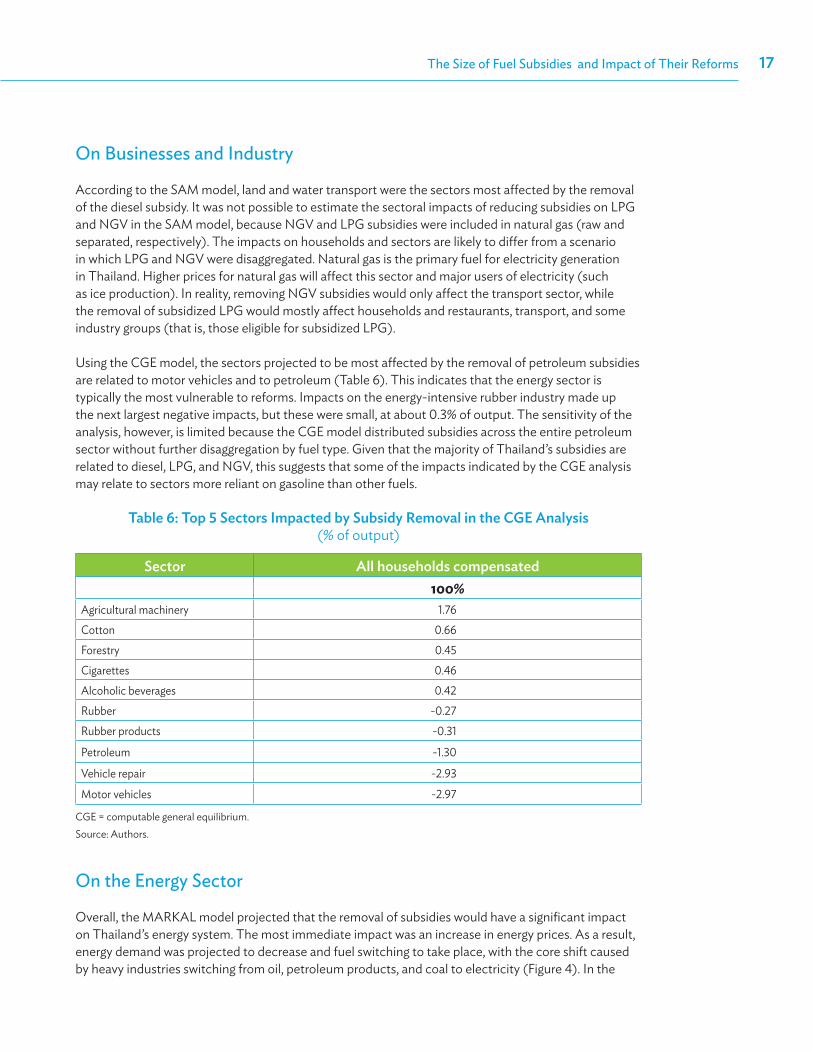
Using the CGE model, the sectors projected to be most affected by the removal of petroleum subsidies are related to motor vehicles and to petroleum (Table 6). This indicates that the energy sector is typically the most vulnerable to reforms. Impacts on the energy-intensive rubber industry made up the next largest negative impacts, but these were small, at about 0.3% of output. The sensitivity of the analysis, however, is limited because the CGE model distributed subsidies across the entire petroleum sector without further disaggregation by fuel type. Given that the majority of Thailand’s subsidies are related to diesel, LPG, and NGV, this suggests that some of the impacts indicated by the CGE analysis may relate to sectors more reliant on gasoline than other fuels.
Table 6: Top 5 sectors impacted by subsidy removal in the cGe Analysis (% of output)
sector All households compensated100%
Agricultural machinery 1.76Cotton 0.66Forestry 0.45Cigarettes 0.46Alcoholic beverages 0.42Rubber -0.27Rubber products -0.31
Petroleum -1.30
Vehicle repair -2.93
Motor vehicles -2.97
CGE = computable general equilibrium.Source: Authors.
On the Energy Sector
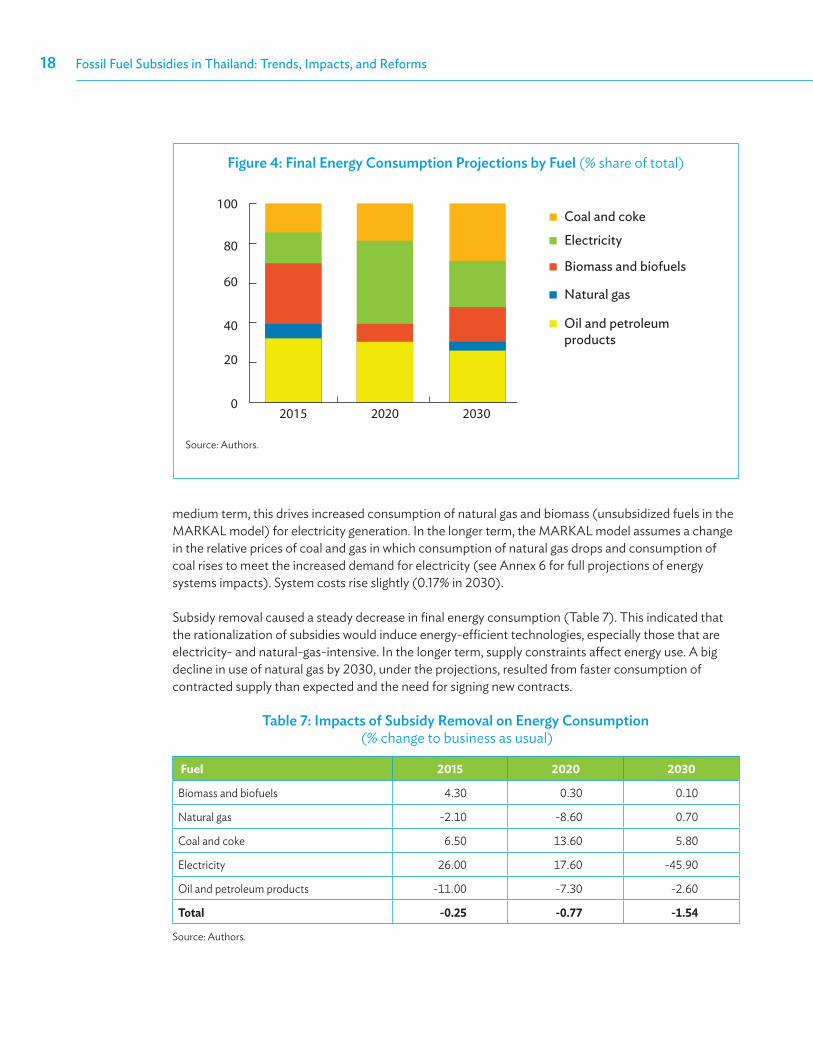
Overall, the MARKAL model projected that the removal of subsidies would have a significant impact on Thailand’s energy system. The most immediate impact was an increase in energy prices. As a result, energy demand was projected to decrease and fuel switching to take place, with the core shift caused by heavy industries switching from oil, petroleum products, and coal to electricity (Figure 4). In the
Fossil Fuel Subsidies in Thailand: Trends, Impacts, and Reforms18
medium term, this drives increased consumption of natural gas and biomass (unsubsidized fuels in the MARKAL model) for electricity generation. In the longer term, the MARKAL model assumes a change in the relative prices of coal and gas in which consumption of natural gas drops and consumption of coal rises to meet the increased demand for electricity (see Annex 6 for full projections of energy systems impacts). System costs rise slightly (0.17% in 2030).
Subsidy removal caused a steady decrease in final energy consumption (Table 7). This indicated that the rationalization of subsidies would induce energy-efficient technologies, especially those that are electricity- and natural-gas-intensive. In the longer term, supply constraints affect energy use. A big decline in use of natural gas by 2030, under the projections, resulted from faster consumption of contracted supply than expected and the need for signing new contracts.
Table 7: impacts of subsidy removal on energy consumption (% change to business as usual)
Fuel 2015 2020 2030
Biomass and biofuels 4.30 0.30 0.10
Natural gas -2.10 -8.60 0.70
Coal and coke 6.50 13.60 5.80
Electricity 26.00 17.60 -45.90
Oil and petroleum products -11.00 -7.30 -2.60
Total -0.25 -0.77 -1.54
Source: Authors.
Figure 4: Final energy consumption projections by Fuel (% share of total)
Coal and coke
Electricity
Biomass and biofuels
Natural gas
Oil and petroleum products
100
80
60
40
20
2015 2020 20300
Source: Authors.
The Size of Fuel Subsidies and Impact of Their Reforms 19
Figure 5: Final energy consumption projections by sector (% share of total)
Agriculture
Commercial
Residential
Transportation
Industry
100
80
60
40
20
02015 2020 2030
Source: Authors.
The MARKAL results are consistent with those of the CGE model, which disaggregated energy into electricity and a single category for petroleum (meaning that only the petroleum results could be compared). The CGE model projected a 6.9% reduction in household petroleum demand; MARKAL forecast a 7.3% decline across all sectors.
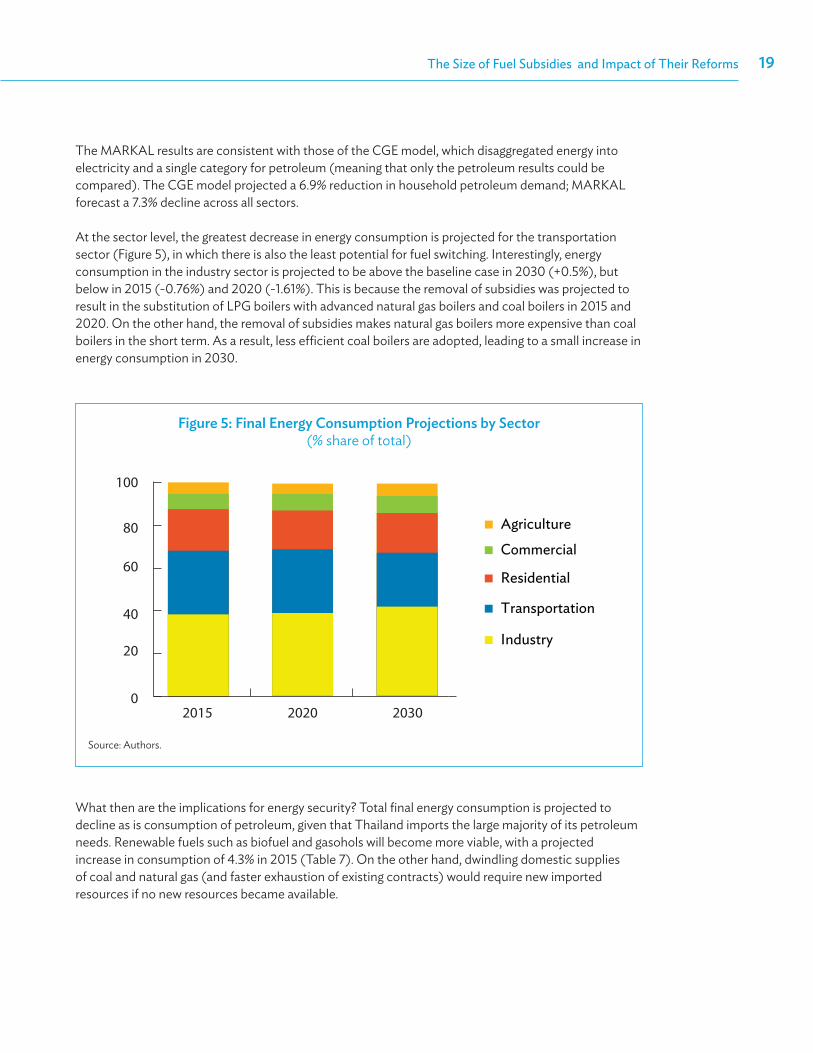
At the sector level, the greatest decrease in energy consumption is projected for the transportation sector (Figure 5), in which there is also the least potential for fuel switching. Interestingly, energy consumption in the industry sector is projected to be above the baseline case in 2030 (+0.5%), but below in 2015 (-0.76%) and 2020 (-1.61%). This is because the removal of subsidies was projected to result in the substitution of LPG boilers with advanced natural gas boilers and coal boilers in 2015 and 2020. On the other hand, the removal of subsidies makes natural gas boilers more expensive than coal boilers in the short term. As a result, less efficient coal boilers are adopted, leading to a small increase in energy consumption in 2030.
What then are the implications for energy security? Total final energy consumption is projected to decline as is consumption of petroleum, given that Thailand imports the large majority of its petroleum needs. Renewable fuels such as biofuel and gasohols will become more viable, with a projected increase in consumption of 4.3% in 2015 (Table 7). On the other hand, dwindling domestic supplies of coal and natural gas (and faster exhaustion of existing contracts) would require new imported resources if no new resources became available.
Fossil Fuel Subsidies in Thailand: Trends, Impacts, and Reforms20
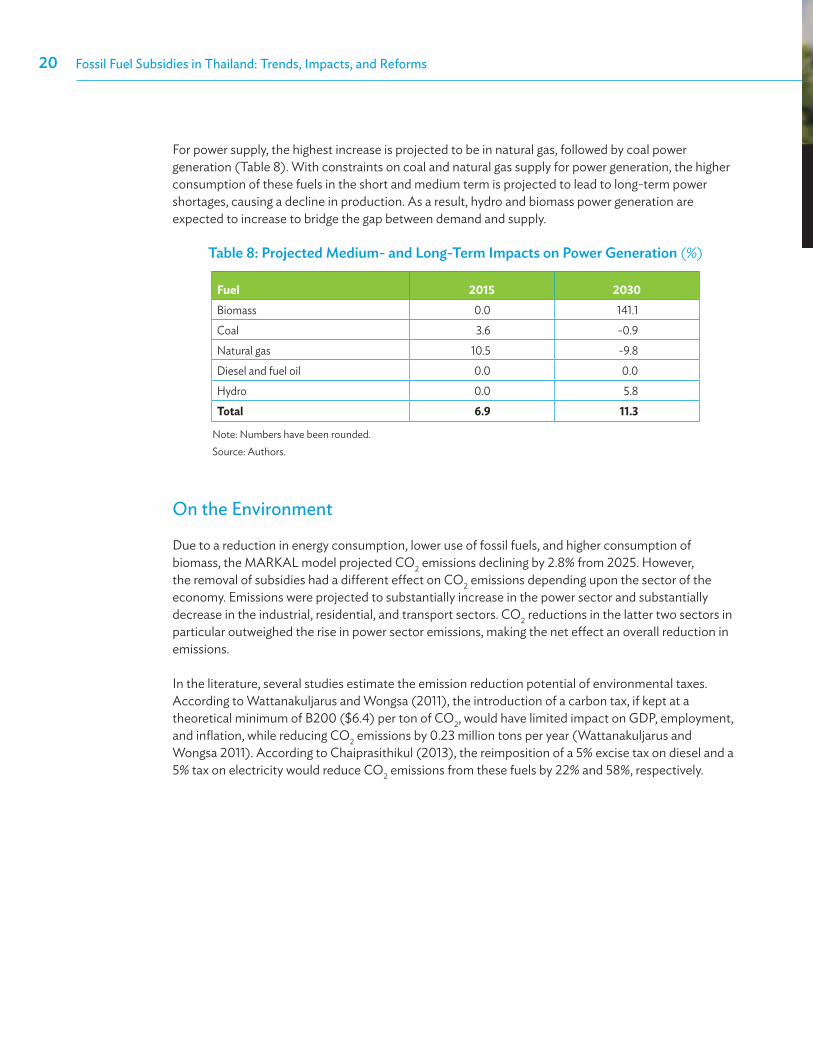
For power supply, the highest increase is projected to be in natural gas, followed by coal power generation (Table 8). With constraints on coal and natural gas supply for power generation, the higher consumption of these fuels in the short and medium term is projected to lead to long-term power shortages, causing a decline in production. As a result, hydro and biomass power generation are expected to increase to bridge the gap between demand and supply.
Table 8: projected medium- and long-Term impacts on power Generation (%)
Fuel 2015 2030Biomass 0.0 141.1Coal 3.6 -0.9Natural gas 10.5 -9.8Diesel and fuel oil 0.0 0.0Hydro 0.0 5.8Total 6.9 11.3
Note: Numbers have been rounded.Source: Authors.
On the Environment
Due to a reduction in energy consumption, lower use of fossil fuels, and higher consumption of biomass, the MARKAL model projected CO2 emissions declining by 2.8% from 2025. However, the removal of subsidies had a different effect on CO2 emissions depending upon the sector of the economy. Emissions were projected to substantially increase in the power sector and substantially decrease in the industrial, residential, and transport sectors. CO2 reductions in the latter two sectors in particular outweighed the rise in power sector emissions, making the net effect an overall reduction in emissions.
In the literature, several studies estimate the emission reduction potential of environmental taxes. According to Wattanakuljarus and Wongsa (2011), the introduction of a carbon tax, if kept at a theoretical minimum of B200 ($6.4) per ton of CO2, would have limited impact on GDP, employment, and inflation, while reducing CO2 emissions by 0.23 million tons per year (Wattanakuljarus and Wongsa 2011). According to Chaiprasithikul (2013), the reimposition of a 5% excise tax on diesel and a 5% tax on electricity would reduce CO2 emissions from these fuels by 22% and 58%, respectively.
4 Fuel Subsidy Reforms and the Need to Protect the Poor
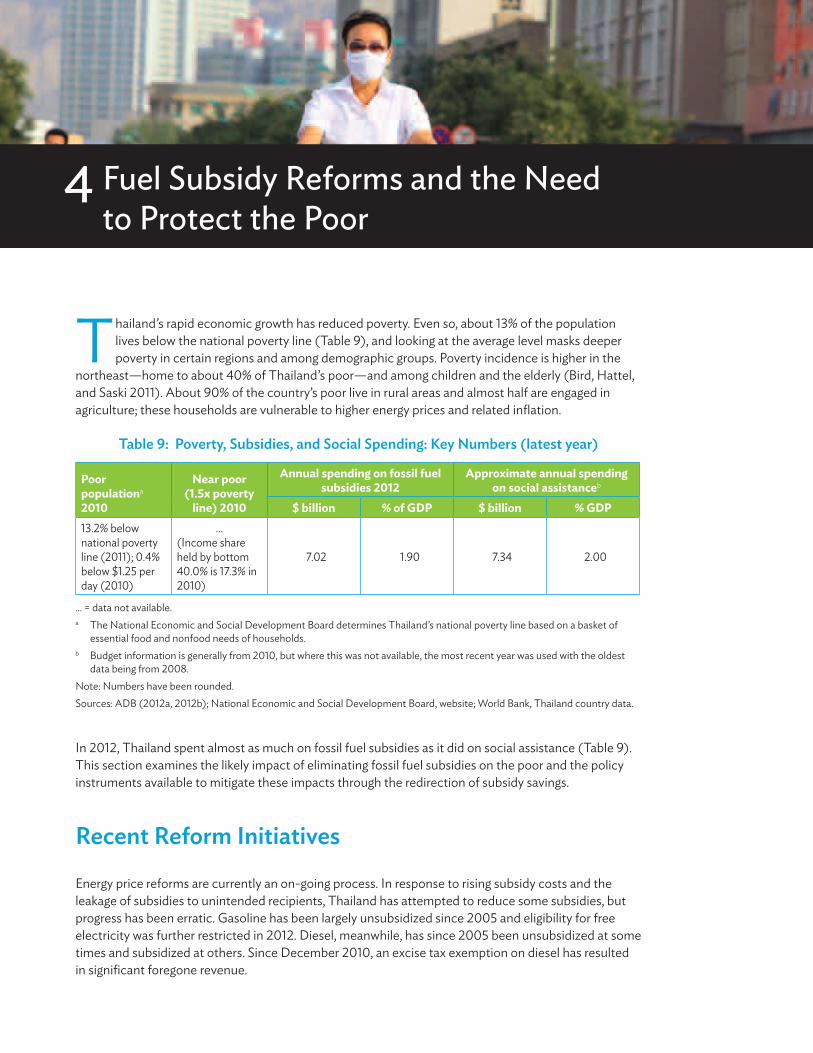
Thailand’s rapid economic growth has reduced poverty. Even so, about 13% of the population lives below the national poverty line (Table 9), and looking at the average level masks deeper poverty in certain regions and among demographic groups. Poverty incidence is higher in the
northeast—home to about 40% of Thailand’s poor—and among children and the elderly (Bird, Hattel, and Saski 2011). About 90% of the country’s poor live in rural areas and almost half are engaged in agriculture; these households are vulnerable to higher energy prices and related inflation.
Table 9: poverty, subsidies, and social spending: Key numbers (latest year)
Poor populationa 2010
Near poor(1.5x poverty
line) 2010
Annual spending on fossil fuel subsidies 2012
Approximate annual spending on social assistanceb
$ billion % of GDP $ billion % GDP13.2% below national poverty line (2011); 0.4% below $1.25 per day (2010)
…(Income share held by bottom 40.0% is 17.3% in 2010)
7.02 1.90 7.34 2.00
... = data not available.a The National Economic and Social Development Board determines Thailand’s national poverty line based on a basket of
essential food and nonfood needs of households. b Budget information is generally from 2010, but where this was not available, the most recent year was used with the oldest
data being from 2008. Note: Numbers have been rounded.Sources: ADB (2012a, 2012b); National Economic and Social Development Board, website; World Bank, Thailand country data.
In 2012, Thailand spent almost as much on fossil fuel subsidies as it did on social assistance (Table 9). This section examines the likely impact of eliminating fossil fuel subsidies on the poor and the policy instruments available to mitigate these impacts through the redirection of subsidy savings.
recent reform initiatives
Energy price reforms are currently an on-going process. In response to rising subsidy costs and the leakage of subsidies to unintended recipients, Thailand has attempted to reduce some subsidies, but progress has been erratic. Gasoline has been largely unsubsidized since 2005 and eligibility for free electricity was further restricted in 2012. Diesel, meanwhile, has since 2005 been unsubsidized at some times and subsidized at others. Since December 2010, an excise tax exemption on diesel has resulted in significant foregone revenue.
Fossil Fuel Subsidies in Thailand: Trends, Impacts, and Reforms22
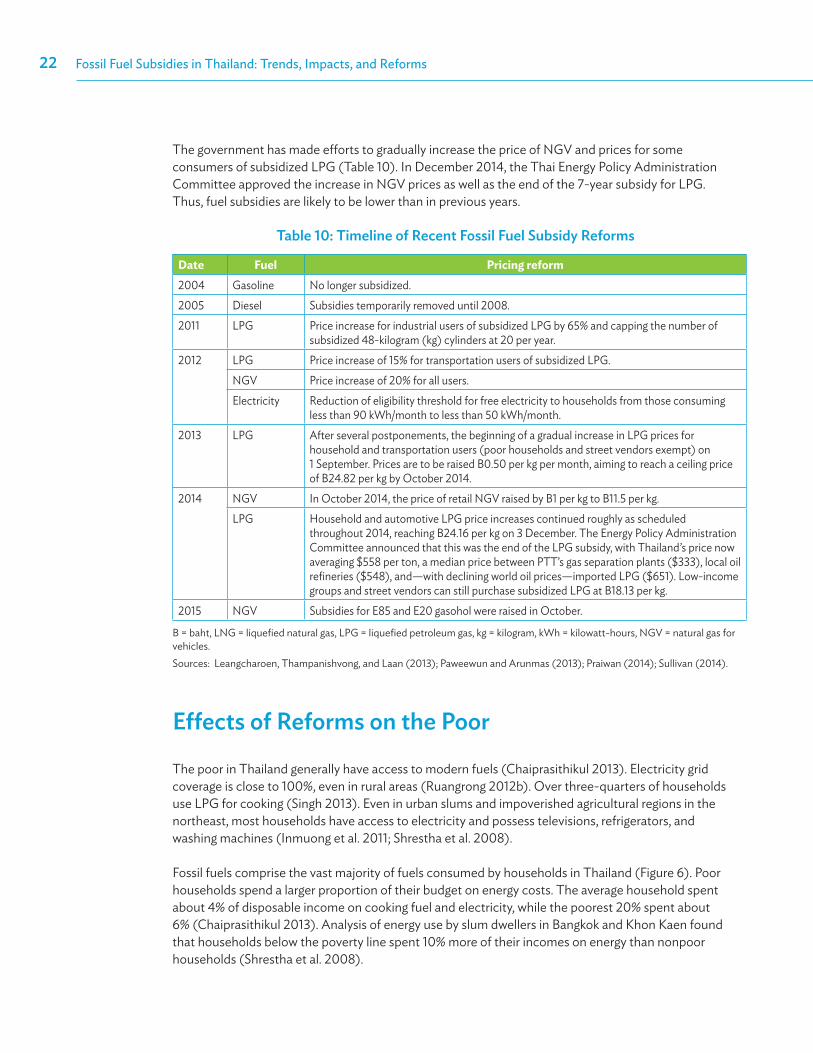
The government has made efforts to gradually increase the price of NGV and prices for some consumers of subsidized LPG (Table 10). In December 2014, the Thai Energy Policy Administration Committee approved the increase in NGV prices as well as the end of the 7-year subsidy for LPG. Thus, fuel subsidies are likely to be lower than in previous years.
Table 10: Timeline of recent Fossil Fuel subsidy reforms
Date Fuel Pricing reform2004 Gasoline No longer subsidized.2005 Diesel Subsidies temporarily removed until 2008.2011 LPG Price increase for industrial users of subsidized LPG by 65% and capping the number of
subsidized 48-kilogram (kg) cylinders at 20 per year.2012 LPG Price increase of 15% for transportation users of subsidized LPG.
NGV Price increase of 20% for all users.Electricity Reduction of eligibility threshold for free electricity to households from those consuming
less than 90 kWh/month to less than 50 kWh/month. 2013 LPG After several postponements, the beginning of a gradual increase in LPG prices for
household and transportation users (poor households and street vendors exempt) on 1 September. Prices are to be raised B0.50 per kg per month, aiming to reach a ceiling price of B24.82 per kg by October 2014.
2014 NGV In October 2014, the price of retail NGV raised by B1 per kg to B11.5 per kg.LPG Household and automotive LPG price increases continued roughly as scheduled
throughout 2014, reaching B24.16 per kg on 3 December. The Energy Policy Administration Committee announced that this was the end of the LPG subsidy, with Thailand’s price now averaging $558 per ton, a median price between PTT’s gas separation plants ($333), local oil refineries ($548), and—with declining world oil prices—imported LPG ($651). Low-income groups and street vendors can still purchase subsidized LPG at B18.13 per kg.
2015 NGV Subsidies for E85 and E20 gasohol were raised in October.
B = baht, LNG = liquefied natural gas, LPG = liquefied petroleum gas, kg = kilogram, kWh = kilowatt-hours, NGV = natural gas for vehicles.Sources: Leangcharoen, Thampanishvong, and Laan (2013); Paweewun and Arunmas (2013); Praiwan (2014); Sullivan (2014).
effects of reforms on the poor
The poor in Thailand generally have access to modern fuels (Chaiprasithikul 2013). Electricity grid coverage is close to 100%, even in rural areas (Ruangrong 2012b). Over three-quarters of households use LPG for cooking (Singh 2013). Even in urban slums and impoverished agricultural regions in the northeast, most households have access to electricity and possess televisions, refrigerators, and washing machines (Inmuong et al. 2011; Shrestha et al. 2008).
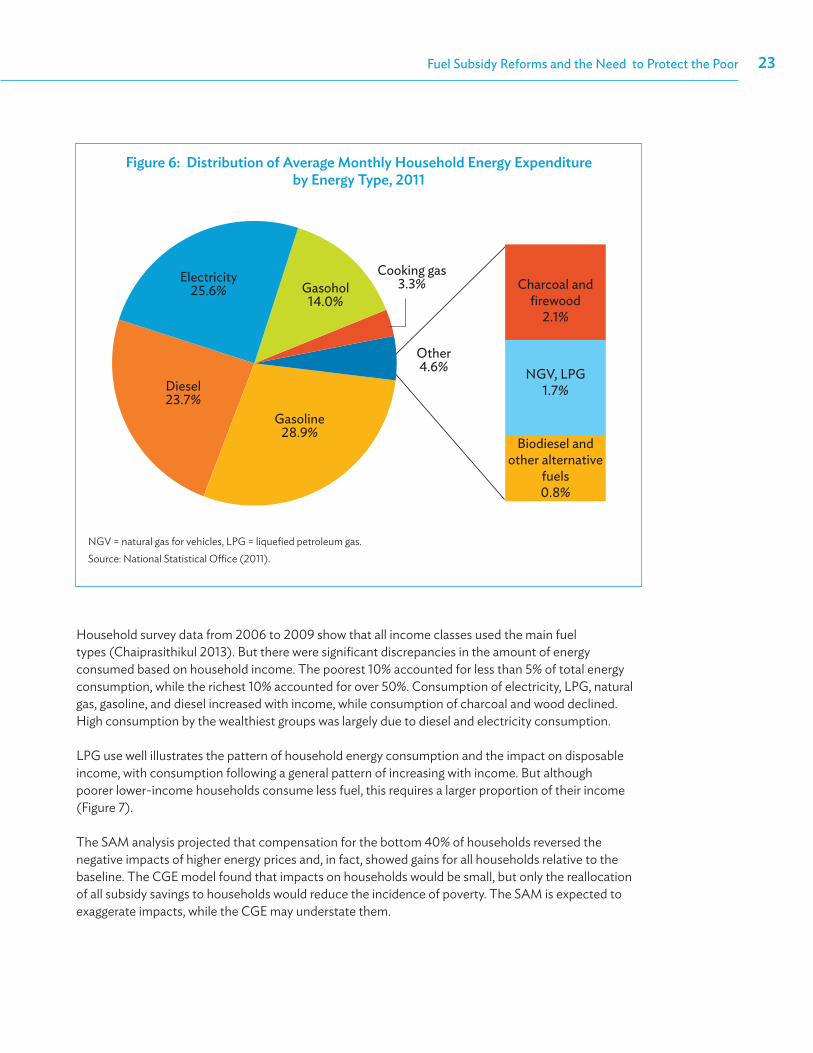
Fossil fuels comprise the vast majority of fuels consumed by households in Thailand (Figure 6). Poor households spend a larger proportion of their budget on energy costs. The average household spent about 4% of disposable income on cooking fuel and electricity, while the poorest 20% spent about 6% (Chaiprasithikul 2013). Analysis of energy use by slum dwellers in Bangkok and Khon Kaen found that households below the poverty line spent 10% more of their incomes on energy than nonpoor households (Shrestha et al. 2008).
Fuel Subsidy Reforms and the Need to Protect the Poor 23
Household survey data from 2006 to 2009 show that all income classes used the main fuel types (Chaiprasithikul 2013). But there were significant discrepancies in the amount of energy consumed based on household income. The poorest 10% accounted for less than 5% of total energy consumption, while the richest 10% accounted for over 50%. Consumption of electricity, LPG, natural gas, gasoline, and diesel increased with income, while consumption of charcoal and wood declined. High consumption by the wealthiest groups was largely due to diesel and electricity consumption.
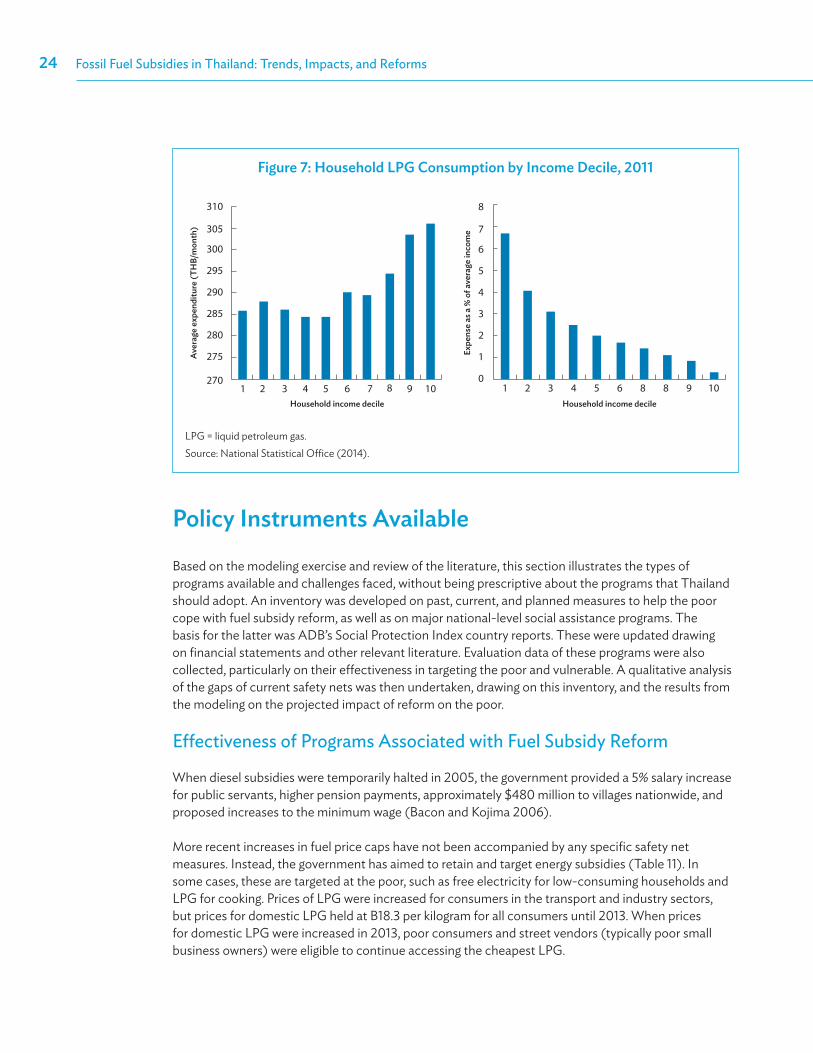
LPG use well illustrates the pattern of household energy consumption and the impact on disposable income, with consumption following a general pattern of increasing with income. But although poorer lower-income households consume less fuel, this requires a larger proportion of their income (Figure 7).
The SAM analysis projected that compensation for the bottom 40% of households reversed the negative impacts of higher energy prices and, in fact, showed gains for all households relative to the baseline. The CGE model found that impacts on households would be small, but only the reallocation of all subsidy savings to households would reduce the incidence of poverty. The SAM is expected to exaggerate impacts, while the CGE may understate them.
Figure 6: distribution of Average monthly Household energy expenditure by energy Type, 2011
Cooking gas3.3%
Other4.6%
Charcoal and firewood
2.1%
NGV, LPG1.7%
Biodiesel and other alternative
fuels 0.8%
Electricity25.6%
Diesel23.7%
Gasoline28.9%
Gasohol14.0%
NGV = natural gas for vehicles, LPG = liquefied petroleum gas.Source: National Statistical Office (2011).
Fossil Fuel Subsidies in Thailand: Trends, Impacts, and Reforms24
Figure 7: Household lpG consumption by income decile, 2011
Expe
nse
as a
% o
f ave
rage
inco
me
Aver
age
expe
nditu
re (T
HB/
mon
th)
Household income decileHousehold income decile
8
7
6
5
4
3
2
0
1
1 2 3 4 5 6 8 8 9 10
310
305
300
295
290
285
280
270
275
1 2 3 4 5 6 7 8 9 10
LPG = liquid petroleum gas. Source: National Statistical Office (2014).
policy instruments Available
Based on the modeling exercise and review of the literature, this section illustrates the types of programs available and challenges faced, without being prescriptive about the programs that Thailand should adopt. An inventory was developed on past, current, and planned measures to help the poor cope with fuel subsidy reform, as well as on major national-level social assistance programs. The basis for the latter was ADB’s Social Protection Index country reports. These were updated drawing on financial statements and other relevant literature. Evaluation data of these programs were also collected, particularly on their effectiveness in targeting the poor and vulnerable. A qualitative analysis of the gaps of current safety nets was then undertaken, drawing on this inventory, and the results from the modeling on the projected impact of reform on the poor.
Effectiveness of Programs Associated with Fuel Subsidy Reform
When diesel subsidies were temporarily halted in 2005, the government provided a 5% salary increase for public servants, higher pension payments, approximately $480 million to villages nationwide, and proposed increases to the minimum wage (Bacon and Kojima 2006).
More recent increases in fuel price caps have not been accompanied by any specific safety net measures. Instead, the government has aimed to retain and target energy subsidies (Table 11). In some cases, these are targeted at the poor, such as free electricity for low-consuming households and LPG for cooking. Prices of LPG were increased for consumers in the transport and industry sectors, but prices for domestic LPG held at B18.3 per kilogram for all consumers until 2013. When prices for domestic LPG were increased in 2013, poor consumers and street vendors (typically poor small business owners) were eligible to continue accessing the cheapest LPG.
Fuel Subsidy Reforms and the Need to Protect the Poor 25
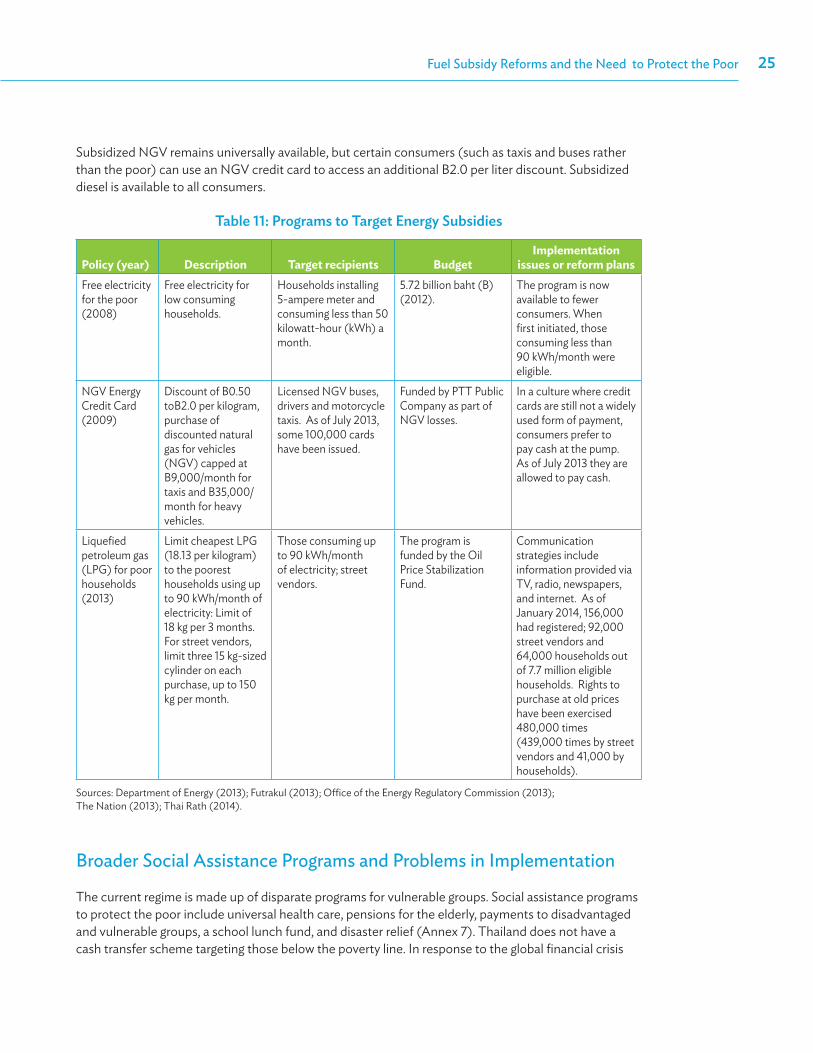
Subsidized NGV remains universally available, but certain consumers (such as taxis and buses rather than the poor) can use an NGV credit card to access an additional B2.0 per liter discount. Subsidized diesel is available to all consumers.
Table 11: programs to Target energy subsidies
Policy (year) Description Target recipients BudgetImplementation
issues or reform plansFree electricity for the poor (2008)
Free electricity for low consuming households.
Households installing 5-ampere meter and consuming less than 50 kilowatt-hour (kWh) a month.
5.72 billion baht (B) (2012).
The program is now available to fewer consumers. When first initiated, those consuming less than 90 kWh/month were eligible.
NGV Energy Credit Card (2009)
Discount of B0.50 toB2.0 per kilogram, purchase of discounted natural gas for vehicles (NGV) capped at B9,000/month for taxis and B35,000/month for heavy vehicles.
Licensed NGV buses, drivers and motorcycle taxis. As of July 2013, some 100,000 cards have been issued.
Funded by PTT Public Company as part of NGV losses.
In a culture where credit cards are still not a widely used form of payment, consumers prefer to pay cash at the pump. As of July 2013 they are allowed to pay cash.
Liquefied petroleum gas (LPG) for poor households (2013)
Limit cheapest LPG (18.13 per kilogram) to the poorest households using up to 90 kWh/month of electricity: Limit of 18 kg per 3 months. For street vendors, limit three 15 kg-sized cylinder on each purchase, up to 150 kg per month.
Those consuming up to 90 kWh/month of electricity; street vendors.
The program is funded by the Oil Price Stabilization Fund.
Communication strategies include information provided via TV, radio, newspapers, and internet. As of January 2014, 156,000 had registered; 92,000 street vendors and 64,000 households out of 7.7 million eligible households. Rights to purchase at old prices have been exercised 480,000 times (439,000 times by street vendors and 41,000 by households).
Sources: Department of Energy (2013); Futrakul (2013); Office of the Energy Regulatory Commission (2013); The Nation (2013); Thai Rath (2014).
Broader Social Assistance Programs and Problems in Implementation
The current regime is made up of disparate programs for vulnerable groups. Social assistance programs to protect the poor include universal health care, pensions for the elderly, payments to disadvantaged and vulnerable groups, a school lunch fund, and disaster relief (Annex 7). Thailand does not have a cash transfer scheme targeting those below the poverty line. In response to the global financial crisis
Fossil Fuel Subsidies in Thailand: Trends, Impacts, and Reforms26
of 2008, the National Cheque Project was launched; it provides a one-off payment to those with a monthly income of B15,000 ($455 in 2008) or less.
The Village Fund, a microfinance program, administers loans through nearly 80,000 elected committees; it reaches 30% of all households and beneficiaries are predominantly to the poor (Boonperm et al. 2012).
The central government funds virtually all programs and activities providing a social safety net. The decentralization and devolution of certain functions in 1997 led to the establishment of over 7,800 local administration organizations (Department of Local Administration 2013). These organizations deliver up to 90% of social services and human development activities (Panprayad 2014). Local administration organizations have juridical power to provide social safety nets from their own funds, but have yet to generate significant means beyond those granted by the central government. Their total budget is less than one-tenth the size of the central government (Jittungsakul 2010).
Local administration organizations recently initiated community welfare funds. These are contributory and jointly funded by community members at a rate of B365 per year, with matching funding from the central government and a contribution from the local administration organizations and local businesses at a voluntary rate. As of April 2013, there were a 5,600 such funds, with total membership of 3,478,800 and a value of about B4 billion (Community Organizations Development Institute 2013).
The government is also attempting to extend coverage of contributory schemes, which are not included in the technical definition of “social assistance,” but are worth mentioning because of the significant role they play in Thailand’s social welfare system. Social security benefits to public servants cover about 7% of the population (International Labour Organization 2013). The national Social Security Fund covers self-employed people and private sector employees (about 15% of the population) by providing allowances for sickness, death and disability, maternity and child benefits, old age pensions, and unemployment benefits.
A key challenge is coverage of those not benefiting from contributory schemes as public servants or members of the formal sector. Informal economy workers and their families comprise 76% of the population. A 2009 review of Thailand’s contributory and noncontributory social programs concluded that the country’s social protection regime was inadequate due to problems with coverage, adequacy of benefits, and management (Paitoonpong, Chawla, and Akkarakul 2009).
To address this, the government introduced in 2012 the National Savings Fund, a voluntary contribution fund providing a pension scheme for those not covered by the public sector pension scheme or social security (predominantly the self-employed and people employed in the informal sector). The government matches monthly contributions of between B50 and B1,100 according to an age-related scale.
Improving Social Assistance Programs for the Poor
The government has implemented policies to reduce the fiscal burden of fuel subsidies by gradually increasing the LPG price, while protecting the poor (targeting cheap LPG and lifeline electricity rates). In their current form, however, these policies are having only a limited impact on helping the poor and reducing the budgetary impacts of fossil fuel subsidies. Of the 7.7 million eligible recipients, only 2% have registered to access the cheapest LPG. This may be because retail prices for all household
Fuel Subsidy Reforms and the Need to Protect the Poor 27
consumers are still only marginally above the rate for poor consumers. If the price disparity grows, more may register for the cheapest gas. But it may also be because the process for registering and accessing subsidized LPG is difficult or cumbersome. Raising LPG price to B24 per kilogram, equivalent to the domestic cost of production, for other consumers of cooking and transport fuels, will still provide significant subsidies. Moreover, the price is significantly lower than the price PTT pays for imported LPG—and it is exempt from the usual fuel taxes.
The excise tax exemption on diesel is the government’s single largest fossil fuel subsidy, and is highly regressive given that poor households used about 10 liters per year in 2009, while the richest 10% used over 500 liters. Given that diesel is an input to primary production and transport, subsidy removal could impact the poor indirectly by increasing prices. Compensation would therefore be needed, but this is not possible through targeted fuel subsidies.
Some recommendations to improve social assistance programs for the poor include the following:
• Phase out subsidies for diesel, LPG, and NGV and replace them with targeted cash transfers for the poor that compensate for the direct and indirect impacts of subsidy removal. This can be achieved using the funding liberated from reform. Reimposing the excise on diesel would generate over B110 billion per year in government revenue, almost double the annual cost of the old-age allowance. This would provide a survival pension to over 7 million people (more than 10% of the population). Funds from reimposing taxes on diesel would be sufficient to fund a similar scheme for those below the poverty line—something currently lacking in Thailand’s social assistance regime. Those below the poverty line comprise 13% of the population, but there is likely to be overlap between this group and those already receiving the old-age allowance.
• Utilize pro-poor programs. Thailand has numerous pro-poor programs that could be used to help develop a unified registry of the poor as well as proxy means testing. As an upper-middle income country, identification of poor households should be readily achievable.
• Use subsidy savings to increase funding for education and health services in poor areas. The key structural issues facing Thailand are the need to extend access to quality education and health care to the underprivileged and reduce the environmental impacts of growth (OECD 2013). Fossil fuel subsidy reform can address both of these by liberating funds for social spending and reducing emissions by eliminating distortions in fuel pricing. Allocating some subsidy savings to new social insurance schemes could also help to increase support for subsidy reform among the nonpoor.
• Maintain free electricity for poor households until reform solutions can be developed that do not compromise energy access. Until nonprice-subsidy policies are developed that can ensure modern energy access for the poor, free electricity for low-income households remains an imperfect but relatively well-targeted measure to achieve this end. The MARKAL model projected fuel switching to electricity (14% increase in electricity consumption by 2020). Low tariffs for the poor would protect them from higher prices when increasing electricity use and from switching to biomass, which could have negative impacts given indoor air pollution, time spent searching for fuel, and deforestation.
5 Summary of Findings
Thailand has been undertaking reforms of fossil fuel subsidies. The subsidies in the budget and those not captured in the budget, are estimated to be about $7 billion in 2012. The largest quantified subsidies were tax breaks for diesel, market price support for LPG and NGV, and free
electricity for low-income consumers. Market-price support is provided through cross-subsidies from the oil fund and under-recoveries by PTT. A major subsidy estimated in the inventory, but not included in government estimates, was the opportunity cost of the price caps on LPG relative to international market prices. The upstream and midstream subsidies for the supply of NGV were tax reductions for activities related to capital expenditure on exploration, LNG terminals, pipelines, and service stations.
The removal of fossil fuel subsidies in Thailand was projected to have a significant positive impact on GDP by the SAM model, while the CGE model—although shedding useful light on household and sectoral impacts—was not structured to capture any relationship between GDP and transfers to households or lower budgetary deficits. Middle-income household groups, especially families living in urban areas, were expected to be most affected.
The impacts on the energy system are noticeable. Higher energy prices lead to lower energy demand, with fuel switching taking place from oil and petroleum products (subsidized fuels) to electricity generated with natural gas, biomass, and coal (fuels considered unsubsidized in the MARKAL model).
The CGE model provided results on poverty incidence and indicated that poverty would increase very slightly when only the bottom 40% by income were compensated, but decrease when subsidy savings were redistributed to all households.
Thailand has not put in place specific safety net programs to accompany fossil fuel subsidy reform. Instead, it has attempted to target some subsidies for the poor (LPG and electricity), while raising prices for other consumers. For LPG, the policy is likely to have limited ability to protect the poor as only 2% of eligible consumers have registered to access the cheapest LPG. Thailand’s largest fossil fuel subsidy, the excise exemption on diesel, is highly regressive given that poor households use very little diesel directly. Reimposing the excise tax on diesel would generate over B110 billion per year, enough to fund an allowance scheme for all households below the national poverty line. This would compensate the poor for the direct and indirect impact of higher diesel prices, while providing a long-term benefit for Thailand’s poor.

ANNExES
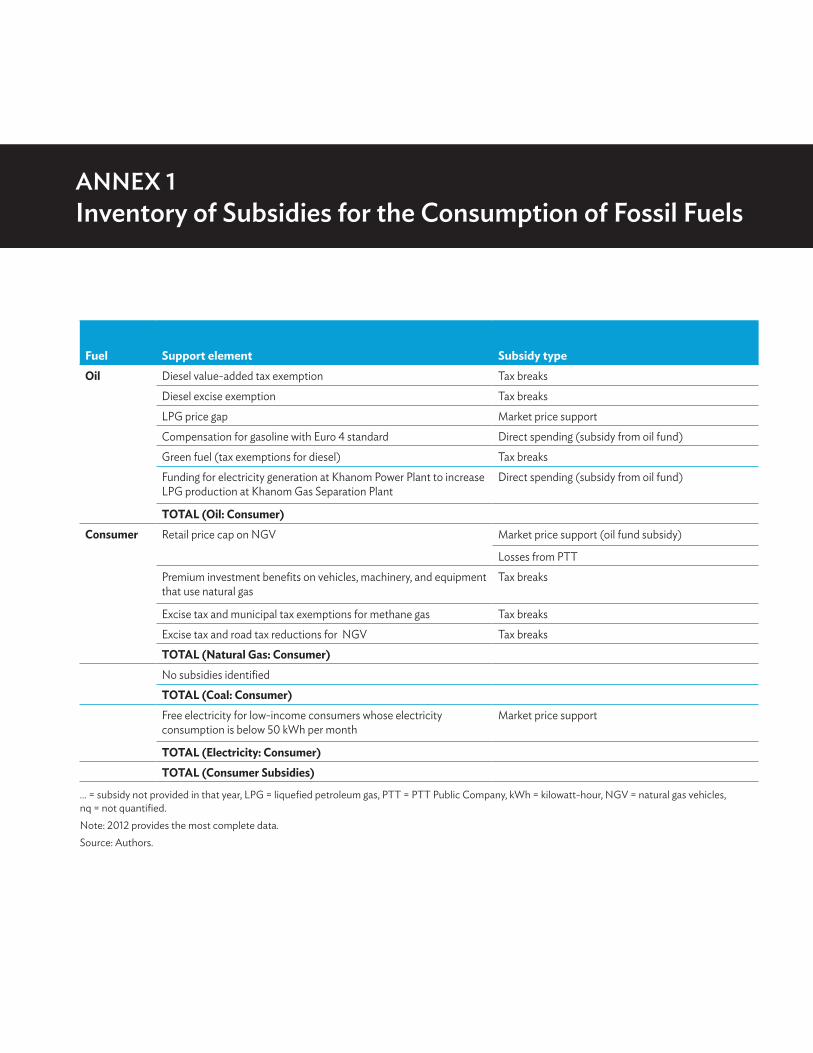
Fuel Support element Subsidy type FuelSubsidy estimates (baht million) Subsidy estimates ($ million)
2008 2009 2010 2011 2012 2008 2009 2010 2011 2012Oil Diesel value-added tax exemption Tax breaks Oil … … … 7,677 8,226 … … … 252 265
Diesel excise exemption Tax breaks 23,803 … … 41,991 106,547 722 … … 1,378 3,431LPG price gap Market price support 55,784 21,780 44,080 60,016 67,967 1,691 634 1,389 1,969 2,188Compensation for gasoline with Euro 4 standard Direct spending (subsidy from oil fund) 508 1,532 1,876 2,055 1,361 15 45 59 67 44Green fuel (tax exemptions for diesel) Tax breaks 2,882 7,373 9,770 3,679 3,778 87 215 308 121 122Funding for electricity generation at Khanom Power Plant to increase LPG production at Khanom Gas Separation Plant
Direct spending (subsidy from oil fund) … … … 1,196 877 … … … 39 28
TOTAL (Oil: Consumer) 82,978 30,684 55,725 116,613 188,755 2,515 894 1,756 3,826 6,077Consumer Retail price cap on NGV Market price support (oil fund subsidy) Consumer 0 0 2,965 3,600 814 0 0 93 118 26
Losses from PTT 5,280 9,624 9,193 12,820 21,372 160 280 290 421 688Premium investment benefits on vehicles, machinery, and equipment that use natural gas
Tax breaks nq nq nq nq nq nq nq nq nq nq
Excise tax and municipal tax exemptions for methane gas Tax breaks 1,792 3,238 4,384 5,592 6,756 54 94 138 183 218Excise tax and road tax reductions for NGV Tax breaks 576 1,227 1,504 3,671 3,258 17 36 47 120 105TOTAL (Natural Gas: Consumer) 5,280 9,624 12,158 16,420 22,186 160 280 383 539 714No subsidies identified 0 0 0 0 0 0 0 0 0 0TOTAL (Coal: Consumer) 0 0 0 0 0 0 0 0 0 0Free electricity for low-income consumers whose electricity consumption is below 50 kWh per month
Market price support … 15,860 17,842 2,911 5,719 … 462 562 96 184
TOTAL (Electricity: Consumer) 0 15,860 17,842 2,911 5,719 0 462 562 96 184TOTAL (Consumer Subsidies) 88,258 56,168 85,725 135,944 216,660 2,675 1,636 2,702 4,460 6,976
… = subsidy not provided in that year, LPG = liquefied petroleum gas, PTT = PTT Public Company, kWh = kilowatt-hour, NGV = natural gas vehicles, nq = not quantified. Note: 2012 provides the most complete data.Source: Authors.
Annex 1inventory of subsidies for the consumption of Fossil Fuels
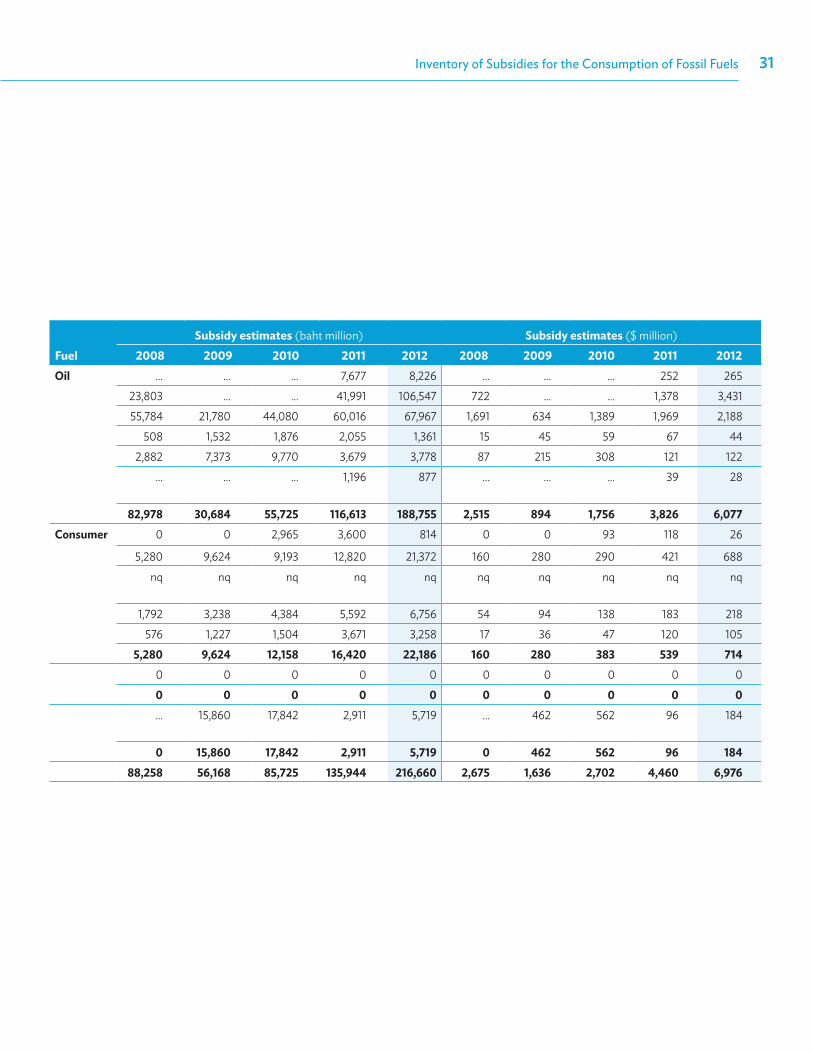
Inventory of Subsidies for the Consumption of Fossil Fuels 31
Fuel Support element Subsidy type FuelSubsidy estimates (baht million) Subsidy estimates ($ million)
2008 2009 2010 2011 2012 2008 2009 2010 2011 2012Oil Diesel value-added tax exemption Tax breaks Oil … … … 7,677 8,226 … … … 252 265
Diesel excise exemption Tax breaks 23,803 … … 41,991 106,547 722 … … 1,378 3,431LPG price gap Market price support 55,784 21,780 44,080 60,016 67,967 1,691 634 1,389 1,969 2,188Compensation for gasoline with Euro 4 standard Direct spending (subsidy from oil fund) 508 1,532 1,876 2,055 1,361 15 45 59 67 44Green fuel (tax exemptions for diesel) Tax breaks 2,882 7,373 9,770 3,679 3,778 87 215 308 121 122Funding for electricity generation at Khanom Power Plant to increase LPG production at Khanom Gas Separation Plant
Direct spending (subsidy from oil fund) … … … 1,196 877 … … … 39 28
TOTAL (Oil: Consumer) 82,978 30,684 55,725 116,613 188,755 2,515 894 1,756 3,826 6,077Consumer Retail price cap on NGV Market price support (oil fund subsidy) Consumer 0 0 2,965 3,600 814 0 0 93 118 26
Losses from PTT 5,280 9,624 9,193 12,820 21,372 160 280 290 421 688Premium investment benefits on vehicles, machinery, and equipment that use natural gas
Tax breaks nq nq nq nq nq nq nq nq nq nq
Excise tax and municipal tax exemptions for methane gas Tax breaks 1,792 3,238 4,384 5,592 6,756 54 94 138 183 218Excise tax and road tax reductions for NGV Tax breaks 576 1,227 1,504 3,671 3,258 17 36 47 120 105TOTAL (Natural Gas: Consumer) 5,280 9,624 12,158 16,420 22,186 160 280 383 539 714No subsidies identified 0 0 0 0 0 0 0 0 0 0TOTAL (Coal: Consumer) 0 0 0 0 0 0 0 0 0 0Free electricity for low-income consumers whose electricity consumption is below 50 kWh per month
Market price support … 15,860 17,842 2,911 5,719 … 462 562 96 184
TOTAL (Electricity: Consumer) 0 15,860 17,842 2,911 5,719 0 462 562 96 184TOTAL (Consumer Subsidies) 88,258 56,168 85,725 135,944 216,660 2,675 1,636 2,702 4,460 6,976
… = subsidy not provided in that year, LPG = liquefied petroleum gas, PTT = PTT Public Company, kWh = kilowatt-hour, NGV = natural gas vehicles, nq = not quantified. Note: 2012 provides the most complete data.Source: Authors.
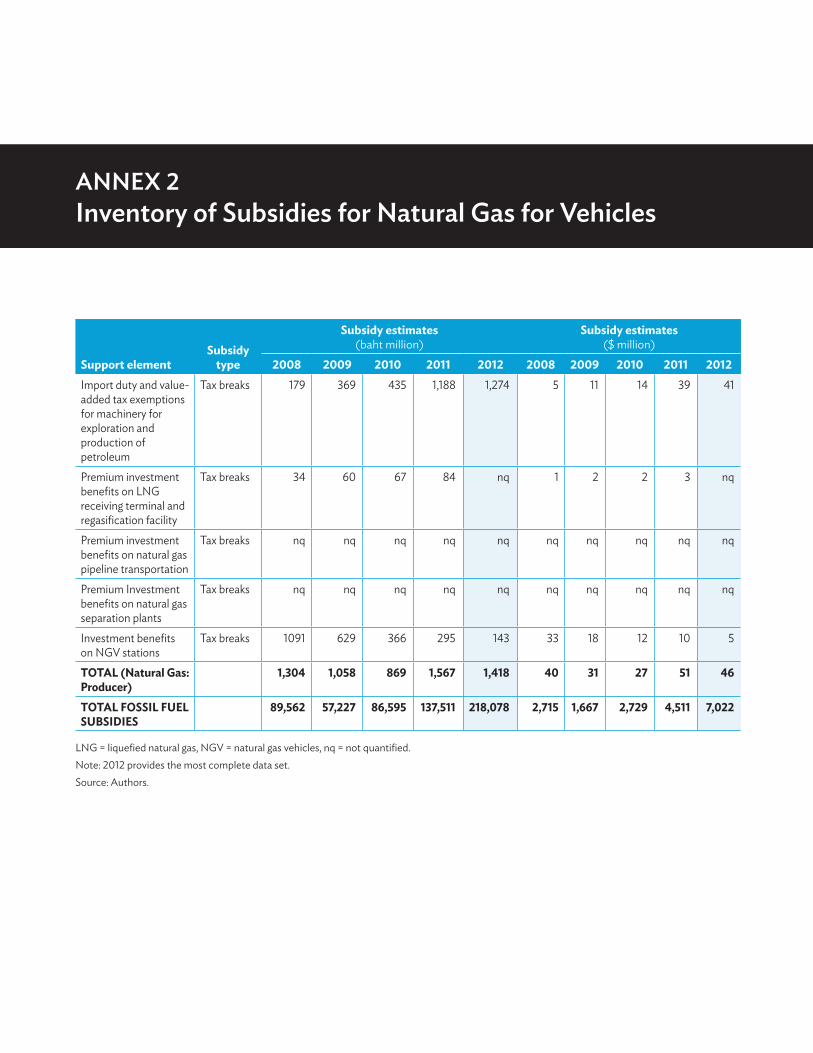
Support elementSubsidy
type
Subsidy estimates (baht million)
Subsidy estimates ($ million)
2008 2009 2010 2011 2012 2008 2009 2010 2011 2012Import duty and value-added tax exemptions for machinery for exploration and production of petroleum
Tax breaks 179 369 435 1,188 1,274 5 11 14 39 41
Premium investment benefits on LNG receiving terminal and regasification facility
Tax breaks 34 60 67 84 nq 1 2 2 3 nq
Premium investment benefits on natural gas pipeline transportation
Tax breaks nq nq nq nq nq nq nq nq nq nq
Premium Investment benefits on natural gas separation plants
Tax breaks nq nq nq nq nq nq nq nq nq nq
Investment benefits on NGV stations
Tax breaks 1091 629 366 295 143 33 18 12 10 5
TOTAL (Natural Gas: Producer)
1,304 1,058 869 1,567 1,418 40 31 27 51 46
TOTAL FOSSIL FUEL SUBSIDIES
89,562 57,227 86,595 137,511 218,078 2,715 1,667 2,729 4,511 7,022
LNG = liquefied natural gas, NGV = natural gas vehicles, nq = not quantified.Note: 2012 provides the most complete data set.Source: Authors.
Annex 2inventory of subsidies for natural Gas for Vehicles
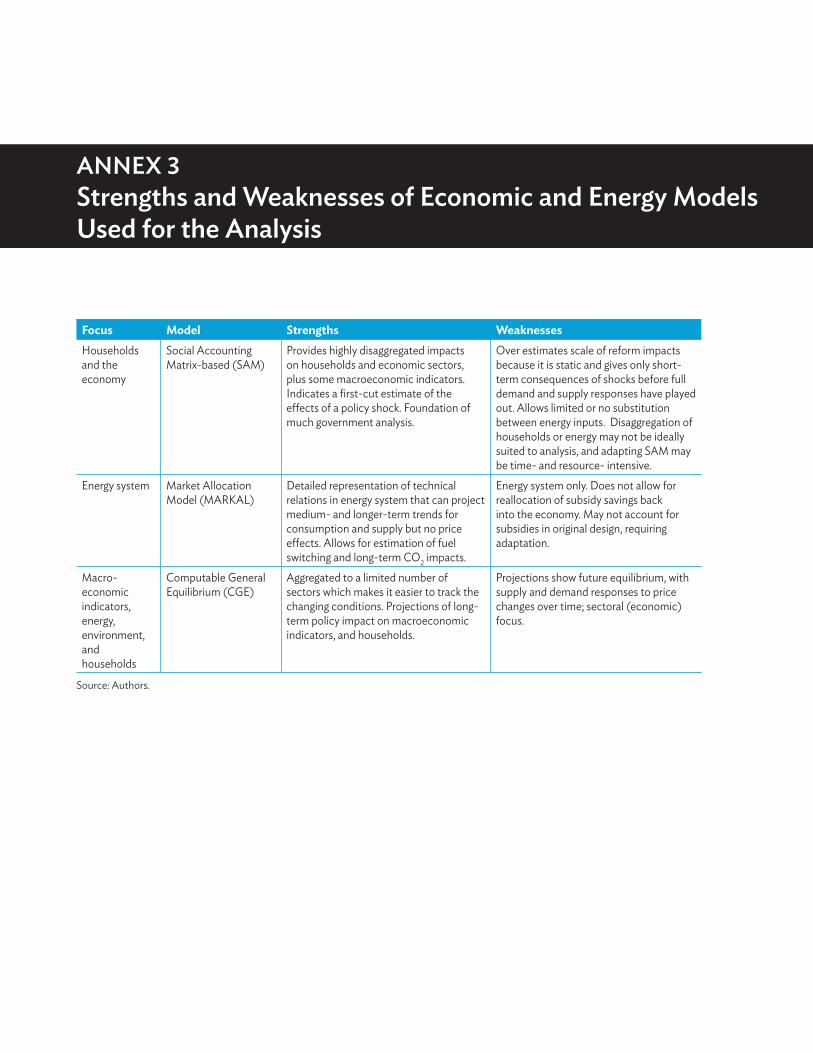
Annex 3strengths and Weaknesses of economic and energy models used for the Analysis
Focus Model Strengths WeaknessesHouseholds and the economy
Social Accounting Matrix-based (SAM)
Provides highly disaggregated impacts on households and economic sectors, plus some macroeconomic indicators. Indicates a first-cut estimate of the effects of a policy shock. Foundation of much government analysis.
Over estimates scale of reform impacts because it is static and gives only short-term consequences of shocks before full demand and supply responses have played out. Allows limited or no substitution between energy inputs. Disaggregation of households or energy may not be ideally suited to analysis, and adapting SAM may be time- and resource- intensive.
Energy system Market Allocation Model (MARKAL)
Detailed representation of technical relations in energy system that can project medium- and longer-term trends for consumption and supply but no price effects. Allows for estimation of fuel switching and long-term CO2 impacts.
Energy system only. Does not allow for reallocation of subsidy savings back into the economy. May not account for subsidies in original design, requiring adaptation.
Macro-economic indicators, energy, environment, and households
Computable General Equilibrium (CGE)
Aggregated to a limited number of sectors which makes it easier to track the changing conditions. Projections of long-term policy impact on macroeconomic indicators, and households.
Projections show future equilibrium, with supply and demand responses to price changes over time; sectoral (economic) focus.
Source: Authors.
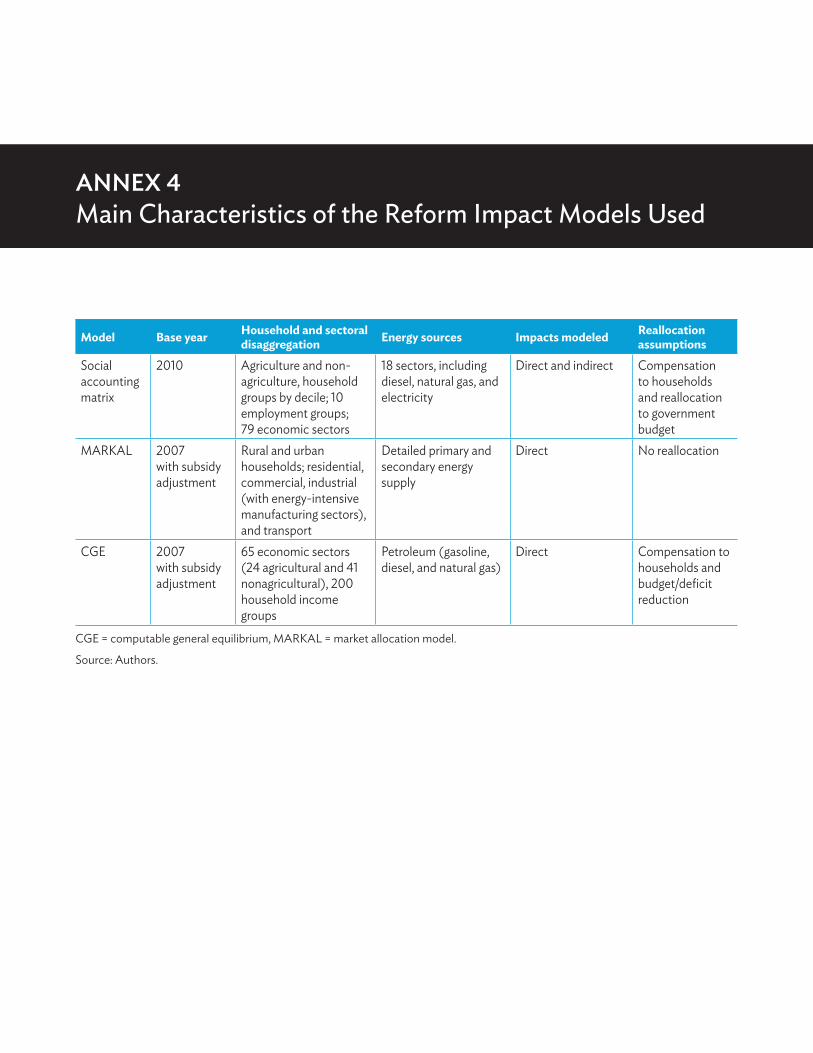
Annex 4Main Characteristics of the Reform Impact Models Used
Model Base year Household and sectoral disaggregation Energy sources Impacts modeled Reallocation
assumptions
Social accounting matrix
2010 Agriculture and non-agriculture, household groups by decile; 10 employment groups; 79 economic sectors
18 sectors, including diesel, natural gas, and electricity
Direct and indirect Compensation to households and reallocation to government budget
MARKAL 2007 with subsidy adjustment
Rural and urban households; residential, commercial, industrial (with energy-intensive manufacturing sectors), and transport
Detailed primary and secondary energy supply
Direct No reallocation
CGE 2007 with subsidy adjustment
65 economic sectors (24 agricultural and 41 nonagricultural), 200 household income groups
Petroleum (gasoline, diesel, and natural gas)
Direct Compensation to households and budget/deficit reduction
CGE = computable general equilibrium, MARKAL = market allocation model.
Source: Authors.
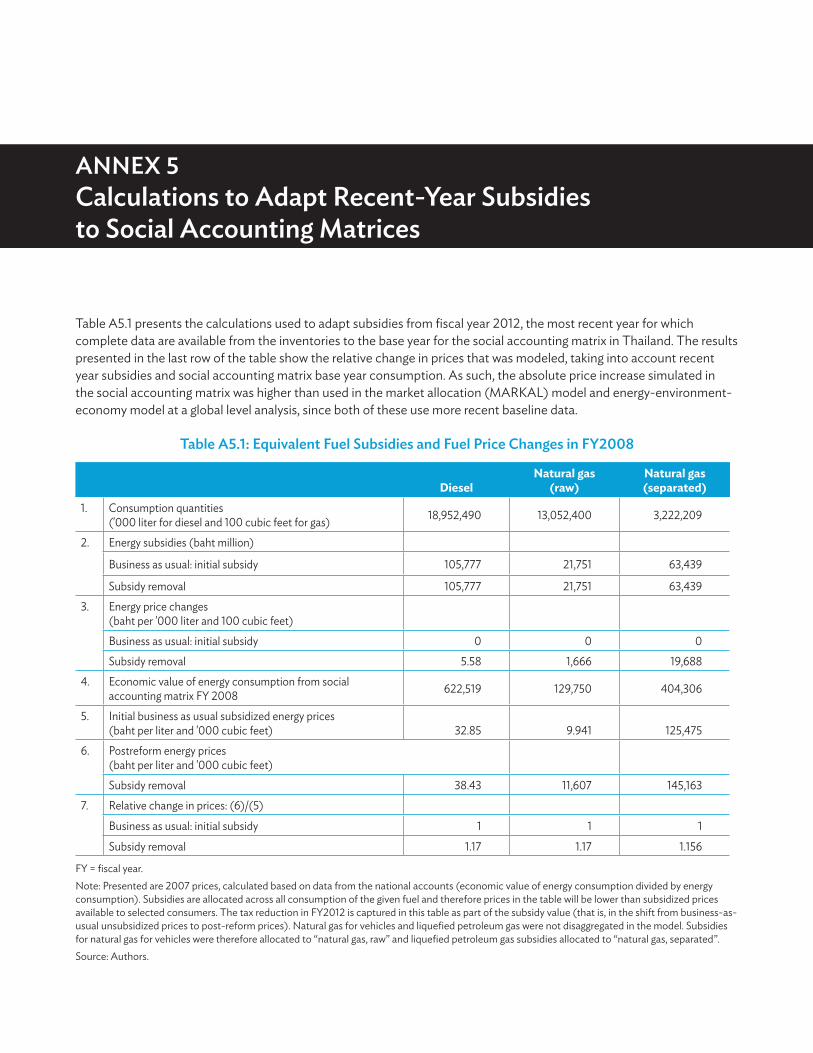
Annex 5calculations to Adapt recent-Year subsidies to social Accounting matrices
Table A5.1 presents the calculations used to adapt subsidies from fiscal year 2012, the most recent year for which complete data are available from the inventories to the base year for the social accounting matrix in Thailand. The results presented in the last row of the table show the relative change in prices that was modeled, taking into account recent year subsidies and social accounting matrix base year consumption. As such, the absolute price increase simulated in the social accounting matrix was higher than used in the market allocation (MARKAL) model and energy-environment-economy model at a global level analysis, since both of these use more recent baseline data.
Table A5.1: equivalent Fuel subsidies and Fuel price changes in FY2008
DieselNatural gas
(raw)Natural gas (separated)
1. Consumption quantities ('000 liter for diesel and 100 cubic feet for gas) 18,952,490 13,052,400 3,222,209
2. Energy subsidies (baht million)
Business as usual: initial subsidy 105,777 21,751 63,439
Subsidy removal 105,777 21,751 63,4393. Energy price changes
(baht per '000 liter and 100 cubic feet)Business as usual: initial subsidy 0 0 0Subsidy removal 5.58 1,666 19,688
4. Economic value of energy consumption from social accounting matrix FY 2008 622,519 129,750 404,306
5. Initial business as usual subsidized energy prices (baht per liter and '000 cubic feet) 32.85 9.941 125,475
6. Postreform energy prices (baht per liter and '000 cubic feet)Subsidy removal 38.43 11,607 145,163
7. Relative change in prices: (6)/(5)
Business as usual: initial subsidy 1 1 1
Subsidy removal 1.17 1.17 1.156
FY = fiscal year.Note: Presented are 2007 prices, calculated based on data from the national accounts (economic value of energy consumption divided by energy consumption). Subsidies are allocated across all consumption of the given fuel and therefore prices in the table will be lower than subsidized prices available to selected consumers. The tax reduction in FY2012 is captured in this table as part of the subsidy value (that is, in the shift from business-as-usual unsubsidized prices to post-reform prices). Natural gas for vehicles and liquefied petroleum gas were not disaggregated in the model. Subsidies for natural gas for vehicles were therefore allocated to “natural gas, raw” and liquefied petroleum gas subsidies allocated to “natural gas, separated”.Source: Authors.
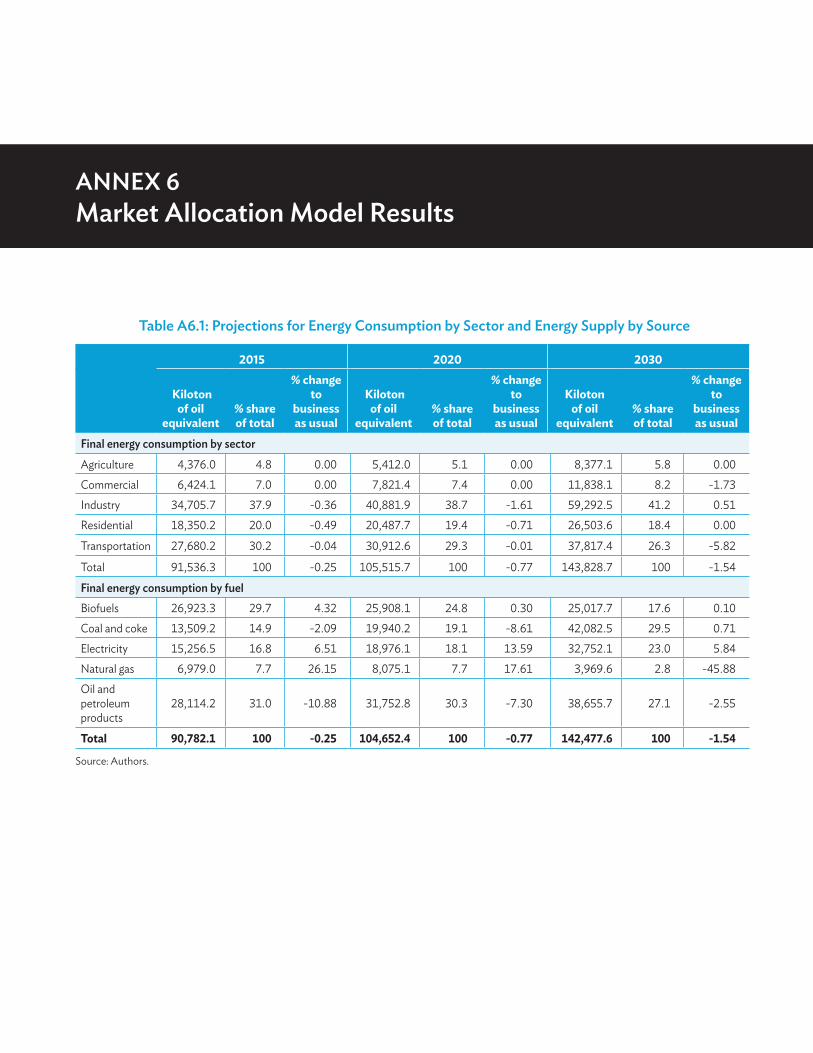
Annex 6market Allocation model results
Table A6.1: projections for energy consumption by sector and energy supply by source
2015 2020 2030
Kiloton of oil
equivalent % share of total
% change to
business as usual
Kiloton of oil
equivalent % share of total
% change to
business as usual
Kiloton of oil
equivalent % share of total
% change to
business as usual
Final energy consumption by sectorAgriculture 4,376.0 4.8 0.00 5,412.0 5.1 0.00 8,377.1 5.8 0.00Commercial 6,424.1 7.0 0.00 7,821.4 7.4 0.00 11,838.1 8.2 -1.73Industry 34,705.7 37.9 -0.36 40,881.9 38.7 -1.61 59,292.5 41.2 0.51Residential 18,350.2 20.0 -0.49 20,487.7 19.4 -0.71 26,503.6 18.4 0.00
Transportation 27,680.2 30.2 -0.04 30,912.6 29.3 -0.01 37,817.4 26.3 -5.82
Total 91,536.3 100 -0.25 105,515.7 100 -0.77 143,828.7 100 -1.54
Final energy consumption by fuel Biofuels 26,923.3 29.7 4.32 25,908.1 24.8 0.30 25,017.7 17.6 0.10Coal and coke 13,509.2 14.9 -2.09 19,940.2 19.1 -8.61 42,082.5 29.5 0.71Electricity 15,256.5 16.8 6.51 18,976.1 18.1 13.59 32,752.1 23.0 5.84Natural gas 6,979.0 7.7 26.15 8,075.1 7.7 17.61 3,969.6 2.8 -45.88Oil and petroleum products
28,114.2 31.0 -10.88 31,752.8 30.3 -7.30 38,655.7 27.1 -2.55
Total 90,782.1 100 -0.25 104,652.4 100 -0.77 142,477.6 100 -1.54
Source: Authors.
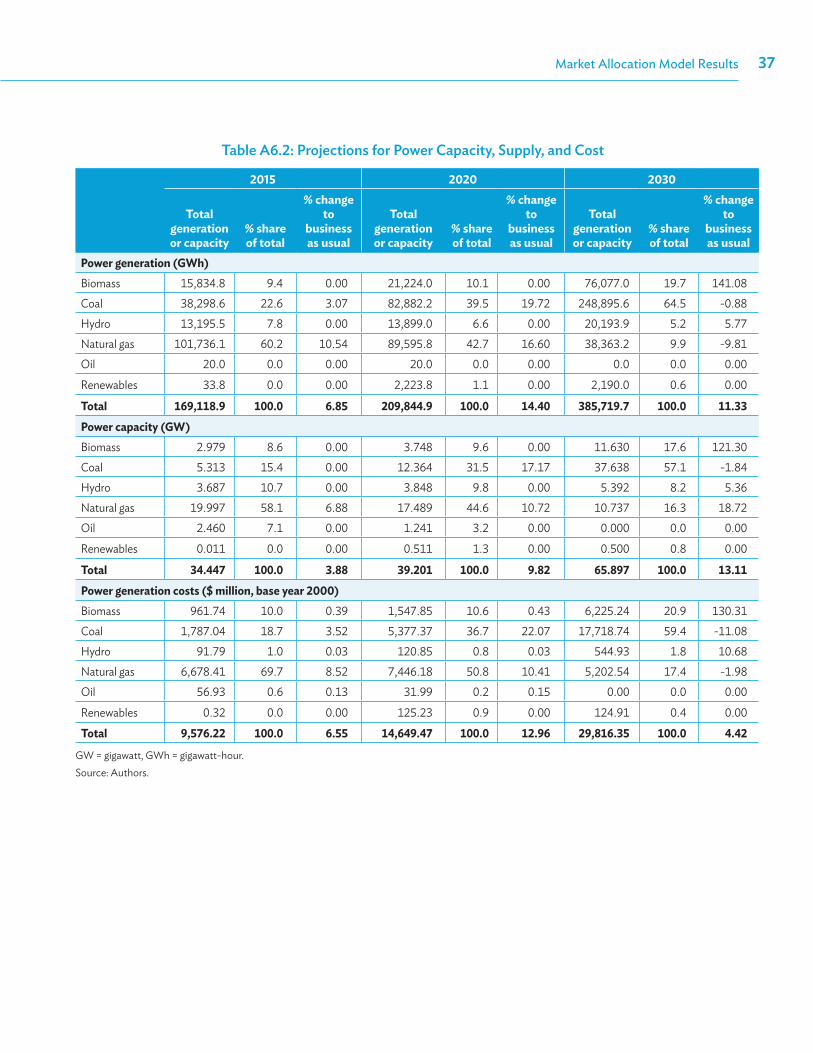
Market Allocation Model Results 37
Table A6.2: projections for power capacity, supply, and cost
2015 2020 2030
Total generation or capacity
% share of total
% change to
business as usual
Total generation or capacity
% share of total
% change to
business as usual
Total generation or capacity
% share of total
% change to
business as usual
Power generation (GWh)Biomass 15,834.8 9.4 0.00 21,224.0 10.1 0.00 76,077.0 19.7 141.08Coal 38,298.6 22.6 3.07 82,882.2 39.5 19.72 248,895.6 64.5 -0.88Hydro 13,195.5 7.8 0.00 13,899.0 6.6 0.00 20,193.9 5.2 5.77Natural gas 101,736.1 60.2 10.54 89,595.8 42.7 16.60 38,363.2 9.9 -9.81Oil 20.0 0.0 0.00 20.0 0.0 0.00 0.0 0.0 0.00
Renewables 33.8 0.0 0.00 2,223.8 1.1 0.00 2,190.0 0.6 0.00
Total 169,118.9 100.0 6.85 209,844.9 100.0 14.40 385,719.7 100.0 11.33Power capacity (GW) Biomass 2.979 8.6 0.00 3.748 9.6 0.00 11.630 17.6 121.30Coal 5.313 15.4 0.00 12.364 31.5 17.17 37.638 57.1 -1.84Hydro 3.687 10.7 0.00 3.848 9.8 0.00 5.392 8.2 5.36Natural gas 19.997 58.1 6.88 17.489 44.6 10.72 10.737 16.3 18.72Oil 2.460 7.1 0.00 1.241 3.2 0.00 0.000 0.0 0.00
Renewables 0.011 0.0 0.00 0.511 1.3 0.00 0.500 0.8 0.00
Total 34.447 100.0 3.88 39.201 100.0 9.82 65.897 100.0 13.11Power generation costs ($ million, base year 2000)Biomass 961.74 10.0 0.39 1,547.85 10.6 0.43 6,225.24 20.9 130.31Coal 1,787.04 18.7 3.52 5,377.37 36.7 22.07 17,718.74 59.4 -11.08Hydro 91.79 1.0 0.03 120.85 0.8 0.03 544.93 1.8 10.68Natural gas 6,678.41 69.7 8.52 7,446.18 50.8 10.41 5,202.54 17.4 -1.98Oil 56.93 0.6 0.13 31.99 0.2 0.15 0.00 0.0 0.00
Renewables 0.32 0.0 0.00 125.23 0.9 0.00 124.91 0.4 0.00
Total 9,576.22 100.0 6.55 14,649.47 100.0 12.96 29,816.35 100.0 4.42
GW = gigawatt, GWh = gigawatt-hour.Source: Authors.
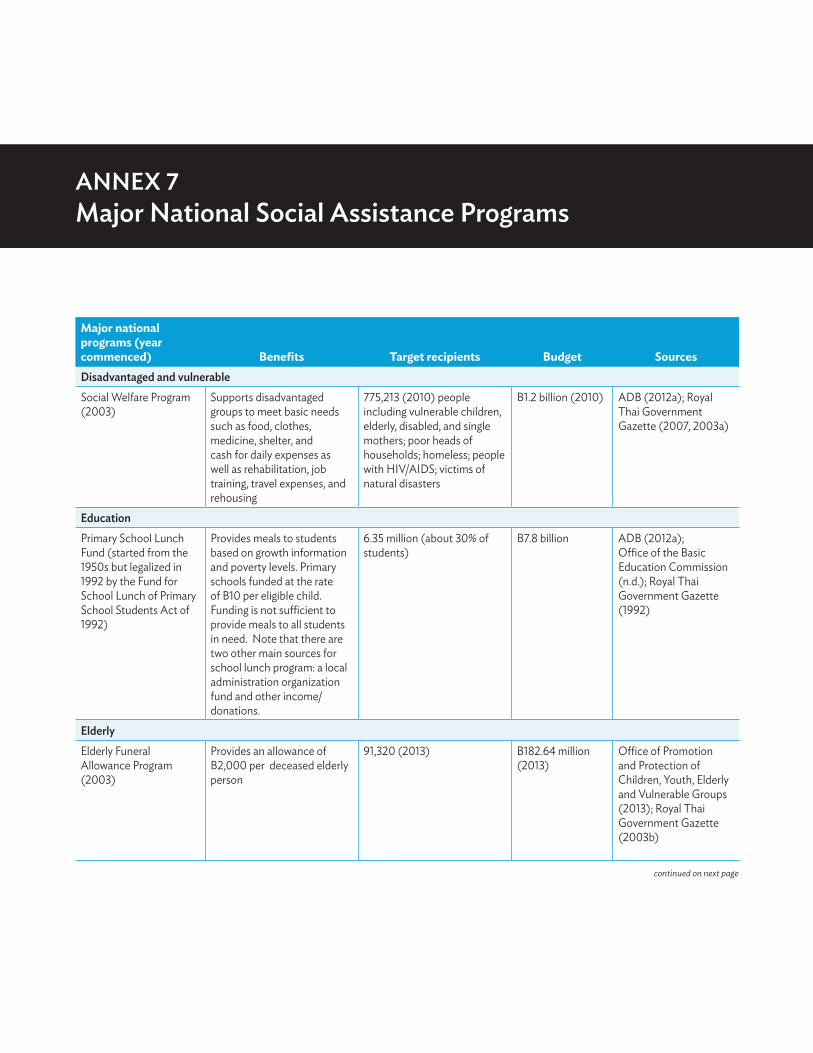
Annex 7major national social Assistance programs
Major national programs (year commenced) Benefits Target recipients Budget Sources disadvantaged and vulnerableSocial Welfare Program (2003)
Supports disadvantaged groups to meet basic needs such as food, clothes, medicine, shelter, and cash for daily expenses as well as rehabilitation, job training, travel expenses, and rehousing
775,213 (2010) people including vulnerable children, elderly, disabled, and single mothers; poor heads of households; homeless; people with HIV/AIDS; victims of natural disasters
B1.2 billion (2010) ADB (2012a); Royal Thai Government Gazette (2007, 2003a)
education Primary School Lunch Fund (started from the 1950s but legalized in 1992 by the Fund for School Lunch of Primary School Students Act of 1992)
Provides meals to students based on growth information and poverty levels. Primary schools funded at the rate of B10 per eligible child. Funding is not sufficient to provide meals to all students in need. Note that there are two other main sources for school lunch program: a local administration organization fund and other income/donations.
6.35 million (about 30% of students)
B7.8 billion ADB (2012a); Office of the Basic Education Commission (n.d.); Royal Thai Government Gazette (1992)
elderlyElderly Funeral Allowance Program (2003)
Provides an allowance of B2,000 per deceased elderly person
91,320 (2013) B182.64 million (2013)
Office of Promotion and Protection of Children, Youth, Elderly and Vulnerable Groups (2013); Royal Thai Government Gazette (2003b)
continued on next page
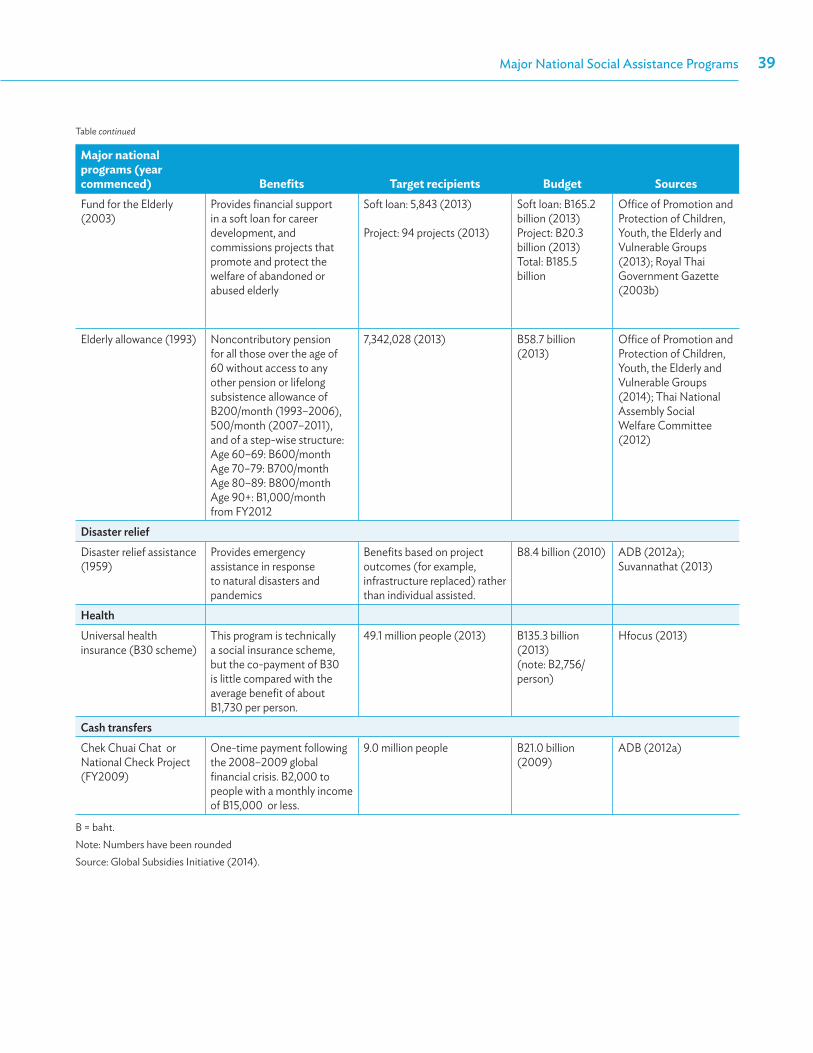
Major National Social Assistance Programs 39
Major national programs (year commenced) Benefits Target recipients Budget Sources Fund for the Elderly (2003)
Provides financial support in a soft loan for career development, and commissions projects that promote and protect the welfare of abandoned or abused elderly
Soft loan: 5,843 (2013)
Project: 94 projects (2013)
Soft loan: B165.2 billion (2013)Project: B20.3 billion (2013)Total: B185.5 billion
Office of Promotion and Protection of Children, Youth, the Elderly and Vulnerable Groups (2013); Royal Thai Government Gazette (2003b)
Elderly allowance (1993) Noncontributory pension for all those over the age of 60 without access to any other pension or lifelong subsistence allowance of B200/month (1993–2006), 500/month (2007–2011),and of a step-wise structure: Age 60–69: B600/month Age 70–79: B700/monthAge 80–89: B800/monthAge 90+: B1,000/monthfrom FY2012
7,342,028 (2013) B58.7 billion (2013)
Office of Promotion and Protection of Children, Youth, the Elderly and Vulnerable Groups (2014); Thai National Assembly Social Welfare Committee (2012)
disaster reliefDisaster relief assistance (1959)
Provides emergency assistance in response to natural disasters and pandemics
Benefits based on project outcomes (for example, infrastructure replaced) rather than individual assisted.
B8.4 billion (2010) ADB (2012a); Suvannathat (2013)
HealthUniversal health insurance (B30 scheme)
This program is technically a social insurance scheme, but the co-payment of B30 is little compared with the average benefit of about B1,730 per person.
49.1 million people (2013) B135.3 billion (2013) (note: B2,756/person)
Hfocus (2013)
cash transfersChek Chuai Chat or National Check Project (FY2009)
One-time payment following the 2008–2009 global financial crisis. B2,000 to people with a monthly income of B15,000 or less.
9.0 million people B21.0 billion (2009)
ADB (2012a)
B = baht.Note: Numbers have been roundedSource: Global Subsidies Initiative (2014).
Table continued
list of background papers
Global Subsidies Initiative (GSI). 2014. Assessment and Implications of Rationalizing and Phasing Out Fossil Fuel Subsidies. Report submitted to the Asian Development Bank Technical Assistance Project on Assessment and Implications of Rationalizing and Phasing Out Fossil Fuel Subsidies.
Reports prepared for the GSI study:
Hassler, J., J. Kurbatsch, G. Goldstein, S. Pradhan, and T. Kullack. 2014. Modeling of Subsidy Removal in the Energy Sector of Thailand for GSI Phase 3.
Leangcharoen. P. 2014. Thailand: Inventory of consumer subsidies for fossil fuels and electricity
Warr, P. 2014. Effects of Petroleum Subsidy Reform in Thailand
Wattanakuljarus, A. 2014. The Impacts of Fuel Subsidy Reforms in Thailand.
Wongsa. K. 2014. Inventory of Producers’ Subsidies for Natural Gas for Vehicles (NGV) in Thailand
Chattopadhyay, D. 2014. Energy Subsidies in Southeast Asia: Impact on Power Sector. Report submitted to the Asian Development Bank Technical Assistance Project on Assessment and Implications of Rationalizing and Phasing Out Fossil Fuel Subsidies.
references
Asian Development Bank (ADB). 2012a. Social Protection Index. Country reports from ADB Social Protection Index. http://spi.adb.org/spidmz/index.jsp (accessed November 2013).
—–—. 2012b. Asian Development Bank and Thailand. http://www.adb.org/sites/default/files/pub/2013/THA.pdf
———. Statistical Database System. https://sdbs.adb.org/sdbs/index.jsp (accessed November 2013).
Asian Institute of Technology. 2010. Energy Security in Thailand. School of Environment, Resources and Development. 2010: Prepared for Global Network on Energy for Sustainable Development.
Bacon, R., and M. Kojima. 2006. Coping with Higher Oil Prices. Washington, DC: World Bank.
Bird, K., K. Hattel, and E. Saski. 2011. Poverty, Income Inequality and Microfinance in Thailand. Manila: ADB.
Boonperm, J., J. Haughton, S. R. Khandker, and P. Rukumnuaykit. 2012. Appraising the Thailand Village Fund. Washington, DC: World Bank.
BP. 2012. BP Statistical Review of World Energy June 2012. http://www.bp.com/content/dam/bp/pdf/Statistical-Review-2012/statistical_review_of_world_energy_2012.pdf
Chaiprasithikul, S. 2013. Sustainable Energy Consumption in Developing Countries: An Analysis on Thailand’s Household Socio-Economic Survey. OIDA International Journal of Sustainable Development. 6 (3). pp. 63-70.
Chenphuengpawn, J. 2012. Deadweight Loss of Alternative Energy Pricing Policy. Applied Economics Journal. 19 (1). pp. 1-23.
Clements, B., D. Coady, S. Fabrizi, S. Gupta, T. Serge, C. Alleyne, and C.A. Sdralevich. 2013. Energy Subsidy Reform: Lessons and Implications. Washington, DC: International Monetary Fund.
Community Organizations Development Institute. 2013. Community Welfare Fund 2013. http://www.codi.or.th/index.php/news/documentary-communities-news/42-2009-09-22-05-47-57/2617-56-5-599-3-47 (in Thai).
Department of Energy. 2013. LPG Frequently Asked Questions. http://www1.lpg4u.net/FAQ.aspx (in Thai).
References42
Department of Local Administration. 2013. Number of LAOs Nation-wide. http://www.dla.go.th/work/abt/summarize.js (retrieved 25 March 2014).
Energy Fund Administration Institute. 2013. Data on estimated flow of funds to and from the Thai Oil Fund. Provided in response to a formal request by Kannika Thampanishyong, Thailand Development and Research Institute.
Energy Policy and Planning Office. 2013a. Energy Statistics: Petroleum. February. http://www.eppo.go.th/info/2petroleum_stat.htm
———. 2013b. Energy Statistics: Electricity. http://www.eppo.go.th/info/5electricity_stat.htm
———. 2013c. Oil Fund Levied on Petroleum Prices Weekly. http://www.eppo.go.th/info/8prices_stat.htm
Energy Policy and Planning Office. n.d. PPO Cast Light on LPG Cost – It Is Actually Higher than the Present Retail Price. Thai Energy News. http://202.44.52.249/thaienergynews/en/NewsHilightDetail.aspx?id=55
Futrakul, P. 2013. Interview by Kridtiyaporn Wongsa with the Vice President of the NGV Marketing Department. Personal interview (one-on-one meeting). PTT Headquarters, Bangkok. 26 July 2013.
Hfocus. 2013. 30 Baht Health Scheme: 2014 Annual Budget Proposal (in Thai). http://www.hfocus.org/content/2013/03/2684
Inmuong, U., J. Rayubkul, P. Srikuta, A.L. Bush. 2011. Survey of Rural Households in Huai Sai Bat Sub-River Basin Northeast Thailand, Exploring the Mekong Futures Project. Khon Kaen, Thailand: Khon Kaen University.
International Monetary Fund (IMF). 2008. Food and Fuel Prices—Recent Developments, Macroeconomic Impact, and Policy Responses. Washington, DC: IMF.
International Energy Agency (IEA). 2012. World Energy Outlook 2012. Paris: IEA.
International Labour Organization. 2013. Social Protection: Thailand. http://www.ilo.org/gimi/gess/ShowCountryProfile.do?cid=404
Jittungsakul, V. 2010. Training Documents from Bank of Thailand (in Thai). http://www.bot.or.th/Thai/AboutBOT/project/Northern/econ_Trainning/econ10-220410.pdf
Kiatfuengfoo, V. 2013. Interview by Kridtiyaporn Wongsa with the Director of Petroleum Business Group. Personal interview (one-on-one meeting), Energy Policy and Planning Office (EPPO), Ministry of Energy, Bangkok. 8 August 2013.
Leangcharoen, P., K. Thampanishvong, and T. Laan. 2013. A Citizens’ Guide to Energy Subsidies in Thailand. Geneva: Global Subsidies Initiative of the International Institute for Sustainable Development.
References 43
Muangkum, L. 2011. The Optimal Diesel Tax Rate in Thailand (in Thai). Bangkok: Kasetsart University Press.
Suvannathat, P. 2013. Does Prime Minister Hold Power to Grant Approval on Budget for Emergency and Necessary Causes? (in Thai). http://www.naewna.com/politic/columnist/8388 (accessed March 2014).
National Economic and Social Development Board. http://eng.nesdb.go.th/
National Statistical Office. 2011. Energy Consumption of Households 2011. http://web.nso.go.th/en/survey/env/data_env/551101_env11_executive.pdf
———. 2014. Thai Household Socio-Economic Survey 2011. Bangkok: National Statistical Office.
Office of the Basic Education Commission. n.d. Financing Primary School Lunch (in Thai). http://audit.obec.go.th/lunch/lunch.pdf
Office of Promotion and Protection of Children, Youth, the Elderly and Vulnerable Groups. 2013. Annual Report (in Thai). Bangkok.
———. 2014. Elderly Allowance Database (in Thai). http://oppo.opp.go.th/info/StatE_Allowance55-56.xls (retrieved March 2014, from Bureau of Empowerment for Older Persons).
Office of the Energy Regulatory Commission. 2013. Data provided in response to a formal request by P. Leangcharoen of the Electricity and Natural Gas Industry Regulatory Department and Power Development Fund Management Department, Bangkok.
Organisation for Economic Co-operation and Development (OECD). 2013. Southeast Asian Economic Outlook 2013: With Perspectives on [the People's Republic of] China and India. Paris: OECD.
———. International Development Statistics. http://stats.oecd.org/qwids/
Paitoonpong, S., A. Chawla., and N. Akkarakul. 2009. Social Protection in Thailand. Chapter 9 in M.G. Asher, S. Oum, and F. Parulian, eds. Social Protection in East Asia – Current State and Challenges. Jakarta: Economic Research Institute for ASEAN and East Asia.
Panprayad. N. 2014. Interview by Kridtiyaporn Wongsa. LAOs and social services. Telephone interview. February 2014.
Paweewun, O., and P. Arunmas. 2013. Impacts of Price Hikes Limited: Weak Spending Curbs Room for Pass-Through. Bangkok Post. 2 September.
Praiwan, Y. 2014. LPG Price Increases after Subsidy Ends. Bangkok Post. 3 December. http://www.bangkokpost.com/business/news/446846/lpg-price-increases-after-subsidy-ends
PTT Public Company (PTT). 2012. Annual Report 2012. Bangkok: PTT.
References44
Royal Thai Government Gazette. 1992. Act on Primary School Lunch Fund A.D. 1992. The Royal Thai Government Gazette, p. 96.
———. 2003a. Act on Promotion of Social Welfare A.D. 2003. The Royal Thai Government Gazette, 120 Section 94.
———. 2003b. Elderly Act A.D. 2003. The Royal Thai Government Gazette.
———. 2007. Act on Promotion of Social Welfare A.D. 2007. The Royal Thai Government Gazette, 124 Section 100, p. 12.
Ruangrong, P. 2012a. Power Tariff Structure in Thailand. Singapore: Energy Regulatory Commission of Thailand.
—–— . 2012b. Power Tariff Structure in Thailand. Presentation to the East Asia Summit “Energy Market Deregulation Reform” organized by the Economic Research Institute for ASEAN and East Asia. 23 October. http://www.eria.org/events/Power%20Tariff%20Structure%20in%20Thailand.pdf
Shrestha, R. M., S. Kumar, S. Martin, and A. Dhakal. 2008. Modern Energy Use by the Urban Poor in Thailand: A Study of Slum Households in Two Cities, Energy for Sustainable Development. Energy for Sustainable Development. 12 (3). pp. 5-13.
Singh, R. 2013. Energy Poverty in Developing Countries' Urban Poor Communities: Assessments and Recommendations. Report prepared for Global Network on Energy for Sustainable Development by The Energy and Resources Institue (TERI). Roskilde, Denmark.
Standard and Poor’s Rating Services. 2013. PTT Public Co. Ltd. http://ptt.listedcompany.com/misc/CR/20130510-PTT-SP-EN.pdf (retrieved 19 September 2013).
Sullivan, R. 2014. Thailand Raises LPG Prices for Transport Again. Interfax Natural Gas Daily. 21 October. http://interfaxenergy.com/gasdaily/article/13981/thailand-raises-lpg-prices-for-transport-again
Tangkitvanich, S., and C. Kansuntisukmongkol. 2007. Impacts from Oil Price Intervention Policy (in Thai). Bangkok: Thailand Development Research Institute.
Thai Rath. 2014. Department of Energy Business on LPG Price (in Thai). 7 February. http://www.thairath.co.th/content/eco/401886
Thai National Assembly Social Welfare Committee. 2012. Welfare for Elderly. http://www.parliament.go.th/ewtcommittee/ewt/welfare/download/article/article_20120516063121.pdf
The Nation. 2013. Household Use of LPG Drops 19%. 22 October. http://www.nationmultimedia.com/business/Household-use-of-LPG-drops-19-30217703.html
Theppatimakorn, P. 1996. Oil Price Liberalization: The Case of Thailand’s Office of National Energy Policy Council. Bangkok: Thammasat University Press.
References 45
US. Energy Information Administration. Countries. http://www.eia.gov/countries/ (accessed 25 June 2013).
Wattanakuljarus, A., and K. Wongsa. 2011. Carbon Tax and GHGs Emission Control: Options and Considerations for Thailand. Paper presented at the 4th International Conference on Sustainable Energy and Environment: A Paradigm Shift to Low Carbon Society. Bangkok, 23–25 November.
World Bank. Thailand Country Data. http://data.worldbank.org/country/thailand (accessed January 2014).
ASIAN DEVELOPMENT BANK
FOSSIL FuEL SuBSIDIES IN THAILANDTrENDS, IMPAcTS, AND rEFOrMS
AsiAn Development BAnk6 ADB Avenue, Mandaluyong City1550 Metro Manila, Philippineswww.adb.org
Fossil Fuel Subsidies in Thailand: Trends, Impacts, and reforms
Heavily dependent on imported energy sources, significant subsidies on fossil fuels present a heavy burden on public finances in Thailand. This study measures the size of fossil fuel subsidies such as tax breaks for diesel and natural gas, market price support for natural gas for vehicles, and free electricity for low-income consumers as well as the potential economic, energy, and environmental impacts of reducing them. With adequate reallocation of subsidy savings, the short-term adverse impacts of subsidy reform are shown to turn positive in the long term as households and industry respond to changing market realities by adjusting energy demand, supply, and production capacity. The study offers policy advice for sustainable energy use to help guide Thailand’s reform strategies.
About the Asian Development Bank
ADB’s vision is an Asia and Pacific region free of poverty. Its mission is to help its developing member countries reduce poverty and improve the quality of life of their people. Despite the region’s many successes, it remains home to the majority of the world’s poor. ADB is committed to reducing poverty through inclusive economic growth, environmentally sustainable growth, and regional integration.
Based in Manila, ADB is owned by 67 members, including 48 from the region. Its main instruments for helping its developing member countries are policy dialogue, loans, equity investments, guarantees, grants, and technical assistance.