forum energy technologies - · pdf fileforum energy technologies ... ‒ davis-lynch™...
TRANSCRIPT

Smart Solutions. Powerful Products. Confidential
Smart Solutions. Powerful Products. Smart Solutions. Powerful Products.
Forum Energy Technologies

Smart Solutions. Powerful Products. Confidential
Forward Looking Statements
The statements made during this presentation, including the answers to your questions,
include information that the Company believes to be forward-looking statements within
the meaning of the Private Securities Litigation Reform Act. Forward-looking statements
involve risk and uncertainties that may cause actual results or events to differ materially
from those expressed or implied in such statements. Those risks include, among other
things, matters that the Company has described in its earnings release and in its filings
with the Securities and Exchange Commission. The Company does not undertake any
ongoing obligation, other than that imposed by law, to publicly update or revise any
forward-looking statements to reflect future events, information, or circumstances that
arise after this presentation. In addition, this presentation contains time sensitive
information that reflects management's best judgment only as of the date of this
presentation.
2
Smart Solutions. Powerful Products. Confidential
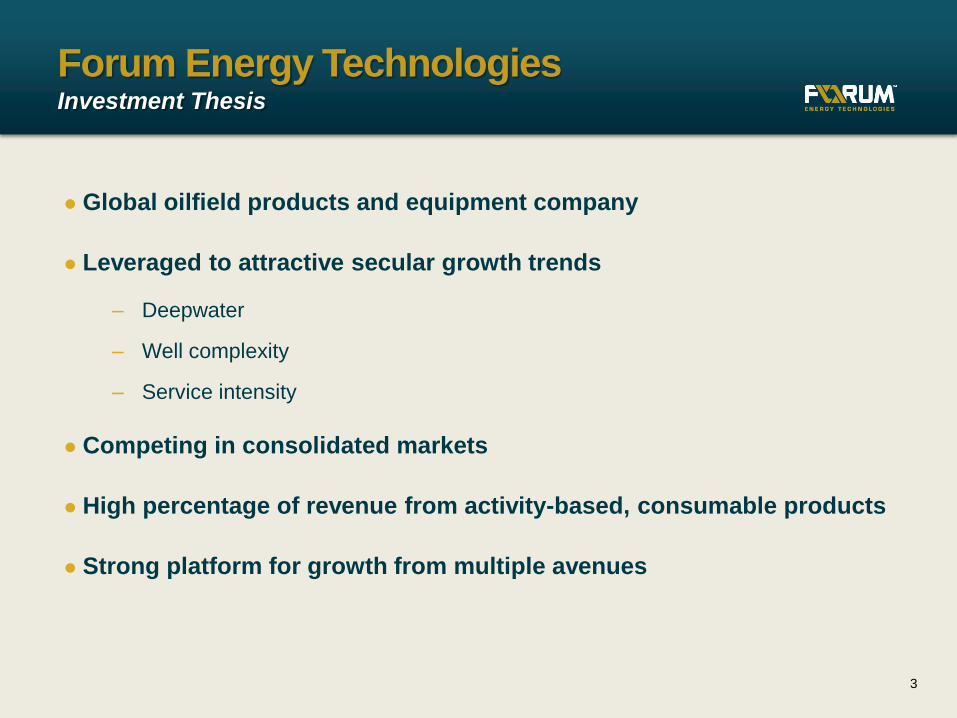
Global oilfield products and equipment company
Leveraged to attractive secular growth trends
‒ Deepwater
‒ Well complexity
‒ Service intensity
Competing in consolidated markets
High percentage of revenue from activity-based, consumable products
Strong platform for growth from multiple avenues
Forum Energy Technologies Investment Thesis
3

Smart Solutions. Powerful Products. Confidential
Subsea
Construction
&
Development
Well
Construction
& Completion
Production
Infrastructure
Stimulation &
Intervention
Markets and Key Customers We Serve Exposure to multiple large areas of industry spending
4
Drilling

Smart Solutions. Powerful Products. Confidential
Subsea
Technologies
Drilling
Technologies
Production
Equipment
Drilling and Subsea Production and Infrastructure
Valve
Solutions
Downhole
Technologies
Organized into two divisions, each focused on key industry growth trends
Six product lines aligned with customers and end-users
High percentage of revenue from activity-based, consumable products
Flow
Equipment
From the reservoir to the wellhead
On the drilling rig and below the surface
From wellhead to the refinery
In the production and transportation line
Organization
5
Subsea Drilling Completion Production Infrastructure

Smart Solutions. Powerful Products. Confidential
Leading provider of deepwater remote operating vehicles
Tooling, components & positioning systems
Strong secular trends in the deepwater
Deepwater Development Subsea capital equipment & downhole consumables
6
Subsea Technologies
Downhole Technologies
‒ Development activity growth
‒ ROV fleet renewal cycle
‒ Subsea pipeline, fiber-optic, and
offshore windfarms
Premium provider of offshore,
downhole well construction tools
Subsea Infrastructure Growth
Source: Pareto Securities Research, “E&P Survey,” August 2012
0
100
200
300
400
500
600
700
2008 2009 2010 2011 2012E 2013E 2014E 2015E
Su
bsea T
ree A
ward
s (
#)
0
2,000
4,000
6,000
8,000
10,000
12,000
14,000
16,000
18,000
20,000
Pip
eli
ne I
nsta
llati
on
(km
)
Subsea Production Trees Pipeline Installations rhs (km)

Smart Solutions. Powerful Products. Confidential
Leading brands of downhole tools
‒ Davis-Lynch™ cementing tools and Cannon™ protection systems
‒ Core focus on well integrity
Leveraged to well complexity trends
‒ Increasing number of highly deviated well paths
‒ Growth in downhole gauges, injections lines, ESP artificial lift
Rig capital equipment focused on tubular handling
‒ Rig upgrade and retrofit market
‒ Increased speed, automation, and safety around tubulars
Increasing Well Complexity Downhole consumables & drilling rig capital equipment
7
Downhole Technologies
Drilling Technologies

Smart Solutions. Powerful Products. Confidential
High wear rate consumables related to well stimulation
‒ Replacement treating iron and pressure control valves
‒ Recertification and refurbishment channel to market
Strong service intensity trends
‒ “Manufacturing of wells”
‒ Completion intensity: increasing lateral lengths & stages per well
‒ Drilling intensity: increasing wells drilled per rig per year
Drilling rig consumable products
‒ Manual and powered handling tools
Service Intensity Fracturing consumables & drilling rig consumables
8
Flow Equipment
Drilling Technologies

Smart Solutions. Powerful Products. Confidential
Broad offering of valves
Strong infrastructure tailwinds
‒ Pipeline Safety Act
‒ Canadian heavy oil sands process facilities
‒ Petrochemical complex revival
Oil and liquids need for surface process equipment
‒ Shift to liquids rich and oil basins
‒ High revenue per well opportunity
Unconventional Infrastructure Valves & production capital equipment
9
Valve Solutions
Production Equipment
Multi-well Production Systems

Smart Solutions. Powerful Products. Confidential
DRILLING SUBSEA
WELL
CONSTRUCTION
& COMPLETION
PRODUCTION
& PROCESS INFRASTRUCTURE
STIMULATION &
INTERVENTION
V&M segment PCS segment (NATCO) Surface Technologies
segment DPS segment
Subsea Technologies segment (ROVs)
Rig Technology segment
Oil & Gas segment
Competing in Consolidated Markets Focused on areas with few large, well capitalized competitors
ROVs & Related
Subsea Products & Services
Tubular Handling Tools & Equipment
Downhole Tools Consumable Flow
Iron & Related Services
Surface
Production Equipment
Up, Mid,
Downstream Valves
10

Smart Solutions. Powerful Products. Confidential
Products consumed or worn out during the well construction and completion process, or related
to the ongoing operation of large energy transmission and processing infrastructure
Purchases often associated with our customers’ operating expense budgets
Weighted Towards Consumables Activity-based revenue drivers
Consumable Products & Aftermarket
53%
Capital Products & Equipment
40%
Rental 4%
Other 3% Downhole
Technologies
Valve
Solutions
Flow
Equipment
Drilling
Technologies
Subsea
Technologies
Production
Equipment
Capital Equipment
Orientation
Consumable
Products Orientation
Mix of Consumables
& Capital Equipment
11 Note: Chart shows pro-forma for all acquisitions closed during 2011, as a % of the aggregate revenue for 2011.
Percent of 2011 Pro Forma Revenue

Smart Solutions. Powerful Products. Confidential
Multiple avenues of growth across our lines of business
‒ Market share gains
‒ New product commercialization
‒ Geographic expansion: Bakken, Brazil, Australia, etc.
Productivity improvements in manufacturing, distribution and supply chain
Long term enhancement of revenue driver mix
‒ Increase international and offshore content
‒ Preserve mix of consumable products versus capital equipment
Complementary acquisition program
Growth Company Focused on organic growth prospects
12

Smart Solutions. Powerful Products. Confidential
Subsea
Technologies
Drilling
Technologies
Downhole
Technologies
Flow
Equipment
Production
Equipment
Drilling and Subsea Segment
Production and Infrastructure Segment
Valve
Solutions
Subsea Drilling Completion Production Infrastructure
Focused Acquisition Program M&A as a strategic core competency
Significant acquisition program in 2011
‒ Created two new business lines to gain exposure to the growth trend in the completions sector
‒ Extended our subsea and drilling offering with three acquisitions
Ongoing program
‒ Product line extensions within our existing six business lines
‒ Value oriented with compelling opportunity to enhance acquired business
‒ Focused on the subsea and completion areas, with emphasis on international market opportunities
13

Smart Solutions. Powerful Products. Confidential
3nd Quarter 2012 Results (unaudited) Solid growth with strong margins ($ Millions)
YTD Revenue & EBITDA Margin % Quarterly Revenue & EBITDA Margin %
$331
$374 $348
21.7% 22.1%
21.6%
0%
5%
10%
15%
20%
25%
$0
$50
$100
$150
$200
$250
$300
$350
$400
$450
$500
3Q 2011 2Q 2012 3Q 2012
EB
ITD
A M
arg
in %
Re
ve
nu
e
Note: EBITDA is a non-GAAP financial measure. See reconciliation of EBITDA to Net Income in the appendix.
14
$791
$909
$1,085
17.2%
20.3%
22.1%
0%
5%
10%
15%
20%
25%
$0
$200
$400
$600
$800
$1,000
$1,200
YTD 9/30/11 YTD 9/30/11 PF YTD 9/30/12
EB
ITD
A M
arg
in %
Re
ve
nu
e
US Land Rigs 1,945 1,959 1,905

Smart Solutions. Powerful Products. Confidential
Capitalization Strong balance sheet to support growth initiatives
15
Initial public offering priced on April 11, 2012 and raised $257 million net proceeds
Concurrent private placement of $50 million
Total Net Capitalization ($millions) Sept. 30, 2012
Debt
$600mm Revolver, Oct 2016 $14
$300mm Term Loan, Oct 2016 300
Other debt (cap leases, etc.) 4 Total Debt $318
Shareholders Equity 1,129
Total Capitalization $1,447
Less: Cash on hand 18
Total Net Capitalization $1,429
Common Shares Outstanding (mm) 87
Credit Statistics
Net Debt $300
Net Capitalization Ratio 21%
Net Debt / TTM EBITDA 1.0x

Smart Solutions. Powerful Products. Confidential
Summary Large cap capabilities, small cap growth
16
Global oilfield products and equipment company
Leveraged to attractive secular growth trends
‒ Deepwater
‒ Well complexity
‒ Service intensity
Competing in consolidated markets
High percentage of revenue from activity-based, consumable products
Strong platform for growth from multiple avenues

Smart Solutions. Powerful Products. Confidential
Smart Solutions. Powerful Products. Smart Solutions. Powerful Products.
Questions?

Smart Solutions. Powerful Products. Confidential
Smart Solutions. Powerful Products. Smart Solutions. Powerful Products.
Appendix
Rescue Submarine VMAX™ Simulation Station

Smart Solutions. Powerful Products. Confidential
Subsea 18%
Drilling Capital
Equipment 8%
Drilling Consumables
18% Well Construction & Completion
11%
Stimulation & Intervention
16%
Production 15%
Infrastructure 14%
Land 76%
Offshore 24%
Sources of Revenue As a percent of 2011 pro forma sales
Note: Charts show pro-forma for all acquisitions closed during 2011, as a % of the aggregate revenue for 2011.
Purchase Cycle
Well Cycle Land / Offshore
Geography
Consumable, Parts &
Aftermarket 53%
Capital Products & Equipment
40%
Rental 4%
Other 3%
19
United States 61%
Europe Africa 14%
Canada 9%
Asia Pacific 8%
Latin America
4%
Middle East 4%

Smart Solutions. Powerful Products. Confidential ROV Components
Drilling & Subsea Division Subsea Technologies
Specialty Vehicles
Tether
Management
Systems
Largest range of
ROVs in industry
Perry™ and Sub-Atlantic™
ROV Technology
ROVDrill™ Subsea Coring Tool
VMax™ Simulation Systems
Global ROV Market (Douglas Westwood)
Source: (1) Douglas-Westwood, “The World ROV Market Report 2011-2015” 20
0
20
40
60
80
100
120
140
160
180
2006 2007 2008 2009 2010 2011 2012 2013 2014 2015
RO
V D
ay
s (
00
0s
)
$0
$200
$400
$600
$800
$1,000
$1,200
$1,400
$1,600
$1,800
RO
V E
xp
en
dit
ure
($ M
illio
ns)
RM: Re pa ir & Ma inte na nc e
DS: Subse a DV We lls
DS: E&A We lls
CS: Trunkline Insta lla tion
CS: FPSO Mooring & Rise rs
CS: Subse a Proc e ssing
CS: TMFJ
CS: Umbilic a ls & Flowline s
CS: Subse a Tre e s
ROV Expe nditure

Smart Solutions. Powerful Products. Confidential
Subsea Technologies Widest range of remote operating vehicles in the industry
21
Smart Solutions. Powerful Products. Confidential
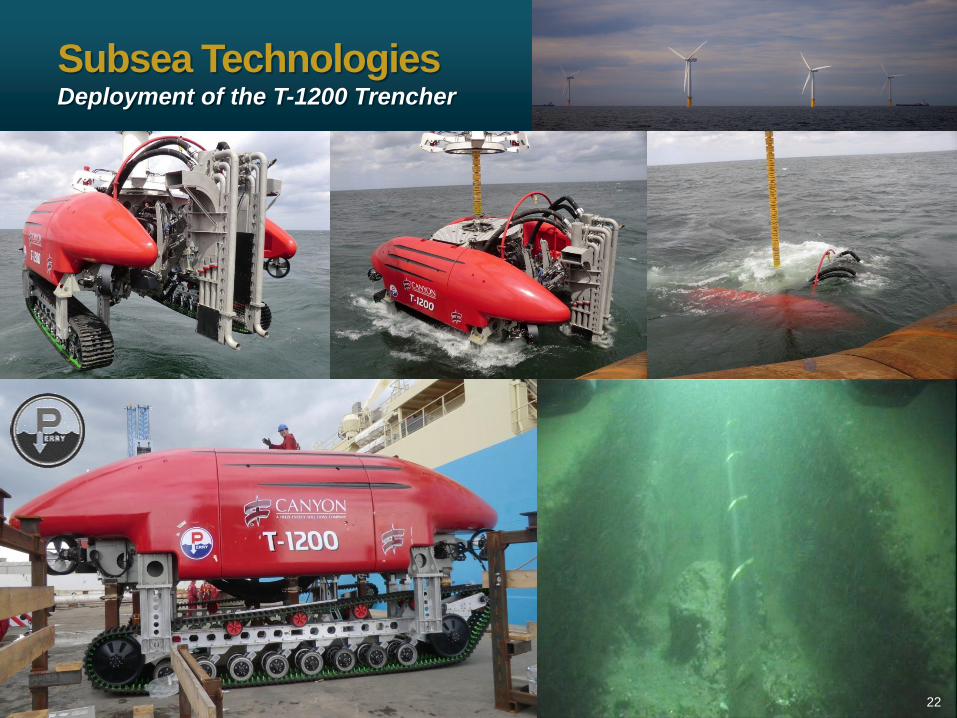
Subsea Technologies Deployment of the T-1200 Trencher
22

Smart Solutions. Powerful Products. Confidential
Drilling & Subsea Division Drilling Technologies
XL Backsaver
P-Quip™ mud pump
liner retention system
1,000 ton hydraulic elevator
125 ton air spider
Casing slip
Drilling Consumable Product Suite
Drill pipe float valve
Mousehole tool
Wrangler™ Roughneck
Wrangler™ Catwalk
AMC™ torque machines
Mission Critical Drilling Capital Equipment
Offline Activity Crane
Fluid end parts
23
Smart Solutions. Powerful Products. Confidential
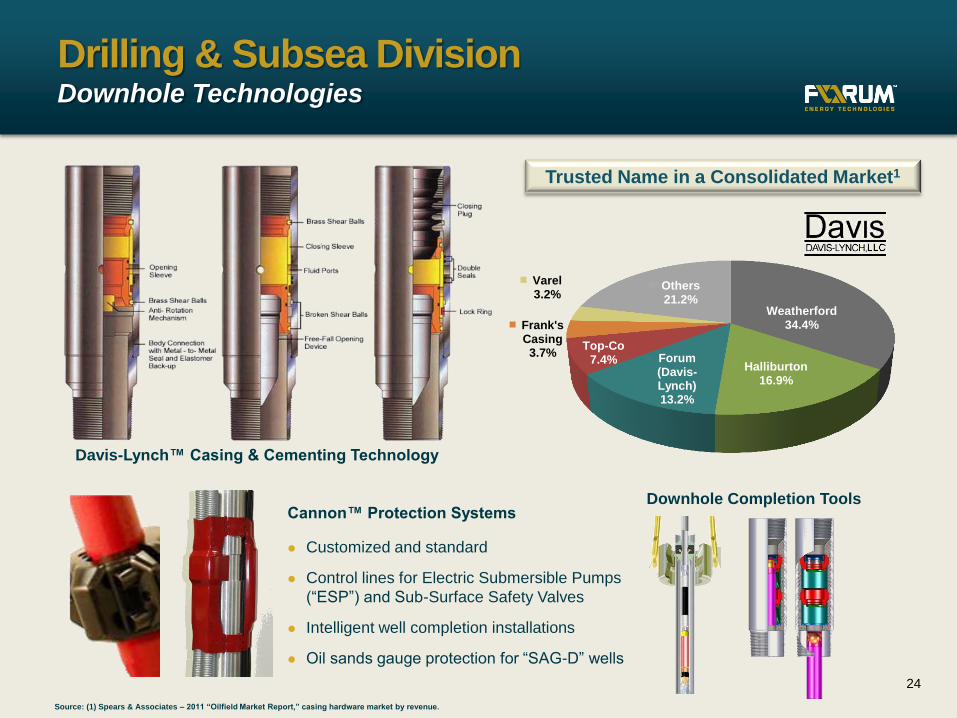
Davis-Lynch™ Casing & Cementing Technology
Drilling & Subsea Division Downhole Technologies
Cannon™ Protection Systems
Customized and standard
Control lines for Electric Submersible Pumps
(“ESP”) and Sub-Surface Safety Valves
Intelligent well completion installations
Oil sands gauge protection for “SAG-D” wells
Downhole Completion Tools
Source: (1) Spears & Associates – 2011 “Oilfield Market Report,” casing hardware market by revenue.
Trusted Name in a Consolidated Market1
24
Weatherford 34.4%
Halliburton 16.9%
Forum (Davis-Lynch) 13.2%
Top-Co 7.4%
Frank's Casing 3.7%
Varel 3.2%
Others 21.2%

Smart Solutions. Powerful Products. Confidential
Production & Infrastructure Division Production Equipment
Far left: Desoto compression
station in KS
2nd left: Edge Desal
technology
Far right: Line of heater
treaters
25

Smart Solutions. Powerful Products. Confidential
Production Equipment Multi-well production equipment battery for Chevron
26
Heater Treater
Well Manifold
Production Separator Gas
Scrubber
Test Separators

Smart Solutions. Powerful Products. Confidential
Two piece trunnion valves for the shale markets
Production & Infrastructure Division Valve Solutions
Specified ball valve of choice for the US Strategic Petroleum Reserve
Preferred valve supplier to leading Canadian oil sands producers 27

Smart Solutions. Powerful Products. Confidential 28
Production & Infrastructure Division Flow Equipment
28

Smart Solutions. Powerful Products. Confidential
Cris Gaut, Chairman & CEO
President (Drilling & Evaluation), CFO – Halliburton
Co-COO & CFO – ENSCO
Charles Jones, President of Drilling and Subsea
President & CEO – Forum Oilfield Technologies
COO - Hydril
Wendell Brooks, President of Production and Infrastructure
President & CEO – Allied Technology
Group Director Well Support – Wood Group
James Harris, Chief Financial Officer
CFO – Forum Oilfield Technologies
Controller – Baker Hughes
Jim McCulloch, General Counsel
General Counsel – GlobalSantaFe
Senior Management Executive team has an average of 30+ yrs of industry experience
29

Smart Solutions. Powerful Products. Confidential
Cris Gaut, FET Chairman & CEO
‒ President (Drilling & Evaluation) and
CFO – Halliburton
‒ ENSCO
Franklin Myers
‒ Chief Financial Officer, Cameron
‒ General Counsel, Baker Hughes
Evelyn Angelle, Halliburton
‒ Chief Accounting Officer,
Halliburton
‒ Ernst & Young
Louis A. Raspino
‒ President & CEO, Pride International
‒ Sr VP & CFO, Grant Prideco
David Baldwin, SCF Partners
‒ Managing Director, SCF Partners
‒ Union Pacific Drilling
John Schmitz, Select Energy Services
‒ Chairman & CEO, Select Energy
Services
‒ HEP Oil Company
John A. Carrig
‒ President & COO, ConocoPhillips
‒ Chief Financial Officer, Conoco
Phillips
Terence O’Toole, Tinicum
‒ Managing Member, Tinicum
Partnership
‒ Goldman, Sachs & Co.
Mike McShane, Advent International
‒ President & CEO, Grant Prideco
‒ BJ Services Company
Andrew L. Waite, SCF Partners
‒ Managing Director, SCF Partners
‒ Simmons & Company
‒ Royal Dutch Shell
Board of Directors
30

Smart Solutions. Powerful Products. Confidential
Non-GAAP Measures
This presentation contains “non-GAAP financial measures” as defined in Item 10 of Regulation S-K of the
Securities Exchange Act of 1934. The non-GAAP financial measures reflect earnings before interest, taxes,
depreciation and amortization expense (“EBITDA”). A reconciliation of EBITDA to the most directly
comparable financial measures calculated and presented in accordance with Generally Accepted
Accounting Principles in the United States (“GAAP”) is included in the appendix of this presentation. The
Company believes the presentation of EBITDA is useful to the Company's investors because EBITDA is an
appropriate measure of evaluating the Company's operating performance and liquidity that reflects the
resources available for strategic opportunities including, among others, investing in the business,
strengthening the balance sheet, repurchasing the Company's securities and making strategic acquisitions.
In addition, EBITDA is a widely used benchmark in the investment community.
The presentation of this additional information is not meant to be considered in isolation or as a substitute
for the Company's financial results prepared in accordance with GAAP.
31

Smart Solutions. Powerful Products. Confidential
Reconciliation of Non-GAAP Measures
32
Forum Energy Technologies, Inc.
Reconciliation of GAAP to non-GAAP financial information
Three Months Ended
Sept 30, Sept 30, June 30, 2012 2011 2012
(in millions of dollars) Actual Actual Actual
EBITDA Reconciliation
Net Income attributable to common stockholders $40.9 $35.5 $44.1
Interest expense 3.6 6.0 3.6
Depreciation and amortization 13.0 11.6 13.3
Income tax expense 17.6 18.8 21.7
EBITDA $75.1 $71.9 $82.7
Nine Months Ended
Sept 30, Sept 30,
2012 2011
(in millions of dollars) Actual Actual Pro Forma
EBITDA Reconciliation
Net Income attributable to common stockholders $127.5 $61.6 $80.0
Interest expense 13.0 13.7 26.8
Depreciation and amortization 38.1 27.9 35.3
Income tax expense 61.2 33.2 42.4
EBITDA $239.8 $136.4 $184.5