fortune minerals - september 2014 investor presentation
DESCRIPTION
September 2014 Investor PresentationTRANSCRIPT

1
Investor PresentationSeptember 2014

This management presentation (the “presentation”) was prepared as a summary overview of current information about Fortune Minerals Limited (the “Company”) only and is not a prospectus or other offering document intended to provide investors with the information required to make investment decisions. This presentation does notpurport to contain full and complete information about the Company and its operations and recipients of this information are advised to review the Company’s public disclosure, available on SEDAR at www.sedar.comunder the Corporate Profiles heading for full and complete information about the Company.
This presentation contains certain information and statements that constitute “forward-looking statements” or “forward-looking information” including “financial outlook”, as such terms are defined under applicable Canadian and United States securities laws. These statements are subject to certain risks and uncertainties that could cause actual results to differ materially from those included in the forward-looking information and financial outlook. All statements or information other than statements or information of historical fact may constitute forward-looking information and financial outlook. These statements and information are only predictions.
Actual events or results may differ materially. In addition, this presentation may contain forward-looking information attributed to third party industry sources. Undue reliance should not be placed on the forward-looking information and financial outlook, as there can be no assurance that the plans, intentions or expectations upon which this information is based will occur. By its nature, forward-looking information (which includes financial outlook) involves numerous assumptions, known and unknown risks and uncertainties, both general and specific, that contributetothe possibility that the predictions, forecasts, projections made will not occur.
Specific forward-looking information contained in this presentation includes, among others, statements regarding: the anticipated completion of the acquisition of 100% of the Revenue Silver Mine (the “RSM”); the anticipated IRR, NPV, cash flow, cash costs and mine life for the RSM; the potential to produce copper concentrate at the RSMfor sale to the Asian market and negotiate recovery of other metals produced at the RSM; the potential to expand resources, production and extend mine life at the RSM; the planned ramp-up of the mill at the RSM; the anticipated timing of production at the RSM and the NICO Project; metal recoveries and products to be generated by the Company’s Saskatchewan Metals Processing Plant (the “SMPP”); the expected capital and operating costs for the NICO Project and the SMPP; Company’s anticipated revenues and internal rateof return from the NICO Project; and the Company’s future developments plans for, and anticipated mine life of, its ArctosAnthracite Project and the Company’s strategy with respect to the development and potential expansion of its projects. The financial outlook with respect to the RSM, the NICO Project and the ArctosAnthracite Project contained in this presentation at pages 13 and 14, 36 and 37, and 44, respectively, is derived from the PEA included in the SRK Technical Report, the feasibility report included in the Micon Technical Report and the feasibility report included in the Marston Technical Report, respectively, each of which was prepared for strategic planning purposes, and is not appropriate for any other purpose.
With respect to forward-looking information and financial outlook contained in this presentation, the Company has made assumptions (including those assumptions set forth in certain pages of this presentation regarding, among other things: the Company’s ability to obtain the necessary financing to complete the RSM acquisition, and to develop and operate the NICO Project; expected production and associated costs being in line with estimates; the Company’s ability to fund future staged payments for the RSM acquisition from the mine’s cash flow and/or external sources; the RSM mill having the ability to process at rate of 400 tons per day, the Company’s ability to expand production in the future; the ability to increase capital spending as necessary in the circumstances; and the production potential of its properties and properties to be acquired being consistent with its expectations.
Some of the risks that could affect the Company’s future results and could cause results to differ materially from those expressed in the Company’s forward-looking information and financial outlook include: the inherent risks involved in the exploration and development of mineral properties and in the mining industry in general;the risk that the Company may not be able to arrange the necessary financing to complete the acquisition of the RSM or to develop, construct and operate the NICO Project and the SMPP; uncertainties with respect to the receipt or timing of required permits for the development of the NICO Project, the SMPP and the ArctosAnthracite Project; the possibility of delays in the commencement of production from the RSM and/or the NICO Project; the possible inability of the RSM mill to process up to 400 tons per day; unexpected delays in the ramp-up of the RSM and associated delays in the production of silver; the risk that the operating and/or capital costs for any of the Company’sprojects may be materially higher than anticipated; the risk of decreases in the market prices of the metals to be produced by the Company’s projects; loss of key personnel; discrepancies between actual and estimated production; discrepancies between actual and estimated mineral resources or between actual and estimated metallurgical recoveries; uncertainties associated with estimating mineral resources and even if such resources prove accurate the risk that such resources may not be converted into mineral reserves, once economic conditions are applied; labour shortages; mining accidents; the cost and timing of expansion activities; changes in applicable laws or regulations; competition for, among other things, capital and skilled personnel; unforeseen geological, technical, drilling and processing problems; compliance with and liabilities under environmental laws andregulations; changes to the Company’s current business strategies and objectives; and other factors, many of which are beyond the Company’s control. In addition, the risk factors described or referred to in the Company’s Annual Information Form for the year ended December 31, 2013, which is available on the SEDAR website under the heading Corporate Profiles, should be reviewed in conjunction with the information contained in this presentation.
The financial outlook and forward-looking information contained herein, speak only as of the date of this presentation. Except as required by law, the Company and its subsidiaries do not intend, and do not assume any obligation, to update the financial outlook and forward-looking information contained herein.
This presentation does not constitute an offer to sell or a solicitation of an offer to buy nor shall there be any sale of any of the securities in any jurisdiction in which such offer, solicitation or sale would be unlawful. The Company’s securities have not been and will not be registered under the United States Securities Act of 1933, as amended (the"U.S. Securities Act"), or the securities laws of any state of the United States and will not be offered or sold within the United States or to or for the account or benefit of a U.S. Person or a person in the United States (as such terms are defined in Regulation S under the U.S. Securities Act) unless registered under the U.S. Securities Act and applicable state securities laws or pursuant to an exemption from such registration requirements.
2

The scientific and technical information with respect to the RSM contained in this presentation is based on the technical report dated July 23, 2014 prepared by SRK Consulting entitled “NI 43-101 Technical Report Preliminary Economic Assessment The Revenue Mine, Sneffels, Colorado” (the “SRK Technical Report”) which includes a preliminary economic assessment (the “SRK PEA”), a copy of which is available for review on SEDAR at www.sedar.com under the Company’s profile. The SRK Technical Report was authored byDorinda Bair, BSc Geology, CPG, Principal Consultant (Geology), James M. Beck, BscMining Engineering, PE, SRK Associate Consultant (Environmental), Mark K Jorgensen, BSc Chemical Engineering, SRK Associate Consultant (Metallurgy), and Joanna Poeck, BEng Mining, Senior Consultant (Mining Engineer), all of whom are Qualified Persons for the purposes of National Instrument 43-101 (“NI 43-101”). The SRK Technical Report was also subject to peer review as part of SRK’s own internal process by Bret Swanson, BEng Mining, Principal Consultant (Mining Engineer).
The SRK PEA is preliminary in nature and includes inferred mineral resources that are considered too speculative geologically tohave economic considerations applied to them that could enable them to be categorized as mineral resources. There is no certainty that the SRK PEA will be realized.
The scientific and technical information with respect to the NICO Project contained in this presentation is based on the technical report dated May 5, 2014 prepared by MiconInternational entitled “Technical Report on the Feasibility Study for the NicoGold-Cobalt-Bismuth-Copper Project, Northwest Territories, Canada” (the “MiconTechnical Report”) prepared by Harry Burgess, P.Eng., Richard M. Gowans, P.Eng., B. Terrence Hennessey, P.Geo., Christopher R. Lattanzi, P.Eng. and Eugene Puritch, P.Eng., the qualified persons for the purposes of NI 43-101, a copy of which is available for review on SEDAR at www.sedar.com under the Company’s profile.
Except as other wise set forth herein, the scientific and technical information with respect to the ArctosAnthracite Project contained in this presentation is based on the technical report dated November 28, 2012 prepared by Golder Associates entitled “Technical Report on the 2012 update of the ArctosAnthracite Project Mine Feasibility Study” prepared by Edward H. Minnes, P.E., the qualified person for purposes of NI 43-101, a copy of which is available for review on SEDAR at www.sedar.com under the Company’s profile.
Mineral resources referred to herein are not mineral reserves and do not have demonstrated economic viability. There is no certainty that all or any part of the mineral resources estimated will be converted into mineral reserves. The mineral resource estimates include inferred mineral resources that are normally considered too speculative geologically to have economic considerations applied to them that would enable them to be categorized as mineral reserves. There is also no certainty that inferred mineral resourceswill be converted to measured and indicated categories through further drilling, or into mineral reserves, once economic considerations are applied. Mineral resource tonnage and contained metal asdisclosed herein have been rounded to reflect the accuracy of the estimate, and numbers may not add due to rounding.
The disclosure of scientific and technical information contained in this presentation has been approved by Robin Goad, M.Sc.,P.Geo., President and Chief Executive Officer of Fortune Minerals Limited, who is a “Qualified Person” under NI 43-101
3
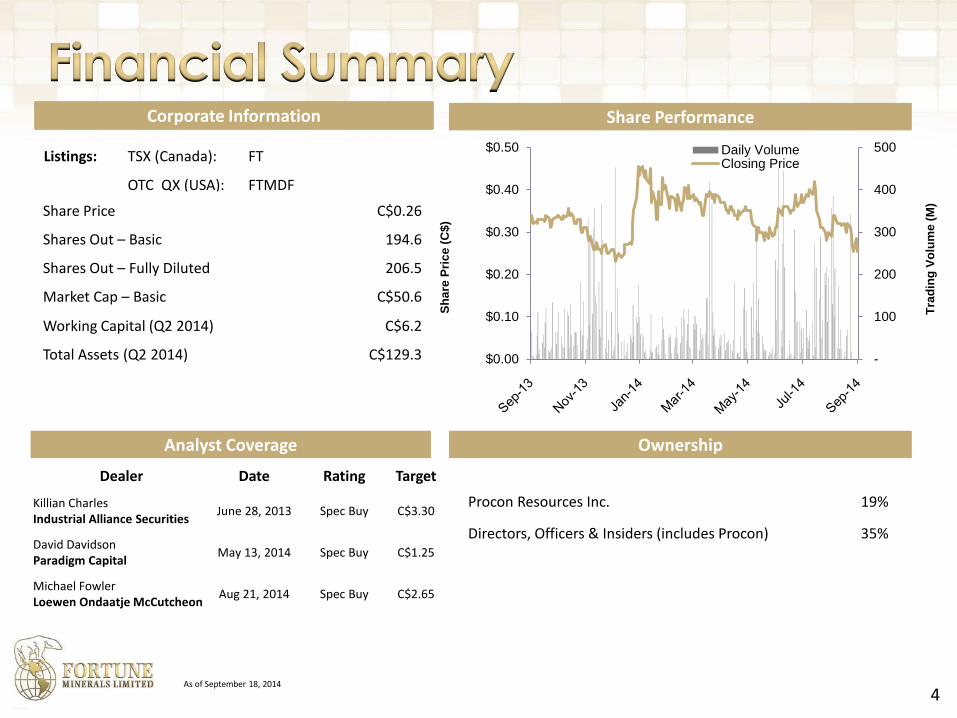
Corporate Information
Listings: TSX (Canada): FT
OTC QX (USA): FTMDF
Share Price C$0.26
Shares Out – Basic 194.6
Shares Out – Fully Diluted 206.5
Market Cap – Basic C$50.6
Working Capital (Q2 2014) C$6.2
Total Assets (Q2 2014) C$129.3
Share Performance
Analyst Coverage
Dealer Date Rating Target
Killian CharlesIndustrial Alliance Securities
June 28, 2013 Spec Buy C$3.30
David DavidsonParadigm Capital
May 13, 2014 Spec Buy C$1.25
Michael FowlerLoewen Ondaatje McCutcheon
Aug 21, 2014 Spec Buy C$2.65
Ownership
Procon Resources Inc. 19%
Directors, Officers & Insiders (includes Procon) 35%
As of September 18, 2014
4
Sh
are
Pri
ce
(C
$)
Tra
din
g V
olu
me
(M
)
-
100
200
300
400
500
$0.00
$0.10
$0.20
$0.30
$0.40
$0.50 Daily VolumeClosing Price

Headquartered in London, Ontario, Canada
Operating in mining friendly jurisdictions
Strong management team with proven records
Revenue Silver Mine
Historical 15 million oz silver producer in southwest Colorado, U.S.A.
Mine in advanced stages of commissioning & ramping up to 400 tons per day
Two late-stage projects
NICO Gold-Cobalt-Bismuth-Copper Project, Northwest Territories (NT) & Saskatchewan (SK)
Positive Feasibility & FEED Studies
Environmental Assessments (EA) approvals received
Arctos Anthracite Project, British Columbia (BC)
Positive Feasibility Study
BC EA process in progress
Combined Pre-Tax NPV approaching $ 1 billion
5

6
Revenue Mine38 M ozs Ag Eq.
contained
• Fully permitted & constructed underground high grade silver mine & mill with byproduct gold, lead & zinc
• In commissioning & ramping up to 400 tons per day • Historical production of ~15 M ozs of silver 1876 - 1912
NICO ProjectOver 1 M ozs Au plus
cobalt, bismuth & copper
• Late stage vertically integrated development project comprised of mine & concentrator in Northwest Territories (NT) & refinery in Saskatchewan (SK)
• Cobalt chemicals for rechargeable batteries & bismuth to replace lead • Positive Feasibility Study, test mining, pilot plant & EA’s completed• Financing targeting strategic partner investment & project level loan
Arctos ProjectWorld-class
metallurgical coal deposit
• One of world’s premier metallurgical coal developments• Joint Venture partner POSCO, one of the world’s largest steel producers,
committed to investing $181 million in the project• Strategic options process underway to determine optimal strategy
More than $250 million invested in Fortune’s key North American assets
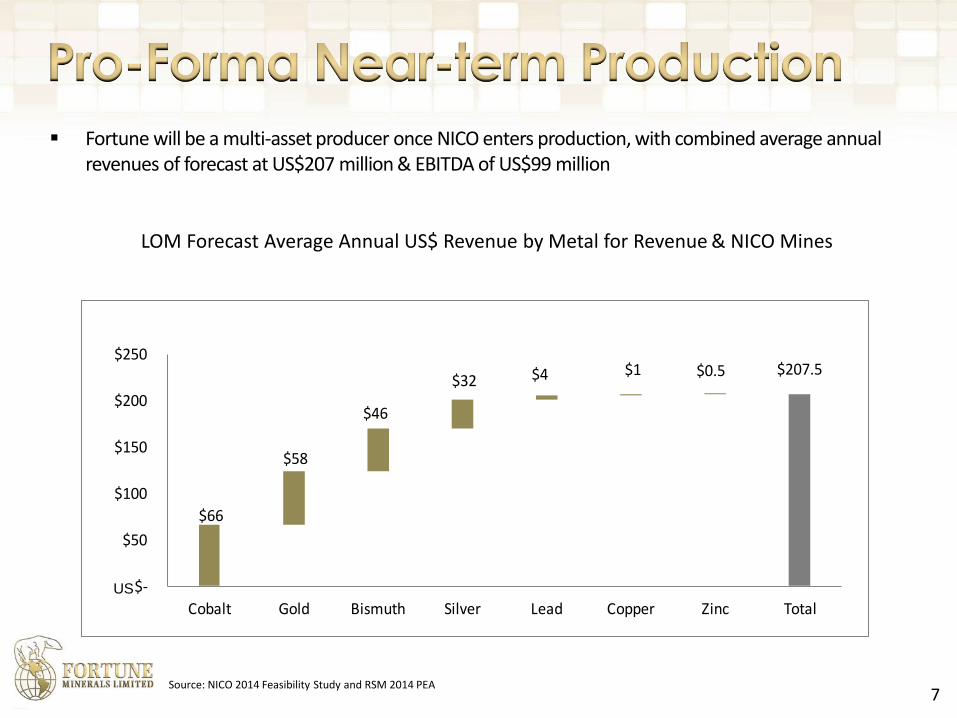
$207.5
$66
$58
$46
$32 $4 $1 $0.5
$-
$50
$100
$150
$200
$250
Cobalt Gold Bismuth Silver Lead Copper Zinc Total
Fortune will be a multi-asset producer once NICO enters production, with combined average annual revenues of forecast at US$207 million & EBITDA of US$99 million
7
LOM Forecast Average Annual US$ Revenue by Metal for Revenue & NICO Mines
US
Source: NICO 2014 Feasibility Study and RSM 2014 PEA
8
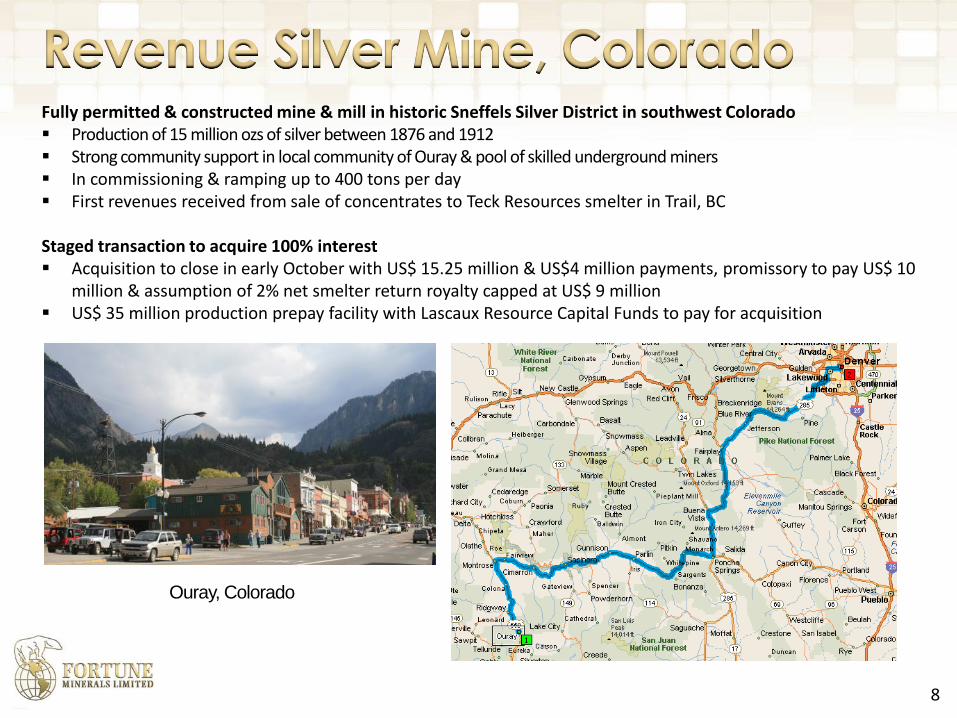
Fully permitted & constructed mine & mill in historic Sneffels Silver District in southwest Colorado Production of 15 million ozs of silver between 1876 and 1912 Strong community support in local community of Ouray & pool of skilled underground miners In commissioning & ramping up to 400 tons per day First revenues received from sale of concentrates to Teck Resources smelter in Trail, BC
Staged transaction to acquire 100% interest Acquisition to close in early October with US$ 15.25 million & US$4 million payments, promissory to pay US$ 10
million & assumption of 2% net smelter return royalty capped at US$ 9 million US$ 35 million production prepay facility with Lascaux Resource Capital Funds to pay for acquisition
Ouray, Colorado
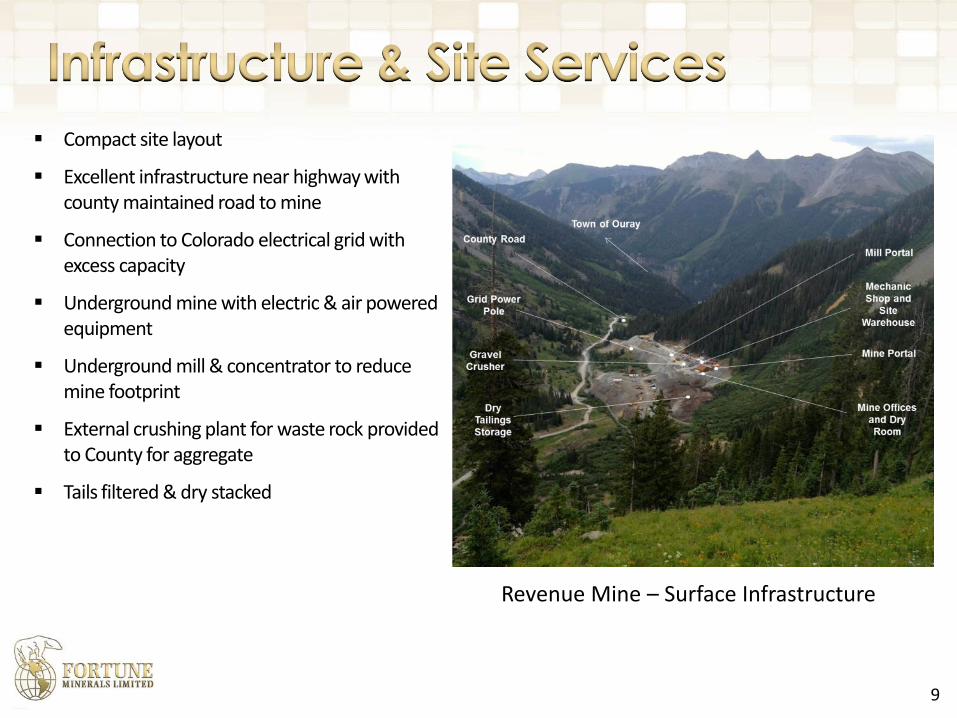
Compact site layout
Excellent infrastructure near highway with county maintained road to mine
Connection to Colorado electrical grid with excess capacity
Underground mine with electric & air powered equipment
Underground mill & concentrator to reduce mine footprint
External crushing plant for waste rock provided to County for aggregate
Tails filtered & dry stacked
9
Revenue Mine – Surface Infrastructure

10
Geology well understood from more than a century of mining & exploration work
Current resources identified in Yellow Rose & Virginius Veins – Upside opportunities in 6 other veins
Resources contained in narrow, steeply dipping, high-grade epithermal quartz-carbonate veins containing tetrahedrite & freibergite (silver), gold, galena (lead), sphalerite (zinc), chalcopyrite (copper) & pyrite
Surface & underground stockpiles estimated at ~650,000 tons excluded from resource
11
Area Category TonsAg
(opt)Au
(opt)Pb(%)
Cu(%)
Zn(%)
Contained Metal
Ag (M oz)
Au (oz)
Pb(M lb)
Cu (M lb)
Zn (M lb)
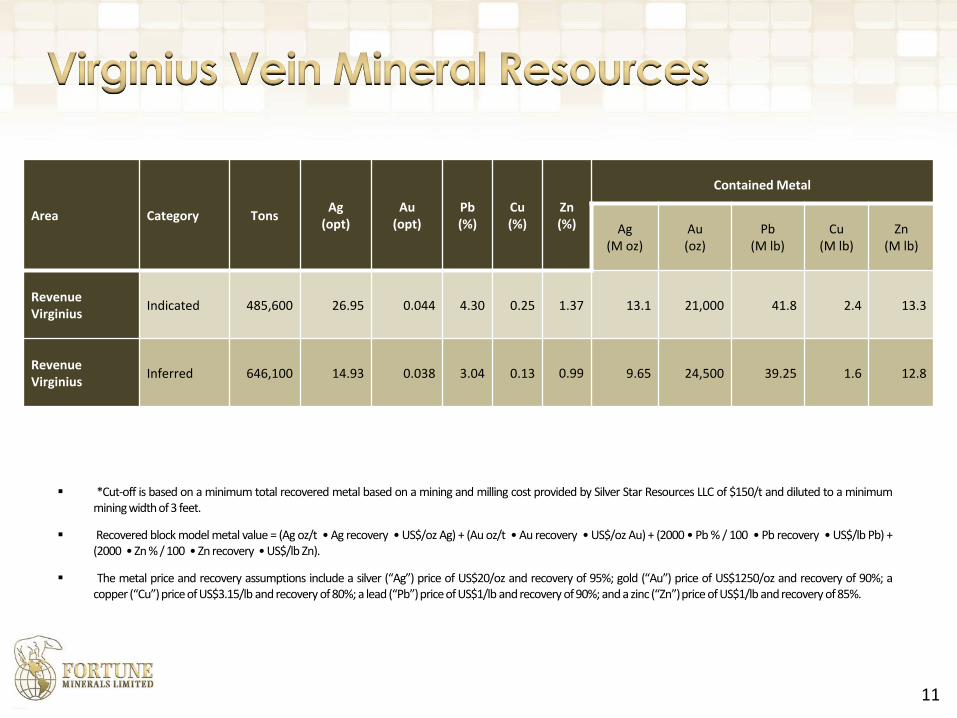
Revenue Virginius
Indicated 485,600 26.95 0.044 4.30 0.25 1.37 13.1 21,000 41.8 2.4 13.3
Revenue Virginius
Inferred 646,100 14.93 0.038 3.04 0.13 0.99 9.65 24,500 39.25 1.6 12.8
*Cut-off is based on a minimum total recovered metal based on a mining and milling cost provided by Silver Star Resources LLC of $150/t and diluted to a minimummining widthof 3 feet.
Recovered block model metal value = (Ag oz/t • Ag recovery • US$/oz Ag) + (Au oz/t • Au recovery • US$/oz Au) + (2000 • Pb % / 100 • Pb recovery • US$/lb Pb) +(2000 • Zn % / 100 • Zn recovery • US$/lb Zn).
The metal price and recovery assumptions include a silver (“Ag”) price of US$20/oz and recovery of 95%; gold (“Au”) price of US$1250/oz and recovery of 90%; acopper (“Cu”)price of US$3.15/lb and recovery of 80%; a lead (“Pb”)price of US$1/lb and recovery of 90%; and a zinc (“Zn”)price of US$1/lb and recovery of 85%.

12
Area Category TonsAg
(opt)Au
(opt)Pb(%)
Zn(%)
Contained Metal
Ag (M oz )
Au (oz)
Pb(M lb)
Zn(M lb)
Yellow Rose Measured 215,300 10.08 0.034 1.71 1.69 2.17 6,400 7.37 7.28
Yellow Rose Indicated 100,700 10.92 0.036 1.96 1.74 1.10 4,000 3.95 3.5
Yellow Rose Measured & Indicated 316,100 10.35 0.035 1.79 1.71 3.27 10,490 11.31 10.78
Yellow Rose Inferred 38,100 11.01 0.025 1.69 0.92 0.49 700 1.28 0.701
*Cut-off is based on a minimum total recovered metal based on a mining and milling cost provided by Silver Star Resources LLC of $150/t and diluted to a minimummining width of 3 feet.
Recovered block model metal value = (Ag oz/t • Ag recovery • US$/oz Ag) + (Au oz/t • Au recovery • US$/oz Au) + (2000 • Pb % / 100 • Pb recovery • US$/lb Pb) +(2000 • Zn % / 100 • Zn recovery • US$/lb Zn).
The metal price and recovery assumptions include a silver (“Ag”) price of US$20/oz and recovery of 95%; gold (“Au”) price of US$1250/oz and recovery of 90%; a lead(“Pb”)price of US$1/lb and recovery of 90%; and a zinc (“Zn”)price of US$1/lb and recovery of 85%.

Description Tons (kt) Ag (oz/t) Au (oz/t) Pb (%) Zn (%)
Virginius
MeasuredIndicated 369.8 19.68 0.03 2.91 0.83Measured + Indicated
369.8 19.68 0.03 2.91 0.83
Inferred 310.9 12.43 0.02 1.98 0.69
Yellow Rose
Measured 141.6 8.38 0.02 1.28 1.31Indicated 45.2 11.29 0.01 2.21 1.63Measured + Indicated 186.86 9.08 0.02 1.51 1.39Inferred 20.7 5.19 0.01 1.05 0.73
13
Mine Plan Resources were estimated for the SRK PEA from the Mineral Resource Estimates for the Viginius and Yellow Rose Veins based on a NSRcut-off grade of US$ 130 per ton for design purposes and applying a marginal cut-off grade of US$ 50 per ton for reporting based on the design.
Numbers include a 90% mining recovery to the designed stope wireframes in addition to 15% unplanned waste dilution within stopes at zero grade Additional development of 5% to 10% was applied based on development type to account for detail currently not in the design.
Mine Plan Resources of 888,283 tons (diluted), averaging 14.6 ounces of silver per ton, 0.02 ounces of gold per ton, 2.26 percent lead, and 0.90 percent zinc

14Existing Portal, Revenue Tunnel and Primary Veins
Yellow Rose Vein
Revenue Virginius Vein
Mine Portal UG Mill
Veins accessed from ~7400 foot (2.3 km) long tracked Revenue Tunnel, plus ~5600 feet (1707 m) of drifting on 2 main veins
Internal winze ~710 feet deep (216 m) & planned ramp to access 4 additional levels
Mining primarily by underground shrinkage methods from Alimak raises
Slushers used to scrape mined production to draw point with chutes to load tram cars & transport to mill using electric locomotives

15
Ball Mill & Flotation
Crushing GalleryBulk Flotation
Underground crushing & grinding plant & flotation concentrator with gravity gold circuit ramping up to 400 tons per day production rate

16
Production of silver, gold, lead & zinc Lead & Zinc concentrates containing silver & gold
sold to Teck Resources smelter in Trail, BC Gravity gold sold to Johnson Matthey in Salt Lake
City, Utah Potential to produce copper concentrate for sale
to Asia & increase revenue payments Potential to negotiate recovery of other metals
Concentrate Bagging
Mining & productionAnnual Average
Contained*
Silver 1.86 million oz.
Lead 5.74 million lb
Zinc 2.29 million lb
Gold 3,075 oz.
Plant feed, ore 127,000 tons* Calculated using a half year of production in 2014 and 2021

Attractive economics indicated from SRK PEA using Mine Plan Resource & excluding surface & underground stockpiles
Underground mining using shrinkage methods
400 ton/day underground mill & concentrator
Lead-Silver & Zinc-Silver concentrates sold to TeckResources Trail Smelter
Gravity Gold concentrate sold to Johnson Matthey
Metal recoveries:
Silver recovery - 95%
Gold recovery - 90%
Lead recovery - 90%
Zinc recovery - 85%
SRK Preliminary Economic Assessment Highlights
Mine Life8 years based on Mine Plan Resource including ramp up & ramp down
LOM Sustaining Capital US$ 26.14M
LOM Average Revenue (net of treatment)
US$ 306.60 / ton processedUS$ 38.91M / year
LOM Average Operating Costs(excluding treatment, royalties & reclamation)
US$ 156.45 / ton processedUS$ 19.85M / year
Operating Margin (EBITDA)US$ 138.24 / ton processedUS$ 17.54M / year
Free Cash Flow (Pre-Tax)US$ 108.81 / ton processedUS$ 13.81M / year
NPV (6%) Pre-Tax US$ 69.63 millionAfter-Tax US$ 58.85 million
IRR Pre-Tax 76.4%After-Tax 73.2%
Cash cost per ounce of Silver (net of by-product credits)
Total Cash Cost US$11.16C1 Cash Cost US$10.28Cost before treatment $US$ 6.62
17
The SRK PEA was prepared on a project basis without financing costs included Price assumptions are US$ 22/troy ounce for silver, US$1,350/troy ounce (“oz”) for gold, US$1/pound (“lb”) for Lead, and US$1/lb for zinc

Source: Metal Economics Group - 10,000,000 20,000,000 30,000,000 40,000,000 50,000,000
Endeavour Silver Corp. - ElCubo
Endeavour Silver Corp. -Bolanitos
Fortune Minerals - RevenueMine
Excellon Resources Inc. -Miguel Auza
Scorpio Mining Corp. -Nuestra Senora
Silvercrest Mines Inc. - ElOcto
Great Panther Silver Ltd -Guanajuato District
United Silver Corp. - CresentMine
Great Panther Silver Ltd -Topia
Total Silver Equivalent Ounces by Silver Mine
Proven and Probable Oz. Measured and Indicated Oz. Inferred Oz.
Source: SNL Metals & Mining, Company Reports & Revenue Mine Mineral Resource Estimates Silver equivalent ounces for 2014 are established using prices of US$21.50 per Ag troy ounce (“oz”), US$1,350 per Au oz (60:1
ratio), US$1.00 per Zn pound (“lb”) and US$1.00 per Pb lb
Crescent
Silver
18

19
Source: SNL Metals & Mining, Company Reports & SRK Technical Report Silver equivalent ounces for 2014 are established using prices of US$21.50 per Ag oz, US$1,350 per Au oz (60:1 ratio), US$1.00
per Zn lb & US$1.00 per Pb lb
1.31.8 2.1 2.2 2.3
3.4
4.7 5.0
6.5
7.78.3 8.8
15.2
16.5
17.7 17.718.8
0.0
2.0
4.0
6.0
8.0
10.0
12.0
14.0
16.0
18.0
20.0
AgE
qG
rad
e (
oz/
t)
Silver Equivalent grade (Troy oz/t) for comparable companies
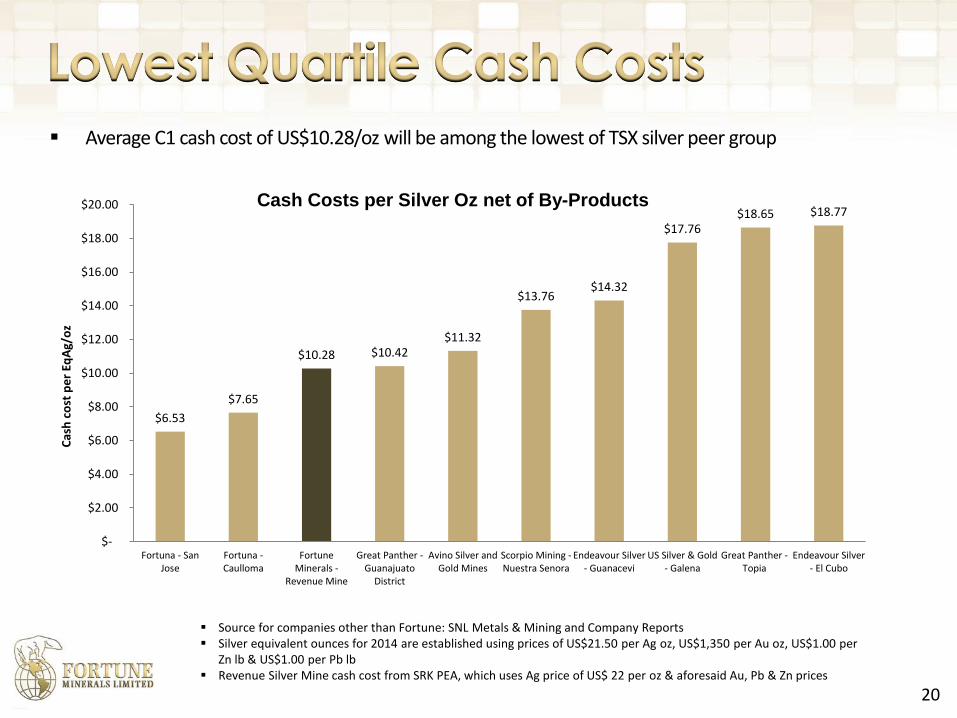
Average C1 cash cost of US$10.28/oz will be among the lowest of TSX silver peer group
20
Cash Costs per Silver Oz net of By-Products
Source for companies other than Fortune: SNL Metals & Mining and Company Reports Silver equivalent ounces for 2014 are established using prices of US$21.50 per Ag oz, US$1,350 per Au oz, US$1.00 per
Zn lb & US$1.00 per Pb lb Revenue Silver Mine cash cost from SRK PEA, which uses Ag price of US$ 22 per oz & aforesaid Au, Pb & Zn prices
$6.53
$7.65
$10.28 $10.42$11.32
$13.76$14.32
$17.76$18.65 $18.77
$-
$2.00
$4.00
$6.00
$8.00
$10.00
$12.00
$14.00
$16.00
$18.00
$20.00
Fortuna - SanJose
Fortuna -Caulloma
FortuneMinerals -
Revenue Mine
Great Panther -Guanajuato
District
Avino Silver andGold Mines
Scorpio Mining -Nuestra Senora
Endeavour Silver- Guanacevi
US Silver & Gold- Galena
Great Panther -Topia
Endeavour Silver- El Cubo
Cas
h c
ost
pe
r Eq
Ag/
oz

21
Public CompaniesMarket Cap EV EBITDA P / CF EV / EBITDA NAV*
P / NAV(C$M) (C$M) 2014E 2015E 2014E 2015E 2014E 2015E (C$M)
Primero Mining Corp. 1,041 1,088 97 161 11.1x 7.3x 11.2x 6.8x 906 1.15x
Fortuna Silver Mines Inc. 647 583 72 96 9.9x 8.8x 8.1x 6.1x 507 1.28x
Endeavour Silver Corp. 560 543 73 81 9.0x 8.7x 7.4x 6.7x 405 1.38x
MAG Silver Corp. 633 613 -5 -8 NM NM NM NM 657 0.96x
Mandalay Resources Corp. 412 394 77 110 5.1x 4.2x 5.1x 3.6x 413 1.00x
Silvercrest Mines Inc. 223 196 29 44 9.9x 6.3x 6.7x 4.5x 255 0.88x
Great Panther Silver Ltd 182 164 4 n/a 39.7x 8.5x 39.3x n/a 97 1.88x
Bear Creek Mining Corp. 210 164 -13 -22 NM NM NM NM 474 0.44x
Alexco Resource Corporation 62 56 -9 5 NM 17.0x NM 10.4x 98 0.63x
Excellon Resources Inc. 63 53 n/a n/a 5.8x 3.8x n/a n/a 87 0.72x
Scorpio Mining Corp. 54 35 n/a n/a 9.0x 2.2x n/a n/a 127 0.42x
Aurcana Corporation 36 71 n/a n/a 4.3x 2.3x n/a n/a n/a n/a
U.S. Silver & Gold Inc. 39 37 n/a 10 7.4x 5.2x n/a 3.8x 77 0.51x
Revett Mining Company, Inc. 47 41 n/a n/a n/a n/a n/a n/a n/a n/a
Min 4.3x 2.2x 5.1x 3.6x 77 0.42x
Max 39.7x 17.0x 39.3x 10.4x 906 1.88x
Median 9.0x 6.3x 7.8x 6.1x 330 0.92x
Average 11.1x 6.8x 13.0x 6.0x 342 0.94x
Fortune Minerals Ltd. 50 49 n/a n/a n/a n/a n/a n/a 182 0.28x
Note:*Analyst average estimate; all market data as of September 17, 2014.
"n/a" refers to no estimates available, "NM" denotes for negative multiples
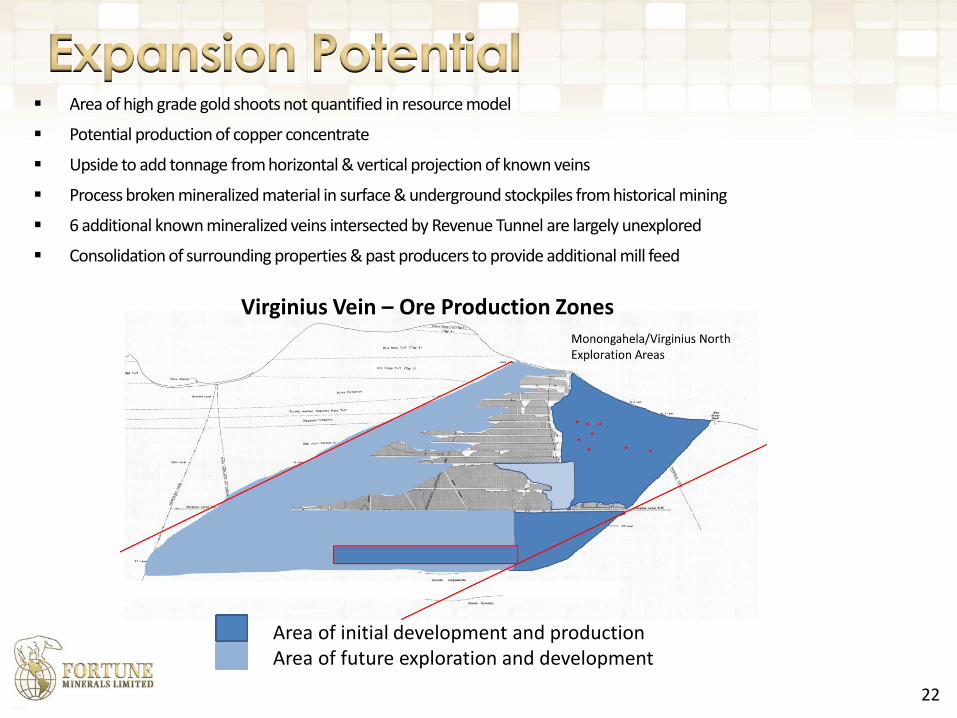
Area of high grade gold shoots not quantified in resource model
Potential production of copper concentrate
Upside to add tonnage from horizontal & vertical projection of known veins
Process broken mineralized material in surface & underground stockpiles from historical mining
6 additional known mineralized veins intersected by Revenue Tunnel are largely unexplored
Consolidation of surrounding properties & past producers to provide additional mill feed
22
Virginius Vein – Ore Production Zones
Area of initial development and productionArea of future exploration and development

Accretive & transformational acquisition that transitions Fortune to producer with cash flow
Securing financing from Lascaux to fund completion of acquisition
Completing execution of transition plan with current owners & integrating management team
Advancing mine plan & development to ensure sufficient mill feed
Complete transition to 7-days per week & 2 shifts
Develop minimum of 10 working faces
Developing plan for additional escape ways & improved ventilation
Completing ramp up & improvements to mill to improve performance
Eliminating process commissioning bottlenecks to ramp up to 400 tons per day
Installation of thickener to improve tailings throughput & process water quality
After achieving throughput capacity & cash flow - Conduct exploration to identify new resources in mine & surrounding area
23

Vertically integrated project to recover gold, cobalt, bismuth (12% of global reserves) & by-product copper
Mine & concentrator in NT
Saskatchewan Metals Processing Plant (SMPP) in SK to process concentrates from mine to high value metals & chemicals
Bulk flotation concentrate (<4% of original ore) contains the economic metals for cost effective transportation to SMPP & low cost refining
Very advanced project with C$ 110 million invested, including test mining & pilot plant processing to reduce development risks
2014 updated positive Feasibility Study
EA, Land Use Permit & Class A Water License approvals received in NT & EA approval in SK
Negotiations with strategic partner & banking syndicate for project financing
Potential reliable, fully integrated North American source of cobalt chemicals for rechargeable battery sector
24

The NICO mineral reserves are based on 327 drill holes & surface trenches
Deposit is an Iron Oxide Copper Gold (“IOCG”) class (Olympic Dam-type) deosit
Ore hosted in 3 lenses of ironstone breccia up to 1.3 km in length, 550 m in width, & 70 m in thickness
Underground test mining has verified geometry & grade of deposit
Pilot plants completed at SGS Lakefield to verify process designs, flow sheet & product quality
Green = Upper Ore Zone, Blue = Middle Ore Zone, Red = Lower Ore Zone
Brown = Open Pit, Cyan = Underground Development and Stopes
25

Underground Mineral ReservesTonnes
(Thousands)Au
(g/t)Co (%)
Bi (%)
Cu (%)
Proven 282 4.93 0.14 0.27 0.03
Probable 295 5.00 0.07 0.07 0.01
Total 577 4.96 0.10 0.17 0.02
Open Pit Mineral ReservesTonnes
(Thousands)Au
(g/t)Co (%)
Bi(%)
Cu (%)
Proven 20,453 0.92 0.11 0.15 0.04
Probable 12,047 1.03 0.11 0.13 0.04
Total 32,500 0.96 0.11 0.14 0.04
Combined Mineral ReservesTonnes
(Thousands)Au
(g/t)Co (%)
Bi (%)
Cu (%)
Proven 20,735 0.97 0.11 0.15 0.04
Probable 12,342 1.13 0.11 0.13 0.04
Total 33,077 1.03 0.11 0.14 0.04
Metal Contained 1.11 Moz 82.3 Mlb 102.1 Mlb 27.2 Mlb
Sums of the combined reserves may not exactly equal sums of the underground and open pit reserves due to rounding error.
26
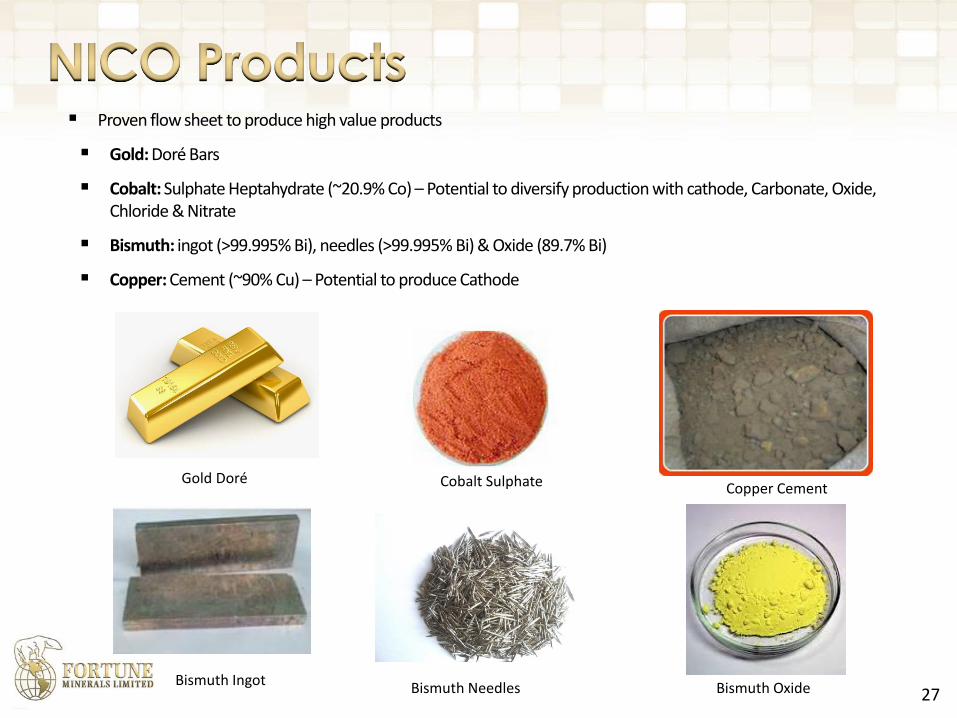
Proven flow sheet to produce high value products
Gold: Doré Bars
Cobalt: Sulphate Heptahydrate (~20.9% Co) – Potential to diversify production with cathode, Carbonate, Oxide, Chloride & Nitrate
Bismuth: ingot (>99.995% Bi), needles (>99.995% Bi) & Oxide (89.7% Bi)
Copper: Cement (~90% Cu) – Potential to produce Cathode
Cobalt Sulphate
Bismuth Ingot27
Gold Doré
Bismuth Needles Bismuth Oxide
Copper Cement

Wide chemical & metallurgical market applications in batteries, high strength alloys, cutting tools, magnets, catalysts & pigments
High purity cobalt used in aerospace industry
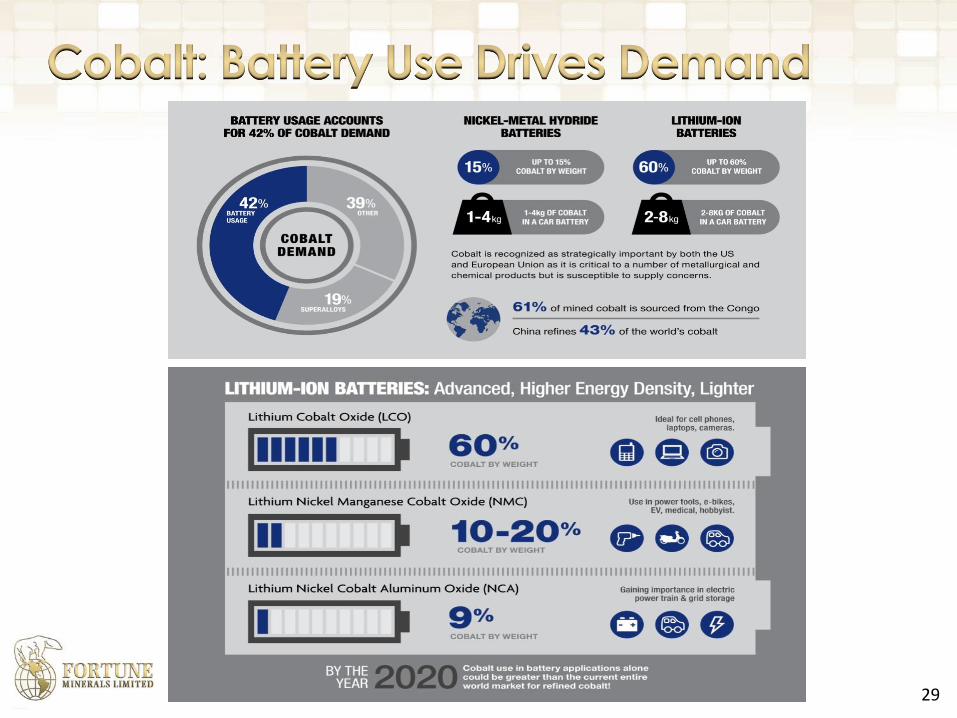
Cobalt sulphate & oxide used in lithium ion & nickel metal hydride batteries for electronic devices & hybrid/electric vehicles
Chemicals account for 58% of worldwide cobalt demand & is driving future cobalt consumption, particularly in rechargeable batteries & catalysts
Cobalt market 94,000 tonnes & expected to grow ~6% to 8% per year over next 5 years
Supply concerns from 61% of mine production in politically unstable Congo & 43% of refinery production in China
CRU anticipates non-metallurgical cobalt deficit in 2015 & all cobalt deficit in 2017
42%
19%
9%
9%
7%4% 3% 7%
Cobalt Consumption by End Use 2013
Battery Chemicals(42%)
Superalloys (19%)
Hard Materials (9%)
Catalysts (9%)
Ceramics / Pigments(7%)
28
29

Tesla has started construction of its $5 billion lithium-ion battery plant in Nevada
By 2020 anticipated to produce more lithium-ion batteries annually than were produced globally in 2013
Model S uses Nickel Cobalt Aluminum (NCA) cathode chemistry from Panasonic (contains ~9% cobalt)
Tesla prefers North America suppliers to minimize environmental impacts & material costs
30

240,000
45,360 39,000
11,000 10,000 10,000 5,000
48,661
China Vietnam OtherCountries
Peru Mexico UnitedStates
Canada NICO
World Bismuth Reserves (Tonnes)
World market ~15,000 to 20,000 tonnes per year
China principal source of bismuth, accounts for 60% of world reserves & 80% of world production
China closed 20% of its production due to environmental & mine safety issues – Policies to restrict exports
NICO is World’s largest deposit - 12% of global reserves
NICO will be a reliable North American vertically integrated producer
World’s largest deposit
*
*Canada reserves exclude NICOSource: USGS Industry Survey 2010 & Company market studies
31
80%
8%
6%
3%
1% 1% 1%0%
0%
0%China
Peru
Mexico
Japan
Kazakh
Bolivia
Canada
Russia
Roman
Bulgari
World Bismuth Mine Production (MT)

32
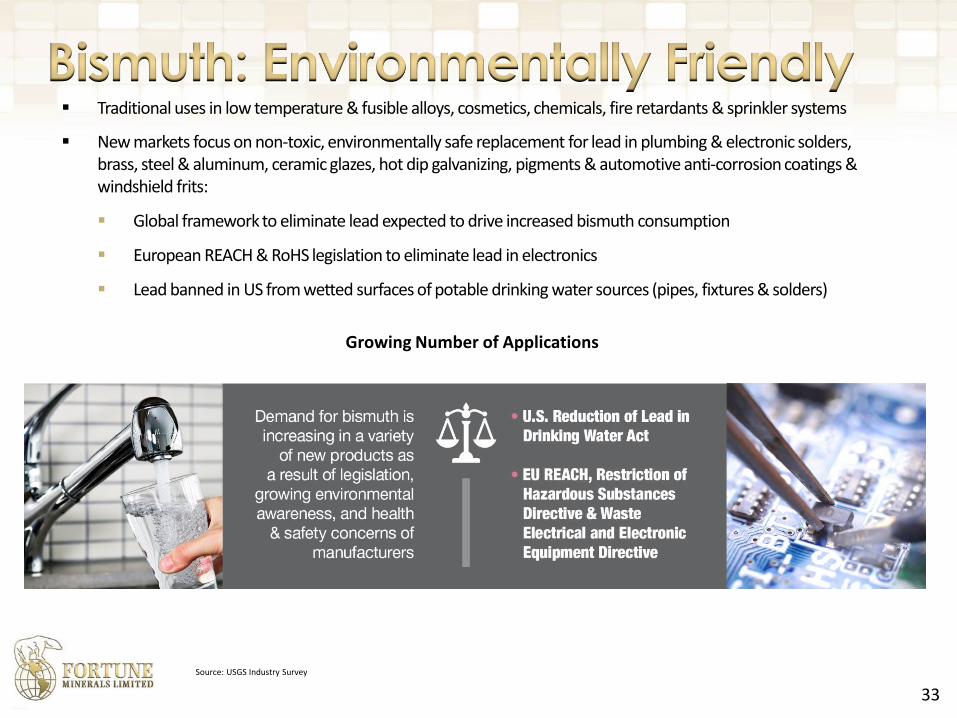
Traditional uses in low temperature & fusible alloys, cosmetics, chemicals, fire retardants & sprinkler systems
New markets focus on non-toxic, environmentally safe replacement for lead in plumbing & electronic solders, brass, steel & aluminum, ceramic glazes, hot dip galvanizing, pigments & automotive anti-corrosion coatings & windshield frits:
Global framework to eliminate lead expected to drive increased bismuth consumption
European REACH & RoHS legislation to eliminate lead in electronics
Lead banned in US from wetted surfaces of potable drinking water sources (pipes, fixtures & solders)
Growing Number of Applications
Source: USGS Industry Survey
33

34
20 yr mine life at 4,650 tpd
Reserves: 33.0 Mt
Additional 5.5 Mt low grade to be stockpiled for future processing
Primarily open pit mining
Underground mining in first 2 years
Early access to high grade improves economics
Co-mingled waste rock & mill tailings
Plant site
Mill & flotation concentrator
Camp & ancillary buildings
Access road
180 employees (270 during underground operations)

Saskatchewan Metals Processing Plant (SMPP) is a hydrometallurgical refinery that will be built on land owned by Fortune 27 km north of Saskatoon near the Town of Langham
SMPP allows for processing of NICO concentrate to high value metals & chemicals in a low cost jurisdiction
Low cost power (~5.7 cents kWh)
Skilled labour pool
Proximity to reagents & services
5-year tax holiday
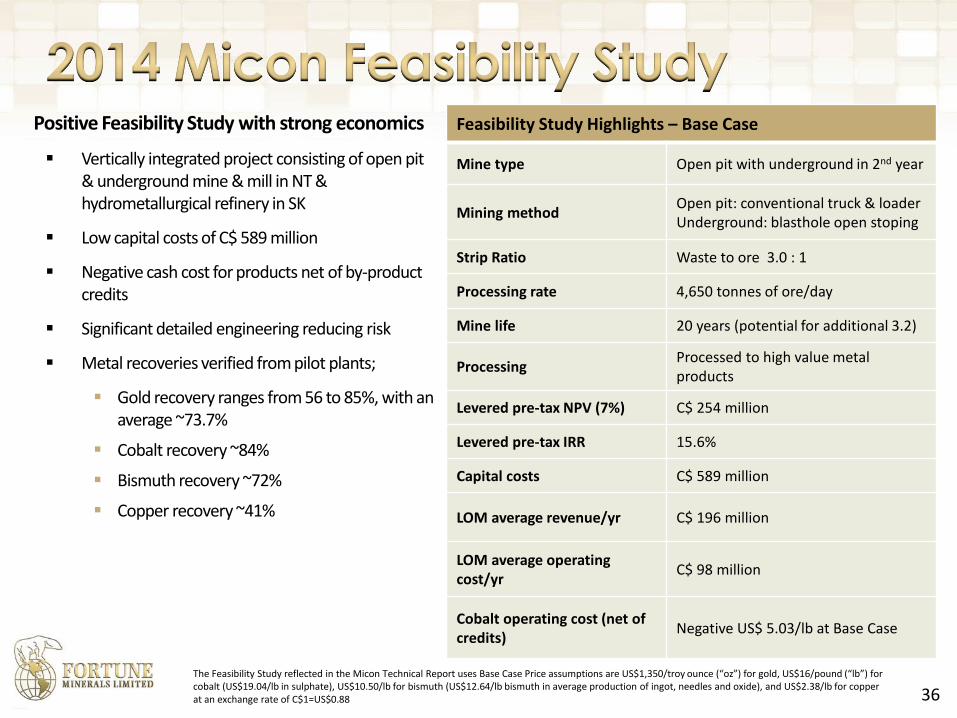
Positive Feasibility Study with strong economics
Vertically integrated project consisting of open pit & underground mine & mill in NT & hydrometallurgical refinery in SK
Low capital costs of C$ 589 million
Negative cash cost for products net of by-product credits
Significant detailed engineering reducing risk
Metal recoveries verified from pilot plants;
Gold recovery ranges from 56 to 85%, with an average ~73.7%
Cobalt recovery ~84%
Bismuth recovery ~72%
Copper recovery ~41%
Feasibility Study Highlights – Base Case
Mine type Open pit with underground in 2nd year
Mining methodOpen pit: conventional truck & loaderUnderground: blasthole open stoping
Strip Ratio Waste to ore 3.0 : 1
Processing rate 4,650 tonnes of ore/day
Mine life 20 years (potential for additional 3.2)
ProcessingProcessed to high value metal products
Levered pre-tax NPV (7%) C$ 254 million
Levered pre-tax IRR 15.6%
Capital costs C$ 589 million
LOM average revenue/yr C$ 196 million
LOM average operatingcost/yr
C$ 98 million
Cobalt operating cost (net of credits)
Negative US$ 5.03/lb at Base Case
36
The Feasibility Study reflected in the Micon Technical Report uses Base Case Price assumptions are US$1,350/troy ounce (“oz”) for gold, US$16/pound (“lb”) for cobalt (US$19.04/lb in sulphate), US$10.50/lb for bismuth (US$12.64/lb bismuth in average production of ingot, needles and oxide), and US$2.38/lb for copperat an exchange rate of C$1=US$0.88
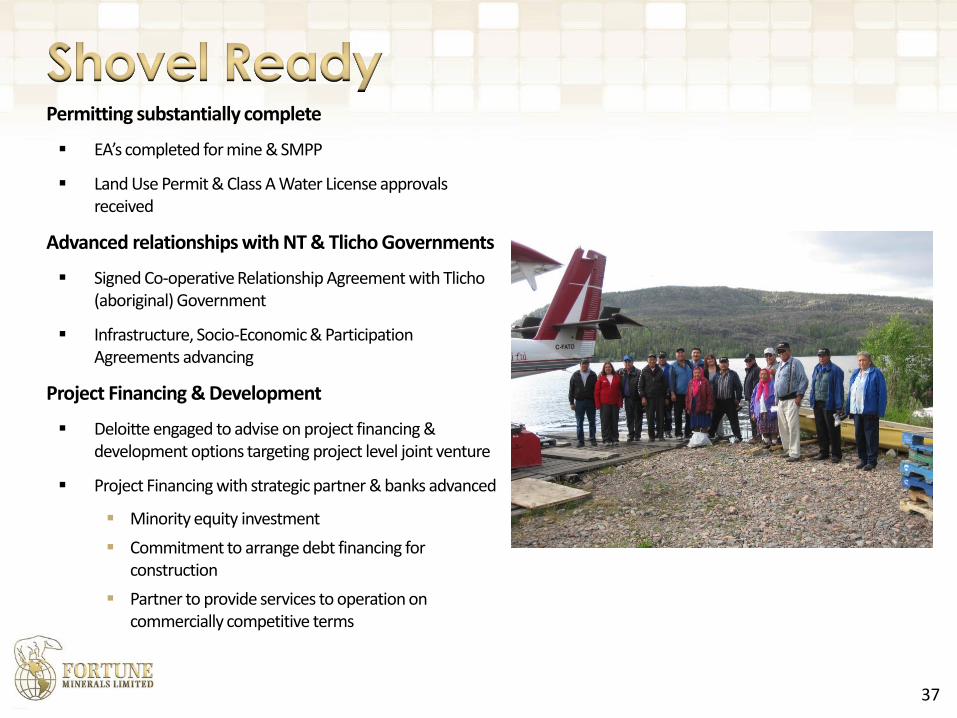
Permitting substantially complete
EA’s completed for mine & SMPP
Land Use Permit & Class A Water License approvals received
Advanced relationships with NT & Tlicho Governments
Signed Co-operative Relationship Agreement with Tlicho(aboriginal) Government
Infrastructure, Socio-Economic & Participation Agreements advancing
Project Financing & Development
Deloitte engaged to advise on project financing & development options targeting project level joint venture
Project Financing with strategic partner & banks advanced
Minority equity investment
Commitment to arrange debt financing for construction
Partner to provide services to operation on commercially competitive terms
37

38
Summary Highlights
One of the world’s premier metallurgical coal development projects
Joint Venture partnership with South Korean steel producer POSCO
Advanced project with C$110 million of work completed including test mining, pilot plant processing & trial cargos
Positive Feasibility Study with robust economics
125 Mt of run of mine coal reserves will support 25+ years of production (small fraction of total resource)
Railway transport of coal to Ridley Terminal in Prince Rupert
Premium lump coal, ultra-low volatile PCI & sinter products
CN collaborating on railway extension to Arctos
EA process advancing

Measured & Indicated Resources of 230 Mt - Small fraction of total global resource
Run-of-Mine Coal Reserves of 125 Mt in Lost Fox deposit remains open for possible expansion
Historical Resources include 2 Bn + tonnes in the Speculative class (1)
Area Measured Indicated M&I Inferred
Lost Fox 107.9 109.5 217.4 91.5
Hobbit-Broatch 13.5 13.5 258.4
Summit 9.6
Lost Fox Extension
Total 107.9 123.0 230.9 359.5
Coal Resources Run-of-Mine Coal Reserves 10% Ash Product Reserves
Measured Indicated Inferred Proven Probable Total Proven ProbableTotal
Product
172.4 20.4 12.1 115.0 9.9 124.9 64.4 4.8 69.2
Arctos Global Resources (million tonnes)
Lost Fox Metallurgical Coal Reserves and Resources (million tonnes)
(1) The Historical Resources include 2.2 billion tonnes in the Speculative class. The historical resource estimate was developed by Gulf in 1988 and updated in 2002 by Marston-Golder to reflect changes in the estimation of Inferred Resources under Paper GSC 88-21. The Speculative portion of the resources is not compliant with current reporting standards. A qualified person has not done the work necessary to classify the historical estimate of Speculative resources as current mineral resources under NI 43-101 and the estimate should not be relied upon. Speculative Resources were developed based on estimated average coal thickness applied to the projected aerial extent of the coal.
39

Arctos is one of the largest & most advanced Canadian projects of high rank anthracite coal
Highest quality metallurgical coal with very high carbon & energy content
Represents only 1% of world coal reserves
Metallurgical coal with diverse applications
Metallurgical Reductants / charge carbon
Ultra-Low Vol. PCI
Sinter
Other products:
Filter media
Blend coal with coking coal for making metallurgical coke
Direct coke replacement
Urea fertilizers, synthetic fuels & plastics
Heating & cooking briquettes
Pelletizing
Premium thermal coal
Cement
Food processing
40
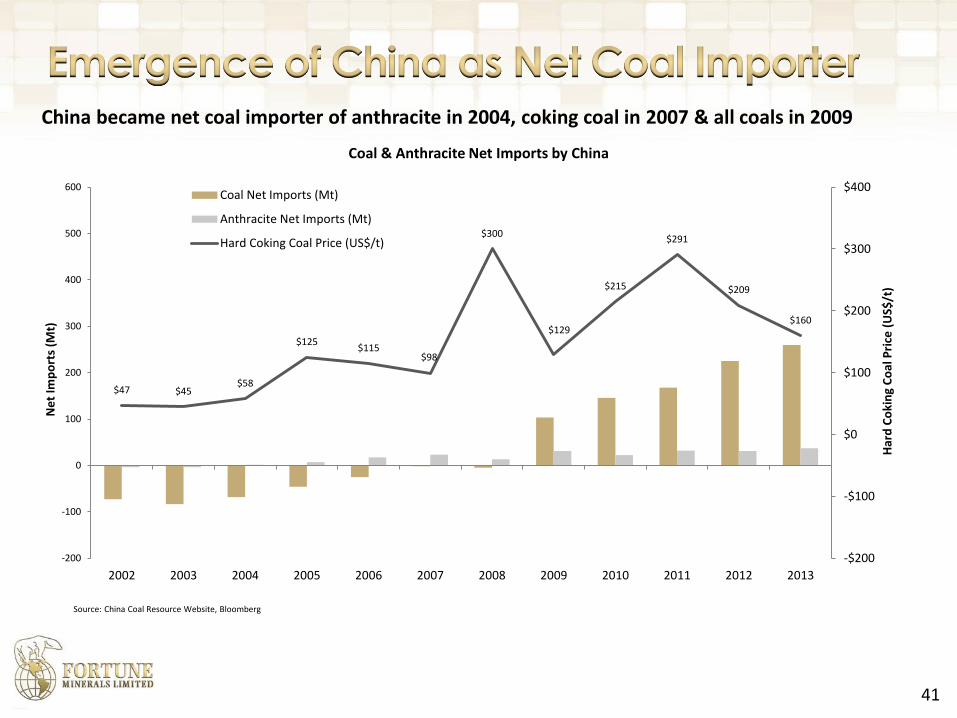
China became net coal importer of anthracite in 2004, coking coal in 2007 & all coals in 2009
Source: China Coal Resource Website, Bloomberg
41
$47 $45$58
$125$115
$98
$300
$129
$215
$291
$209
$160
-$200
-$100
$0
$100
$200
$300
$400
-200
-100
0
100
200
300
400
500
600
2002 2003 2004 2005 2006 2007 2008 2009 2010 2011 2012 2013
Har
d C
oki
ng
Co
al P
rice
(U
S$/t
)
Ne
t Im
po
rts
(Mt)
Coal & Anthracite Net Imports by China
Coal Net Imports (Mt)
Anthracite Net Imports (Mt)
Hard Coking Coal Price (US$/t)

Railway road bed largely constructed to mine site by BC Government
Project economics supports 150 km brownfield extension from Minaret
EA on railway extension underway as part of mine development
MOU advanced with CN to operate railway
Other parties interested in the rail – Dramatic reduction of railway cost to improve project economics
Railway provides access to 25 Mtpa Ridley Coal Terminal in Prince Rupert for access to global markets
Existing railway right-of-way & road bed
42
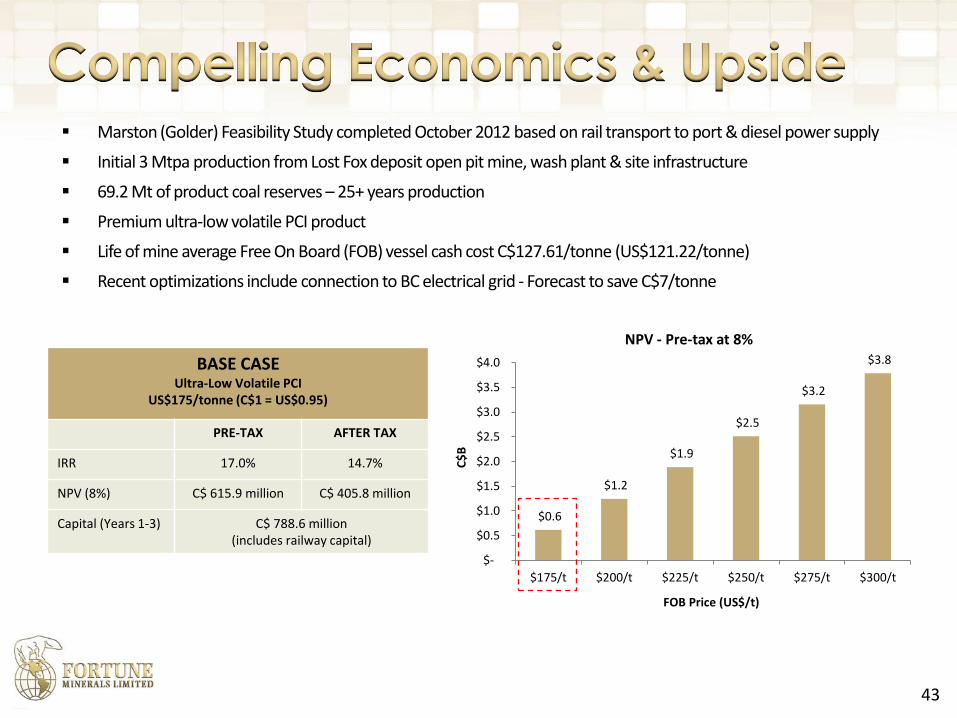
Marston (Golder) Feasibility Study completed October 2012 based on rail transport to port & diesel power supply
Initial 3 Mtpa production from Lost Fox deposit open pit mine, wash plant & site infrastructure
69.2 Mt of product coal reserves – 25+ years production
Premium ultra-low volatile PCI product
Life of mine average Free On Board (FOB) vessel cash cost C$127.61/tonne (US$121.22/tonne)
Recent optimizations include connection to BC electrical grid - Forecast to save C$7/tonne
BASE CASEUltra-Low Volatile PCI
US$175/tonne (C$1 = US$0.95)
PRE-TAX AFTER TAX
IRR 17.0% 14.7%
NPV (8%) C$ 615.9 million C$ 405.8 million
Capital (Years 1-3) C$ 788.6 million(includes railway capital)
$0.6
$1.2
$1.9
$2.5
$3.2
$3.8
$-
$0.5
$1.0
$1.5
$2.0
$2.5
$3.0
$3.5
$4.0
$175/t $200/t $225/t $250/t $275/t $300/t
C$
B
FOB Price (US$/t)
NPV - Pre-tax at 8%
43
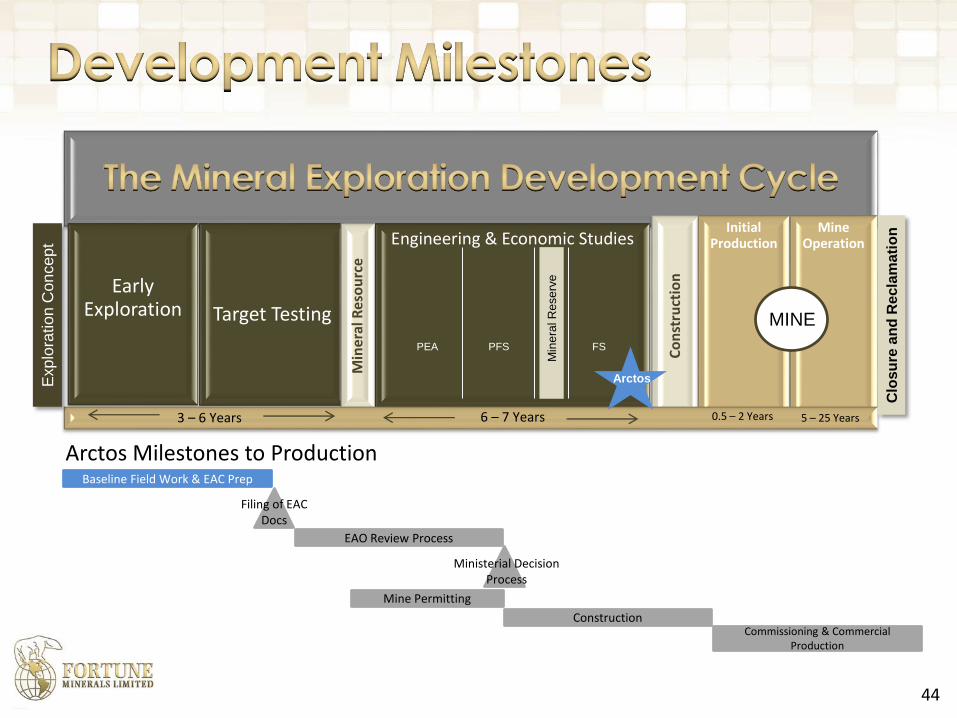
Early Exploration Target Testing
Min
eral
Res
ou
rce
Engineering & Economic Studies
Co
nst
ruct
ion
Initial Production
Mine Operation
44
Exp
lora
tio
n C
on
ce
pt
Clo
su
re a
nd
Re
cla
ma
tio
n
3 – 6 Years 6 – 7 Years
PEA PFS FS
Min
era
l R
ese
rve
MINE
0.5 – 2 Years 5 – 25 Years
Arctos
Baseline Field Work & EAC Prep
EAO Review Process
Mine Permitting
Construction Commissioning & Commercial
Production
Arctos Milestones to Production
Filing of EAC Docs
Ministerial Decision Process

Revenue Silver Mine Complete acquisition of mine & transition with management Complete capital improvements & ramp up to full production Achieve cash flow from operations
NICO & SMPP Project Complete detailed engineering & secure remaining permits for construction readiness Complete re-zoning of SMPP lands Complete Participation & Socio-economic agreements with NT & Tlicho Governments Secure project financing
Arctos Project Complete permitting activities Continue Tahltan, Gitxsan & stakeholder engagement Advance rail engineering & permitting - Establish agreements with rail operator Secure port capacity Secure low cost power for the site with extension of electrical grid
Deloitte engaged to advise on project financing & development Identify strategic partners for project financing Equity investment in projects
45

Directors
Mahendra Naik, B Comm, CPA,CA Chairman, Director CFO Fundeco - Founding director & former CFO, IAMGOLD
George Doumet, MSc, MBA Honorary Chairman, Director Chemical Engineer – President & CEO, Federal White Cement
Robin Goad, MSc, PGeo President & CEO, Director Geologist - 30 yrs mining & exploration experience
David Knight, BA, LLB Secretary, Director Partner, Norton Rose Fulbright Canada LLP specializing in securities & mining law
James Excell, BASc Director Metallurgical Engineer – 35 yrs mining experience BHP-Billiton
James Williams, BSc Director Geologist – 30 yrs mining, oil & gas experience - CEO of Southwest Productions
The Honorable Carl L. Clouter Director Commercial pilot - Former owner of charter airline in NWT
Shou Wu (Grant) Chen, MSc, MBA Director Geologist – Former Deputy Chairman & CEO, China Mining Resources Group
Ed Yurkowski, BASc Director Civil Engineer & CEO Procon Mining & Tunneling
Management
Adam Jean, HBA, CPA, CA VP Finance & CFO Chartered Accountant previously with Ernst & Young LLP
Mike Romaniuk, BASc, PEng VP Operations & COO Geologist & Process Engineer – 25+ yrs engineering, mining & construction
experience primarily with Xstrata Nickel & Falconbridge
Bill Shepard, Ind. Mgt. Dipl. Logistics Manager 15 yrs experience in procurement & logistics
Richard Schryer, PhD Director Regulatory &
Environmental Affairs
Aquatic Scientist –20+ yrs experience in mine permitting & environmental
assessments
Keith Lee, BSc Senior Process Engineer 25 yrs operations, engineering & mineral processing experience
Carl Kottmeier, BASc, MBA, PEng
Dustin Reinders, BSc, PEng
Project Manager
Project Engineer
Mining Engineer – 25 yrs engineering & operations experience
Mining Engineer - 5 yrs mining experience
Dianna Stoopnikoff, AScT Environmental Relations Manager 15 yrs environmental & health and safety experience primarily in BC mining
Fiona Brekelmans, BAcc (Hon), CPA, CA
Patrick Moloney, BSc, BEd
Controller
Human Resources Manager
7 yrs accounting & audit experience, previously with Ernst & Young LLP
20 yrs of human resources & labor relations experience
46