formulating a proactive entry strategy for ericsson in
TRANSCRIPT
I
Lund UniversityLund Institute of TechnologyDepartment of Industrial Management and LogisticsDivision of Production Management
Formulating a Proactive Entry Strategy for Ericsson in India
New Site Leasing Industry
Author: Emily Ericsson
Supervisors: Carl-Johan AsplundDepartment of Production ManagementRajul KumarEricsson India & Sri Lanka Pvt Ltd

I
Preface
A number of people have contributed to this thesis in different ways. I would therefore like to start by saying some thank yous. I would like to start by thanking Håkan Ericsson and Vishal Awal, without your help this thesis would never have happened. I would also like to thank the whole of Mr Vishal’s family who made me feel welcome in their home and made my stay in India an amazing experience. Another person who deserves a special thank you is Ola Millnert who has given me valuable feedback and great support throughout the thesis.
I also would like to send a thank you to Miss Shaivya Shrivastava who helped me in anumber of ways making my stay at Ericsson India possible. Thank you Jan Lund, Vibhas Sharma, and Richa Singh who have all helped me by answering questions and giving me access to valuable information.
Finally, I would like to thank my two supervisors; Carl-Johan Asplund, my academic supervisor at Lund’s Institute of Technology, and Rajul Kumar, my supervisor at Ericsson India Pvt Ltd, for your advise and assistance throughout the thesis.
Emily Ericsson
Lund, October 2006

II
Abstract
Ericsson India is looking into the possibility to enter a new business in the country. The business is a “telecom site leasing” service which would be included in Ericsson’s service portfolio. Services are an increasingly important part of the company’s total revenues. Demand for so called turn-key services, meaning full implementation and control over a customer’s network, is an example of a service which is increasing in developing countries like India. Ericsson finds it therefore natural to grow within the service segment in these markets. The idea to expand the service offerings with an entrance to the so called tower industry emerged from identified new opportunities and a noted market demand. This thesis has investigated how Ericsson should enter this “site leasing” business in India.
The business is expected to take off with or without Ericsson, as regulators and the Indian government see many benefits to the economy with the concept. Since the aim of the concept is to achieve as many tenants as possible per tower, infrastructure costs are expected to decrease per operator. The cost reductions is the main reason for the belief that the service is expected to improve coverage in rural areas, which at the present have a network penetration of less than 2%. The service is also supported by the government and the regulators because it is estimated to improve countryside and city esthetics andnetwork capacity in urban areas, which are facing problems with insufficient space.
It was found through various analyses that Ericsson should invest in a pilot project initially to minimize risks. After an evaluation of the pilot project it is recommended to start an aggressive investment strategy. In this way it is believed that Ericsson will raise barriers for entering competitors and thus create a more profitable business. The strategy is also believed to overcome the weakness of the Ericsson non-associated tower brand easier through faster implementation of the business on a wider scale than competitors. Moreover, it was also found that Ericsson should differentiate the service compared to competitors. Ericsson has the capability to supply customers with a service with perceived benefits, thereof the strategy. It is estimated that Ericsson will alone be able to hold such a position in the industry and thus the incentive to price their service slightly higher than competitors. It is furthermore recommended that Ericsson should monitor the new business closely to correct dissatisfying performance in time.
III
Sammanfattning
Ericsson Indien tittar för nuvarande in på alternativet att erbjuda en ny tjänst till sina kunder. Tjänsten är en uthyrningstjänst, vilken innebär att Ericsson hyr ut passiv ”site”-infrastruktur till operatörer. En anledning till att Ericsson funderat på tjänstesektorn som ett rätt naturligt område att utöka sina tjänster inom, är dess ökade betydelse inom företaget då den utgör en allt större del av koncernens inkomster. Den ökande efterfrågan i utvecklingsländer som Indien på den så kallade ”turn-key” tjänsten, vilken innebär att Ericsson förser kunden med ett komplett ansvar över utbyggnad och operation av nätverk, är ett exempel på en sådan utveckling. När möjligheten att starta en ”uthyrning av siter” tjänst uppkom blev därför de många fördelarna med en sådan tillväxt snabbt tydliga. Det här exjobbet undersöker därför hur Ericsson bäst ska gå in i den här s.k. ”tower industrin”.
Att hyra ut ”siter” till multipla operatörer är en tjänst som förväntas startas i Indien med eller utan Ericsson. Detta för det statliga stödet av tjänsten. Eftersom målet med tjänsten är att locka till sig så många operatörer som möjligt till varje ”site” för förbättrad vinst, kommer också operatörernas kostnad minska för den passiva infrastruktur delen. Dessa konstandsminskningar är den huvudsakliga orsaken till tron på att tjänsten kommer ge incitament till en större utvidgning av nät i rurala områden som just nu har en täckning på mindre än 2%. Ännu en anledning till varför staten stöttar en utveckling av tjänsten är för att den förväntas förbättra estetiken i landskapet genom färre byggda torn och en höjning av kapaciteten i de överbelastade nätverken i städerna som står inför ett problem med otillräcklig mark.
Genom olika analyser i exjobbet fann man att Ericsson borde investera i ett pilot projekt initialt för att minimera riskerna. Efter en utvärdering av projektet rekommenderas en mer aggressiv investerings strategi. Genom en sådan aggressiv strategi förväntas Ericsson kunna höja barriärer för inkommande konkurrenter. Färre konkurrenter skapar större möjligheter för högre marginaler och därmed högre vinster. Det är också förväntat att strategin kommer lättare besegra en av Ericssons största barriärer, det icke-associerade Ericsson märket i ”tower industrin”. Exjobbet presenterar också den funna mest strategiska placeringen för den nya tjänsten i industrin. Ericsson bör differentiera sin tjänst jämfört med konkurrenterna, då företaget har större möjligheter att erbjuda en bredare tjänst. Den bredare tjänsten inkluderar möjligheten för Ericsson att förse kunder med komplett lösning, från uppbyggnad till underhåll och operation av alla delar av nätverket. Ericsson kan exempelvis erbjuda en uthyrnings tjänst av ”siter” tillsammans med deras ”turn-key” tjänst. Behovet för kunder att bara behöva gå till en ”one-stop-shop” för samtliga tjänster och produkter anses skapa en konkurrenskraftig position. Därför finns det anledningar att tro att Ericsson kan ta ut något högre priser än konkurrenter. Slutligen rekommenderar exjobbet företaget att övervaka den nya tjänstens utvecklig på marknaden för att kunna korrigera strategin i rätt tid.
IV
Table of Content
1. Introduction................................................................................................................... 11.1 Background ............................................................................................................... 11.2 Purpose...................................................................................................................... 11.4 Delimitations............................................................................................................. 21.5 Target Group ............................................................................................................. 21.6 Disposition of the Thesis .......................................................................................... 2
2. Practical and Theoretical Framework ........................................................................ 42.1 Methodology ............................................................................................................. 42.2 Theoretical Framework............................................................................................. 6
3. The Indian Market...................................................................................................... 113.1 Indian market .......................................................................................................... 113.2 Mobile Telecom History ......................................................................................... 133.3 Market Growth........................................................................................................ 133.4 Stakeholders............................................................................................................ 153.5 Market Challenges .................................................................................................. 193.6 Key Findings........................................................................................................... 22
4. The Business Concept ................................................................................................. 234.1 Definition of Concept ............................................................................................. 234.2 Why Shared Infrastructure? .................................................................................... 244.3 Why not Before and why not More?....................................................................... 254.4 Governmental Push................................................................................................. 264.5 Infrastructure Sharing’s Impact on Goals ............................................................... 274.6 Size of Market......................................................................................................... 284.7 Shared Infrastructure in Other International Markets ............................................. 294.8 Key Findings........................................................................................................... 33
5. Ericsson – the Company Behind................................................................................ 355.1 Total Growth of Ericsson India ............................................................................... 355.2 Offered Services...................................................................................................... 365.3 The People .............................................................................................................. 385.4 Why Include in Ericsson Business?........................................................................ 385.5 Expectations............................................................................................................ 395.6 Key Findings........................................................................................................... 39
6. Analysis ........................................................................................................................ 406.1 Investment Analysis................................................................................................ 406.2 Market Analyses ..................................................................................................... 476.3 Risk Analysis .......................................................................................................... 566.4 Analyses Findings................................................................................................... 596.5 Key Findings........................................................................................................... 60
7. Entry Strategy Conclusion ......................................................................................... 617.1 Action Plan Model .................................................................................................. 617.2 Entry Strategy Conclusion and Discussion............................................................. 647.3 Recommendations for Further Studies.................................................................... 67
References........................................................................................................................ 68Appendixes....................................................................................................................... 75
V
Appendix I – Definitions .............................................................................................. 75Appendix IIa) – Tower Estimations Spreadsheet ......................................................... 78Appendix IIb) – Tower Cost Estimations Spreadsheet................................................. 79Appendix III – Current Players in Site Leasing Business............................................. 80
1
1. Introduction
The chapter will discuss and clarify the background, main purpose and sub purpose, and delimitations of the thesis. It will also present the disposition of the thesis in order to get a clear picture of the structure and content of the paper.
1.1 BackgroundIndia is today one of the fastest growing telecom markets in the world. With around five million new subscribers per month the market holds great business opportunities for telecom vendors like Ericsson (TRAI, 2006). Even though Ericsson is presently the market leader the company must continuously review its service and product portfolio and look for new opportunities to stay on the top.
Recent changes in the market have lead to an opening of a new business in India, the main scope being to lease out space on telecommunication sites to multiple operators. The business has been present in other markets for several years, but has not until recently been applicable in India. Today there exist nine major operators in the country and each operator owns their own sites, where the tower and the equipment needed to run a network is put up. In many areas three towers from three different operators can be seen next to each other. To cut expenses operators could instead share one tower. In this way many current market challenges, like the almost nonexistent network coverage in rural areas, esthetic concerns, and lack of space in urban areas, are expected to improve. Even though all of these challenges are of importance to address, the challenge of bringing network to rural India is viewed to be the most crucial. Network coverage in rural areas isexpected to not only result in a growth of the GDP but also in improved conditions for India’s poor rural population. The government of India has realized these benefits to theeconomy and to the individual citizen and has therefore started a project to kick-start an implementation of the idea. The government has also realized that a third party is most likely needed to supply the market with the tower sharing solution because of the present difficulties for the operators to run the business on their own. Such difficulties are for example the rivalry culture between the operators and their need to focus more on theircore business due to the immense market growth. The project has therefore lead to a new business opportunity for companies connected to the telecom market.
Ericsson has identified this new business opportunity as a possibility to grow in the increasingly important service segment. Ericsson believes, among other positive effects, that such a service could imply an added value to their customers. As an effect, Ericsson is presently more interested in how to enter the business than if they should enter. The thesis will therefore investigate and analyze the market and its expectations and give recommendations for a successful entry strategy.
1.2 PurposeThe main purpose and aim of the thesis is through various analyses answer the question; how should Ericsson enter the “telecom site leasing” business in India. In order to reach
2
an answer to the “how” question, it is necessary to deal with the question if Ericsson should enter the industry. It is necessary because it gives a broader platform to stand on when suggesting entrance strategies. The thesis aims at answering this question through firstly a model which explains the internal course of action and secondly the internal and external strategic choices. The hope is that the thesis will contribute to the material needed by Ericsson to make a successful business entrance in the market.
1.4 DelimitationsThe thesis has been limited to a general strategic discussion not including into depth evaluation of the technological platform. The technology of how a mobile network is run is very complex. When necessary to include technical aspects simplifications of the real world will be made.
The thesis does also not include a thorough business intelligence analysis of the market players and possible partners. It will hence not go into detail of each such possible playerand partner, but will instead generalize them into groups. The difficulty in extracting such information is one reason behind this limitation. The sensitiveness of the subject and difficulties in the Indian market are two other reasons. The information in this area will therefore be taken from the internet and personal contacts within Ericsson.
The thesis has also been limited to only include the result of various cost calculations.The calculations have been made from partially sensitive numbers for Ericsson and will therefore not be made public.
1.5 Target GroupThe principal target group of the thesis is Ericsson’s service unit in India. Other target groups include students at the Industrial Engineering and Management program and the Production Management department at Lund’s Institute of Technology.
1.6 Disposition of the ThesisThe first chapter gives an introduction to the paper. It explains the background, the purpose and delimitations, and clarifies the disposition of the thesis.
The second chapter presents the methodology and the theoretical framework. The methodology explains how the information to the thesis has been gathered. The information will be categorized as primary or secondary, the primary mostly being interviews and discussions with Ericsson employees, the secondary mostly being desktop research. The methodology will also discuss the validity and reliability of the thesis. The theoretical framework will moreover define and present the theoretical content of the thesis. The theoretical content here is the tools and models used in the analyses.
The third chapter provides the reader with information about the Indian telecom market. The Indian market is different from the Swedish market and needs to be explained in order to understand the need for the proposed business.
3
The fourth chapter deals with the concept of the “telecom site leasing” business. The chapter will define the concept and discuss various opportunities and challenges with it. It will also present a global study of the business in selected countries. The chapter aims at laying a foundation for understanding the business and why Ericsson wants to enter it.
The fifth chapter presents Ericsson India. The chapter discusses the growth, the services, the people, and the expectations of the business. The chapter will be an important ground to draw the internal factors conclusions from.
The sixth chapter analyzes the business out of an Ericsson perspective. The models and tools presented in the theoretical framework will here be applied to the content of the thesis. The aim of the analyses is to give a picture of the industry to understand external factors, but also give a picture of Ericsson’s strengths and weaknesses to understand internal factors. The analyses will be the platform which the entry strategy will be built on.
The seventh and final chapter summarizes the result of the thesis. It will provide the reader with an internal action plan, which should be executed before, during, and after entering the market. The chapter will also present the concluded entry strategy, both how to prepare internally and where and how to enter externally. The chapter will, with this conclusion, answer the question which was the main purpose of the thesis; how Ericsson should enter the “telecom site leasing” business. The thesis ends with some recommendations for further studies in order to improve the knowledge base and hence the strategy.

4
2. Practical and Theoretical Framework
The practical and theoretical framework chapter explains the methodology of the thesis and the models and tools used. The practical framework aims at guiding the thesis target group through the research and how it was executed. The aim of the theoretical framework is to present the models and tools used in the thesis and why they have been chosen in order to come to the conclusion.
2.1 MethodologyTo gather information for the thesis three main research methods have been used, these being interviews, general observations, and desktop-based research. Desktop research has been the natural start to understand the market, the concept, Ericsson India, and the theoretical part of the models used in the analyses. When continuing to the Ericsson perspective and applying the theoretical models to the market and Ericsson, the use ofprimary sources have been necessary. Observations made of working procedures and cultural differences have also contributed to the analyses.
These methods have been chosen with regard to the purpose and the market situation. Difficulties, as will be further elaborated on in the primary sources chapter, has prevented the use of some other methods.
2.1.1 Primary SourcesThe primary sources used for interviews and discussions have been people from Ericssonboth in India and head office in Stockholm. The Indian research was performed in Delhi, Ericsson’s Indian head office, for two months in the months of August and September. These primary sources have helped with the understanding of the market, the business, and Ericsson’s expectations. They have also provided with all the information necessary to perform the cost/profit analysis, statistics, and internal reports.
The choice of the primary sources has been a natural result of discussions with the thesis company supervisor. The supervisor, Mr Rajul Kumar, has many times provided with helpful tips of people to talk to for information regarding different questions. In most cases these tips have lead to talks with the Ericsson India’s manager of network roll-out (NRO), Mr Vibhas Sharma.
It should be noted that the “corporate” culture in India and the sensitiveness of the topic made it difficult to gain trust for an open discussion of various issues within Ericsson India. A general reluctance to share information was a challenge which was difficult to overcome. The reluctance to share is believed to not only stem from the sensitiveness of the topic but also the lack of professional merits and maybe also the fact of me being a woman. In India professional status is very important to get access to information and time from employees. Unfortunately it is also a country which is far from equality between men and females.
5
2.1.2 Secondary SourcesAs mentioned, desktop research has been a widely used method in the paper. The Ericsson internal database, which all Ericsson employees get access to, has been an important source of information. Many consultation papers and relevant news articles have been extracted from this database. These papers have contributed to the understanding of the market and the business concept, but also in the understanding of Ericsson.
Another important secondary data source has been the annual reports from the American tower industry. Companies listed on one US’s stock exchanges must follow a certain format, called 10K, when writing their annual reports (U.S. Securities and Exchange Commission, 2006). Thanks to this law the annual reports contain a lot of information, both detailed and general. These reports have therefore contributed to a better understanding of the tower industry and the potential of a similar business idea in the Indian market.
Other sources which have been of great importance for the study of the market and the concept are the websites of the Cellular Operators Association of India (COAI), Telecom Regulatory Authority of India (TRAI), and the Department of Telecommunication (DoT). As for the theoretical part of the models used in the analyses, the Harvard Business Review has proven to be yet another great source.
2.1.3 Validity and ReliabilityThe thesis contains sources of error that may affect the degree of validity in the analysis results. Six main such sources have been identified; lack of more primary sources, objectivity, cultural difficulties, internet reliability, validity of assumptions made from the American tower industry, and varying results from different secondary sources. These will be discussed below.
Firstly, the sensitiveness of the topic, being a strategic proposition, brought some difficulties, as already mentioned, when collecting information. The research has therefore mostly been made from written secondary sources. It is estimated that the results would be more reliable if more primary sources would have been used. The viewpoints from the wireless service providers themselves and the regulators in the country would, for example, have provided with a more reliable analysis.
Secondly, it should be understood that the objectivity of the thesis can be questioned since the research has been done at Ericsson for Ericsson. The thesis will naturally be influenced by Ericsson’s believes of the “telecom site leasing” market.
Thirdly, the cultural differences have affected the possibility to collect information from the primary sources and hence the results. As mentioned, the lack of professional status and being a female are two aspects of these differences which are estimated to have affected the time taken by these sources to contribute to more accurate results.
6
Fourthly, information has been extracted from the internet, which as a result has contributed to the final conclusion. The internet is an obvious possible source of error.
Fifthly, many assumptions have been made from the American tower industry. The assumptions may be a source of error if the differences of the markets prove to be larger than expected.
Finally, Ericsson has, as most companies, a wide internal database where many reports can be found. These reports are mainly written by various consultant companies, which sometimes use varying data. This data has to some extent been used and contributed to the results. It is estimated that the data could be a possible source of error.
2.2 Theoretical FrameworkTo answer the question how Ericsson should enter the business of “telecom site leasing” in India, the thesis will provide the reader with five analyses; cost/profit analysis, barriers of entry analysis, five forces analysis, SWOT analysis, and a financial respective partner risk analysis. These analyses will lead to a conclusion to the above question. The conclusion will in its turn be presented as a model, the model best explained as an action plan specific for Ericsson to follow for a successful entry. The analyses will also lead to a conclusion of a strategic position, in terms of price vs. perceived service benefits, of thebusiness in the industry.
The reason why these models have been chosen is because each of them gives different valuable insights to the market. An investment and sensitivity analysis highlights the potential of the business, but also the risks. The “barriers of entry”- and “five forces” -analysis gives information about which forces and barriers is needed to decrease or rise to increase profitability. The SWOT analysis gives a clear picture of Ericsson’s strengths which should be taken advantage of in the entry strategy. It also addresses the threats and weaknesses which Ericsson needs to look out for. They have hence been evaluated to provide the best support to draw the conclusion from. Each analysis tool used in the thesis is presented below
2.2.1 Investment AnalysisA cost/profit analysis is of great importance to understand how to strategically price ones services and or products. In such an analysis all costs and revenues associated with the service/product should be included over the life of the investment. In this way the profit margin can be viewed over the years. To further analyze the profitability of the business calculations as Net Present Value (NPV), Pay Back (PB) period, and Internal Rate of Return (IRR) should be done. The mathematical formulas can be seen below.

7
N
tt
t
i
CNPV
0 )1(
NC
IPBperiod
N
tt
0
N
tt
t
IRR
CI
0 1
When the initial cost analysis is finished a sensitivity analysis is easily performed. Through the sensitivity analysis both different risks and opportunities can be relieved.
2.2.2 Barriers of Entry Analysis1
When entering a new business, as when entering a new market, six major entry barriers exist; economies of scale, brand identification, capital requirement, cost disadvantages independent of size, access to distribution, and government policy (Porter, 1979). The acquisition route of entry, which many firms choose, faces other problems which will not be discussed here (Yip, 1982). The “barriers of entry” analysis is important to understand the difficulties and gateways when entering a business.
Economies of scale – The economies of scale barrier determine entry by forcing the aspirant either to come in on a large scale or to accept a cost disadvantage.
Brand identification – Brand identification creates a barrier by forcing entrants to spend heavily to overcome customer loyalty.
Capital requirement – The need to invest large financial resources in order to compete creates a barrier to entry.
Cost disadvantages independent of size – Incumbent companies may have cost advantages not available to potential rivals, no matter what their size and attainable economies of scale. These advantages can e.g. stem from the effects of the learning curve (and the experience curve) and proprietary technology solutions.
Access to distribution – An entrant in any market or business must secure distribution of its services.
Government policy – The government can limit or even foreclose entry to industries with such controls as license requirements. The government can also play a major indirect role by affecting entry barriers through institutional voids as lack of infrastructure.
1 Source is Porter, 1979 if not otherwise stated.
Ct = Cash flowi = discount ratet = time of the cash flowN = total time of projectI = project initial investmentNPV = Net Present ValuePB period =Pay Back PeriodIRR = Internal Rate of Return
8
2.2.3 Porter’s Five Forces Analysis2
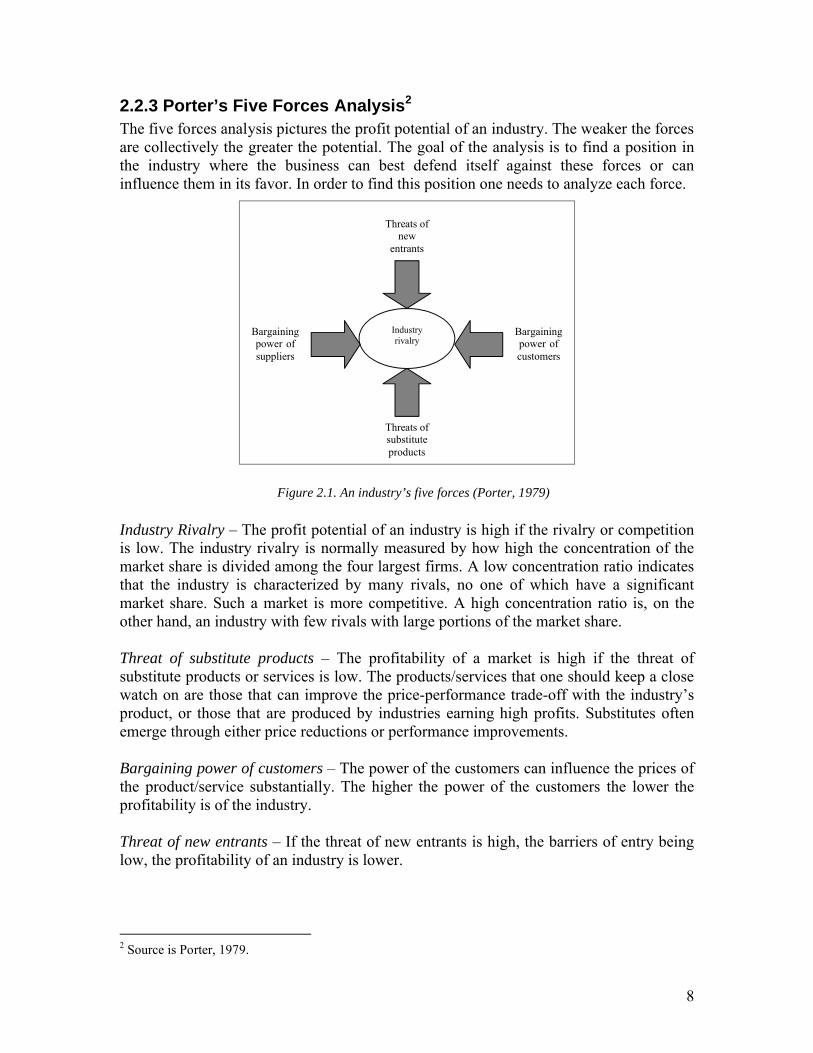
The five forces analysis pictures the profit potential of an industry. The weaker the forces are collectively the greater the potential. The goal of the analysis is to find a position in the industry where the business can best defend itself against these forces or can influence them in its favor. In order to find this position one needs to analyze each force.
Industry Rivalry – The profit potential of an industry is high if the rivalry or competition is low. The industry rivalry is normally measured by how high the concentration of the market share is divided among the four largest firms. A low concentration ratio indicates that the industry is characterized by many rivals, no one of which have a significant market share. Such a market is more competitive. A high concentration ratio is, on the other hand, an industry with few rivals with large portions of the market share.
Threat of substitute products – The profitability of a market is high if the threat of substitute products or services is low. The products/services that one should keep a close watch on are those that can improve the price-performance trade-off with the industry’s product, or those that are produced by industries earning high profits. Substitutes often emerge through either price reductions or performance improvements.
Bargaining power of customers – The power of the customers can influence the prices of the product/service substantially. The higher the power of the customers the lower the profitability is of the industry.
Threat of new entrants – If the threat of new entrants is high, the barriers of entry being low, the profitability of an industry is lower.
2 Source is Porter, 1979.
Industryrivalry
Bargaining power of customers
Bargaining power of suppliers
Threats of substitute products
Threats of new
entrants
Figure 2.1. An industry’s five forces (Porter, 1979)
9
Bargaining power of suppliers – Alike the bargaining power of customers, the higher the power of the suppliers the lower the profitability is of the industry.
2.2.4 SWOT Analysis3
Another well known analysis tool is the SWOT model. The model is useful in order to realize and understand both the strengths and opportunities, but also the weaknesses and threats of a business. The goal of the analysis is to highlight the internal weak areas which need attention and strong areas which should be put emphasis on toward the customer. The goal is furthermore to understand and identify the external threats and opportunities of the business. The SWOT analysis gives further input how to strategically position oneself in the industry.
2.2.5 The Strategy Clock Analysis4
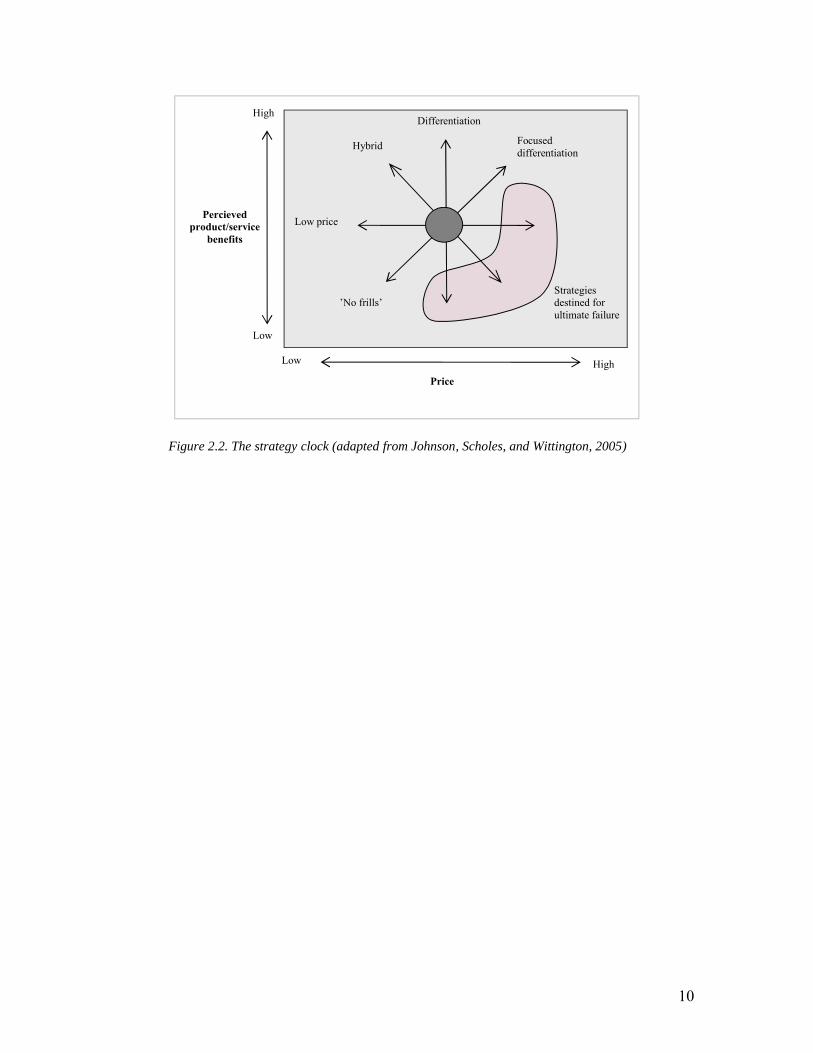
The strategy clock analysis clarifies the competitive strategic options of a new business. To win customers in an industry with a number of players a company needs to place its products or services in a strategic position. The strategic clock represent different such positions.
‘No frills’ - The ‘no frills’ strategy focuses on low prices and not quality or extra benefits to the customer. Such a service/product fits well in a price sensitive market segment. Risk: narrow market segment reach.
Low price – The low price strategy focuses the competitive power on price while still offering the same quality and benefits of the service as competitors. Risks: price wars and low margins; need to be cost leader.
Hybrid – The hybrid strategy tries to compete with price and quality/benefits simultaneously. Risk: need to have a low cost base.
Differentiation – The differentiation strategy aims at delivering high quality and extraordinary service benefits to the customers either to a premium price or similar price as competitors. Risks: added value enough to bear a premium price or need to have a low cost base to compete with similar price as competitors.
Focused differentiation – The focused differentiation strategy focus on a small market segment capable and willing to pay a higher price for high service benefits. Such a service/product is usually supported by a strong brand. Risks: narrow market segment reach and perceived service/product benefits.
3 Source is Johnson, Scholes, and Wittington, 20054 Source of analysis tool: Johnson, Scholes, and Wittington, 2005
10
’No frills’
Low price
Hybrid
Differentiation
Focused differentiation
Strategies destined for ultimate failure
Low
High
High
Price
Percieved product/service
benefits
Low
Figure 2.2. The strategy clock (adapted from Johnson, Scholes, and Wittington, 2005)
11
3. The Indian Market
In this section information about the present telecom industry in India will be presented. The chapter has been included in order to understand the need for shared infrastructure and its role in the Indian market. Topics that will be dealt with include history of mobile services in India, market growth, stakeholders, and industry challenges.
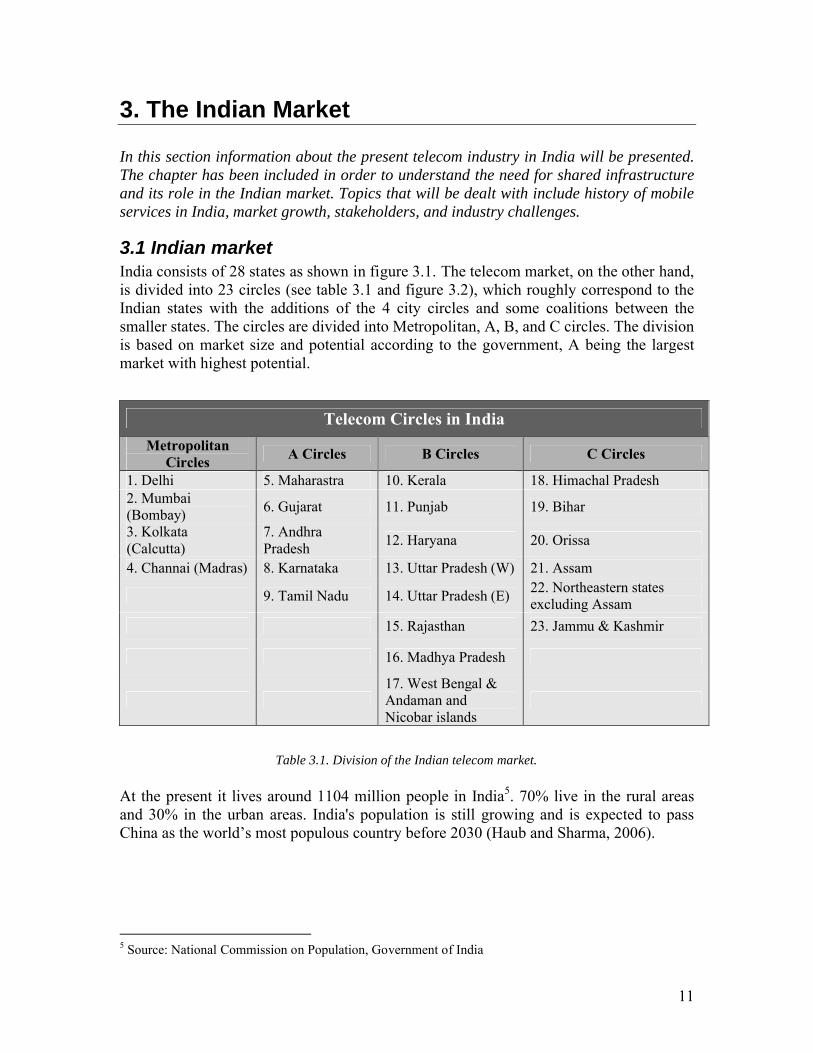
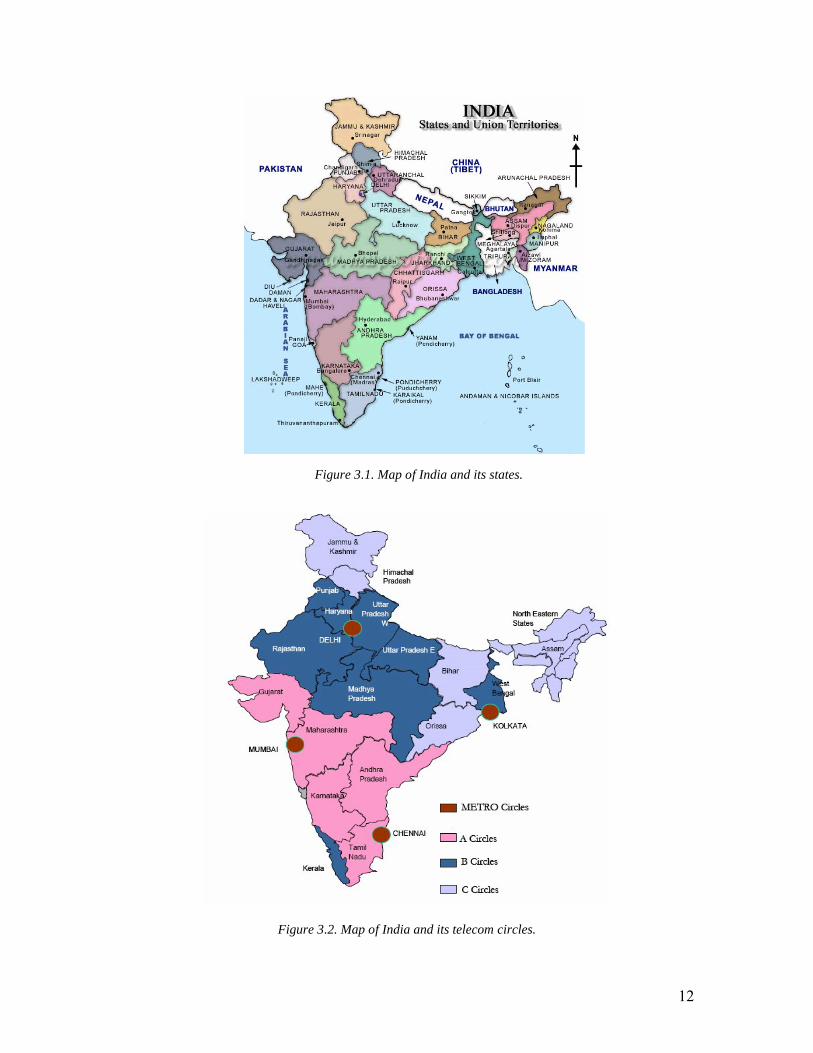
3.1 Indian marketIndia consists of 28 states as shown in figure 3.1. The telecom market, on the other hand, is divided into 23 circles (see table 3.1 and figure 3.2), which roughly correspond to the Indian states with the additions of the 4 city circles and some coalitions between the smaller states. The circles are divided into Metropolitan, A, B, and C circles. The division is based on market size and potential according to the government, A being the largest market with highest potential.
At the present it lives around 1104 million people in India5. 70% live in the rural areas and 30% in the urban areas. India's population is still growing and is expected to pass China as the world’s most populous country before 2030 (Haub and Sharma, 2006).
5 Source: National Commission on Population, Government of India
Telecom Circles in India
Metropolitan Circles
A Circles B Circles C Circles
1. Delhi 5. Maharastra 10. Kerala 18. Himachal Pradesh2. Mumbai (Bombay)
6. Gujarat 11. Punjab 19. Bihar
3. Kolkata (Calcutta)
7. Andhra Pradesh
12. Haryana 20. Orissa
4. Channai (Madras) 8. Karnataka 13. Uttar Pradesh (W) 21. Assam
9. Tamil Nadu 14. Uttar Pradesh (E)22. Northeastern states excluding Assam
15. Rajasthan 23. Jammu & Kashmir
16. Madhya Pradesh
17. West Bengal & Andaman and Nicobar islands
Table 3.1. Division of the Indian telecom market.
12
Figure 3.1. Map of India and its states.
Figure 3.2. Map of India and its telecom circles.
13
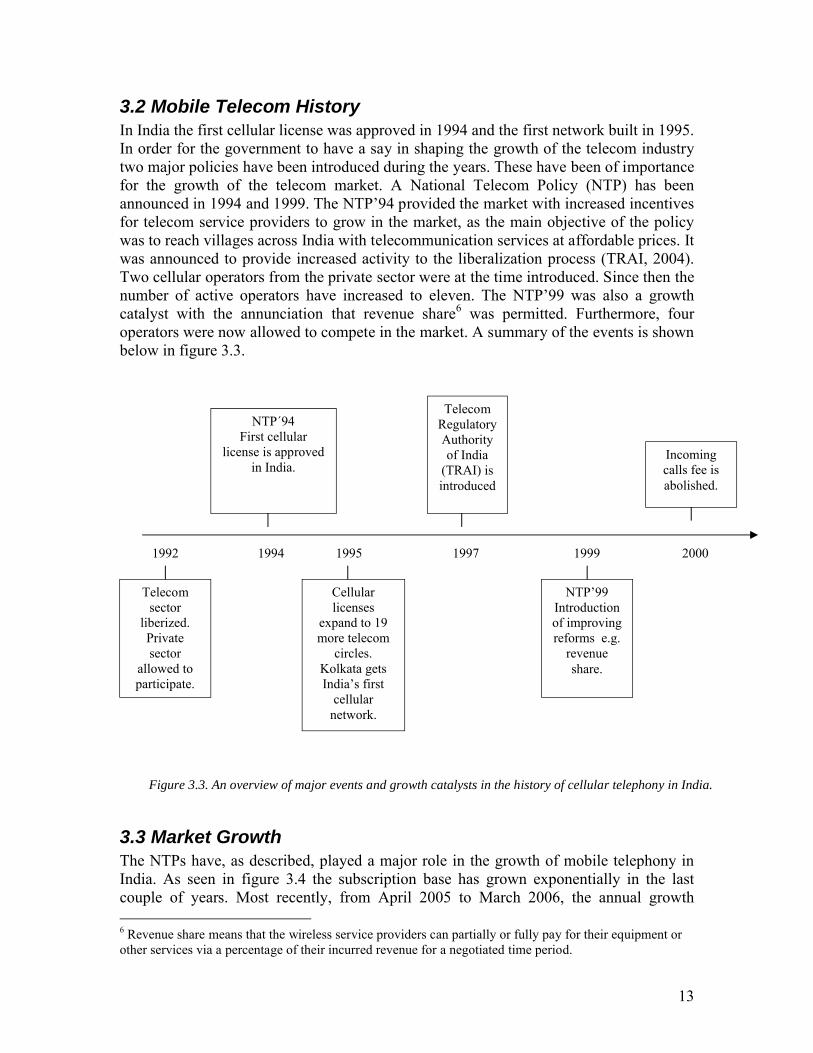
3.2 Mobile Telecom HistoryIn India the first cellular license was approved in 1994 and the first network built in 1995. In order for the government to have a say in shaping the growth of the telecom industry two major policies have been introduced during the years. These have been of importance for the growth of the telecom market. A National Telecom Policy (NTP) has been announced in 1994 and 1999. The NTP’94 provided the market with increased incentives for telecom service providers to grow in the market, as the main objective of the policy was to reach villages across India with telecommunication services at affordable prices. It was announced to provide increased activity to the liberalization process (TRAI, 2004). Two cellular operators from the private sector were at the time introduced. Since then the number of active operators have increased to eleven. The NTP’99 was also a growth catalyst with the annunciation that revenue share6 was permitted. Furthermore, four operators were now allowed to compete in the market. A summary of the events is shown below in figure 3.3.
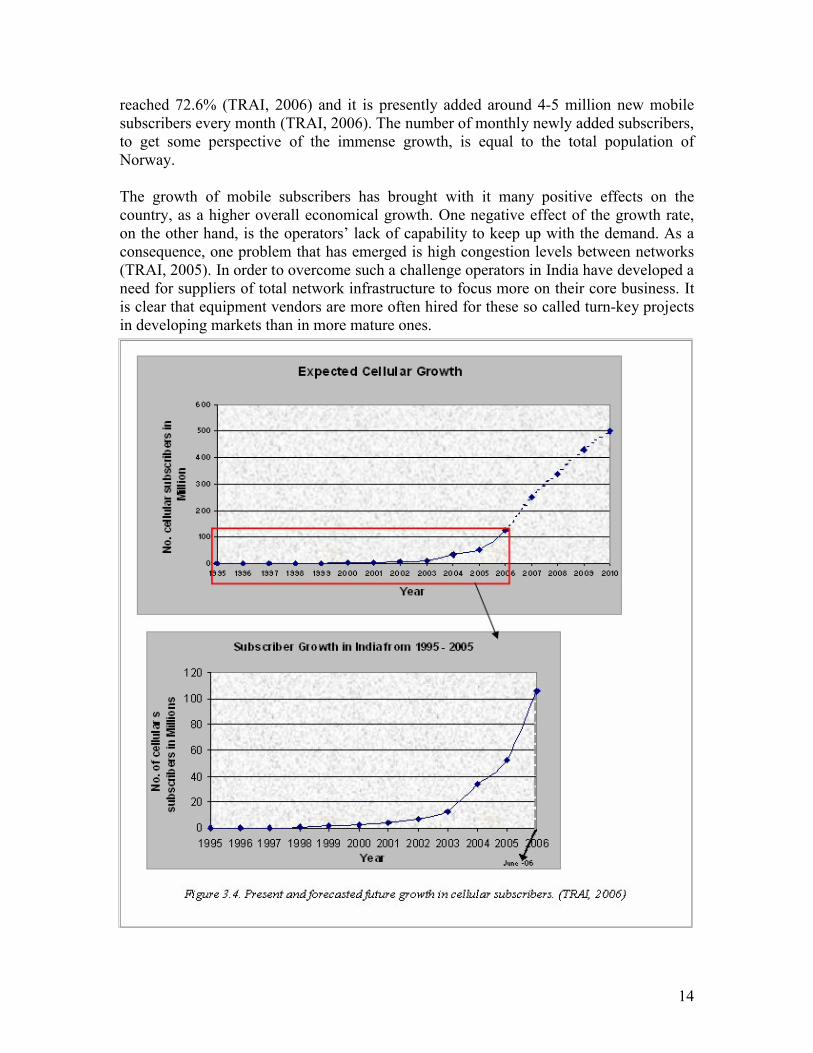
3.3 Market GrowthThe NTPs have, as described, played a major role in the growth of mobile telephony in India. As seen in figure 3.4 the subscription base has grown exponentially in the last couple of years. Most recently, from April 2005 to March 2006, the annual growth 6 Revenue share means that the wireless service providers can partially or fully pay for their equipment or other services via a percentage of their incurred revenue for a negotiated time period.
Telecom sector
liberized. Private sector
allowed to participate.
NTP´94First cellular
license is approved in India.
NTP’99Introduction of improving reforms e.g.
revenue share.
Telecom Regulatory Authority of India
(TRAI) is introduced
Cellular licenses
expand to 19 more telecom
circles. Kolkata gets India’s first
cellular network.
1992 1994 1995 1997 1999 2000
Incoming calls fee is abolished.
Figure 3.3. An overview of major events and growth catalysts in the history of cellular telephony in India.
14
reached 72.6% (TRAI, 2006) and it is presently added around 4-5 million new mobile subscribers every month (TRAI, 2006). The number of monthly newly added subscribers, to get some perspective of the immense growth, is equal to the total population of Norway.
The growth of mobile subscribers has brought with it many positive effects on the country, as a higher overall economical growth. One negative effect of the growth rate, on the other hand, is the operators’ lack of capability to keep up with the demand. As a consequence, one problem that has emerged is high congestion levels between networks (TRAI, 2005). In order to overcome such a challenge operators in India have developed a need for suppliers of total network infrastructure to focus more on their core business. It is clear that equipment vendors are more often hired for these so called turn-key projects in developing markets than in more mature ones.

15
The presently exponentially high growth rate is expected to slow down as seen in figure 3.4 above. Future governmental forecasts predict that the country will reach around 200 million subscribers at the end of 2007 and 500 million by 2010 (Raj, 2006). The calculated average growth rate from 2006 to 2010 would thus be 45% per year, to be compared to the above stated growth of around 72% the previous year. Still, almost five times as many users from June 2006 to the end of December 2010 are predicted with this forecast.
3.4 StakeholdersIn the Indian telecom sector five major stakeholders are recognized; operators, special interest groups, government/regulators, equipment vendors, and customers. These are going to be discussed in the following chapter.
3.4.1 OperatorsThe current competitive outlook among operators in India is fierce, the reason being the high number of operators and the price sensitive consumer market. Even though the NTP’99, with the introduction of revenue share, has (as seen in figure 3.5) been the biggest contributor to the decreased tariff fees, the competitiveness of the market is also regarded as an important catalyst. India has today one of the lowest tariff fees in the
world (TRAI, 2006), with tariffs around 0.02 USD/minute7. The operators can support the low tariffs because of their scale advantages. The number of subscribers which are reached with just one tower in the densely populated areas are high, resulting in a rather low cost per subscriber. The average revenue per user8 (ARPU) is around 8.0 USD (TRAI, 2006). The ARPU is lower than western markets (ARPU in Sweden is around 28 USD9), but the scale of the market makes it high enough for high total profits. The current market leader among the operators has total revenues of their mobile services of
7 ≈ average extracted from operators’ website8 Measured per month9 Source: TeliaSonera’s website
Figure 3.5. Cellular mobile growth and operators’ average effective charge per minute. (TRAI (2004) p. 5)
16
1.7 billion10 USD, to be compared to Sweden’s wireless service provider market leader TeliaSonera’s revenue for mobile services of 1.5 billion11 USD.
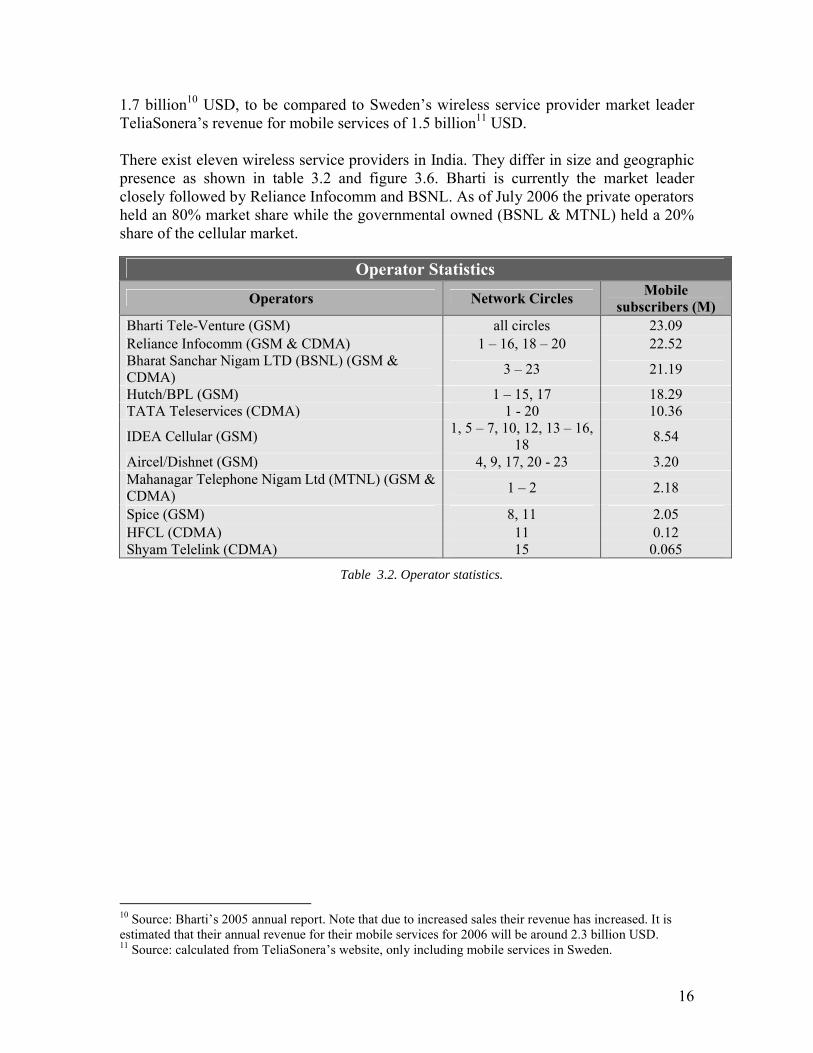
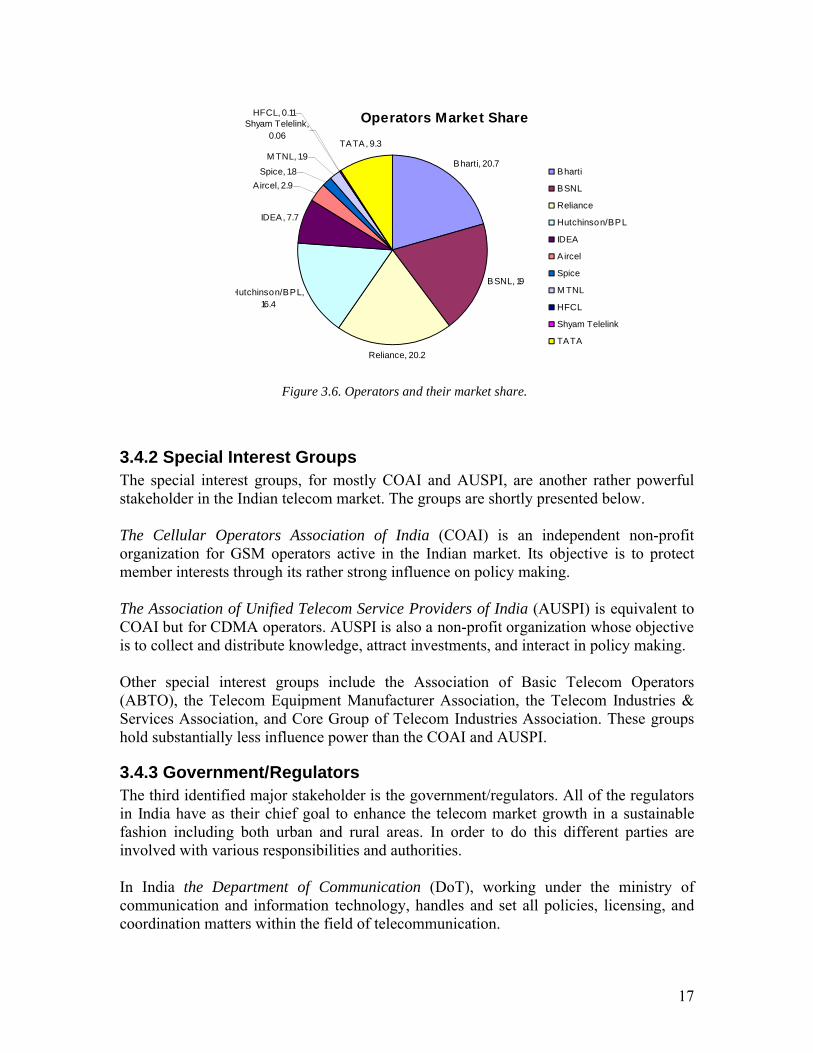
There exist eleven wireless service providers in India. They differ in size and geographic presence as shown in table 3.2 and figure 3.6. Bharti is currently the market leader closely followed by Reliance Infocomm and BSNL. As of July 2006 the private operators held an 80% market share while the governmental owned (BSNL & MTNL) held a 20% share of the cellular market.
10 Source: Bharti’s 2005 annual report. Note that due to increased sales their revenue has increased. It is estimated that their annual revenue for their mobile services for 2006 will be around 2.3 billion USD.11 Source: calculated from TeliaSonera’s website, only including mobile services in Sweden.
Operator Statistics
Operators Network CirclesMobile
subscribers (M)Bharti Tele-Venture (GSM) all circles 23.09Reliance Infocomm (GSM & CDMA) 1 – 16, 18 – 20 22.52Bharat Sanchar Nigam LTD (BSNL) (GSM & CDMA)
3 – 23 21.19
Hutch/BPL (GSM) 1 – 15, 17 18.29TATA Teleservices (CDMA) 1 - 20 10.36
IDEA Cellular (GSM)1, 5 – 7, 10, 12, 13 – 16,
188.54
Aircel/Dishnet (GSM) 4, 9, 17, 20 - 23 3.20Mahanagar Telephone Nigam Ltd (MTNL) (GSM & CDMA)
1 – 2 2.18
Spice (GSM) 8, 11 2.05HFCL (CDMA) 11 0.12Shyam Telelink (CDMA) 15 0.065
Table 3.2. Operator statistics.
17
Operators Market Share
Bharti, 20.7
BSNL, 19
Reliance, 20.2
Hutchinson/BPL, 16.4
IDEA, 7.7
Aircel, 2.9
Spice, 1.8
TATA, 9.3
M TNL, 1.9
HFCL, 0.11Shyam Telelink,
0.06
Bharti
BSNL
Reliance
Hutchinson/BPL
IDEA
Aircel
Spice
M TNL
HFCL
Shyam Telelink
TATA
3.4.2 Special Interest GroupsThe special interest groups, for mostly COAI and AUSPI, are another rather powerful stakeholder in the Indian telecom market. The groups are shortly presented below.
The Cellular Operators Association of India (COAI) is an independent non-profit organization for GSM operators active in the Indian market. Its objective is to protect member interests through its rather strong influence on policy making.
The Association of Unified Telecom Service Providers of India (AUSPI) is equivalent to COAI but for CDMA operators. AUSPI is also a non-profit organization whose objective is to collect and distribute knowledge, attract investments, and interact in policy making.
Other special interest groups include the Association of Basic Telecom Operators (ABTO), the Telecom Equipment Manufacturer Association, the Telecom Industries & Services Association, and Core Group of Telecom Industries Association. These groups hold substantially less influence power than the COAI and AUSPI.
3.4.3 Government/RegulatorsThe third identified major stakeholder is the government/regulators. All of the regulators in India have as their chief goal to enhance the telecom market growth in a sustainable fashion including both urban and rural areas. In order to do this different parties are involved with various responsibilities and authorities.
In India the Department of Communication (DoT), working under the ministry of communication and information technology, handles and set all policies, licensing, and coordination matters within the field of telecommunication.
Figure 3.6. Operators and their market share.
18
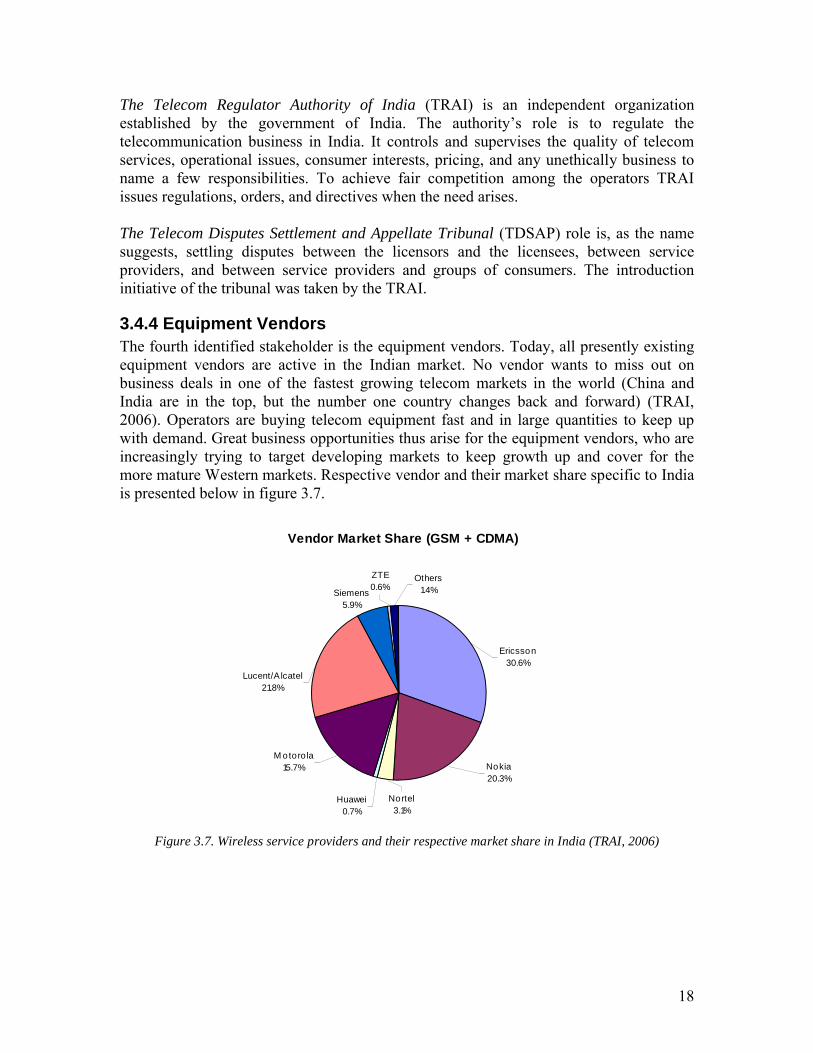
Figure 3.7. Wireless service providers and their respective market share in India (TRAI, 2006)
The Telecom Regulator Authority of India (TRAI) is an independent organization established by the government of India. The authority’s role is to regulate the telecommunication business in India. It controls and supervises the quality of telecom services, operational issues, consumer interests, pricing, and any unethically business to name a few responsibilities. To achieve fair competition among the operators TRAI issues regulations, orders, and directives when the need arises.
The Telecom Disputes Settlement and Appellate Tribunal (TDSAP) role is, as the name suggests, settling disputes between the licensors and the licensees, between service providers, and between service providers and groups of consumers. The introduction initiative of the tribunal was taken by the TRAI.
3.4.4 Equipment VendorsThe fourth identified stakeholder is the equipment vendors. Today, all presently existing equipment vendors are active in the Indian market. No vendor wants to miss out on business deals in one of the fastest growing telecom markets in the world (China and India are in the top, but the number one country changes back and forward) (TRAI, 2006). Operators are buying telecom equipment fast and in large quantities to keep up with demand. Great business opportunities thus arise for the equipment vendors, who are increasingly trying to target developing markets to keep growth up and cover for the more mature Western markets. Respective vendor and their market share specific to India is presented below in figure 3.7.
Vendor Market Share (GSM + CDMA)
Nokia20.3%
Others1.4%
Ericsson30.6%
Huawei0.7%
Nortel3.1%
M otorola15.7%
Lucent/A lcatel21.8%
Siemens5.9%
ZTE0.6%
19
3.4.5 Customer NeedsThe customers of mobile services are also a stakeholder. The bargaining power of a dispersed group like the end users in a big and rather poor country like India is concluded to be weak.
Customer needs are estimated to be the same in India as everywhere else in the world when it comes to telecom networks. Customers want to have a country wide geographical coverage of their mobile network, good quality of the services (e.g. no congestion between networks), and reasonable prices for usage of the network. The last statement may be more specific to India with concern to the price sensitive market. Presently, only the last need is fulfilled, both the network reach and the quality are not at customer satisfaction.
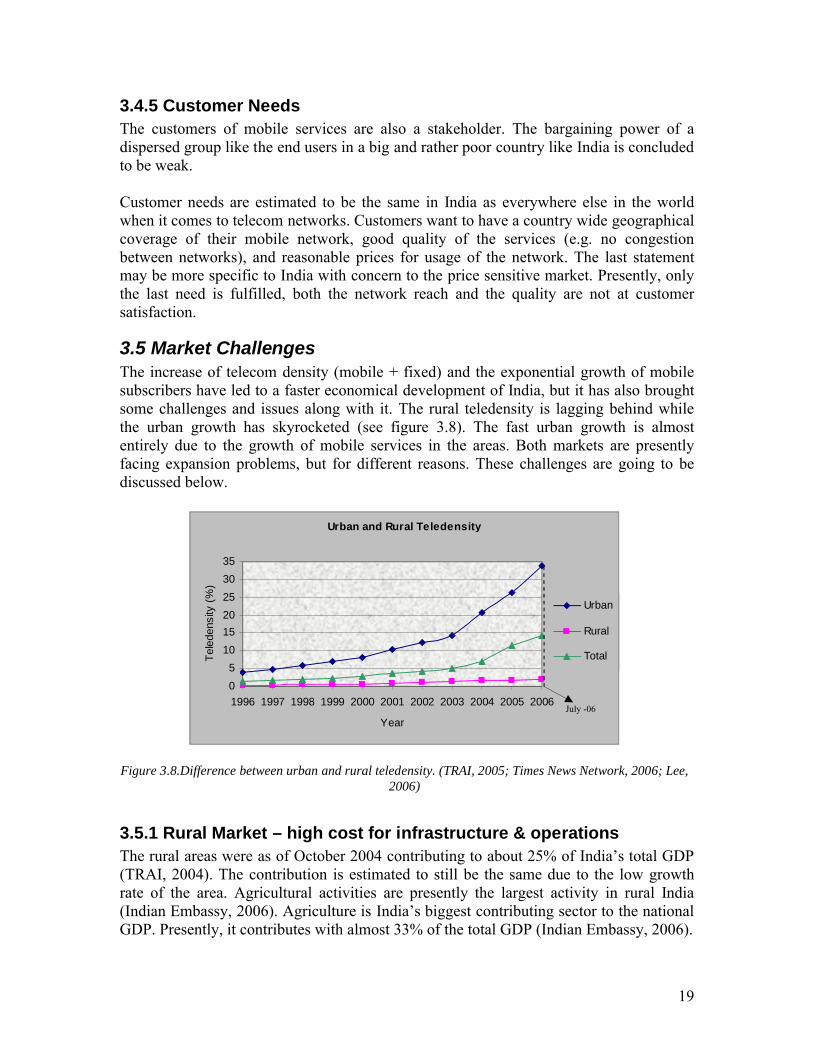
3.5 Market ChallengesThe increase of telecom density (mobile + fixed) and the exponential growth of mobile subscribers have led to a faster economical development of India, but it has also brought some challenges and issues along with it. The rural teledensity is lagging behind while the urban growth has skyrocketed (see figure 3.8). The fast urban growth is almost entirely due to the growth of mobile services in the areas. Both markets are presently facing expansion problems, but for different reasons. These challenges are going to be discussed below.
3.5.1 Rural Market – high cost for infrastructure & operationsThe rural areas were as of October 2004 contributing to about 25% of India’s total GDP (TRAI, 2004). The contribution is estimated to still be the same due to the low growth rate of the area. Agricultural activities are presently the largest activity in rural India (Indian Embassy, 2006). Agriculture is India’s biggest contributing sector to the national GDP. Presently, it contributes with almost 33% of the total GDP (Indian Embassy, 2006).
Urban and Rural Teledensity
0
5
10
15
20
25
30
35
1996 1997 1998 1999 2000 2001 2002 2003 2004 2005 2006
Year
Tel
eden
sity
(%
)
Urban
Rural
Total
July -06
Figure 3.8.Difference between urban and rural teledensity. (TRAI, 2005; Times News Network, 2006; Lee, 2006)
20
The Indian government and TRAI have tried to encourage more operators to invest in the rural markets. The result of an increase of telecom density in rural areas is an enhancement of efficiency and efficacy of the already existing commercial and agricultural activities. One example is the possibility for farmers via telecom services to access information on agriculture topics like trading prices and fertilizers (Prahalad, 2005). The telecom sector is counted as being the single strongest factor to achieve economic growth (TRAI, 2004). The regulators have not succeeded as of today with pushing the operators to expand the telecom network to these areas and thus the rural market is still lagging behind the expected growth levels. As of July 2006 the cellular market penetration in the rural areas was 1.87% (Times News Network, 2006).
As mentioned, around 70% of India’s population lives in the rural areas, meaning around 770 million people. The possibilities for the operators to increase their subscription base in these areas should therefore be immense, but as the buying power here is substantially lower than in the cities and customers are more dispersed, benefits get reduced. The deployment of wireless telecom services in rural India have, on the other hand, some advantages compared to other developing countries. A wide expanding Optical Fibre network already exists through out the country reaching rural areas. The reason why the operators still haven’t moved their business further out in the country stems from various reasons, these being discussed below (summary based on various sources within Ericsson India).
1. The vast growth of the telecom market since the introduction of mobile networks in 1995 has led to problems for the operators to keep up. Most operators have therefore focused on the bigger city areas to win as many subscribers as possible in the least amount of time and the least amount of investments. The cost per subscriber is higher in the rural areas.
2. Even though an Optical Fibre network already exists to a great extent it is far from the total last mile infrastructure of a network (see figure 3.9 for a graphical representation of the problem). Costs of building a last mile infrastructure for a mobile network is a huge investment.
3. Rural areas incur higher costs for logistics, maintenance, and electricity due to the remote locations and lack of availability of electricity. Generators are needed as power supply for the equipment in these areas.
4. One might expect the governmental owned operators (BSNL & MTNL) to take on the responsibility to build out the infrastructure, since this will help the growth of the GDP faster. BSNL does also take some responsibility, but they are slowed down because of the first reason stated above (see bullet 1) and the bureaucracy environment within the company. Furthermore, it is crucial for BSNL to run their business in a cost sustainable fashion to stay competitive to the market competitors.

21
The TRAI’s Universal Service Objectives (USO) has made several attempts to get around these problems shown in figure 3.10 below.
Delhi Mumbai
Backbone (Optical Fibre network)Last mile
infrastructure
Rural village
Existing railway, Optical Fibre network
Last mile infrastructure missing to cover village with mobile network.
Basic network build-up between cities.
Rural network problem
Figure 3.10. TRAI’s Universal Service Objectives (TRAI (2004) p. 14)
Figure 3.9. The basic structure of problem of a mobile network.

22
Neither of these objectives has succeeded in achieving the goal of a faster increase of teledensity in the rural areas. The gap between the urban and rural has instead grown, as seen in figure 3.8.
3.5.2 City/town Market – lack of spaceThe urban market has, as shown in figure 3.8, a teledensity of around 34% as of June 2006 (Lee, 2006). Delhi has a mobile teledensity of around 43% and a total teledensity (fixed and mobile) of 60% (Singh, 2006). The biggest problems the operators are facing in the bigger city areas as Delhi are a lack of space left to continue the build-out and increased prices of site estate. Also, more recently, esthetic and safety reasons have developed. To overcome these challenges operators are now trying to share towers in order to grow in cities. Around 20% of the towers are shared by two operators (Ericsson, 2006). Usually when two operators decide to share a tower they agree on it on the premises that an “exchange” takes place. When an exchange takes place, two operators allow each other to use the others’ site to put up network facilities. Each operator still owns their own site and maintain it in usual manner, but allows the use of their site’spassive infrastructure.
3.6 Key FindingsThe key findings of the chapter are highlighted below.
Wireless growth continues, but is expected to slow down over the next four years. India is a highly competitive and price sensitive market. Operators need to focus more on their core business to grow and keep up with
demand. The telecom sector is viewed as the single strongest factor to achieve economic
growth. 98% of the rural areas are still uncovered by mobile network. The primary reason
for the slow growth rate in the regions is the higher cost per subscriber. Urban markets are facing space problems and increasingly expensive site estate
prices.
The key findings of this chapter will lay as a foundation for the continuing chapters, where the shared infrastructure concept and its opportunities will be discussed.
23
4. The Business Concept
The topic of focus in the coming chapter is the basic concept of the “telecom site leasing” business in the Indian market. The topic aims at laying a foundation for understanding the industry and why Ericsson wants to go into the business. A definition of the concept will firstly be given, followed by a discussion of the benefits, and why the concept has not been used in India before. Further discussions include the governmental initiative to start off the concept, some estimations of impact on goals and size of market, and finally a global market study.
4.1 Definition of Concept
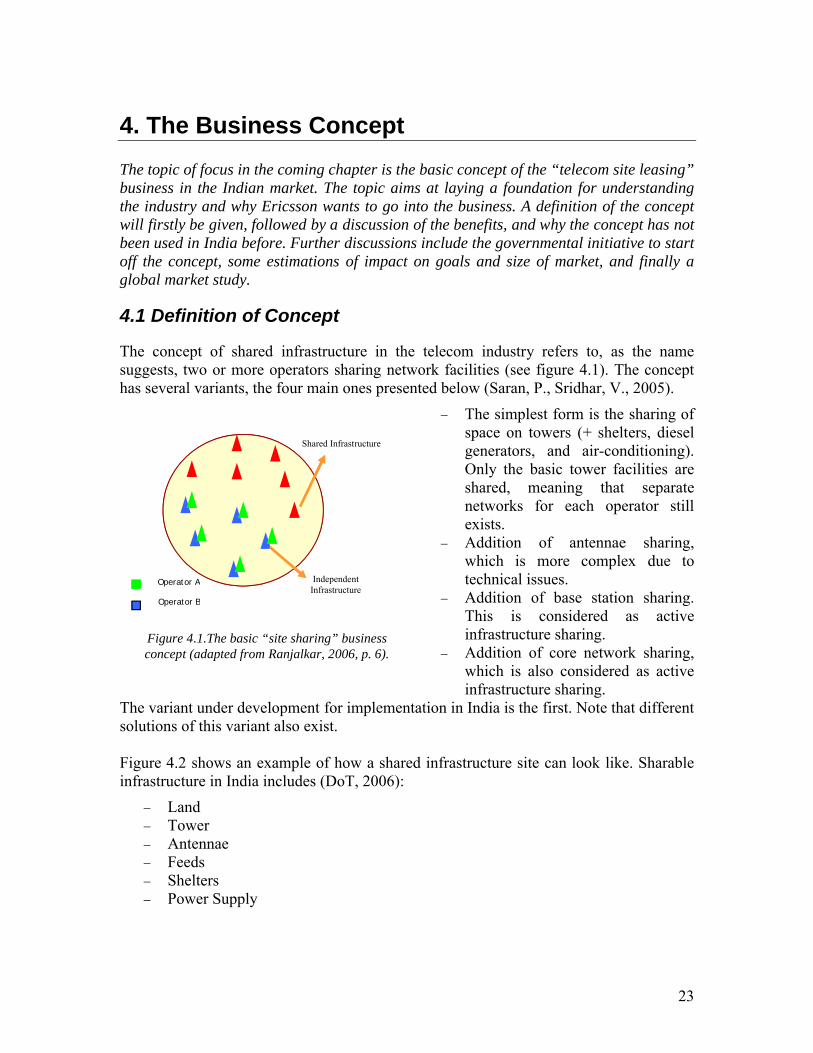
The concept of shared infrastructure in the telecom industry refers to, as the name suggests, two or more operators sharing network facilities (see figure 4.1). The concept has several variants, the four main ones presented below (Saran, P., Sridhar, V., 2005).
The simplest form is the sharing of space on towers (+ shelters, diesel generators, and air-conditioning). Only the basic tower facilities are shared, meaning that separate networks for each operator still exists.
Addition of antennae sharing, which is more complex due to technical issues.
Addition of base station sharing. This is considered as active infrastructure sharing.
Addition of core network sharing, which is also considered as active infrastructure sharing.
The variant under development for implementation in India is the first. Note that different solutions of this variant also exist.
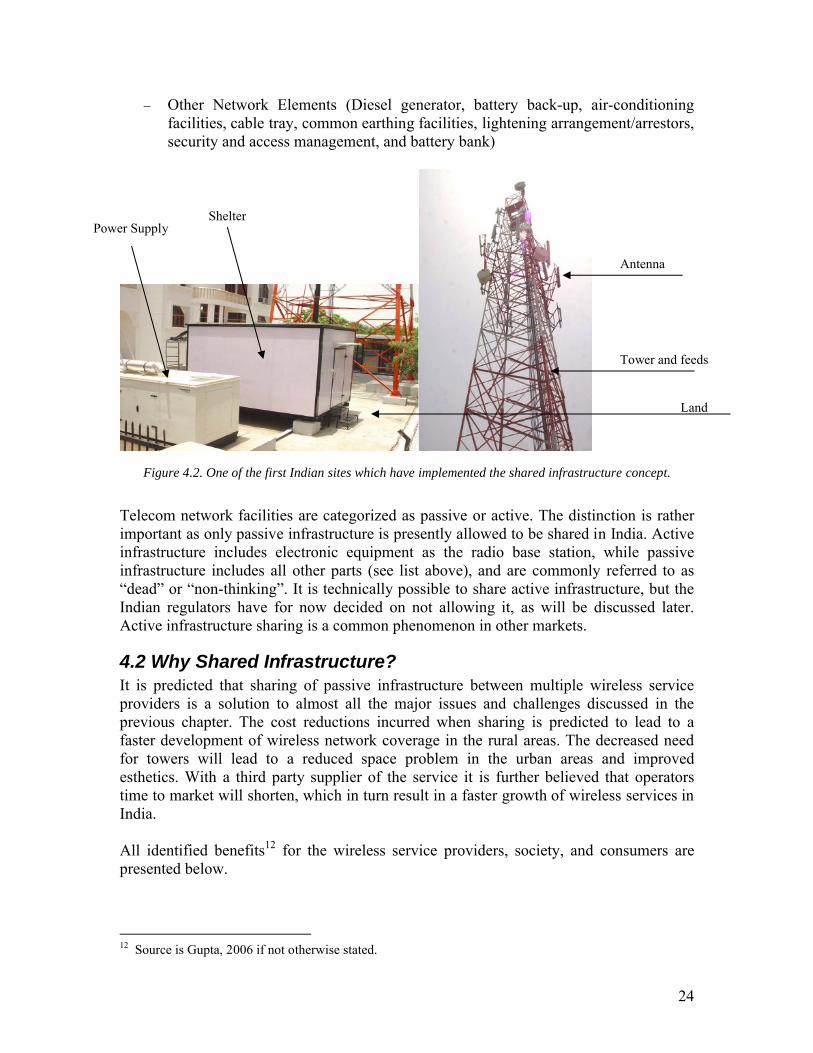
Figure 4.2 shows an example of how a shared infrastructure site can look like. Sharable infrastructure in India includes (DoT, 2006):
Land Tower Antennae Feeds Shelters Power Supply
Figure 4.1.The basic “site sharing” business concept (adapted from Ranjalkar, 2006, p. 6).
Operator A
Operator B
IndependentInfrastructure
Shared Infrastructure
Operator A
Operator B
24
Other Network Elements (Diesel generator, battery back-up, air-conditioning facilities, cable tray, common earthing facilities, lightening arrangement/arrestors, security and access management, and battery bank)
Telecom network facilities are categorized as passive or active. The distinction is rather important as only passive infrastructure is presently allowed to be shared in India. Active infrastructure includes electronic equipment as the radio base station, while passive infrastructure includes all other parts (see list above), and are commonly referred to as “dead” or “non-thinking”. It is technically possible to share active infrastructure, but the Indian regulators have for now decided on not allowing it, as will be discussed later. Active infrastructure sharing is a common phenomenon in other markets.
4.2 Why Shared Infrastructure?It is predicted that sharing of passive infrastructure between multiple wireless service providers is a solution to almost all the major issues and challenges discussed in the previous chapter. The cost reductions incurred when sharing is predicted to lead to a faster development of wireless network coverage in the rural areas. The decreased need for towers will lead to a reduced space problem in the urban areas and improved esthetics. With a third party supplier of the service it is further believed that operators time to market will shorten, which in turn result in a faster growth of wireless services in India.
All identified benefits12 for the wireless service providers, society, and consumers arepresented below.
12 Source is Gupta, 2006 if not otherwise stated.
Figure 4.2. One of the first Indian sites which have implemented the shared infrastructure concept.
Land
Tower and feeds
Antenna
ShelterPower Supply

25
Benefits for Telecom Operators13:
Decreases operators CAPEX (Capital expenditures) and allows an enhancement of coverage and penetration.
Reduces OPEX (operational expenditures) for operation and maintenance expenditures of passive infrastructure.
Facilitates Telecom Operators to meet the mandated coverage requirements in low density areas such as rural and suburban.
Reduce dropped calls (Ericsson, 2006). Saves time to market by the provision of an existing, telecom ready facility. Eliminate the need for Telecom Operators to manage non-core issues. Freeing of
capital for core areas. Less administrative hassles (DoT,2006)
Benefits to the economy and society:
Efficient use of capital in the economy. Reduce dropped calls (Ericsson, 2006). De-clutter skylines and safer city environment.
Benefits to the Consumers:
Access to network all around country, since most likely not possible without sharing of infrastructure.
Reduce dropped calls (Ericsson, 2006).
4.3 Why not Before and why not More?The primary reason why sharing of passive infrastructure has not been done sooner is believed to be because no one has thought of it before (Sharma, 2006). The development of the wireless network has been argued to initially have been slowed down from the political atmosphere in the country, and therefore taken off relatively late. Much has happened at such a speed recently that the solution has not occurred to anyone until now.
The rivalry between the operators is another identified reason. The rivalry has made it difficult for cooperation between the operators on their own initiative.
Many of the issues discussed in the previous chapter, such as lack of space and increased cost of land in urban areas, has not until recently been a problem. The need to share has as a result been insufficient in the past.
The price sensitive market has pushed tariff prices down to such an extent that operators now face a need to change their business model to increase the revenue per subscriber.
Even now when all the benefits have been identified implementation of shared infrastructure between the wireless service providers is not taking off at anticipated speed. The reason is clearly believed to be the need for a third party supplier to provide the market with a finished solution. The need of such a supplier implies a creation of a
13 Benefits in italic writing are only realized if there exists a third party supplier of the service.
26
whole new industry, much alike the one present in USA, Australia, and U.K. as will be discussed later. Some challenges of a “telecom site leasing” industry are presented below.
Capital intensive, who take on the assets on their balance sheet? Financial funding difficulties to support the fast growth. Cost effective solutions to attract Telecom Operators. Sharing reluctance between operators.
4.4 Governmental Push It lies in the government’s interest to increase teledensity across the country including the rural areas, as mentioned before. The government has therefore taken an initiative to start off a site leasing industry with a project called MOST. The idea of the Mobile Operators’ Shared Towers (MOST) project is to let a third party infrastructure provider set up sites, making them fully operational, and then lease them to several operators. In this way it is believed that both GSM and CDMA operators as private and public players, will be able to share infrastructure cost easier and to a wider extent than what is done presently.
Four flagship sites included in the MOST project have at the present already been finished in the Delhi area. A total of ten pilot sites in Delhi have been planned to be build as a start of the MOST project. It has been agreed that for these particular sites a third party will set up and maintain the passive parts of the sites, while the operators will maintain their own equipment. The infrastructure that has been agreed to share is the entire above stated passive infrastructure list except the antennae, which could not be agreed to share. The four sites are presented below.
Delhi high court, two roof-top towers have been introduced in this location. The first tower is split between Airtel, Hutch, and IDEA. The second tower is split by MTNL, Reliance, and TATA.
Rajokri, one tower shared by Airtel, Hutch, IDEA, and TATA. Dhansa, one tower shared by Airtel, Hutch, IDEA, MTNL, Reliance, and TATA.
The government joint with other interest groups, such as TRAI and COAI, are currently pushing the same concept to the rural areas. TRAI has with its universal service objectives, as explained in the previous chapter, set up a fund (the USO fund) for the purpose of providing these areas with network. According to the minister of telecommunication it is planned to build 8,000 – 10,000 shared sites, with funding from the USO fund, which would roughly cover 85% of these areas (Raj, 2006). The minister of telecommunication has also stated that a detailed study is undertaken to decide in which villages in the remote areas the USO fund will be of most assistance. These sites will be subject to bidding with regard to who the third party owner is going to be. The bidding of these future planned sites are divided into two parts, one including the passive infrastructure and the other including non-sharable active infrastructure as the radio base station. Only licensed access service providers will be eligible to bid for both parts (DoT, 2006). The percentage the fund will cover of the site costs is not at the present decided on. It is expected that these sites are going to be ready for use in around 6-8 months (Sharma, 2006).
27
The MOST project is viewed as a first step toward deregulation of further shared infrastructure such as the active radio base stations (Sharma, 2006).
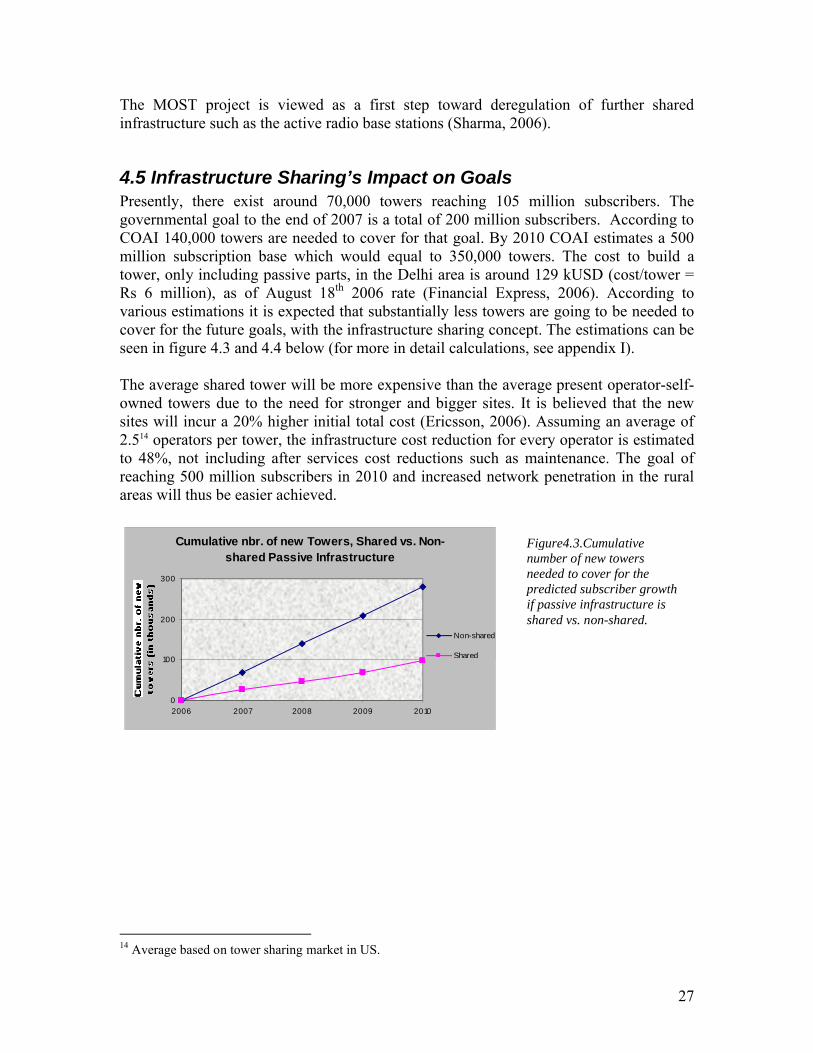
4.5 Infrastructure Sharing’s Impact on GoalsPresently, there exist around 70,000 towers reaching 105 million subscribers. The governmental goal to the end of 2007 is a total of 200 million subscribers. According to COAI 140,000 towers are needed to cover for that goal. By 2010 COAI estimates a 500 million subscription base which would equal to 350,000 towers. The cost to build a tower, only including passive parts, in the Delhi area is around 129 kUSD (cost/tower = Rs 6 million), as of August 18th 2006 rate (Financial Express, 2006). According to various estimations it is expected that substantially less towers are going to be needed to cover for the future goals, with the infrastructure sharing concept. The estimations can be seen in figure 4.3 and 4.4 below (for more in detail calculations, see appendix I).
The average shared tower will be more expensive than the average present operator-self-owned towers due to the need for stronger and bigger sites. It is believed that the new sites will incur a 20% higher initial total cost (Ericsson, 2006). Assuming an average of 2.514 operators per tower, the infrastructure cost reduction for every operator is estimated to 48%, not including after services cost reductions such as maintenance. The goal of reaching 500 million subscribers in 2010 and increased network penetration in the rural areas will thus be easier achieved.
Cumulative nbr. of new Towers, Shared vs. Non-shared Passive Infrastructure
0
100
200
300
2006 2007 2008 2009 2010
Non-shared
Shared
14 Average based on tower sharing market in US.
Figure4.3.Cumulative number of new towers needed to cover for the predicted subscriber growth if passive infrastructure is shared vs. non-shared.

28
Cumulated Cost/Operator of New Towers Shared vs. Non-shared Passive Infrastructure
0
10
20
30
40
2006 2007 2008 2009 2010
Non-shared
Shared
The minister of telecommunication, Mr Dayanidhi Maran, claims that operators can decrease their tower cost with 50% with the new concept (Financial Express, 2006). Note that this corresponds well to the above calculations of a 48% decrease. Other goals asimproving coverage, further reduction of tariffs for inhabitants with less buying power in the rural areas, and environmental and esthetic concerns are also expected to be fulfilled with the initiative from the MOST project (The Hindi Group, 2006). For these reasons, the government is now discussing with TRAI to look into the possibilities of a new policy, making sharing of infrastructure mandatory for operators (Techtree newsstaff, 2006).
4.6 Size of MarketIf the Indian market would evolve toward the American market (see chapter 4.7.1) in terms of leasing revenues per tower it could reach an annual market size revenue of 2.2 billion15 USD by 2008. In 2010 the size would be around 4.5 billion USD. Of course the Indian market is not identical to the American and the differences may imply different expectations in terms of estimations of the market size. If 20% less of the American average revenue per tower can be achieved in India, the market would still come to around 1.7 billion USD in 2008 and 3.6 billion USD in 2010 annually (see table 4.1 and 4.2).
15 The number is based on a calculated average from American Tower, Crown Castle, and SBA’s respective annual rental revenues per tower. The revenues and number of sites from the companies are extracted from their annual reports. The numbers only includes rental revenues and not site/network development services.
Figure 4.4.Cumulative cost/operator of new towers needed to cover for the predicted subscriber growth if passive infrastructure is shared vs. non-shared.

29
2008 Indian Tower Market Estimations
Cumulative nbr. of new shared towers 2008 (thousands) 47.6Average annual revenue/tower (USD in thousands) 45.7Size of Indian annual tower market (USD in billions) 2.2
Cumulative nbr. of new shared towers 2008 (thousands) 47.6Average annual revenue/tower (USD in thousands) 45.7Expected revenue diff. in percentage 20%Size of Indian annual tower market (USD in billions) 1.7
2010 Indian Tower Market Estimations
Cumulative nbr. of new shared towers 2010 (thousands) 98.0Average annual revenue/tower (USD in thousands) 45.7Size of Indian annual tower market (USD in billions) 4.5
Cumulative nbr. of new shared towers 2010 (thousands) 98.0Average annual revenue/tower (USD in thousands) 45.7Expected revenue diff. in percentage 20%Size of Indian annual tower market (USD in billions) 3.6
4.7 Shared Infrastructure in Other International MarketsPresently many markets around the world have implemented various shared infrastructure solutions. The purpose of the study is to give a general picture of both mature and developing telecom markets.
4.7.1 USAIn USA it is common for so called tower companies to rent out telecom sites. The basic business idea is to let operators lease space on sites of interest, where several other tenants can already be present, and earn a profit on the rent. Shared infrastructure most often includes the entire above stated passive infrastructure list, including the antennae more recently. The concept result in higher profits for the tower companies and reduced renting fees for the tenants the more tenants there are sharing a site. In this way, through a third party supplier, passive infrastructure sharing is common. The demand for such solutions is presently concentrated to urban areas, where the operators are in a need for higher network capacity.
Note that, the presently second largest tower company in USA, Crown Castle, has an average of about 2.3 tenants per site. On 348 towers there are more than 5 tenants (Crown Castle, 2006). Not all tenants are telecom operators, some can e.g. be radio and TV
Table 4.1. Annual revenue estimations of the 2008 Indian tower market, based on the American market.
Table 4.2. Annual revenue estimations of the 2010 Indian tower market, based on the American market.
30
broadcasting companies. Still, number of tenants sharing the passive infrastructure as land and tower is highly achieved.
Active infrastructure sharing is also present in the American market. Voicestream’s (now T-Mobile) agreement with Cingular to share complete infrastructure in New York, California, and Nevada, is one example (King, 2001). Furthermore, are Mobile Virtual Network Operators (MVNO’s), operators with (usually) no self-owned network infrastructure, active players in the market. Virgin Mobile USA, SmartServ, and Qwest are examples of such players. They most commonly lease network capacity from market leaders, SprintNextel being one supplier of such services (Charny, 2004).
4.7.2 AustraliaIn Australia the sharing of infrastructure works in similar way as in US. There exist three major companies that own most sites, Crown Castle, Broadcast Australia, and Telstra. Crown Castle and Broadcast Australia (owned by Macquarie Bank) have their business focus on “telecom site leasing”, while Telstra is an operator with high network assets. Telstra is a partially stately owned operator and has as BSNL in India a wide coverage of their telecom network. They have, as BSNL, been reluctant to share their infrastructure, the reason being their belief that coverage gives higher return in terms of competitiveness than leasing revenues would (Lund, 2006). Crown Castle and Broadcast Australia, neither being a telecom operator, are on the other hand both trying to maximize their profit by including as many tenants as possible to their sites. Much of the passive parts of the 2G network have thus been shared in Australia on the initiative of a third party supplier.
The 3G network infrastructure has been shared to an even greater extent then the 2G. Australia is comparable to India in the sense that they also have large rural areas. To build out a 3G network in these areas alliances have been forced to be formed even including the sharing reluctant Telstra. Telstra and Hutch have formed one alliance while Vodafone Australia and Optus have formed theirs.
In Australia the alliances do not mean that the operators share the assets incurred with an ownership of a site. Instead, other entities most often own sites and the alliances lease space. The difference of the 2G and the 3G infrastructure sharing is that in the 3G network both the passive and active infrastructure is shared, while in the 2G only the passive is shared.
The MVNO phenomenon is also present in Australia, as it has been in US, with the market leader Virgin Mobile. In Australia Virgin Mobile lease capacity from Optus.
4.7.3 EuropeThe European market varies from country to country. Two EU markets have been chosento focus on, the Swedish and British. These have randomly been chosen, but with some consideration to the connections of India and/or Ericsson to these markets. England has had a strong influence over India historically which can still be seen in the market. It is therefore believed that it would be of interest to see how the British “site leasing” market has developed. As for Sweden the only reason for the choice of this country is because
31
Ericsson is a Swedish company and it therefore could be interesting to see how “site leasing” has evolved in the company’s home market. Sweden is also a country which represents another type of market than the previous presented ones.
The one thing that all EU countries have in common is the imposed EU policies and regulations. The present status regarding infrastructure sharing (both passive and active) is that the European Commission has not found it to prevent competition. The EU commission has instead declared that it benefits consumers because of quicker roll outs of the network in less covered areas (EU Commission, 2003).
4.7.3.1 SwedenThere is a great difference between the 2G and the 3G network in Sweden when it comes to infrastructure sharing. With regard to the 2G network very little sharing has been taken place. The operators have in general built their own networks and taken little advantage from each other. The only sharing that has been done is Telenor’s agreement with Telia to get access to Telia’s network in the northern parts of Sweden (Lund, 2006). Telenor has no own infrastructure in those parts.
The 3G network on the other hand has been crucial to share in order to realize a cost effective roll-out. Since it is allowed to share active infrastructure in Sweden, alliances between operators quickly arose at the time of the roll-out to share as much infrastructure as possible. Tele2 and Telia being one alliance and HI3G (partially owned by Hutch) and Europolitan Vodafone (now Telenor) forming the other. In this way, only two 3G networks needed to be built in Sweden.
The only thing that the 2G and 3G infrastructure sharing has had in common is that no third party supplier has been present. All agreements have occurred between operators on their own initiative. Tower companies or alike does not at the present exist in Sweden.
4.7.3.2 U.K.In United Kingdom sharing of infrastructure is also a widely used concept. A consequence of it being allowed to share active infrastructure, the world’s first MVNO operator, Virgin Mobile, entered the business here. Virgin Mobile doesn’t own any network facilities. Virgin has an agreement with T-mobile (formerly One-to-One) to lease capacity on its entire network (Ericsson, 2006). Another 2G partnership is the one between Hutch and O2, where Hutch wanted availability of a 2G network for its customers while rolling out its 3G network16.
Furthermore, T-mobile and O2 has entered into an agreement to share 3G infrastructure in U.K. as well as in Germany. As in Sweden, it was crucial for the operators to share 3G infrastructure. The high licensing fees being the main catalyst behind this. Vodafone has an estimated 3G licensing cost of 1880 USD/subscriber (converted from £1000/subscriber, August 20th 2006 exchange rate) (Secker, 2001).
16 Source is O2 annual report 2002.
32
The tower business is present in U.K. as it is in US and Australia. The concept is thesame; multi operator solutions offered to operators for a lower price than if self-owned. As an example, it can be mentioned that one of U.K.’s biggest tower companies, Arqiva, has provided the market with so called CityCell solutions (Lund, 2006). On these sites, both 2G and 3G customers share infrastructure in what can be called a hotel. All the operators need to do is buy their active infrastructure, with Arqiva providing the passive infrastructure, the installations, and maintenance of the equipment (Arqiva press release, 2006).
4.7.4 AfricaAfrica has experienced similar problems as India when it comes to infrastructure sharing. The lack of infrastructure sharing has in Africa, as in India, prevented more cost effective dispersion of telecom services. The non-sharing culture in Africa stem from three main reasons. Firstly, it is claimed that system specifications used are different and hence prevent sharing. Secondly, some operators have systems of inferior quality and of higher cost and thus are not willing to share this with other operators to maintain their competitive advantage. Thirdly, when a dominant or monopolistic player have been present and have established a wide network infrastructure they feel reluctant to share this with new entering competitors. Presently, it is not an uncommon sight to see three towers in a 200 meter radius from 3 different operators (CIPESA, 2006). The first and the second reason have been argued to be unqualified arguments and at the bottom line it all comes down to the rivalry culture between the competitors. Hence, the rivalry reason being the strongest for the operators not to join into alliances or partnership with each other. It is expected that more infrastructure sharing will take place as competition get increasingly fierce (Lund, 2006).
Some similarities can be seen between Africa’s and India’s sharing problems. In India as in parts of Africa there has been an old monopoly operator who owns a wide network and is not willing to share due to competitive reasons. Also, the rivalry culture between the operators exists in both markets, resulting in slow development of networks in remote areas. Moreover, there have been arguments that in both markets the operators have simply not been too cost conscious.
4.7.5 Global Study FindingsSome conclusions from these market examples will be discussed below.
Just like alliances between airlines, telecom operator alliances have emerged around the globe. As the 3G network has been implemented in mature telecom markets it can be seen that alliances have formed between operators in order to overcome high infrastructure cost. In these markets active infrastructure has been allowed to share and thus the benefits even greater than the sharing of only passive infrastructure. Generally it can be summarized that these partnerships have been taken from the operators’ initiative.
It can also be concluded that passive infrastructure sharing has normally been taken place with a third party player. The third party players in these markets have mostly been tower companies which lease space and infrastructure to multiple tenants on self owned or

33
leased sites. A market growth for such solutions has been expected globally. As a result, a market division between operators and other entities, as tower companies, which supply and maintain all network infrastructure is estimated (Lund, 2006).
A difference between developing and developed countries has also been distinguished. Less sharing is taking place in the less developed countries. The main reasons are concluded to be the lack of competition and rivalry between wireless service providers. A change is expected when competition increases and the need for faster and more cost efficient network roll-outs get crucial in order for a continuous market growth, as seen in India.
It has been claimed that regulations in the telecom network in India has been too strict resulting in prevention of faster development. An example of the tight regulations is the prohibition to share active infrastructure. If active infrastructure sharing would be allowed the consequences could mean a build-up of only one network in each telecom circle. The lengthy process of getting a license to build a network in a new circle would almost be eliminated and the infrastructure cost decreased heavily. Since presently only passive infrastructure is allowed to be shared, it is concluded that in order to overcome some of the cellular growth challenges, it is important to take advantage of the solution available in the market. The study of the various markets globally has revealed that the easiest way to implement passive infrastructure sharing on a larger scale is via a third party. The third party building, supervising, “owning”, and maintaining the site.
The study has also raised concern regarding the belief that the “telecom site leasing” service will mean higher growth of network services in rural areas. Passive infrastructure sharing has mostly taken place in urban areas in countries like USA while active infrastructure has been more common in both rural and urban areas. A valid question to ask oneself is if the rural areas can hold to be profitable for operators even if the passive infrastructure is shared.
4.8 Key Findings The key findings of the chapter are presented below.
Only passive infrastructure is allowed to be shared in India. Benefits of sharing infrastructure include;
- Cost reductions- Overcoming of urban space problems- Improving esthetics with reduction of number of towers
To overcome the challenge of operators’ lack of time a third party supplier is needed. The third party would provide the market with a leasing service of passive infrastructure to multiple tenants. Benefits of such a solution includes (except the already above stated ones);
- Eliminate the need for operators to manage non-core issues.- Shortening operators’ time to market.- Less administrative hassle.
34
Challenges exist, like the high financial requirements and sharing reluctance between operators, and need to be addressed and overcome to leverage the business on a wider scale.
The governmental initiated MOST project has been implemented in order to kick start the third party business to further improve mobile growth in the country.
85% of the rural areas are expected to be covered with the help from governmental funding.
Size of the infrastructure leasing market in 2010 is estimated to 3.6 billion USD annually.
The sharing of infrastructure is common in many markets globally. Different solutions have developed depending on the market. Governmental regulations and the competitive landscape among operators is an important aspect for the concept to take off.
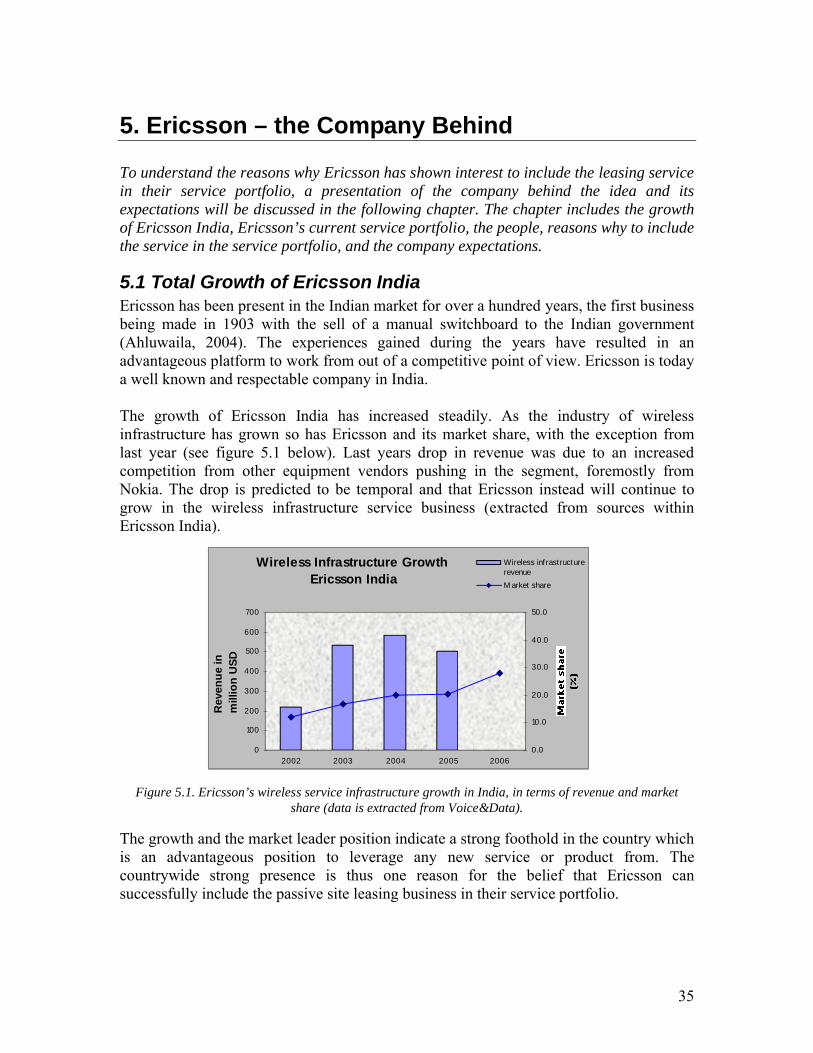
35
5. Ericsson – the Company Behind
To understand the reasons why Ericsson has shown interest to include the leasing service in their service portfolio, a presentation of the company behind the idea and itsexpectations will be discussed in the following chapter. The chapter includes the growth of Ericsson India, Ericsson’s current service portfolio, the people, reasons why to include the service in the service portfolio, and the company expectations.
5.1 Total Growth of Ericsson IndiaEricsson has been present in the Indian market for over a hundred years, the first business being made in 1903 with the sell of a manual switchboard to the Indian government (Ahluwaila, 2004). The experiences gained during the years have resulted in an advantageous platform to work from out of a competitive point of view. Ericsson is today a well known and respectable company in India.
The growth of Ericsson India has increased steadily. As the industry of wireless infrastructure has grown so has Ericsson and its market share, with the exception from last year (see figure 5.1 below). Last years drop in revenue was due to an increased competition from other equipment vendors pushing in the segment, foremostly from Nokia. The drop is predicted to be temporal and that Ericsson instead will continue to grow in the wireless infrastructure service business (extracted from sources within Ericsson India).
Wireless Infrastructure Growth Ericsson India
0
100
200
300
400
500
600
700
2002 2003 2004 2005 2006
Rev
enu
e in
m
illio
n U
SD
0.0
10.0
20.0
30.0
40.0
50.0
Wireless infrastructurerevenue
M arket share
The growth and the market leader position indicate a strong foothold in the country which is an advantageous position to leverage any new service or product from. The countrywide strong presence is thus one reason for the belief that Ericsson can successfully include the passive site leasing business in their service portfolio.
Figure 5.1. Ericsson’s wireless service infrastructure growth in India, in terms of revenue and market share (data is extracted from Voice&Data).
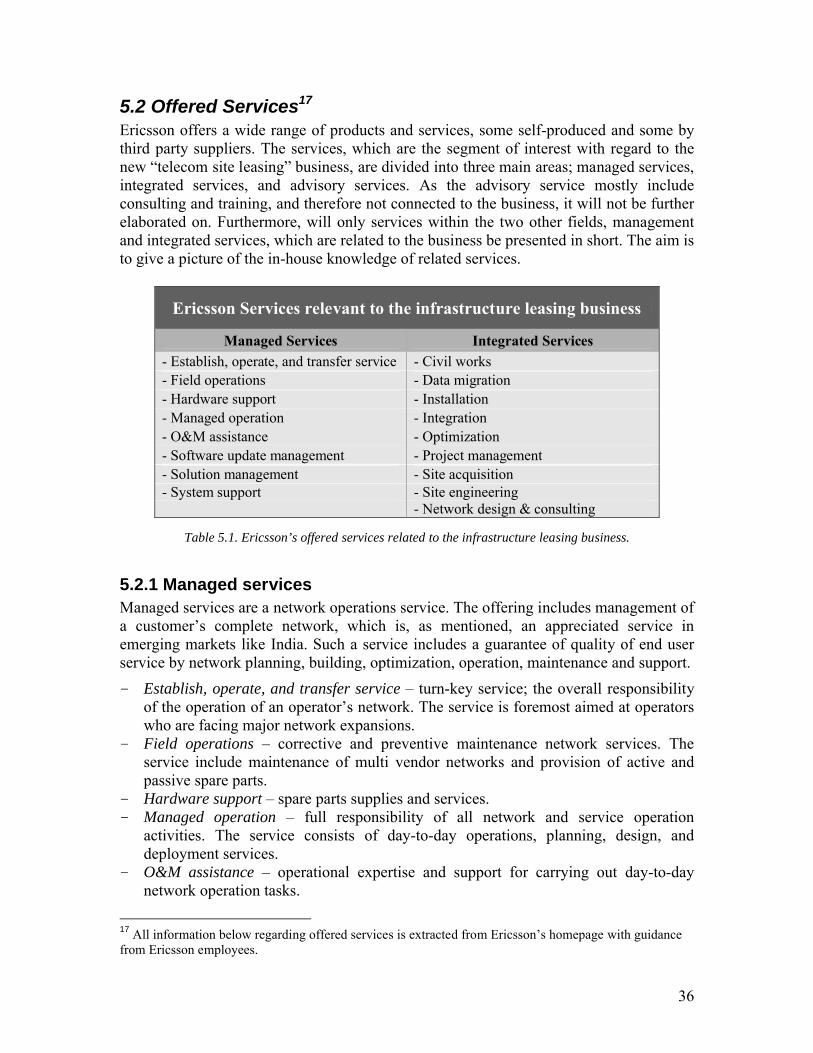
36
5.2 Offered Services17
Ericsson offers a wide range of products and services, some self-produced and some by third party suppliers. The services, which are the segment of interest with regard to the new “telecom site leasing” business, are divided into three main areas; managed services, integrated services, and advisory services. As the advisory service mostly include consulting and training, and therefore not connected to the business, it will not be further elaborated on. Furthermore, will only services within the two other fields, management and integrated services, which are related to the business be presented in short. The aim is to give a picture of the in-house knowledge of related services.
Ericsson Services relevant to the infrastructure leasing business
Managed Services Integrated Services
- Establish, operate, and transfer service - Civil works- Field operations - Data migration- Hardware support - Installation- Managed operation - Integration- O&M assistance - Optimization- Software update management - Project management- Solution management - Site acquisition- System support - Site engineering
- Network design & consulting
5.2.1 Managed servicesManaged services are a network operations service. The offering includes management of a customer’s complete network, which is, as mentioned, an appreciated service in emerging markets like India. Such a service includes a guarantee of quality of end user service by network planning, building, optimization, operation, maintenance and support.
- Establish, operate, and transfer service – turn-key service; the overall responsibility of the operation of an operator’s network. The service is foremost aimed at operators who are facing major network expansions.
- Field operations – corrective and preventive maintenance network services. The service include maintenance of multi vendor networks and provision of active and passive spare parts.
- Hardware support – spare parts supplies and services.- Managed operation – full responsibility of all network and service operation
activities. The service consists of day-to-day operations, planning, design, and deployment services.
- O&M assistance – operational expertise and support for carrying out day-to-day network operation tasks.
17 All information below regarding offered services is extracted from Ericsson’s homepage with guidance from Ericsson employees.
Table 5.1. Ericsson’s offered services related to the infrastructure leasing business.

37
- Software update management – supply of software updates to operators’ incumbent networks.
- Solution management – customized solutions support for multi vendor components. Such solution support can be in the areas of service provisioning, revenue management, network management & service assurance, and service layer.
- System support – assistance in operation, with everything from general consulting to the clearing of an emergency situation, including software updates on regular basis including bug fixes.
5.2.2 Integrated ServicesIntegrated services support customers by designing, implementing and integrating networks and systems in multi-vendor environments. The services range from implementation of new networks to upgrading and migrating existing networks. The service assures customers that their networks can support the latest applications and that systems such as billing and customer care perform as a fully integrated part of the network.
- Civil works – design and construction of network sites. This service is only offered together with complete network solutions. It is leveraged through third party contractors, consultants, and suppliers. It is furthermore a service which is very much dependant on local factors.
- Installation – installation of various kinds of equipment, from nodes to complete system solutions. It is applicable for all network elements either new, upgrade, or change-outs.
- Integration – integration of network roll-out with existing technical environment, communication standards, end-user services such as integrating network systems from multiple vendors, and nodes and terminals from various vendors with technologies18 as TDMA, CDMA, GSM, GPRS, and WCDMA.
- Optimization – optimization of multi-vendor as well as single user network, including adaptations needed for the network elements to secure high quality in network functions and end-user services.
- Project management – planning, organizing, manage quality & risks, monitoring, and controlling the different phases throughout the entire project.
- Site acquisition – identifying, evaluating, and procuring sites. As with civil works, site acquisition is country specific and dependent on local factors, such as the real estate market, land and property owner, local building regulations, and environmental regulations. The service is offered through third party suppliers and is not offered alone but included in a service package of total network build solutions with mainly Ericsson products.
- Site engineering – provides plans and documentation and construction designs for the site taking the equipment to be used at the site into account. The service is available for new, upgrade or change-out installations, and applies to everything from simple nodes to complete system solutions. The service results in instruction and documentation for installing all associated equipment, including antennae, base
18 See appendix I for technology definitions.

38
stations, access cabinets, switches, routers, transmission and backbone equipment, cabling, and connections. The service is provided from third party suppliers.
- Network design & consulting – network design and consulting services to reach coverage expectations.
5.2.3 ConclusionIt can be seen from the above presentation that Ericsson offers many services globally, either through third parties or own, to build and manage all parts of a network, including the passive infrastructure. It can therefore be concluded that Ericsson has the channels and the knowledge to support a “site leasing” business. Even though no direct knowledge exists of how a leasing business is run, the existing wide expanding related knowledge is enough to qualify as yet another reason for an interest in the new service.
5.3 The PeopleWithout the right team behind a business idea it will have no chance of success (Sahlman, 1997). The need of support and force to push for an idea is vital in any business in any market.
Within Ericsson there has traditionally been a rivalry between the product selling unit and service selling unit. The focus of the salesmen has globally been on the products, which have higher margins and has in general been easier to sell. The service unit has also been viewed as non-core activities for long. The growth of the company in developing markets has started to change this view. An insight of the importance of the services in order to expand and provide value added services to beat competition has been established. It was clear from the company’s latest quarterly report that the company expects the service area to grow faster than the products during next year (Augustsson, 2006). Some of the old reluctance toward the service unit still exists.
Ericsson India has a relatively large service unit to support the market demand. In that respect the backing of a new “site leasing” service is estimated to get higher support than it probably would in some other markets. The Indian office is furthermore known to hold a dedicated team which will stand behind management decisions. Some of the above issues still apply for the salesmen in India though. It is viewed to be crucial to get the backing from the salesmen, without any push from them few solutions will be sold. In order to overcome such a scenario it is expected that management need to influence and make clear of the importance and opportunities of the concept. Since the idea has some management support, which may be viewed as a stronger incentive in India than in some other markets, challenges will be easier to overcome. It is commonly said that, when entering a new business; business model, brand strength, industry structure, and competitive intensity, can all prove less valuable without the support and ability of the leading organization.
5.4 Why Include in Ericsson Business?One might find that entering a new business which is in some ways not core to Ericsson is a risky business. The option of not going may, on the other hand, be more risky. It has
39
also been argued that the business is very close to Ericsson’s core services, and could therefore become a core activity in the future. As most of the knowledge is already in-house the growth in this new direction can be viewed as a natural step. If the revenues can prove to match the American market substantial profits can be earned. If being on theoptimistic side, assuming that a 20% market share can be reached, an annual leasing revenue of USD 720 million19 could be reached by 2010 for Ericsson alone. Since basically no one is competing in the market at the present the opportunities are expected to exceed the risks (also see chapter 6.3.3 discussion).
5.5 Expectations The expectation of the idea is a new business opportunity. The highlights are presented below;
- Increased overall revenue.- Better integration with customers.- Better utilization of Ericsson’s existing economies of scale.- Meet a new market demand with minimal effort since most knowledge is
already in-house.- Provide the market with a value added service to beat competition in other
fields as well.
5.6 Key Findings
- Ericsson India’s service segment is growing and is seen as increasingly important.
- Ericsson has a lot of related knowledge in-house to leverage a “site leasing”business.
- The general reluctance to push for selling Ericsson services compared to their high margin products among the salesmen is concluded to be a challenge which needs to be addressed in order to succeed with the tower industry entry in India.
- The “site leasing” business is relatively close to Ericsson’s core activities and could be seen as a natural industry to grow into.
19 Estimations are based on data explained in chapter 4.6.
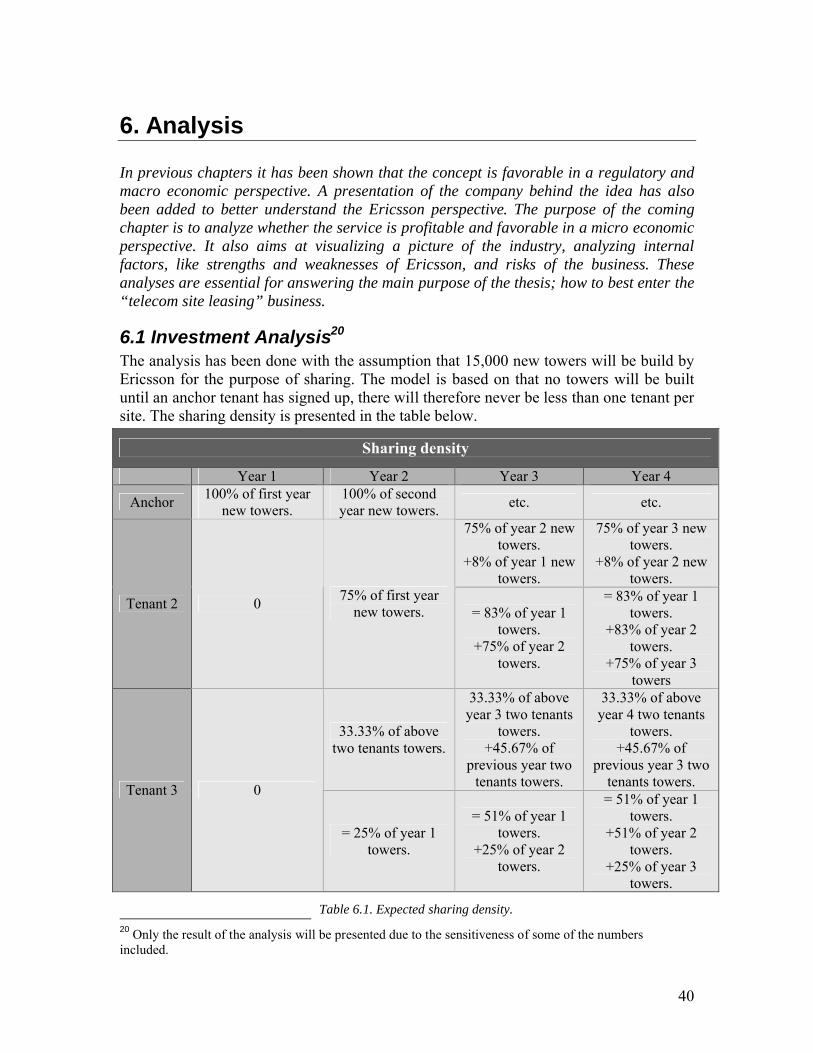
40
Table 6.1. Expected sharing density.
6. Analysis
In previous chapters it has been shown that the concept is favorable in a regulatory and macro economic perspective. A presentation of the company behind the idea has also been added to better understand the Ericsson perspective. The purpose of the coming chapter is to analyze whether the service is profitable and favorable in a micro economic perspective. It also aims at visualizing a picture of the industry, analyzing internal factors, like strengths and weaknesses of Ericsson, and risks of the business. These analyses are essential for answering the main purpose of the thesis; how to best enter the “telecom site leasing” business.
6.1 Investment Analysis20
The analysis has been done with the assumption that 15,000 new towers will be build by Ericsson for the purpose of sharing. The model is based on that no towers will be built until an anchor tenant has signed up, there will therefore never be less than one tenant per site. The sharing density is presented in the table below.
20 Only the result of the analysis will be presented due to the sensitiveness of some of the numbers included.
Sharing density
Year 1 Year 2 Year 3 Year 4
Anchor100% of first year
new towers.100% of second year new towers.
etc. etc.
75% of year 2 new towers.
+8% of year 1 new towers.
75% of year 3 new towers.
+8% of year 2 new towers.
Tenant 2 075% of first year
new towers. = 83% of year 1 towers.
+75% of year 2 towers.
= 83% of year 1 towers.
+83% of year 2 towers.
+75% of year 3 towers
33.33% of above two tenants towers.
33.33% of above year 3 two tenants
towers.+45.67% of
previous year two tenants towers.
33.33% of above year 4 two tenants
towers.+45.67% of
previous year 3 two tenants towers.
Tenant 3 0
= 25% of year 1 towers.
= 51% of year 1 towers.
+25% of year 2 towers.
= 51% of year 1 towers.
+51% of year 2 towers.
+25% of year 3 towers.
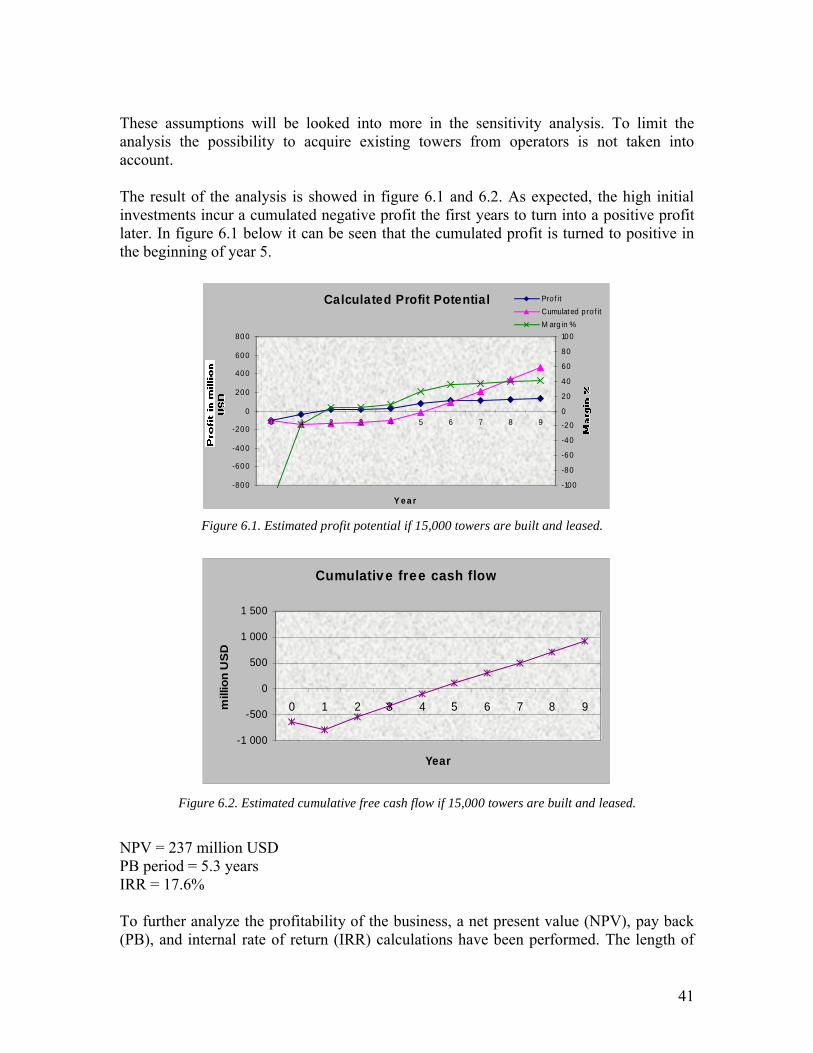
41
These assumptions will be looked into more in the sensitivity analysis. To limit the analysis the possibility to acquire existing towers from operators is not taken into account.
The result of the analysis is showed in figure 6.1 and 6.2. As expected, the high initial investments incur a cumulated negative profit the first years to turn into a positive profit later. In figure 6.1 below it can be seen that the cumulated profit is turned to positive in the beginning of year 5.
Calculated Profit Potential
-800
-600
-400
-200
0
200
400
600
800
0 1 2 3 4 5 6 7 8 9
Y e a r
-100
-80
-60
-40
-20
0
20
40
60
80
100
Prof it
Cumulated prof it
M arg in %
Cumulative free cash flow
-1 000
-500
0
500
1 000
1 500
0 1 2 3 4 5 6 7 8 9
Year
mill
ion
US
D
NPV = 237 million USDPB period = 5.3 yearsIRR = 17.6%
To further analyze the profitability of the business, a net present value (NPV), pay back (PB), and internal rate of return (IRR) calculations have been performed. The length of
Figure 6.1. Estimated profit potential if 15,000 towers are built and leased.
Figure 6.2. Estimated cumulative free cash flow if 15,000 towers are built and leased.
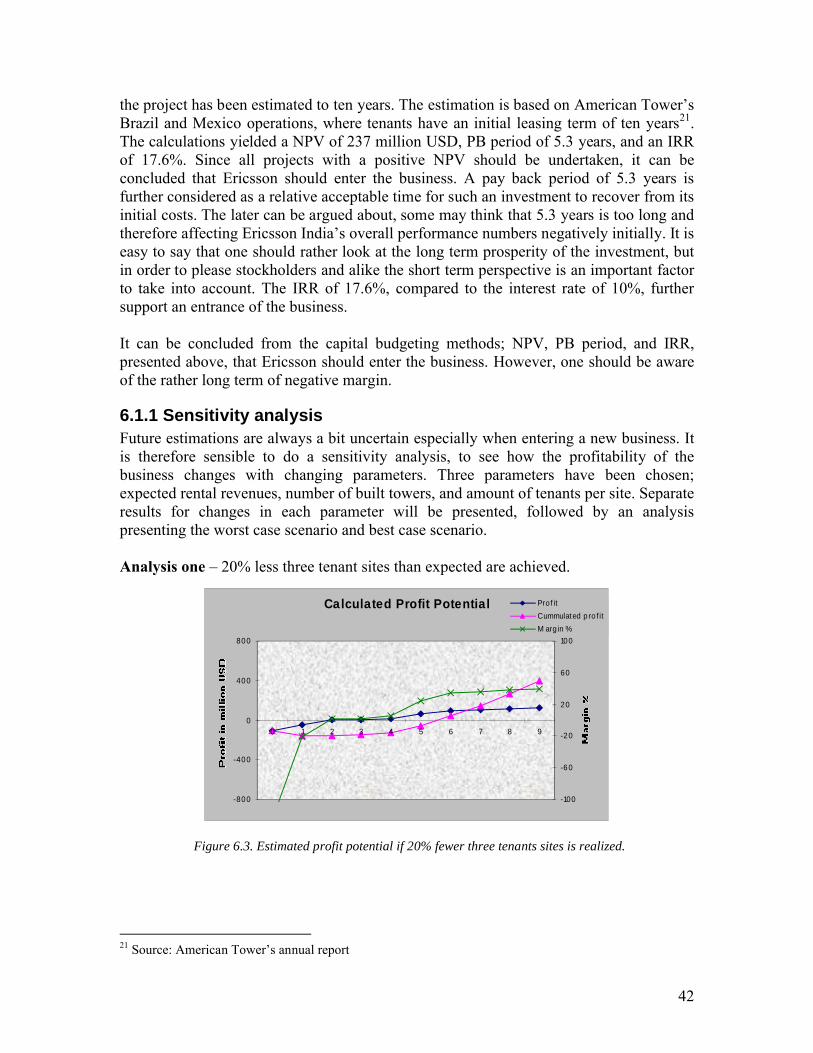
42
the project has been estimated to ten years. The estimation is based on American Tower’s Brazil and Mexico operations, where tenants have an initial leasing term of ten years21. The calculations yielded a NPV of 237 million USD, PB period of 5.3 years, and an IRR of 17.6%. Since all projects with a positive NPV should be undertaken, it can be concluded that Ericsson should enter the business. A pay back period of 5.3 years is further considered as a relative acceptable time for such an investment to recover from its initial costs. The later can be argued about, some may think that 5.3 years is too long and therefore affecting Ericsson India’s overall performance numbers negatively initially. It is easy to say that one should rather look at the long term prosperity of the investment, but in order to please stockholders and alike the short term perspective is an important factor to take into account. The IRR of 17.6%, compared to the interest rate of 10%, further support an entrance of the business.
It can be concluded from the capital budgeting methods; NPV, PB period, and IRR,presented above, that Ericsson should enter the business. However, one should be aware of the rather long term of negative margin.
6.1.1 Sensitivity analysis Future estimations are always a bit uncertain especially when entering a new business. It is therefore sensible to do a sensitivity analysis, to see how the profitability of the business changes with changing parameters. Three parameters have been chosen; expected rental revenues, number of built towers, and amount of tenants per site. Separate results for changes in each parameter will be presented, followed by an analysis presenting the worst case scenario and best case scenario.
Analysis one – 20% less three tenant sites than expected are achieved.
Calculated Profit Potential
-800
-400
0
400
800
0 1 2 3 4 5 6 7 8 9
-100
-60
-20
20
60
100
Prof it
Cummulated p ro f it
M argin %
21 Source: American Tower’s annual report
Figure 6.3. Estimated profit potential if 20% fewer three tenants sites is realized.
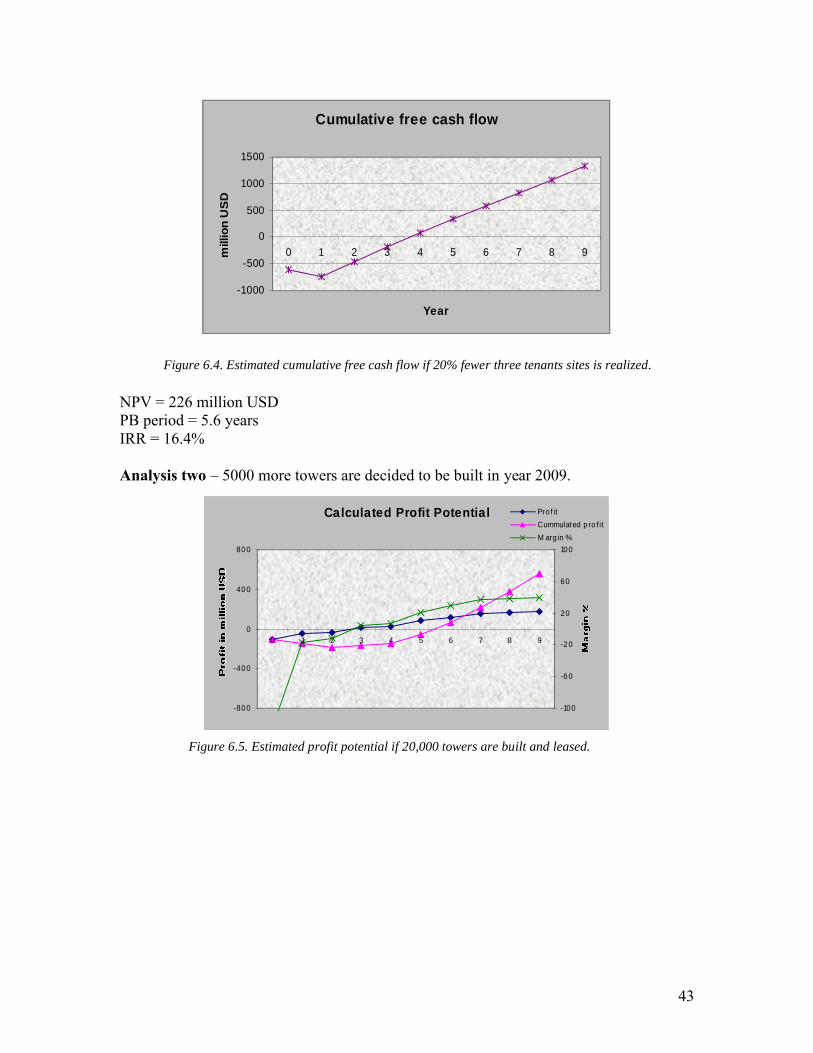
43
Cumulative free cash flow
-1000
-500
0
500
1000
1500
0 1 2 3 4 5 6 7 8 9
Year
mill
ion
US
D
NPV = 226 million USDPB period = 5.6 yearsIRR = 16.4%
Analysis two – 5000 more towers are decided to be built in year 2009.
Calculated Profit Potential
-800
-400
0
400
800
0 1 2 3 4 5 6 7 8 9
-100
-60
-20
20
60
100
Prof it
Cummulated p ro f it
M argin %
Figure 6.5. Estimated profit potential if 20,000 towers are built and leased.
Figure 6.4. Estimated cumulative free cash flow if 20% fewer three tenants sites is realized.
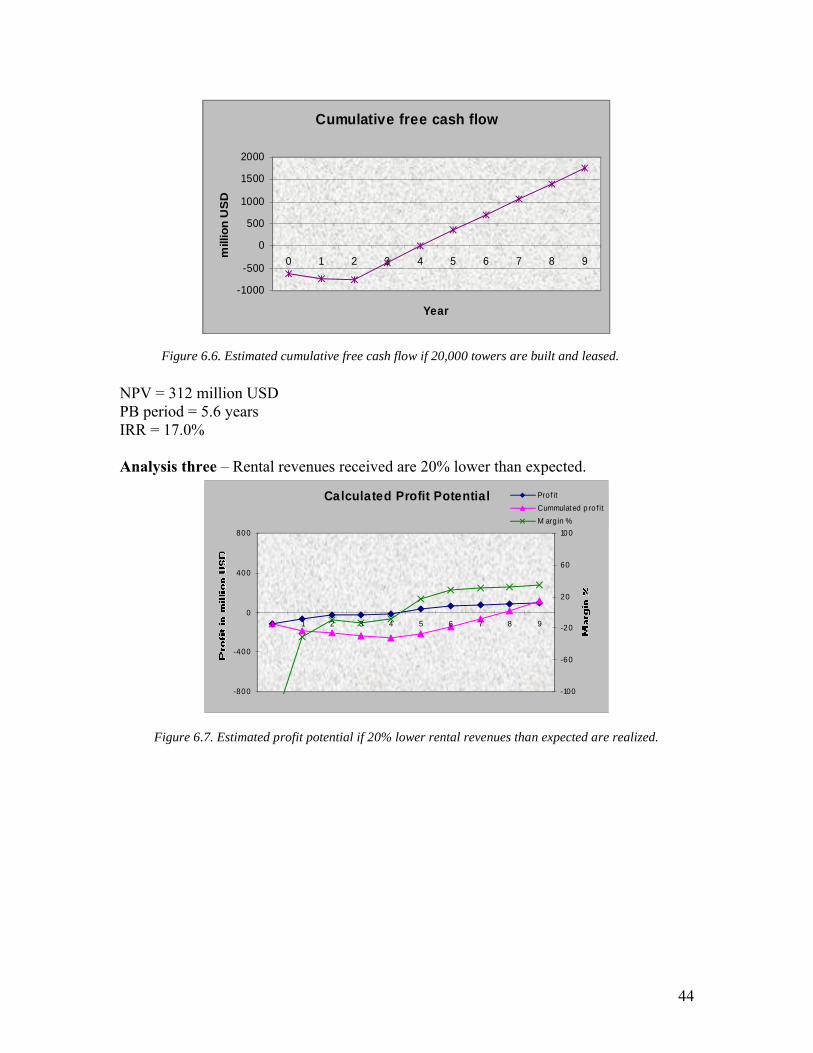
44
Cumulative free cash flow
-1000
-500
0
500
1000
1500
2000
0 1 2 3 4 5 6 7 8 9
Year
mill
ion
US
D
NPV = 312 million USDPB period = 5.6 years IRR = 17.0%
Analysis three – Rental revenues received are 20% lower than expected.
Calculated Profit Potential
-800
-400
0
400
800
0 1 2 3 4 5 6 7 8 9
-100
-60
-20
20
60
100
Prof it
Cummulated p ro f it
M argin %
Figure 6.7. Estimated profit potential if 20% lower rental revenues than expected are realized.
Figure 6.6. Estimated cumulative free cash flow if 20,000 towers are built and leased.
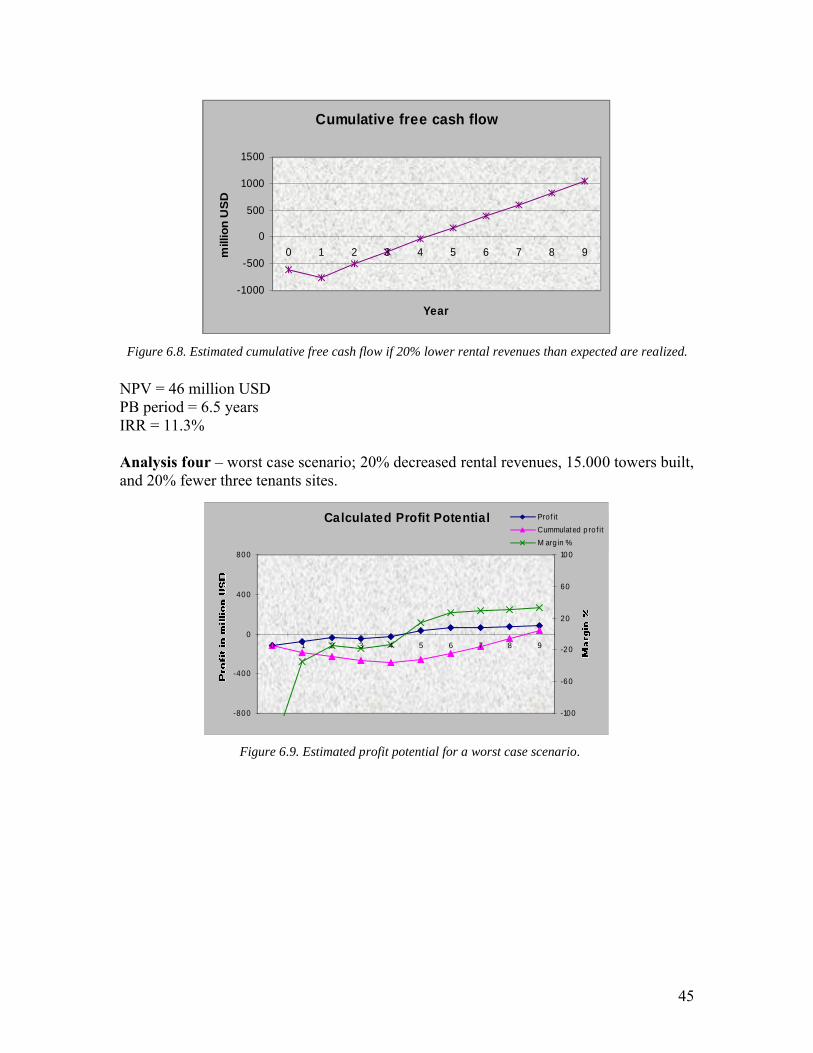
45
Cumulative free cash flow
-1000
-500
0
500
1000
1500
0 1 2 3 4 5 6 7 8 9
Year
mill
ion
US
D
NPV = 46 million USDPB period = 6.5 yearsIRR = 11.3%
Analysis four – worst case scenario; 20% decreased rental revenues, 15.000 towers built, and 20% fewer three tenants sites.
Calculated Profit Potential
-800
-400
0
400
800
0 1 2 3 4 5 6 7 8 9
-100
-60
-20
20
60
100
Prof it
Cummulated p ro f it
M argin %
Figure 6.9. Estimated profit potential for a worst case scenario.
Figure 6.8. Estimated cumulative free cash flow if 20% lower rental revenues than expected are realized.
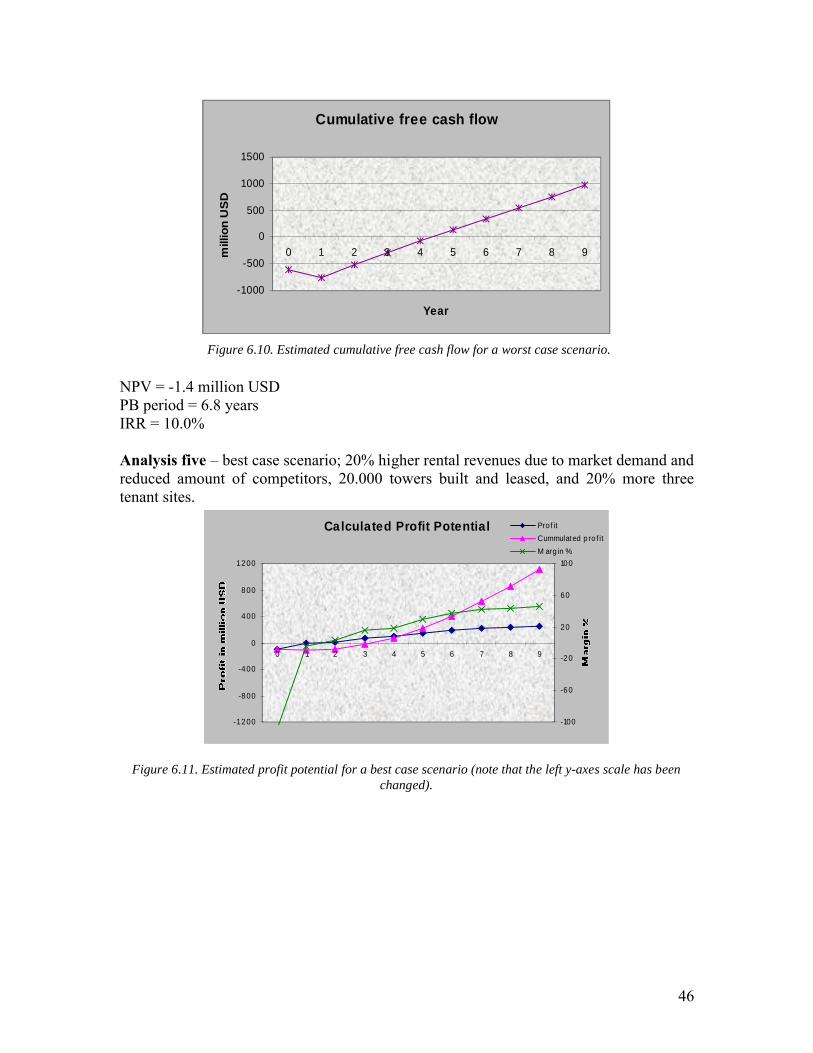
46
Cumulative free cash flow
-1000
-500
0
500
1000
1500
0 1 2 3 4 5 6 7 8 9
Year
mill
ion
US
D
NPV = -1.4 million USDPB period = 6.8 yearsIRR = 10.0%
Analysis five – best case scenario; 20% higher rental revenues due to market demand and reduced amount of competitors, 20.000 towers built and leased, and 20% more three tenant sites.
Calculated Profit Potential
-1 200
-800
-400
0
400
800
1 200
0 1 2 3 4 5 6 7 8 9
-100
-60
-20
20
60
100
Prof it
Cummulated p ro f it
M argin %
Figure 6.11. Estimated profit potential for a best case scenario (note that the left y-axes scale has been changed).
Figure 6.10. Estimated cumulative free cash flow for a worst case scenario.

47
Cumulative free cash flow
-1000
-500
0
500
1000
1500
2000
2500
0 1 2 3 4 5 6 7 8 9
Year
mill
ion
US
D
NPV = 650 million USDPB period = 4.6 yearsIRR = 24.0%
From the sensitivity analysis it can be concluded that the project is profitable in all of the above scenarios except in the worst case scenario. The worst case scenario indicates some of the risks with the investment, which will be further discussed in chapter 6.3.1.
6.2 Market Analyses
6.2.1 Competitors22
It is not yet clear how the Indian market for shared infrastructure will evolve. Is it going to resemble the American model, where the operators have “outsourced” the passive infrastructure sharing to tower companies? Or, are the Indian operators instead going to turn to infrastructure service providers for management of the leasing service? Or, is it going to evolve its own model where the operators will go to a one-stop supplier of both passive and active infrastructure, these suppliers being the major equipment vendors? Or, will it be a mix of all above scenarios?
Ericsson will have competitors in the infrastructure sharing business and it is clear that that they need to be identified to be beaten. The question is which type of provider will hold the strongest threat. An analysis has been performed with the aim to give a general picture of possible competitor groups.
6.2.1.1 Tower Companies
Tower companies, with their core competence in the telecom infrastructure leasing field, are expected to be the number one threat to Ericsson in this particular business. The possibility of the entrance of big international players as American Tower, Crown Castle, and SBA Communication is a known threat (Ericsson, 2006).
22 For a more detailed summary of current possible competitors in India, see appendix II.
Figure 6.12. Estimated cumulative free cash flow for a best case scenario.
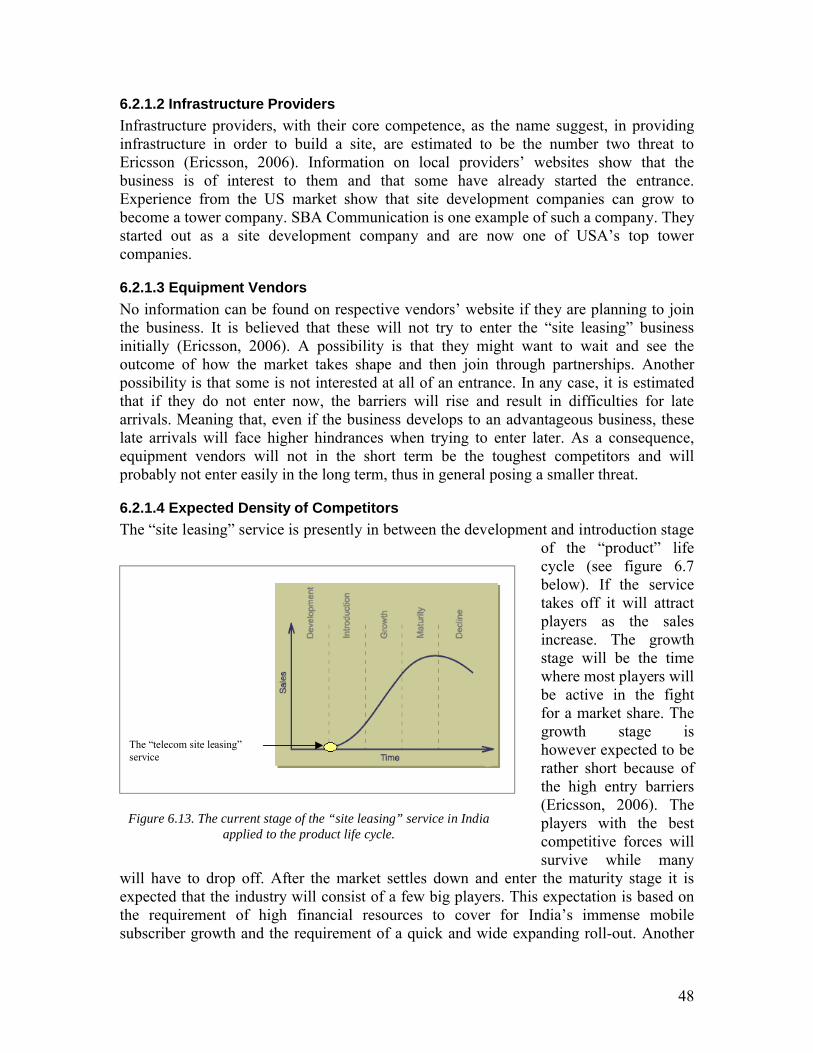
48
6.2.1.2 Infrastructure Providers
Infrastructure providers, with their core competence, as the name suggest, in providing infrastructure in order to build a site, are estimated to be the number two threat to Ericsson (Ericsson, 2006). Information on local providers’ websites show that the business is of interest to them and that some have already started the entrance. Experience from the US market show that site development companies can grow to become a tower company. SBA Communication is one example of such a company. They started out as a site development company and are now one of USA’s top tower companies.
6.2.1.3 Equipment Vendors
No information can be found on respective vendors’ website if they are planning to join the business. It is believed that these will not try to enter the “site leasing” businessinitially (Ericsson, 2006). A possibility is that they might want to wait and see the outcome of how the market takes shape and then join through partnerships. Another possibility is that some is not interested at all of an entrance. In any case, it is estimated that if they do not enter now, the barriers will rise and result in difficulties for late arrivals. Meaning that, even if the business develops to an advantageous business, these late arrivals will face higher hindrances when trying to enter later. As a consequence, equipment vendors will not in the short term be the toughest competitors and will probably not enter easily in the long term, thus in general posing a smaller threat.
6.2.1.4 Expected Density of Competitors
The “site leasing” service is presently in between the development and introduction stage of the “product” life cycle (see figure 6.7below). If the service takes off it will attract players as the sales increase. The growth stage will be the time where most players will be active in the fight for a market share. The growth stage is however expected to be rather short because of the high entry barriers(Ericsson, 2006). The players with the best competitive forces will survive while many
will have to drop off. After the market settles down and enter the maturity stage it is expected that the industry will consist of a few big players. This expectation is based on the requirement of high financial resources to cover for India’s immense mobile subscriber growth and the requirement of a quick and wide expanding roll-out. Another
Figure 6.13. The current stage of the “site leasing” service in India applied to the product life cycle.
The “telecom site leasing” service
49
reason is the belief that the operators will not be willing to, due to time limitations, manage many different suppliers of the service.
6.2.2 Barriers of EntryWhen entering a new business, as when entering a new market, six major entry barriers exist; economies of scale, brand identification, capital requirement, cost disadvantages independent of size, access to distribution, and government policy (Porter, 1979). These will be discussed and presented below.
Economies of scale - The economies of scale barrier determine entry by forcing the aspirant either to come in on a large scale or to accept a cost disadvantage. The barrier is estimated to be relatively high when entering the “site leasing” industry in India. In order to compete in the price sensitive market in the telecom service and or product segment,economies of scale is needed. Ericsson has the advantage of scale, which is why the barrier will give Ericsson some lead compared to many potential competitors.
Brand identification – Brand identification creates a barrier by forcing entrants to spend heavily to overcome customer loyalty. Ericsson is a well known brand throughout India and is regarded as a high quality service and product provider. The Ericsson brand is not, on the other hand, connected to the tower industry which may imply a barrier. It is estimated that the brand is strong enough to give Ericsson an advantage compared to smaller new players and local infrastructure providers with limited size. Compared to the well established international tower companies, Ericsson will face a relatively high brand identification barrier.
Capital requirement – The need to invest large financial resources in order to compete creates an entry barrier. This barrier will be high in the Indian tower industry. High financial resources are needed to leverage the business on a large scale, to handle the cost incurred with owning sites, and to cope with project management expenditures. Ericssonhas an advantageous position in this aspect, since its financial resources exceeds many competitors and has capital available for new market establishments. Compared to some players can Ericsson’s reluctance to take on the assets on their balance sheet, on the other hand, prove to be a barrier since financial partners may be needed.
Cost disadvantages independent of size – incumbent companies may have cost advantages not available to potential rivals, no matter what their size and attainable economies of scale. These advantages can e.g. stem from the effects of the learning curve (and the experience curve) and proprietary technology solutions. A cost disadvantage barrier can be distinguished connected to the learning curve in the Indian tower industry. Ericsson will most likely face such a disadvantage when entering compared to tower companies. The same types of companies are, on the other hand, going to face cost disadvantages in knowledge and experience of the Indian market. Ericsson has clear cost advantages with their long history of service management contracts and strong buying power in the country. Compared to local infrastructure providers both equipment vendors and tower companies may face cost disadvantages due to their infrastructure and market knowledge. Infrastructure providers is estimated to be able to compete with a lower cost
50
solution since they are the first hand supplier. Infrastructure providers will face cost disadvantages in other areas such as management of site leasing and lack of understanding and knowledge of the broader telecom picture.
Access to distribution channels – An entrant in any market or business must secure distribution of its services. As Ericsson already has access to a wide distribution network throughout India this barrier is expected to be an advantage to Ericsson. Most of the local players do not have equal width of their network and outside players will need to create a complete new network of distribution, hence facing a high barrier.
Government policy – The government can limit or even foreclose entry to industries with such controls as license requirements. The government can also play a major indirect role by affecting entry barriers through institutional voids as lack of infrastructure (Khanna and Palepu, 2006). Even though the government in general tries to encourage the business with for example their USO fund some barriers still exist working against entering players. Government regulations on foreign entering firms are an example of a barrier which will affect the international tower companies and other international players interested in entering the market. Another barrier is the slow general infrastructure development, which, due to the bureaucracy environment and lack of organization of the ministry and government, increases cost for all entering players. It can be argued that Western entering companies, as the major tower companies, will be less equipped to deal with such difficulties.
6.2.2.1 Barriers Conclusion
Table 6.2 below summarizes the barriers affect on Ericsson. It can clearly be seen that Ericsson hold a leading advantage over the infrastructure providers, but will as predicted face barriers compared to the larger international tower companies.

51
Table 6.2. A summary of Porter’s barriers of entry applied to Ericsson.
Barriers Pro and Against Ericsson
Barriers
Pro Ericsson
compared to all
Pro Ericsson
compared to infra.
providers
ProEricsson
compared to tower
COs
Against Ericsson
compared to infra.
providers
Against Ericsson
compared to tower
COs
Pro and against
all
Economies of scale √Brand identification √ √Capital requirement √ √Cost disadvantages independent of size
√ √ √ √
Access to distribution channels
√Government policy √
6.2.3 Five ForcesThe second market analysis tool which will be applied to the case is the five forces model. According to Porter, an industry is influenced by five forces (see figure 6.14below). The model will be used to better understand the “site leasing” industry in which Ericsson will compete in. In the fight for market share in the new business, competition will not only be held by other competitors. Customers, suppliers, potential entrants, and substitute solutions are all competitive factors that need to be identified. The weaker the threat are collectively, the greater the opportunity for superior performance (Porter, 1979). The goal of the analysis is to find a position where Ericsson best can defend itself against these forces or can influence them in its favor.

52
Force 1: Industry RivalryIndustry rivalry is normally measured by how high the concentration of the market share is divided among the four largest firms. A low concentration ratio indicates that the industry is characterized by many rivals, no one of which have a significant market share. Such a market is more competitive. A high concentration ratio is, on the other hand, an industry with few rivals with large portions of the market share. The Indian market can go either way, but it is estimated that it is more likely to go for a high concentration ratio (see above discussion, chapter 6.2.1.4). Around ten providers is a rough guess of the industry concentration after the sifting. In pursuing an advantage over rivals, a firm can choose from several competitive moves; changing prices (raising or lowering prices to gain a temporary advantage), improving product differentiation, creatively using channels of distribution, and exploiting relationships with suppliers (Yip, 1982).
Force 2: Threat of substitute servicesThe threat of substitute services is expected to be low in the near future, but in the longer perspective a threat of a substitute service may arise with the expected deregulation of active infrastructure sharing policies. Active sharing services would under normal circumstances imply alliances between operators and thus a consolidation of the market, resulting in deceased revenue for “passive site leasing” companies. In most western markets, were active sharing and “site leasing” services co-exists, this is a known threat and has been stated as a factor which needs attention23.
Force 3: Bargaining power of customersThe bargaining power of the customers is expected to be relatively high. There exist few buyers with significant market share (BSNL, Bharti, Hutch, IDEA, TATA, and Reliance) indicating high bargaining power, but since the service is expected to be sold to other industries like TV and radio broadcasting it will be lessened.
23 Source is American Tower and Crown Castle Annual Reports, 2005.
Industryrivalry
Bargaining power of customers
Bargaining power of suppliers
Threats of substitute products
Threats of new
entrants
Figure 6.14. The industry’s five forces (Porter, 1979)

53
Force 4: Threat of new entrantsThe threat of new entrants is expected to be present and most threatening in the introduction and growth stage of the service. As described above, it is believed that competition will get increasingly fierce as the service grows in sales, but that the number of providers will decrease as the market matures. The highest entrant threat is concluded from above analysis to come from foreign tower companies.
Force 5: Bargaining power of suppliersThe suppliers’ power will be low. The suppliers to Ericsson in India in this particular service will not differ from the ordinary operations. The suppliers, in other words, will be infrastructure providers which build the sites and some equipment suppliers which provide the sites with equipment as antennae and feeds. As these will not differ from the normal operations, the bargaining power of suppliers is not an important force to watch out for in the “telecom site leasing” business.
6.2.3.1 Five Forces Conclusion
Figure 6.15 below summarizes the forces identified above. The analysis goal was to find a position where Ericsson best can defend itself against these forces.
The analysis relieved that the market will have a high concentration ratio, with rather few but strong competitors. These competitors are expected to foremostly come from the American tower industry. Since the bargaining power of the customers will furthermore be rather high it is advisable that Ericsson should create a financially strong unit through aggressive initial investments. A start entry, which will be discussed more in the next chapter, is bidding for the USO funded sites. Through such investments Ericsson will create higher entry barriers for new entrants, as higher capital requirements, economies of scale, brand recognition, and access to distribution channels. The higher barriers will
Industry rivalry→
High market concentration ratio
Bargaining powerof customers
→ Relatively high
Bargaining powerof suppliers
→Relatively low
Threats of new entrants→
High in growth face.Tower COs the biggest threat
Threats of substitute products/services
→Active infrastructure sharing
Roaming
Figure 6.15. Summary of five forces analysis

54
result in fewer competitors and stronger bargaining power for the service providers. Ericsson is thus creating a more profitable market through decreasing customer powerand the threat of new entrants, while achieving a more consolidated industry. In pursuing an advantage over the fewer but stronger competitors it is advised that Ericsson should differentiate its service offering. This strategy will be discussed more into detail in the next chapter.
When it comes to the treat of substitute services, the expected future deregulation of the active infrastructure sharing policy can’t be prevented. If a scenario of increased alliances between operators, increased roaming, and entry of MVNOs will realize, thus decreasing the demand for a “passive site leasing” service between multiple tenants, Ericsson is estimated to have several possibilities. Since Ericsson has its historical core knowledge in active infrastructure, it is expected that Ericsson can shift scope of business relatively easy. The already present shared towers would still be of used, but instead of leasing out passive infrastructure only, Ericsson could now lease active services to operators as well (Ericsson, 2006). Ericsson would, in other words, supply the operators with the possibility to lease both active and passive equipment, much like the services to MVNOs supplied by other wireless service providers today. This new business is estimated to bring increased revenues compared to just leasing passive infrastructure.
6.2.4 SWOT analysisAnother well known analysis tool is the SWOT model. The purpose of its use here is to further explore how to best enter the business in an Ericsson perspective. The model is useful in order to realize and understand both the strengths and opportunities, but also the weaknesses and threats to form a final strategy.
6.2.4.1 Strengths
Ericsson holds a relatively large portfolio of strengths related to the leasing service. Its strongest is viewed to be its unique selling point of being able to deliver a total solution to its customers, including everything from the leasing service to installations, updates, products, and O&M services of both passive and active parts. The leasing service, included in a one-stop-shop package, would thus be a value added service to Ericsson’s customers. Compared to potential competitors Ericsson has strengths like cultural knowledge, present customer base, access to well working distribution system and suppliers, estimated superior service performance in O&M and network management, and high quality reputation among customers in relating fields.
6.2.4.2 Weaknesses
The most apparent weakness is the lack of experience in the tower industry. Tower companies, which have several years of experience of leasing out passive infrastructure to operators, can follow a known formula and adapt it to the market. Ericsson may have more difficulties when leveraging the business and thus be a few steps behind. Another weakness that Ericsson holds compared to some of its competitors, when only looking at the passive sharing solutions, is an estimated higher cost solution. The estimation is based on the lack of experience in pricing of the service and the business in general. Tower companies will probably be able to reduce cost and possibly offer a lower priced solution
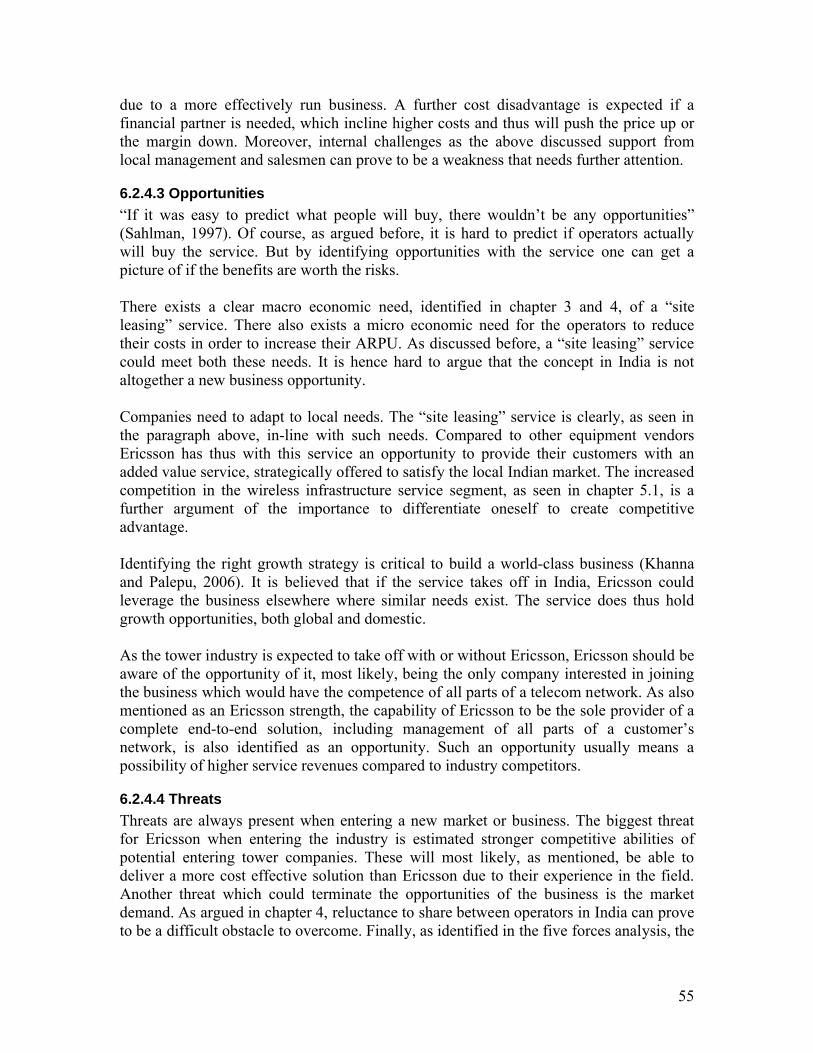
55
due to a more effectively run business. A further cost disadvantage is expected if a financial partner is needed, which incline higher costs and thus will push the price up or the margin down. Moreover, internal challenges as the above discussed support from local management and salesmen can prove to be a weakness that needs further attention.
6.2.4.3 Opportunities
“If it was easy to predict what people will buy, there wouldn’t be any opportunities” (Sahlman, 1997). Of course, as argued before, it is hard to predict if operators actually will buy the service. But by identifying opportunities with the service one can get a picture of if the benefits are worth the risks.
There exists a clear macro economic need, identified in chapter 3 and 4, of a “site leasing” service. There also exists a micro economic need for the operators to reduce their costs in order to increase their ARPU. As discussed before, a “site leasing” service could meet both these needs. It is hence hard to argue that the concept in India is not altogether a new business opportunity.
Companies need to adapt to local needs. The “site leasing” service is clearly, as seen in the paragraph above, in-line with such needs. Compared to other equipment vendorsEricsson has thus with this service an opportunity to provide their customers with anadded value service, strategically offered to satisfy the local Indian market. The increased competition in the wireless infrastructure service segment, as seen in chapter 5.1, is afurther argument of the importance to differentiate oneself to create competitive advantage.
Identifying the right growth strategy is critical to build a world-class business (Khanna and Palepu, 2006). It is believed that if the service takes off in India, Ericsson could leverage the business elsewhere where similar needs exist. The service does thus hold growth opportunities, both global and domestic.
As the tower industry is expected to take off with or without Ericsson, Ericsson should be aware of the opportunity of it, most likely, being the only company interested in joining the business which would have the competence of all parts of a telecom network. As also mentioned as an Ericsson strength, the capability of Ericsson to be the sole provider of a complete end-to-end solution, including management of all parts of a customer’s network, is also identified as an opportunity. Such an opportunity usually means a possibility of higher service revenues compared to industry competitors.
6.2.4.4 Threats
Threats are always present when entering a new market or business. The biggest threat for Ericsson when entering the industry is estimated stronger competitive abilities of potential entering tower companies. These will most likely, as mentioned, be able to deliver a more cost effective solution than Ericsson due to their experience in the field. Another threat which could terminate the opportunities of the business is the market demand. As argued in chapter 4, reluctance to share between operators in India can prove to be a difficult obstacle to overcome. Finally, as identified in the five forces analysis, the
56
threat of industry consolidation as a result of future allowance of active sharing is a threat in the long term that will most likely end in the need for Ericsson to reinvent the service. All of these threats are estimated to have the ability of turn the cash flow of the service to negative numbers.
6.2.4.5 SWOT conclusion
A summary of the findings of the SWOT analysis is presented in figure 6.16 below.
Strengths- Superior service performance compared to
competitors in O&M, installations, management etc.
- Existing customer relationships- Unique selling point – one stop shop for
management of total network to a reduced cost than before.
- Knowledge of market and business culture.- Access to a well established distribution
system and local suppliers.- High quality reputation in relating fields.
Weaknesses- Price – Ericsson’s lack of ability to deliver
as cost effective solutions as Tower Cos.- People – smaller part of Ericsson’s overall
business, therefore not as much focus as potential competitors.
- Communication internally and externally.- Brand recognition in the leasing service
field.
Opportunities- Macro and micro economic need.- Added value to customer.- Competitive advantage over existing
equipment vendors. - Domestic and international growth
opportunities.- Possibility of being a sole provider of an
end-to-end network service.
Threats- Tower Cos strong competitive abilities.- Affect on existing customer relations if
business not successful.- Market demand. Overcome operators’
reluctance to share and change.- Industry consolidation.
6.3 Risk AnalysisGrowth always involves taking risks. A firm needs to assess the risks and potential outcomes to face and minimize them. One should keep in mind that a risk can be turned into an opportunity (Slywotzky and Drzik, 2005).
6.3.1 Financial Risk24
From the findings in the previous chapters and from the sensitivity analysis, financial risks for Ericsson when entering the business have been distinguished. Four main financial risk scenarios which have been identified as entering risks will be discussed below.
The first identified risk is the risk of not overcoming the challenge of the local sharing reluctance between the operators. This can result in Ericsson not being able to bring 24 The financial risk analysis is based on sources from Ericsson India and annual reports from the tower industry.
Figure 6.16. Summary of SWOT analysis
57
much more than one tenant to a site (Ericsson, 2006). Since the price model used in the industry is based on an assumption that on average there will be more than one tenant per site, such a scenario will result in substantial losses. A tendency of such results could be seen in the sensitivity analysis (see analysis 1, chapter 6.1.1), where a 20% decrease of third tenant customers lead to 18% lower NPV. The scenario of only achieving one tenant per site would result in the disastrous NPV of -641 million USD. Even if the likeliness of only attracting one tenant to each site is small, one should note that the number of tenant variable is important for the profitability of the business.
The risk of affecting presently good customer relations negatively if the service does not meet industry expectations is another scenario which has been identified as a potential risk not only to the business but to Ericsson India as a company. Such a risk could decrease Ericsson’s market share and revenues in the overall Indian business.
The third risk is the risk of not achieving expected rental revenues. The rental revenues, as seen in the sensitivity analysis (see analysis 3, chapter 6.1.1), are also an important variable for a successful business. The Indian market is very price sensitive and it is possible that Ericsson’s “telecom site leasing” business will be forced to push prices down below expected levels. A 20% decrease in expected rental revenues would result in an 83% decrease of the NPV. The revenues are therefore a variable of importance to monitor.
The last of the four main identified risks is the risk of hidden costs. Costs not included in the investment analysis, have the capability of turning the investment to a non-profitable one.
Other identified long term risks include; mergers among wireless providers implying consolidation of the industry, engagement of roaming between wireless providers as an alternative to sharing, and too long return of investment even if the net present value is positive.
6.3.2 Going Alone vs. Partner risks Knowledge and funding from an outside partner is a solution to overcome some of the challenges when entering the business. A possibility is to join a more into depth partnership like a joint venture. An entrance to such a partnership is usually time consuming and difficult depending on the partner. Important aspects to take into account when planning for a joint venture is the purpose of the venture, common goals, and organizational similarities (Linde, 2006). It is estimated that neither of the identified possible partner groups can fulfill all of these requirements. The lack of similarity between the organizations is the biggest threat in this case for an unsuccessful venture. It is therefore concluded that Ericsson should more look into the possibility to get funding and maybe also knowledge from a “partnership” with looser strings attached. The identified risks of the different partner solutions are given below.
- Going alone – no alliance with any major entity. Ericsson takes the assets incurred with owning sites on their balance sheet and hire local contractors etc. as usual when delivering site solutions to customers.
58
Risks – slower time to market, assets on balance sheet, and lack of experience in sharing which could result in less competitive abilities.
- Partner with bank/financial institute – bank/financial institute takes assets. Ericsson gets a better balance sheet, but at a cost to the banks. Ericsson hires local contractors etc. as usual when delivering site solutions to customers. Risks – higher costs, lack of knowledge of leasing concept, and
reduced profits or higher fees for the customer which in turn can lead to less competitive abilities.
- Partner with infrastructure providers – infrastructure providers take the assets and the responsibility of delivering a finished site infrastructure to Ericsson, who in turn installs required equipment, leases it, and manages it to the customers. Risks – possibly higher costs, lack of knowledge of leasing
concept, and infrastructure providers’ lack of resources to meet growth of business.
- Partner with tower company – tower company takes assets, share their knowledge of how to leverage a shared infrastructure solution, and are responsible of building the site together with Ericsson and other infrastructure suppliers. An exchange of information takes place, Ericsson share knowledge of market and tower company share knowledge of business. Risks – relatively complicated partnership with identified
unwanted high “strings attached”. The more sharing the more the partnership turn into a joint venture. The estimated large differences in corporate culture between one of the big international tower companies and Ericsson can result in an unsuccessful venture. Other risks include higher costs, tower company takes too much control over business resulting in Ericsson being a supplier to them, Ericsson get detached from business, and has shared knowledge of market to potential competitor.
6.3.3 Risk FindingsThe biggest opportunity usually lies with the first mover, but they also have to take the largest risks. It can be concluded that a company always has to take risks to continue growing and surviving in the market place, the question is if the risks are too high.
The financial risk analysis has provided with the insight that the business is not immortal even though it is strong. When entering a new business many unexpected turns can take place in the first years. These turns can shift the business into a non-profitable one. The business is expected to hold for some of these risks, but not all. Still, the answer to the above question, if the risks are too high, can be concluded to be negative. Most of these risks will emerge in an early stadium resulting in a relative fast understanding of how the business will proceed. If the outlook does not look good enough, a quick exist, through
59
selling of the sites to competitors or back to operators, is estimated to recover most of the initial investments.
Some kind of partner is most likely needed for carrying the assets completely or partially. After analyzing the alternatives it has been concluded that a bank/financial institute is probably the easiest and most straight forward solution to overcome the financial challenges. Partnering with any of the infrastructure providers is not a realistic solution since the goal of the partnership is financial backing and neither of the providers in the markets is estimated to be reliable in such terms. It is concluded that infrastructure providers as partners can’t add any value to Ericsson’s service. Partnering with a bank/financial institute will not give any knowledge in the leasing field or overcome the brand recognition barrier, but compared to the alternative of partnering with a tower company, it is viewed as more beneficial since it is less complicated and less risky. An identified possibility to overcome the knowledge barrier is instead to get it from the leasing business via recruitment of A or B listed people from the tower industry abroad. It is also estimated that Ericsson has such a strong brand name in relating fields that the barrier will be reduced. A partnership with a tower company is likely to be too time consuming, and as this has never been done before, it is probably more risky and can result in a longer time to market.
6.4 Analyses FindingsOne could say that Ericsson is an adapter to the future and local needs with this new business. The statement is concluded from the company’s ambition to capture new opportunities in an existing market. The various analyses above show the outlook for these ambitions in India.
The sensitivity analysis showed that number of tenants per towers and size of rental fees are two sensitive variables. A negative trend in these variables can turn the business to a non-profitable one. The analysis also showed that if Ericsson should decide to build more towers it would increase the profitability.
The barriers of entry analysis showed that Ericsson’s highest barriers were their unknown brand name in the tower leasing industry, the high capital requirements and hence the need to find a financial partner to take the assets, and their lack of knowledge in the leasing field.
The five forces analysis concluded that the best position for Ericsson to defend them self against the identified forces was to create a financially strong unit with aggressive initial investments.
The SWOT analysis simply pointed out the areas which need attention, as the people and communication issue, and the areas which place Ericsson in an advantageous position compared to competitors. Such advantages included Ericsson’s wide spanning telecom knowledge, knowledge of market, and existing access to distribution and suppliers.
60
The risk analysis concluded that four main risks exist which have the potential to turn the business into a non-profitable one. The business will most likely stay profitable if one or maybe two of these risks realizes to a moderate extent, but not all. It is further believed that all of them can be discovered at an early stadium, thus the possibility to plan exit strategies quickly, resulting in a recovery of most of the initial investments. It is therefore concluded that the benefits exceed the risks. The risk analysis also summarized that the best financial partner is a bank or financial institute. The partner risk analysis furthermore suggests that Ericsson could gain more competence in the field by recruiting A and/or B listed people from the tower industry abroad.
Through these analyses it has been found that to minimize losses a pilot project should first be introduced, similar to the governmental initiative. If the pilot proves to attract operators and give an incentive of improved customer relations then Ericsson should start a more aggressive approach. The aggressive investment approach means to supply the market at a high speed and in a large scale, while focusing initially on areas where demand for increased capacity is high. With such a strategy risks are minimized, threats of competition lessened, and market opportunities and strengths like economies of scale and market knowledge taken advantage of. This will be further discussed in the entry proposal in the following chapter.
6.5 Key FindingsThe key findings of this chapter are presented below.
- If a project length of 10 years is assumed and 15,000 towers built then the cumulated profit can be expected to turn positive in year 5, a positive NPV (= 274 million USD) achieved, PB period = 5.3 years, and IRR = 17.6%.
- Three major groups of competitors have been distinguished, mentioned in order with highest threat first; tower companies, infrastructure providers, and equipment vendors.
- The industry rivalry is expected to be high in concentration, with few players dominating the market.
- An unfulfilled customer need is identified as the most important opportunity when entering the business.
- Expected benefits are believed to exceed the financial risks.- The “partner” alternative with the least risk is estimated to be a bank or a
financial institute.

61
7. Entry Strategy Conclusion
From the analyses presented in the previous chapter it is now believed that sufficient knowledge is achieved to answer the question which was the main purpose of the thesis; how to enter the “telecom site leasing” business. The coming chapter will present an internal action plan for Ericsson to follow to prepare the organization for a successful entrance. The chapter will also conclude the complete external and internal entrance plan and present some areas which are recommended for further studies.
7.1 Action Plan ModelMany cornerstones are needed to build a successful and sustainable strategy for a new business idea, even though many good opportunities are present. There exist several industry examples where companiesonly achieve a part of their strategies’ potential value because of the lack of a thorough plan of execution(Mankins & Steele, 2005). In order to succeed all the way, a solidly grounded realistic plan of execution, or entry strategy, is needed. With such a plan, shortfalls can quicker be taken action against and the strategy turned into great performance.
A general plan of execution has been developed in order to easier identify missing pieces to achieve expected performance and to prioritize the right step at the right point in time (see figure 7.1). Even though the plan is general, it is constructed to suit the service sector and more specific; Ericsson’s entry in the infrastructure sharing business.
Identify business opportunities, is the first step an idea must take to create interest. While identifying the opportunities, an industry- and company -analysis needs to be performed to get a picture of the idea’s competitive abilities. Such analysis could be the above used five forces and SWOT. Questions like if the company have the required resources to bring the idea to the market, should furthermore be answered in this step.
Get management support, is crucial in order to pursue the idea to the next step. The management support does not necessarily mean backing to leverage the idea to the market, but it means approval
Identify Business Opportunities
Get Management Support
Calculate a Cost Analysis
Perform a Price Model
Find Financial Support
Get Workforce Support
Approach Customer
Monitor
Figure 7.1. A general entry strategy plan.
62
of further investigating of it at a broader level.
Calculate a cost analysis, to understand the possibility of the business and the abilities of the company in financial terms.
Perform a price model, to find a suitable pricing strategy. How should the product/service be priced under various market situations? Perform a market analysis and develop a pricing model thereafter.
Find financial support, if needed. Different possible partners should be contacted and analyzed.
Get workforce support, to finally leverage the solution to the market. The in-house support from top managers to salesmen is needed to reach the customers. Clear and simple communication with e.g. a rigorous framework is a recommendation (Mankins & Steele, 2005). Motivation of the staff to actually sell the new service is an important factor for successful performance. One way to create higher motivation is through reward systems.
Approach the customer, is a natural step, but the timing is important to consider. When the customer is approached the business should be ready for it including the work force, top management, the suppliers, and the partners. A decent proposition which takes a strategic standpoint needs to be ready.
Monitor, is recommended to follow results and correct dissatisfying performance in time (Mankins & Steele, 2005). Key performance indicators (KPI) are a commonly used instrument for the purpose.
7.1.1 A Suggested Ericsson Action PlanThe above general entry strategy plan will below be applied to an Ericsson context. Note that the model is, as all models are, a simplified picture of the real world. The aim of the model is to easier identify various issues and challenges and overcome these to achieve enhanced performance when leveraging the business. One needs to go through each step at a time and analyze it in an objective manner to identify gaps and new risks.
The two first stages; “identify business opportunities” and “get management support”, will not be further elaborated on, since both have already been executed.
Calculate a cost analysisChallenges – identifying all costs included in the business. Analysis solution – encourage more communication within the unit to get as many inputs to the cost calculations as possible.

63
Perform a price modelChallenges – place oneself price wise strategically in the market. What is a reasonable margin to achieve profitability but also price competing abilities.Analysis solution – compare to other markets where similar solutions are present and communicate with customers to understand their expectations (see also “entry strategy conclusion and discussion” below for further findings).
Find financial supportChallenges – risks with financial “partner” as discussed in chapter 6.3.2.Analysis solution – go with a bank/financial institute partner to minimize risks.
Get workforce supportChallenges – reach, get acceptance, and communicate the importance of the business to the sales team. Analysis solution – top management influence is of importance. To motivate further a reward system could be a possible solution.
Approach the customerChallenges – persuading the customer of the benefits with the business to overcome their sharing conservatism. Also, the unifying of Ericsson people in order to approach the customer with a
solution that everybody has understood and supports. Analysis solution – present to the customers in a simple and clear fashion all the benefits of sharing in a five year time horizon. Support the proposal with strong in-house communication.
MonitorChallenges – find the right KPIs which reflect the business.Analysis solution – suggested KPIs are profitability, OPEX, customer satisfaction, and average sharing per tower.
Identify Business Opportunities
Get Management Support
Calculate a Cost Analysis
Perform a Price Model
Find Financial Support
Get Workforce Support
Approach Customer
Monitor
Under progress
Need priority now
Not done, need attention
Done
Figure 7.2. A suggested entry strategy plan for Ericsson.
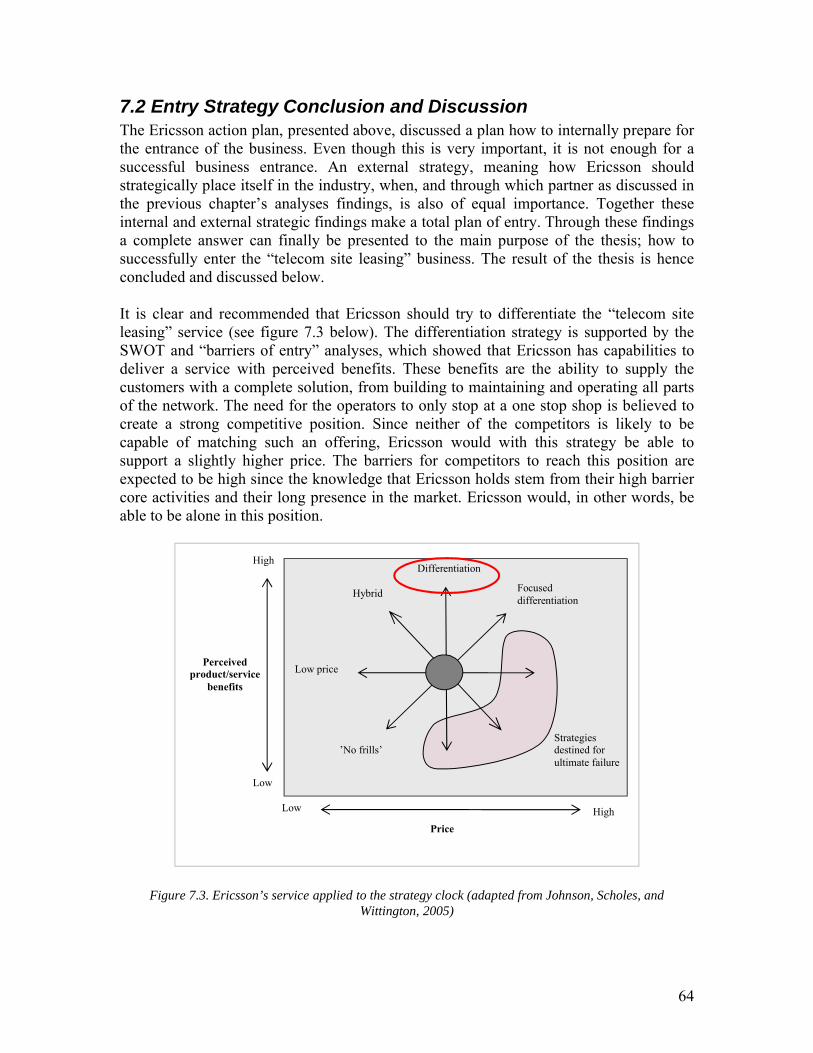
64
7.2 Entry Strategy Conclusion and Discussion The Ericsson action plan, presented above, discussed a plan how to internally prepare for the entrance of the business. Even though this is very important, it is not enough for a successful business entrance. An external strategy, meaning how Ericsson should strategically place itself in the industry, when, and through which partner as discussed in the previous chapter’s analyses findings, is also of equal importance. Together these internal and external strategic findings make a total plan of entry. Through these findings a complete answer can finally be presented to the main purpose of the thesis; how to successfully enter the “telecom site leasing” business. The result of the thesis is hence concluded and discussed below.
It is clear and recommended that Ericsson should try to differentiate the “telecom site leasing” service (see figure 7.3 below). The differentiation strategy is supported by the SWOT and “barriers of entry” analyses, which showed that Ericsson has capabilities to deliver a service with perceived benefits. These benefits are the ability to supply the customers with a complete solution, from building to maintaining and operating all parts of the network. The need for the operators to only stop at a one stop shop is believed to create a strong competitive position. Since neither of the competitors is likely to be capable of matching such an offering, Ericsson would with this strategy be able to support a slightly higher price. The barriers for competitors to reach this position areexpected to be high since the knowledge that Ericsson holds stem from their high barrier core activities and their long presence in the market. Ericsson would, in other words, be able to be alone in this position.
’No frills’
Low price
Hybrid
Differentiation
Focused differentiation
Strategies destined for ultimate failure
Low
High
High
Price
Perceived product/service
benefits
Low
Figure 7.3. Ericsson’s service applied to the strategy clock (adapted from Johnson, Scholes, and Wittington, 2005)
65
It is now clear where Ericsson should position its service in the industry, but when and how the service should first be presented is still questionable. From the analyses findings in the previous chapter it was found that a pilot project should first be introduced. Rushing to the market seldom proves to be a success. A pilot project would also minimize some of the risks identified in the financial risk analysis. It was found that the risk of sharing reluctance, affecting customer relations negatively, unexpected drop in rental revenues, and hidden project costs are all risks which are estimated to surface at an early stadium. A pilot is therefore a smart move to quickly get an insight of how the industry will evolve. A good start of the pilot project could be bidding for some of the USO funded sites, depending on the timing of the governmental start of the bidding.
After an evaluation of the pilot project, in a time effective manner, Ericsson should start a more aggressive approach, assuming the evaluation returned positive results. The aggressive approach strategy is supported by the sensitivity-, “barriers of entry”-, five forces, and SWOT –analysis. From these analyses it was found that Ericsson in this way creates a more profitable business and higher barriers for new entrants.
In the sensitivity analysis it was showed that when building 5000 more towers the net present value increased. Initial investment obviously increases thus the longer pay back period, but in the long term it is a more profitable strategy.
From the “barriers of entry” analysis it can be concluded that such a strategy reinforces entrance barriers through higher capital requirements, economies of scale, brand recognition, and access to distribution channels. Three of these barriers; the capital requirement, economies of scale, and access to distribution channels, are strengths that Ericsson has, compared to competitors. These advantages are something that Ericssonshould take advantage of in its entry strategy. It is also expected that the strategy would easier overcome Ericsson’s brand recognition barrier, compared to the tower companies, through the creation of a strong foothold in the industry faster than tower-competitors. The SWOT analysis also showed that the brand recognition barrier should, compared to other competitors, decrease since Ericsson’s high quality reputation in relating fields.
The five forces analysis further supports the aggressive entry strategy, because if it’s cleverly positioning of Ericsson in the industry. It was found that it decreases the power of three of Porter’s forces; threats of new entrants, industry rivalry, and the bargaining power of customers. The reduction in the power of these forces is connected to each other; the higher entrance barriers created by the strategy result in a more consolidated industry, which in its turn decreases the bargaining power of the customers. An aggressive entrance strategy would thus create higher incentives for a more profitable business.
Through the partner risk analysis it was found that financial support will most likely be needed and wanted from an outside partner. The idea is that the outside partner will take the assets incurred with owning sites on their balance sheet. Together with a suitable financial partner, believed to be a bank/financial institute, investments to supply the market in a high speed and in a large scale will therefore easier be achieved. Initial focus
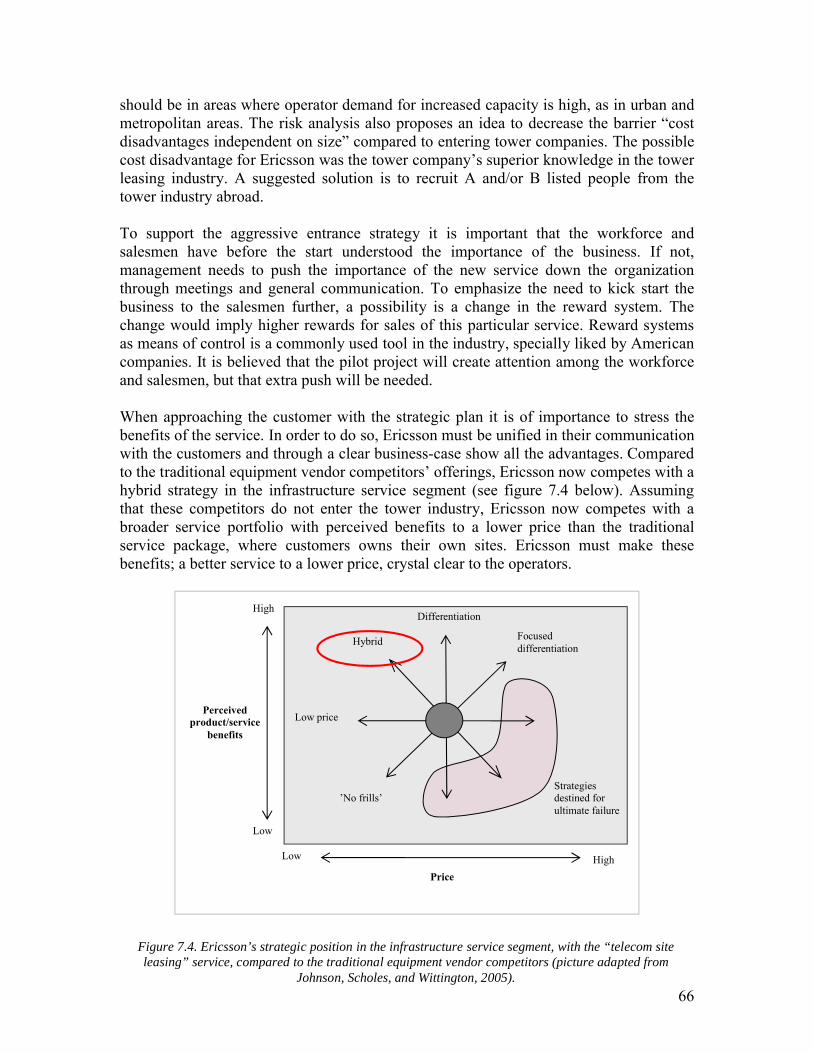
66
should be in areas where operator demand for increased capacity is high, as in urban and metropolitan areas. The risk analysis also proposes an idea to decrease the barrier “cost disadvantages independent on size” compared to entering tower companies. The possible cost disadvantage for Ericsson was the tower company’s superior knowledge in the towerleasing industry. A suggested solution is to recruit A and/or B listed people from the tower industry abroad.
To support the aggressive entrance strategy it is important that the workforce and salesmen have before the start understood the importance of the business. If not, management needs to push the importance of the new service down the organization through meetings and general communication. To emphasize the need to kick start the business to the salesmen further, a possibility is a change in the reward system. The change would imply higher rewards for sales of this particular service. Reward systems as means of control is a commonly used tool in the industry, specially liked by American companies. It is believed that the pilot project will create attention among the workforce and salesmen, but that extra push will be needed.
When approaching the customer with the strategic plan it is of importance to stress the benefits of the service. In order to do so, Ericsson must be unified in their communication with the customers and through a clear business-case show all the advantages. Compared to the traditional equipment vendor competitors’ offerings, Ericsson now competes with a hybrid strategy in the infrastructure service segment (see figure 7.4 below). Assuming that these competitors do not enter the tower industry, Ericsson now competes with a broader service portfolio with perceived benefits to a lower price than the traditional service package, where customers owns their own sites. Ericsson must make these benefits; a better service to a lower price, crystal clear to the operators.
’No frills’
Low price
Hybrid
Differentiation
Focused differentiation
Strategies destined for ultimate failure
Low
High
High
Price
Perceived product/service
benefits
Low
Figure 7.4. Ericsson’s strategic position in the infrastructure service segment, with the “telecom site leasing” service, compared to the traditional equipment vendor competitors (picture adapted from
Johnson, Scholes, and Wittington, 2005).
67
It is finally recommended to monitor the business carefully to continuously evaluate if the results match the expectations. One suggestion of such monitoring is to use key performance indicators. These indicators should foremostly reflect performance in risk zone areas, identified in the sensitivity- and financial risk –analysis.
The concluded entrance strategy is believed to minimize risks and threats of fierce competition, but also take full advantage of Ericsson strengths and market opportunities.Note that the strategy does not initially solve the problem of the rural slow network implementation development. Through bidding on some of the USO funded sites in the pilot project it contributes, but after that it is recommended to focus on metropolitan and urban areas where demand is high. In the longer term on the other hand, it will probably contribute, since if service proves to be successful an expansion including these areas is inevitable.
7.3 Recommendations for Further StudiesOne of the largest identified risks is the uncertainty of the market; the risk of Ericsson not being able to attract enough tenants to each site to make the business profitable. To minimize this risk it is therefore recommended that the company should perform an into depth market analysis to get a better understanding of the real potential of the market. It is further recommended to hire a consultant company, which would be more neutral, to investigate this issue.
A possibility to overcome some of the internal challenges is to conduct a study of the knowledge and support of the workforce for the “telecom site leasing” business. The study would hopefully show the gaps of knowledge of management and workforce and present some suggestions in order to motivate the salesmen more.
68
References
Personal ContactsAndres Linde, Business Development, Global Services, Telefonaktiebolaget LM Ericsson
Håkan Ericsson, Sales Director, Global Services, Telefonaktiebolaget LM Ericsson
Jan Lund, Product Manager, Managed Services, Ericsson Global Services, Telefonaktiebolaget LM Ericsson
Rajul Kumar, Managing Principal Ericsson Business Consulting, Ericsson India Pvt Ltd
Richa Singh, Assistant Manager Network Rollout, Ericsson India & Sri Lanka Pvt Ltd
Vibhas Sharma, Head of Sales Network Rollout, Ericsson India & Sri Lanka Pvt Ltd
Vishal Awal, Vice President Services , Ericsson India & Sri Lanka Pvt Ltd
Publications
BooksJohnson, G., Scholes, K., Whittington, R. (2005), Exploring Corporate Strategy, Financial Times Prentice Hall, seventh edition
Persson, I., Nilsson, S-V. (2001), Investeringsbedöming, Liber Ekonomi, sixth edition
Prahalad, C.K. (2005), The Fortune at the Bottom of the Pyramid, Wharton School Publishing
Reports & PapersAmerican Tower Annual Report, (2005),Available: http://library.corporate-ir.net/library/98/985/98586/items/190842/annual_2005.pdf[Accessed 25 August, 2006)
Bharti Annual Report, (2005),Available: http://www.bhartiairtel.in/fileadmin/srijan/Results_Record/us_gaap_financials_05_06.pdf[Accessed 02 August, 2006]
Bharti Quarterly Report, (2005),Available: http://www.bhartiairtel.in/fileadmin/srijan/Results_Record/quarterly_report_q1_fy07.pdf[Accessed 02 August, 2006]
Coleman, S., Marchetti, J., Ahmand, A., Dionisio, P. (2006), Communications Equipment; India on the Cusp, Morgan Stanley [Electronic],Available (for Ericsson employees only): http://bic.ericsson.se/sources/intelliscope/20060126/10890690.pdf[Accessed 20 September, 2006]
Courtney, H., Kirkland, J., Viguerie, P. (1997), Strategy Under Uncertainty, Harvard Business Review, November 1997
69
Crown Castle Annual Report, (2005),Available: http://www.crowncastle.com/investor/10K/Crowncast2005k.pdf[Accessed 25 August, 2006]
DoT, (2006), A Four Year Business Plan for Rural Infrastructure [Electronic], DoT,Available: http://www.bharatnirman.gov.in/[Accessed 08 August, 2006]
DoT, (2006), Engagement of a financial consultant for advising the USOF in finalization of the project for supporting infrastructure for cellular mobile services in rural areas [Electronic], DoT, Available: http://72.14.235.104/custom?q=cache:TMlYnzW75n0J:www.dot.gov.in/uso/EOI%2520for%2520Financial%2520Consultant%2520USOAPR06.doc+Mobile+Operators%27+Shared+Tower&hl=en&ct=clnk&cd=1&ie=UTF-8[Accessed 21 August, 2006]
Haub, C., Sharma, O.P. (2006), India’s Population Reality: Reconciling Change and Tradition[Electronic], The Population Reference Bureau Available: http://www.prb.org/pdf06/61.3IndiasPopulationReality_Eng.pdf[Accessed 15 September, 2006]
Hulten, S., Andersson, P. (2001), 3G Mobile Policy the Case of Sweden [Electronic], Part of a series of Telecommunication Case Studies produced under the New Initiatives program of the Office of the Secretary General of the ITU,Available : http://www.itu.int/osg/spu/ni/3G/casestudies/sweden/Sweden_fin3.pdf[Accessed 11 August, 2006]
Jain, K., Manson, N., Sankhe, S. (2005), The Right Passage to India, The McKinsey Quarterly, February 2005
Khanna, T., Palepu, K.G. (2006), Emerging Giants, Building World-Class Companies in Developing Countries, Harvard Business Review, October 2006
Kim, C., Mauborgne, R. (2004), Blue Ocean Strategy, Harvard Business Review, October 2004
Lee, K. (2006), India’s fixed market: will it take off? [Electronic], WirelessStrategy@Ovum,Available (for Ericsson employees only): http://bic.ericsson.se/sources/ovum/cao_a/content/036540.htm[Accessed 7 September, 2006]
Macquarie Communications Infrastructure Group Annual Report, (2006),Available: http://mcg.republicast.com/ar2006/republicast.asp?page=1&layout=1&control=yes&zoom=100[Accessed 26 August, 2006]
Mankins, M., Steele, R. (2005), Turing Great Strategy into Great Performance, Harvard Business Review, July-August 2005
O2 Annual Report, (2002),Available: http://www.o2.com/media_files/20-F_2002.pdf[Accessed 13 October, 2006]
Porter, M.E. (1979), How Competitive Forces Shape Strategy, Harvard Business Review, March 1979
Ranjalkar, S.H. (2006), Telecom scenario in India [Electronic], GTL Infrastructure Ltd,Available: http://www.assocham.org/events/recent/event_59/prakask.ppt[Accessed 07 August, 2006]
70
Sahlman, W. (1997), How to write a great business plan, Harvard Business Review, July 1997
SBA Communications Annual Report, (2005),Available: http://library.corporate-ir.net/library/91/911/91174/items/192311/ar05.pdf[Accessed 25 August, 2006]
Sirkin, J.H., Jackson, A. (2005), The Hard Side of Change Management, Harvard Business Review, October 2005
Slywotzky, A., Drzik, J. (2005), Countering the Biggest Risk of them All, Harvard Business Review, April 2005
Telecom Regulatory Authority of India, (2006), Financial Analysis of Telecom Industry of China and India[Electronic], TRAI, Available:http://www.trai.gov.in/trai/upload/StudyPapers/7/Study%20Paper%20of%20China%2027%20June%202006_NEW.pdf[Accessed 18 August, 2006]
Telecom Regulatory Authority of India, (2004), Growth of Telecom Services in Rural India [Electronic], TRAI, Available: http://www.trai.gov.in/trai/upload/ConsultationPapers/17/27octconspap.pdf[Accessed 03 August, 2006]
Telecom Regulatory Authority of India, (2005), Indications on Telecom Growth [Electronic], TRAI, Available: http://www.trai.gov.in/trai/upload/StudyPapers/2/ir30june.pdf[Accessed 03 August, 2006]
Telecom Regulatory Authority of India, (2005), State of Indian Telecom Network [Electronic], TRAI, Available: http://www.trai.gov.in/trai/upload/StudyPapers/5/spaper2nov05.pdf[Accessed 08 August, 2006]
Telecom Regulatory Authority of India, (2006), The Indian Telecom Services Performance Indicators October – December 2005 [Electronic], Available: http://www.trai.gov.in/trai/upload/Reports/26/Report%20QE%20Mar-06%20Part%20I.pdf[Accessed 08 August, 2006]
US Securities and Exchange Commission, (2006), EDGAR Filer Manual, US Securities and Exchange Commission, Available: http://www.sec.gov/info/edgar/forms/edgform.pdf[Accessed 13 October, 2006]
Waite, T. (2002), Stick to the Core - or Go for More, Harvard Business Review, February 2002
Yip, G. (1982), Gateways to Entry, Harvard Business Review, September 1982
Zook, C., Allen, J. (2003), Growth Outside the Core, Harvard Business Review, December 2003
ArticlesAhluwaila, J. (2004), Ericsson India, a Hundred Years to Build Upon, Factiva [Online], 04 January, 2004Available (for Ericsson employees only): http://internal.ericsson.com/page/hub_indiasrilanka/news/intouch/archives/2004/jan04/inauguration.jsp[Accessed 23 August, 2006]
71
Arqiva press release, (2006), Vodafone signs up to Arqiva’s CityCell service in Glasgow, Arqiva [Online], 06 July 2006 Available: http://www.arqiva.com/server.php?show=ConWebDoc.674[Accessed 17 August, 2006]
Augustsson, T. (2006), Ericssons tillväxt satt i vänteläge, Svenska Dagbladet, 20 October, 2006
Charny, B. (2004), New wireless resellers to aim at ‘urban ethnic’ market, CNET News.com [Online], 10 November 2004Available: http://news.com.com/New+wireless+reseller+to+aim+at+urban+ethnic+market/2100-1039_3-5447038.html[Accessed 21 August, 2006]
CIPESA (2006), The Case of Infrastructure Sharing in Africa, CIPESA (Collaboration on International ICT Policy for Eastern and Southern Africa) [Online], 15 April 2006Available : http://www.cipesa.org/163[Accessed 11 August, 2006]
EU Commission (2003), Framework Agreement between T-Mobile and Viag Interkom, EU Commission [Online], 17 August 2003Available: http://europa.eu/bulletin/en/200307/p103076.htm[Accessed 11 August, 2006]
Financial Express (2006), Telecom firm aggress to share infrastructure, Factiva [Online], 04 July 2006Available (available for Ericsson employees only):http://bic.ericsson.se/sources/factiva/factiva_reference.php?url=http://bic.ericsson.se/sources/factiva/2006-07-05/AIWFIE0020060704e27400008_FT.xml[Accessed 8 August 2006]
Gupta, R. (2006), Infrastructure Sharing: Hand in Hand, CIOL Network [Online], 01 May 2006 Available: http://www.voicendata.com/content/service_provider/106050104.asp[Accessed 7 August 2006]
Gupta, R. (2006), Rural India Calling, Voice&Data [Online], 13 February 2006, Available: http://www.voicendata.com/content/top_stories/106021301.asp[Accessed 12 September, 2006]
King, R. (2001), VoiceStream, Cingular to Share Infrastructure, Net Economy [Online], October 2001Available: http://findarticles.com/p/articles/mi_zdtne/is_200110/ai_ziff16586[Accessed 21 August, 2006]
Oftel, (2001), 3G Mobile Infrastructure Sharing in the U.K., Oftel [Online], 01 May 2001Available: http://www.ofcom.org.uk/static/archive/Oftel/publications/mobile/infrashare0501.htm[Accessed 16 August, 2006]
Poropudas, T. (2005), India’s telecom regulator wants to connect rural majority, Mobile Monday [Online], 16 October 2005Available: http://www.mobilemonday.net/mm/story.php?story_id=4459[Accessed 04 August, 2006]
PTI (2006), Govt to share infrastructure with pvt cos for rural mobile svc, newKerala.com [Online], 02 August 2006Available: http://www.newkerala.com/news4.php?action=fullnews&id=943http://www.newkerala.com/news4.php?action=fullnews&id=943[Accessed 15 August 2006]
72
Raj, R. (2006), Telecom Firm Agree to Share Infrastructure, The Financial Express [Online], 05 July 2006 Available: http://www.financialexpress.com/fe_full_story.php?content_id=132845[Accessed 07 August 2006]
Saran, P., Sridhar, V. (2005), Telecom operators can collaborate to compete, Financial Times Express [Online], 23 November 2005Available: http://www.financialexpress.com/fe_full_story.php?content_id=109376[Accessed 16 August, 2006]
Secker, M. (2001), The case of sharing 3G infrastructure – Industry Trend or Event, Horizon House Publications [Online], January 2001Available: http://www.findarticles.com/p/articles/mi_m0TLC/is_1_35/ai_69978770[Accessed 14 August, 2006]
Singh, H. (2006), Teledensity target to be revised for 2006, says DoT, The Financial Express [Online], 09 January 2006Available: http://www.financialexpress.com/fe_full_story.php?content_id=113956[Accessed 02 August, 2006]
Singh, H. (2006), Delhi tops metro list on mobile teledensity, The Financial Express [Online], 17 Feb 2006 Available: http://www.financialexpress.com/fe_full_story.php?content_id=117784[Accessed 07 September, 2006]
Techtree News Staff, (2006), Telecom Operators to Share Towers, Techtree.com [Online], 06 July 2006Available: http://www.techtree.com/techtree/jsp/article.jsp?article_id=74387&cat_id=613[Accessed 15 August 2006]
Telecom Regulatory Authority of India (Press Release) (2006), Quarterly Performance Indicators of Telecom Services, TRAI [Online], 28 June 2006Available: http://www.trai.gov.in/trai/upload/PressReleases/341/pr28jun06no60.pdf[Accessed 23 August, 2006]
Telecom Regulatory Authority of India (Press Release) (2006), Telephone Services Maintain its Growth in June 2006, TRAI [Online], 12 June 2006Available: http://www.trai.gov.in/trai/upload/PressReleases/348/Press%20Release66of12Jul06.pdf[Accessed 25 August, 2006]
Telecom Regulatory Authority of India (Press Release) (2006), Monthly Growth of Wireless Subscribers crosses 6 Million Mark, TRAI [Online], 12 October 2006Available: http://www.trai.gov.in/trai/upload/PressReleases/379/pr12oct06no97.pdf[Accessed 25 October, 2006]
Times News Network, (2006), Rural Teledensity a Dark Spot, The Economic Times [Online], 15 July 2006,Available: http://economictimes.indiatimes.com/articleshow/1754379.cms[Accessed 03 August, 2006]
The Hindi Group (2006), TRAI wants BSNL to Share Infrastructure, The Hindu Business Line [Online], 24 June 2006Available: http://www.blonnet.com/2006/06/24/stories/2006062403460400.htm[Accessed 7 August 2006]
73
The Hindi Group (2006), Pilot Project to Share Infrastructure, The Hindu Business Line [Online], 06 July 2006Available: http://www.blonnet.com/2006/07/06/stories/2006070603350400.htm[Accessed 8 August 2006]
The Press Trust of India Limited, (2006), Cell-phone users to rise 16% in 2006 in Asia, Hindustan Times [Online], 14 June 2006Available: http://www.hindustantimes.com/news/181_1720044,00020020.htm[Accessed 23 August, 2006]
The Press Trust of India Limited, (2006), GSM, CDMA mobile operators to share infrastructure, Factiva [Online], 05 July 2006 Available (for Ericsson employees only): http://bic.ericsson.se/sources/factiva/factiva_reference.php?url=http://bic.ericsson.se/sources/factiva/2006-07-06/PRTRIN0020060706e2750002c_FT.xml[Accessed 08 August 2006]
United Press International (2005), Private Firms to Share India Telecom Grid, Physorg.com [Online], 07 December 2005Available: http://www.physorg.com/news8826.html[Accessed 07 August, 2006]
Voice&Data news staff, (2004), Ericsson Beyond Selling Networks, Voice&Data [Online], 15 June 2004Available: http://www.voicendata.com/content/vNd100/2004/104061503.asp[Accessed 25 August, 2006]
WebsitesAmerican Tower [Online], Available: http://www.americantower.com/atcweb
Arqiva [Online], Available: http://www.arqiva.com/server.php?show=nav.5811
Association of Unified Telecom Service Providers of India [Online], Available: http://www.auspi.in
Aster [Online], Available: http://www.atspl.com/
Bharti Airtel Limited [Online], Available: http://www.bhartiairtel.in
Cellular Operators Association of India [Online], Available: http://www.coai.in
Crown Castle International Corp. [Online], Available: http://www.crowncastle.com/index.shtml
Department of Telecommunication [Online], Available: http://www.dotindia.com
ELCOMP, [Online], Available: http://www.elcompindia.com/indian-market06.html
Ericsson [Online], Available: http://www.ericsson.com
Ericsson Intranet MU India and Sri Lanka, [Online], Available (for Ericsson employees only): http://internal.ericsson.com/page/hub_indiasrilanka/index.jsp
HFCL [Online], Available: http://www.hfcl.com/
Hutchison Essar Limited [Online], Available: http://www.hutch.in/home/index.asp
IDEA Cellular Limited [Online], Available: http://www.ideacellular.com
74
ITI Limited [Online], Available: http://www.itiltd-india.com/
India Cellular, [Online], Available: http://www.india-cellular.com
Indian Embassy, [Online], Available: http://www.indianembassy.org/
Macquarie Infrastructure Group [Online], Available: http://www.macquarie.com.au/au/mcg/index.html
Nutek [Online], Available: http://www.consultnutek.com/
National Commission on Population, Government of India [Online], Available: http://populationcommission.nic.in/
Quipo Equipment rental [Online], Available: http://www.quipoworld.com/telcom.html
Quick MBA [Online], Available: http://www.quickmba.com/
Reliance InfoComm Limited [Online], Available: http://www.reliancecommunications.co.in/webapp/Communications/home.jsp
SBA Communications Inc [Online], Available: http://www.sbasite.com/
TATA Teleservices [Online], Available: http://www.tata.in/tata_teleservices/index.htm
Telecom Regulatory Authority of India [Online], Available: http://www.trai.gov.in
The Associated Chambers of Commerce and Industry of India [Online], Available: http://www.assocham.org/

75
Appendixes
Appendix I – DefinitionsThe following definitions will be given to clarify the language and terminology used in the paper. Most of the terms are commonly confused and to prevent any misunderstandings some general clarifications are needed.
ARPU – Average Revenue Per User. Average monthly revenue for per subscriber.
2GThe second generation network differs from the first generation mainly by the digital voice data transfer. The 1G technology uses an analog voice transfer, but note that both use digital signaling to connect to the telecom towers. The 2G systems technology standards will be listed below.
GSM (TDMA based) – Europe based but used worldwide. iDen (TDMA based), used in USA and Canada, exclusively provided by Nextel
in US and Telus Mobility in Canada. IS – 136 (TDMA based), used in the Americas and simply referred to TDMA. IS – 95 (CDMA based), used in the Americas and parts of Asia and Australia.
Often simply referred to CDMA. In this paper it will be referred to the CDMA standard.
PDC (TDMA based), used in Japan.
The primary advantage of the digital voice data is that it is compressed in such a high degree that the same bandwidth allows more calls compared to the first generation. Also, other digital data services such as SMS and email is possible to use with the 2G network.
3GThe difference between the third generation technology and the second generation technology is the ability to transfer both voice data and non-voice data (e.g. downloading) substantially faster. The higher data exchange in the 3G network compared to the 2G has been made possible with the high capacity broadband capabilities. 3G is supported by the WCDMA and CDMA2000 technologies, the GSM standard allied with the WCDMA and the CDMA standard with CDMA2000. The 3G technology has not yet been implemented in India. Governmental goal is to reach a 3G subscription base to 21.3 million by 2010 (ICT World Team, 2006).
CDMACDMA stands for Code Division Multiple Access. As with the definition of the TDMA technology, a general explanation will be given.
76
The CDMA technology encodes the voice data with a specific code to identify every user and segment the channel into multiple channels. The technology is more immune to interference than TDMA and can supposedly support more users.
Free Cash Flow A firm’s cash flow after all expenditures. Calculated as operating cash flow minus capital expenditures.
GPRSGPRS stands for General Packet Radio Service. The technology is a GSM technology often referred to 2.5G, meaning the technology generation between 2G and 3G.
GSMGSM stands for Global System for Mobile communication and is a mobile technology network standard. It is the most popular standard used worldwide. It is one of the standards from the TDMA based technology.
Mobile phones stay connected to the GSM network by a continuous search for cells (the closest telecom tower). The cell radius’ varies depending on the height of the antennae on the tower, the higher the tower the larger the radius. The longest distance the system can support is 35 km.
GSM works in four different frequencies, the most common being 900 Hz and 1800 Hz. In the Americas (USA and Canada) they use frequencies of 850 Hz and 1900 Hz, because the two other were already occupied.
Revenue share – Service which enables the operators to fully or partially pay for their equipment and or services via a percentage of their incurred revenue for a negotiated time period.
Telecom Network (GSM)A GSM telecom network is divided into three main parts;
The mobile station; subscriber’s mobile phone. The cell site: transmitter, receiver, radio base station, and radio base station
controller. The base station subsystem is the components which handles the traffic from the cell site to the switching subsystem.
The switching subsystem. The component which carries out the switching functions and connects the mobile calls into the public telephone network. The switching subsystem is often referred to the network’s core system.

77
TDMATDMA stands for Time Division Multiple Access. No into depth explanation will be given of the technology because of its complexity. A general understanding of the concept is sufficient for the purpose of the paper.
The main concept of the technology is its ability to share the same channel between users by dividing it into timeslots. The timeslots are large enough to access a call from a mobile 35 km from the base station. A mobile just next to a telecom tower will with no time delay be transmitted while a broadcast from a mobile just less than 35 km from the tower will arrive at the base station at the very end of the slot.
WCDMA WCDMA stands for Wideband Code Division Multiple Access. It is a GSM allied 3G technology
Base Station and subsystem The switching subsystemMobile Station Receiver mobile/fixed
Figure 1.1. A simplified GSM network structure.
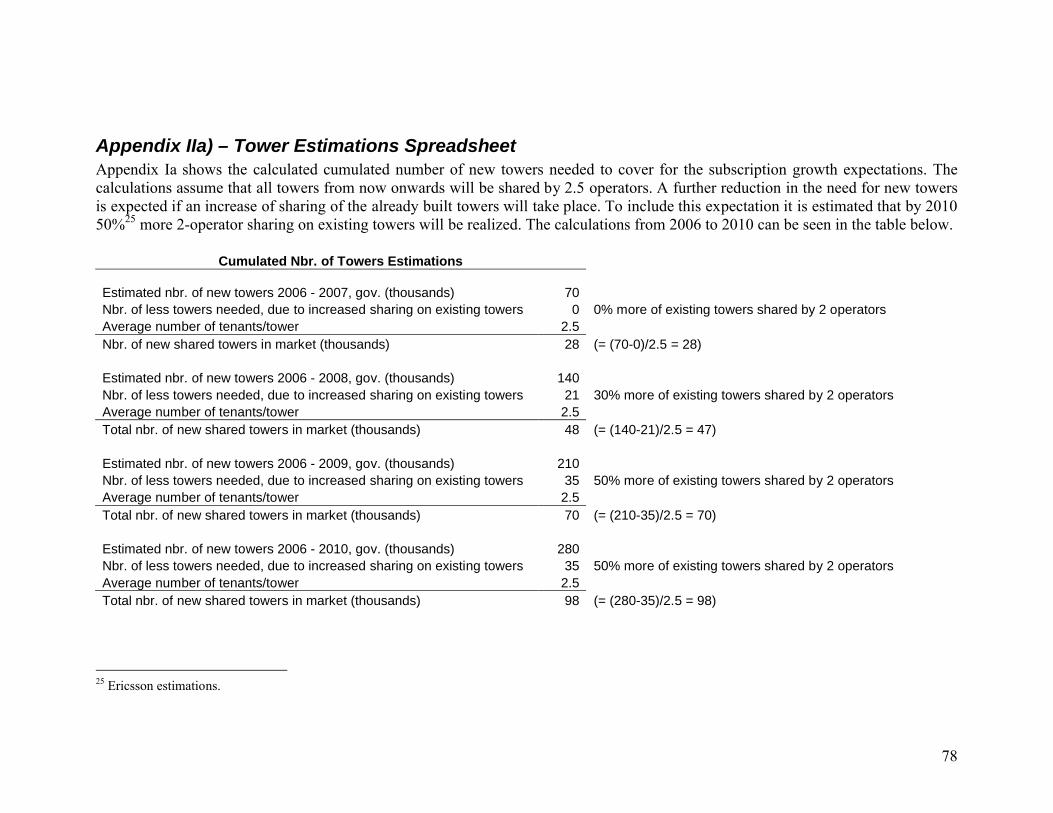
78
Appendix IIa) – Tower Estimations SpreadsheetAppendix Ia shows the calculated cumulated number of new towers needed to cover for the subscription growth expectations. The calculations assume that all towers from now onwards will be shared by 2.5 operators. A further reduction in the need for new towers is expected if an increase of sharing of the already built towers will take place. To include this expectation it is estimated that by 2010 50%25 more 2-operator sharing on existing towers will be realized. The calculations from 2006 to 2010 can be seen in the table below.
Cumulated Nbr. of Towers Estimations
Estimated nbr. of new towers 2006 - 2007, gov. (thousands) 70Nbr. of less towers needed, due to increased sharing on existing towers 0 0% more of existing towers shared by 2 operatorsAverage number of tenants/tower 2.5Nbr. of new shared towers in market (thousands) 28 (= (70-0)/2.5 = 28)
Estimated nbr. of new towers 2006 - 2008, gov. (thousands) 140Nbr. of less towers needed, due to increased sharing on existing towers 21 30% more of existing towers shared by 2 operatorsAverage number of tenants/tower 2.5Total nbr. of new shared towers in market (thousands) 48 (= (140-21)/2.5 = 47)
Estimated nbr. of new towers 2006 - 2009, gov. (thousands) 210Nbr. of less towers needed, due to increased sharing on existing towers 35 50% more of existing towers shared by 2 operatorsAverage number of tenants/tower 2.5Total nbr. of new shared towers in market (thousands) 70 (= (210-35)/2.5 = 70)
Estimated nbr. of new towers 2006 - 2010, gov. (thousands) 280Nbr. of less towers needed, due to increased sharing on existing towers 35 50% more of existing towers shared by 2 operatorsAverage number of tenants/tower 2.5Total nbr. of new shared towers in market (thousands) 98 (= (280-35)/2.5 = 98)
25 Ericsson estimations.
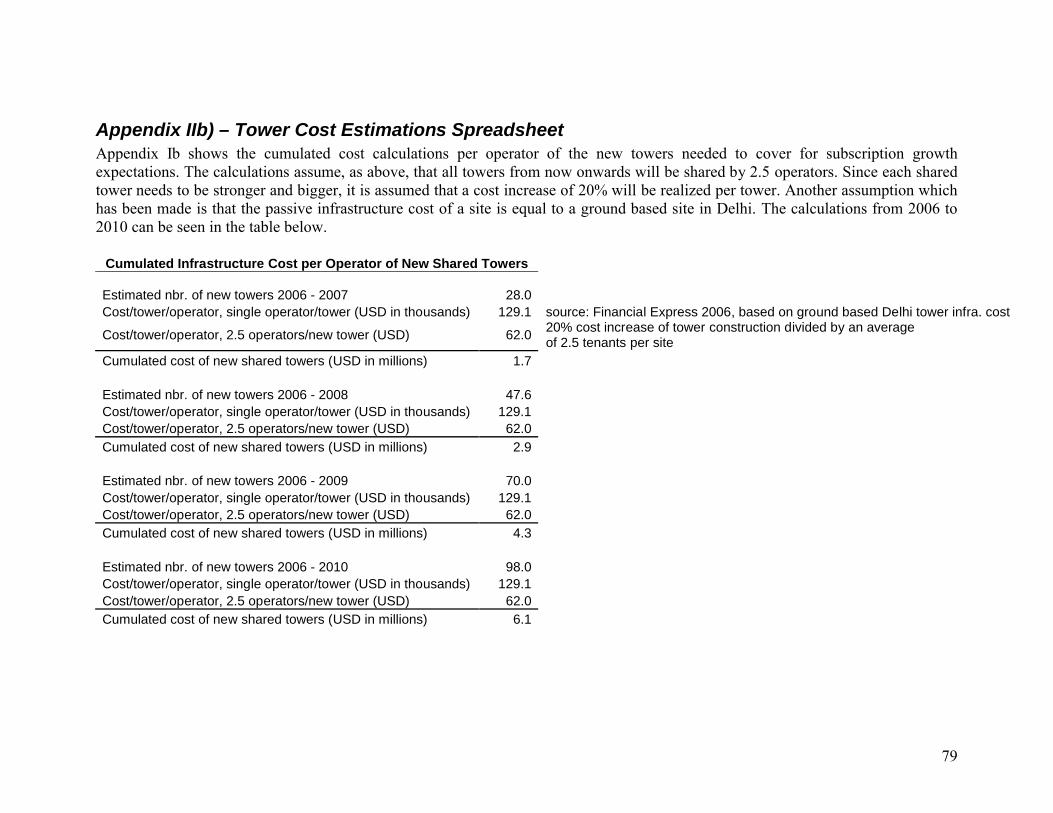
79
Appendix IIb) – Tower Cost Estimations SpreadsheetAppendix Ib shows the cumulated cost calculations per operator of the new towers needed to cover for subscription growth expectations. The calculations assume, as above, that all towers from now onwards will be shared by 2.5 operators. Since each shared tower needs to be stronger and bigger, it is assumed that a cost increase of 20% will be realized per tower. Another assumption which has been made is that the passive infrastructure cost of a site is equal to a ground based site in Delhi. The calculations from 2006 to 2010 can be seen in the table below.
Cumulated Infrastructure Cost per Operator of New Shared Towers
Estimated nbr. of new towers 2006 - 2007 28.0Cost/tower/operator, single operator/tower (USD in thousands) 129.1 source: Financial Express 2006, based on ground based Delhi tower infra. cost
Cost/tower/operator, 2.5 operators/new tower (USD) 62.020% cost increase of tower construction divided by an average of 2.5 tenants per site
Cumulated cost of new shared towers (USD in millions) 1.7
Estimated nbr. of new towers 2006 - 2008 47.6Cost/tower/operator, single operator/tower (USD in thousands) 129.1Cost/tower/operator, 2.5 operators/new tower (USD) 62.0
Cumulated cost of new shared towers (USD in millions) 2.9
Estimated nbr. of new towers 2006 - 2009 70.0Cost/tower/operator, single operator/tower (USD in thousands) 129.1Cost/tower/operator, 2.5 operators/new tower (USD) 62.0Cumulated cost of new shared towers (USD in millions) 4.3
Estimated nbr. of new towers 2006 - 2010 98.0Cost/tower/operator, single operator/tower (USD in thousands) 129.1Cost/tower/operator, 2.5 operators/new tower (USD) 62.0Cumulated cost of new shared towers (USD in millions) 6.1
80
Appendix III – Current Players in Site Leasing BusinessActive players in the Indian market which could pose as a competitive threat is presented below.
Tower CompaniesTower VisionTower Vision is an U.K. based tower company, which have recently entered the Indian tower market. They have an agreement with Spice to build and lease out 1,000 tower sites. It is believed that these sites will be shared with other operators.
Infrastructure ProvidersQuipo Telecom Infrastructure Pvt Ltd.Quipo is currently not a threat to Ericsson, but they are pushing into the shared infrastructure business and thus could become a competitor to Ericsson. Quipo has their background in infrastructure equipment leasing business. They claim that they are currently negotiating roll-out of 200 “shared” sites in the next 3-6 months. Quipo has realized the necessity to acquire partnership in technology, project management, and souring, in order to support a project management role in the business. Their business idea is to let the anchor tenant choose the best position for its equipment. Subsequent tenants will get next best suitable position according to their requirements. Discounts will be given on shared towers on the basis of the revenue generated from the subsequent operators. Their pricing strategy is based on an encouragement for multiple operators to share each site.
Aster Teleservices Pvt Ltd.Aster is an infrastructure provider which offers services in engineering, construction and projects, project management, infrastructure, operations and maintenance, and RF (radio frequency) engineering services. No information regarding if they are planning to go into the infrastructure sharing business can be found on their website. The company is still viewed as a possible future competitor with regard to their knowledge base and customer contacts. It is believed that Aster has the capability to offer infrastructure sharing solutions directly to the operators. Moreover, Aster has an alliance with Ericson when it comes to GSM equipment services and installation. An alliance in one field does not mean that the same company can’t be a competitor in another.
GTL Infrastructure (GIL)GIL is a subsidiary of GTL which provides infrastructure services in telecom. As of May 2006 this new service is still in the planning stage. The company will own, operate, and provide passive infrastructure, including towers, air-conditioning facilities, shelters, diesel generators, battery back up, and related site structures (ground based and roof top sites) for co-locating active elements owned by different operators. The company has further plans to provide operation and maintenance services with regard to the passive infrastructure. They believe that they will not go into the business of sharing electronic infrastructure elements such as antennae. Therefore, the operators would have to maintain and install their own antennae and radio network equipment (Gupta, 2006). The reason is
81
concluded to be a lack of competence. It is possible that the result can be less competitive power.
GIL has currently around 1,300 sites across the country. They have a goal of owning 12,000 sites in the next three years, including acquisitions of existing non-shared sites. Their price model is based on an approximate fee of about 1,000 USD/month (Rs 45,000/month). When the site reaches a shared status the first tenant will get a 35% discount and the second a 65% discount. They have a limit of five operators to share a site.
The mother company, GTL, has experience in the field of telecom engineering since long. Their services include site construction, site engineering, passive equipment installation, testing and integration, training, planning, design, and tests. GIL may haveeasier to expand in the passive infrastructure business because of this.
ITI LimitedITI offer services like; network planning, design, engineering, survey, installation, commissioning and maintenance, civil works (such as construction of buildings, towers/mast, and external cable plant). Even though they do not mention any plans to move in to the infrastructure sharing business, they could be potential competitors since they sit on knowledge in the field.
Himachal Futuristic Communications Ltd (HFCL) GroupHFCL offers a wide range of shared infrastructure related services, such as civil works, installation of equipment, site surveys, etc. HFCL are most likely not able to offer a infrastructure sharing business to operators since they currently don’t have experience in maintenance and operations in the area. They have on the other hand a quite wide experience in the site infrastructure business in general and thus could together with a partner become a dangerous competitor.
Nutek Nutek could be a threat due to their offerings in all areas of telecommunication from design to installation and operations & maintenance. Note that Ericsson has used Nutek to develop Jammu and Kashmir non-shared sites. As with most of the above infrastructure providers, Nutek may face financial difficulties to support a tower leasing business. With a financial partner it is estimated that Nutek has the capabilities to grow their business into site leasing. No such plans are stated on their website.