formulas for calculating the approach to equilibrium in...
TRANSCRIPT
Desalination, 60 (1986) 223-249 223 Elsevier Science Publishers B.V., Amsterdam -- Printed in The Netherlands
Formulas for Calculating the Approach to Equil ibrium in Open Channel Flash Evaporators for Saline Water
NOAM LIOR
Department of Mechanical Engineering and Applied Mechanics, University of Pennsylvania, Philadelphia, PA 19104 (U.S.A.)
(Received January 2, 1985)
SUMMARY
The evaporator used in multistage flash desalination plants, and considered for open cycle ocean-thermal energy conversion (OTEC) plants is the open- channel type, in which an essentially-horizontal stream of seawater is passed through an open channel in which it is exposed to a pressure lower than the saturation pressure which corresponds to its temperature. This paper reviews the equations used at present to determine the nonequilibrium allowance A' which indicates how far from equilibrium the seawater stream is as it leaves the evaporator.
Flash evaporation in open channels is used in most of the water desalination plants, and the existing equations for A' have been developed for that application. The equations are typically empirical correlations, each developed for one type of geometry and range of parameters. The equations are com- pared graphically, p lot ted side-by-side to express A' as a funct ion of the major parameters: stage saturation temperature, stage flash-down, flashing seawater flow rate, stage length, and flashing seawater depth.
It was found for water desalination applications that there exists a large spread between the non-equilibrium fraction values calculated by the differ- ent equations, of about one order of magnitude. The situation is even worse for OTEC conditions. Consequently, it was concluded that no general method exists for the adequately accurate prediction of A', i.e. of the approach to equilibrium of flashing free stream channel flows.
SYMBOLS
BT A and B -- constants f rom the relation P = Ae (Eqs. 16, 17), calculated
for a 5% NaC1 solution
*The units used in the equations are shown in their SI; British forms.
0011-9164/86/$03.50 © 1986 Elsevier Science Publishers B.V.
224
Ax
BPE Cp C G h H k K ga L M
n P P~ AP
APs
APvf
TB TBi TBo TBo. ATB ATs AT Tv Tyro Yg
w W
A' 4"
A'i0 P Pv
- - cross-sectional area of brine flow in the stage at location x along it, ft. 2
-- boiling point elevation, ° C ; ° F - - heat capacity - - salt concentration, ppm - - flow rate, ft. 3/s -- liquid depth, m; in. - - level of flashing liquid, m; in. - - evaporation coefficient, Eq. (16) - - flashing coefficient, Eq. (17), K = 16 nTr -- Cp pAT/Pv ~, nondimensional - - stage length, m; ft. - - (TBi) -- (outlet temperature of condenser coolant) or (Tso) --
(inlet temperature of condenser coolant), °C; °F - - number of bubbles (liquid--vapor interfaces in the liquid) - - pressure - - vapor pressure at mean exit liquid temperature, mm Hg - - a c t u a l pressure drop across the stage, i.e., (vapor pressure of
incoming liquid) -- (stage saturation pressure) - - stage pressure drop. Values are taken from the respective values
of saturation pressure as equivalent to ATs for the given temp- erature
- -vapor pressure difference between the vapor pressure of the liquid at Tm and that of the liquid at TBo, mm Hg
-- mean liquid temperature, °C,; °F -- mean liquid temperature at stage inlet, °C; °F -- mean liquid temperature at stage outlet, °C; °F -- TBo (absolute temperature), K; °R - - stage flashdown defined by (Tin -- TBo ), °C; °F -- superheat defined by (TBi -- Tvm ), °C; °F -- ATs + A', °C; °F - - stage saturation vapor temperature, °C; °F -- mean vapor space temperature, °C; °F -- vapor specific volume (at Tv unless otherwise specified), m 3/kg;
f t . 3 / l b -- liquid flow rate per unit stage width, kg/h m; l b / h ft. - - flow rate of flashing seawater, kg/h m width -- heat of vaporization, J/kg; Btu/lb -- nonequilibrium allowance, Eq. (2), °C, °F -- A' at location x, °C; °F -- A' for a 10-ft. stage, °C; °F -- density of brine, kg/m 3 ; 1b/ft. 3 -- vapor density, kg/m 3 ; 1b/ft. 3
225
INTRODUCTION
The open-channel flash evaporator is used widely in the multi-stage flash distillation process for water desalination [1--3] and has been proposed for use as the steam generator in the open cycle ocean--thermal energy conversion (OTEC) process [4,5] . The configuration of such an evaporator is very simple: a free-surface stream flows through a horizontal (or slightly inclined) channel, and releases vapor along the way.
The process of flash evaporation occurs when a liquid is exposed to a pressure lower than the saturation pressure which corresponds to its temper- ature. In contrast to other evaporation processes for which heat is supplied to the liquid from outside, sensible heat stored in the liquid as superheat is converted during the flash evaporation process into latent heat of evapor- ation. If left alone (i.e., insulated and with no further reduction in the pres- sure), the system will approach an equilibrium state as the average temperature of the liquid approaches some asymptotic value. The temperature difference between this equilibrium state and the average temperature of the liquid is the minimal superheat required to overcome the various effects which inhibit flashing.
The first of these effects is the Boiling Point Elevation (BPE). At a given pressure, it is the increase in the boiling temperature due to the salts dissolved in the water.
A second effect is the resistance to vapor bubble production which results from the work needed to separate the water and to form the curved interface by overcoming the surface tension and the surrounding hydrostatic pressure. This can be explained by the balance of forces on the bubble
2o P2 = PI + - - (1)
r
where P2 is the pressure inside the bubble and PI in the surrounding liquid, o is the surface tension, and r the bubble radius. For equilibrium, i.e., just to keep the bubble from collapsing, P~ has to be larger t hanP 1 by the amount contributed by the surface tension. The vapor in the bubble is saturated at T2 which is the temperature at the interface. Since P, is smaller than P2, the liquid close to the interface must be superheated. Furthermore, a temperature gradient must be established in the liquid for heat to flow to the bubble-- liquid interface, if vapor production is to occur.
The third retarding effect results from the hydrostatic pressure. As the pressure increases with depth, so does the saturation temperature. The avail- able liquid superheat decreases correspondingly, and it may vanish in some cases. A flashing penetration depth is thus established, below which no flashing occurs.
Another possible effect is the contamination of the liquid by materials which may retard evaporation, such as various organic substances [6]. It
226
is hard to prevent the intrusion of small amounts of such materials, which originate either in an imperfectly cleaned evaporator, or from the feedwater. Even small quantities, which tend to migrate to evaporating interfaces, may have severe effects on inhibiting evaporation rates. It should also be noted that in some cases, surface-active impurities may induce foaming and thus enhance evaporation by improving the heat transfer rates through the liquid [7 ,3] .
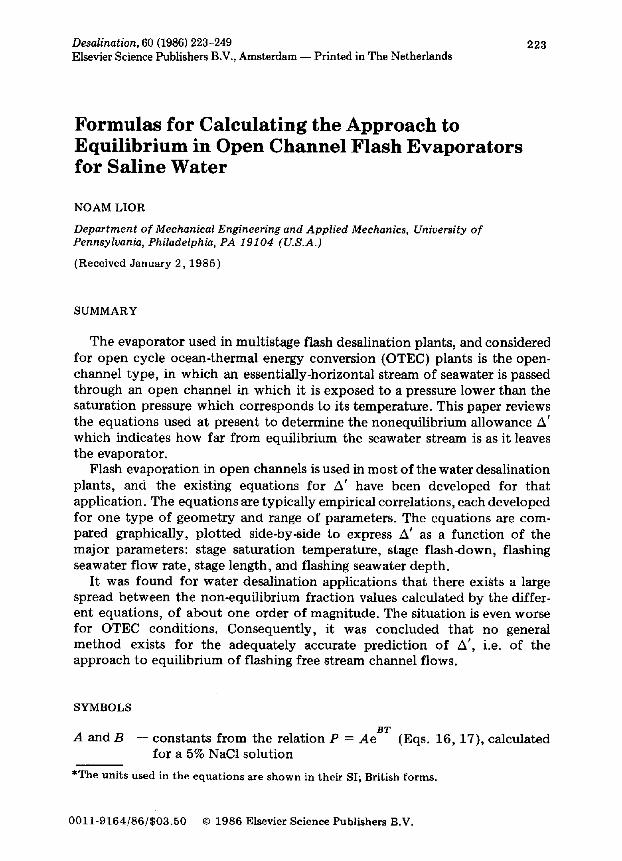
A major port ion of the work related to flash evaporation has been done for multistage flash evaporators used in water desalination. A typical stage is shown in Fig. 1.
. . . . . . . . . . . . . . . . . . . . . . . . . . . . . . . . . . . . . . . . . . . . . . . . . . . . . . . . . . . . . . . . . . . . [ . . . . . . . . . . . . . II
HEATEO . . . . . . . . . . . . . . . . . . . . . . . . . . . . . . . . . . . - " ICONOE.SER BRINE ...... ." ]_ J TUBE BUNOLE
1 / 1 1 " COLLECTION TRAYS ! ] ) }
DEMIST ~ / ~ ~ ~ v ~ ~ ) ~ ~ Y V ~
I t / / ) ,t /Pv'n-i Pv'n-ii~< Pv'n-~ / / i Pv'~,~.
Fig. 1. The nth stage of a multistage flash evaporator.
The liquid flows through the inlet orifice into a region where the pressure is lower than its saturation pressure. Flashing is initiated, and the liquid cools down as it evaporates and flows towards the exit. Since it usually cools increasingly as the free surface is approached, a temperature gradient is created. The temperature at the surface is the stage saturation temperature plus the BPE, and it increases towards the bo t tom due to the effects men- t ioned above. Thus, the liquid leaving the stage has an average temperature higher than would be expected. (Ideally, we would expect the liquid to be in equilibrium with the vapor at the stage saturation temperature plus the BPE). For a given vapor temperature Tv, the difference between the mean liquid temperature, TB, and the superheated vapor temperature (that is: Tv + BPE) is called A': the nonequilibrium allowance.
A ' ---- TB - - T v - - B P E ( 2 )
Some investigators include BPE in A' and define this as A't
A't -- T B - - T v (3)
227
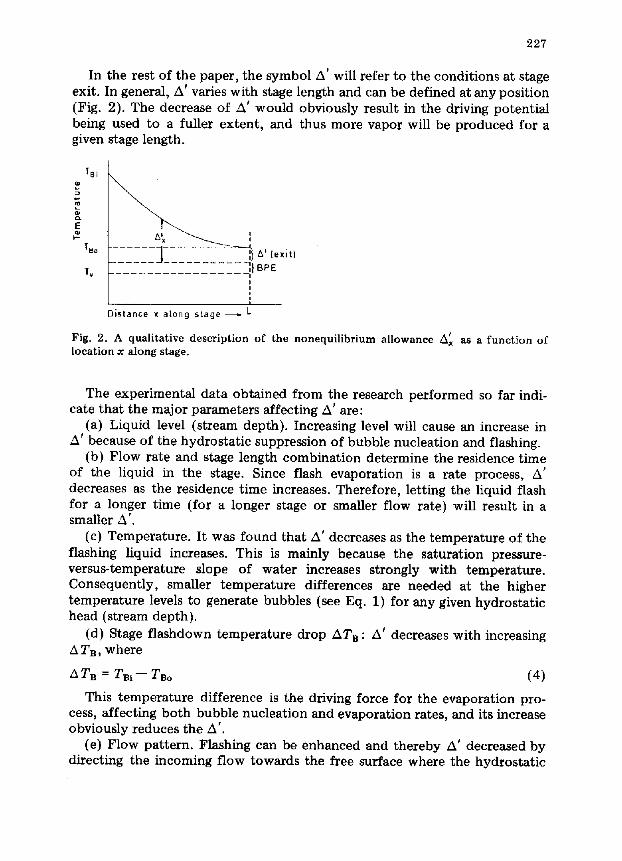
In the rest of the paper, the symbol A' will refer to the conditions at stage exit. In general, A' varies with stage length and can be defined at any position (Fig. 2). The decrease of A' would obviously result in the driving potential being used to a fuller extent, and thus more vapor will be produced for a given stage length.
E
Tai
TBo
Tv - B P E
1 1 t
Distance x along stage ~ L
Fig. 2. A qualitative description of the nonequilibrium allowance A~ as a function of location x along stage.
The experimental data obtained from the research performed so far indi- cate that the major parameters affecting A' are:
(a) Liquid level (stream depth). Increasing level will cause an increase in A' because of the hydrostatic suppression of bubble nucleation and flashing.
(b) Flow rate and stage length combination determine the residence time of the liquid in the stage. Since flash evaporation is a rate process, A' decreases as the residence time increases. Therefore, letting the liquid flash for a longer time (for a longer stage or smaller flow rate) will result in a smaller A'.
(c) Temperature. It was found that A' decreases as the temperature of the flashing liquid increases. This is mainly because the saturation pressure- versus-temperature slope of water increases strongly with temperature. Consequently, smaller temperature differences are needed at the higher temperature levels to generate bubbles (see Eq. 1) for any given hydrostatic head (stream depth).
(d) Stage flashdown temperature drop ATB : A' decreases with increasing TB, where
TB = TBi -- TBo (4)
This temperature difference is the driving force for the evaporation pro- cess, affecting both bubble nucleation and evaporation rates, and its increase obviously reduces the A'.
(e) Flow pattern. Flashing can be enhanced and thereby A' decreased by directing the incoming flow towards the free surface where the hydrostat ic
228
suppression effect is diminished, or by increasing turbulent mixing in the stream whereby heat is transferred more rapidly to the evaporating inter- faces.
Other factors such as stage geometry, stage-to-stage liquid transfer aperture size and shape, and chemical t reatment also affect A'.
To be able to design a flash evaporator, it is necessary to know the quant- itative relationship between the A' and the process parameters and stage geometry. No satisfactory analytical results exist for that purpose, principally due to the complexity of the heat transfer and fluid mechanics in the process [3 ,8 ,9 ] . Consequently, several groups have developed empiricaly correlations from their own experiments, usually in an a t tempt to satisfy their own design needs. The use of different experimental facilities and sometimes different definitions and terminology make the general use and comparison of these correlations somewhat difficult.
This paper describes twelve different equations for /~ ' and compares their dependence on the major parameters: liquid saturation temperature, flash- down temperature difference, water flow rate, stage length and stream depth. The comparison is performed for two water temperature ranges: 20--140°C (centered around a vapor temperature of 70.44°C, 175°F) for water desali- nation applications, and 20--50°C (centered around a vapor temperature of 30°C) for OTEC evaporator applications.
NONEQUILIBRIUM ALLOWANCE CORRELATIONS
The correlations are listed according to their authors:
American Machine & Foundry Co.
A M F Eq. no. 1 [10] Their first equation is based on experiments conducted in a two stage
plant. Information about the stage geometry was not provided in the refer- ence. The first stage was the test stage but it is not known whether the second (downstream) stage was flashing too.
In SI units
A' = 2.19 exp [2.76h + (0 .032w)(10 -s ) -- 0 .0641T~, ] (5)
In British units
A' = 12.3 exp [0.07h + (0 .476w)(10 -6) -- 0 . 0 3 5 6 T ~ ] (5a)
With all other parameters remaining constants, A' was found to be invari- ant for 1.1°C < ATB ~ 3°C.
A M F Eq. no. 2 [10] A second equation developed by AMF [10] was based on the 3-stage unit
229
which was a modification of the 2-stage unit mentioned above. An additional stage was added with the middle stage being the test stage. This arrangement resulted in a more realistic simulation of the n th stage in a multistage flash evaporation plant where the stage is preceded and followed by active stages. In addition, adjustable louvers were installed to prevent impingement on the demistors by the splashing brine, and thereby stage capacity and distillate purity were increased.
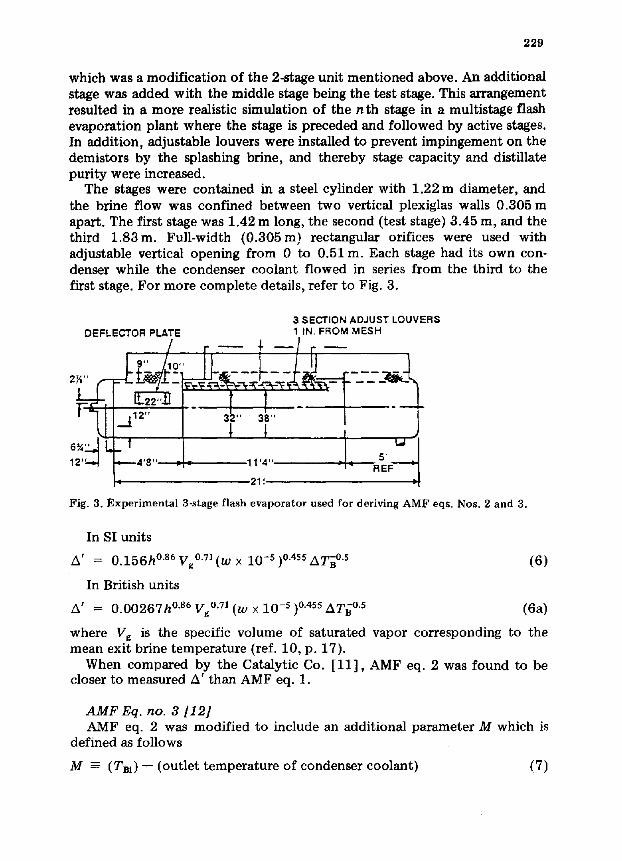
The stages were contained in a steel cylinder with 1.22 m diameter, and the brine flow was confined between two vertical plexiglas walls 0.305 m apart. The first stage was 1.42 m long, the second (test stage) 3.45 m, and the third 1.83m. Full-width (0.305m) rectangular orifices were used with adjustable vertical opening from 0 to 0.51 m. Each stage had its own con- denser while the condenser coolant flowed in series from the third to the first stage. For more complete details, refer to Fig. 3.
DEFLECTOR PLATE 3 SECTION ADJUST LOUVERS 1 IN. FROM MESH
211
Fig. 3. Experimental 3-stage flash evaporator used for deriving AMF eqs. Nos. 2 and 3.
In SI units
A' = 0.156h TM Vg 0'71 (W X 10 -s )0.4SS AT~0.s (6)
In British units
A' = 0.00267h °'86 Vg °'71 (w × 10 -s )0.4ss ATB0.S (6a)
where Vg is the specific volume of saturated vapor corresponding to the mean exit brine temperature (ref. 10, p. 17).
When compared by the Catalytic Co. [11], AMF eq. 2 was found to be closer to measured A' than AMF eq. 1.
A M F Eq. no. 3 [12] AMF eq. 2 was modified to include an additional parameter M which is
defined as follows
M -- (TBi) -- (outlet temperature of condenser coolant) (7)
230
o r
M --- (TBo) -- (inlet temperature of condenser coolant) (7a)
In SI units
/k' = h 0.s6 VgO.71M 0.19 (w × 10 -5 )0 .17/6 .1488 AT °'s (8)
In British units
A' = h °'s6 Vg °'71M °'19 (w x 10 -s )0.17/449 AT °'s (Sa)
It was found by AMF that their eq. 3 reduced the difference between the measured and calculated A' to half as compared to that obtained by using their eq. 2 [12]. When used with data from tests where an evaporation enhancer had been incorporated, their eq. 3 gave results only slightly higher than those obtained by measurement, while their eq. 2 gave much higher values of A'.
The brine used in the AMF experiments was concentrated sea water, deaerated ana acidified, with concentration maintained at about 1.5--2 times that of normal sea water.
Oak Ridge National Laboratory /AMF [13] Based on AMF eq. 1 and some more data from a few commercial plants
(unspecified) the following equation was obtained by the Oak Ridge National Laboratory (ORNL)
In SI units
A'lO = (0.9784) T~ (15.7378) h (1.3777) w ×1°-6 (9)
In British units
A'lo = (0.4235)(5.878) ~'~-T~)a46 (1.522) ¢h-12)/6(1.176) tw× l°-6-°'66)/°'34
= 2.65(0.988)T~ (1.073)h(1.6109)w x 10-' (9a)
Equation (9) was further modified by ORNL to account for stage length. It was assumed that half of the stage temperature drop occurred at the inter- stage orifice and that the temperature decayed exponentially to the end of the stage.
In SI units
A' = [A'lo/(½ATB + A'lO)]0"3281L(½ATB -}- A'10) (10)
In British units
A' = [A'1o/(½AT B + A',O)]L/IO(½ATB + A'~o ) (10a)
While Eq. (9) is applicable only for a 10ft . long stage, Eq. (10) can be used for different stage lengths.
231
Baldwin--Lima--Hamilton Corp. (BLH)
BLH Eq. No. 1 [14] The test stage has a rectangular cross section; L = 4.57 m, width = 0.53 m,
stage height = 2.06 m and demister height = 1.55 m. The condensers are of a shell and tube type, separated from the stage. Four
ducts, 18 in. diameter each, carry the vapor from the top of the stage (above the demisters) to the condensers. The same coolant flows through all con- densers starting at the third.
The orifices have an opening adjustable up to 0.56 m high (ref. 14, p. 10), rectangular in shape.
The whole unit includes 3 stages with the middle one serving as a test stage. No baffles were used. The flashdown ATB was calculated in three ways:
(a) ATB = T B i - TBo (b) From measured product flow
(product flow)(k) ATB = (11) (w)(c,)
(c) From the condenser loop cooling water temperature rise
ATs = (condenser loop flow)(AT (coolant))(cp (coolant)) (12) (w)(c, (brine))
BLH found that the best ATs was the average of the three above. The following equation was obtained
In SI units
•' = ATB(2.88 APB -°'22 Vg -°'°s -- 1) (13)
In British units
A' = ATs(1.39APs -°~2 Vg -°'°s -- 1) (13a)
BLH Eq. No. 2 [12] In SI units
A' = 0.857h °.344 Vg 0-284 (W X 10 -s )0.182 Aps-O.348 (14)
In British units
A' ~- 0 . 0 5 4 h 0"344 VgO.284(w x 10 -$ )0.182 ~DB-0.348 (14a)
Burns and Roe construction (B & R) [15] Based on the data obtained from stages 4 and 5 of the 8-stage MSF module
at the San Diego test facility, wi thout enhancers. The equation is referred to as the 'baseline relation'.
232
The tes t stages had a curve b o t t o m wi th a radius o f 3.66 m, wi th the sides f o r m e d b y t w o vert ical walls 3.15 m apar t . The s tage 's length L was 3 .45 m. Brine dep th , h, was m eas u red a t the exi t center l ine . O the r var iables such as t e m p e r a t u r e s , f low rates, e tc . were averaged over the cross sect ion.
The B & R equation In SI uni ts
A' = (7867 .17 ) h l 'l ATB -°'2s (w × 10 -3 )0.s (1.8Tv + 32) -2~ (15)
In British uni ts
A' = ( 3 5 2 ) h 1J ATB -0.2s (W X 10 -3 ) °'s Tv -2"s (15a)
B & R f o u n d the e q u a t i o n to fi t all the da ta fo r stages 4 and 5 w i t h o u t enhancers , wi th a s t andard dev ia t ion in A' o f 0 .22°C (ref. 15, p. 31).
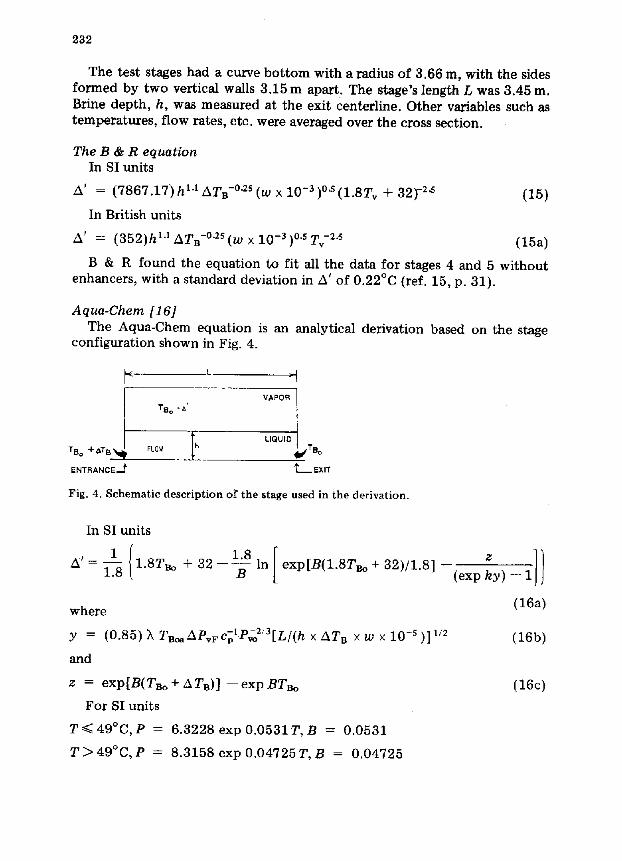
Aqua-Chem [16] The A q u a - C h e m equa t i on is an analy t ica l der iva t ion based on the stage
conf igura t ion shown in Fig. 4.
T8o . ~,' VAPOR
/ Ih LIQUID TBo +Zff B ~ FLOW TB o
ENTRANCE, J' ~ EXIT
Fig. 4. Schematic description of the stage used in the derivation.
In SI uni ts
A'= ~I { 1.8TBo + 32---B--l'81n[ exp[B(I'8TB°+32)/I'8]
where y = (0.85) ~ TBo~APvFC~!P~o2"3[L/(h x ATB × w × 10 -s )] ,/2
and
z = e x p [B( TBo + A TB) ] - - e x p BTBo
F o r SI uni ts
T ~ < 4 9 ° C , P -- 6 . 3 2 2 8 e x p 0 . 0 5 3 1 T , B -- 0 .0531
T > 49°C, P = 8 .3158 exp 0 .04725 T, B = 0 .04725
(exp ky) - -
(16a)
(16b)
(16c)
233
For British units
T ~ 1 2 0 ° F , P = 2.46 exp 0 .0295T, B = 0.0295
T > 1 2 0 ° F , P = 3.59 exp 0 .02625T, B = 0.02625
TBo~ ----- TBo absolute
k = Evaporation coefficient; k = 2.00 × 10 -s wi thout enhancer, 2.675 X 10 -s in the case o f a submerged jet and 3.35 X 10- s for a weir. Values of k for other types of enhancers were not given.
Catalytic Construction Company [17] The equation was derived from a heat transfer model. Catalytic equation:
A ' = ( AP/BP) -- (G 3/2/K) 112 ATB /J. (LAx )I/4 (17)
Fujii et al., Kyushu University [18] Fujii has obtained two empirical relations for A'. One based on data f rom
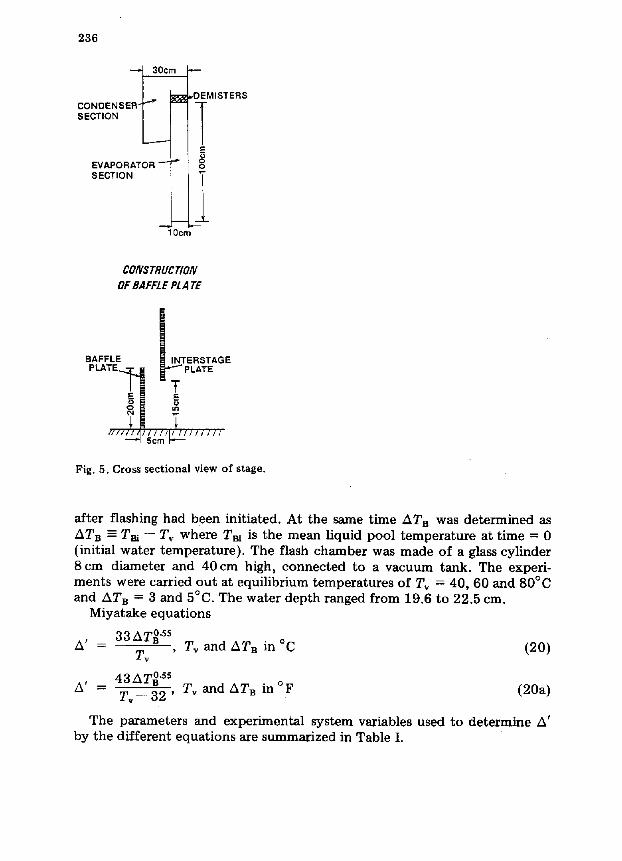
runs with a baffle and another wi thout a baffle (empty stage). The apparatus used for the experiments was a three-stage unit with the test stage being the middle one. The stages were each 1.0 m long and 0.10 m wide. The orifices were rectangular 0.1 m wide and 0.15 m high. See Fig. 5 for more details.
Fujii Eq. no. 1 (without baffle) In SI units
A' = 1.13ATs exp[( - - 2/Vg) + (0.65h x w x 10 -s - - 0 . 5 ) A T B ] (18)
In British units
A' = (1.1304) AT~ exp[{--32.05/Vg) + (0.0136h × w × 10 -s -- 0.278)ATB]
(18a)
Fujii Eq. no. 2 (with baffle) In SI units
A' = 1.31ATs exp[ ( - -5 .07 /Vg) + ( 0 . 7 4 h - 0 .96)ATB]
In British units
A' = 0.404ATs exp [-- 81.216/Vg + (0 .0104h -- 0.533)ATB ]
(19)
(19a)
Miyatake et al., Kyushu University [19] The equation was developed to correlate data from flash evaporation
experiments in a pool of pure water, and is included here just to compare flash evaporation pools and streams. Tv (equilibrium temperature is the term used in ref. 19 for Tv) was determined as the saturation temperature corresponding to the vapor pressure in the vessel which was measured 20 s
2 3 4
Z ~d
r,
z N
r~
r~
N
z
N
z
0 m
~o
o
~. o°.~
~o
,--i e - - o ,--t
oOo ~ po ~ po ~ oOo ~ po ~ ~o~o ~ .~
X x
2 3 5
°° °~ ~ ~ o oo ~
• ~ ~ ~ i
~. . ~. I ~-~. • •
N e m ~. m m t-- ~
o
o[
B.=
"~,
236
~30c ~DEMISTERS
1! SECTION
10cm
CONSTRUCTION OF BAFFLE PLATE
BAFFLE I INTERSTAGE PkATE~ ~m~ PkATE
111111,'1111//I//1111111 ---"'t 5cm Fig. 5. Cross sectional view of stage.
after flashing had been initiated. At the same time ATB was determined as ATB ---- Tm -- Tv where Tsi is the mean liquid pool temperature at t ime = 0 (initial water temperature) . The flash chamber was made of a glass cylinder 8 cm diameter and 40 cm high, connected to a vacuum tank. The experi- ments were carried out at equilibrium temperatures of Tv = 40, 60 and 80°C and ATB = 3 and 5°C. The water depth ranged from 19.6 to 22.5 cm.
Miyatake equations
A ' - 33ATs°'ss Tv , Tv and ATB in °C (20)
A' 43 AT °'ss -- Tv-y 32 ' Tv and ATs in °F (20a)
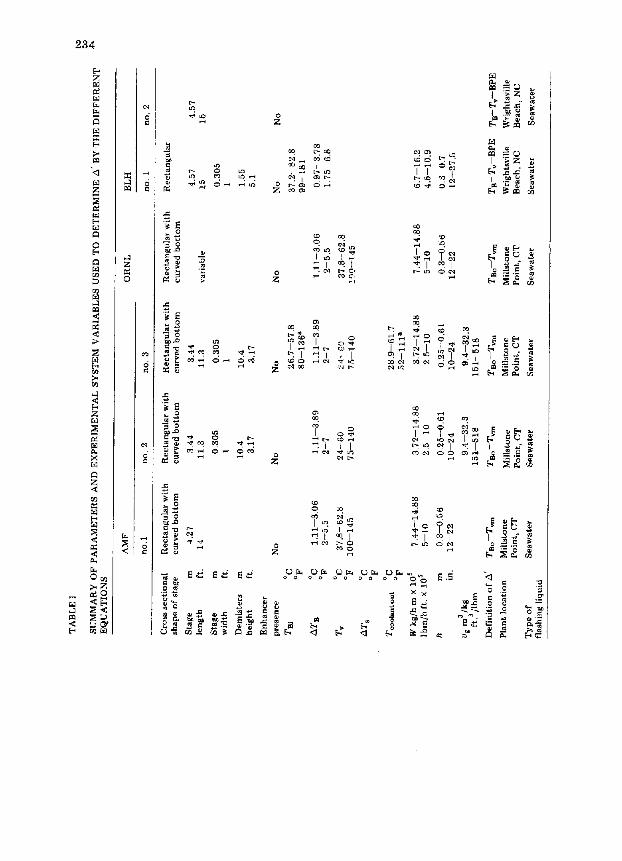
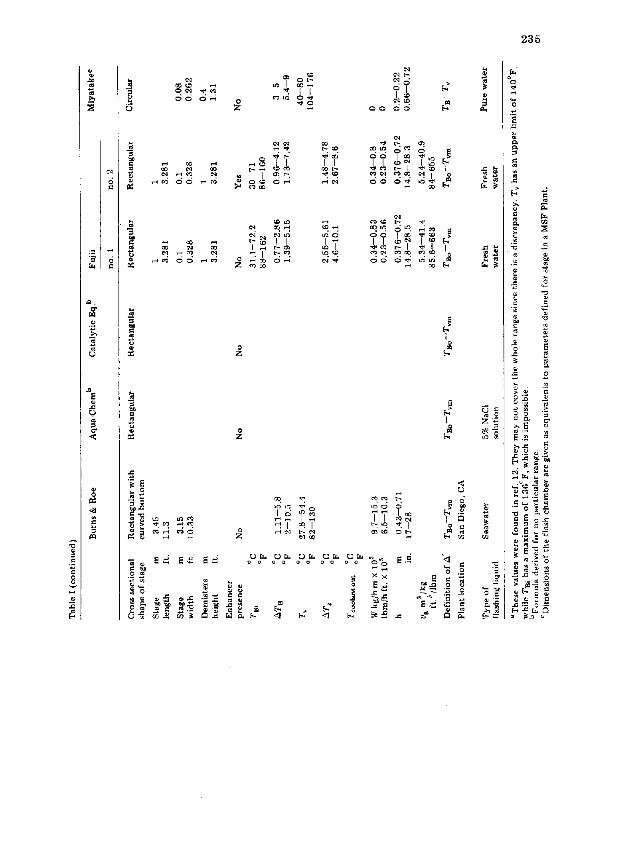
The parameters and experimental system variables used to determine A' by the different equations are summarized in Table I.
237
APPLICABILITY FOR OTEC FLASH EVAPORATORS
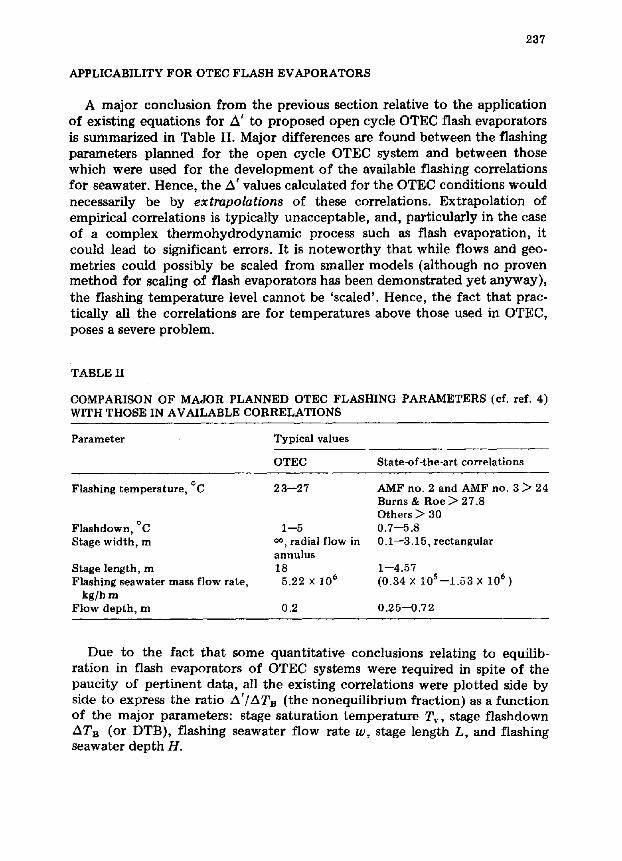
A major conclusion from the previous section relative to the application of existing equations for 4 ' to proposed open cycle OTEC flash evaporators is summarized in Table II. Major differences are found between the flashing parameters planned for the open cycle OTEC system and between those which were used for the development of the available flashing correlations for seawater. Hence, the A' values calculated for the OTEC condit ions would necessarily be by extrapolations of these correlations. Extrapolat ion of empirical correlations is typically unacceptable, and, particularly in the case of a complex thermohydrodynamic process such as flash evaporation, it could lead to significant errors. It is no tewor thy that while flows and geo- metries could possibly be scaled from smaller models (although no proven method for scaling of flash evaporators has been demonstra ted ye t anyway), the flashing temperature level cannot be 'scaled'. Hence, the fact that prac- tically all the correlations are for temperatures above those used in OTEC, poses a severe problem.
TABLE II
COMPARISON OF MAJOR PLANNED OTEC FLASHING PARAMETERS (cf. ref. 4) WITH THOSE IN AVAILABLE CORRELATIONS
Parameter Typical values
OTEC State-of-the-art correlations
Flashing temperature, °C 23--27
Flashdown, °C 1--5 Stage width, m 0% radial flow in
annulus Stage length, m 18 Flashing seawater mass flow rate, 5.22 × 10⁶
kg/h m Flow depth, m 0.2 0.25--0.72
AMF no. 2 and AMF no. 3 ~ 24 Burns & Roe ~> 27.8 Others ~ 30 0.7--5.8 0.1--3.15, rectangular
1--4.57 (0.34 × 10⁵ --1.53 × 10⁶ )
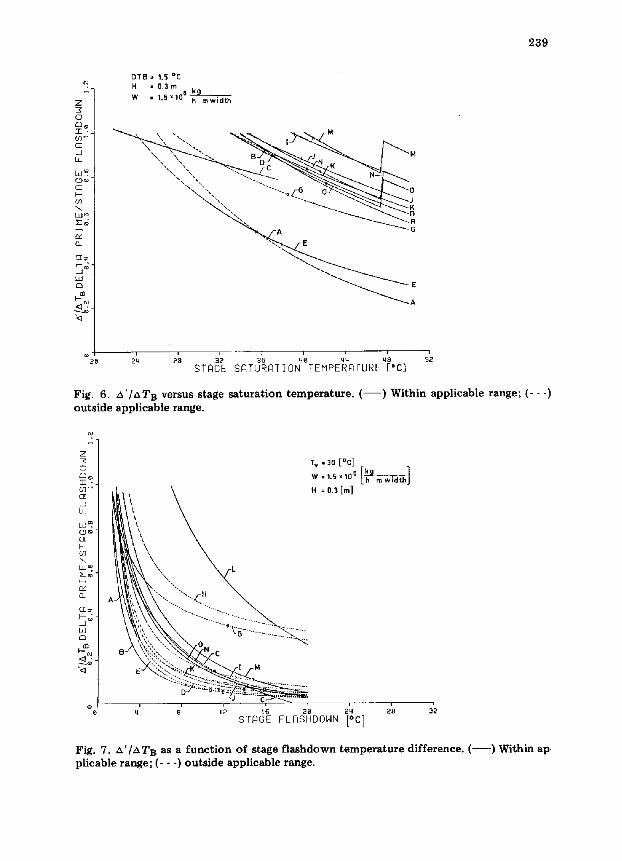
Due to the fact that some quantitative conclusions relating to equilib- ration in flash evaporators of OTEC systems were required in spite of the pauci ty of pert inent data, all the existing correlations were plot ted side by side to express the ratio A'/ATB (the nonequil ibrium fraction) as a funct ion of the major parameters: stage saturation temperature Tv, stage flashdown ATB (or DTB), flashing seawater flow rate w, stage length L, and flashing seawater depth H.
238
In view of the large number of correlations, the wide range of data and the need to determine various temperature, pressure and concentration depen- dent fluid properties for the evaluation of A', a computer program was developed which incorporates the A' correlations, fluid property equations, and a plotting subroutine. The program thus computes the nonequilibrium fraction (A ' /AT B ) in any range of variables, and plots it as a function of any desired parameters, eliminating unreasonable values such as (A'/~TB) ~ 0 and (A'/ATB) ~ 1. Most of the equations blow up in such or other wayswhen extrapolated outside their original range. The results are shown in Figs. 6-- 10. The letters A--O describing the curves stand for the following correlations defined in the previous section:
A: AMF No. 1 B: AMF No. 2 C: BLH No. 1 D: BLH No. 2 E: Burns & Roe F: Fujii No. 1 (without baffle) G: Miyatake (pool flashing) H*: ORNL {general) H: O R N L f o r L = l m
I: ORNL for L = 3.45 m J: ORNL for L = 4.27 m K: ORNL f o r L = 4.57 m L*: Aqua-Chem (general) L: Aqua-Chem for L = 1 m M: Aqua-Chem for L = 3.45 m N: Aqua-Chem for L = 4.27 m O: Aqua-Chem for L = 4.57 m
The four different stage lengths in curves H - O were chosen to correspond to the various stage lengths used in the experiments from which the other corre- lations were derived. In the figures DTB -- ATB = stage flashdown, °C Tv = stage saturation temperature, °C W = flow rate of flashing seawater, kg/h m H -- level of flashing liquid, m
The curves were drawn around the baseline values of Tv = 30°C, DTB = 1.5°C, W = 1 . 5 × 1 0 6 k g / h m , H = 0 . 3 m . The dashed part of some of the curves is for ranges outside those for which the equations were developed.
Inspection of the graphs produces the following major conclusions: (a) There exists a large spread between the nonequilibrium fraction values
calculated by the different correlations, of up to about one order of magni- tude. This makes it practically impossible to make acceptable predictions of nonequilibrium.
(b) All the correlations show a very large nonequilibrium fraction, above about 0.8, in the stage saturation temperature range and flashdown range relevant to OTEC systems.
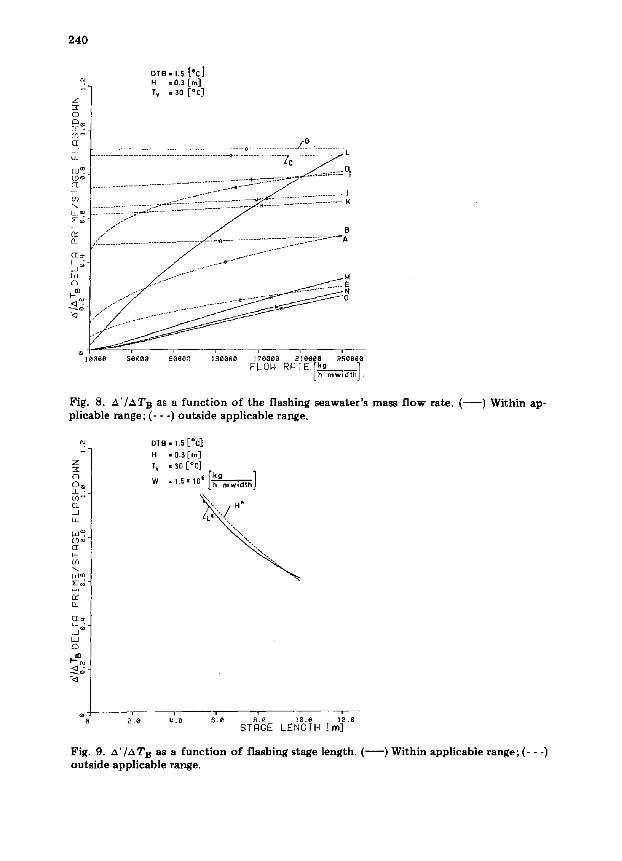
(c) Since the proposed OTEC stage length is 4--5 times longer than the baseline values used in the correlations, Fig. 9, which was plotted for the only two correlations which are a function of stage length (ORNL" H*, and Aqua-Chem: L*), indicates that the nonequilibrium fraction values may decrease markedly below the high values indicated in (b) above. Unfortunately
239
N.
Z : I 0
5 LL
w ~.
LU~o
W C,_
CI~
2~
D T B . 1.5 °C H ffi 0.3m kg W = 1"5x10⁶ h mwidth
"~ . A E 13
STAGE SATURATION TEMPERRTURE [:C]
Fig. 6. A'/AT B versus stage saturation temperature. ( - - ) Within applicable range; (- --) outside applicable range.
N .4"
Z "z"
0
03 ~
d L
m ~
b- CO
m ~ ~ - £ -
c~ (3_
CZ= ~- M C3
A-
STAGE FLASHDONN [°C]
T v ffi 3O ["C]
W •).SxlO6 [h m width l H . 03 [,.]
Fig. 7. A'/ZXTB as a funct ion of stage f lashdown temperature difference. ( ) Within ap plicable range; (- - -) outside applicable range.
240
o , B = , s [=c] cu H =0.3 [ m ] £ -
T v = 30 [ ° c ] Z ]3C 0
........................................................... ~ ................... E....:O ............ ~- .......................................................................... Z~" .......... ~
~z . . . . . . . . . . . . . . . . . . . . . . . . . . . . . . . . . . . . . . . . . . . . . . . . . . . . . . ~[- - - : : . . . . . . . . . . . . p- .. . . . .o---'° _ . . . . . . . . . . .(
co . . . . . . . . _'-_" . . . . . . . . . . . . . . . . . . . . . . . . . . . . . . . . . . . . . . . . . . . . . . . . . . . . K
D_ C_~ . . . . . . . . . . . . . . . . . . . . . . . . . . . . . . ;Z.::-::;: . . . . . . . . A
SJ LJjj --"Y M
C5 . . . . . . . . . . . - E m . - ~ - . . . . . . . . . . . . . N
0 0 0 0 5 0 0 0 0 9 0 0 0 a 1 3 0 0 0 0 1 7 0 0 0 0 2 1 0 0 0 0 25000@ kg
Fig. 8. A'/AT B as a funct ion o f the flashing seawater's mass f l o w rate. ( - - ) Within ap- plicable range; (- - -) outside applicable range.
N .4"
Z Z 0
C£
h _
m ~.
OZ I-- CO
W ~
13_
el[ ::r
W C3
< ~ -
<1
DTB ffi l.S [ °C ]
H ffi 0,3 [ m ]
T v = 30 [ ° C ]
s= .o6 l'kg 1 W = . ,u [h mwld thJ
2' ,o 4' .o s ' .o 8'.o ~ o . o ~ 2 . o STAGE LENGTH [m]
Fig. 9. ~'/ATB as a funct ion o f flashing stage length. ( - - ) Within applicable range; (- - -) outside applicable range.
241
T v = 30 [ ° C ]
O T 8 = 1 "5 [ °C ] [ . k . ~ . . . ] W = 1 " 5 x 1 0 6 h m w l d t h
0 : 2 M A ~
= ~ / / zo'Z"/ , 'X' /( ' , ' Zc ,7' ,;-I / ," "/q//,' ," ,' .. f # ,, ,,/ /.?" / , , t lJ ., / / / /
.,, i , . ,, / / , / / / , I i / / L ' / / ; " , ~1 I.!'~ .Zq l / " ," ,,, / ../~i\~;7// . - " , '
~- i I i / " ' I .11 / " i ,,'" gl o L . . . . I I I
...j ~ /#
° , q 1t ..." , : ' / ; /
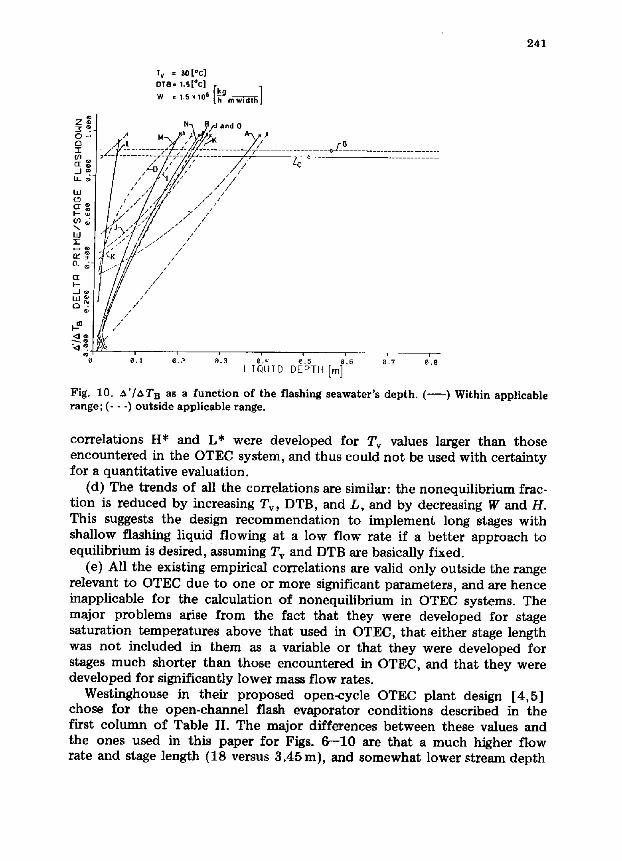
0 , . . . . . . . • 0 . 2 0 . 3 o . q 0 . 5 0 . 6 0 . 7 O.S LIQUIO DEPrH [.,] Fig. 10. A'/ATB as a function of the flashing seawater's depth. ( - - ) Within applicable range; (- - -) outside applicable range.
correlations H* and L* were developed for Tv values larger than those encountered in the OTEC system, and thus could not be used with certainty for a quantitative evaluation.
(d) The trends of all the correlations are similar: the nonequilibrium frac- tion is reduced by increasing Tv, DTB, and L, and by decreasing W and H. This suggests the design recommendation to implement long stages with shallow flashing liquid flowing at a low flow rate if a better approach to equilibrium is desired, assuming Tv and DTB are basically fixed.
(e) All the existing empirical correlations are valid only outside the range relevant to OTEC due to one or more significant parameters, and are hence inapplicable for the calculation of nonequilibrium in OTEC systems. The major problems arise from the fact that they were developed for stage saturation temperatures above that used in OTEC, that either stage length was not included in them as a variable or that they were developed for stages much shorter than those encountered in OTEC, and that they were developed for significantly lower mass flow rates.
Westinghouse in their proposed open,cycle OTEC plant design [4,5] chose for the open-channel flash evaporator conditions described in the first column of Table II. The major differences between these values and the ones used in this paper for Figs. 6--10 are that a much higher flow rate and stage length (18 versus 3.45 m), and somewhat lower stream depth
242
were required for the plant design. This brings the parameters of interest even fur ther f rom the values for which the formulas were originally devel- oped, and their applicability is thus even more in question.
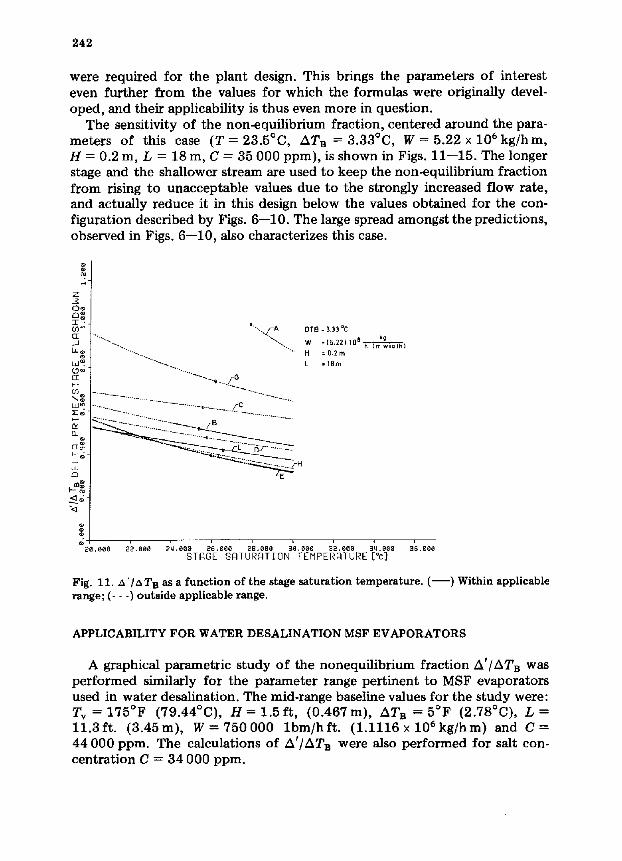
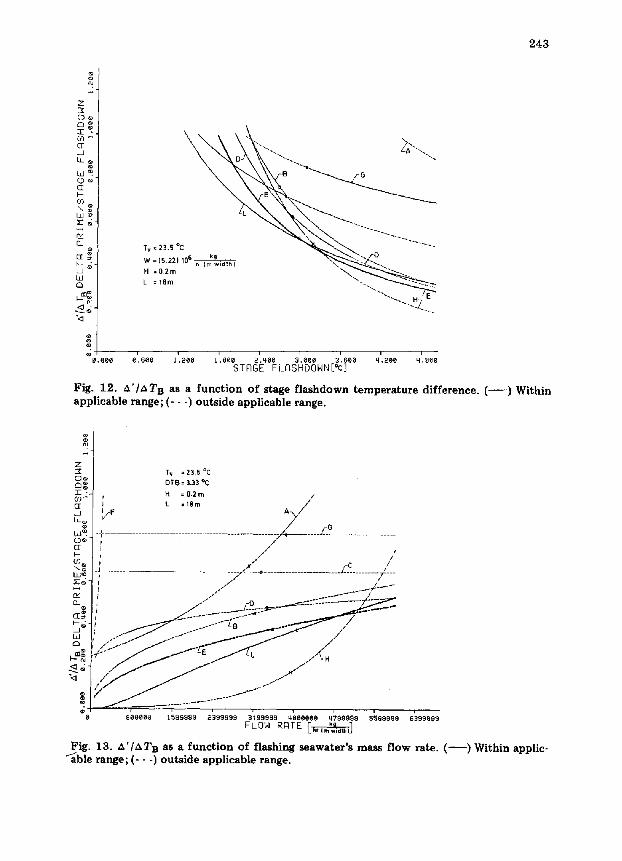
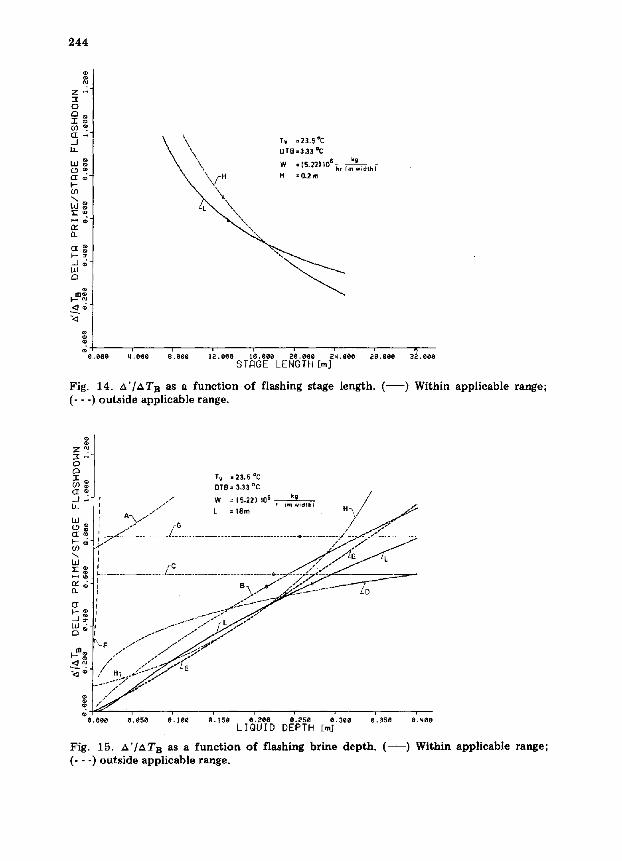
The sensitivity of the non~qui l ibr ium fraction, centered around the para- meters of this case (T = 23.5°C, ATB = 3.33°C, W = 5.22 × 10⁶ kg /hm, H = 0.2 m, L = 18 m, C = 35 000 ppm), is shown in Figs. 11--15. The longer stage and the shallower stream are used to keep the non-equilibrium fraction from rising to unacceptable values due to the strongly increased flow rate, and actually reduce it in this design below the values obtained for the con- figuration described by Figs. 6--10. The large spread amongst the predictions, observed in Figs. 6--10, also characterizes this case.
C]: " , ~ " - . . . .~A DTB ~333°C
] " ...I ...... ,.. " " - , . W = 15.22) 106 h Im width) L l . e " " - , . " " H = 0 . 2 m
LD ~. "~ ...... L = tBrn QD~ ..... - .....
. . . . . . . . . . . . . . . . . . . . . . . . . . . . C . . . . . . . . . . . . . ~ % . . . . . . . . . . " . . . . . . . . . . ,o . . . . . . . . . . . L'-
t--- ea
®
2 0 . 0 0 0 2 2 . 0 0 0 2 q . 0 0 0 2 6 . 0 0 0 2 8 . 0 0 0 3 0 . 0 0 0 3 2 . 0 0 0 3 q , 0 0 0
STAGE SATURATION TEMPERATURE[°c] 36.oee
Fig. 11. A'/ATB as a function of the stage saturation temperature. ( - - ) Within applicable range; (- - -) outside applicable range.
APPLICABILITY FOR WATER DESALINATION MSF EVAPORATORS
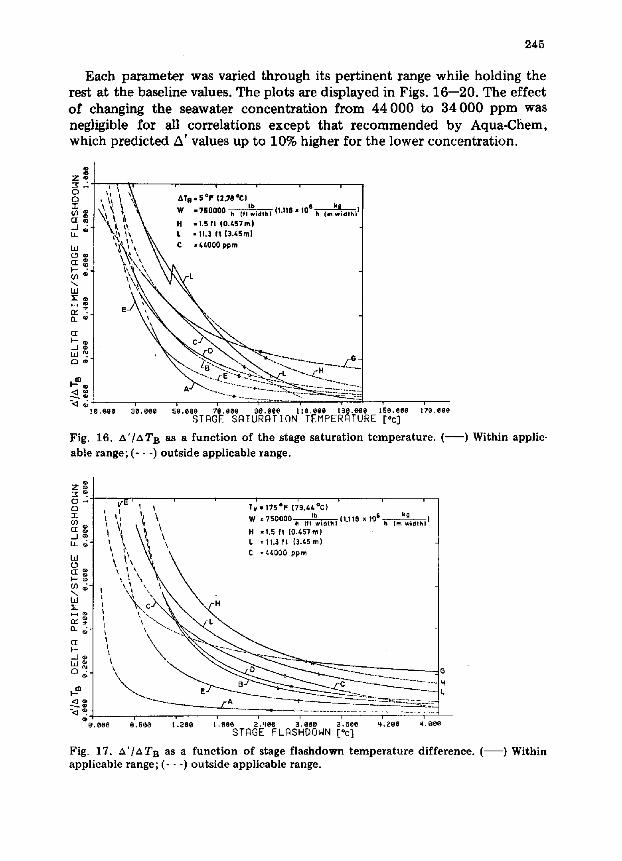
A graphical parametric study of the nonequilibrium fract ion A'IATs was performed similarly for the parameter range pert inent to MSF evaporators used in water desalination. The mid-range baseline values for the study were: Tv = 175°F (79.44°C), H = 1 . 5 f t, (0 .467m) , ATs----5°F (2.78°C), L = l l . 3 f t . (3 .45m) , W = 7 5 0 0 0 0 l b m / h f t . (1.1116 x 1 0 6 k g / h m ) and C = 44 000 ppm. The calculations of A'/ATB were also performed for salt con- centrat ion C = 34 000 ppm.
243
Z O o
J ~ g W ~
W ~ ~ -
m
W
~ , ~
T~ ° 23.s °c " % . . _ ~ ..........
H =0.2m " "'-~ " " " - ~
, i i i i
6', 666 ] .266 1.886 2=, q86 3, EI68 3',6(~e q .2ee q.606 STAGE FLASHDONN[°c]
Fig. 12. ~'IZ~T B as a funct ion o f stage f lashdown temperature difference. ( - - ) Within applicable range; (- - -) outs ide applicable range.
Z
O o
T ° ,
GE ,._1 LEe
G F-
Wto
0-
_~ I.JJ a
~ -
Tv =23.5 °C DTB= 3.33 °C H =0.2m / L =18m / /
I / F A ~ , i /" ~G
t - - i
j /
. . . . . . . . . . . . . . . . . . . . . . . . . . . . . . . . . . ~ . . . . . . . . . . . . . . . . . . . . . . . . . . . . ~ ......... ,;__ l / i iT
. - / r o .....==:::::: . . . . . . . . . . . . / - ~ ' ~ _ _
, . 'S" ~ ....... " ~ " " - - / .,/
866006 1599989 2;99999 3'199999 q;sEl@60 q~/99999 5569999 6;99969 FLON RRTE ka n Eht ( m widthli
Fig. 13. ~'/~TB as a funct ion of flashing seawater's mass f l o w rate. ( ~ ) Within applic- a b l e range; (- - -) outs ide applicable range.
244
¢u
Z ~- --¢
0
(n ~
.J LL
co m ( I e~- i'- 0
LU~
a~ D_
LU ~3
0. 000
~ Tv =23.5 °C DT8=3.33 °C
32.000 S T A G E LENGTH [m]
Fig. 14. A ' / A T B as a funct ion o f flashing stage length. ( - - ) Within applicable range; (- - -) outside applicable range.
z ~. --¢ .
C)
T T v = 23.5 °C OTS= 3.33 °C
h-J -'" / W = 5.22 0 s k g / / I ~ s/ h {m width} H /
~ L . . . . . . . . . . . . . . . . . . . . . . . . . . . . . . . . . . . . . . . . . . . . . . . . . . . ~ . . . . . " - - - . , - ~ ' - - - / - _ _ ~
.~ ~ /" ..-;... ~G" /
~P0.0@0 6'.(150 0'. 100 0~. ] 50 0.200 0 .250 0'. 300 0'. 350 0.400 L I O U I D D E P T H [mJ
Fig. 15. A' /AT B as a funct ion o f flashing brine depth. ( ) Wi th in applicable range; (- - -) outside applicable range.
245
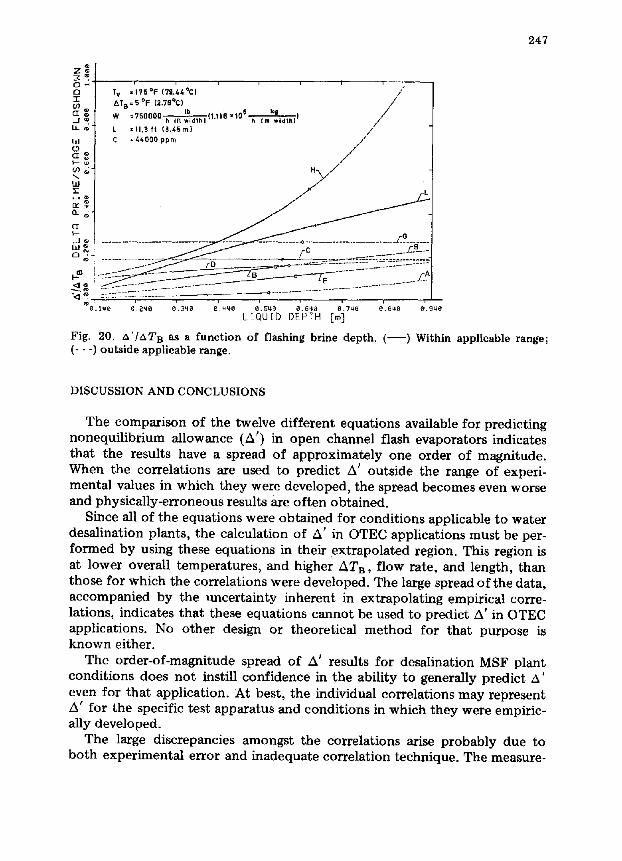
Each parameter was varied through its pertinent range while holding the rest at the baseline values. The plots are displayed in Figs. 16--20. The effect of changing the seawater concentration from 44 000 to 34 000 ppm was negligible for all correlations except that recommended by Aqua-Chem, which predicted A' values up to 10% higher for the lower concentration.
',~ ~ i ~ i ~ ~ ~ ATB.5OF(2.78OC) ~ . \ , , ~ ' w . , , o o o o ~ ( , . , s . , . ' j - - , " h (mwidthl QZ ~o \ ~ . H - l .S f t (o./,57m) b_ J ":'" ~ "~ L -11.3 ft (3./.5m) LLI ~i C = 4/*000 ppm
n,< fl ®"
"<1~ ze.eee 3e.eee 5o.eee 7e.eee se.eee tze.eee z'~e.eee zse.eee z7e.eee STAGE SATURATION TEMPERATURE [°c]
Fig. 16. /~'/ATB as a func t ion o f the stage saturat ion temperature . ( ~ ) Within applic- able range; (- - -) outs ide appl icable range.
z ~ ( D - i , I i ~ i , V'E ~ TV = 175°F (79 44%
', '~', , t, \, W =750000 h [,tlb[dth)(1.116 x 1 0 6 ~ ]
"k \~, L =11.3ft (3.45m)
-J¢
H
~O.~ee e'.6oo z'.~ee 1'.see 2'.qoe 3'. see 3'.~ee ~'.eoe ~'. coo ST!qGE FLASHDOWN [%]
Fig. 17. ~'/~T B as a f u n c t i o n o f stage f l a shdown temperature di f ference. ( appl icable range; (- - -) outs ide appl icable range.
) Within
246
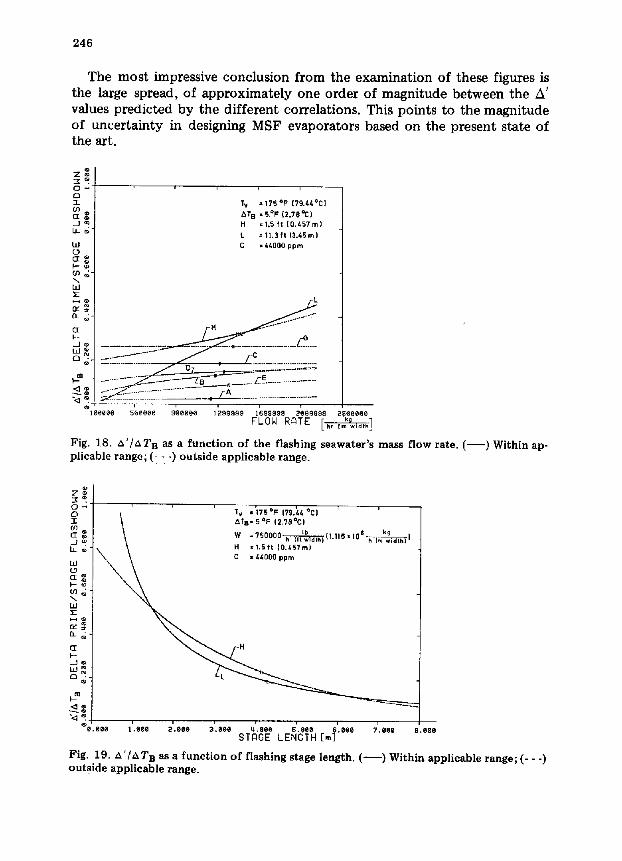
The most impressive conclusion from the examination of these figures is the large spread, of approximately one order of magnitude between the A' values predicted by the different correlations. This points to the magnitude of uncertainty in designing MSF evaporators based on the present state of the art.
z ~ O ~ i I i l i
O T TV : 175 OF (79.44 OC ) (/3 QZ ~ ATB =5-OF (2. 780C)
• - J ~ H =1.5 ft (0.457 m) LL ~ -
L = I L 3 f t ( 3 . 4 5 m )
W C = 44000 ppm O
m
\ W
- J ~' . . . . . . . . . . . . . . . . . . . . . . ,e . . . . . . . . . . . . . . . . . . . . . . . . . . ~ ...... w ~ ~ : ~ [ ............
~.erl ......... - . . . . . .
<z ~ ....... .......................... FA ~ _ _ - T - - . r" . . . . . . . . . . . . . . . . . . . . . . . . . . . . . . - < ~
el ee00(~ s~eeee 9~oeee ] 299989 169999s 2~99999 geeeeee FLOW RATE [~, I.n * . , .h i
Fig. 18. , ' , ' /AT s as a funct ion o f the flashing seawater's mass f low rate. ( plicable range; (- - -) outside applicable range.
) Within ap-
z g
0 - , ' Tv =175°F [ 4 | "79."/. °C" ] ' TO \ ATB =SQF (2.78 °C)
~ \ w °.oooo. , , :° , . , . .o. ,o~ m%,.,~ _ j o o LL ~ , H = 1 ,S f t (0 .457 m ) %
\ \ \ C = 44000 ppm
W ~
~_®
~ ' .80e 1'.0~e 2',oee 3'. eee q'.eee 5'. e6e 6'.ee6 7'.60e 8.eee STAGE LENGTH[m]
Fig. 19. A ' / A T B as a funct ion o f flashing stage length. ( - - ) Within applicable range; (- - -) outside applicable range.
247
O - r if)
t l l (D
~ g
W
i i i i I T v =175°F (79,44°C) / AT 8 =5 oF (2.78%) ///// W = 7 5 0 0 0 0 ~ ( 1 . 1 1 6 x 1 0 1 5 ~ ) h Im / /
L =11.3 ft (3,45 m) / / C = 44000 ppm //
/ / j J
H ~ ) / / "
L
w ~ J 0_g:
. _ J ~ . . . . . . . . . . . . . . . . . . . . . . . . . . . . .
, ~ m ~ . . . . . _ . . . . . . . . . . ~ .....................
, * i i ~ 0 . t ~ e O'. 2q0 e . 3~0 O. ~ 0 0'. gt~O O'. 6qO O. 7~-~ e . 8qO O. 9~te
LIQUID DEPTH [m]
Fig. 20. A ' / A T s as a hmet ion of flashing brine depth. ( (- - -) outside applicable range.
) Within applicable range;
DISCUSSION AND CONCLUSIONS
The comparison of the twelve different equations available for predicting nonequilibrium allowance (A') in open channel flash evaporators indicates that the results have a spread of approximately one order of magnitude. When the correlations are used to predict A' outside the range of experi- mental values in which they were developed, the spread becomes even worse and physically-erroneous results are of ten obtained.
Since all of the equations were obtained for conditions applicable to water desalination plants, the calculation of A' in OTEC applications must be per- formed by using these equations in their extrapolated region. This region is at lower overall temperatures, and higher ATB, flow rate, and length, than those for which the correlations were developed. The large spread of the data, accompanied by the uncertainty inherent in extrapolating empirical corre- lations, indicates that these equations cannot be used to predict A' in OTEC applications. No other design or theoretical method for that purpose is known either.
The order-of-magnitude spread of A' results for desalination MSF plant conditions does not instill confidence in the ability to generally predict A' even for that application. At best, the individual correlations may represent A' for the specific test apparatus and conditions in which they were empiric- ally developed.
The large discrepancies amongst the correlations arise probably due to both experimental error and inadequate correlation technique. The measure-
248
ment error comes from the fact that the very small temperature differences, of say 0.5--2°C, and the vapor temperature, need to be measured accurately. Furthermore, the velocity distribution at the inlet and outlet of the evapora- tor needs usually to be known for the determination of T~ and TBo. The low-velocity (around 1 m/s) typically two-phase flow makes this very difficult to measure with adequate accuracy.
It is noteworthy that all the correlations are dimensional. They do not use characteristic nondimensional numbers (such as Reynolds, Prandtl, Jakob, Froude) which are needed for a good correlation, and thus also ignore most of the property varitions which influence the process, such as those in vis- cosity, thermal conductivity, specific and latent heat, and surface tension.
The inevitable conclusion for improvement in the ability to predict the approach to equilibrium in open channel flash evaporators, is that both better measurements and correlations are needed, in the entire range of parameters of interest.
ACKNOWLEDGEMENTS
This study was supported in large part by Westinghouse Electric Corpor- ation, from a Solar Energy Research Institute contract and by a contract from the U.S. Department of Energy Solar Heating and Cooling R&D Branch, to the University of Pennsylvania. The assistance of Messrs. I. Segal and Y. Tartakovski in the computation, the encouragement by Mr. Ron Ellis, and the counsel of Dr. T. Rabas, are gratefully acknowledged.
REFERENCES
1 A. Porteous, Saline Water Desalination Processes, Longman, London, 1975. 2 Burns and Roe, Inc., Universal Design: Report on Design of a 2.5 Million Gallon Per
Day Universal Desalting Plant Report on U.S.D.I. Contract No. 14-01-0001-955, June 1969.
3 N. Lior and R. Greif, Some basic observations on heat transfer and evaporation in the horizontal flash evaporator, Desalination, 33 (1980) 269--286.
4 T.J. Rabas, J.M. Wittig and K. Finsterwalder, OTEC 100-MWe alternate power systems study, Proc. of Sixth Ocean Thermal Energy Conversion Conference, Washington, D.C., 19--22 June 1979, Vol. 1, p.g. 1--1.
5 W.H. Coleman, Westinghouse OTEC power systems, Energy, 5 (1980) 493--501. 6 La Mer, Retardation of Evaporation by Monolayers, Academic Press, New York,
1962. 7 H.H. Sephton, Vertical Tube Evaporator Utilizing Vortex Flows and Flash Enhance-
ment, O.S.W., R & D Progress Report No. 574, May 1970. 8 R.D. Veltri, An Experimental and Analytical Analysis of Low Quality Vapor Transfer
in One Stage of a Free Surface Flash Evaporator, Ph.D. Dissertation in Mechanical Engineering, University of Connecticut, 1974.
249
9 N. Lior and E. Nishiyama, The effect of gas bubbles on flash evaporation, Desali- nation, 45, (1983) 231--240.
10 W.R. Williamson and F.W. Gilbert, Investigation of Multistage Flash Phenomena in a Three-Stage Test System, O.S.W., R & D Progress Report No. 525, Feb. 1968, pp. 3, 51.
11 Catalytic Construction Company, Senator Clair Engle Test Bed Plant, Chula Vista, California, Development Program Report, Catalytic Construction Company Contract No. 41560, O.S.W. Contract No. 14-01-0001-2283, Jan. 1970.
12 W.R. Williamson and J.R. Hefler, Special Studies on the characteristics of a Flashing Stage, O.S.W., R & D Progress Report No. 575, May 1970, p. 61.
13 Oak Ridge National Laboratory, Study of 250-MGD Multistage Flash Distillation Plant with Two-Level Brine Flow, O.S.W., R & D Progress Report No. 389, March 1969, pp. 26--27.
14 Envirogenics Co., Operation of the Three-Stage Flash Devices Plant, A Final Report for Baldwin-Lima-Hamilton Corp. and O.S.W., NTIS Publication No. PB252273, Accession No. W76-07111, April 1972, p. 28.
15 Burns and Roe, Inc., Final Report, MSF Module Studies, O.S.W. San Diego Test Facility, O.S.W. Contract No. 14-30-3014, May 1972, p. 31.
16 A. Steinbruchel, Aqua Chem, Inc., Final Report of the MSF Flash Enhancer Study, O.S.W. Contract 14-01-001-2184, O.S.W., R & D Progress Report No. 749, Sept. 1971.
17 Catalytic, Inc., Operation of the Multi-Effect Multi-Stage Flash Distillation Plant (Clair Engle). Third Report (Annual), San Diego, California, O.S.W., R & D Progress Report No. 668, April 1971, p. 451.
18 T. Fujii, O. Miyatake, T. Tanaka, T. Nakaoka, H. Matsunaga and N. Sagakuchi, Fundamental Experiments on Flashing Phenomena in a multistage Flash Evaporator, Heat Transfer Jpn. Res. 5 (1) (1976), 84--93.
19 O. Miyatake, K. Murakami, Y. Kawata and T. Fujii, Fundamental Experiments with Flash Evaporation, Heat Transfer Jpn. Res. 2(4) (1973) 89--100.
Note: All U.S. Government reports are available for purchase from the Superintendent of Documents, U.S. Government Printing Office, Washington, D.C. 20402.