form approved report documentation page omb · pdf filetow body allowed real-time data...
TRANSCRIPT

Form ApprovedREPORT DOCUMENTATION PAGE OMB No. 0704-01-018A
1 Me puoM reporting burden 10rlo WlNl COollC1,o0 Of Im oonr l I esln to average I rnot-r In o i touolne m• Ing Instucto he, "apenc on uth s , sou I nfotndun sugg the burden to Dpart of Defense, Washington Headquaers S a for In o a and Reports (0704-01), 1215 JeffersonDavis Highway, Suits 1204, Adklgton VA 22202-4302. Respondents should be aware that notwlthstanding any other provision of law, no person sa be subjeot to any penalty for failing tocornply with a collection of Information If it does not displav a currentiv valid OMB control nuwner.PLEASE DO NOT RETURN YOUR FORM TO THE ABOVE ADDRESS.
1. REPORT DATE (DD-MM-YYYY) 2. REPORT TYPE 3. DATES COVERED (From - To)2003 1 Conference Proceedings
4. TITLE AND SUBTITLE 5a. CONTRACT NUMBERHigh Frequency Side Scan Sonar for Target Reacquisition and Identification
Sb. GRANT NUMBER
Sc. PROGRAM ELEMENT NUMBER
S. AUTHORS 5d. PROJECT NUMBERThomas E. Wilcox*Barbara Fletcher so. TASK NUMBER
5f. WORK UNIT NUMBER
7. PERFORMING ORGANIZATION NAME(S) AND ADDRESS(ES) 8. PERFORMING ORGANIZATIONSSC San Diego *Marine Sonic Technology, Ltd. REPORT NUMBER53560 Hull St. 5508 George Washington Memorial HwySan Diego, CA 92152-5001 White Marsh, VA 23183
9. SPONSORING/MONITORING AGENCY NAME(S) AND ADDRESS(ES) 10. SPONSORIMONITOR'S ACRONYM(S)
11. SPONSOR/MONITOR'S REPORTNUMBER(S)
12. DISTRIBUT1ONIAVAILABILITY STATEMENTApproved for public release; distribution is unlimited.
13. SUPPLEMENTARY NOTESThis is the work of the United States Government and therefore is not copyrighted. This work may be copied and disseminatedwithout restriction. Many SSC San Diego public release documents are available in electronic format at:http://www.spawar.navy.mil/sti/publications/pubs/index.html
14. ABSTRACT
The increasing use of small unmanned underwater vehicles (UUV's) for scientific, military and security applications has led to thedevelopment of new sensor technologies. Key among these has been the development of small, light, cost-effective side scan sonarsystems, enabling small vehicles such as the REMUS and CETUS II to perform a variety of survey-type missions. Newdevelopments in side scan technology are increasing the capabilities of these systems, going beyond the simple detection oftargets. Use of high frequencies such as 1.2 and 2.4 MHz can provide a sufficient degree of resolution for the recognition andidentification of targets. The performance of these sonar systems will be discussed, as well as factors affecting performance suchas speed, altitude, depression angle, and vehicle system interference.
Published in Proceedings of OCEANS 2003 MTS/IEEE, Marine Technology Society, Washington, DC, 2003, pp. 1882-1887.
15. SUBJECT TERMSsensor technologiesside scan sonar systemsunmanned underwater vehicles (UUV's)
16. SECURITY CLASSIFICATION OF: 17. UMITATION OF 18. NUMBER 19a. NAME OF RESPONSIBLE PERSONa. REPORT b. ABSTRACT c. THIS PAGE ABSTRACT OF Barbara Fletcher, Code 2744IPAGES' P S 19B. TELEPHONE NUMBER (Include area code)
U U U UU 6 (619) 553-3859Standard Form 298(Rev. 8/98)Prescribed by ANSI Std. Z39.18
High Frequency Side Scan Sonar for Target Reacquisition and Identification
Thomas E. Wilcox Barbara FletcherMarine Sonic Technology, Ltd. Space & Naval Warfare Systems Center 2744
5508 George Washington Memorial Hwy 49590 Lassing RoadWhite Marsh, VA, 23183, USA San Diego, CA, 92152, USA
[email protected] [email protected]
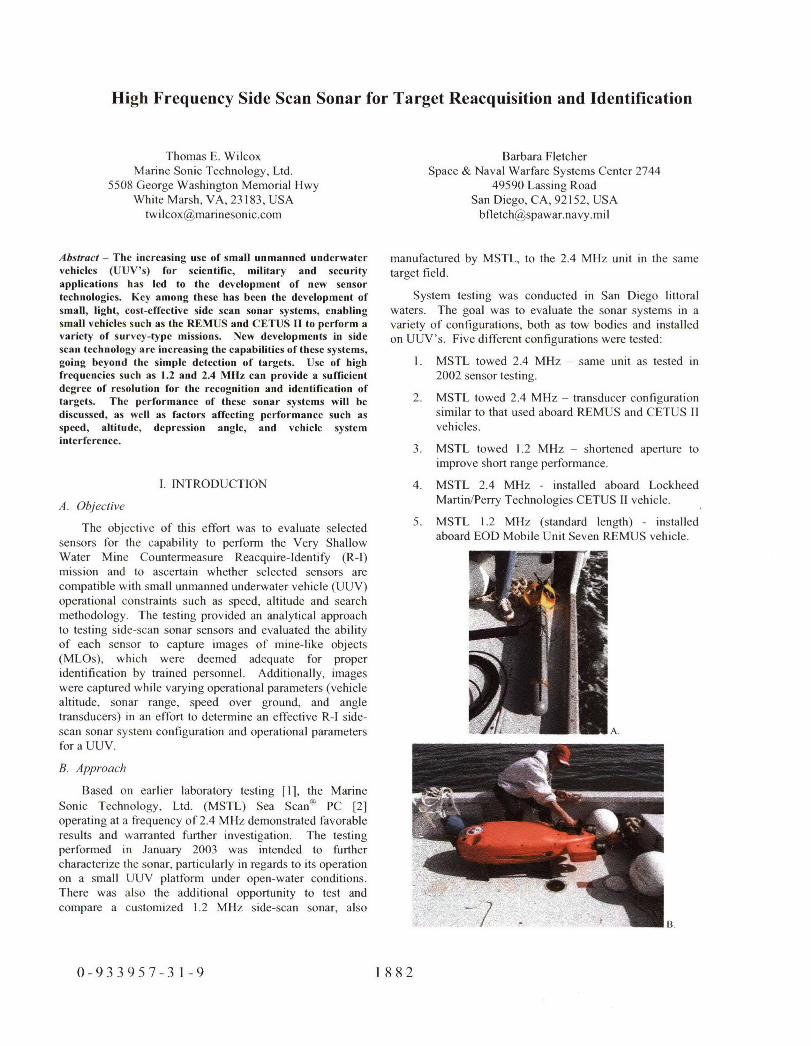
Abstract - The increasing use of small unmanned underwater manufactured by MSTL, to the 2.4 MHz unit in the samevehicles (UUV's) for scientific, military and security target field.applications has led to the development of new sensortechnologies. Key among these has been the development of System testing was conducted in San Diego littoralsmall, light, cost-effective side scan sonar systems, enabling waters. The goal was to evaluate the sonar systems in asmall vehicles such as the REMUS and CETUS II to perform a variety of configurations, both as tow bodies and installedvariety of survey-type missions. New developments in side on UUV's. Five different configurations were tested:scan technology are increasing the capabilities of these systems,going beyond the simple detection of targets. Use of high 1. MSTL towed 2.4 MHz - same unit as tested infrequencies such as 1.2 and 2.4 MHz can provide a sufficient 2002 sensor testing.degree of resolution for the recognition and identification oftargets. The performance of these sonar systems will be 2. MSTL towed 2.4 MHz - transducer configurationdiscussed, as well as factors affecting performance such as similar to that used aboard REMUS and CETUS Itspeed, altitude, depression angle, and vehicle system vehicles.interference. 3. MSTL towed 1.2 MHz - shortened aperture to
improve short range performance.
I. INTRODUCTION 4. MSTL 2.4 MHz - installed aboard Lockheed
A. Objective Martin/Perry Technologies CETUS II vehicle.
The objective of this effort was to evaluate selected 5. MSTL 1.2 MHz (standard length) - installed
sensors for the capability to perform the Very Shallow aboard EOD Mobile Unit Seven REMUS vehicle.
Water Mine Countermeasure Reacquire-Identify (R-I)mission and to ascertain whether selected sensors arecompatible with small unmanned underwater vehicle (UUV)operational constraints such as speed, altitude and searchmethodology. The testing provided an analytical approachto testing side-scan sonar sensors and evaluated the abilityof each sensor to capture images of mine-like objects(MLOs), which were deemed adequate for properidentification by trained personnel. Additionally, imageswere captured while varying operational parameters (vehiclealtitude, sonar range, speed over ground, and angletransducers) in an effort to determine an effective R-I side-scan sonar system configuration and operational parameters A.for a UUV.
B. Approach
Based on earlier laboratory testing [1], the MarineSonic Technology, Ltd. (MSTL) Sea Scan® PC [2]operating at a frequency of 2.4 MHz demonstrated favorableresults and warranted further investigation. The testingperformed in January 2003 was intended to furthercharacterize the sonar, particularly in regards to its operationon a small UUV platform under open-water conditions.There was also the additional opportunity to test andcompare a customized 1.2 MHz side-scan sonar, also
0-933957-31-9 1882
tow body allowed real-time data observation by the systemoperator, which allowed for the most efficient variation ofsonar parameters, such as vehicle altitude, sonar range andtransducer depression angle. For instance, if during testingthe tow body was progressively raised above the seabed to apoint that the sonar data was ineffective, that altitude couldbe noted and the test stopped without further collection. If aUUV was used for testing of this nature, a great deal of timewould be spent in both vehicle deployment andreacquisition tasks and in transferal of the data to a suitableworkstation for review. Many lines of data might have beencollected at this unsuitable altitude while other parameterswere being tested.
C. A REMUS vehicle in its current 1200 kHz
Fig. I. Test Platforms: A) MSTL tow body, B) CETUS It Vehicle and configuration was used to test the ability of a small UUV toC) REMUS Vehicle reacquire and identify a MLO in a known location using a
pre-devised search method. This test was focused on thevehicle's ability to run the search pattern and reacquire the
C. Background MLO, and not on the sonar parameters that maximized its
Small UUV's, those that weigh less than 150 lbs, have effectiveness in the R-I mission.
many advantages for field operations over the larger models. A CETUS II vehicle with the first 2.4 MHz side-scanThe increase in number and capabilities of these vehicles is sonar modified for use on a UUV was present andopening doors for an ever expanding number of applications conducted initial sea-trials and system integration work with[3]. Current and anticipated mission areas include the new sensor. Lockheed Martin and MSTL engineershydrographic survey, mine countermeasure survey-classify- were able to work together in the field learning of andmap, target reacquisition and identification, chemical dealing with vehicle integration problems as they arose.detection and plume mapping and harbor security [4, 5]. This kind of joint field work is very beneficial to bothThe development of sensors such as those described here vehicle developer and sensor manufacturer.will further enhance the capabilities and utility of thesevehicles.
D. Test Plan II. PARAMETERS SPECIFIC TO THE SONAR SYSTEM
The objective of the test was to find the configuration A. Frequency Comparison
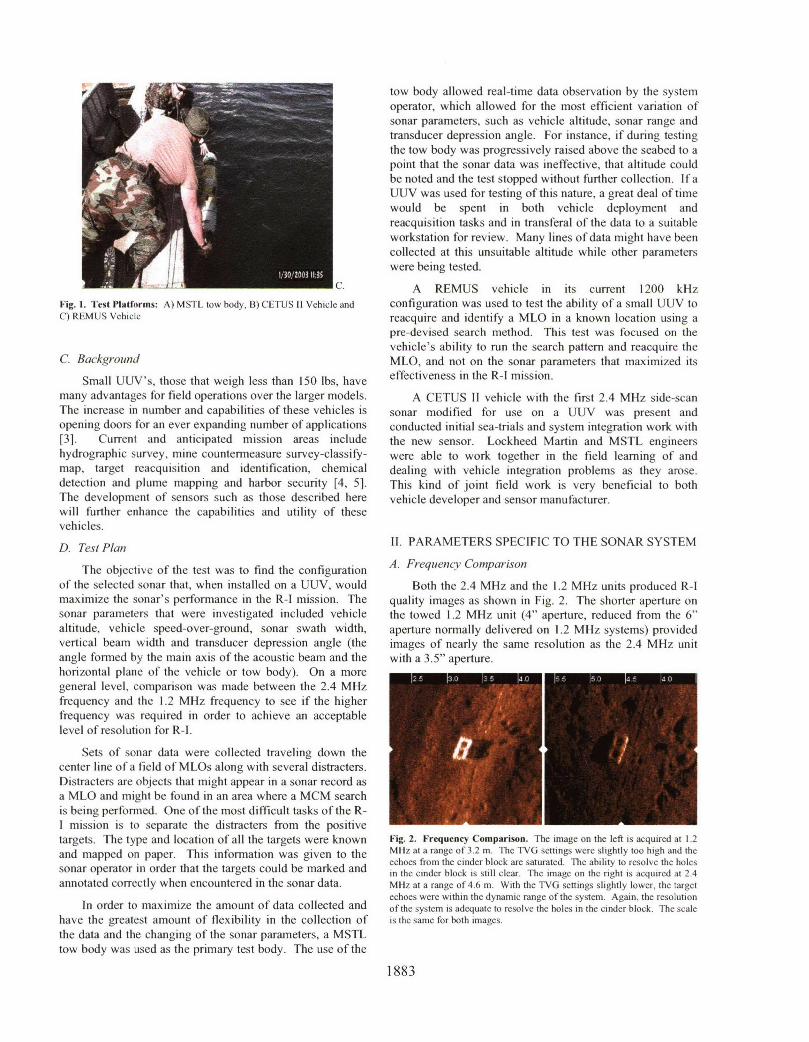
of the selected sonar that, when installed on a UUV, would Both the 2.4 MHz and the 1.2 MHz units produced R-Imaximize the sonar's performance in the R-I mission. The quality images as shown in Fig. 2. The shorter aperture onsonar parameters that were investigated included vehicle the towed 1.2 MHz unit (4" aperture, reduced from the 6"altitude, vehicle speed-over-ground, sonar swath width, aperture normally delivered on 1.2 MHz systems) providedvertical beam width and transducer depression angle (the images of nearly the same resolution as the 2.4 MHz unitangle formed by the main axis of the acoustic beam and the with a 3.5" aperture.horizontal plane of the vehicle or tow body). On a moregeneral level, comparison was made between the 2.4 MHzfrequency and the 1.2 MHz frequency to see if the higherfrequency was required in order to achieve an acceptablelevel of resolution for R-I.
Sets of sonar data were collected traveling down thecenter line of a field of MLOs along with several distracters.Distracters are objects that might appear in a sonar record asa MLO and might be found in an area where a MCM searchis being performed. One of the most difficult tasks of the R-I mission is to separate the distracters from the positivetargets. The type and location of all the targets were known Fig. 2. Frequency Comparison. The image on the left is acquired at 1.2
and mapped on paper. This information was given to the Miz at a range of 3.2 m. The TVG settings were slightly too high and theechoes from the cinder block are saturated. The ability to resolve the holes
sonar operator in order that the targets could be marked and in the cinder block is still clear. The image on the right is acquired at 2.4annotated correctly when encountered in the sonar data. Mllz at a range of 4.6 m. With the TVG settings slightly lower, the target
echoes were within the dynamic range of the system. Again, the resolutionIn order to maximize the amount of data collected and of the system is adequate to resolve the holes in the cinder block. The scalc
have the greatest amount of flexibility in the collection of is the same for both images.the data and the changing of the sonar parameters, a MSTLtow body was used as the primary test body. The use of the
1883
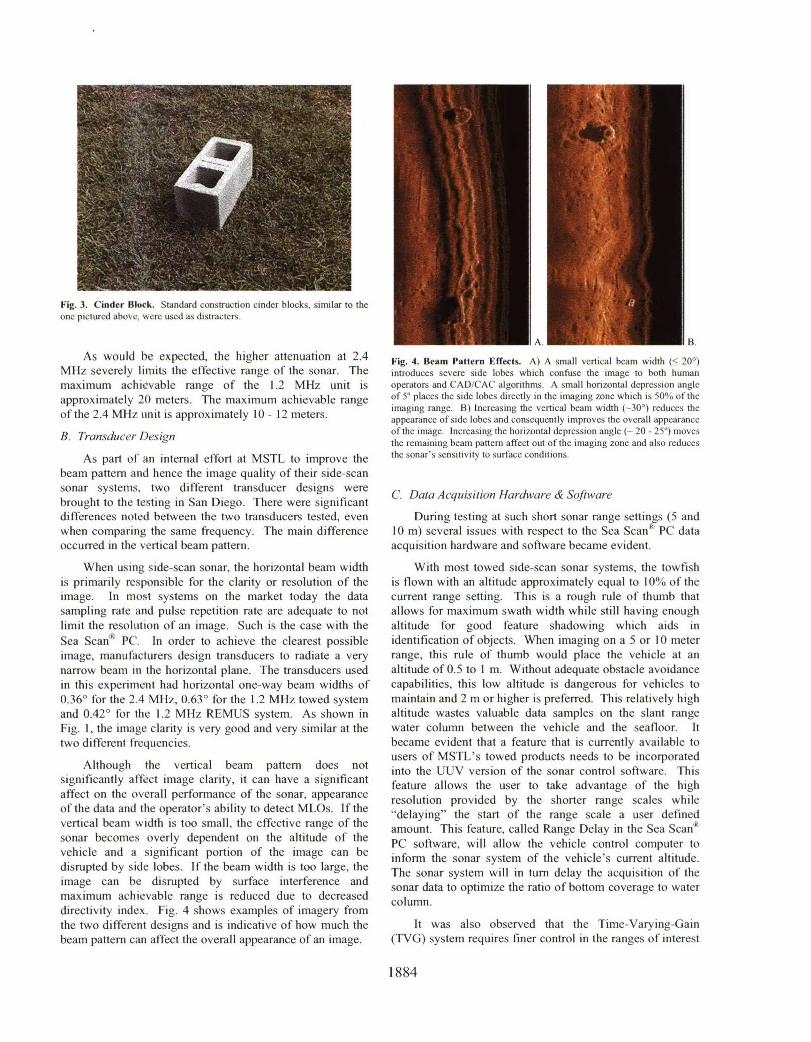
Fig. 3. Cinder Block. Standard construction cinder blocks, similar to theone pictured above, were used as distracters.
A. B.
As would be expected, the higher attenuation at 2.4 Fig. 4. Beam Pattern Effects. A) A small vertical beam width (< 20')MHz severely limits the effective range of the sonar. The introduces severe side lobes which confuse the image to both humanmaximum achievable range of the 1.2 MHz unit is operators and CAD/CAC algorithms. A small horizontal depression angle
approximately 20 meters. The maximum achievable range of 5' places the side lobes directly in the imaging zone which is 50% of theimaging range. B) Increasing the vertical beam width (~30') reduces theof the 2.4 Mltz unit is approximately 10 - 12 meters. appearance of side lobes and consequently improves the overall appearance
B. Transducer Design of the image. Increasing the horizontal depression angle (- 20 - 250) movesthe remaining beam pattern affect out of the imaging zone and also reduces
As part of an internal effort at MSTL to improve the the sonar's sensitivity to surface conditions.
beam pattern and hence the image quality of their side-scansonar systems, two different transducer designs were C. Data Acquisition Hardware & Softwarebrought to the testing in San Diego. There were significantdifferences noted between the two transducers tested, even During testing at such short sonar range settings (5 andwhen comparing the same frequency. The main difference 10 m) several issues with respect to the Sea Scanj" PC dataoccurred in the vertical beam pattern. acquisition hardware and software became evident.
When using side-scan sonar, the horizontal beam width With most towed side-scan sonar systems, the towfishis primarily responsible for the clarity or resolution of the is flown with an altitude approximately equal to 10% of theimage. In most systems on the market today the data current range setting. This is a rough rule of thumb thatsampling rate and pulse repetition rate are adequate to not allows for maximum swath width while still having enoughlimit the resolution of an image. Such is the case with the altitude for good feature shadowing which aids inSea Scan"ý` PC. In order to achieve the clearest possible identification of objects. When imaging on a 5 or 10 meterimage, manufacturers design transducers to radiate a very range, this rule of thumb would place the vehicle at annarrow beam in the horizontal plane. The transducers used altitude of 0.5 to I m. Without adequate obstacle avoidancein this experiment had horizontal one-way beam widths of capabilities, this low altitude is dangerous for vehicles to0.36' for the 2.4 MHz, 0.63' for the 1.2 MHz towed system maintain and 2 m or higher is preferred. This relatively highand 0.42' for the 1.2 MHz REMUS system. As shown in altitude wastes valuable data samples on the slant rangeFig. 1, the image clarity is very good and very similar at the water column between the vehicle and the seafloor. Ittwo different frequencies. became evident that a feature that is currently available to
users of MSTL's towed products needs to be incorporatedAlthough the vertical beam pattern does not into the UUV version of the sonar control software. This
significantly affect image clarity, it can have a significant feature allows the user to take advantage of the highaffect on the overall performance of the sonar, appearance resolution provided by the shorter range scales while
of the data and the operator's ability to detect MLOs. If the r'delaying" the start of the range scale a user defined
vertical beam width is too small, the effective range of the amount. This feature, called Range Delay in the Sea Scane'
sonar becomes overly dependent on the altitude of the PC software, will allow the vehicle control computer to
vehicle and a significant portion of the image can be inform the sonar system of the vehicle's current altitude.
disrupted by side lobes. If the beam width is too large, the The sonar system will in turn delay the acquisition of the
image can be disrupted by surface interference and sonar data to optimize the ratio of bottom coverage to water
maximum achievable range is reduced due to decreased column.
directivity index. Fig. 4 shows examples of imagery from
the two different designs and is indicative of how much the It was also observed that the Time-Varying-Gainbeam pattern can affect the overall appearance of an image. (TVG) system requires finer control in the ranges of interest
1884

during the R-! mission. The Sea Scan'k PC TVG system is supplies, motor controllers, high current transients on motordesigned such that the user has the finest amount of control cables and the motors themselves on the high frequencyclosest to the towfish. The amount of slant range signal end. On the low frequency end acoustic positioningmodified by each TVG control point increases with range by systems, acoustic communications and occasionally vehiclea power of 2. For example, the first control point is at 0 m, structural vibrations can cause noise in the sonar system.the second is at 2 m, and the rest follow at the 4, 8, 16, 32, Design considerations such as the electro-magnetic64, 128, and 256 m ranges. When the system is used on the shielding that a housing provides, the amount of current5 and 10 meter range scales, only three and four TVG allowed in switching transients, the selection of electroniccontrol points affect the image respectively. This results in components that use switching technology and the type ofrapid changes to the TVG at the control points and cabling used within a vehicle and a sensor can all greatlysubsequent unnatural changes in the intensity of the bottom reduce the amount of noise interference experienced by theback scatter observed in the image. system. Even the proximity of sensor components relative
to vehicle components can play a significant role.It was also observed that it would be beneficial to
increase the amount of data samples collected per channel to For example, the initial installation of the 2.4 MHz1024 from the current 512. This would improve the range side-scan system aboard the CETUS I1 vehicle resulted in aresolution of the system by a factor of 2. This is a software total "'blanking" of the image when the vehicle thrusterschange only and is currently being implemented for testing were turned on, as shown in Fig. 5. When the thrusters wereat MSTL. disabled, a usable image was obtained.
III. VEHICLE INTEGRATION ISSUES
One of the key issues in evaluation of the side-scansonar systems is the ability for them to function effectivelyon the UUV platforms of interest. As these are new sonarsystems, the vehicle integration issues are only now beingworked out.
A. Transducer Depression Angle
The transducer depression angle (the angle between theacoustic axis of the transducer and horizontal plane withrespect to the vehicle) is an important parameter to beconsidered when using side-scan sonar. This depressionangle affects sonar performance aspects such as maximum A.
achievable range, target echo strength, location andvisibility of transducer side lobes in the imagery andartifacts in the image due to surface scattering in shallowwater. The reduction in maximum achievable range is notimportant in the R-I mission due to the fact that the imagingrange will most likely be shorter than the maximum range ofthe sonar. The requirement for high resolution dictates theshort imaging range. Due to the short ranges and relativelyhigh altitudes required for the R-I mission, a highdepression angle of 20-30" was determined to provide thebest images. It was found that this high "angle of attack"did not adversely affect the targets echo strength and stillprovided good shadows for aid in target identification. Thewider vertical beam width (30') is necessary in thisconfiguration for overall image clarity. B.
B. Vehicle InterIerence Fig. 5. Vehicle Noise. A) This image shows the interference received bythe side-scan upon first installation of the sonar into the CETUS It vehicle.
Anytime a sensor is installed into a UUV, there are The noise was associated with the thrusters. B) With the thrusters disabled
significant vehicle integration issues in regards to noise and the vehicle temporarily converted to a towed system, usable side-scan
interference in the sonar record that must be considered. data was obtained as evidenced by the school of fish imaged on the right
Typically, these noise interference issues become more channel. Many times, dealing with noise interference in UUV's is like
problematic as the frequency of interest increases. The pealing back the layers of an onion. Once an offending noise source isfound and dealt with, another becomes visible. In B, high frequency
design of the vehicle and sensor can both play a role in the interference probably from a DC/DC converter in the vehicle is visible atsusceptibility of the overall system to noise interference, the outer edge ofboth channels.
Hardware systems aboard the vehicle that are commonsources of noise are DC/DC converters used in power
1885
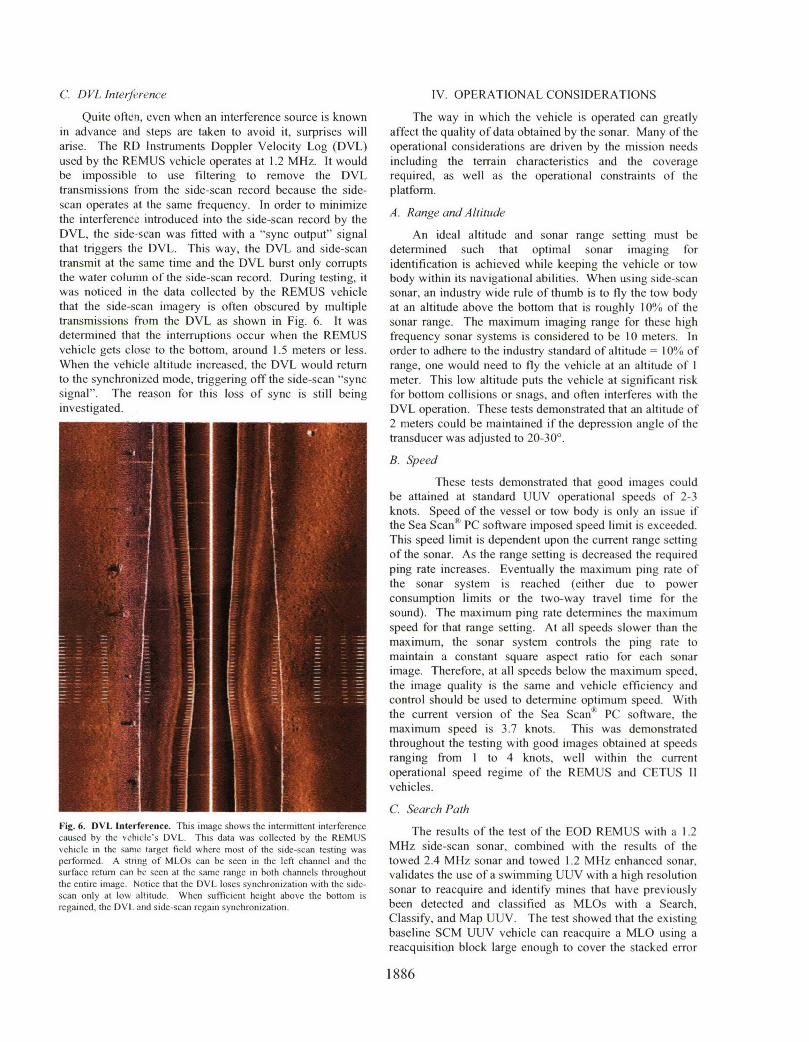
C. DVL Interlerence IV. OPERATIONAL CONSIDERATIONS
Quite often, even when an interference source is known The way in which the vehicle is operated can greatlyin advance and steps are taken to avoid it, surprises will affect the quality of data obtained by the sonar. Many of thearise. The RD Instruments Doppler Velocity Log (DVL) operational considerations are driven by the mission needsused by the REMUS vehicle operates at 1.2 MHz. It would including the terrain characteristics and the coveragebe impossible to use filtering to remove the DVL required, as well as the operational constraints of thetransmissions from the side-scan record because the side- platform.scan operates at the same frequency. In order to minimizethe interference introduced into the side-scan record by theDVL, the side-scan was fitted with a "sync output" signal An ideal altitude and sonar range setting must bethat triggers the DVL. This way, the DVL and side-scan determined such that optimal sonar imaging fortransmit at the same time and the DVL burst only corrupts identification is achieved while keeping the vehicle or towthe water column of the side-scan record. During testing, it body within its navigational abilities. When using side-scanwas noticed in the data collected by the REMUS vehicle sonar, an industry wide rule of thumb is to fly the tow bodythat the side-scan imagery is often obscured by multiple at an altitude above the bottom that is roughly 10% of thetransmissions from the DVL as shown in Fig. 6. It was sonar range. The maximum imaging range for these highdetermined that the interruptions occur when the REMUS frequency sonar systems is considered to be 10 meters. Invehicle gets close to the bottom, around 1.5 meters or less. order to adhere to the industry standard of altitude = 10% ofWhen the vehicle altitude increased, the DVL would return range, one would need to fly the vehicle at an altitude of Ito the synchronized mode, triggering off the side-scan "sync meter. This low altitude puts the vehicle at significant risksignal". The reason for this loss of sync is still being for bottom collisions or snags, and often interferes with theinvestigated. DVL operation. These tests demonstrated that an altitude of
2 meters could be maintained if the depression angle of thetransducer was adjusted to 20-30'.
B. Speed
These tests demonstrated that good images couldbe attained at standard UUV operational speeds of 2-3knots. Speed of the vessel or tow body is only an issue ifthe Sea Scan* PC software imposed speed limit is exceeded.This speed limit is dependent upon the current range settingof the sonar. As the range setting is decreased the requiredping rate increases. Eventually the maximum ping rate ofthe sonar system is reached (either due to powerconsumption limits or the two-way travel time for thesound). The maximum ping rate determines the maximumspeed for that range setting. At all speeds slower than themaximum, the sonar system controls the ping rate tomaintain a constant square aspect ratio for each sonarimage. Therefore, at all speeds below the maximum speed,the image quality is the same and vehicle efficiency andcontrol should be used to determine optimum speed. Withthe current version of the Sea Scant PC software, themaximum speed is 3.7 knots. This was demonstratedthroughout the testing with good images obtained at speedsranging from I to 4 knots, well within the currentoperational speed regime of the REMUS and CETUS IIvehicles.
C. Search PathFig. 6. DVL Interference. This image shows the intermittent interference The results of the test of the EOD REMUS with a 1.2caused by the vehicle's DVL. This data was collected by the REMUSvehicle in the samc target field where most of the side-scan testing was MHz side-scan sonar, combined with the results of theperformed- A string of MLOs can be seen in the left channel and the towed 2.4 MHz sonar and towed 1 .2 MHz enhanced sonar,surface return can he seen at the same range in both channels throughout validates the use of a swimming UUV with a high resolutionthe entire image. Notice that the DVL loses synchronization with the side-scan only at low altitude. When sufficient height above the bottom is sonar to reacquire and identify mines that have previouslyregained, the DVL and side-scan regain synchronization. been detected and classified as MLOs with a Search,
Classify, and Map UUV. The test showed that the existingbaseline SCM UUV vehicle can reacquire a MLO using areacquisition block large enough to cover the stacked error
1886
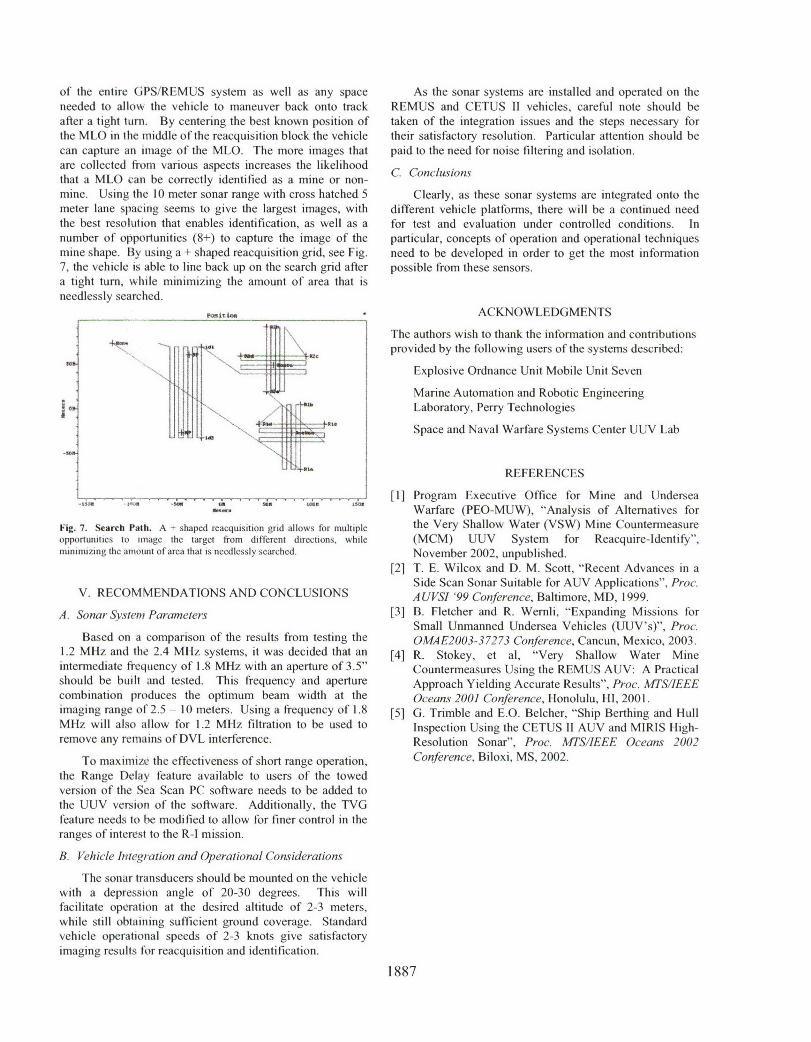
of the entire GPS/REMUS system as well as any space As the sonar systems are installed and operated on theneeded to allow the vehicle to maneuver back onto track REMUS and CETUS II vehicles, careful note should beafter a tight turn. By centering the best known position of taken of the integration issues and the steps necessary forthe MLO in the middle of the reacquisition block the vehicle their satisfactory resolution. Particular attention should becan capture an image of the MLO. The more images that paid to the need for noise filtering and isolation.are collected from various aspects increases the likelihood C Conclusionsthat a MLO can be correctly identified as a mine or non-mine. Using the 10 meter sonar range with cross hatched 5 Clearly, as these sonar systems are integrated onto themeter lane spacing seems to give the largest images, with different vehicle platforms, there will be a continued needthe best resolution that enables identification, as well as a for test and evaluation under controlled conditions. Innumber of opportunities (8+) to capture the image of the particular, concepts of operation and operational techniquesmine shape. By using a + shaped reacquisition grid, see Fig. need to be developed in order to get the most information7, the vehicle is able to line back up on the search grid after possible from these sensors.a tight turn, while minimizing the amount of area that isneedlessly searched.
ACKNOWLEDGMENTS
The authors wish to thank the information and contributions"provided by the following users of the systems described:
Explosive Ordnance Unit Mobile Unit Seven
Marine Automation and Robotic EngineeringijF[] Laboratory, Perry Technologies
Space and Naval Warfare Systems Center UUV Lab
"REFERENCES
[1] Program Executive Office for Mine and Undersea,-- Warfare (PEO-MUW), "'Analysis of Alternatives for
Fig. 7. Search Path. A + shaped reacquisition grid allows for multiple the Very Shallow Water (VSW) Mine Countermeasureopportunities to image the target from different directions, while (MCM) UUV System for Reacquire-Identify",minimizing the amount of area that is needlessly searched. November 2002, unpublished.
[2] T. E. Wilcox and D. M. Scott, "Recent Advances in aSide Scan Sonar Suitable for AUV Applications", Proc.
V. RECOMMENDATIONS AND CONCLUSIONS A UVSI '99 Conference, Baltimore, MD, 1999.
A. Sonar System Parameters [3] B. Fletcher and R. Wernli, "Expanding Missions forSmall Unmanned Undersea Vehicles (UUV's)", Proc.
Based on a comparison of the results from testing the OMAE2003-37273 Conference, Cancun, Mexico, 2003.1.2 MHz and the 2.4 MHz systems, it was decided that an [4] R. Stokey, et al, "Very Shallow Water Mineintermediate frequency of 1.8 MHz with an aperture of 3.5" Countermeasures Using the REMUS AUV: A Practicalshould be built and tested. This frequency and aperture Approach Yielding Accurate Results", Proc. MTS/IEEEcombination produces the optimum beam width at the Oceans 2001 Con/erence, Honolulu, HI, 2001.imaging range of 2.5 - 10 meters. Using a frequency of 1.8 [5] G. Trimble and E.O. Belcher, "Ship Berthing and Hull
MHz will also allow for 1.2 MHz filtration to be used to Inspection Using the CETUS II AUV and MIRIS High-remove any remains of DVL interference. Resolution Sonar", Proc. MTS/IEEE Oceans 2002
To maximize the effectiveness of short range operation, Conference, Biloxi, MS, 2002.
the Range Delay feature available to users of the towedversion of the Sea Scan PC software needs to be added tothe UUV version of the software. Additionally, the TVGfeature needs to be modified to allow for finer control in theranges of interest to the R-I mission.
B. Vehicle Integration and Operational Considerations
The sonar transducers should be mounted on the vehiclewith a depression angle of 20-30 degrees. This willfacilitate operation at the desired altitude of 2-3 meters,while still obtaining sufficient ground coverage. Standardvehicle operational speeds of 2-3 knots give satisfactoryimaging results for reacquisition and identification.
1887