form 8-k - about schwab€¦ · form 8-k current report ... appearing in this current report on...
TRANSCRIPT

UNITED STATES SECURITIES AND EXCHANGE COMMISSION
Washington, D.C. 20549
FORM 8-K
CURRENT REPORT Pursuant to Section 13 or 15(d) of The Securities Exchange Act of 1934
Date of Report (Date of earliest event reported): June 24, 2013
The Charles Schwab Corporation
(Exact name of registrant as specified in its charter)
Commission File Number: 1-9700
211 Main Street, San Francisco, CA 94105
(Address of principal executive offices, including zip code)
(415) 667-7000 (Registrant’s telephone number, including area code)
N/A (Former name or former address, if changed since last report)
Check the appropriate box below if the Form 8-K filing is intended to simultaneously satisfy the filing obligation of the registrant under any of the following provisions:
Delaware 94-3025021(State or other jurisdiction
of incorporation)(I.R.S. Employer
Identification No.)
� Written communications pursuant to Rule 425 under the Securities Act (17 CFR 230.425)
� Soliciting material pursuant to Rule 14a-12 under the Exchange Act (17 CFR 240.14a-12)
� Pre-commencement communications pursuant to Rule 14d-2(b) under the Exchange Act (17 CFR 240.14d-2(b))
� Pre-commencement communications pursuant to Rule 13e-4(c) under the Exchange Act (17 CFR 240.13e-4(c))

The Charles Schwab Corporation (the Company) is filing this Current Report on Form 8-K for the purpose of conforming certain of its historical segment information to reflect the realignment of the Company’s reportable segments as a result of organizational changes. The segment formerly reported as Institutional Services was renamed to Advisor Services. Additionally, the Retirement Plan Services and Corporate Brokerage Services business units are now part of the Investor Services segment. These segment changes were made in the first quarter of 2013 and reflect the manner in which the Company currently manages its business.
This Current Report on Form 8-K updates the following items in the Company’s Annual Report on Form 10-K for the year ended December 31, 2012, to reflect the segment change:
Form 10-K:
Item 1. Business
Item 7. Management’s Discussion and Analysis of Financial Condition and Results of Operations
Item 8. Financial Statements and Supplementary Data (revisions to Notes 9 and 25)
All updates to the Company’s Annual Report on Form 10-K relate solely to the presentation of segment-specific disclosures on a basis consistent with the current segment reporting structure. These updates have no effect on the Company’s previously reported results of operations, financial position, or cash flows. All other information in the Annual Report on Form 10-K remains unchanged and has not been otherwise updated for events occurring after December 31, 2012. The information in this Current Report on Form 8–K should be read in conjunction with the Company’s Annual Report on Form 10-K for the year ended December 31, 2012, which was filed with the Securities and Exchange Commission (except for the items updated herein).
The information in this Current Report on Form 8-K is deemed incorporated by reference into the Company’s registration statements filed under the Securities Exchange Act of 1933, as amended.
Item 8.01 Other Events
Item 9.01 Financial Statements and Exhibits
(d) Exhibits
23.1 Consent of Independent Registered Public Accounting Firm.
99.1
From The Charles Schwab Corporation Annual Report on Form 10-K for the year ended December 31, 2012: “Part I – Item 1. Business,” “Part II – Item 7. Management’s Discussion and Analysis of Financial Condition and Results of Operations,” and “Part II – Item 8. Financial Statements and Supplementary Data (revisions to Notes 9 and 25).”
101.INS XBRL Instance Document
101.SCH XBRL Taxonomy Extension Schema
101.CAL XBRL Taxonomy Extension Calculation
101.DEF XBRL Extension Definition
101.LAB XBRL Taxonomy Extension Label
101.PRE XBRL Taxonomy Extension Presentation

Signature(s)
Pursuant to the requirements of the Securities Exchange Act of 1934, the registrant has duly caused this report to be signed on itsbehalf by the undersigned hereunto duly authorized.
THE CHARLES SCHWAB CORPORATION
Date: June 24, 2013 By: /s/ Joseph R. Martinetto
Joseph R. Martinetto
Executive Vice President and Chief Financial Officer

Exhibit Index
Exhibit No. Description
23.1 Consent of Independent Registered Public Accounting Firm.
99.1
From The Charles Schwab Corporation Annual Report on Form 10-K for the year ended December 31, 2012: “Part I – Item 1. Business,” “Part II – Item 7. Management’s Discussion and Analysis of Financial Condition and Results of Operations,” and “Part II – Item 8. Financial Statements and Supplementary Data (revisions to Notes 9 and 25).”
101.INS XBRL Instance Document
101.SCH XBRL Taxonomy Extension Schema
101.CAL XBRL Taxonomy Extension Calculation
101.DEF XBRL Extension Definition
101.LAB XBRL Taxonomy Extension Label
101.PRE XBRL Taxonomy Extension Presentation

THE CHARLES SCHWAB CORPORATION
EXHIBIT 23.1
CONSENT OF INDEPENDENT REGISTERED PUBLIC ACCOUNTING FIRM
We consent to the incorporation by reference in the following Registration Statements of our report dated February 21, 2013, except for Notes 9 and 25, as to which the date is June 24, 2013, relating to the consolidated financial statements and financial statement schedule of The Charles Schwab Corporation and the effectiveness of The Charles Schwab Corporation’s internal control over financial reporting, appearing in this Current Report on Form 8-K.
Filed on Form S-3:
Registration Statement No. 333-178525
(Debt Securities, Preferred Stock, Depository Shares, Common Stock, Purchase Contracts, Warrants, and Units Consisting of Two or More Securities)
Filed on Form S-4:
Registration Statement No. 333-184654 (Offer to Exchange 3.225% Senior Notes due 2022)
Filed on Form S-8:
Registration Statement No. 333-175862 (The Charles Schwab Corporation 2004 Stock Incentive Plan)
Registration Statement No. 333-173635
(optionsXpress Holdings, Inc. 2008 Equity Incentive Plan, optionsXpress Holdings, Inc. 2005 Equity Incentive Plan, and optionsXpress, Inc. 2001 Equity Incentive Plan)
Registration Statement No. 333-144303 (The Charles Schwab Corporation Employee Stock Purchase Plan)
Registration Statement No. 333-131502 (The Charles Schwab Corporation Deferred Compensation Plan II)
Registration Statement No. 333-101992 (The Charles Schwab Corporation 2004 Stock Incentive Plan)
Registration Statement No. 333-93125 (The Charles Schwab Corporation Employee Stock Incentive Plan)
Registration Statement No. 333-81840 (The Charles Schwab Corporation Employee Stock Incentive Plan)
Registration Statement No. 333-71322 (The SchwabPlan Retirement Savings and Investment Plan)
Registration Statement No. 333-63452 (The Charles Schwab Corporation Employee Stock Incentive Plan)
Registration Statement No. 333-63448 (The Charles Schwab Corporation 2004 Stock Incentive Plan)
Registration Statement No. 333-59280 (The Charles Schwab Corporation Employee Stock Incentive Plan)
Registration Statement No. 333-48335 (The Charles Schwab Corporation Employee Stock Incentive Plan)
Registration Statement No. 333-47107 (The Charles Schwab Corporation 2004 Stock Incentive Plan)
Registration Statement No. 333-44793 (Charles Schwab Profit Sharing and Employee Stock Ownership Plan)
/s/ Deloitte & Touche LLP
San Francisco, California
June 24, 2013
THE CHARLES SCHWAB CORPORATION
EXHIBIT 99.1
General Corporate Overview
The Charles Schwab Corporation (CSC), headquartered in San Francisco, California, was incorporated in 1986 and engages, through its subsidiaries (together referred to as the Company, and primarily located in San Francisco except as indicated), in securities brokerage, banking, money management, and financial advisory services. At December 31, 2012, the Company had $1.95 trillion in client assets, 8.8 million active brokerage accounts , 1.6 million corporate retirement plan participants, and 865,000 banking accounts.
Significant business subsidiaries of CSC include:
The Company provides financial services to individuals and institutional clients through two segments – Investor Services and Advisor Services. In the first quarter of 2013, the Company realigned its reportable segments as a result of organizational changes. The segment formerly reported as Institutional Services was renamed to Advisor Services. Additionally, the Retirement Plan Services and Corporate Brokerage Services business units are now part of the Investor Services segment. Previously reported segment information has been revised to reflect these organizational changes. The Investor Services segment provides retail brokerage and banking services to individual investors, retirement plan services, and corporate brokerage services. The Advisor Services segment provides custodial, trading, and support services to independent investment advisors (IAs), and retirement business services to independent retirement plan advisors and recordkeepers whose plan assets are held at Schwab Bank. For financial information by segment for the three years ended December 31, 2012, see “Item 8 – Financial Statements and Supplementary Data – Notes to Consolidated Financial Statements – 25. Segment Information.”
As of December 31, 2012, the Company had full-time, part-time and temporary employees, and persons employed on a contract basis that represented the equivalent of about 13,800 full-time employees.
Business Acquisitions
On December 14, 2012, the Company acquired ThomasPartners, Inc., a growth and dividend income-focused asset management firm.
In September 2011, the Company acquired optionsXpress Holdings, Inc. (optionsXpress), an online brokerage firm primarily focused on equity option securities and futures. The optionsXpress brokerage platform provides active investors and traders trading tools, analytics and education to execute a variety of investment strategies. optionsXpress, Inc., a wholly-owned subsidiary of optionsXpress, is a securities broker-dealer.
In November 2010, the Company acquired substantially all of the assets of Windward Investment Management, Inc. (Windward), an investment advisory firm that managed diversified investment portfolios comprised primarily of exchange-traded fund securities. As a result of the acquisition, Windhaven Investment Management, Inc. (Windhaven) was formed as a wholly-owned subsidiary of Schwab Holdings, Inc.
- 1 -
Item 1. Business
� Charles Schwab & Co., Inc. (Schwab), which was incorporated in 1971, is a securities broker-dealer with over 300 domestic branch offices in 45 states, as well as a branch in each of the Commonwealth of Puerto Rico and London, U.K., and serves clients in Hong Kong through one of CSC’s subsidiaries;
� Charles Schwab Bank (Schwab Bank), which commenced operations in 2003, is a federal savings bank located in Reno,
Nevada; and
� Charles Schwab Investment Management, Inc. (CSIM), which is the investment advisor for Schwab’s proprietary mutual funds, referred to as the Schwab Funds , and Schwab’s exchange-traded funds, referred to as the Schwab ETFs™.
Accounts with balances or activity within the preceding eight months.
(a)
®
®
(a)

THE CHARLES SCHWAB CORPORATION Business Strategy and Competitive Environment
The Company’s purpose is to champion every client’s goals with passion and integrity, believing that the best long-term strategy is one that puts clients first. Seeing the Company’s business “through clients’ eyes” helps it earn its clients’ trust as the Company strives daily to fulfill its purpose and act according to its values. The Company’s values are to serve its clients in an ethical, empathetic and proactive way; to innovate constantly to improve the client experience; to respect fellow employees and reinforce the power of teamwork; and to be good stewards of the resources entrusted to the Company – client assets, the Company’s brand, and stockholder value.
The Company’s competition in serving individual investors includes a wide range of brokerage, wealth management, and asset management firms, as well as banks and trust companies. In serving these investors and competing for a growing percentage of the investable wealth in the U.S., the Company offers a multi-channel service delivery model, which includes online, mobile, telephonic, and branch capabilities. Under this model, the Company can offer personalized service at competitive prices while giving clients the choice of where, when, and how they do business with the Company. Schwab’s branches and regional telephone service centers are staffed with trained and experienced financial consultants (FCs) focused on building and sustaining client relationships. The Company offers the ability to meet client investing needs through a single ongoing point of contact, even as those needs change over time. In particular, management believes that the Company’s ability to provide those clients seeking help, guidance, or advice with an integrated, individually tailored solution – ranging from occasional consultations to an ongoing relationship with a Schwab FC or an IA – is a competitive strength compared to the more fragmented offerings of other firms.
The Company’s online, mobile, and telephonic channels provide quick and efficient access to an extensive array of information, research, tools, trade execution, and administrative services, which clients can access according to their needs. For example, clients that trade more actively can use these channels to access highly competitive pricing, expert tools, and extensive service capabilities – including experienced, knowledgeable teams of trading specialists and integrated product offerings. Individuals investing for retirement through 401(k) plans can take advantage of the Company’s bundled offering of multiple investment choices, education, and third-party advice. Management also believes the Company is able to compete with the wide variety of financial services firms striving to attract individual client relationships by complementing these capabilities with the extensive array of investment, banking, and lending products and services described in the following section.
In the IA arena, the Company competes with institutional custodians, traditional and discount brokers, banks, investment advisory firms, and trust companies. Management believes that its Advisor Services segment can maintain its market leadership position primarily through the efforts of its expanded sales and support teams, which are dedicated to helping IAs grow, compete, and succeed in serving their clients. In addition to focusing on superior service, Advisor Services competes by utilizing technology to provide IAs with a highly-developed, scalable platform for administering their clients’ assets easily and efficiently. Advisor Services sponsors a variety of national, regional, and local events designed to help IAs identify and implement better ways to grow and manage their practices efficiently.
Another important aspect of the Company’s ability to compete is its ongoing focus on efficiency and productivity, as lower costs give the Company greater flexibility in its approach to pricing and investing for growth. Management believes that this flexibility remains important in light of the competitive environment, in which a number of competitors offer reduced online trading commission rates and low expense ratios on certain classes of mutual funds and exchange-traded funds. Additionally, the Company’s nationwide marketing effort is an important competitive tool because it reinforces the attributes of the Schwab brand.
Products and Services
The Company offers a broad range of products to address individuals’ varying investment and financial needs. Examples of these product offerings include:
- 2 -
� Brokerage – an array of brokerage accounts including some with check-writing features, debit card, and billpay; individual retirement accounts; retirement plans for small to large businesses; 529 college savings accounts; designated brokerage accounts; equity incentive plan accounts; and margin loans, as well as access to fixed income securities, equity and debt offerings, options, and futures;
®

THE CHARLES SCHWAB CORPORATION
These products, and the Company’s full array of investing services, are made available through its two segments – Investor Services and Advisor Services. The Company’s major sources of revenues are generated by both of the Company’s reportable segments. Revenue is attributable to a reportable segment based on which segment has the primary responsibility for serving the client. The accounting policies of the Company’s reportable segments are the same as those described in “Item 8 – Financial Statements and Supplementary Data – Notes to Consolidated Financial Statements – 2. Summary of Significant Accounting Policies.”
Investor Services
Through the Investor Services segment, the Company provides retail brokerage and banking services to individual investors.
The Company offers research, analytic tools, performance reports, market analysis, and educational material to all clients. Clients looking for more guidance have access to online portfolio planning tools, professional advice from Schwab’s portfolio consultants who can help develop an investment strategy and carry out investment and portfolio management decisions, as well as a range of fully delegated managed solutions that provide ongoing portfolio management.
Schwab strives to demystify investing by educating and assisting clients in the development of investment plans. Educational tools include workshops, interactive courses, and online information about investing, which Schwab does not earn revenue from. Additionally, Schwab provides various internet-based research and analysis tools that are designed to help clients achieve better investment outcomes. As an example of such tools, Schwab Equity Ratings is a quantitative model-based stock rating system that provides all clients with ratings on approximately 3,000 stocks, assigning each equity a single grade: A, B, C, D, or F. Schwab Equity Ratings International , an international ranking methodology, covers approximately 4,000 stocks in 28 foreign equity markets. Stocks are rated based on specific factors relating to fundamentals, valuation, momentum, and risk and ranked so that the number of ‘buy consideration’ ratings – As and Bs – equals the number of ‘sell consideration’ ratings – Ds and Fs.
Clients may need specific investment recommendations, either from time to time or on an ongoing basis. The Company provides clients seeking advice with customized solutions. The Company’s approach to advice is based on long-term investment strategies and guidance on portfolio diversification and asset allocation. This approach is designed to be offered consistently across all of Schwab’s delivery channels.
Schwab Private Client features a personal advice relationship with a designated portfolio consultant, supported by a team of investment professionals who provide individualized service, a customized investment strategy developed in collaboration with the client, and ongoing guidance and execution.
For clients seeking a relationship in which investment decisions are fully delegated to a financial professional, the Company offers several alternatives. The Company provides investors access to professional investment management in a diversified account that is invested exclusively in either mutual funds or ETFs through the Schwab Managed Portfolios and Windhaven programs. The Company also refers investors who want to utilize a specific third-party money manager to direct a portion of their investment assets to the Schwab Managed Account program. In addition, clients who want the assistance of an independent professional in managing their financial affairs may be referred to IAs in the Schwab Advisor Network . These IAs provide personalized portfolio management, financial planning, and wealth management solutions.
- 3 -
� Mutual funds – third-party mutual funds through Mutual Fund Marketplace , including no-load mutual funds through the Mutual Fund OneSource service, proprietary mutual funds from two fund families – Schwab Funds and Laudus Funds , other third-party mutual funds, and mutual fund trading and clearing services to broker-dealers;
� Exchange-traded funds (ETFs) – third-party and proprietary ETFs, including Schwab ETFs™, and separately managed
portfolios of ETFs;
� Advice solutions – separately managed accounts, customized personal advice for tailored portfolios, and specialized planning and full-time portfolio management;
� Banking – checking accounts linked to brokerage accounts, savings accounts, certificates of deposit, demand deposit accounts, first lien residential real estate mortgage loans (First Mortgages), home equity lines of credit (HELOCs), personal loans collateralized by securities, and entity lending; and
� Trust – trust custody services, personal trust reporting services, and administrative trustee services.
®
® ® ®
®
TM
TM
TM ®
®

THE CHARLES SCHWAB CORPORATION The Company strives to deliver information, education, technology, service, and pricing that meet the specific needs of clients who trade actively. Schwab and optionsXpress, Inc. both offer integrated Web- and software-based trading platforms, which incorporate intelligent order routing technology, real-time market data, options trading, premium stock or futures research, and multi-channel access, as well as sophisticated account and trade management features, risk management tools, decision support tools, and dedicated personal support.
For clients wishing to invest in foreign equities, the Company offers a suite of global investing capabilities, including on-line access to certain foreign equity markets with the ability to trade in their local currencies. In addition, the Company serves both foreign investors and non-English-speaking U.S. clients who wish to trade or invest in U.S. dollar-based securities. In the U.S., the Company serves Chinese-, Spanish-, and Vietnamese-speaking clients through a combination of its branch offices and Web-based and telephonic services.
The Investor Services segment also includes the Retirement Plan Services and Corporate Brokerage Services business units.
Retirement Plan Services offers a bundled 401(k) retirement plan product that provides plan sponsors a wide array of investment options, trustee or custodial services, and participant-level recordkeeping. Plan design features, which increase plan efficiency and achieve employer goals, are also offered, such as automatic enrollment, automatic fund mapping at conversion, and automatic contribution increases. In 2012, the Company launched Schwab Index Advantage , a unique 401(k) plan offer designed to lower costs, simplify investing and help workers better prepare for retirement. Services also include support for Roth 401(k) accounts and profit sharing and defined benefit plans. The Company provides a robust suite of tools to plan sponsors to manage their plans, including plan-specific reports, studies and research, access to legislative updates and benchmarking reports that provide perspective on their plan’s features compared with overall industry and segment-specific plans. Participants in bundled plans serviced by the Company receive targeted education materials, have access to electronic tools and resources, may attend onsite and virtual seminars, and can receive third-party advice delivered by Schwab. This third-party advice service is delivered online, by phone, or in person, including recommendations based on the core investment fund choices in their retirement plan and specific recommended savings rates.
Corporate Brokerage Services provides specialty brokerage-related services to corporate clients through its Stock Plan Services, Compliance Solutions (formerly Designated Brokerage Services), and Corporate Brokerage Retirement Services (part of the former Retirement Business Services business unit) businesses. Stock Plan Services offers equity compensation plan sponsors full-service recordkeeping for stock plans: stock options, restricted stock, performance shares and stock appreciation rights. Specialized services for executive transactions and reporting, grant acceptance tracking and other services are offered to employers to meet the needs of administering the reporting and compliance aspects of an equity compensation plan. Compliance Solutions provides solutions for compliance departments of regulated companies and firms with special requirements to monitor employee personal trading, including trade surveillance technology. Corporate Brokerage Retirement Services serves independent recordkeepers seeking a custodian for retirement plan assets. Schwab provides custody services tailored for retirement plans seeking a low-cost solution. Plans held at Schwab are either self-trusteed or trusteed by a separate, independent trustee. Corporate Brokerage Retirement Services also offers theSchwab Personal Choice Retirement Account , a self-directed brokerage offering for retirement plans and the Company Retirement Account, a brokerage account designed to hold the assets of an individually designed business retirement plan.
The Corporate Brokerage Services unit also provides mutual fund clearing services to banks, brokerage firms and trust companies and offers proprietary mutual funds, ETFs, collective trust funds, and investment management outside the Company to institutional channels.
Advisor Services
Through the Advisor Services segment, the Company provides custodial, trading, technology, practice management, trust asset, and other support services to IAs.
To attract and serve IAs, the Company has a dedicated sales force and service teams assigned to meet their needs. IAs who custody client accounts at Schwab may use proprietary software that provides them with up-to-date client account information, as well as trading capabilities. The Advisor Services website is the core platform for IAs to conduct daily
- 4 -
®
®

THE CHARLES SCHWAB CORPORATION business activities online with Schwab, including submitting client account information and retrieving news and market information. This platform provides IAs with a comprehensive suite of electronic and paper-based reporting capabilities. The Company offers online cashiering services, as well as internet-based eDocuments sites for both IAs and their clients that provide multi-year archiving of online statements, trade confirms and tax reports, along with document search capabilities.
To help IAs grow and manage their practices, the Company offers a variety of services, including marketing and business development, business strategy and planning, and transition support. Regulatory compliance consulting and support services are available, as well as website design and development capabilities. The Company maintains a website that provides interactive tools, educational content, and research reports to assist advisors thinking about establishing their own independent practices.
The Company offers an array of services to help advisors establish their own independent practices through the Business Start-up Solutions package. This includes access to dedicated service teams and outsourcing of back-office operations, as well as third-party firms who provide assistance with real estate, errors and omissions insurance, and company benefits.
The Company offers a variety of educational materials and events to IAs seeking to expand their knowledge of industry issues and trends, as well as sharpen their individual expertise and practice management skills. The Company updates and shares market research on an ongoing basis, and it holds a series of events and conferences every year to discuss topics of interest to IAs, including business strategies and best practices. The Company sponsors the annual IMPACT conference, which provides a national forum for the Company, IAs, and other industry participants to gather and share information and insights.
IAs and their clients have access to a broad range of the Company’s products and services, including individual securities, mutual funds, ETFs, managed accounts, and cash products.
The Advisor Services segment also includes the Retirement Business Services Trust business unit (part of the former Retirement Business Services business unit). Retirement Business Services Trust provides retirement business services to independent retirement plan advisors and recordkeepers whose plan assets are held at Schwab Bank. The Company and independent retirement plan providers work together to serve plan sponsors, combining the consulting and administrative expertise of the administrator with the Company’s investment, technology, trust, and custodial services. Retirement Business Services Trust also offers the Schwab Personal Choice Retirement Account for retirement plans.
Regulation
CSC is a savings and loan holding company and Schwab Bank, CSC’s depository institution subsidiary, is a federal savings bank. CSC is subject to supervision and regulation by the Board of Governors of the Federal Reserve System (the Federal Reserve) and Schwab Bank is subject to supervision and regulation by the Office of the Comptroller of the Currency (OCC). CSC is currently not subject to specific statutory capital requirements, however CSC is required to serve as a source of strength for Schwab Bank. Under the “Dodd-Frank Wall Street Reform and Consumer Protection Act” (the Dodd-Frank Act), CSC will be subject to new minimum leverage and minimum risk-based capital ratio requirements that will be set by the Federal Reserve that are at least as stringent as the current requirements generally applicable to insured depository institutions.
Schwab Bank is subject to regulation and supervision and to various requirements and restrictions under federal and state laws, including regulatory capital guidelines. Among other things, these requirements also restrict and govern the terms of affiliate transactions, such as extensions of credit and repayment of loans between Schwab Bank and CSC or CSC’s other subsidiaries. In addition, Schwab Bank is required to provide notice to and may be required to obtain approval of the OCC and the Federal Reserve to declare dividends to CSC. The federal banking agencies have broad powers to enforce these regulations, including the power to terminate deposit insurance, impose substantial fines and other civil and criminal penalties, and appoint a conservator or receiver. Under the Federal Deposit Insurance Act, Schwab Bank could be subject to restrictive actions if it were to fall within one of the lowest three of five capital categories. Schwab Bank is required to maintain minimum capital levels as specified in federal banking laws and regulations. Failure to meet the minimum levels could result in certain mandatory, and possibly additional discretionary actions by the regulators that, if undertaken, could have a direct material effect on Schwab Bank.
- 5 -
®
®

THE CHARLES SHWAB CORPORATION
The securities industry in the United States is subject to extensive regulation under both federal and state laws. CSC’s principal U.S. broker-dealers are Schwab and optionsXpress, Inc. Schwab is registered as a broker-dealer with the United States Securities and Exchange Commission (SEC), the fifty states, and the District of Columbia and Puerto Rico. optionsXpress, Inc. is registered as a broker-dealer with the SEC, the fifty states, the District of Columbia, Puerto Rico, and the Virgin Islands. Schwab and CSIM are registered as investment advisors with the SEC. Additionally, Schwab and optionsXpress, Inc. are regulated by the Commodities Futures Trading Commission (CFTC) with respect to the commodity futures and commodities trading activities they conduct as an introducing broker and futures commission merchant, respectively.
Much of the regulation of broker-dealers has been delegated to self-regulatory organizations (SROs). Schwab and optionsXpress, Inc. are members of the Financial Industry Regulatory Authority, Inc. (FINRA), the Municipal Securities Rulemaking Board (MSRB), NYSE Arca, and the Chicago Board Options Exchange (CBOE). optionsXpress, Inc. is also a member of other exchanges. The primary regulators of Schwab are FINRA and, for municipal securities, the MSRB. The primary regulators of optionsXpress, Inc. are FINRA, CBOE, and for municipal securities, the MSRB. The National Futures Association (NFA) is Schwab and optionsXpress, Inc.’s primary regulator for futures and commodities trading activities. The Company’s business is also subject to oversight by regulatory bodies in other countries in which the Company operates.
The principal purpose of regulating broker-dealers and investment advisors is the protection of clients and the securities markets. The regulations to which broker-dealers and investment advisors are subject cover all aspects of the securities business, including, among other things, sales and trading practices, publication of research, margin lending, uses and safekeeping of clients’ funds and securities, capital adequacy, recordkeeping and reporting, fee arrangements, disclosure to clients, fiduciary duties owed to advisory clients, and the conduct of directors, officers and employees.
Schwab and optionsXpress, Inc. are both subject to Rule 15c3-1 under the Securities Exchange Act of 1934 (the Uniform Net Capital Rule) and related SRO requirements. The CFTC and NFA also impose net capital requirements. The Uniform Net Capital Rule specifies minimum capital requirements that are intended to ensure the general financial soundness and liquidity of broker-dealers. Because CSC itself is not a registered broker-dealer, it is not subject to the Uniform Net Capital Rule. However, if Schwab fails to maintain specified levels of net capital, such failure would constitute a default by CSC under debt covenants under CSC’s credit agreement.
The Uniform Net Capital Rule limits broker-dealers’ ability to transfer capital to parent companies and other affiliates. Compliance with the Uniform Net Capital Rule could limit Schwab’s operations and its ability to repay subordinated debt to CSC, which in turn could limit CSC’s ability to repay debt, pay cash dividends, and purchase shares of its outstanding stock.
Sources of Net Revenues
The Company’s major sources of net revenues are asset management and administration fees, net interest revenue, and trading revenue. The Company generates asset management and administration fees through its proprietary and third-party mutual fund offerings, as well as fee-based advisory solutions. Net interest revenue is the difference between interest earned on interest-earning assets (such as cash, short- and long-term investments, and mortgage and margin loans) and interest paid on funding sources (including banking deposits and client cash in brokerage accounts and long-term debt). The Company generates trading revenue through commissions earned for executing trades for clients and principal transaction revenue primarily from trading activity in client fixed income securities.
For revenue information by source for the three years ended December 31, 2012, see “Item 7 – Management’s Discussion and Analysis of Financial Condition and Results of Operations – Results of Operations – Net Revenues.”
Available Information
The Company files annual, quarterly, and current reports, proxy statements, and other information with the SEC. The Company’s SEC filings are available to the public over the Internet on the SEC’s website at http://www.sec.gov. You may read and copy any document that the Company files with the SEC at the SEC’s Public Reference Room at 100 F Street, NE, Washington, DC 20549. You may obtain information on the operation of the Public Reference Room by calling the SEC at 1-800-SEC-0330.
- 6 -

THE CHARLES SHWAB CORPORATION
On the Company’s Internet website, http://www.aboutschwab.com, the Company posts the following recent filings as soon as reasonably practicable after they are electronically filed with or furnished to the SEC: the Company’s annual reports on Form 10-K, the Company’s quarterly reports on Form 10-Q, the Company’s current reports on Form 8-K, and any amendments to those reports filed or furnished pursuant to Section 13(a) or 15(d) of the Securities Exchange Act of 1934. All such filings are available free of charge either on the Company’s website or by request via email ([email protected]), telephone (415-667-1959), or mail (Charles Schwab Investor Relations at 211 Main Street, San Francisco, CA 94105).
- 7 -

THE CHARLES SCHWAB CORPORATION Management’s Discussion and Analysis of Financial Condition and Results of Operations
(Tabular Amounts in Millions, Except Ratios, or as Noted)
OVERVIEW
Management of the Company focuses on several key client activity and financial metrics in evaluating the Company’s financial position and operating performance. Results for the years ended December 31, 2012, 2011, and 2010 are:
- 8 -
Item 7. Management’s Discussion and Analysis of Financial Condition and Results of Operations
Year Ended December 31,
Growth Rate1-Year
2011-2012 2012 2011 2010
Client Activity Metrics:
Net new client assets (in billions) (4%) $ 139.7 $ 145.9 $ 26.6 Client assets (in billions, at year end) 16% $ 1,951.6 $ 1,677.7 $ 1,574.5 New brokerage accounts (in thousands) (21%) 900 1,138 829 Active brokerage accounts (in thousands, at year end) 3% 8,787 8,552 7,998
Company Financial Metrics:
Net revenues 4% $ 4,883 $ 4,691 $ 4,248 Expenses excluding interest 4% 3,433 3,299 3,469
Income before taxes on income 4% 1,450 1,392 779 Taxes on income (1%) 522 528 325
Net income 7% $ 928 $ 864 $ 454
Net income available to common stockholders 2% $ 883 $ 864 $ 454 Earnings per common share – diluted (1%) $ .69 $ .70 $ .38 Net revenue growth from prior year 4% 10% 1% Pre-tax profit margin 29.7% 29.7% 18.3% Return on common stockholders’ equity 11% 12% 8% Net revenue per average full-time equivalent employee (in thousands) 1% $ 354 $ 350 $ 337
2012 includes inflows of $27.7 billion from mutual fund clearing services clients and $900 million from the acquisition of ThomasPartners, Inc., and outflows of $1.3 billion from the closure and/or sale of certain subsidiaries of optionsXpress Holdings, Inc. 2011 includes inflows of $56.1 billion from a mutual fund clearing services client and $7.5 billion from the acquisition of optionsXpress. 2010 includes net outflows of $51.5 billion related to the planned deconversion of a mutual fund clearing services client.
2011 includes 315,000 new brokerage accounts from the acquisition of optionsXpress Holdings, Inc. 2012 includes the removal of approximately 19,000 accounts as a result of the sale of certain subsidiaries of optionsXpress and
30,000 accounts due to escheatment and other factors. Calculated as net income available to common stockholders divided by common stockholders’ equity.
• Net new client assets is defined as the total inflows of client cash and securities to the firm less client outflows. Management believes that this metric depicts how well the Company’s products and services appeal to new and existing clients in a given operating environment. Core net new client assets is defined as net new client assets before significant one-time flows.
• Client assets is the market value of all client assets custodied at the Company. Management considers client assets to be
indicative of the Company’s appeal in the marketplace. Additionally, fluctuations in certain components of client assets (e.g., Mutual Fund OneSource funds) directly impact asset management and administration fees.
• New brokerage accounts include all brokerage accounts opened during the period, as well as any accounts added via
acquisition. This metric measures the Company’s effectiveness in attracting new clients and building stronger relationships with existing clients.
• Active brokerage accounts include accounts with balances or activity within the preceding eight months. This metric is an
indicator of the Company’s success in both attracting and retaining clients.
(1)
(2)
(3)
(4)
(1)
(2)
(3)
(4)
THE CHARLES SCHWAB CORPORATION Management’s Discussion and Analysis of Financial Condition and Results of Operations
(Tabular Amounts in Millions, Except Ratios, or as Noted)
The Company’s major sources of net revenues are asset management and administration fees, net interest revenue, and trading revenue. The Company generates asset management and administration fees through its proprietary and third-party mutual fund offerings, as well as fee-based advisory solutions. Net interest revenue is the difference between interest earned on interest-earning assets and interest paid on funding sources. Asset management and administration fees and net interest revenue are impacted by securities valuations, interest rates, the amount and mix of interest-earning assets and interest-bearing funding sources, the Company’s ability to attract new clients, and client activity levels. The Company generates trading revenue through commissions earned for executing trades for clients and principal transaction revenue primarily from trading activity in client fixed income securities. Trading revenue is impacted by trading volumes, the volatility of prices in the equity and fixed income markets, and commission rates.
2012 Compared to 2011
The broad equity markets improved during 2012 compared to 2011, as the Nasdaq Composite Index, Standard & Poor’s 500 Index, and Dow Jones Industrial Average increased 16%, 13%, and 7%, respectively. While the federal funds target rate remained unchanged at a range of zero to 0.25%, the average three-month Treasury Bill yield increased by 4 basis points to 0.08% during 2012 compared to 2011. At the same time, the average 10-year Treasury yield decreased by 98 basis points to 1.78%.
Despite continuing economic and interest rate challenges during the year, the Company’s sustained client focus helped deliver strong key client activity metrics in 2012. While net new client assets decreased slightly by 4% to $139.7 billion in 2012, core net new client assets totaled $112.4 billion, up 37% from $82.3 billion in 2011. Total client assets ended the year at a record $1.95 trillion, up 16% from 2011. In addition, the Company added 900,000 new brokerage accounts to its client base during 2012, and active brokerage accounts reached a record 8.8 million, up 3% from 2011.
Net revenues increased by 4% in 2012 from 2011 primarily due to increases in asset management and administration fees, net interest revenue, and other revenue – net, partially offset by a decrease in trading revenue. Asset management and administration fees increased primarily due to increases in advice solutions fees and other asset management and administration fees. Net interest revenue increased primarily due to higher average balances of interest-earning assets, partially offset by the effect of low overall interest rates and higher amortization of premiums relating to mortgage-backed securities. Other revenue – net increased primarily due to a pre-tax gain of $70 million relating to a confidential resolution of a vendor dispute in the second quarter of 2012. Trading revenue decreased primarily due to lower daily average revenue trades, partially offset by the inclusion of optionsXpress’ trading activity from its acquisition in September 2011.
Expenses excluding interest were higher by 4% in 2012 compared to 2011 primarily due to the inclusion of a full year of optionsXpress’ expenses. Taxes on income in 2012 include a non-recurring state tax benefit of $20 million recorded in the third quarter of 2012. Overall, growth in the Company’s client base and ongoing expense discipline helped the Company increase net income by 7% in 2012 from 2011, and achieve a pre-tax profit margin of 29.7% and return on common stockholders’ equity of 11% in 2012.
2011 Compared to 2010
Economic and market conditions were challenging throughout 2011, marked by volatility in the equity markets, lower market valuations, and further declines in interest rates. The Standard & Poor’s 500 Index, Nasdaq Composite Index, and Dow Jones Industrial Average decreased on average 6%, 5%, and 4%, respectively, between the first and second halves of the year. The federal funds target rate remained unchanged during the year at a range of zero to 0.25% and the average three-month Treasury Bill and average 10-year Treasury yields declined by 8 and 43 basis points to 0.04% and 2.76%, respectively.
- 9 -
• Management believes that earnings per common share, net revenue growth, pre-tax profit margin, and return on common
stockholders’ equity provide broad indicators of the Company’s overall financial health, operating efficiency, and ability to generate acceptable returns within the context of a given operating environment.
• Net revenue per average full-time equivalent employee is considered by management to be the Company’s broadest
measure of productivity.

THE CHARLES SCHWAB CORPORATION Management’s Discussion and Analysis of Financial Condition and Results of Operations
(Tabular Amounts in Millions, Except Ratios, or as Noted) The Company’s key client activity metrics in 2011 were stable in the midst of a weakened economic and market environment. Net new client assets totaled $145.9 billion in 2011. Core net new client assets totaled $82.3 billion in 2011, up 5% from $78.1 billion in 2010. Total client assets ended the year at $1.68 trillion, up 7% from 2010. In addition, the Company added 1.1 million new brokerage accounts to its client base during 2011 and ended the year serving 8.6 million active brokerage accounts.
Net revenues increased by 10% in 2011 from 2010 due to increases in all of the Company’s major sources of net revenues. Asset management and administration fees increased primarily due to an increase in advice solutions fees and continued asset inflows, partially offset by a decrease in net money market mutual fund fees. Net interest revenue increased primarily due to higher average balances of interest-earning assets during the year, partially offset by the effect of lower interest rate spreads resulting from higher amortization of premiums relating to residential mortgage-backed securities caused by higher mortgage prepayments in 2011. Trading revenue increased primarily due to higher daily average revenue trades and the addition of optionsXpress’ trading activity.
While total expenses excluding interest were lower by 5% in 2011 compared to 2010, the Company experienced increases in compensation and benefits, professional services, occupancy and equipment, and advertising and market development expenses in aggregate of $266 million in 2011 compared to 2010. Significant charges in 2010 included class action litigation and regulatory reserves relating to the Schwab YieldPlus Fund , losses recognized for Schwab money market mutual funds, and a charge relating to the termination of the Company’s Invest First and WorldPoints Visa credit card program for a total of $482 million.
As a result of the Company’s ongoing investment in clients and sustained expense discipline, the Company achieved a pre-tax profit margin of 29.7% and return on common stockholders’ equity of 12% in 2011.
CURRENT MARKET AND REGULATORY ENVIRONMENT AND OTHER DEVELOPMENTS
As discussed above, interest rates remained at low levels during 2012. To the extent rates remain at these low levels, the Company’s net interest revenue will continue to be constrained, even as growth in average balances helps to increase such revenue. The low interest rate environment also affects asset management and administration fees. While net money market mutual fund fees improved in 2012 from 2011 primarily due to sustained improvement in short-term interest rates, the overall yields on certain Schwab-sponsored money market mutual funds have remained at levels at or below the management fees on those funds. The Company continues to waive a portion of its management fees so that the funds can maintain a positive return to clients. These and other money market mutual funds may not be able to replace maturing securities with securities of equal or higher yields. As a result, the yields on such funds may remain around or decline from their current levels, and therefore below the management fees on those funds. To the extent this occurs, asset management and administration fees may be negatively affected.
The Company recorded net impairment losses of $32 million related to certain non-agency residential mortgage-backed securities in 2012 primarily due to further credit deterioration of the securities’ underlying loans. Further deterioration in the performance of the underlying loans in the Company’s non-agency residential mortgage-backed securities portfolio could result in the recognition of additional impairment losses.
The Dodd-Frank Act was signed into law in July 2010. Among other things, the legislation transferred the supervision and regulation of CSC from the OTS to the Federal Reserve and supervision and regulation of Schwab Bank from the OTS to the OCC; both transfers were effective July 21, 2011. In 2012, the Federal Reserve issued notices of proposed rulemaking (NPRs) to meet certain requirements of the Dodd-Frank Act and to align current capital rules with the BASEL III capital standards. The NPRs would subject all savings and loan holding companies, including CSC, to consolidated capital requirements. In
WorldPoints is a registered trademark of FIA Card Services, N.A. Visa is a registered trademark of Visa International Service Association.
- 10 -
®
® (a) (b)
(a)(b)

THE CHARLES SCHWAB CORPORATION Management’s Discussion and Analysis of Financial Condition and Results of Operations
(Tabular Amounts in Millions, Except Ratios, or as Noted) addition, the NPRs would establish more restrictive capital definitions, higher risk-weightings for certain asset classes, higher minimum capital ratios, and capital buffers. The Company expects the capital standard rules to be phased in under an extended time frame after adoption. The comment period for the NPRs ended on October 22, 2012, and the NPRs are subject to further modification. CSC continues to monitor developments in order to assess the impact of the NPRs but does not expect them to have a material impact on the Company’s business, financial condition, and results of operations.
The Company is pursuing lawsuits in state court in San Francisco for rescission and damages against issuers, underwriters, and dealers of individual non-agency residential mortgage-backed securities on which the Company has experienced realized and unrealized losses. The lawsuits allege that offering documents for the securities contained material untrue and misleading statements about the securities and the underwriting standards and credit quality of the underlying loans. On January 27, 2012, and July 24, 2012, the court denied defendants’ motions to dismiss the claims with respect to all but 3 of the 51 securities, and discovery is proceeding.
RESULTS OF OPERATIONS
The following discussion presents an analysis of the Company’s results of operations for the years ended December 31, 2012, 2011, and 2010.
Net Revenues
The Company’s major sources of net revenues are asset management and administration fees, net interest revenue, and trading revenue. Asset management and administration fees and net interest revenue increased, while trading revenue decreased in 2012 as compared to 2011. Asset management and administration fees, net interest revenue, and trading revenue all increased in 2011 as compared to 2010.
- 11 -
Year Ended December 31,
Growth Rate2011-2012
2012 2011 2010
Amount
% of Total NetRevenues Amount
% of Total Net Revenues Amount
% of Total Net Revenues
Asset management and administration fees Schwab money market funds before fee waivers 3% $ 891 $ 865 $ 865 Fee waivers 3% (587) (568) (433)
Schwab money market funds after fee waivers 2% 304 6% 297 6% 432 10% Equity and bond funds 6% 125 3% 118 3% 114 3% Mutual Fund OneSource - 680 14% 680 14% 608 14%
Total mutual funds 1% 1,109 23% 1,095 23% 1,154 27% Advice solutions 11% 580 12% 522 11% 384 9% Other 14% 354 7% 311 7% 284 7%
Asset management and administration fees 6% 2,043 42% 1,928 41% 1,822 43%
Net interest revenue Interest revenue 1% 1,914 39% 1,900 41% 1,723 41% Interest expense (14%) (150) (3%) (175) (4%) (199) (5%)
Net interest revenue 2% 1,764 36% 1,725 37% 1,524 36%
Trading revenue Commissions (6%) 816 17% 866 19% 770 18% Principal transactions (15%) 52 1% 61 1% 60 2%
Trading revenue (6%) 868 18% 927 20% 830 20%
Other – net 60% 256 5% 160 3% 135 3%
Provision for loan losses (11%) (16) - (18) - (27) (1%)
Net impairment losses on securities 3% (32) (1%) (31) (1%) (36) (1%)
Total net revenues 4% $ 4,883 100% $ 4,691 100% $ 4,248 100%
®

THE CHARLES SCHWAB CORPORATION Management’s Discussion and Analysis of Financial Condition and Results of Operations
(Tabular Amounts in Millions, Except Ratios, or as Noted) Asset Management and Administration Fees
Asset management and administration fees include mutual fund service fees and fees for other asset-based financial services provided to individual and institutional clients. The Company earns mutual fund service fees for shareholder services, administration, and investment management provided to its proprietary funds, and recordkeeping and shareholder services provided to third-party funds. These fees are based upon the daily balances of client assets invested in these funds. The Company also earns asset management fees for advice solutions, which include advisory and managed account services that are based on the daily balances of client assets subject to the specific fee for service. The fair values of client assets included in proprietary and third-party mutual funds are based on quoted market prices and other observable market data. Other asset management and administration fees include various asset based fees, such as third-party mutual fund service fees, trust fees, 401k record keeping fees, and mutual fund clearing and other service fees. Asset management and administration fees may vary with changes in the balances of client assets due to market fluctuations and client activity. For discussion of the impact of current market conditions on asset management and administration fees, see “Current Market and Regulatory Environment and Other Developments.”
Asset management and administration fees increased by $115 million, or 6%, in 2012 from 2011 primarily due to increases in advice solutions fees and other asset management and administration fees. Asset management and administration fees increased by $106 million, or 6%, in 2011 from 2010 primarily due to an increase in advice solutions fees, partially offset by a decrease in mutual fund service fees.
Mutual fund service fees were relatively flat in 2012 from 2011, which reflected growth in client asset balances invested in money market mutual funds, equity and bond funds, and Mutual Fund OneSource funds, offset by the effect of lower yields on certain mutual fund assets. Mutual fund service fees decreased by $59 million, or 5%, in 2011 from 2010 primarily due to a decrease in net money market mutual fund fees as a result of lower yields on fund assets, partially offset by higher Mutual Fund OneSource fees.
Advice solutions fees increased by $58 million, or 11%, in 2012 from 2011 and by $138 million, or 36%, in 2011 from 2010 primarily due to growth in client assets enrolled in retail advisory and managed account programs, including Windhaven and Schwab Managed Portfolios . The increase in advice solutions fees in 2011 from 2010 was also due to temporary fees rebates of $63 million, which reduced advice solutions fees in 2010 under a rebate program that ended in 2010.
Other asset management and administration fees increased by $43 million, or 14%, in 2012 from 2011 primarily due to an increase in third-party mutual fund service fees as a result of an increase in client asset balances invested in other third-party mutual funds.
Net Interest Revenue
Net interest revenue is the difference between interest earned on interest-earning assets and interest paid on funding sources. Net interest revenue is affected by changes in the volume and mix of these assets and liabilities, as well as by fluctuations in interest rates and portfolio management strategies. The Company’s investment strategy is structured to produce an increase in net interest revenue when interest rates rise and, conversely, a decrease in net interest revenue when interest rates fall (i.e., interest-earning assets generally reprice more quickly than interest-bearing liabilities). When interest rates fall, the Company may attempt to mitigate some of this negative impact by extending the maturities of assets in investment portfolios to lock in asset yields, and by lowering rates paid to clients on interest-bearing liabilities. Since the Company establishes the rates paid on certain brokerage client cash balances and deposits from banking clients, as well as the rates charged on receivables from brokerage clients, and also controls the composition of its investment securities, it has some ability to manage its net interest spread. The current low interest rate environment limits the extent to which the Company can reduce interest expense paid on funding sources. However, the spread is influenced by external factors such as the interest rate environment and competition. For discussion of the impact of current market conditions on net interest revenue, see “Current Market and Regulatory Environment and Other Developments.”
- 12 -
®
TM

THE CHARLES SCHWAB CORPORATION Management’s Discussion and Analysis of Financial Condition and Results of Operations
(Tabular Amounts in Millions, Except Ratios, or as Noted) The Company’s interest-earning assets are financed primarily by brokerage client cash balances and deposits from banking clients. Non-interest-bearing funding sources include non-interest-bearing brokerage client cash balances and proceeds from stock-lending activities, as well as stockholders’equity.
In clearing their clients’ trades, Schwab and optionsXpress, Inc. hold cash balances payable to clients. In most cases, Schwab and optionsXpress, Inc. pay their clients interest on cash balances awaiting investment, and in turn invest these funds and earn interest revenue. Receivables from brokerage clients consist primarily of margin loans to brokerage clients. Margin loans are loans made to clients on a secured basis to purchase securities. Pursuant to applicable regulations, client cash balances that are not used for margin lending are generally segregated into investment accounts that are maintained for the exclusive benefit of clients, which are recorded in cash and investments segregated on the Company’s consolidated balance sheet. When investing segregated client cash balances, Schwab and optionsXpress, Inc. must adhere to applicable regulations that restrict investments to securities guaranteed by the full faith and credit of the U.S. government, participation certificates, mortgage-backed securities guaranteed by the Government National Mortgage Association, deposits held at U.S. banks and thrifts, and resale agreements collateralized by qualified securities. Additionally, Schwab and optionsXpress, Inc. have established policies for the minimum credit quality and maximum maturity of these investments.
Schwab Bank maintains investment portfolios for liquidity as well as to invest funds from deposits in excess of loans to banking clients and liquidity limits. Schwab Bank’s securities available for sale include mortgage-backed securities, asset-backed securities, corporate debt securities, certificates of deposit, U.S. agency notes, commercial paper, and other securities. Schwab Bank’s securities held to maturity include mortgage-backed and other securities. Schwab Bank lends funds to banking clients primarily in the form of mortgage loans and HELOCs. These loans are largely funded by interest-bearing deposits from banking clients.
The following table presents net interest revenue information corresponding to interest-earning assets and funding sources on the consolidated balance sheet:
Net interest revenue increased in 2012 from 2011 primarily due to higher average balances of interest-earning assets, primarily securities available for sale, partially offset by the effect of low overall interest rates and higher amortization of premiums
- 13 -
Year Ended December 31, 2012 2011 2010
Average Balance
InterestRevenue/Expense
AverageYield/Rate
AverageBalance
InterestRevenue/Expense
AverageYield/ Rate
Average Balance
InterestRevenue/Expense
Average Yield/ Rate
Interest-earning assets: Cash and cash equivalents $ 7,130 $ 18 0.25% $ 5,554 $ 13 0.23% $ 7,269 $ 19 0.26% Cash and investments segregated 25,263 46 0.18% 25,831 39 0.15% 19,543 57 0.29% Broker-related receivables 351 - 0.04% 310 - 0.05% 317 - 0.28% Receivables from brokerage clients 10,928 446 4.08% 10,637 467 4.39% 8,981 437 4.87% Other securities owned - - - - - - 74 - 0.45% Securities available for sale 39,745 583 1.47% 27,486 456 1.66% 24,209 486 2.01% Securities held to maturity 15,371 397 2.58% 16,050 492 3.07% 10,440 361 3.46% Loans to banking clients 10,053 309 3.07% 9,472 310 3.27% 7,987 275 3.44% Loans held for sale 18 1 4.12% 65 3 4.62% 80 4 5.00%
Total interest-earning assets 108,859 1,800 1.65% 95,405 1,780 1.87% 78,900 1,639 2.08%
Other interest revenue 114 120 84
Total interest-earning assets $ 108,859 $ 1,914 1.76% $ 95,405 $ 1,900 1.99% $ 78,900 $ 1,723 2.18%
Funding sources: Deposits from banking clients $ 65,546 $ 42 0.06% $ 52,701 $ 62 0.12% $ 44,858 $ 105 0.23% Payables to brokerage clients 29,831 3 0.01% 29,992 3 0.01% 22,715 2 0.01% Long-term debt 1,934 103 5.33% 2,004 108 5.39% 1,648 92 5.58%
Total interest-bearing liabilities 97,311 148 0.15% 84,697 173 0.20% 69,221 199 0.29%
Non-interest-bearing funding sources 11,548 10,708 9,679 Other interest expense 2 2 -
Total funding sources $ 108,859 $ 150 0.14% $ 95,405 $ 175 0.18% $ 78,900 $ 199 0.25%
Net interest revenue $ 1,764 1.62% $ 1,725 1.81% $ 1,524 1.93%
Interest revenue was less than $500,000 in the period or periods presented. Amounts have been calculated based on amortized cost.
(1) (1)
(2)
(1)(2)

THE CHARLES SCHWAB CORPORATION Management’s Discussion and Analysis of Financial Condition and Results of Operations
(Tabular Amounts in Millions, Except Ratios, or as Noted) relating to mortgage-backed securities. Growth in the average deposit balances from banking clients funded the increase in the balance of securities available for sale.
Net interest revenue increased in 2011 from 2010 primarily due to higher average balances of interest-earning assets, partially offset by the effect of lower interest rate spreads resulting from higher amortization of premiums relating to residential mortgage-backed securities. The growth in average balances of deposits from banking clients and payables to brokerage clients funded the increases in the balances of receivables from brokerage clients, securities available for sale, and securities held to maturity. Further declines in interest rates in 2011 accelerated the prepayment activity in the Company’s portfolio of residential mortgage-backed securities, which resulted in higher premium amortization.
Trading Revenue
Trading revenue includes commission and principal transaction revenues. Commission revenue is affected by the number of revenue trades executed and the average revenue earned per revenue trade. Principal transaction revenue is primarily comprised of revenue from trading activity in client fixed income securities. To accommodate clients’ fixed income trading activity, the Company maintains positions in fixed income securities, including state and municipal debt obligations, U.S. Government, corporate debt, and other securities. The difference between the price at which the Company buys and sells securities to and from its clients and other broker-dealers is recognized as principal transaction revenue. Principal transaction revenue also includes unrealized gains and losses on these securities positions. Factors that influence principal transaction revenue include the volume of client trades and market price volatility.
Trading revenue decreased by $59 million, or 6%, in 2012 from 2011 primarily due to lower daily average revenue trades, partially offset by the inclusion of optionsXpress’ trading activity for the full year. Trading revenue increased by $97 million, or 12%, in 2011 from 2010 primarily due to higher daily average revenue trades and the addition of optionsXpress’ trading activity starting in September 2011.
Daily average revenue trades decreased by 7% in 2012 from 2011 primarily due to a lower volume of equity and mutual fund trades, partially offset by a higher volume of option and future trades as a result of the inclusion of optionsXpress. Daily average revenue trades increased by 12% in 2011 from 2010 primarily due to a higher volume of option, equity, and mutual fund trades. Average revenue per revenue trade remained relatively flat in 2012 and 2011.
Other Revenue – Net
Other revenue – net includes nonrecurring gains and losses, realized gains and losses on sales of securities available for sale, order flow revenue, software fees from the Company’s portfolio management services, exchange processing fees, and other service fees.
Other revenue – net increased by $96 million, or 60%, in 2012 compared to 2011 primarily due to a pre-tax gain of $70 million relating to a confidential resolution of a vendor dispute in the second quarter of 2012. In November 2012, the
- 14 -
Year Ended December 31,
Growth Rate 2011-2012 2012 2011 2010
Daily average revenue trades (in thousands) (7%) 282.7 303.8 270.7 Clients’ daily average trades (in thousands) (2%) 440.9 451.1 399.7 Number of trading days (1%) 248.5 251.5 251.5 Average revenue per revenue trade 2% $ 12.35 $ 12.15 $ 12.28
Includes all client trades that generate trading revenue (i.e., commission revenue or revenue from fixed income securities trading).
Includes daily average revenue trades, trades by clients in asset-based pricing relationships, and all commission-free trades, including the Company’s Mutual Fund OneSource funds and ETFs, and other proprietary products. Clients’ daily average trades is an indicator of client engagement with securities markets.
October 29 and 30, 2012, were not included as trading days due to weather-related market closures.
(1)
(2)
(3)
(1)
(2)
(3)

THE CHARLES SCHWAB CORPORATION Management’s Discussion and Analysis of Financial Condition and Results of Operations
(Tabular Amounts in Millions, Except Ratios, or as Noted) Company began receiving additional order flow rebates from market venues to which client orders are routed for execution. Order flow revenue increased by $23 million due to this revenue and the inclusion of a full year of optionsXpress’ order flow revenue. In December 2012, CSC redeemed the remaining outstanding portion of its 4.950% Senior Notes of $494 million that were due in 2014, which resulted in the payment of a make-whole premium of $31 million that was recorded in other revenue – net. Other revenue – net also included realized gains of $35 million from the sales of securities available for sale.
Other revenue – net increased by $25 million, or 19%, in 2011 compared to 2010 primarily due to increases in software and exchange processing fees, as well as the addition of education services revenue from the acquisition of optionsXpress.
Provision for Loan Losses
The provision for loan losses was relatively flat in 2012 from 2011, reflecting stable levels of delinquencies and nonaccrual loans experienced in 2012. The provision for loan losses decreased by $9 million, or 33%, in 2011 from 2010 due to a decrease in overall expected loss rates resulting primarily from a decrease in first mortgage loan delinquencies. Charge-offs were $16 million, $19 million, and $20 million in 2012, 2011, and 2010, respectively. For further discussion on the Company’s credit risk and the allowance for loan losses, see “Risk Management – Credit Risk” and “Item 8 – Financial Statements and Supplementary Data – Notes to Consolidated Financial Statements – 7. Loans to Banking Clients and Related Allowance for Loan Losses.”
Net Impairment Losses on Securities
Net impairment losses on securities were $32 million, $31 million, and $36 million in 2012, 2011, and 2010, respectively. These charges relate to certain non-agency residential mortgage-backed securities, which experienced further credit deterioration of the securities’ underlying loans. For further discussion, see “Item 8 – Financial Statements and Supplementary Data – Notes to Consolidated Financial Statements – 6. Securities Available for Sale and Securities Held to Maturity.”
Expenses Excluding Interest
As shown in the table below, expenses excluding interest were higher in 2012 compared to 2011, which was primarily due to the inclusion of a full year of optionsXpress’ expenses and amortization of intangible assets relating to the optionsXpress acquisition. Expenses excluding interest were lower in 2011 compared to 2010 primarily due to certain significant charges in 2010, including class action litigation and regulatory reserves relating to the Schwab YieldPlus Fund and losses recognized for Schwab money market mutual funds. The decrease in expenses excluding interest caused by these charges in 2010 was offset by increases in compensation and benefits, professional services, occupancy and equipment, and advertising and market development expenses in 2011.
- 15 -
Year Ended December 31,
Growth Rate2011-2012 2012 2011 2010
Compensation and benefits 4% $ 1,803 $ 1,732 $ 1,573 Professional services - 388 387 341 Occupancy and equipment 3% 311 301 272 Advertising and market development 6% 241 228 196 Communications - 220 220 207 Depreciation and amortization 26% 196 155 146 Class action litigation and regulatory reserve N/M - 7 320 Money market mutual fund charges - - - 132 Other 2% 274 269 282
Total expenses excluding interest 4% $ 3,433 $ 3,299 $ 3,469
Expenses as a percentage of total net revenues:
Total expenses excluding interest 70% 70% 82% Advertising and market development 5% 5% 5%
N/M Not meaningful.

THE CHARLES SCHWAB CORPORATION Management’s Discussion and Analysis of Financial Condition and Results of Operations
(Tabular Amounts in Millions, Except Ratios, or as Noted) Compensation and Benefits
Compensation and benefits expense includes salaries and wages, incentive compensation, and related employee benefits and taxes. Incentive compensation includes variable compensation, discretionary bonuses, and stock-based compensation. Variable compensation includes payments to certain individuals based on their sales performance. Discretionary bonuses are based on the Company’s overall performance as measured by earnings per common share, and therefore will fluctuate with this measure. Stock-based compensation primarily includes employee and board of director stock options, restricted stock units, and restricted stock awards.
Compensation and benefits expense increased by $71 million, or 4%, in 2012 from 2011 due to increases in salaries and wages, incentive compensation and employee benefits and other expense. Compensation and benefits expense increased by $159 million, or 10%, in 2011 from 2010 primarily due to increases in salaries and wages and incentive compensation. The following table shows a comparison of certain compensation and benefits components and employee data:
Salaries and wages increased in 2012 from 2011 primarily due to an increase in average full-time employees from the inclusion of a full year of optionsXpress’ employees. The increase in salaries and wages was partially offset by a decrease in persons employed on a contract basis. Incentive compensation increased in 2012 from 2011 primarily due to higher variable compensation resulting from product sales performance in the Company’s branch offices. Employee benefits and other expense increased in 2012 from 2011 primarily due to increases in payroll taxes and the Company’s 401(k) plan contribution expense due to increases in average full-time employees and incentive compensation, and an increase in the Company’s deferred compensation plan expense as a result of improvement in the broad equity markets.
Salaries and wages increased in 2011 from 2010 primarily due to increases in full-time employees and persons employed on a contract basis. The increase in full-time employees was partially due to the addition of full-time employees from the optionsXpress acquisition. Incentive compensation increased in 2011 from 2010 primarily due to an increase in discretionary bonuses and higher variable compensation. Discretionary bonuses increased based on the Company’s overall performance in 2011, as well as an increase in full time employees. Variable compensation was higher primarily due to the integration of Windhaven, which was acquired in November 2010. Employee benefits and other expense increased in 2011 from 2010 primarily due to increases in payroll taxes and the Company’s 401(k) plan contribution expense as a result of increases in incentive compensation and full-time employees.
- 16 -
Year Ended December 31,
Growth Rate 2011-2012 2012 2011 2010
Salaries and wages 3% $ 1,043 $ 1,012 $ 931 Incentive compensation 5% 466 444 386 Employee benefits and other 7% 294 276 256
Total compensation and benefits expense 4% $ 1,803 $ 1,732 $ 1,573
Compensation and benefits expense as a percentage of total net revenues:
Salaries and wages 21% 22% 22% Incentive compensation 10% 9% 9% Employee benefits and other 6% 6% 6%
Total compensation and benefits expense 37% 37% 37%
Full-time equivalent employees (in thousands)
At year end (2%) 13.8 14.1 12.8 Average 3% 13.8 13.4 12.6
Includes full-time, part-time and temporary employees, and persons employed on a contract basis, and excludes employees of outsourced service providers.
(1)
(1)

THE CHARLES SCHWAB CORPORATION Management’s Discussion and Analysis of Financial Condition and Results of Operations
(Tabular Amounts in Millions, Except Ratios, or as Noted) Expenses Excluding Compensation and Benefits
Professional services expense increased in 2011 from 2010 primarily due to an increase in fees relating to the Company’s technology investments and client facing infrastructure, and approximately $10 million in costs relating to the integration of optionsXpress.
Occupancy and equipment expense increased in 2012 from 2011 primarily due to an increase in software maintenance expense relating to the Company’s information technology systems. Occupancy and equipment expense increased in 2011 from 2010 primarily due to an increase in the Company’s investments in data processing equipment.
Advertising and market development expense increased in 2012 from 2011 primarily due to the inclusion of a full year of optionsXpress’ expenses, which includes media, and the Company’s increased spending on customer promotions. Advertising and market development expense increased in 2011 from 2010 primarily due to higher spending on customer and branch promotions and electronic media.
Communications expense increased in 2011 from 2010 primarily due to higher telephone service expense and third-party news and information expense.
Depreciation and amortization expense increased in 2012 and 2011 primarily due to the amortization of intangible assets relating to the optionsXpress acquisition. The increase in 2011 from 2010 was also due to the amortization of intangible assets resulting from the Windhaven acquisition.
In 2011 and 2010, the Company recorded class action litigation and regulatory reserves relating to the Schwab YieldPlus Fund. For further discussion of the Schwab YieldPlus Fund litigation and regulatory matters, see “Item 8 – Financial Statements and Supplementary Data – Notes to Consolidated Financial Statements – 21. Class Action Litigation and Regulatory Reserve and Money Market Mutual Fund Charges.”
In 2010, the Company decided to cover the net remaining losses of $132 million recognized by Schwab money market mutual funds as a result of their investments in a single structured investment vehicle that defaulted in 2008.
Other expense was lower in 2011 compared to 2010 primarily due to a charge of $30 million in 2010, relating to the Company’s former Invest First and WorldPoints Visa credit cards, as the Company ended its sponsorship due to challenging credit card industry economics.
Taxes on Income
The Company’s effective income tax rate on income before taxes was 36.0% in 2012, 37.9% in 2011, and 41.7% in 2010. The decrease in 2012 from 2011 was primarily due to the recognition of a non-recurring state tax benefit of $20 million in the third quarter of 2012. The decrease in 2011 from 2010 was due to a lower effective state income tax rate in 2011 and the impact of non-deductible penalties relating to the Schwab YieldPlus Fund regulatory settlements in 2010.
Segment Information
The Company provides financial services to individuals and institutional clients through two segments – Investor Services and Advisor Services. In the first quarter of 2013, the Company realigned its reportable segments as a result of organizational changes. The segment formerly reported as Institutional Services was renamed to Advisor Services. Additionally, the Retirement Plan Services and Corporate Brokerage Services business units are now part of the Investor Services segment. Previously reported segment information has been revised to reflect these organizational changes. The Investor Services segment provides retail brokerage and banking services to individual investors, retirement plan services, and corporate brokerage services. The Advisor Services segment provides custodial, trading, and support services to independent investment advisors, and retirement business services to independent retirement plan advisors and recordkeepers whose plan assets are held at Schwab Bank. Banking revenues and expenses are allocated to the Company’s two segments based on which segment
- 17 -

THE CHARLES SCHWAB CORPORATION Management’s Discussion and Analysis of Financial Condition and Results of Operations
(Tabular Amounts in Millions, Except Ratios, or as Noted) services the client. The Company evaluates the performance of its segments on a pre-tax basis, excluding items such as significant nonrecurring gains, impairment charges on non-financial assets, discontinued operations, extraordinary items, and significant restructuring and other charges. Segment assets and liabilities are not used for evaluating segment performance or in deciding how to allocate resources to segments.
Financial information for the Company’s reportable segments is presented in the following tables:
Investor Services Net revenues were relatively flat in 2012 compared to 2011 as the increases in asset management and administration fees, net interest revenue, and other revenue – net were largely offset by a decrease in trading revenue. Asset management and administration fees increased primarily due to an increase in advice solutions fees relating to Windhaven, partially offset by a decrease in net money market mutual fund fees. Net interest revenue increased primarily due to higher average balances of interest-earning assets, partially offset by the effect of low overall interest rates and higher amortization of premiums relating to mortgage-backed securities. Other revenue – net increased primarily due to the inclusion of a full year of optionsXpress’
- 18 -
Investor Services
Advisor Services
Year Ended December 31,
Growth Rate2011-2012 2012 2011 2010
Growth Rate2011-2012 2012 2011 2010
Net Revenues
Asset management and administration fees 6% $ 1,436 $ 1,357 $ 1,275 6% $ 607 $ 571 $ 547
Net interest revenue 1% 1,559 1,542 1,363 12% 205 183 161 Trading revenue (8%) 612 667 598 (2%) 255 260 232 Other – net 26% 123 98 80 - 62 62 55 Provision for loan losses (6%) (15) (16) (24) (50%) (1) (2) (3) Net impairment losses on
securities - (29) (29) (34) 50% (3) (2) (2)
Total net revenues 2% 3,686 3,619 3,258 5% 1,125 1,072 990
Expenses Excluding Interest 5% 2,693 2,569 2,331 1% 739 731 694
Income before taxes on income (5%) $ 993 $ 1,050 $ 927 13% $ 386 $ 341 $ 296
Unallocated
Total
Year Ended December 31,
Growth Rate2011-2012 2012 2011 2010
Growth Rate2011-2012 2012 2011 2010
Net Revenues
Asset management and administration fees N/M $ - $ - $ - 6% $ 2,043 $ 1,928 $ 1,822
Net interest revenue N/M - - - 2% 1,764 1,725 1,524 Trading revenue N/M 1 - - (6%) 868 927 830 Other – net N/M 71 - - 60% 256 160 135 Provision for loan losses N/M - - - (11%) (16) (18) (27) Net impairment losses on
securities N/M - - - 3% (32) (31) (36)
Total net revenues N/M 72 - - 4% 4,883 4,691 4,248
Expenses Excluding Interest N/M 1 (1) 444 4% 3,433 3,299 3,469
Income before taxes on income N/M $ 71 $ 1 $ (444) 4% $ 1,450 $ 1,392 $ 779
Taxes on income 522 528 325
Net Income $ 928 $ 864 $ 454
N/M Not meaningful.

THE CHARLES SCHWAB CORPORATION Management’s Discussion and Analysis of Financial Condition and Results of Operations
(Tabular Amounts in Millions, Except Ratios, or as Noted) order flow revenue and other fees. Trading revenue decreased primarily due to lower daily average revenue trades, partially offset by the inclusion of optionsXpress’ trading activity for the full year. Expenses excluding interest increased by $124 million, or 5%, in 2012 from 2011 primarily due to the inclusion of a full year of optionsXpress’ compensation and benefits, depreciation and amortization, and advertising and market development expenses.
Net revenues increased by $361 million, or 11%, in 2011 from 2010 primarily due to increases in net interest revenue, asset management and administration fees, and trading revenue. Net interest revenue increased primarily due to higher average balances of interest-earning assets during the year, partially offset by the effect of higher premium amortization relating to residential mortgage-backed securities caused by higher mortgage prepayments in 2011. Asset management and administration fees increased primarily due to an increase in advice solutions fees and continued asset inflows, partially offset by decrease in net money market mutual fund fees. Trading revenue increased primarily due to higher daily average revenue trades and the addition of optionsXpress. Expenses excluding interest increased by $238 million, or 10%, in 2011 from 2010 primarily due to increases in compensation and benefits, professional services, and advertising and market development expenses, which included the integration of optionsXpress.
Advisor Services Net revenues increased by $53 million, or 5%, in 2012 from 2011 primarily due to increases in asset management and administration fees and net interest revenue, partially offset by a decrease in trading revenue. Asset management and administration fees increased primarily due to an increase in third-party mutual fund service fees. Net interest revenue increased primarily due to higher average balances of interest-earning assets, partially offset by the effect of low overall interest rates and higher amortization of premiums relating to mortgage-backed securities. Trading revenue decreased primarily due to lower daily average revenue trades. Expenses excluding interest were relatively flat in 2012 compared to 2011.
Net revenues increased by $82 million, or 8%, in 2011 from 2010 primarily due to increases in net interest revenue, asset management and administration fees, and trading revenue. Net interest revenue increased primarily due to higher average balances of interest-earning assets during the year, partially offset by the effect of higher premium amortization relating to residential mortgage-backed securities caused by higher mortgage prepayments in 2011. Asset management and administration fees increased primarily due to an increase in mutual fund service fees relating to the Company’s Mutual Fund OneSource funds as a result of continued asset inflows, offset by net money market mutual fund fees waivers. Trading revenue increased primarily due to higher daily average revenue trades. Expenses excluding interest increased by $37 million, or 5%, in 2011 from 2010 primarily due to an increase in compensation and benefits expense.
Unallocated Other revenue – net in 2012 includes a pre-tax gain of $70 million relating to a confidential resolution of a vendor dispute in the second quarter of 2012. Expenses excluding interest in 2010 include class action litigation and regulatory reserves relating to the Schwab YieldPlus Fund and a charge relating to the Company’s decision to cover the net remaining losses recognized by Schwab money market mutual funds as a result of their investments in a single structured investment vehicle that defaulted in 2008.
LIQUIDITY AND CAPITAL RESOURCES
CSC conducts substantially all of its business through its wholly-owned subsidiaries. The Company’s capital structure is designed to provide each subsidiary with capital and liquidity to meet its operational needs and regulatory requirements.
CSC is a savings and loan holding company and Schwab Bank, CSC’s depository institution, is a federal savings bank. CSC is subject to supervision and regulation by the Federal Reserve and Schwab Bank is subject to supervision and regulation by the OCC.
- 19 -
THE CHARLES SCHWAB CORPORATION Management’s Discussion and Analysis of Financial Condition and Results of Operations
(Tabular Amounts in Millions, Except Ratios, or as Noted) Liquidity
CSC
CSC’s liquidity needs arise from funding its subsidiaries’ operations, including margin and mortgage lending, and transaction settlement, in addition to funding cash dividends, acquisitions, investments, short- and long-term debt, and managing statutory capital requirements.
CSC’s liquidity needs are generally met through cash generated by its subsidiaries, as well as cash provided by external financing. CSC has a universal automatic shelf registration statement (Shelf Registration Statement) on file with the SEC which enables CSC to issue debt, equity and other securities. CSC maintains excess liquidity in the form of overnight cash deposits and short-term investments to cover daily funding needs and to support growth in the Company’s business. Generally, CSC does not hold liquidity at its subsidiaries in excess of amounts deemed sufficient to support the subsidiaries’ operations, including any regulatory capital requirements. Schwab, Schwab Bank, and optionsXpress, Inc. are subject to regulatory requirements that may restrict them from certain transactions with CSC, as further discussed below. Management believes that funds generated by the operations of CSC’s subsidiaries will continue to be the primary funding source in meeting CSC’s liquidity needs, providing adequate liquidity to meet Schwab Bank’s capital guidelines, and maintaining Schwab and optionsXpress, Inc.’s net capital.
While CSC is not currently subject to specific statutory capital requirements, CSC is required to serve as a source of strength for Schwab Bank and must have the ability to provide financial assistance if Schwab Bank experiences financial distress. To manage capital adequacy, the Company currently utilizes a target Tier 1 Leverage Ratio, as defined by the Federal Reserve, of at least 6%. At December 31, 2012, the Company’s Tier 1 Leverage Ratio was 6.5%, Tier 1 Capital Ratio was 16.9%, and Total Capital Ratio was 17.0%.
In January and June 2012, the Company completed offerings of its Series A and Series B preferred stock under the Shelf Registration Statement, with an aggregate liquidation preference of $885 million. CSC’s preferred stock is rated Baa2 by Moody’s Investors Service (Moody’s), BBB+ by Standard & Poor’s Ratings Group (Standard & Poor’s), and BB+ by Fitch Ratings, Ltd (Fitch). For further discussion of these equity offerings, see “Item 8 – Financial Statements and Supplementary Data – Notes to Consolidated Financial Statements – 18. Stockholders’ Equity.”
In August 2012, CSC completed an exchange offer with certain eligible holders of its 4.950% Senior Notes due 2014 (Old Senior Notes), whereby Old Senior Notes in an aggregate principal amount of $256 million were exchanged for the same aggregate principal amount of 3.225% Senior Notes due 2022 (New Senior Notes) and cash consideration of $19 million. On December 6, 2012, CSC issued $350 million of additional Senior Notes that mature in 2015 under the Shelf Registration Statement, which have a fixed interest rate of 0.850% with interest payable semi-annually. Additionally, on December 21, 2012, CSC redeemed all of its remaining outstanding Old Senior Notes of $494 million. In connection with the redemption, CSC paid the holders of the Old Senior Notes a make-whole premium of $31 million in addition to the $494 million principal payment. For further discussion of the Senior Notes, see “Item 8 – Financial Statements and Supplementary Data – Notes to Consolidated Financial Statements – 14. Borrowings.”
On August 31, 2012, CSC redeemed all of the fixed-to-floating rate trust preferred securities issued by Schwab Capital Trust (Trust) of which $202 million in principal was outstanding for $207 million. The trust preferred securities were redeemed, along with the common securities issued by the Trust and held by CSC, as a result of the concurrent redemption in whole by CSC of the Junior Subordinated Notes held by the Trust which underlay the trust preferred securities. For further discussion of this redemption, see “Item 8 – Financial Statements and Supplementary Data – Notes to Consolidated Financial Statements – 14. Borrowings.”
- 20 -
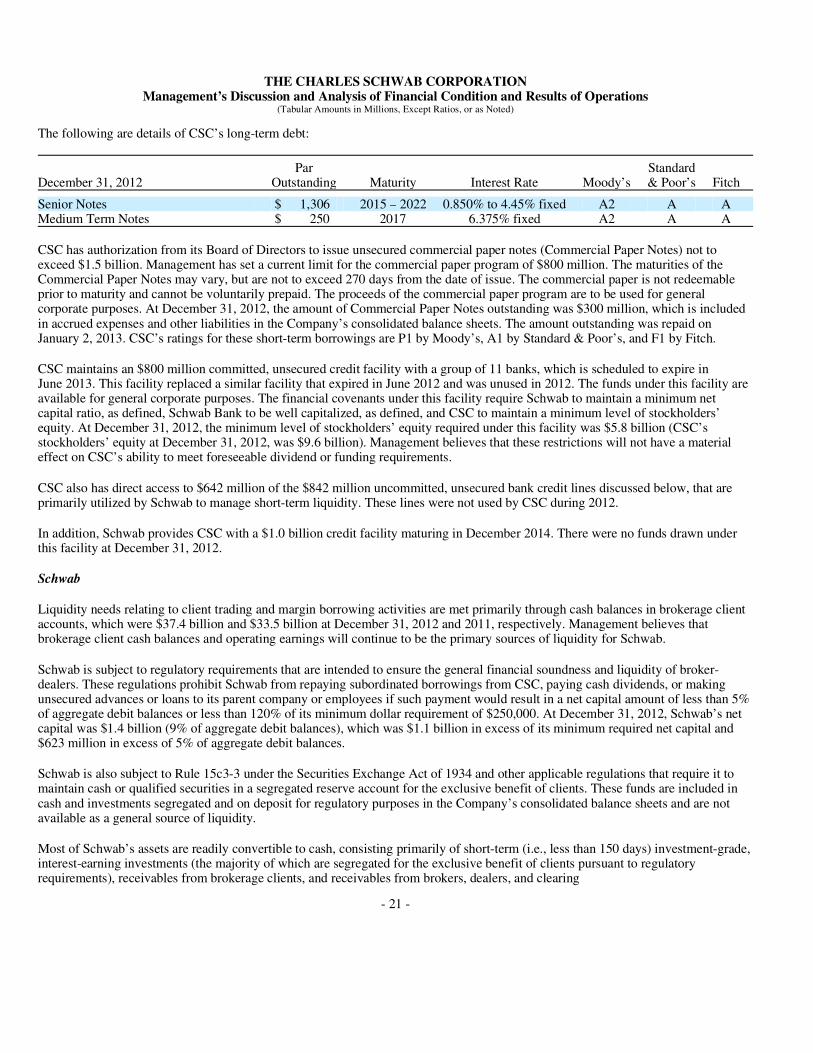
THE CHARLES SCHWAB CORPORATION Management’s Discussion and Analysis of Financial Condition and Results of Operations
(Tabular Amounts in Millions, Except Ratios, or as Noted) The following are details of CSC’s long-term debt:
CSC has authorization from its Board of Directors to issue unsecured commercial paper notes (Commercial Paper Notes) not to exceed $1.5 billion. Management has set a current limit for the commercial paper program of $800 million. The maturities of the Commercial Paper Notes may vary, but are not to exceed 270 days from the date of issue. The commercial paper is not redeemable prior to maturity and cannot be voluntarily prepaid. The proceeds of the commercial paper program are to be used for general corporate purposes. At December 31, 2012, the amount of Commercial Paper Notes outstanding was $300 million, which is included in accrued expenses and other liabilities in the Company’s consolidated balance sheets. The amount outstanding was repaid on January 2, 2013. CSC’s ratings for these short-term borrowings are P1 by Moody’s, A1 by Standard & Poor’s, and F1 by Fitch.
CSC maintains an $800 million committed, unsecured credit facility with a group of 11 banks, which is scheduled to expire in June 2013. This facility replaced a similar facility that expired in June 2012 and was unused in 2012. The funds under this facility are available for general corporate purposes. The financial covenants under this facility require Schwab to maintain a minimum net capital ratio, as defined, Schwab Bank to be well capitalized, as defined, and CSC to maintain a minimum level of stockholders’ equity. At December 31, 2012, the minimum level of stockholders’ equity required under this facility was $5.8 billion (CSC’s stockholders’ equity at December 31, 2012, was $9.6 billion). Management believes that these restrictions will not have a material effect on CSC’s ability to meet foreseeable dividend or funding requirements.
CSC also has direct access to $642 million of the $842 million uncommitted, unsecured bank credit lines discussed below, that are primarily utilized by Schwab to manage short-term liquidity. These lines were not used by CSC during 2012.
In addition, Schwab provides CSC with a $1.0 billion credit facility maturing in December 2014. There were no funds drawn under this facility at December 31, 2012.
Schwab
Liquidity needs relating to client trading and margin borrowing activities are met primarily through cash balances in brokerage client accounts, which were $37.4 billion and $33.5 billion at December 31, 2012 and 2011, respectively. Management believes that brokerage client cash balances and operating earnings will continue to be the primary sources of liquidity for Schwab.
Schwab is subject to regulatory requirements that are intended to ensure the general financial soundness and liquidity of broker-dealers. These regulations prohibit Schwab from repaying subordinated borrowings from CSC, paying cash dividends, or making unsecured advances or loans to its parent company or employees if such payment would result in a net capital amount of less than 5% of aggregate debit balances or less than 120% of its minimum dollar requirement of $250,000. At December 31, 2012, Schwab’s net capital was $1.4 billion (9% of aggregate debit balances), which was $1.1 billion in excess of its minimum required net capital and $623 million in excess of 5% of aggregate debit balances.
Schwab is also subject to Rule 15c3-3 under the Securities Exchange Act of 1934 and other applicable regulations that require it to maintain cash or qualified securities in a segregated reserve account for the exclusive benefit of clients. These funds are included in cash and investments segregated and on deposit for regulatory purposes in the Company’s consolidated balance sheets and are not available as a general source of liquidity.
Most of Schwab’s assets are readily convertible to cash, consisting primarily of short-term (i.e., less than 150 days) investment-grade, interest-earning investments (the majority of which are segregated for the exclusive benefit of clients pursuant to regulatory requirements), receivables from brokerage clients, and receivables from brokers, dealers, and clearing
- 21 -
December 31, 2012
Par Outstanding Maturity Interest Rate Moody’s
Standard& Poor’s Fitch
Senior Notes $ 1,306 2015 – 2022 0.850% to 4.45% fixed A2 A A Medium Term Notes $ 250 2017 6.375% fixed A2 A A

THE CHARLES SCHWAB CORPORATION Management’s Discussion and Analysis of Financial Condition and Results of Operations
(Tabular Amounts in Millions, Except Ratios, or as Noted) organizations. Client margin loans are demand loan obligations secured by readily marketable securities. Receivables from and payables to brokers, dealers, and clearing organizations primarily represent current open transactions, which usually settle, or can be closed out, within a few business days.
Schwab has a finance lease obligation related to an office building and land under a 20-year lease. The remaining finance lease obligation of $95 million at December 31, 2012, is being reduced by a portion of the lease payments over the remaining lease term of 12 years.
To manage short-term liquidity, Schwab maintains uncommitted, unsecured bank credit lines with a group of six banks totaling $842 million at December 31, 2012. The need for short-term borrowings arises primarily from timing differences between cash flow requirements, scheduled liquidation of interest-earnings investments, and movements of cash to meet regulatory brokerage client cash segregation requirements. Schwab used such borrowings for three days in 2012, with average daily amounts borrowed of $62 million. There were no borrowings outstanding under these lines at December 31, 2012.
To partially satisfy the margin requirement of client option transactions with the Options Clearing Corporation, Schwab has unsecured standby letter of credit agreements (LOCs) with five banks in favor of the Options Clearing Corporation aggregating $325 million at December 31, 2012. In connection with its securities lending activities, Schwab is required to provide collateral to certain brokerage clients. Schwab satisfies the collateral requirements by arranging LOCs, in favor of these brokerage clients, which are issued by multiple banks. At December 31, 2012, the aggregate face amount of these LOCs totaled $74 million. There were no funds drawn under any of these LOCs during 2012.
To manage Schwab’s regulatory capital requirement, CSC provides Schwab with a $1.4 billion subordinated revolving credit facility, which is scheduled to expire in March 2014. The amount outstanding under this facility at December 31, 2012, was $315 million. Borrowings under this subordinated lending arrangement qualify as regulatory capital for Schwab.
In addition, CSC provides Schwab with a $2.5 billion credit facility, which is scheduled to expire in December 2014. Borrowings under this facility do not qualify as regulatory capital for Schwab. There were no funds drawn under this facility at December 31, 2012.
Schwab Bank
Schwab Bank’s liquidity needs are met through deposits from banking clients and equity capital.
The excess cash held in certain Schwab brokerage client accounts is swept into deposit accounts at Schwab Bank. At December 31, 2012, these balances totaled $56.9 billion. Beginning in the fourth quarter of 2012, the excess cash held in certain optionsXpress, Inc. brokerage accounts was swept into deposit accounts at Schwab Bank, which totaled $1.3 billion at December 31, 2012.
Schwab Bank is subject to regulatory requirements that restrict and govern the terms of affiliate transactions, such as extensions of credit and repayment of loans between Schwab Bank and CSC or CSC’s other subsidiaries. In addition, Schwab Bank is required to provide notice to and may be required to obtain approval of the OCC and the Federal Reserve to declare dividends to CSC.
- 22 -

THE CHARLES SCHWAB CORPORATION Management’s Discussion and Analysis of Financial Condition and Results of Operations
(Tabular Amounts in Millions, Except Ratios, or as Noted) Schwab Bank is required to maintain capital levels as specified in federal banking laws and regulations. Failure to meet the minimum levels could result in certain mandatory, and possibly additional discretionary actions by the regulators that, if undertaken, could have a direct material effect on Schwab Bank. Based on its regulatory capital ratios at December 31, 2012, Schwab Bank is considered well capitalized. Schwab Bank’s regulatory capital and ratios at December 31, 2012, are as follows:
N/A Not applicable.
In the third quarter of 2012, management lowered its target Tier 1 Leverage Ratio for Schwab Bank from at least 7.5% to at least 6.25%. This change reflects Schwab Bank’s approach to lending and investing, which results in a lower risk profile relative to the industry and risk-based capital ratios significantly in excess of well capitalized levels. This allows greater flexibility in managing capital resources to either support Schwab Bank’s balance sheet growth or return capital to CSC.
Schwab Bank has access to traditional funding sources such as deposits, federal funds purchased, and repurchase agreements. Additionally, Schwab Bank has access to short-term funding through the Federal Reserve Bank (FRB) discount window. Amounts available under the FRB discount window are dependent on the fair value of certain of Schwab Bank’s securities available for sale and/or securities held to maturity that are pledged as collateral. Schwab Bank maintains policies and procedures necessary to access this funding and tests discount window borrowing procedures annually. At December 31, 2012, $2.8 billion was available under this arrangement. There were no funds drawn under this arrangement during 2012.
Schwab Bank maintains a credit facility with the Federal Home Loan Bank System. Amounts available under this facility are dependent on the amount of Schwab Bank’s residential real estate mortgages and HELOCs that are pledged as collateral. At December 31, 2012, $5.5 billion was available under this facility. There were no funds drawn under this facility during 2012.
CSC provides Schwab Bank with a $100 million short-term credit facility, which is scheduled to expire in December 2014. Borrowings under this facility do not qualify as regulatory capital for Schwab Bank. There were no funds drawn under these facilities during 2012.
optionsXpress
Liquidity needs relating to client trading and margin borrowing activities are met primarily through cash balances in brokerage client accounts, which were $1.1 billion at December 31, 2012. Management believes that brokerage client cash balances and operating earnings will continue to be the primary sources of liquidity for optionsXpress, Inc.
optionsXpress, Inc., a wholly-owned subsidiary of optionsXpress, is a registered broker-dealer and is subject to regulatory requirements that are intended to ensure the general financial soundness and liquidity of broker-dealers. These regulations prohibit optionsXpress, Inc. from paying cash dividends or making unsecured advances or loans to its parent company or employees if such payment would result in a net capital amount of less than 5% of aggregate debit balances or less than 120% of its minimum dollar requirement of $250,000. At December 31, 2012, optionsXpress Inc.’s net capital was $87 million (40% of aggregate debit balances), which was $82 million in excess of its minimum required net capital and $76 million in excess of 5% of aggregate debit balances.
optionsXpress, Inc. is also subject to Commodity Futures Trading Commission Regulation 1.17 (Reg. 1.17) under the Commodity Exchange Act, which also requires the maintenance of minimum net capital. optionsXpress, Inc. as a futures commission merchant, is required to maintain minimum net capital equal to the greater of its net capital requirement under
- 23 -
Minimum Capital
Minimum to be
Actual Requirement Well Capitalized
Amount Ratio Amount Ratio Amount Ratio
Tier 1 Risk-Based Capital $ 5,707 20.0% $ 1,139 4.0% $ 1,709 6.0% Total Risk-Based Capital $ 5,760 20.2% $ 2,279 8.0% $ 2,848 10.0% Tier 1 Leverage $ 5,707 6.7% $ 3,412 4.0% $ 4,266 5.0% Tangible Equity $ 5,707 6.7% $ 1,706 2.0% N/A

THE CHARLES SCHWAB CORPORATION Management’s Discussion and Analysis of Financial Condition and Results of Operations
(Tabular Amounts in Millions, Except Ratios, or as Noted) Reg. 1.17 ($1 million), or the sum of 8% of the total risk margin requirements for all positions carried in customer accounts and 8% of the total risk margin requirements for all positions carried in non-customer accounts (as defined in Reg. 1.17).
Additionally, optionsXpress, Inc. is subject to Rule 15c3-3 under the Securities Exchange Act of 1934 and other applicable regulations that require it to maintain cash or qualified securities in a segregated reserve account for the exclusive benefit of clients. These funds are included in cash and investments segregated and on deposit for regulatory purposes in the Company’s consolidated balance sheets and are not available as a general source of liquidity.
CSC provides optionsXpress, Inc. with a $200 million credit facility, which is scheduled to expire in December 2014. There were no borrowings outstanding under this facility at December 31, 2012. Borrowings under this facility do not qualify as regulatory capital for optionsXpress, Inc.
optionsXpress has a term loan with CSC, of which $89 million was outstanding at December 31, 2012, and it matures in December 2017.
Capital Resources
The Company monitors both the relative composition and absolute level of its capital structure. Management is focused on limiting the Company’s use of capital and currently targets a long-term debt to total financial capital ratio not to exceed 30%. The Company’s total financial capital (long-term debt plus stockholders’ equity) at December 31, 2012, was $11.2 billion, up $1.5 billion, or 16%, from December 31, 2011.
The Company’s cash position (reported as cash and cash equivalents on its consolidated balance sheets) and cash flows are affected by changes in brokerage client cash balances and the associated amounts required to be segregated under regulatory guidelines. Timing differences between cash and investments actually segregated on a given date and the amount required to be segregated for that date may arise in the ordinary course of business and are addressed by the Company in accordance with applicable regulations. Other factors which affect the Company’s cash position and cash flows include investment activity in security portfolios, levels of capital expenditures, acquisition and divestiture activity, banking client deposit activity, brokerage and banking client loan activity, financing activity in long-term debt, payments of dividends, and repurchases and issuances of CSC’s preferred and common stock. The combination of these factors can cause significant fluctuations in the cash position during specific time periods.
Long-term Debt
At December 31, 2012, the Company had long-term debt of $1.6 billion, or 15% of total financial capital, that bears interest at a weighted-average rate of 3.85%. At December 31, 2011, the Company had long-term debt of $2.0 billion, or 21% of total financial capital. For further discussion of the Company’s long-term debt, see “Liquidity and Capital Resources – Liquidity” and “Item 8 – Financial Statements and Supplementary Data – Notes to Consolidated Financial Statements – 14. Borrowings.”
In addition, the Company repaid $5 million of other long-term debt in 2012. The Company repaid $116 million of long-term debt in 2011, which included the pay off of long-term debt acquired from optionsXpress of $110 million subsequent to the acquisition date.
Capital Expenditures
The Company’s capital expenditures were $138 million (3% of net revenues) and $190 million (4% of net revenues) in 2012 and 2011, respectively. Capital expenditures in 2012 and 2011 were primarily for capitalized costs for developing internal-use software, software and equipment relating to the Company’s information technology systems, and leasehold improvements. Capitalized costs for developing internal-use software were $61 million and $57 million in 2012 and 2011, respectively.
Management currently anticipates that 2013 capital expenditures will be approximately 85% higher than 2012 primarily due to increased spending on buildings, leasehold improvements, and software and equipment relating to the Company’s information
- 24 -

THE CHARLES SCHWAB CORPORATION Management’s Discussion and Analysis of Financial Condition and Results of Operations
(Tabular Amounts in Millions, Except Ratios, or as Noted) technology systems. A majority of this increase is planned to be spent on buildings and leasehold improvements related to the consolidation and relocation of the Company’s existing office campus in Denver, Colorado. As in recent years, the Company adjusts its capital expenditures periodically as business conditions change. Management believes that funds generated by its operations will continue to be the primary funding source of its capital expenditures.
Equity Offerings
In January 2012, the Company issued and sold 400,000 shares of fixed-to-floating rate (currently fixed at 7.000%) non-cumulative perpetual preferred stock, Series A, with a liquidation preference of $1,000 per share for net proceeds of $394 million (Series A Preferred Stock). In June 2012, the Company issued and sold 485,000 shares of 6.00% non-cumulative perpetual preferred stock, Series B, with a liquidation preference of $1,000 per share for net proceeds of $469 million (Series B Preferred Stock). Net proceeds received from these sales were used for general corporate purposes. For further discussion of these equity offerings, see “Item 8 – Financial Statements and Supplementary Data – Notes to Consolidated Financial Statements – 18. Stockholders’ Equity.”
Dividends
CSC paid common stock cash dividends of $308 million ($0.24 per share) and $295 million ($0.24 per share) in 2012 and 2011, respectively. Since the initial dividend in 1989, CSC has paid 95 consecutive quarterly dividends and has increased the quarterly dividend rate 19 times, including a 20% increase in the third quarter of 2008. Since 1989, dividends have increased by a 23% compounded annual growth rate, excluding the special cash dividend of $1.00 per common share in 2007. While the payment and amount of dividends are at the discretion of the Board of Directors, subject to certain regulatory and other restrictions, the Company currently targets its cash dividend at approximately 20% to 30% of net income.
CSC paid Series A Preferred Stock cash dividends of $14 million ($36.17 per share) and Series B Preferred Stock cash dividends of $14 million ($29.17 per share) in 2012. On December 12, 2012, CSC declared a semi-annual dividend of $35.00 per share of Series A Preferred Stock that is payable February 1, 2013, to stockholders of record on January 17, 2013. Under the respective terms of the Series A Preferred Stock and Series B Preferred Stock, the Company’s ability to pay dividends on, make distributions with respect to, or to repurchase, redeem or acquire its common stock or any preferred stock ranking on parity with or junior to the relevant series of preferred stock, is subject to restrictions in the event that the Company does not declare and either pay or set aside a sum sufficient for payment of dividends on the relevant series of preferred stock for the immediately preceding dividend period. For further discussion of the Series A and Series B Preferred Stock offerings, see “Item 8 – Financial Statements and Supplementary Data – Notes to Consolidated Financial Statements – 18. Stockholders’ Equity.”
Share Repurchases
There were no repurchases of CSC’s common stock in 2012 or 2011. As of December 31, 2012, CSC had remaining authority from the Board of Directors to repurchase up to $596 million of its common stock, which does not have an expiration date.
Business Acquisitions
On December 14, 2012, the Company acquired ThomasPartners, Inc., a growth and dividend income-focused asset management firm, for $85 million in cash.
On September 1, 2011, the Company acquired optionsXpress, an online brokerage firm primarily focused on equity option securities and futures, for total consideration of $714 million. Under the terms of the merger agreement, optionsXpress stockholders received 1.02 shares of the Company’s common stock for each share of optionsXpress stock. As a result, the Company issued 59 million shares of the Company’s common stock valued at $710 million, based on the closing price of the Company’s common stock on September 1, 2011. The Company also assumed optionsXpress’ stock-based compensation awards valued at $4 million.
- 25 -

THE CHARLES SCHWAB CORPORATION Management’s Discussion and Analysis of Financial Condition and Results of Operations
(Tabular Amounts in Millions, Except Ratios, or as Noted) For more information on these acquisitions, see “Item 8 – Financial Statements and Supplementary Data – Notes to Consolidated Financial Statements – 3. Business Acquisitions.”
Off-Balance Sheet Arrangements
The Company enters into various off-balance sheet arrangements in the ordinary course of business, primarily to meet the needs of its clients. These arrangements include firm commitments to extend credit. Additionally, the Company enters into guarantees and other similar arrangements as part of transactions in the ordinary course of business. For information on each of these arrangements, see “Item 8 – Financial Statements and Supplementary Data – Notes to Consolidated Financial Statements – 15. Commitments and Contingencies.”
Contractual Obligations
The Company’s principal contractual obligations as of December 31, 2012, are shown in the following table. Management believes that funds generated by its continuing operations, as well as cash provided by external financing, will continue to be the primary funding sources in meeting these obligations. Excluded from this table are liabilities recorded on the consolidated balance sheet that are generally short-term in nature (e.g., payables to brokers, dealers, and clearing organizations) or without contractual payment terms (e.g., deposits from banking clients, payables to brokerage clients, and deferred compensation).
RISK MANAGEMENT
Overview
The Company’s business activities expose it to a variety of risks, including operational, credit, market, liquidity, and reputational risk. Identification and management of these risks are essential to the success and financial soundness of the Company.
The Board of Directors has approved an enterprise risk management framework that is commensurate with the size, risk profile, complexity, and continuing growth of the Company. Senior management takes an active role in the Company’s risk management process and has developed policies and procedures under which specific business and control units are responsible for identifying, measuring, and controlling various risks. The Global Risk Committee, which is comprised of senior managers of major business and control functions, is responsible for reviewing and monitoring the Company’s risk exposures and leading the continued development of the Company’s risk management policies and practices.
- 26 -
Less than1 Year
1-3Years
3-5Years
More than5 Years Total
Credit-related financial instruments $ 1,395 $ 981 $ 1,061 $ 2,975 $ 6,412 Long-term debt 58 467 361 1,091 1,977 Leases 91 148 107 166 512 Purchase obligations 159 139 7 1 306
Total $ 1,703 $ 1,735 $ 1,536 $ 4,233 $ 9,207
Represents Schwab Bank’s commitments to extend credit to banking clients and purchase mortgage loans. Includes estimated future interest payments through 2017 for Medium-Term Notes and through 2022 for Senior Notes. Amounts
exclude maturities under a finance lease obligation and unamortized discounts and premiums. Represents minimum rental commitments, net of sublease commitments, and includes facilities under the Company’s past
restructuring initiatives and rental commitments under a finance lease obligation. Consists of purchase obligations for services such as advertising and marketing, telecommunications, professional services, and
hardware- and software-related agreements. Includes purchase obligations that can be canceled by the Company without penalty.
(1)
(2)
(3)
(4)
(1)
(2)
(3)
(4)

THE CHARLES SCHWAB CORPORATION Management’s Discussion and Analysis of Financial Condition and Results of Operations
(Tabular Amounts in Millions, Except Ratios, or as Noted) Functional risk sub-committees focusing on specific areas of risk report into the Global Risk Committee. These sub-committees include the:
The Global Risk Committee reports regularly to the Audit and Risk Committees of the Board of Directors, which review major risk exposures and the steps management has taken to monitor and control such exposures.
The Company’s Disclosure Committee is responsible for monitoring and evaluating the effectiveness of the Company’s (a) disclosure controls and procedures and (b) internal control over financial reporting as of the end of each fiscal quarter. The Disclosure Committee reports on this evaluation to the CEO and CFO prior to their certification required by Sections 302 and 906 of the Sarbanes Oxley Act of 2002.
The Company’s compliance, finance, internal audit, legal, and corporate risk management departments assist management and the various risk committees in evaluating, testing, and monitoring the Company’s risk management.
Risk is inherent in the Company’s business. Consequently, despite the Company’s efforts to identify areas of risk and implement risk management policies and procedures, there can be no assurance that the Company will not suffer unexpected losses due to operational or other risks. The following discussion highlights the Company’s policies and procedures for identification, assessment, and management of the principal areas of risk in its operations.
Operational Risk
Operational risk is the potential for loss due to inadequate or failed internal processes, people, and systems or from external events and relationships impacting CSC and/or any of its key business partners and vendors. Operational risk includes fiduciary, legal and compliance risk, and each are also described in detail below.
The Company’s operations are highly dependent on the integrity of its technology systems and the Company’s success depends, in part, on its ability to make timely enhancements and additions to its technology in anticipation of evolving client needs. To the extent the Company experiences system interruptions, errors or downtime (which could result from a variety of causes, including changes in client use patterns, technological failure, changes to its systems, linkages with third-party systems, and power failures), the Company’s business and operations could be significantly negatively impacted. To minimize business interruptions, Schwab has two data centers intended, in part, to further improve the recovery of business processing in the event of an emergency. The Company is committed to an ongoing process of upgrading, enhancing, and testing its technology systems. This effort is focused on meeting client needs, meeting market and regulatory changes, and deploying standardized technology platforms.
Operational risk also includes the risk of human error, employee misconduct, external fraud, computer viruses, distributed denial of service attacks, terrorist attacks, and natural disaster. Employee misconduct could include fraud and misappropriation of client or Company assets, improper use or disclosure of confidential client or Company information, and unauthorized activities, such as transactions exceeding acceptable risks or authorized limits. External fraud includes
- 27 -
� Corporate Asset-Liability Management and Pricing Committee, which focuses on the Company’s liquidity, capital resources,
interest rate risk, and investments;
� Credit and Market Risk Oversight Committee, which focuses on credit exposures resulting from client borrowing activity
(e.g., margin lending activities and loans to banking clients), investing activities of certain of the Company’s proprietary funds, corporate credit and investment activity, and market risk resulting from the Company taking positions in certain securities to facilitate client trading activity;
� New Products & Services Subcommittee, which reviews the risks associated with the launch of new product classes, services
and offers;
� Operational Risk Oversight Committee, which provides oversight of and approves operational risk management policies, risk tolerance levels, and operational risk governance processes, and includes the following subcommittees:
Information Security and Privacy Committee, which oversees information security and privacy policies, procedures
and controls; and the Model Governance Committee, which provides oversight of model risk throughout the Company.
�
�

THE CHARLES SCHWAB CORPORATION Management’s Discussion and Analysis of Financial Condition and Results of Operations
(Tabular Amounts in Millions, Except Ratios, or as Noted) misappropriation of client or Company assets by third parties, including through unauthorized access to Company systems and data and client accounts. The frequency and sophistication of such fraud attempts continue to increase.
Operational risk is mitigated through a system of internal controls and risk management practices that are designed to keep operational risk and operational losses at levels appropriate to the inherent risk of the business in which the Company operates. The Company has specific policies and procedures to identify and manage operational risk, and uses periodic risk self-assessments and internal audit reviews to evaluate the effectiveness of these internal controls. The Company maintains backup and recovery functions, including facilities for backup and communications, and conducts periodic testing of disaster recovery plans. The Company also maintains policies and procedures and technology to protect against fraud and unauthorized access to systems and data.
Despite the Company’s risk management efforts, it is not always possible to deter or prevent technological or operational failure, or fraud or other misconduct, and the precautions taken by the Company may not be effective in all cases. The Company may be subject to litigation, losses, and regulatory actions in such cases, and may be required to expend significant additional resources to remediate vulnerabilities or other exposures.
The Company also faces operational risk when it employs the services of various external vendors, including domestic and international outsourcing of certain technology, processing, servicing, and support functions. The Company manages its exposure to external vendor risk through contractual provisions, control standards, and ongoing monitoring of vendor performance. The Company maintains policies and procedures regarding the standard of care expected with Company data, whether the data is internal company information, employee information, or non-public client information. The Company clearly defines for employees, contractors, and vendors the Company’s expected standards of care for confidential data. Regular training is provided by the Company in regard to data security.
The Company is actively engaged in the research and development of new technologies, services, and products. The Company endeavors to protect its research and development efforts, and its brands, through the use of copyrights, patents, trade secrets, and contracts.
Fiduciary Risk
Fiduciary risk is the potential for financial or reputational loss through breach of fiduciary duties to a client. Fiduciary activities include, but are not limited to, individual and institutional trust, investment management, custody, and cash and securities processing. The Company attempts to manage this risk by establishing procedures to ensure that obligations to clients are discharged faithfully and in compliance with applicable legal and regulatory requirements. Business units have the primary responsibility for adherence to the procedures applicable to their business. Guidance and control are provided through the creation, approval, and ongoing review of applicable policies by business units and various risk committees.
Legal and Compliance Risk
The Company faces significant legal and compliance risk in its business, and the volume of litigation and regulatory proceedings against financial services firms and the amount of damages claimed have been increasing. Among other things, these risks relate to the suitability of client investments, conflicts of interest, disclosure obligations and performance expectations for Company products and services, supervision of employees, and the adequacy of the Company’s controls. Claims against the Company may increase due to a variety of factors, such as if clients suffer losses during a period of deteriorating equity market conditions, as the Company increases the level of advice it provides to clients, and as the Company enhances the services it provides to IAs. In addition, the Company and its affiliates are subject to extensive regulation by federal, state and foreign regulatory authorities, and SROs, and such regulation is becoming increasingly extensive and complex.
The Company attempts to manage legal and compliance risk through policies and procedures reasonably designed to avoid litigation claims and prevent or detect violations of applicable legal and regulatory requirements. These procedures address issues such as business conduct and ethics, sales and trading practices, marketing and communications, extension of credit,
- 28 -

THE CHARLES SCHWAB CORPORATION Management’s Discussion and Analysis of Financial Condition and Results of Operations
(Tabular Amounts in Millions, Except Ratios, or as Noted) client funds and securities, books and records, anti-money laundering, client privacy, employment policies, and contracts management. Despite the Company’s efforts to maintain an effective compliance program and internal controls, legal breaches and rule violations could result in reputational harm, significant losses and disciplinary sanctions, including limitations on the Company’s business activities.
Credit Risk
Credit risk is the potential for loss due to a borrower, counterparty, or issuer failing to perform its contractual obligations. The Company’s direct exposure to credit risk mainly results from margin lending activities, securities lending activities, mortgage lending activities, its role as a counterparty in financial contracts and other investing activities. To manage the risks of such losses, the Company has established policies and procedures which include: establishing and reviewing credit limits, monitoring of credit limits and quality of counterparties, and adjusting margin requirements for certain securities. Collateral arrangements relating to margin loans, securities lending agreements, and resale agreements include provisions that require additional collateral in the event that market fluctuations result in declines in the value of collateral received. Additionally, for margin loan and securities lending agreements, collateral arrangements require that the fair value of such collateral exceeds the amounts loaned.
The Company’s credit risk exposure related to loans to banking clients is actively managed through individual and portfolio reviews performed by management. Management regularly reviews asset quality including concentrations, delinquencies, nonaccrual loans, charge-offs, and recoveries. All are factors in the determination of an appropriate allowance for loan losses, which is reviewed quarterly by management. The Company’s mortgage loan portfolios primarily include First Mortgages of $6.5 billion and HELOCs of $3.3 billion at December 31, 2012.
The Company’s First Mortgage portfolio underwriting requirements are generally consistent with the underwriting requirements in the secondary market for loan portfolios. The Company’s underwriting guidelines include maximum loan-to-value (LTV) ratios, cash out limits, and minimum Fair Isaac Corporation (FICO) credit scores. The specific guidelines are dependent on the individual characteristics of a loan (for example, whether the property is a primary or secondary residence, whether the loan is for investment property, whether the loan is for an initial purchase of a home or refinance of an existing home, and whether the loan is conforming or jumbo). These credit underwriting standards have limited the exposure to the types of loans that experienced high foreclosures and loss rates elsewhere in the industry in recent years. There have been no significant changes to the LTV ratio or FICO credit score underwriting guidelines related to the Company’s First Mortgage or HELOC portfolios during 2012. The Company does not offer loans that allow for negative amortization and does not originate or purchase subprime loans (generally defined as extensions of credit to borrowers with a FICO credit score of less than 620 at origination), unless the borrower has compensating credit factors. At December 31, 2012, approximately 1% of both the First Mortgage and HELOC portfolios consisted of loans to borrowers with updated FICO credit scores of less than 620.
At December 31, 2012, the weighted-average originated LTV ratios were 60% and 59% for the First Mortgage and HELOC portfolios, respectively. The computation of the origination LTV ratio for a HELOC includes any first lien mortgage outstanding on the same property at the time of origination. At December 31, 2012, 22% of HELOCs ($725 million of the HELOC portfolio) were in a first lien position. The weighted-average originated FICO credit score was 768 for both the First Mortgage and HELOC portfolios.
The Company monitors the estimated current LTV ratios of its First Mortgage and HELOC portfolios on an ongoing basis. At December 31, 2012, the weighted-average estimated current LTV ratios were 62% and 72% for the First Mortgage and HELOC portfolios, respectively. The computation of the estimated current LTV ratio for a HELOC includes any first lien mortgage outstanding on the same property at the time of the HELOC’s origination. The Company estimates the current LTV ratio for each loan by reference to a home price appreciation index. The Company also monitors updated borrower FICO scores, delinquency trends, and verified liquid assets held by individual borrowers. At December 31, 2012, the weighted-average updated FICO scores were 768 and 767 for the First Mortgage and HELOC portfolios, respectively.
A portion of the Company’s HELOC portfolio is secured by second liens on the associated properties. Second lien mortgage loans possess a higher degree of credit risk given the subordination to the first lien holder in the event of default. At
- 29 -

THE CHARLES SCHWAB CORPORATION Management’s Discussion and Analysis of Financial Condition and Results of Operations
(Tabular Amounts in Millions, Except Ratios, or as Noted) December 31, 2012, $2.6 billion, or 78%, of the HELOC portfolio was in a second lien position. In addition to the credit monitoring activities described above, the Company also monitors credit risk on second lien HELOC loans by reviewing the delinquency status of the first lien loan on the associated property, when such status is available. The portion of the Company’s second lien HELOC portfolio for which the Company either holds the first lien or has the ability to monitor the delinquency status of the related first mortgage was $477 million, or 15%, of the HELOC portfolio at December 31, 2012. Additionally, at December 31, 2012, approximately 35% of the HELOC borrowers that had a balance only paid the minimum amount due.
For more information on the Company’s credit quality indicators relating to its First Mortgage and HELOC portfolios, including delinquency characteristics, borrower FICO scores at origination, updated borrower FICO scores, LTV ratios at origination, and estimated current LTV ratios, see “Item 8 – Financial Statements and Supplementary Data – Notes to Consolidated Financial Statements – 7. Loans to Banking Clients and Related Allowance for Loan Losses.”
The following table presents certain of the Company’s loan quality metrics as a percentage of total outstanding loans:
The Company has exposure to credit risk associated with its securities available for sale and securities held to maturity portfolios, whose fair values totaled $46.1 billion and $18.7 billion at December 31, 2012, respectively. These portfolios include U.S. agency and non-agency mortgage-backed securities, asset-backed securities, corporate debt securities, certificates of deposit, U.S. agency notes, commercial paper, and other securities. U.S. agency mortgage-backed securities do not have explicit credit ratings, however, management considers these to be of the highest credit quality and rating given the guarantee of principal and interest by the U.S. government-sponsored enterprises. Included in non-agency residential mortgage-backed securities are securities collateralized by loans that are considered to be “Prime” (defined by the Company as loans to borrowers with a FICO credit score of 620 or higher at origination), and “Alt-A” (defined by the Company as Prime loans with reduced documentation at origination).
Residential mortgage-backed securities, particularly Alt-A securities, experienced continued credit deterioration in 2012, including increased payment delinquency rates and losses on foreclosures of underlying mortgages. For a discussion of the impact of current market conditions on residential mortgage-backed securities, see “Current Market and Regulatory Environment and Other Developments.” At December 31, 2012, the amortized cost of non-agency residential mortgage-backed securities represented 2% of the total mortgage-backed securities portfolio. These securities were originated between 2003 and 2007. At December 31, 2012, all of the corporate debt securities and non-mortgage asset-backed securities were rated investment grade (defined as a rating equivalent to a Moody’s rating of “Baa” or higher, or a Standard & Poor’s rating of “BBB-” or higher).
Schwab performs clearing services for all securities transactions in its client accounts. Schwab has exposure to credit risk due to its obligation to settle transactions with clearing corporations, mutual funds, and other financial institutions even if Schwab’s client or a counterparty fails to meet its obligations to Schwab.
The Company sponsors a number of proprietary money market mutual funds and other proprietary funds. Although the Company has no obligation to do so, the Company may decide for competitive reasons to provide credit, liquidity or other support to its funds in the event of significant declines in valuation of fund holdings or significant redemption activity that exceeds available liquidity. Such support could cause the Company to take significant charges and could reduce the Company’s liquidity. If the Company chose not to provide credit, liquidity or other support in such a situation, the Company could suffer reputational damage and its business could be adversely affected.
- 30 -
December 31, 2012 2011
Loan delinquencies 0.77% 0.81% Nonaccrual loans 0.45% 0.53% Allowance for loan losses 0.52% 0.55%
Loan delinquencies are defined as loans that are 30 days or more past due.
(1)
(1)

THE CHARLES SCHWAB CORPORATION Management’s Discussion and Analysis of Financial Condition and Results of Operations
(Tabular Amounts in Millions, Except Ratios, or as Noted) Concentration Risk
The Company has exposure to concentration risk when holding large positions in financial instruments collateralized by assets with similar economic characteristics or in securities of a single issuer or industry.
The fair value of the Company’s investments in mortgage-backed securities totaled $39.5 billion at December 31, 2012. Of these, $38.8 billion were issued by U.S. agencies and $733 million were issued by private entities (non-agency securities). The U.S. agency securities are included in securities available for sale and securities held to maturity and the non-agency securities are included in securities available for sale. Included in non-agency residential mortgage-backed securities are securities collateralized by Alt-A loans. At December 31, 2012, the amortized cost and fair value of Alt-A mortgage-backed securities were $308 million and $269 million, respectively.
The Company’s investments in corporate debt securities and commercial paper totaled $8.0 billion at December 31, 2012, with the majority issued by institutions in the financial services industry. These securities are included in securities available for sale, securities held to maturity, cash and cash equivalents, and other securities owned in the Company’s consolidated balance sheets.
The Company’s loans to banking clients include $6.0 billion of adjustable rate first lien residential real estate mortgage loans at December 31, 2012. The Company’s adjustable rate mortgages have initial fixed interest rates for three to ten years and interest rates that adjust annually thereafter. Approximately 50% of these mortgages consisted of loans with interest-only payment terms. The interest rates on approximately 65% of these interest-only loans are not scheduled to reset for three or more years. The Company’s mortgage loans do not include interest terms described as temporary introductory rates below current market rates. At December 31, 2012, 45% of the residential real estate mortgages and 50% of the HELOC balances were secured by properties which are located in California.
The Company’s HELOC product has a 30-year loan term with an initial draw period of 10 years from the date of origination. After the initial draw period, the balance outstanding at such time is converted to a 20-year amortizing loan. The interest rate during the initial draw period and the 20-year amortizing period is a floating rate based on the prime rate plus a margin. The following table presents when current outstanding HELOCs will convert to amortizing loans:
As of December 31, 2012, all of the Company’s HELOC loans are within the 10-year initial draw period, and as such, none of the HELOCs have converted to an amortizing loan.
The Company also has exposure to concentration risk from its margin and securities lending activities collateralized by securities of a single issuer or industry. This concentration risk is mitigated by collateral arrangements that require the fair value of such collateral exceeds the amounts loaned.
The Company has indirect exposure to U.S. Government and agency securities held as collateral to secure its resale agreements. The Company’s primary credit exposure on these resale transactions is with its counterparty. The Company would have exposure to the U.S. Government and agency securities only in the event of the counterparty’s default on the resale agreements. The fair value of U.S. Government and agency securities held as collateral for resale agreements totaled $19.7 billion at December 31, 2012.
- 31 -
December 31, 2012 Balance
Within 1 year $ 152 > 1 year – 3 years 598 > 3 years – 5 years 436 > 5 years 2,101
Total $ 3,287

THE CHARLES SCHWAB CORPORATION Management’s Discussion and Analysis of Financial Condition and Results of Operations
(Tabular Amounts in Millions, Except Ratios, or as Noted) European Holdings
The Company has exposure to non-sovereign financial and non-financial institutions in Europe. The following table shows the balances of this exposure by each country in Europe in which the issuer or counterparty is domiciled. The Company has no direct exposure to sovereign governments in Europe. The Company does not have unfunded commitments to counterparties in Europe, nor does it have exposure as a result of credit default protection purchased or sold separately as of December 31, 2012.
The determination of the domicile of exposure varies by the type of investment. For time deposits and certificates of deposit, the exposure is grouped in the country in which the financial institution is chartered under the regulatory framework of the European country. For asset-backed commercial paper, the exposure is grouped by the country of the sponsoring bank that provides the credit and liquidity support for such instruments. For corporate debt securities, the exposure is grouped by the country in which the issuer is domiciled. In situations in which the Company invests in a corporate debt security of a U.S. subsidiary of a European parent company, such holdings will be attributable to the European country only if significant reliance is placed on the European parent company for credit support underlying the security. For substantially all of the holdings listed below, the issuers or counterparties were financial institutions. All of the Company’s resale agreements, which are included in investments segregated and on deposit for regulatory purposes, are collateralized by U.S. government securities. Additionally, the Company’s securities lending activities are collateralized by cash. Therefore, the Company’s resale agreements and securities lending activities are not included in the table below even if the counterparty is a European institution. Fair Value as of December 31, 2012
Denmark France Germany Italy Netherlands Norway Sweden Switzerland
United Kingdom Total
Cash equivalents:
Time deposits $ - $ 500 $ - $ - $ - $ - $ - $ - $ 200 $ 700 Commercial
paper - 45 - 100 - - - - 100 245
Cash and investments segregated and on deposit for regulatory purposes:
Trust deposits - - 400 - - - - - - 400
Securities
available for sale:
Certificates of deposit - 100 300 - 100 200 1,201 802 1,100 3,803
Corporate debt securities 213 - - - 193 - 101 - 307 814
Commercial paper - 100 - - - - - - 400 500
Securities held
to maturity:
Corporate debt securities - - - - - - - 100 - 100
Total fair value $ 213 $745 $ 700 $ 100 $ 293 $ 200 $1,302 $ 902 $2,107 $6,562
Total amortized cost $ 212 $745 $ 700 $ 100 $ 292 $ 200 $1,300 $ 900 $2,103 $6,552
(1)

- 32 -
Maturities:
Overnight $ - $500 $ 400 $ - $ - $ - $ - $ - $ 200 $1,100 1 day – < 6
months 113 245 300 100 70 100 200 225 1,201 2,554 6 months – < 1
year 100 - - - 123 - 501 501 298 1,523 1 year – 2 years - - - - 100 100 601 176 304 1,281 > 2 years - - - - - - - - 104 104
Total fair value $ 213 $745 $ 700 $ 100 $ 293 $ 200 $1,302 $ 902 $2,107 $6,562
The exposures in Denmark are also backed by the full faith and credit of the Danish government. (1)

THE CHARLES SCHWAB CORPORATION Management’s Discussion and Analysis of Financial Condition and Results of Operations
(Tabular Amounts in Millions, Except Ratios, or as Noted) In addition to the direct holdings of European companies listed above, the Company also has indirect exposure to Europe through its investments in Schwab sponsored money market funds (collectively, the Funds) resulting from clearing activities. At December 31, 2012, the Company had $329 million in investments in these Funds. Certain of the Funds’ positions include certificates of deposits, time deposits, commercial paper and corporate debt securities issued by counterparties in Europe.
Management mitigates exposure to European holdings by employing a separate team of credit analysts that evaluate each issuer, counterparty, and country. Management monitors its exposure to European issuers by 1) performing risk assessments of the foreign countries, which include evaluating the size of the country and economy, currency trends, political landscape and the countries’ regulatory environment and developments, 2) performing ad hoc stress tests that evaluate the impact of sovereign governments’ debt write-downs on the issuers and counterparties to our investments, 3) reviewing publicly available stress tests that are published by various regulators in the European market, 4) establishing credit and maturity limits by issuer, and 5) monitoring aggregate exposures by country.
Market Risk
Market risk is the potential for changes in revenue or the value of financial instruments held by the Company as a result of fluctuations in interest rates, equity prices or market conditions. For discussion of the Company’s market risk, see “Item 7A – Quantitative and Qualitative Disclosures About Market Risk.”
FAIR VALUE OF FINANCIAL INSTRUMENTS
The Company uses fair value measurements to record certain financial assets and liabilities at fair value, and to determine fair value disclosures. Assets are measured at fair value using quoted prices or market-based information and accordingly are classified as Level 1 or Level 2 measurements in accordance with the fair value hierarchy described in fair value measurement accounting guidance. Liabilities recorded at fair value were not material at December 31, 2012 or 2011. See “Item 8 – Financial Statements and Supplementary Data – Notes to Consolidated Financial Statements – 2. Summary of Significant Accounting Policies and 17. Fair Values of Assets and Liabilities” for more information on the Company’s assets and liabilities recorded at fair value.
When available, the Company uses quoted prices in active markets to measure the fair value of assets and liabilities. When utilizing market data with a bid-ask spread, the Company uses the price within the bid-ask spread that best represents fair value. When quoted prices do not exist, the Company uses prices obtained from independent third-party pricing services to measure the fair value of investment assets. The Company generally obtains prices from at least three independent pricing sources for assets recorded at fair value and may obtain up to five prices on assets with higher risk of limited observable information, such as non-agency residential mortgage-backed securities. The Company’s primary independent pricing service provides prices based on observable trades and discounted cash flows that incorporate observable information such as yields for similar types of securities (a benchmark interest rate plus observable spreads) and weighted-average maturity for the same or similar “to-be-issued” securities. The Company compares the prices obtained from its primary independent pricing service to the prices obtained from the additional independent pricing services to determine if the price obtained from the primary independent pricing service is reasonable. The Company does not adjust the prices received from independent third-party pricing services unless such prices are inconsistent with the definition of fair value and result in a material difference in the recorded amounts. At December 31, 2012 and 2011, the Company did not adjust prices received from the primary independent third-party pricing service.
CRITICAL ACCOUNTING ESTIMATES
The consolidated financial statements of the Company have been prepared in accordance with accounting principles generally accepted in the U.S. While the majority of the Company’s revenues, expenses, assets and liabilities are not based on estimates, there are certain accounting principles that require management to make estimates regarding matters that are uncertain and susceptible to change where such change may result in a material adverse impact on the Company’s financial position and
- 33 -

THE CHARLES SCHWAB CORPORATION Management’s Discussion and Analysis of Financial Condition and Results of Operations
(Tabular Amounts in Millions, Except Ratios, or as Noted) reported financial results. These critical accounting estimates are described below. Management regularly reviews the estimates and assumptions used in the preparation of the Company’s financial statements for reasonableness and adequacy.
Other-than-Temporary Impairment of Securities Available for Sale and Securities Held to Maturity
Management evaluates whether securities available for sale and securities held to maturity are other-than-temporarily impaired (OTTI) on a quarterly basis. Debt securities with unrealized losses are considered OTTI if the Company intends to sell the security or if it is more likely than not that the Company will be required to sell such security prior to any anticipated recovery. If management determines that a security is OTTI under these circumstances, the impairment recognized in earnings is measured as the entire difference between the amortized cost and the then-current fair value.
A security is also OTTI if management does not expect to recover the amortized cost of the security. In this circumstance, management utilizes cash flow models to estimate the expected future cash flow from the securities and to estimate the credit loss. The impairment recognized in earnings is measured by the difference between the present value of expected cash flows and the amortized cost of the security. Expected cash flows are discounted using the security’s effective interest rate.
The evaluation of whether the Company expects to recover the amortized cost of a security is inherently judgmental. The evaluation includes the assessment of several bond performance indicators including: the portion of the underlying loans that are delinquent (30 days, 60 days, 90+ days), in bankruptcy, in foreclosure or converted to real estate owned; the actual amount of loss incurred on the underlying loans in which the property has been foreclosed and sold; the amount of credit support provided by the structure of the security available to absorb credit losses on the underlying loans; the current price and magnitude of the unrealized loss; and whether the Company has received all scheduled principal and interest payments. Management uses cash flow models to further assess the likelihood of other-than-temporary impairment for the Company’s non-agency residential mortgage-backed securities. To develop the cash flow models, the Company uses forecasted loss severity, prepayment speeds (i.e. the rate at which the principal on underlying loans are paid down), and default rates over the securities’ expected remaining maturities.
Valuation of Goodwill
The Company tests goodwill for impairment at least annually, or whenever indications of impairment exist. Impairment exists when the carrying amount of goodwill exceeds its implied fair value, resulting in an impairment charge for this excess. Adverse changes in the Company’s planned business operations such as unanticipated competition, a loss of key personnel, the sale of a reporting unit or a significant portion of a reporting unit, or other unforeseen developments could result in an impairment of the Company’s recorded goodwill.
The Company’s annual goodwill impairment testing date is April 1 . In testing for a potential impairment of goodwill on April 1, 2012, the fair values of the Company’s reporting units (generally defined as the Company’s businesses for which financial information is available and reviewed regularly by management) substantially exceeded their carrying values, and therefore management concluded that no amount of goodwill was impaired. The estimated fair values of the reporting units were established using a discounted cash flow model that includes significant assumptions about the future operating results and cash flows of each reporting unit and a market capitalization analysis. As allowed by applicable accounting standards, the Company can elect to qualitatively assess goodwill for impairment if it is more likely than not that the fair value of a reporting unit exceeds its carrying value.
Allowance for Loan Losses
The appropriateness of the allowance is reviewed quarterly by management, taking into consideration current economic conditions, the existing loan portfolio composition, past loss experience, and risks inherent in the portfolio.
The methodology to establish an allowance for loan losses utilizes statistical models that estimate prepayments, defaults, and probable losses for the loan segments based on predicted behavior of individual loans within the segments. The methodology considers the effects of borrower behavior and a variety of factors including, but not limited to, interest rates, housing price
- 34 -
st

THE CHARLES SCHWAB CORPORATION Management’s Discussion and Analysis of Financial Condition and Results of Operations
(Tabular Amounts in Millions, Except Ratios, or as Noted) movements as measured by a housing price index, economic conditions, estimated defaults and foreclosures measured by historical and expected delinquencies, changes in prepayment speeds, loan-to-value (LTV) ratios, past loss experience, estimates of future loss severities, borrower credit risk measured by FICO scores, and the adequacy of collateral. The methodology also evaluates concentrations in the loan segments including loan products, year of origination, geographical distribution of collateral, and the portion of borrowers who have other client relationships with the Company.
Probable losses are forecast using a loan-level simulation of the delinquency status of the loans over the term of the loans. The simulation starts with the current relevant risk indicators, including the current delinquent status of each loan, the estimated current LTV ratio of each loan, the term and structure of each loan, current key interest rates including U.S. Treasury and London Interbank Offered Rate (LIBOR) rates, and borrower FICO scores. The more significant variables in the simulation include delinquency roll rates, loss severity, housing prices, and interest rates. Delinquency roll rates (i.e., the rates at which loans transition through delinquency stages and ultimately result in a loss) are estimated from the Company’s historical loss experience adjusted for current trends and market information. Further, the delinquency roll rates within the loan-level simulation discussed above are calibrated to match a moving average of the delinquency roll rates actually experienced in the respective First Mortgage and HELOC portfolios. Loss severity estimates are based on the Company’s historical loss experience and market trends. The estimated loss severity (i.e. loss given default) used in the allowance for loan loss methodology for HELOCs is higher than that used in the methodology for First Mortgages. Housing price trends are derived from historical home price indices and econometric forecasts of future home values. Factors affecting the home price index include: housing inventory, unemployment, interest rates, and inflation expectations. Interest rate projections are based on the current term structure of interest rates and historical volatilities to project various possible future interest rate paths. As a result, the current state of house prices, including the decrease in general house prices experienced over the last several years, as well as the current state of delinquencies unique to the Company’s First Mortgage and HELOC portfolios, are considered in the allowance for loan loss methodology.
This methodology results in loss factors that are applied to the outstanding balances to determine the allowance for loan loss for each loan segment.
Legal and Regulatory Reserves
Reserves for legal and regulatory claims and proceedings reflect an estimate of probable losses for each matter, after considering, among other factors, the progress of the case, prior experience and the experience of others in similar cases, available defenses, insurance coverage and indemnification, and the opinions and views of legal counsel. In many cases, including most class action lawsuits, it is not possible to determine whether a loss will be incurred, or to estimate the range of that loss, until the matter is close to resolution, in which case no accrual is made until that time. Reserves are adjusted as more information becomes available or when an event occurs requiring a change. Significant judgment is required in making these estimates, and the actual cost of resolving a matter may ultimately differ materially from the amount reserved.
The Company’s management has discussed the development and selection of these critical accounting estimates with the Audit Committee. Additionally, management has reviewed with the Audit Committee the Company’s significant estimates discussed in this Management’s Discussion and Analysis of Financial Condition and Results of Operations.
FORWARD-LOOKING STATEMENTS
In addition to historical information, this Annual Report on Form 10-K contains “forward-looking statements” within the meaning of Section 27A of the Securities Act, and Section 21E of the Securities Exchange Act of 1934. Forward-looking statements are identified by words such as “believe,” “anticipate,” “expect,” “intend,” “plan,” “will,” “may,” “estimate,” “appear,” “aim,” “target,” “could,” and other similar expressions. In addition, any statements that refer to expectations, projections, or other characterizations of future events or circumstances are forward-looking statements.
- 35 -

THE CHARLES SCHWAB CORPORATION Management’s Discussion and Analysis of Financial Condition and Results of Operations
(Tabular Amounts in Millions, Except Ratios, or as Noted) These forward-looking statements, which reflect management’s beliefs, objectives, and expectations as of the date hereof, are necessarily estimates based on the best judgment of the Company’s senior management. These statements relate to, among other things:
Achievement of the expressed beliefs, objectives and expectations described in these statements is subject to certain risks and uncertainties that could cause actual results to differ materially from the expressed beliefs, objectives, and expectations. Readers are cautioned not to place undue reliance on these forward-looking statements, which speak only as of the date of this Annual Report on Form 10-K or, in the case of documents incorporated by reference, as of the date of those documents.
Important factors that may cause actual results to differ include, but are not limited to:
- 36 -
� the Company’s ability to pursue its business strategy (see “Part I – Item 1. – Business – Business Strategy and Competitive
Environment”);
� the expected impact of the Federal Reserve’s NPRs (see “Part I – Item 1A. – Risk Factors” and “Current Market and Regulatory Environment and Other Developments”);
� the impact of legal proceedings and regulatory matters (see “Part I – Item 3. – Legal Proceedings” and “Item 8 – Financial Statements and Supplementary Data – Notes to Consolidated Financial Statements –15. Commitments and Contingencies –Legal Contingencies”);
� the impact of current market conditions on the Company’s results of operations (see “Current Market and Regulatory Environment and Other Developments,” “Results of Operations – Net Interest Revenue,” and “Item 8 – Financial Statements and Supplementary Data – Notes to Consolidated Financial Statements – 6. Securities Available for Sale and Securities Held to Maturity”);
� sources of liquidity, capital, and level of dividends (see “Part I – Item 1. – Business – Regulation,” “Liquidity and Capital Resources,” “Contractual Obligations,” and “Item 8 – Financial Statements and Supplementary Data – Notes to Consolidated Financial Statements – 24. Regulatory Requirements”);
� target capital ratios (see “Liquidity and Capital Resources” and “Item 8 – Financial Statements and Supplementary Data –
Notes to Consolidated Financial Statements – 24. Regulatory Requirements”); � capital expenditures (see “Liquidity and Capital Resources – Capital Resources – Capital Expenditures”);
� the impact of changes in management’s estimates on the Company’s results of operations (see “Critical Accounting
Estimates”);
� the impact of changes in the likelihood of indemnification and guarantee payment obligations on the Company’s results of operations (see “Item 8 – Financial Statements and Supplementary Data – Notes to Consolidated Financial Statements – 15. Commitments and Contingencies”); and
� the impact on the Company’s results of operations of recording stock option expense (see “Item 8 – Financial Statements and Supplementary Data – Notes to Consolidated Financial Statements – 20. Employee Incentive, Retirement, and Deferred Compensation Plans”).
� changes in general economic and financial market conditions; � changes in revenues and profit margin due to changes in interest rates; � adverse developments in litigation or regulatory matters; �
the extent of any charges associated with litigation and regulatory matters; � amounts recovered on insurance policies; � the Company’s ability to attract and retain clients and grow client assets and relationships; � the Company’s ability to develop and launch new products, services and capabilities in a timely and successful manner; � fluctuations in client asset values due to changes in equity valuations; � the Company’s ability to monetize client assets; � the performance or valuation of securities available for sale and securities held to maturity; � trading activity; � the level of interest rates, including yields available on money market mutual fund eligible instruments; � the adverse impact of financial reform legislation and related regulations; � the amount of loans to the Company’s brokerage and banking clients; � the level of the Company’s stock repurchase activity; � the level of brokerage client cash balances and deposits from banking clients;

THE CHARLES SCHWAB CORPORATION Management’s Discussion and Analysis of Financial Condition and Results of Operations
(Tabular Amounts in Millions, Except Ratios, or as Noted)
Certain of these factors, as well as general risk factors affecting the Company, are discussed in greater detail in this Annual Report on Form 10-K, including “Item 1A - Risk Factors.”
- 37 -
� the availability and terms of external financing; � capital needs; � level of expenses; � competitive pressures on rates and fees; �
acquisition integration costs;
� the timing and impact of changes in the Company’s level of investments in buildings, leasehold improvements, and
software and equipment relating to its information technology systems; and � potential breaches of contractual terms for which the Company has guarantee obligations.

THE CHARLES SCHWAB CORPORATION
TABLE OF CONTENTS
- 38 -
Item 8. Financial Statements and Supplementary Data
Consolidated Statements of Income 39 Consolidated Statements of Comprehensive Income 40 Consolidated Balance Sheets 41 Consolidated Statements of Cash Flows 42 Consolidated Statements of Stockholders’ Equity 43 Notes to Consolidated Financial Statements 44 Note 1. Introduction and Basis of Presentation 44 Note 2. Summary of Significant Accounting Policies 44 Note 3. Business Acquisitions 50 Note 4. Receivables from Brokerage Clients 52 Note 5. Other Securities Owned 53 Note 6. Securities Available for Sale and Securities Held to Maturity 53 Note 7. Loans to Banking Clients and Related Allowance for Loan Losses 57 Note 8. Equipment, Office Facilities, and Property 61 Note 9. Intangible Assets and Goodwill 61 Note 10. Other Assets 62 Note 11. Deposits from Banking Clients 62 Note 12. Payables to Brokers, Dealers, and Clearing Organizations 62 Note 13. Payables to Brokerage Clients 63 Note 14. Borrowings 63 Note 15. Commitments and Contingencies 65 Note 16. Financial Instruments Subject to Off-Balance Sheet Risk, Credit Risk, or Market Risk 67 Note 17. Fair Values of Assets and Liabilities 69 Note 18. Stockholders’ Equity 72 Note 19. Accumulated Other Comprehensive Income (Loss) 73 Note 20. Employee Incentive, Retirement, and Deferred Compensation Plans 73 Note 21. Class Action Litigation and Regulatory Reserve and Money Market Mutual Fund Charges 76 Note 22. Taxes on Income 76 Note 23. Earnings Per Common Share 77 Note 24. Regulatory Requirements 78 Note 25. Segment Information 79 Note 26. Subsequent Events 80 Note 27. The Charles Schwab Corporation – Parent Company Only Financial Statements 81 Note 28. Quarterly Financial Information (Unaudited) 83 Report of Independent Registered Public Accounting Firm 84 Management’s Report on Internal Control Over Financial Reporting 85

THE CHARLES SCHWAB CORPORATION
Consolidated Statements of Income (In Millions, Except Per Share Amounts)
See Notes to Consolidated Financial Statements.
- 39 -
Year Ended December 31, 2012 2011 2010
Net Revenues
Asset management and administration fees $ 2,043 $ 1,928 $ 1,822 Interest revenue 1,914 1,900 1,723 Interest expense (150) (175) (199)
Net interest revenue 1,764 1,725 1,524 Trading revenue 868 927 830 Other — net 256 160 135 Provision for loan losses (16) (18) (27) Net impairment losses on securities (32) (31) (36)
Total net revenues 4,883 4,691 4,248
Expenses Excluding Interest
Compensation and benefits 1,803 1,732 1,573 Professional services 388 387 341 Occupancy and equipment 311 301 272 Advertising and market development 241 228 196 Communications 220 220 207 Depreciation and amortization 196 155 146 Class action litigation and regulatory reserve - 7 320 Money market mutual fund charges - - 132 Other 274 269 282
Total expenses excluding interest 3,433 3,299 3,469
Income before taxes on income 1,450 1,392 779 Taxes on income 522 528 325
Net Income 928 864 454
Preferred stock dividends 45 - -
Net Income Available to Common Stockholders $ 883 $ 864 $ 454
Weighted-Average Common Shares Outstanding — Diluted 1,275 1,229 1,194
Earnings Per Common Share — Basic $ .69 $ .70 $ .38
Earnings Per Common Share — Diluted $ .69 $ .70 $ .38
Net impairment losses on securities include total other-than-temporary impairment losses of $15 million, $18 million, and $41 million, net of $(17) million, $(13) million, and $5 million recognized in other comprehensive income in 2012, 2011, and 2010, respectively.
(1)
(1)

THE CHARLES SCHWAB CORPORATION
Consolidated Statements of Comprehensive Income (In Millions)
See Notes to Consolidated Financial Statements.
- 40 -
Year Ended December 31, 2012 2011 2010
Net income $ 928 $ 864 $ 454
Other comprehensive income (loss), before tax:
Change in net unrealized gain on securities available for sale:
Net unrealized gain (loss) 470 (43) 300 Reclassification of impairment charges included in earnings 32 31 36 Other reclassifications included in earnings (38) 1 1
Other 1 (1) (1)
Other comprehensive income (loss), before tax 465 (12) 336
Income tax effect 175 (4) 129
Other comprehensive income (loss), net of tax 290 (8) 207
Comprehensive Income $ 1,218 $ 856 $ 661

THE CHARLES SCHWAB CORPORATION
Consolidated Balance Sheets (In Millions, Except Per Share and Share Amounts)
See Notes to Consolidated Financial Statements.
- 41 -
December 31, 2012 2011
Assets
Cash and cash equivalents $ 12,663 $ 8,679 Cash and investments segregated and on deposit for regulatory purposes (including resale
agreements of $19,325 and $17,899 at December 31, 2012 and 2011, respectively) 28,469 26,034 Receivables from brokers, dealers, and clearing organizations 333 230 Receivables from brokerage clients — net 13,458 11,072 Other securities owned — at fair value 636 593 Securities available for sale 46,123 33,965 Securities held to maturity (fair value — $18,732 and $15,539 at December 31, 2012 and 2011,
respectively) 18,194 15,108 Loans to banking clients — net 10,726 9,812 Loans held for sale - 70 Equipment, office facilities, and property — net 675 685 Goodwill 1,228 1,161 Intangible assets — net 319 326 Other assets 813 818
Total assets $ 133,637 $ 108,553
Liabilities and Stockholders’ Equity Deposits from banking clients $ 79,377 $ 60,854 Payables to brokers, dealers, and clearing organizations 1,068 1,098 Payables to brokerage clients 40,330 35,489 Accrued expenses and other liabilities 1,641 1,397 Long-term debt 1,632 2,001
Total liabilities 124,048 100,839
Stockholders’ equity:
Preferred stock — $.01 par value per share; aggregate liquidation preference of $885 and $0 at December 31, 2012 and 2011, respectively 865 -
Common stock — 3 billion shares authorized; $.01 par value per share; 1,487,543,446 shares issued 15 15
Additional paid-in capital 3,881 3,826 Retained earnings 8,554 7,978 Treasury stock, at cost — 210,014,305 shares and 216,378,623 shares at December 31, 2012
and 2011, respectively (4,024) (4,113) Accumulated other comprehensive income 298 8
Total stockholders’ equity 9,589 7,714
Total liabilities and stockholders’ equity $ 133,637 $ 108,553

THE CHARLES SCHWAB CORPORATION
Consolidated Statements of Cash Flows (In Millions) Year Ended December 31, 2012 2011 2010
Cash Flows from Operating Activities
Net income $ 928 $ 864 $ 454 Adjustments to reconcile net income to net cash provided by (used for) operating
activities:
Provision for loan losses 16 18 27 Net impairment losses on securities 32 31 36 Stock-based compensation 105 99 87 Depreciation and amortization 196 155 146 Provision (benefit) for deferred income taxes 5 52 (51) Premium amortization, net, on securities available for sale and securities held to
maturity 222 136 35 Other 26 9 (3)
Originations of loans held for sale (441) (1,574) (2,015) Proceeds from sales of loans held for sale 513 1,703 1,943 Net change in:
Cash and investments segregated and on deposit for regulatory purposes (2,549) (2,211) (4,376) Receivables from brokers, dealers, and clearing organizations (104) 220 148 Receivables from brokerage clients (2,391) 341 (2,612) Other securities owned (43) (231) 581 Other assets 10 (15) 133 Payables to brokers, dealers, and clearing organizations 28 (357) 283 Payables to brokerage clients 4,950 3,407 4,886 Accrued expenses and other liabilities (237) (183) 289
Net cash provided by (used for) operating activities 1,266 2,464 (9)
Cash Flows from Investing Activities
Purchases of securities available for sale (29,035) (18,434) (15,697) Proceeds from sales of securities available for sale 3,336 500 871 Principal payments on securities available for sale 13,867 7,978 13,261 Purchases of securities held to maturity (8,678) (2,253) (14,906) Principal payments on securities held to maturity 5,453 4,786 2,672 Net increase in loans to banking clients (978) (1,125) (1,443) Purchase of equipment, office facilities, and property (148) (180) (129) Cash (paid) acquired in business acquisitions — net (80) 54 (44) Other investing activities 3 7 5
Net cash used for investing activities (16,260) (8,667) (15,410)
Cash Flows from Financing Activities
Net change in deposits from banking clients 18,523 10,264 11,328 Issuance of commercial paper 300 - - Issuance of long-term debt 350 - 701 Repayment of long-term debt (732) (116) (205) Premium paid on debt exchange (19) - - Net proceeds from preferred stock offerings 863 - - Net proceeds from common stock offering - - 543 Dividends paid (337) (295) (288) Proceeds from stock options exercised and other 35 96 35 Other financing activities (5) 2 (5)
Net cash provided by financing activities 18,978 9,951 12,109
Increase (Decrease) in Cash and Cash Equivalents 3,984 3,748 (3,310) Cash and Cash Equivalents at Beginning of Year 8,679 4,931 8,241
Cash and Cash Equivalents at End of Year $ 12,663 $ 8,679 $ 4,931
Supplemental Cash Flow Information

See Notes to Consolidated Financial Statements.
- 42 -
Cash paid during the year for:
Interest $ 143 $ 168 $ 178 Income taxes $ 508 $ 517 $ 327
Non-cash investing activities:
Common stock issued and equity awards assumed for business acquisitions (See note “3 – Business Acquisitions”) $ - $ 714 $ 106
Securities purchased during the year but settled after year end $ - $ 58 $ - Non-cash financing activity:
Transfer of trust related balances to deposits from banking clients $ - $ - $ 442 Exchange of Senior Notes (See note “14 – Borrowings”) $ 256 $ - $ -

THE CHARLES SCHWAB CORPORATION
Consolidated Statements of Stockholders’ Equity (In Millions)
See Notes to Consolidated Financial Statements.
- 43 -
Additional Accumulated
Other
Preferred Common Stock Paid-In Retained Treasury Stock, Comprehensive Stock Shares Amount Capital Earnings at cost Income (Loss) Total
Balance at December 31, 2009 $ - 1,392 $ 14 $ 2,298 $ 7,243 $ (4,291) $ (191) $ 5,073
Net income - - - - 454 - - 454 Other comprehensive income, net of
tax - - - - - - 207 207 Issuance of common stock - 30 - 543 - - - 543 Issuance of common stock for business
acquisition - 7 - 106 - - - 106 Dividends declared on common stock - - - - (288) - - (288) Stock option exercises and other - - - (4) - 39 - 35 Stock-based compensation and related
tax effects - - - 87 - - - 87 Other - - - 4 - 5 - 9
Balance at December 31, 2010 - 1,429 14 3,034 7,409 (4,247) 16 6,226
Net income - - - - 864 - - 864 Other comprehensive income, net of
tax - - - - - - (8) (8) Issuance of common stock for business
acquisition - 59 1 713 - - - 714 Dividends declared on common stock - - - - (295) - - (295) Stock option exercises and other - - - (24) - 122 - 98 Stock-based compensation and related
tax effects - - - 99 - - - 99 Other - - - 4 - 12 - 16
Balance at December 31, 2011 - 1,488 15 3,826 7,978 (4,113) 8 7,714
Net income - - - - 928 - - 928 Other comprehensive income, net of
tax - - - - - - 290 290 Issuance of preferred stock 863 - - - - - - 863 Dividends declared on preferred stock - - - - (43) - - (43) Dividends declared on common stock - - - - (308) - - (308) Stock option exercises and other - - - (40) - 76 - 36 Stock-based compensation and related
tax effects - - - 98 - - - 98 Other 2 - - (3) (1) 13 - 11
Balance at December 31, 2012 $ 865 1,488 $ 15 $ 3,881 $ 8,554 $ (4,024) $ 298 $ 9,589

THE CHARLES SCHWAB CORPORATION Notes to Consolidated Financial Statements
(Tabular Amounts in Millions, Except Per Share Data, Option Price Amounts, Ratios, or as Noted)
The Charles Schwab Corporation (CSC) is a savings and loan holding company engaged, through its subsidiaries, in securities brokerage, banking, money management, and financial advisory services. Charles Schwab & Co., Inc. (Schwab) is a securities broker-dealer with over 300 domestic branch offices in 45 states, as well as a branch in each of the Commonwealth of Puerto Rico and London, U.K. In addition, Schwab serves clients in Hong Kong through one of CSC’s subsidiaries. Other subsidiaries include Charles Schwab Bank (Schwab Bank), a federal savings bank, and Charles Schwab Investment Management, Inc. (CSIM), the investment advisor for Schwab’s proprietary mutual funds, which are referred to as the Schwab Funds , and for Schwab’s exchange-traded funds, which are referred to as the Schwab ETFs .
The accompanying consolidated financial statements include CSC and its majority-owned subsidiaries (collectively referred to as the Company). Intercompany balances and transactions have been eliminated. These consolidated financial statements have been prepared in conformity with accounting principles generally accepted in the United States (U.S.), which require management to make certain estimates and assumptions that affect the reported amounts in the accompanying financial statements. Certain estimates relate to other-than-temporary impairment of securities available for sale and securities held to maturity, valuation of goodwill, allowance for loan losses, and legal and regulatory reserves. Actual results may differ from those estimates. Certain prior-period amounts have been reclassified to conform to the current period presentation.
Asset management and administration fees
Asset management and administration fees include mutual fund service fees and fees for other asset-based financial services provided to individual and institutional clients, and are recognized as revenue over the period that the related service is provided, based upon average asset balances. The Company earns mutual fund service fees for shareholder services, administration, and investment management provided to its proprietary funds, and recordkeeping and shareholder services provided to third-party funds. These fees are based upon the daily balances of client assets invested in these funds. The Company also earns asset management fees for advice solutions, which include advisory and managed account services that are based on the daily balances of client assets subject to the specific fee for service. The fair values of client assets included in proprietary and third-party mutual funds are based on quoted market prices and other observable market data. Other asset management and administration fees include various asset based fees, such as third-party mutual fund service fees, trust fees, 401(k) record keeping fees, and mutual fund clearing and other service fees.
In 2012, 2011, and 2010, the Company waived a portion of its asset management fees earned from certain Schwab-sponsored money market mutual funds in order to provide a positive return to clients. Under agreements with these funds, the Company may recover such fee waivers depending on the future performance of the funds and approval by the boards of the respective funds until the third anniversary of the end of the fiscal year in which such fee waiver occurs, subject to certain limitations. Recoveries of previously-waived asset management fees are recognized as revenue when substantially all uncertainties about timing and amount of realization are resolved.
Interest revenue
Interest revenue represents interest earned on cash and cash equivalents, cash and investments segregated, receivables from brokers, dealers, and clearing organizations, receivables from brokerage clients, other securities owned, securities available for sale, securities held to maturity, and loans to banking clients. Interest revenue is recognized in the period earned based upon average or daily asset balances and respective interest rates.
Trading revenue
Trading revenue includes commission and principal transaction revenues. Clients’ securities transactions are recorded on the date that they settle, while the related commission revenues and expenses are recorded on the date that the trade occurs.
- 44 -
1. Introduction and Basis of Presentation
2. Summary of Significant Accounting Policies
®
™

THE CHARLES SCHWAB CORPORATION Notes to Consolidated Financial Statements
(Tabular Amounts in Millions, Except Per Share Data, Option Price Amounts, Ratios, or as Noted) Principal transaction revenues are primarily comprised of revenues from trading activity in client fixed income securities, which is recorded on a trade date basis. To accommodate clients’ fixed income trading activity, the Company maintains positions in fixed income securities, including state and municipal debt obligations, U.S. Government, corporate debt and other securities. The difference between the price at which the Company buys and sells securities to and from its clients and other broker-dealers is recognized as principal transaction revenue. Principal transaction revenue also includes unrealized gains and losses on these securities positions.
Cash and cash equivalents
The Company considers all highly liquid investments with original maturities of three months or less that are not segregated and on deposit for regulatory purposes to be cash equivalents. Cash and cash equivalents include money market funds, deposits with banks, certificates of deposit, commercial paper, and treasury securities. Cash and cash equivalents also include balances that Schwab Bank maintains at the Federal Reserve Bank.
Cash and investments segregated and on deposit for regulatory purposes
Cash and investments segregated and on deposit for regulatory purposes include securities purchased under agreements to resell (resale agreements), which are collateralized by U.S. Government and agency securities. Resale agreements are accounted for as collateralized investing transactions that are recorded at their contractual amounts plus accrued interest. The Company obtains control of collateral with a market value equal to or in excess of the principal amount loaned and accrued interest under resale agreements. Collateral is valued daily by the Company, with additional collateral obtained to ensure full collateralization. Cash and investments segregated also include certificates of deposit, U.S. Government securities, and corporate debt securities. Certificates of deposit, U.S. Government securities, and corporate debt securities are recorded at fair value. Pursuant to applicable regulations, client cash balances that are not used for margin lending are generally segregated into investment accounts that are maintained for the exclusive benefit of clients.
Receivables from brokerage clients
Receivables from brokerage clients include margin loans to clients and are recorded net of an allowance for doubtful accounts. Receivables from brokerage clients that remain unsecured or partially secured for more than 30 days are fully reserved.
Other securities owned
Other securities owned are recorded at fair value based on quoted market prices. Unrealized gains and losses are included in trading revenue.
Securities available for sale and securities held to maturity
Securities available for sale are recorded at fair value and unrealized gains and losses are reported, net of taxes, in accumulated other comprehensive income (loss) included in stockholders’ equity. Securities held to maturity are recorded at amortized cost based on the Company’s positive intent and ability to hold these securities to maturity. Realized gains and losses from sales of securities available for sale are determined on a specific identification basis and are included in other revenue – net.
Management evaluates whether securities available for sale and securities held to maturity are other-than-temporarily impaired (OTTI) on a quarterly basis. Debt securities with unrealized losses are considered OTTI if the Company intends to sell the security or if it is more likely than not that the Company will be required to sell such security prior to any anticipated recovery. If management determines that a security is OTTI under these circumstances, the impairment recognized in earnings is measured as the entire difference between the amortized cost and the then-current fair value.
A security is also OTTI if management does not expect to recover the amortized cost of the security. In this circumstance, management utilizes cash flow models to estimate the expected future cash flow from the securities to estimate the credit loss.
- 45 -

THE CHARLES SCHWAB CORPORATION Notes to Consolidated Financial Statements
(Tabular Amounts in Millions, Except Per Share Data, Option Price Amounts, Ratios, or as Noted) The impairment recognized in earnings is measured by the difference between the present value of expected cash flows and the amortized cost of the security. Expected cash flows are discounted using the security’s effective interest rate.
The evaluation of whether the Company expects to recover the amortized cost of a security is inherently judgmental. The evaluation includes the assessment of several bond performance indicators including: the portion of the underlying loans that are delinquent (30 days, 60 days, 90+ days), in bankruptcy, in foreclosure or converted to real estate owned; the actual amount of loss incurred on the underlying loans in which the property has been foreclosed and sold; the amount of credit support provided by the structure of the security available to absorb credit losses on the underlying loans; the current price and magnitude of the unrealized loss; and whether the Company has received all scheduled principal and interest payments. Management uses cash flow models to further assess the likelihood of other-than-temporary impairment for the Company’s non-agency residential mortgage-backed securities. To develop the cash flow models, the Company uses forecasted loss severity, prepayment speeds (i.e. the rate at which the principal on underlying loans are paid down), and default rates over the securities’ expected remaining maturities.
Securities borrowed and securities loaned
Securities borrowed require the Company to deliver cash to the lender in exchange for securities and are included in receivables from brokers, dealers, and clearing organizations. For securities loaned, the Company receives collateral in the form of cash in an amount equal to or greater than the market value of securities loaned. Securities loaned are included in payables to brokers, dealers, and clearing organizations. The Company monitors the market value of securities borrowed and loaned, with additional collateral obtained or refunded to ensure full collateralization. Fees received or paid are recorded in interest revenue or interest expense.
Loans to banking clients and related allowance for loan losses
Loans to banking clients are recorded at their contractual principal amounts and include unamortized direct origination costs or net purchase premiums. Additionally, loans are recorded net of an allowance for loan losses. The Company’s loan portfolio includes four loan segments: residential real estate mortgages, home equity lines of credit (HELOC), personal loans secured by securities and other loans. Residential real estate mortgages include two loan classes: first mortgages and purchased first mortgages. Loan segments are defined as the level to which the Company disaggregates its loan portfolio when developing and documenting a methodology for determining the allowance for loan losses. A loan class is defined as a group of loans within a loan segment that has homogeneous risk characteristics.
The Company records an allowance for loan losses through a charge to earnings based on management’s estimate of probable losses in the existing portfolio. Management reviews the allowance for loan losses quarterly, taking into consideration current economic conditions, the composition of the existing loan portfolio, past loss experience, and risks inherent in the portfolio to ensure that the allowance for loan losses is maintained at an appropriate level.
The methodology to establish an allowance for loan losses utilizes statistical models that estimate prepayments, defaults, and probable losses for the loan segments based on predicted behavior of individual loans within the segments. The methodology considers the effects of borrower behavior and a variety of factors including, but not limited to, interest rates, housing price movements as measured by a housing price index, economic conditions, estimated defaults and foreclosures measured by historical and expected delinquencies, changes in prepayment speeds, loan-to-value (LTV) ratios, past loss experience, estimates of future loss severities, borrower credit risk measured by Fair Isaac Corporation (FICO) scores, and the adequacy of collateral. The methodology also evaluates concentrations in the loan segments, including loan products, year of origination, geographical distribution of collateral, and the portion of borrowers who have other client relationships with the Company.
Probable losses are forecast using a loan-level simulation of the delinquency status of the loans over the term of the loans. The simulation starts with the current relevant risk indicators, including the current delinquent status of each loan, the estimated current LTV ratio of each loan, the term and structure of each loan, current key interest rates including U.S. Treasury and London Interbank Offered Rate (LIBOR) rates, and borrower FICO scores. The more significant variables in the simulation
- 46 -

THE CHARLES SCHWAB CORPORATION Notes to Consolidated Financial Statements
(Tabular Amounts in Millions, Except Per Share Data, Option Price Amounts, Ratios, or as Noted) include delinquency roll rates, loss severity, housing prices, and interest rates. Delinquency roll rates (i.e., the rates at which loans transition through delinquency stages and ultimately result in a loss) are estimated from the Company’s historical loss experience adjusted for current trends and market information. Further, the delinquency roll rates within the loan-level simulation discussed above are calibrated to match a moving average of the delinquency roll rates actually experienced in the respective first lien residential real estate mortgage loan (First Mortgage) and home equity line of credit (HELOC) portfolios. Loss severity estimates are based on the Company’s historical loss experience and market trends. The estimated loss severity (i.e. loss given default) used in the allowance for loan loss methodology for HELOC loans is higher than that used in the methodology for First Mortgages. Housing price trends are derived from historical home price indices and econometric forecasts of future home values. Factors affecting the home price index include: housing inventory, unemployment, interest rates, and inflation expectations. Interest rate projections are based on the current term structure of interest rates and historical volatilities to project various possible future interest rate paths. As a result, the current state of house prices, including the decrease in general house prices experienced over the last several years, as well as the current state of delinquencies unique to the Company’s First Mortgage and HELOC portfolios, are considered in the allowance for loan loss methodology.
This methodology results in loss factors that are applied to the outstanding balances to determine the allowance for loan loss for each loan segment.
The Company considers loan modifications in which it makes an economic concession to a borrower experiencing financial difficulty to be a troubled debt restructuring.
Nonaccrual loans
Residential real estate mortgages, HELOC, personal, and other loans are placed on nonaccrual status upon becoming 90 days past due as to interest or principal (unless the loans are well-secured and in the process of collection), or when the full timely collection of interest or principal becomes uncertain. For the portion of the HELOC portfolio for which the Company is able to track the delinquency status on the associated first lien loan, the Company places a HELOC on non-accrual status if the associated first mortgage is 90 days or more delinquent, regardless of the payment status of the HELOC. When a loan is placed on nonaccrual status, the accrued and unpaid interest receivable is reversed and the loan is accounted for on the cash or cost recovery method thereafter, until qualifying for return to accrual status. Generally, a nonaccrual loan may be returned to accrual status when all delinquent interest and principal is repaid and the borrower demonstrates a sustained period of performance of twelve consecutive months of repayments, or when the loan is both well-secured and in the process of collection and collectability is no longer doubtful.
Loan Charge-Offs
The Company charges off a loan in the period that it is deemed uncollectible and records a reduction in the allowance for loan losses and the loan balance. The Company’s charge-off policy for residential real estate mortgages and HELOC loans is to assess the value of the property when the loan has been delinquent for 180 days or it is in bankruptcy, regardless of whether or not the property is in foreclosure, and charge-off the amount of the loan balance in excess of the estimated current value of the underlying property less estimated costs to sell.
Equipment, office facilities, and property
Equipment, office facilities, and property are recorded at cost net of accumulated depreciation and amortization, except for land, which is recorded at cost. Equipment and office facilities are depreciated on a straight-line basis over an estimated useful life of three to ten years. Buildings are depreciated on a straight-line basis over 20 to 40 years. Leasehold improvements are amortized on a straight-line basis over the shorter of the estimated useful life of the asset or the term of the lease. Software and certain costs incurred for purchasing or developing software for internal use are amortized on a straight-line basis over an estimated useful life of three or five years. Equipment, office facilities, and property are reviewed for impairment whenever events or changes in circumstances indicate that the carrying amount of such assets may not be recoverable.
- 47 -

THE CHARLES SCHWAB CORPORATION Notes to Consolidated Financial Statements
(Tabular Amounts in Millions, Except Per Share Data, Option Price Amounts, Ratios, or as Noted) Goodwill
Goodwill represents the fair value of acquired businesses in excess of the fair value of the individually identified net assets acquired. Goodwill is not amortized but is tested for impairment annually or whenever indications of impairment exist. In testing for potential impairment of goodwill, management estimates the fair values of each of the Company’s reporting units (defined as the Company’s businesses for which financial information is available and reviewed regularly by management) and compares it to their carrying values. The estimated fair values of the reporting units are established using a discounted cash flow model that includes significant assumptions about the future operating results and cash flows of each reporting unit and a market capitalization analysis. As allowed by applicable accounting standards, the Company can elect to qualitatively assess goodwill for impairment if it is more likely than not that the fair value of a reporting unit exceeds its carrying value. The Company’s annual impairment testing date is April 1 .
Intangible assets
Intangible assets are amortized over their useful lives in a manner that best reflects their economic benefit. Intangible assets are reviewed for impairment whenever events or changes in circumstances indicate that the carrying amount of such assets may not be recoverable. The Company does not have any indefinite-lived intangible assets.
Guarantees and indemnifications
The Company recognizes, at the inception of a guarantee, a liability equal to the estimated fair value of the obligation undertaken in issuing the guarantee. The fair values of the obligations relating to standby letter of credit agreements (LOCs) are estimated based on fees charged to enter into similar agreements, considering the creditworthiness of the counterparties. The fair values of the obligations relating to other guarantees are estimated based on transactions for similar guarantees or expected present value measures.
Income taxes
The Company provides for income taxes on all transactions that have been recognized in the consolidated financial statements. Accordingly, deferred tax assets are adjusted to reflect the tax rates at which future taxable amounts will likely be settled or realized. The effects of tax rate changes on future deferred tax assets and deferred tax liabilities, as well as other changes in income tax laws, are recorded in earnings in the period during which such changes are enacted. The Company’s unrecognized tax benefits, which are included in accrued expenses and other liabilities, represent the difference between positions taken on tax return filings and estimated potential tax settlement outcomes. Interest and penalties relating to unrecognized tax benefits are recorded in income tax expense.
Stock-based compensation
Stock-based compensation includes employee and board of director stock options, restricted stock units, and restricted stock awards. The Company measures compensation expense for these share-based payment arrangements based on their estimated fair values as of the awards’ grant date. The fair value of the share-based award is recognized over the vesting period as stock-based compensation. Stock-based compensation expense is based on awards expected to vest and therefore is reduced for estimated forfeitures. Forfeitures are estimated at the time of grant based on the Company’s historical forfeiture experience and revised in subsequent periods if actual forfeitures differ from those estimates. The excess tax benefits from the exercise of stock options and the vesting of restricted stock awards are recorded in additional paid-in capital.
Fair values of assets and liabilities
Fair value is defined as the price that would be received to sell an asset or the price paid to transfer a liability in an orderly transaction between market participants at the measurement date. Fair value measurement accounting guidance describes the fair value hierarchy for disclosing assets and liabilities measured at fair value based on the inputs used to value them. The fair value hierarchy maximizes the use of observable inputs and minimizes the use of unobservable inputs. Observable inputs are
- 48 -
st

THE CHARLES SCHWAB CORPORATION Notes to Consolidated Financial Statements
(Tabular Amounts in Millions, Except Per Share Data, Option Price Amounts, Ratios, or as Noted) based on market pricing data obtained from sources independent of the Company. A quoted price in an active market provides the most reliable evidence of fair value and is generally used to measure fair value whenever available. Unobservable inputs reflect management’s judgment about the assumptions market participants would use in pricing the asset or liability. Where inputs used to measure fair value of an asset or liability are from different levels of the hierarchy, the asset or liability is categorized based on the lowest level input that is significant to the fair value measurement in its entirety. Assessing the significance of a particular input requires judgment. The fair value hierarchy includes three levels based on the objectivity of the inputs as follows:
Assets and liabilities recorded at fair value
The Company uses the market and income approaches to determine the fair value of assets and liabilities. When available, the Company uses quoted prices in active markets to measure the fair value of assets and liabilities. When utilizing market data and bid-ask spread, the Company uses the price within the bid-ask spread that best represents fair value. When quoted prices do not exist, the Company uses prices obtained from independent third-party pricing services to measure the fair value of investment assets. The Company generally obtains prices from at least three independent pricing sources for assets recorded at fair value and may obtain up to five prices on assets with higher risk of limited observable information, such as non-agency residential mortgage-backed securities. The Company’s primary independent pricing service provides prices based on observable trades and discounted cash flows that incorporate observable information such as yields for similar types of securities (a benchmark interest rate plus observable spreads) and weighted-average maturity for the same or similar “to-be-issued” securities. The Company compares the prices obtained from its primary independent pricing service to the prices obtained from the additional independent pricing services to determine if the price obtained from the primary independent pricing service is reasonable. The Company does not adjust the prices received from independent third-party pricing services unless such prices are inconsistent with the definition of fair value and result in a material difference in the recorded amounts.
Financial instruments not recorded at fair value
Descriptions of the valuation methodologies and assumptions used to estimate the fair value of financial instruments not recorded at fair value are described below. The Company’s financial instruments not recorded at fair value but for which fair value can be approximated and disclosed include:
- 49 -
� Level 1 inputs are quoted prices in active markets as of the measurement date for identical assets or liabilities that the
Company has the ability to access.
� Level 2 inputs are inputs other than quoted prices included in Level 1 that are observable for the asset or liability, either directly or indirectly. Level 2 inputs include quoted prices for similar assets and liabilities in active markets, and inputs other than quoted prices that are observable for the asset or liability, such as interest rates, benchmark yields, issuer spreads, new issue data, and collateral performance.
� Level 3 inputs are unobservable inputs for the asset or liability, and include situations where there is little, if any, market
activity for the asset or liability.
� Cash and cash equivalents are short-term in nature and accordingly are recorded at amounts that approximate fair value.
� Cash and investments segregated and on deposit for regulatory purposes include cash and securities purchased under resale agreements. Securities purchased under resale agreements are short-term in nature and are backed by collateral that both exceeds the carrying value of the resale agreement and is highly liquid in nature. Accordingly, the carrying value approximates fair value.
� Receivables from/payables to brokers, dealers, and clearing organizations are recorded at contractual amounts and
historically have been settled at those values and are short-term in nature, and therefore approximate fair value.

THE CHARLES SCHWAB CORPORATION Notes to Consolidated Financial Statements
(Tabular Amounts in Millions, Except Per Share Data, Option Price Amounts, Ratios, or as Noted)
Adoption of New Accounting Standards
Testing Goodwill for Impairment: In September 2011, the Financial Accounting Standards Board issued new guidance allowing companies to consider qualitative factors before performing a quantitative assessment when determining whether goodwill is impaired, which is effective for goodwill impairment tests performed after January 1, 2012. Specifically, there is no longer a requirement to perform the two-step goodwill impairment test unless the entity determines that based on qualitative factors, it is more likely than not that the fair value of a reporting unit is less than its carrying amount. The adoption of this new guidance did not have a material impact on the Company’s financial position, results of operations, earnings per common share (EPS), or cash flows.
optionsXpress Holdings, Inc.
On September 1, 2011, the Company acquired optionsXpress Holdings, Inc. (optionsXpress) for total consideration of $714 million. optionsXpress is an online brokerage firm primarily focused on equity option securities and futures. The optionsXpress brokerage platform provides active investors and traders trading tools, analytics and education to execute a
- 50 -
� Receivables from/payables to brokerage clients — net are recorded at contractual amounts and historically have been settled
at those values and are short-term in nature, and therefore approximate fair value.
� Securities held to maturity – The fair values of securities held to maturity are obtained using an independent third-party
pricing service similar to investment assets recorded at fair value as discussed above.
� Loans to banking clients – The fair values of the Company’s loans to banking clients are estimated based on prices of
mortgage-backed securities collateralized by similar types of loans.
� Loans held for sale at December 31, 2011, were recorded at the lower of cost or fair value. The fair value of the Company’s
loans held for sale was estimated using quoted market prices for securities backed by similar types of loans.
� Financial instruments included in other assets primarily consist of cost method investments and Federal Home Loan Bank
(FHLB) stock, whose carrying values approximate their fair values. FHLB stock is recorded at par, which approximates fair value.
� Deposits from banking clients have no stated maturity and are recorded at the amount payable on demand as of the balance
sheet date. The Company considers the carrying value of these deposits to approximate their fair values.
� Financial instruments included in accrued expenses and other liabilities consist of commercial paper, drafts payable and certain amounts due under contractual obligations which are short-term in nature and accordingly are recorded at amounts that approximate fair value.
� Long-term debt – Except for the finance lease obligation, the fair values of long-term debt are estimated using indicative, non-binding quotes from independent brokers. The Company validates indicative prices for its debt through comparison to other independent non-binding quotes. The finance lease obligation is recorded at carrying value, which approximates fair value.
� Firm commitments to extend credit – The Company extends credit to banking clients through HELOC and personal loans secured by securities. The Company considers the fair value of these unused commitments to be not material because the interest rates earned on these balances are based on floating interest rates that reset monthly. The Company does not charge a fee to maintain a HELOC or personal loan.
3. Business Acquisitions
®

THE CHARLES SCHWAB CORPORATION Notes to Consolidated Financial Statements
(Tabular Amounts in Millions, Except Per Share Data, Option Price Amounts, Ratios, or as Noted) variety of investment strategies. The combination of optionsXpress and Schwab offers active investors an additional level of service and platform capabilities.
Under the terms of the merger agreement, optionsXpress stockholders received 1.02 shares of the Company’s common stock for each share of optionsXpress stock. As a result, the Company issued 59 million shares of the Company’s common stock valued at $710 million, based on the closing price of the Company’s common stock on September 1, 2011. The Company also assumed optionsXpress’ stock-based compensation awards valued at $4 million.
The results of optionsXpress’ operations have been included in the Company’s consolidated statement of income for the year ended December 31, 2012 and 2011, from the date of acquisition. optionsXpress’ net revenues and net income were $179 million and $6 million, respectively, in 2012. optionsXpress’ net revenues were $68 million and their net loss was not material for the period September 1, 2011 through December 31, 2011.
The following table summarizes the allocation of the purchase price to the net assets of optionsXpress:
The following table summarizes the fair values of the assets acquired and liabilities assumed as of the acquisition date:
Goodwill of $511 million was assigned to the Investor Services segment and will not be deductible for tax purposes.
- 51 -
Fair value of common stock issued $ 710 Fair value of equity awards assumed 4
Total consideration paid $ 714
Fair value of net assets acquired $ 203
Acquisition-related goodwill $ 511
Represents a non-cash investing activity.
September 1, 2011
Assets
Cash and cash equivalents $ 84 Cash and investments segregated and on deposit for regulatory purposes 1,074 Receivables from brokers, dealers, and clearing organizations 40 Receivables from brokerage clients 185 Other securities owned - at fair value 32 Intangible assets 285 Other assets 25
Total assets acquired $ 1,725
Liabilities
Payables to brokerage clients $ 1,221 Deferred tax liability 95 Long-term debt 110 Accrued expenses and other liabilities 96
Total liabilities assumed $ 1,522
Net assets acquired $ 203
All assets and liabilities, except for cash and cash equivalents, represent non-cash investing activities. The Company paid off long-term debt acquired from optionsXpress subsequent to the date of acquisition in September 2011.
(1)
(1)
(1)
(2)
(1)
(1)
(2)

THE CHARLES SCHWAB CORPORATION Notes to Consolidated Financial Statements
(Tabular Amounts in Millions, Except Per Share Data, Option Price Amounts, Ratios, or as Noted) The Company recorded intangible assets of $285 million, which are subject to amortization and will be amortized over their estimated useful lives. The following table summarizes the estimated fair value and useful lives of the intangible assets.
Pro Forma Financial Information (Unaudited)
The following table presents unaudited pro forma financial information as if optionsXpress had been acquired prior to January 1, 2010. Pro forma net income for the year ended December 31, 2011, was adjusted to exclude $16 million, after tax, of acquisition related costs incurred by the Company in 2011. Additionally, pro forma net income below excludes $15 million, before tax, of acquisition related costs because these costs were incurred by optionsXpress prior to the acquisition date. Pro forma net income also reflects the impact of amortizing purchase accounting adjustments relating to intangible assets, net of tax, of $20 million and $22 million, for the years ended December 31, 2011 and 2010, respectively.
The unaudited pro forma financial information above is presented for illustrative purposes only and is not necessarily indicative of the results that actually would have occurred had the acquisition been completed prior to January 1, 2010, nor is it indicative of the results of operations for future periods.
Other Business Acquisitions
On December 14, 2012, the Company acquired ThomasPartners, Inc., a growth and dividend income-focused asset management firm, for $85 million in cash. As a result of a preliminary allocation of the purchase price, the Company recorded goodwill of $68 million and intangible assets of $36 million. The intangible assets primarily relate to customer relationships and will be amortized over 11 years. The preliminary goodwill was allocated to the Investor Services and Advisor Services segments in the amounts of $44 million and $24 million, respectively.
On November 9, 2010, the Company acquired substantially all of the assets of Windward Investment Management, Inc. (Windward) for $106 million in common stock and $44 million in cash. Windward was an investment advisory firm that managed diversified investment portfolios comprised primarily of exchange-traded fund securities. As a result of the acquisition, Windhaven Investment Management, Inc. was formed as a wholly-owned subsidiary of Schwab Holdings, Inc.
Receivables from brokerage clients consist primarily of margin loans to brokerage clients of $11.6 billion and $10.2 billion at December 31, 2012 and 2011, respectively. Securities owned by brokerage clients are held as collateral for margin loans. Such collateral is not reflected in the consolidated financial statements. The average yield earned on margin loans was 4.08% and 4.39% in 2012 and 2011, respectively.
- 52 -
September 1, 2011
Estimated Fair Value
Estimated Useful Life (In Years)
Customer relationships $ 200 11 Technology 70 9 Trade name 15 9
Total intangible assets $ 285
Year Ended December 31, 2011
2010
Net revenues $ 4,857 $ 4,479 Net income $ 896 $ 481 Basic EPS $ .71 $ .39 Diluted EPS $ .71 $ .38
4. Receivables from Brokerage Clients

THE CHARLES SCHWAB CORPORATION Notes to Consolidated Financial Statements
(Tabular Amounts in Millions, Except Per Share Data, Option Price Amounts, Ratios, or as Noted)
A summary of other securities owned is as follows:
The Company’s positions in Schwab Funds money market funds arise from certain overnight funding of clients’ redemption, check-writing, and debit card activities. Equity and bond mutual funds include mutual fund investments held at CSC, investments made by the Company relating to its deferred compensation plan, and inventory maintained to facilitate certain Schwab Funds and third-party mutual fund clients’ transactions. State and municipal debt obligations, equity, U.S. Government and corporate debt, and other securities include securities held to meet clients’ trading activities.
The amortized cost, gross unrealized gains and losses, and fair value of securities available for sale and securities held to maturity are as follows:
- 53 -
5. Other Securities Owned
December 31, 2012 2011
Schwab Funds money market funds $ 329 $ 332 Equity and bond mutual funds 217 183 State and municipal debt obligations 48 46 Equity, U.S. Government and corporate debt, and other securities 42 32
Total other securities owned $ 636 $ 593
6. Securities Available for Sale and Securities Held to Maturity
December 31, 2012
AmortizedCost
Gross Unrealized
Gains
Gross Unrealized
Losses
Fair Value
Securities available for sale: U.S. agency mortgage-backed securities $ 20,080 $ 396 $ - $ 20,476 Asset-backed securities 8,104 62 2 8,164 Corporate debt securities 6,197 61 2 6,256 Certificates of deposit 6,150 12 1 6,161 U.S. agency notes 3,465 2 3 3,464 Non-agency residential mortgage-backed securities 796 2 65 733 Commercial paper 574 - - 574 Other securities 278 17 - 295
Total securities available for sale $ 45,644 $ 552 $ 73 $ 46,123
Securities held to maturity:
U.S. agency mortgage-backed securities $ 17,750 $ 558 $ 19 $ 18,289 Other securities 444 - 1 443
Total securities held to maturity $ 18,194 $ 558 $ 20 $ 18,732
®
®

THE CHARLES SCHWAB CORPORATION Notes to Consolidated Financial Statements
(Tabular Amounts in Millions, Except Per Share Data, Option Price Amounts, Ratios, or as Noted)
A summary of securities with unrealized losses, aggregated by category and period of continuous unrealized loss, is as follows:
- 54 -
December 31, 2011
AmortizedCost
Gross Unrealized
Gains
Gross Unrealized
Losses
Fair Value
Securities available for sale:
U.S. agency mortgage-backed securities $ 20,666 $ 269 $ 14 $ 20,921 Asset-backed securities 2,638 4 7 2,635 Corporate debt securities 3,592 5 26 3,571 Certificates of deposit 3,623 2 3 3,622 U.S. agency notes 1,795 5 - 1,800 Non-agency residential mortgage-backed securities 1,130 - 223 907 Commercial paper 225 - - 225 Other securities 281 3 - 284
Total securities available for sale $ 33,950 $ 288 $ 273 $ 33,965
Securities held to maturity:
U.S. agency mortgage-backed securities $ 14,770 $ 430 $ 2 $ 15,198 Other securities 338 3 - 341
Total securities held to maturity $ 15,108 $ 433 $ 2 $ 15,539
Less than 12 months
12 months or longer Total
December 31, 2012
FairValue
UnrealizedLosses
FairValue
Unrealized Losses
Fair Value
Unrealized Losses
Securities available for sale:
Asset-backed securities $ - $ - $ 801 $ 2 $ 801 $ 2 Corporate debt securities 878 2 - - 878 2 Certificates of deposit 599 1 - - 599 1 U.S. agency notes 2,102 3 - - 2,102 3 Non-agency residential mortgage-backed securities 46 1 549 64 595 65
Total $ 3,625 $ 7 $ 1,350 $ 66 $ 4,975 $ 73
Securities held to maturity:
U.S. agency mortgage-backed securities $ 2,680 $ 19 $ - $ - $ 2,680 $ 19 Other securities 240 1 - - 240 1
Total $ 2,920 $ 20 $ - $ - $ 2,920 $ 20
Total securities with unrealized losses $ 6,545 $ 27 $ 1,350 $ 66 $ 7,895 $ 93
The number of investment positions with unrealized losses totaled 139 for securities available for sale and 24 for securities held to maturity.
(1)
(1)

THE CHARLES SCHWAB CORPORATION Notes to Consolidated Financial Statements
(Tabular Amounts in Millions, Except Per Share Data, Option Price Amounts, Ratios, or as Noted)
Unrealized losses in securities available for sale of $73 million as of December 31, 2012, were concentrated in non-agency residential mortgage-backed securities. Included in non-agency residential mortgage-backed securities are securities collateralized by loans that are considered to be “Prime” (defined as loans to borrowers with a FICO credit score of 620 or higher at origination), and “Alt-A” (defined as Prime loans with reduced documentation at origination). At December 31, 2012, the amortized cost and fair value of Alt-A residential mortgage-backed securities were $308 million and $269 million, respectively.
Management evaluates whether securities available for sale and securities held to maturity are other-than-temporarily impaired (OTTI) on a quarterly basis as described in note “2 – Summary of Significant Accounting Policies.”
Certain Alt-A and Prime residential mortgage-backed securities experienced continued credit deterioration in 2012, including increased payment delinquency rates and losses on foreclosures of underlying mortgages. In addition, during 2012 the Company increased the projected default rates for modified loans underlying the securities. Based on the Company’s cash flow projections, management determined that it does not expect to recover all of the amortized cost of these securities and therefore determined that these securities were OTTI. The Company employs a buy and hold strategy relative to its mortgage-related securities, and does not intend to sell these securities and will not be required to sell these securities before anticipated recovery of the unrealized losses on these securities. Further, the Company has adequate liquidity at December 31, 2012, with cash and cash equivalents totaling $12.7 billion, a loan-to-deposit ratio of 14%, adequate access to short-term borrowing facilities and regulatory capital ratios in excess of “well capitalized” levels. Because the Company does not intend to sell these securities and it is not “more likely than not” that the Company will be required to sell these securities, the Company recognized an impairment charge equal to the securities’ expected credit losses of $32 million in 2012. The expected credit losses were measured as the difference between the present value of expected cash flows and the amortized cost of the securities. Further deterioration in the performance of the underlying loans in the Company’s non-agency residential mortgage-backed securities portfolio could result in the recognition of additional impairment losses.
- 55 -
Less than 12 months
12 months or longer Total
December 31, 2011
FairValue
UnrealizedLosses
FairValue
UnrealizedLosses
Fair Value
Unrealized Losses
Securities available for sale:
U.S. agency mortgage-backed securities $ 5,551 $ 14 $ - $ - $ 5,551 $ 14 Asset-backed securities 1,368 6 152 1 1,520 7 Corporate debt securities 1,888 26 - - 1,888 26 Certificates of deposit 2,158 3 - - 2,158 3 Non-agency residential mortgage-backed securities 121 8 746 215 867 223
Total $ 11,086 $ 57 $ 898 $ 216 $ 11,984 $ 273
Securities held to maturity:
U.S. agency mortgage-backed securities $ 384 $ 2 $ - $ - $ 384 $ 2
Total $ 384 $ 2 $ - $ - $ 384 $ 2
Total securities with unrealized losses $ 11,470 $ 59 $ 898 $ 216 $ 12,368 $ 275
The number of investment positions with unrealized losses totaled 296 for securities available for sale and 3 for securities held to maturity.
(1)
(1)

THE CHARLES SCHWAB CORPORATION Notes to Consolidated Financial Statements
(Tabular Amounts in Millions, Except Per Share Data, Option Price Amounts, Ratios, or as Noted) The following table is a rollforward of the amount of credit losses recognized in earnings for OTTI securities held by the Company during the period for which a portion of the impairment was recognized in other comprehensive income:
The maturities of securities available for sale and securities held to maturity at December 31, 2012, are as follows:
Proceeds and gross realized gains from sales of securities available for sale are as follows:
There were no realized losses from the sales of securities available for sale in 2012, 2011, or 2010.
- 56 -
Year Ended December 31, 2012 2011 2010
Balance at beginning of year $ 127 $ 96 $ 60 Credit losses recognized into current year earnings on debt securities for which an other-
than-temporary impairment was not previously recognized 6 6 7 Credit losses recognized into current year earnings on debt securities for which an other-
than-temporary impairment was previously recognized 26 25 29
Balance at end of year $ 159 $ 127 $ 96
Within1 year
After 1 yearthrough 5 years
After 5 yearsthrough 10 years
After 10 years Total
Securities available for sale:
U.S. agency mortgage-backed securities $ - $ 40 $ 4,050 $ 16,386 $ 20,476 Asset-backed securities - 438 785 6,941 8,164 Corporate debt securities 1,149 4,883 224 - 6,256 Certificates of deposit 4,557 1,604 - - 6,161 U.S. agency notes - 1,300 2,164 - 3,464 Non-agency residential mortgage-backed securities - - 7 726 733 Commercial paper 574 - - - 574 Other securities - - - 295 295
Total fair value $ 6,280 $ 8,265 $ 7,230 $ 24,348 $ 46,123 Total amortized cost $ 6,268 $ 8,201 $ 7,062 $ 24,113 $ 45,644
Securities held to maturity:
U.S. agency mortgage-backed securities $ - $ - $ 9,956 $ 8,333 $ 18,289 Other securities - 100 292 51 443
Total fair value $ - $ 100 $ 10,248 $ 8,384 $ 18,732 Total amortized cost $ - $ 100 $ 9,911 $ 8,183 $ 18,194
Mortgage-backed securities have been allocated to maturity groupings based on final contractual maturities. Actual maturities will differ from final contractual maturities because borrowers on a certain portion of loans underlying these securities have the right to prepay their obligations.
Year Ended December 31, 2012 2011 2010
Proceeds $ 3,336 $ 500 $ 871 Gross realized gains $ 35 $ 1 $ 1
(1)
(1)
(1)
(1)

THE CHARLES SCHWAB CORPORATION Notes to Consolidated Financial Statements
(Tabular Amounts in Millions, Except Per Share Data, Option Price Amounts, Ratios, or as Noted)
The composition of loans to banking clients by loan segment is as follows:
The Company records an allowance for loan losses through a charge to earnings based on management’s estimate of probable losses in the existing portfolio. Management reviews the allowance for loan losses quarterly, taking into consideration current economic conditions, the composition of the existing loan portfolio, past loss experience, and risks inherent in the portfolio, as described in note “2 – Summary of Significant Accounting Policies.”
Changes in the allowance for loan losses were as follows:
Included in the loan portfolio are nonaccrual loans totaling $48 million and $52 million at December 31, 2012 and 2011, respectively. There were no loans accruing interest that were contractually 90 days or more past due at December 31, 2012 or 2011. Nonperforming assets, which include nonaccrual loans and other real estate owned, totaled $54 million and $56 million at December 31, 2012 and 2011, respectively.
- 57 -
7. Loans to Banking Clients and Related Allowance for Loan Losses
December 31, 2012 2011
Residential real estate mortgages $ 6,507 $ 5,596 Home equity lines of credit 3,287 3,509 Personal loans secured by securities 963 742 Other 25 19
Total loans to banking clients 10,782 9,866 Allowance for loan losses (56) (54)
Total loans to banking clients – net $ 10,726 $ 9,812
Loans are evaluated for impairment by loan segment.
Year Ended December 31, 2012 December 31, 2011
Residentialreal estate mortgages
Home equity lines
of credit Total
Residentialreal estatemortgages
Home equity lines
of credit Total
December 31, 2010
Balance at beginning of period $ 40 $ 14 $ 54 $ 38 $ 15 $ 53 $ 45 Charge-offs (7) (9) (16) (11) (8) (19) (20) Recoveries 2 - 2 1 1 2 1 Provision for loan losses 1 15 16 12 6 18 27
Balance at end of period $ 36 $ 20 $ 56 $ 40 $ 14 $ 54 $ 53
(1)
(1)

THE CHARLES SCHWAB CORPORATION Notes to Consolidated Financial Statements
(Tabular Amounts in Millions, Except Per Share Data, Option Price Amounts, Ratios, or as Noted) As of December 31, 2012, Schwab Bank no longer originates First Mortgage loans or HELOCs. In 2012, Schwab Bank launched a co-branded loan origination program for Schwab Bank clients (the Program) with Quicken Loans, Inc. (Quicken Loans ). Pursuant to the Program, Quicken Loans originates and services First Mortgage loans and HELOCs for Schwab Bank clients. Under the Program, Schwab Bank purchases certain First Mortgage loans and HELOCs that are originated by Quicken Loans. Schwab Bank sets the underwriting guidelines and pricing for all loans it intends to purchase for its portfolio. The First Mortgage loans purchased under the Program are included in the first mortgages loan class as of December 31, 2012, in the table below.
The delinquency aging analysis by loan class is as follows:
In addition to monitoring the delinquency characteristics, the Company monitors the credit quality of residential real estate mortgages and HELOCs by stratifying the portfolios by the year of origination, borrower FICO scores at origination (Origination FICO), updated borrower FICO scores (Updated FICO), LTV ratios at origination (Origination LTV), and estimated current LTV ratios (Estimated Current LTV), as presented in the following tables. Borrowers’ FICO scores are provided by an independent third party credit reporting service and were last updated in December 2012. The Origination LTV and Estimated Current LTV ratios for a HELOC include any first lien mortgage outstanding on the same property at the time of the HELOC’s origination. The Estimated Current LTV for each loan is estimated by reference to a home price appreciation index.
- 58 -
December 31, 2012 Current
30-59 dayspast due
60-89 dayspast due
Greater than90 days
Total past due
Total loans
Residential real estate mortgages:
First mortgages $ 6,291 $ 22 $ 2 $ 33 $ 57 $ 6,348 Purchased first mortgages 154 1 - 4 5 159
Home equity lines of credit 3,269 5 2 11 18 3,287 Personal loans secured by securities 963 - - - - 963 Other 22 3 - - 3 25
Total loans to banking clients $ 10,699 $ 31 $ 4 $ 48 $ 83 $ 10,782
December 31, 2011
Residential real estate mortgages:
First mortgages $ 5,380 $ 16 $ 2 $ 39 $ 57 $ 5,437 Purchased first mortgages 152 2 - 5 7 159
Home equity lines of credit 3,494 5 2 8 15 3,509 Personal loans secured by securities 741 1 - - 1 742 Other 19 - - - - 19
Total loans to banking clients $ 9,786 $ 24 $ 4 $ 52 $ 80 $ 9,866
® ®

THE CHARLES SCHWAB CORPORATION Notes to Consolidated Financial Statements
(Tabular Amounts in Millions, Except Per Share Data, Option Price Amounts, Ratios, or as Noted)
The Utilization Rate is calculated using the outstanding HELOC balance divided by the associated total line of credit. N/A Not applicable.
- 59 -
Residential real estate mortgages
December 31, 2012 First mortgages
Purchasedfirst mortgages Total
Home equitylines of credit
Year of origination
Pre-2008 $ 465 $ 56 $ 521 $ 1,187 2008 402 6 408 1,151 2009 305 6 311 338 2010 909 12 921 249 2011 1,270 53 1,323 198 2012 2,997 26 3,023 164
Total $ 6,348 $ 159 $ 6,507 $ 3,287
Origination FICO
<620 $ 10 $ 1 $ 11 $ - 620 - 679 98 16 114 23 680 - 739 1,141 40 1,181 633 ≥740 5,099 102 5,201 2,631
Total $ 6,348 $ 159 $ 6,507 $ 3,287
Updated FICO
<620 $ 54 $ 6 $ 60 $ 49 620 - 679 191 13 204 117 680 - 739 940 34 974 510 ≥740 5,163 106 5,269 2,611
Total $ 6,348 $ 159 $ 6,507 $ 3,287
Origination LTV
≤70% $ 4,189 $ 97 $ 4,286 $ 2,225 >70% - ≤90% 2,142 54 2,196 1,036 >90% - ≤100% 17 8 25 26
Total $ 6,348 $ 159 $ 6,507 $ 3,287
December 31, 2012 Balance
WeightedAverage
Updated FICO
UtilizationRate
Percent of Loans that are 90+ Days
Past Due and Less than 90 Days Past Due but on
Nonaccrual Status
Residential real estate mortgages:
Estimated Current LTV
≤70% $ 4,162 772 N/A 0.05% >70% - ≤90% 1,841 764 N/A 0.22% >90% - ≤100% 168 750 N/A 0.51% >100% 336 741 N/A 5.34%
Total $ 6,507 768 N/A 0.38%
Home equity lines of credit: Estimated Current LTV
≤70% $ 1,559 773 36% 0.14% >70% - ≤90% 1,020 766 46% 0.18% >90% - ≤100% 267 759 54% 0.44% >100% 441 753 59% 1.06%
Total $ 3,287 767 42% 0.31%
(1)
(1)

THE CHARLES SCHWAB CORPORATION Notes to Consolidated Financial Statements
(Tabular Amounts in Millions, Except Per Share Data, Option Price Amounts, Ratios, or as Noted)
The Utilization Rate is calculated using the outstanding HELOC balance divided by the associated total line of credit. N/A Not applicable.
- 60 -
Residential real estate mortgages
December 31, 2011 First mortgages
Purchased first mortgages Total
Home equity lines of credit
Year of origination Pre-2008 $ 569 $ 60 $ 629 $ 1,306 2008 538 8 546 1,262 2009 553 10 563 412 2010 1,757 17 1,774 311 2011 2,020 64 2,084 218
Total $ 5,437 $ 159 $ 5,596 $ 3,509
Origination FICO <620 $ 9 $ 2 $ 11 $ - 620 - 679 108 19 127 24 680 - 739 1,030 43 1,073 667 ≥740 4,290 95 4,385 2,818
Total $ 5,437 $ 159 $ 5,596 $ 3,509
Updated FICO <620 $ 55 $ 7 $ 62 $ 49 620 - 679 162 11 173 112 680 - 739 831 44 875 520 ≥740 4,389 97 4,486 2,828
Total $ 5,437 $ 159 $ 5,596 $ 3,509
Origination LTV
≤ 70% $ 3,507 $ 91 $ 3,598 $ 2,378 >70% - ≤90% 1,904 60 1,964 1,091 >90% - ≤100% 26 8 34 40
Total $ 5,437 $ 159 $ 5,596 $ 3,509
December 31, 2011 Balance
Weighted Average
Updated FICO
UtilizationRate
Percent of Loans that are 90+ Days
Past Due and Less than 90 Days Past Due but on
Nonaccrual Status
Residential real estate mortgages: Estimated Current LTV
≤ 70% $ 3,200 773 N/A 0.27% >70% - ≤90% 1,764 766 N/A 0.41% >90% - ≤100% 241 758 N/A 1.33% >100% 391 748 N/A 2.34%
Total $ 5,596 768 N/A 0.50%
Home equity lines of credit: Estimated Current LTV
≤ 70% $ 1,561 774 37% 0.09% >70% - ≤90% 1,099 769 46% 0.26% >90% - ≤100% 328 765 54% 0.16% >100% 521 755 58% 0.75%
Total $ 3,509 769 43% 0.25%
(1)
(1)

THE CHARLES SCHWAB CORPORATION Notes to Consolidated Financial Statements
(Tabular Amounts in Millions, Except Per Share Data, Option Price Amounts, Ratios, or as Noted) The Company monitors the credit quality of personal loans secured by securities by reviewing the fair value of collateral to ensure adequate collateralization of at least 100% of the principal amount of the loans. All of these personal loans were fully collateralized by securities with fair values in excess of borrowings at December 31, 2012 and 2011.
Equipment, office facilities, and property are detailed below:
The gross carrying value of intangible assets and accumulated amortization was:
Amortization expense for intangible assets was $47 million and $20 million in 2012 and 2011, respectively.
Estimated future annual amortization expense for intangible assets as of December 31, 2012, is as follows:
- 61 -
8. Equipment, Office Facilities, and Property
December 31, 2012 2011
Software
$
1,067
$ 993
Buildings 456 446 Information technology equipment 398 430 Leasehold improvements 287 307 Furniture and equipment 133 131 Telecommunications equipment 95 104 Land 59 59 Construction in progress 7 17
Total equipment, office facilities, and property 2,502 2,487 Accumulated depreciation and amortization (1,827) (1,802)
Total equipment, office facilities, and property – net $ 675 $ 685
9. Intangible Assets and Goodwill
December 31, 2012 December 31, 2011
Gross Carrying
Value
AccumulatedAmortization
Net Carrying
Value
Gross Carrying
Value
AccumulatedAmortization
Net Carrying
Value
Customer relationships $ 279 $ 51 $ 228 $ 245 $ 17 $ 228 Technology 89 16 73 88 6 82 Trade name 17 2 15 15 1 14 Other 5 2 3 2 - 2
Total intangible assets $ 390 $ 71 $ 319 $ 350 $ 24 $ 326
2013 $ 49 2014 $ 43 2015 $ 40 2016 $ 38 2017 $ 35 Thereafter $ 114

THE CHARLES SCHWAB CORPORATION Notes to Consolidated Financial Statements
(Tabular Amounts in Millions, Except Per Share Data, Option Price Amounts, Ratios, or as Noted) The changes in the carrying amount of goodwill, as allocated to the Company’s reportable segments for purposes of testing goodwill for impairment going forward, are presented in the following table:
In testing for potential impairment of goodwill on April 1, 2012, the Company used a discounted cash flow model instead of the qualitative assessment methodology allowed by applicable accounting standards. As a result of this test, the fair values of the Company’s reporting units, as indicated by a discounted cash flow model, substantially exceeded their fair values and therefore management concluded that no amount of goodwill was impaired in 2012. The Company did not recognize any goodwill impairment in 2011 or 2010.
The components of other assets are as follows:
Deposits from banking clients consist of interest-bearing and non-interest-bearing deposits as follows:
Payables to brokers, dealers, and clearing organizations include securities loaned of $882 million and $852 million at December 31, 2012 and 2011, respectively. The cash collateral received from counterparties under securities lending transactions was equal to or greater than the market value of the securities loaned at December 31, 2012 and 2011.
- 62 -
Investor Services
Advisor Services Total
Balance at December 31, 2011 $ 1,083 $ 78 $ 1,161 Goodwill acquired and other changes during the period 45 22 67
Balance at December 31, 2012 $ 1,128 $ 100 $ 1,228
10. Other Assets
December 31,
2012 2011
Accounts receivable $ 417 $ 330 Interest and dividends receivable 150 142 Prepaid expenses 114 153 Other investments 59 57 Deferred tax asset – net - 27 Other 73 109
Total other assets $ 813 $ 818
Accounts receivable includes accrued service fee income and a receivable from the Company’s loan servicer.
11. Deposits from Banking Clients
December 31, 2012 2011
Interest-bearing deposits:
Deposits swept from brokerage accounts $ 58,229 $ 40,617 Checking 11,632 10,765 Savings and other 9,089 8,997
Total interest-bearing deposits 78,950 60,379
Non-interest-bearing deposits 427 475
Total deposits from banking clients $ 79,377 $ 60,854
12. Payables to Brokers, Dealers, and Clearing Organizations
(1)
(1)

THE CHARLES SCHWAB CORPORATION Notes to Consolidated Financial Statements
(Tabular Amounts in Millions, Except Per Share Data, Option Price Amounts, Ratios, or as Noted)
The principal source of funding for Schwab’s margin lending is cash balances in brokerage client accounts, which are included in payables to brokerage clients. Cash balances in interest-bearing brokerage client accounts were $32.6 billion and $30.6 billion at December 31, 2012 and 2011, respectively. The average rate paid on cash balances in interest-bearing brokerage client accounts was 0.01% in 2012 and 2011.
Long-term debt including unamortized debt discounts and premiums, where applicable, consists of the following:
CSC has a universal automatic shelf registration statement (Shelf Registration Statement) on file with the Securities and Exchange Commission (the SEC), which enables CSC to issue debt, equity and other securities.
The Senior Notes outstanding at December 31, 2012, have maturities ranging from 2015 to 2022 and fixed interest rates ranging from 0.850% to 4.45% with interest payable semi-annually.
In August 2012, CSC completed an exchange offer with certain eligible holders of its 4.950% Senior Notes due 2014 (Old Senior Notes), whereby Old Senior Notes in an aggregate principal amount of $256 million were exchanged for the same aggregate principal amount of 3.225% Senior Notes due 2022 (New Senior Notes) and cash consideration of $19 million. Pursuant to an exchange and registration rights agreement (Registration Rights Agreement), CSC filed an exchange registration with the SEC and launched an exchange offer on December 11, 2012, to allow the holders of the New Senior Notes to exchange such New Senior Notes for an equal principal amount of notes with substantially identical terms, except that they are generally freely transferable under the Securities Act of 1933. The exchange offer was completed on January 23, 2013 and substantially all of the New Senior Notes were exchanged. These notes have a fixed interest rate of 3.225% with interest payable semiannually.
On December 6, 2012, CSC issued $350 million of additional Senior Notes that mature in 2015 under the Shelf Registration Statement, which have a fixed interest rate of 0.850% with interest payable semi-annually.
On December 21, 2012, CSC redeemed all of its remaining outstanding Old Senior Notes of $494 million. In connection with the redemption, CSC paid the holders of the Old Senior Notes a make-whole premium of $31 million in addition to the $494 million principal payment. The make-whole premium was recorded in other revenue – net.
The Senior Medium-Term Notes, Series A (Medium-Term Notes) outstanding at December 31, 2012, mature in 2017 and have a fixed interest rate of 6.375% with interest payable semi-annually.
CSC and Schwab Capital Trust I, a statutory trust formed under the laws of the State of Delaware (Trust), previously closed a public offering of $300 million of the Trust’s fixed to floating-rate trust preferred securities. The proceeds from the sale of the trust preferred securities were invested by the Trust in fixed to floating rate Junior Subordinated Notes issued by CSC, of which $202 million remained outstanding at August 30, 2012. On August 31, 2012, CSC redeemed all of the outstanding fixed-to-floating rate trust preferred securities issued by the Trust for $207 million. The trust preferred securities were redeemed, along with the common securities issued by the Trust and held by CSC, as a result of the concurrent redemption in
- 63 -
13. Payables to Brokerage Clients
14. Borrowings
December 31, 2012 2011
Senior Notes $ 1,288 $ 1,450 Senior Medium-Term Notes, Series A 249 249 Finance lease obligation 95 100 Junior Subordinated Notes - 202
Total long-term debt $ 1,632 $ 2,001

THE CHARLES SCHWAB CORPORATION Notes to Consolidated Financial Statements
(Tabular Amounts in Millions, Except Per Share Data, Option Price Amounts, Ratios, or as Noted) whole by CSC of the Junior Subordinated Notes held by the Trust which underlay the trust preferred securities. The redemption price represented 100% of the liquidation amount of each trust preferred security, plus accumulated and unpaid distributions up to and including the redemption date.
Schwab has a finance lease obligation related to an office building and land under a 20-year lease. The remaining finance lease obligation of $95 million at December 31, 2012, is being reduced by a portion of the lease payments over the remaining lease term of 12 years.
Annual maturities on long-term debt outstanding at December 31, 2012, are as follows:
CSC has authorization from its Board of Directors to issue unsecured commercial paper notes (Commercial Paper Notes) not to exceed $1.5 billion. Management has set a current limit for the commercial paper program of $800 million. The maturities of the Commercial Paper Notes may vary, but are not to exceed 270 days from the date of issue. The commercial paper is not redeemable prior to maturity and cannot be voluntarily prepaid. The proceeds of the commercial paper program are to be used for general corporate purposes. At December 31, 2012, the amount of Commercial Paper Notes outstanding was $300 million, which is included in accrued expenses and other liabilities. The amount outstanding was repaid on January 2, 2013. There were no borrowings of Commercial Paper Notes outstanding at December 31, 2011.
CSC maintains an $800 million committed, unsecured credit facility with a group of 11 banks, which is scheduled to expire in June 2013. This facility replaced a similar facility that expired in June 2012. The funds under this facility are available for general corporate purposes. The financial covenants under this facility require Schwab to maintain a minimum net capital ratio, as defined, Schwab Bank to be well capitalized, as defined, and CSC to maintain a minimum level of stockholders’ equity. At December 31, 2012, the minimum level of stockholders’ equity required under this facility was $5.8 billion (CSC’s stockholders’ equity at December 31, 2012, was $9.6 billion). There were no borrowings outstanding under this facility at December 31, 2012 or 2011.
To manage short-term liquidity, Schwab maintains uncommitted, unsecured bank credit lines with a group of six banks totaling $842 million at December 31, 2012. CSC has direct access to $642 million of these credit lines. There were no borrowings outstanding under these lines at December 31, 2012 or 2011.
To partially satisfy the margin requirement of client option transactions with the Options Clearing Corporation, Schwab has unsecured standby LOCs with five banks in favor of the Options Clearing Corporation aggregating $325 million at December 31, 2012. In connection with its securities lending activities, Schwab is required to provide collateral to certain brokerage clients. Schwab satisfies the collateral requirements by arranging LOCs, in favor of these brokerage clients, which are issued by multiple banks. At December 31, 2012, the aggregate face amount of these LOCs totaled $74 million. There were no funds drawn under any of these LOCs at December 31, 2012 or 2011.
- 64 -
2013
$
6
2014 6
2015 357 2016 7 2017 258
Thereafter 1,017
Total maturities 1,651 Unamortized discount, net (19)
Total long-term debt $ 1,632

THE CHARLES SCHWAB CORPORATION Notes to Consolidated Financial Statements
(Tabular Amounts in Millions, Except Per Share Data, Option Price Amounts, Ratios, or as Noted)
Operating leases and other commitments: The Company has non-cancelable operating leases for office space and equipment. Future annual minimum rental commitments under these leases, net of contractual subleases, at December 31, 2012, are as follows:
Certain leases contain provisions for renewal options, purchase options, and rent escalations based on increases in certain costs incurred by the lessor. Rent expense was $203 million, $187 million, and $168 million in 2012, 2011, and 2010, respectively.
Purchase obligations: The Company has purchase obligations for services such as advertising and marketing, telecommunications, professional services, and hardware- and software-related agreements. At December 31, 2012, the Company has purchase obligations as follows:
Guarantees and indemnifications: In the normal course of business, the Company provides certain indemnifications (i.e., protection against damage or loss) to counterparties in connection with the disposition of certain of its assets. Such indemnifications are generally standard contractual terms with various expiration dates and typically relate to title to the assets transferred, ownership of intellectual property rights (e.g., patents), accuracy of financial statements, compliance with laws and regulations, failure to pay, satisfy or discharge any liability, or to defend claims, as well as errors, omissions, and misrepresentations. The maximum potential future liability under these indemnifications cannot be estimated. The Company has not recorded a liability for these indemnifications and believes that the occurrence of events that would trigger payments under these agreements is remote.
The Company has clients that sell (i.e., write) listed option contracts that are cleared by various clearing houses. The clearing houses establish margin requirements on these transactions. The Company partially satisfies the margin requirements by arranging unsecured standby LOCs, in favor of the clearing houses, which are issued by multiple banks. At December 31, 2012, the aggregate face amount of these LOCs totaled $325 million. In connection with its securities lending activities, Schwab is required to provide collateral to certain brokerage clients. Schwab satisfies the collateral requirements by arranging LOCs in favor of these brokerage clients, which are issued by multiple banks. At December 31, 2012, the aggregate face amount of these LOCs totaled $74 million. There were no funds drawn under any of these LOCs at December 31, 2012.
The Company also provides guarantees to securities clearing houses and exchanges under standard membership agreements, which require members to guarantee the performance of other members. Under the agreements, if another member becomes unable to satisfy its obligations to the clearing houses and exchanges, other members would be required to meet shortfalls. The
- 65 -
15. Commitments and Contingencies
OperatingLeases Subleases Net
2013 $ 112 $ 31 $ 81 2014 97 28 69 2015 85 28 57 2016 74 28 46 2017 62 22 40 Thereafter 108 11 97
Total $ 538 $ 148 $ 390
2013 $ 159 2014 104 2015 35 2016 7 2017 - Thereafter 1
Total $ 306

THE CHARLES SCHWAB CORPORATION Notes to Consolidated Financial Statements
(Tabular Amounts in Millions, Except Per Share Data, Option Price Amounts, Ratios, or as Noted) Company’s liability under these arrangements is not quantifiable and may exceed the cash and securities it has posted as collateral. However, the potential requirement for the Company to make payments under these arrangements is remote. Accordingly, no liability has been recognized for these guarantees.
Legal contingencies: The Company is subject to claims and lawsuits in the ordinary course of business, including arbitrations, class actions and other litigation, some of which include claims for substantial or unspecified damages. The Company is also the subject of inquiries, investigations, and proceedings by regulatory and other governmental agencies.
The Company believes it has strong defenses in all significant matters currently pending and is contesting liability and any damages claimed. Nevertheless, some of these matters may result in adverse judgments or awards, including penalties, injunctions or other relief, and the Company may also determine to settle a matter because of the uncertainty and risks of litigation. Described below are certain matters in which there is a reasonable possibility that a material loss could be incurred or where the matter may otherwise be of significant interest to stockholders. With respect to all other pending matters, based on current information and consultation with counsel, it does not appear that the outcome of any such matter could be material to the financial condition, operating results or cash flows of the Company. However, predicting the outcome of a litigation or regulatory matter is inherently difficult, requiring significant judgment and evaluation of various factors, including the procedural status of the matter and any recent developments; prior experience and the experience of others in similar cases; available defenses, including potential opportunities to dispose of a case on the merits or procedural grounds before trial (e.g., motions to dismiss or for summary judgment); the progress of fact discovery; the opinions of counsel and experts regarding potential damages; potential opportunities for settlement and the status of any settlement discussions; and potential insurance coverage and indemnification. Often, as in the case of the Auction Rate Securities Regulatory Inquiries and Total Bond Market Fund Litigation matters described below, it is not possible to reasonably estimate potential liability, if any, or a range of potential liability until the matter is closer to resolution – pending, for example, further proceedings, the outcome of key motions or appeals, or discussions among the parties. Numerous issues may have to be developed, such as discovery of important factual matters and determination of threshold legal issues, which may include novel or unsettled questions of law. Reserves are established or adjusted or further disclosure and estimates of potential loss are provided as the matter progresses and more information becomes available.
Auction Rate Securities Regulatory Inquiries: Schwab has been responding to industry wide inquiries from federal and state regulators regarding sales of auction rate securities to clients who were unable to sell their holdings when the normal auction process for those securities froze unexpectedly in February 2008. On August 17, 2009, a civil complaint was filed against Schwab in New York state court by the Attorney General of the State of New York (NYAG) alleging material misrepresentations and omissions by Schwab regarding the risks of auction rate securities, and seeking restitution, disgorgement, penalties and other relief, including repurchase of securities held in client accounts. As reflected in a statement issued August 17, 2009, Schwab has responded that the allegations are without merit, and has been contesting all charges. By order dated October 24, 2011, the court granted Schwab’s motion to dismiss the complaint with prejudice. The NYAG has appealed to the Appellate Division, where the case is currently pending.
Total Bond Market Fund Litigation: On August 28, 2008, a class action lawsuit was filed in the U.S. District Court for the Northern District of California on behalf of investors in the Schwab Total Bond Market Fund™ (Northstar lawsuit). The lawsuit, which alleges violations of state law and federal securities law in connection with the fund’s investment policy, names Schwab Investments (registrant and issuer of the fund’s shares) and CSIM as defendants. Allegations include that the fund improperly deviated from its stated investment objectives by investing in collateralized mortgage obligations (CMOs) and investing more than 25% of fund assets in CMOs and mortgage-backed securities without obtaining a shareholder vote. Plaintiffs seek unspecified compensatory and rescission damages, unspecified equitable and injunctive relief, costs and attorneys’ fees. Plaintiffs’ federal securities law claim and certain of plaintiffs’ state law claims were dismissed in proceedings before the court and following a successful petition by defendants to the Ninth Circuit Court of Appeals. On August 8, 2011, the court dismissed plaintiffs’ remaining claims with prejudice. Plaintiffs have again appealed to the Ninth Circuit, where the case is currently pending.
optionsXpress Regulatory Matters: optionsXpress entities and individual employees have been responding to certain pending regulatory matters which predate the Company’s acquisition of optionsXpress. On April 16, 2012, optionsXpress, Inc. was
- 66 -

THE CHARLES SCHWAB CORPORATION Notes to Consolidated Financial Statements
(Tabular Amounts in Millions, Except Per Share Data, Option Price Amounts, Ratios, or as Noted) charged by the SEC in an administrative proceeding alleging violations of the firm’s close-out obligations under SEC Regulation SHO (short sale delivery rules) in connection with certain customer trading activity. Trial in the administrative proceeding commenced September 5, 2012. The Company disputes the allegations and is contesting the charges. Separately, on April 19, 2012, the SEC instituted an administrative proceeding alleging violations of the broker-dealer registration requirements by an unregistered optionsXpress entity. On September 5, 2012, the administrative law judge hearing the case ruled on summary disposition that applicable registration requirements were violated. Certain other issues, including relief, remain to be determined at trial. The Company continues to dispute the allegations and is contesting the charges. The Company recorded a contingent liability associated with the two separate matters, which was not material at December 31, 2012.
Securities lending: The Company loans client securities temporarily to other brokers in connection with its securities lending activities and receives cash as collateral for the securities loaned. Increases in security prices may cause the fair value of the securities loaned to exceed the amount of cash received as collateral. In the event the counterparty to these transactions does not return the loaned securities or provide additional cash collateral, the Company may be exposed to the risk of acquiring the securities at prevailing market prices in order to satisfy its client obligations. The Company mitigates this risk by requiring credit approvals for counterparties, monitoring the fair value of securities loaned, and requiring additional cash as collateral when necessary. The fair value of client securities pledged in securities lending transactions to other broker-dealers was $852 million and $783 million at December 31, 2012 and 2011, respectively. Additionally, the Company borrows securities from other broker-dealers to fulfill short sales by clients. The fair value of these borrowed securities was $121 million and $44 million at December 31, 2012 and 2011, respectively.
Client trade settlement: The Company is obligated to settle transactions with brokers and other financial institutions even if the Company’s clients fail to meet their obligations to the Company. Clients are required to complete their transactions on settlement date, generally three business days after the trade date. If clients do not fulfill their contractual obligations, the Company may incur losses. The Company has established procedures to reduce this risk by requiring deposits from clients in excess of amounts prescribed by regulatory requirements for certain types of trades, and therefore the potential to make payments under these client transactions is remote. Accordingly, no liability has been recognized for these transactions.
Margin lending: The Company provides margin loans to its clients which are collateralized by securities in their brokerage accounts and may be liable for the margin requirement of its client margin securities transactions. As clients write options or sell securities short, the Company may incur losses if the clients do not fulfill their obligations and the collateral in client accounts is insufficient to fully cover losses which clients may incur from these strategies. To mitigate this risk, the Company monitors required margin levels and requires clients to deposit additional collateral, or reduce positions to meet minimum collateral requirements.
Clients with margin loans have agreed to allow the Company to pledge collateralized securities in their brokerage accounts in accordance with federal regulations. Under such regulations, the Company was allowed to pledge securities with a fair value of $17.1 billion and $14.7 billion at December 31, 2012 and 2011, respectively. The fair value of client securities pledged to fulfill the short sales of its clients was $1.2 billion at both December 31, 2012 and 2011. The fair value of client securities pledged to fulfill the Company’s proprietary short sales, which resulted from facilitating clients’ dividend reinvestment elections, was $109 million and $101 million at December 31, 2012 and 2011, respectively. The Company has also pledged a portion of its securities owned in order to fulfill the short sales of clients and in connection with securities lending transactions to other broker-dealers. The Company may also pledge client securities to fulfill client margin requirements for open option contracts established with the OCC. The fair value of these pledged securities to the OCC was $1.9 billion and $1.3 billion at December 31, 2012 and 2011, respectively.
Resale and repurchase agreements: Schwab enters into collateralized resale agreements principally with other broker-dealers, which could result in losses in the event the counterparty fails to purchase the securities held as collateral for the cash advanced and the fair value of the securities declines. To mitigate this risk, Schwab requires that the counterparty deliver
- 67 -
16. Financial Instruments Subject to Off-Balance Sheet Risk, Credit Risk, or Market Risk

THE CHARLES SCHWAB CORPORATION Notes to Consolidated Financial Statements
(Tabular Amounts in Millions, Except Per Share Data, Option Price Amounts, Ratios, or as Noted) securities to a custodian, to be held as collateral, with a fair value in excess of the resale price. Schwab also sets standards for the credit quality of the counterparty, monitors the fair value of the underlying securities as compared to the related receivable, including accrued interest, and requires additional collateral where deemed appropriate. At December 31, 2012 and 2011, the fair value of collateral received in connection with resale agreements that are available to be repledged or sold was $19.7 billion and $18.3 billion, respectively. Schwab utilizes the collateral provided under repurchase agreements to meet obligations under broker-dealer client protection rules, which place limitations on its ability to access such segregated securities. For Schwab to repledge or sell this collateral, it would be required to deposit cash and/or securities of an equal amount into its segregated reserve bank accounts in order to meet its segregated cash and investment requirement.
Concentration risk: The Company has exposure to concentration risk when holding large positions of financial instruments collateralized by assets with similar economic characteristics or in securities of a single issuer or industry. For discussion on the Company’s exposure to concentration risk relating to residential mortgage-backed securities, see note “6 – Securities Available for Sale and Securities Held to Maturity.”
The Company’s investments in corporate debt securities and commercial paper totaled $8.0 billion and $5.6 billion at December 31, 2012 and 2011, respectively, with the majority issued by institutions in the financial services industry. These securities are included in securities available for sale, securities held to maturity, cash and investments segregated and on deposit for regulatory purposes, cash and cash equivalents, and other securities owned. At December 31, 2011, the Company held $867 million of corporate debt securities issued by financial institutions and guaranteed under the FDIC Temporary Liquidity Guarantee Program. At December 31, 2012, the Company did not hold any of these securities.
The Company’s loans to banking clients include $6.0 billion and $5.6 billion of adjustable rate first lien residential real estate mortgage loans at December 31, 2012 and 2011, respectively. The Company’s adjustable rate mortgages have initial fixed interest rates for three to ten years and interest rates that adjust annually thereafter. At December 31, 2012, approximately 50% of these mortgages consisted of loans with interest-only payment terms. At December 31, 2012, the interest rates on approximately 65% of these interest-only loans are not scheduled to reset for three or more years. The Company’s mortgage loans do not include interest terms described as temporary introductory rates below current market rates. At December 31, 2012, 45% of the residential real estate mortgages and 50% of the HELOC balances were secured by properties which are located in California. At December 31, 2011, 44% of the residential real estate mortgages and 50% of the HELOC balances were secured by properties which are located in California.
The Company also has exposure to concentration risk from its margin and securities lending activities collateralized by securities of a single issuer or industry. This concentration risk is mitigated by collateral arrangements that require the fair value of such collateral exceeds the amounts loaned.
The Company has indirect exposure to U.S. Government and agency securities held as collateral to secure its resale agreements. The Company’s primary credit exposure on these resale transactions is with its counterparty. The Company would have exposure to the U.S. Government and agency securities only in the event of the counterparty’s default on the resale agreements. The fair value of U.S. Government and agency securities held as collateral for resale agreements totaled $19.7 billion and $18.3 billion at December 31, 2012 and 2011, respectively.
Commitments to extend credit: Schwab Bank enters into commitments to extend credit to banking clients. Schwab Bank also has commitments to purchase certain First Mortgage loans and HELOCs under the Program with Quicken Loans, which began in 2012. The credit risk associated with these commitments varies depending on the creditworthiness of the client and the value of any collateral expected to be held. Collateral requirements vary by type of loan. At December 31, 2012, the Company had commitments to purchase First Mortgage loans of $867 million. Schwab Bank also has commitments to extend credit related to its clients’ unused HELOCs, personal loans secured by securities, and other lines of credit, which totaled $5.4 billion and $5.2 billion at December 31, 2012 and 2011, respectively.
- 68 -

THE CHARLES SCHWAB CORPORATION Notes to Consolidated Financial Statements
(Tabular Amounts in Millions, Except Per Share Data, Option Price Amounts, Ratios, or as Noted)
For a description of the fair value hierarchy and the Company’s fair value methodologies, including the use of independent third-party pricing services, see note “2 – Summary of Significant Accounting Policies.” The Company did not transfer any assets or liabilities between Level 1 and Level 2 during 2012 or 2011. In addition, the Company did not adjust prices received from the primary independent third-party pricing service at December 31, 2012 or 2011.
Financial Instruments Recorded at Fair Value
The following tables present the fair value hierarchy for assets measured at fair value. Liabilities recorded at fair value were not material, and therefore are not included in the following tables:
- 69 -
17. Fair Values of Assets and Liabilities
December 31, 2012
Quoted Pricesin Active Markets
for Identical Assets
(Level 1)
SignificantOther Observable
Inputs (Level 2)
Significant Unobservable
Inputs (Level 3)
Balance at Fair Value
Cash equivalents:
Money market funds $ 413 $ - $ - $ 413 Commercial paper - 1,076 - 1,076
Total cash equivalents 413 1,076 - 1,489 Investments segregated and on deposit for regulatory purposes:
Certificates of deposit - 2,976 - 2,976 U.S. Government securities - 1,767 - 1,767
Total investments segregated and on deposit for regulatory purposes - 4,743 - 4,743
Other securities owned:
Schwab Funds money market funds 329 - - 329 Equity and bond mutual funds 217 - - 217 State and municipal debt obligations - 48 - 48 Equity, U.S. Government and corporate debt, and other securities 2 40 - 42
Total other securities owned 548 88 - 636 Securities available for sale:
U.S. agency mortgage-backed securities - 20,476 - 20,476 Asset-backed securities - 8,164 - 8,164 Corporate debt securities - 6,256 - 6,256 Certificates of deposit - 6,161 - 6,161 U.S. agency notes - 3,464 - 3,464 Non-agency residential mortgage-backed securities - 733 - 733 Commercial paper - 574 - 574 Other securities - 295 - 295
Total securities available for sale - 46,123 - 46,123
Total $ 961 $ 52,030 $ - $ 52,991
®

THE CHARLES SCHWAB CORPORATION Notes to Consolidated Financial Statements
(Tabular Amounts in Millions, Except Per Share Data, Option Price Amounts, Ratios, or as Noted)
- 70 -
December 31, 2011
Quoted Prices in Active Markets
for Identical Assets
(Level 1)
Significant Other Observable
Inputs (Level 2)
Significant Unobservable
Inputs (Level 3)
Balance at Fair Value
Cash equivalents: Money market funds $ 8 $ - $ - $ 8 Commercial paper - 814 - 814
Total cash equivalents 8 814 - 822 Investments segregated and on deposit for regulatory purposes:
Certificates of deposit - 2,374 - 2,374 Corporate debt securities - 767 - 767 U.S. Government securities - 650 - 650
Total investments segregated and on deposit for regulatory purposes - 3,791 - 3,791
Other securities owned:
Schwab Funds money market funds 332 - - 332 Equity and bond mutual funds 183 - - 183 State and municipal debt obligations - 46 - 46 Equity, U.S. Government and corporate debt, and other
securities 12 20 - 32
Total other securities owned 527 66 - 593 Securities available for sale:
U.S. agency mortgage-backed securities - 20,921 - 20,921
Asset-backed securities - 2,635 - 2,635 Corporate debt securities - 3,571 - 3,571 Certificates of deposit - 3,622 - 3,622 U.S. agency notes - 1,800 - 1,800 Non-agency residential mortgage-backed securities - 907 - 907 Commercial paper - 225 - 225 Other securities - 284 - 284
Total securities available for sale - 33,965 - 33,965
Total $ 535 $ 38,636 $ - $ 39,171
®

THE CHARLES SCHWAB CORPORATION Notes to Consolidated Financial Statements
(Tabular Amounts in Millions, Except Per Share Data, Option Price Amounts, Ratios, or as Noted) Financial Instruments Not Recorded at Fair Value
Descriptions of the valuation methodologies and assumptions used to estimate the fair value of financial instruments not recorded at fair value are also described in note “2 – Summary of Significant Accounting Policies.” There were no significant changes in these methodologies or assumptions during 2012. The following table presents the fair value hierarchy for financial instruments not recorded at fair value at December 31, 2012:
The table below presents the Company’s fair value estimates for financial instruments not recorded at fair value at December 31, 2011. The table excludes short-term financial assets and liabilities, for which carrying amounts approximate fair value, and financial instruments recorded at fair value.
- 71 -
Quoted Prices in Active Markets Significant Significant for Identical Other Observable Unobservable Carrying Assets Inputs Inputs Balance at Amount (Level 1) (Level 2) (Level 3) Fair Value
Assets:
Cash and cash equivalents $ 11,174 $ - $ 11,174 $ - $ 11,174 Cash and investments segregated and on
deposit for regulatory purposes 23,723 - 23,723 - 23,723 Receivables from brokers, dealers, and
clearing organizations 333 - 333 - 333 Receivables from brokerage clients – net 13,453 - 13,453 - 13,453 Securities held to maturity:
U.S. agency mortgage-backed securities 17,750 - 18,289 - 18,289 Other securities 444 - 443 - 443
Total securities held to maturity 18,194 - 18,732 - 18,732 Loans to banking clients – net:
Residential real estate mortgages 6,471 - 6,687 - 6,687 Home equity lines of credit 3,267 - 3,295 - 3,295 Personal loans secured by securities 963 - 963 - 963 Other 25 - 24 - 24
Total loans to banking clients – net 10,726 - 10,969 - 10,969 Other assets 64 - 64 - 64
Total $ 77,667 $ - $ 78,448 $ - $ 78,448
Liabilities:
Deposits from banking clients $ 79,377 $ - $ 79,377 $ - $ 79,377 Payables to brokers, dealers, and clearing
organizations 1,068 - 1,068 - 1,068 Payables to brokerage clients 40,330 - 40,330 - 40,330 Accrued expenses and other liabilities 353 - 353 - 353 Long-term debt 1,632 - 1,782 - 1,782
Total $ 122,760 $ - $ 122,910 $ - $ 122,910
Carrying Fair
Amount Value
Financial Assets:
Securities held to maturity $ 15,108 $ 15,539 Loans to banking clients – net $ 9,812 $ 9,671 Loans held for sale $ 70 $ 73
Financial Liabilities:
Long-term debt $ 2,001 $ 2,159

THE CHARLES SCHWAB CORPORATION Notes to Consolidated Financial Statements
(Tabular Amounts in Millions, Except Per Share Data, Option Price Amounts, Ratios, or as Noted)
Preferred Stock
The Company was authorized to issue 9,940,000 shares of preferred stock, $0.01 par value, at December 31, 2012 and 2011. There were no shares of preferred stock issued and outstanding at December 31, 2011. The Company’s preferred stock issued and outstanding as of December 31, 2012, are as follows:
In January 2012, the Company issued and sold 400,000 shares of fixed-to-floating rate non-cumulative perpetual preferred stock, Series A (Series A Preferred Stock). Net proceeds received from the sale were $394 million. The Series A Preferred Stock has no stated maturity and has a fixed dividend rate of 7.000% until February 2022 and a floating rate equal to three-month LIBOR plus 4.820% thereafter. During the fixed rate period, dividends, if declared, will be payable semi-annually in arrears. During the floating rate period, dividends, if declared, will be payable quarterly in arrears. Dividends are not cumulative. Under the terms of the Series A Preferred Stock, the Company’s ability to pay dividends on, make distributions with respect to, or to repurchase, redeem or acquire its common stock or any preferred stock ranking on parity with or junior to the Series A Preferred Stock, is subject to restrictions in the event that the Company does not declare and either pay or set aside a sum sufficient for payment of dividends on the Series A Preferred Stock for the immediately preceding dividend period. The Series A Preferred Stock is redeemable at the Company’s option, in whole or in part, on any dividend payment date on or after February 1, 2022 or, in whole but not in part, within 90 days following a regulatory capital treatment event as defined in its Certificate of Designations.
In June 2012, the Company issued and sold 19,400,000 depositary shares, each representing a 1/40 ownership interest in a share of 6.00% non-cumulative perpetual preferred stock, Series B, equivalent to $25 per depositary share (Series B Preferred Stock). Net proceeds received from the sale were $469 million. The Series B Preferred Stock has no stated maturity and has a fixed dividend rate of 6.00%. Dividends, if declared, will be payable quarterly in arrears. Dividends are not cumulative. Under the terms of the Series B Preferred Stock, the Company’s ability to pay dividends on, make distributions with respect to, or to repurchase, redeem or acquire its common stock or any preferred stock ranking on parity with or junior to the Series B Preferred Stock, is subject to restrictions in the event that the Company does not declare and either pay or set aside a sum sufficient for payment of dividends on the Series B Preferred Stock for the immediately preceding dividend period. The Series B Preferred Stock is redeemable at the Company’s option, in whole or in part, on any dividend payment date on or after September 1, 2017 or, in whole but not in part, within 90 days following a regulatory capital treatment event as defined in its Certificate of Designations.
Common Stock
On January 26, 2010, the Company sold 29,670,300 shares of its common stock, $.01 par value, at a public offering price of $19.00 per share. Net proceeds received from the offering were $543 million and were used to support the Company’s balance sheet growth, including expansion of its deposit base and migration of certain client balances from money market funds into deposit accounts at Schwab Bank.
- 72 -
18. Stockholders’ Equity
Shares
Issued and Liquidation
Outstanding Preference Liquidation Carrying
(In thousands) Per Share Preference Value
Series A 400 $ 1,000 $ 400 $ 394 Series B 485 $ 1,000 485 471
Total Preferred Stock 885 $ 885 $ 865
th

THE CHARLES SCHWAB CORPORATION Notes to Consolidated Financial Statements
(Tabular Amounts in Millions, Except Per Share Data, Option Price Amounts, Ratios, or as Noted)
Accumulated other comprehensive income (loss) represents cumulative gains and losses that are not reflected in earnings. The components of other comprehensive income (loss) are as follows:
Accumulated other comprehensive income (loss) balances are as follows:
The Company’s stock incentive plans provide for granting options, restricted stock units, and restricted stock awards to employees, officers, and directors. In addition, the Company offers retirement and employee stock purchase plans to eligible employees and sponsors deferred compensation plans for eligible officers and non-employee directors.
A summary of the Company’s stock-based compensation and related income tax benefit is as follows:
- 73 -
19. Accumulated Other Comprehensive Income (Loss)
Year Ended December 31, 2012 2011 2010
Before Tax Net of Before Tax Net of Before Tax Net of tax effect tax tax effect tax tax effect tax
Change in net unrealized gain on
Securities available for sale:
Net unrealized gain $ 470 $ (177) $ 293 $ (43) $ 16 $ (27) $ 300 $ (115) $ 185 Reclassification of impairment
charges included in earnings 32 (12) 20 31 (12) 19 36 (14) 22 Other reclassifications included in
earnings (38) 14 (24) 1 - 1 1 - 1
Change in net unrealized gain on securities available for sale 464 (175) 289 (11) 4 (7) 337 (129) 208
Other 1 - 1 (1) - (1) (1) - (1)
Other comprehensive (loss) income $ 465 $ (175) $ 290 $ (12) $ 4 $ (8) $ 336 $ (129) $ 207
Total
Net unrealized gain accumulated other on securities available for sale Other comprehensive income
Balance at December 31, 2009 $ (191) $ - $ (191) Other net changes 208 (1) 207
Balance at December 31, 2010 $ 17 $ (1) $ 16 Other net changes (7) (1) (8)
Balance at December 31, 2011 $ 10 $ (2) $ 8 Other net changes 289 1 290
Balance at December 31, 2012 $ 299 $ (1) $ 298
20. Employee Incentive, Retirement, and Deferred Compensation Plans
Year Ended December 31, 2012 2011 2010
Stock option expense $ 57 $ 61 $ 53 Restricted stock unit expense 40 23 10 Restricted stock award expense 5 12 21 Employee stock purchase plan expense 3 3 3
Total stock-based compensation expense $ 105 $ 99 $ 87
Income tax benefit on stock-based compensation $ (39) $ (37) $ (33)

THE CHARLES SCHWAB CORPORATION Notes to Consolidated Financial Statements
(Tabular Amounts in Millions, Except Per Share Data, Option Price Amounts, Ratios, or as Noted) The Company issues shares for stock options and restricted stock awards from treasury stock. At December 31, 2012, the Company was authorized to grant up to 45 million common shares under its existing stock incentive plans. Additionally, at December 31, 2012, the Company had 43 million shares reserved for future issuance under its employee stock purchase plan.
As of December 31, 2012, there was $191 million of total unrecognized compensation cost, net of forfeitures, related to outstanding stock options, restricted stock awards, and restricted stock units, which is expected to be recognized through 2016 with a remaining weighted-average service period of 2.8 years.
Stock Option Plan
Options are granted for the purchase of shares of common stock at an exercise price not less than market value on the date of grant, and expire within seven or ten years from the date of grant. Options generally vest annually over a three- to five-year period from the date of grant. Certain options were granted at an exercise price above the market value of common stock on the date of grant (i.e., premium-priced options).
The Company’s stock option activity is summarized below:
The aggregate intrinsic value in the table above represents the difference between CSC’s closing stock price and the exercise price of each in-the-money option on the last trading day of the period presented.
Information on stock options granted and exercised is presented below:
- 74 -
Weighted-
Weighted- Average
Average Remaining Aggregate Number Exercise Price Contractual Intrinsic
of Options per Share Life (in years) Value
Outstanding at December 31, 2011 58 $ 16.20
Granted 11 $ 13.51
Exercised (4) $ 10.81
Forfeited (2) $ 13.99 Expired (6) $ 16.80
Outstanding at December 31, 2012 57 $ 16.04 6.70 $ 39
Vested and expected to vest at December 31, 2012 54 $ 16.16 6.59 $ 36
Vested and exercisable at December 31, 2012 31 $ 17.73 5.11 $ 13
Year Ended December 31, 2012 2011 2010
Weighted-average fair value of options granted per share $ 4.07 $ 4.16 $ 5.36 Cash received from options exercised $ 35 $ 96 $ 35 Tax benefit realized on options exercised $ 1 $ 7 $ 5 Aggregate intrinsic value of options exercised $ 9 $ 38 $ 17

THE CHARLES SCHWAB CORPORATION Notes to Consolidated Financial Statements
(Tabular Amounts in Millions, Except Per Share Data, Option Price Amounts, Ratios, or as Noted) Management uses a binomial option pricing model to estimate the fair value of options granted. The binomial model takes into account the contractual term of the stock option, expected volatility, dividend yield, and risk-free interest rate. Expected volatility is based on the implied volatility of publicly-traded options on CSC’s stock. Dividend yield is based on the average historical CSC dividend yield. The risk-free interest rate is based on the yield of a U.S. Treasury zero-coupon issue with a remaining term similar to the contractual term of the option. Management uses historical option exercise data, which includes employee termination data to estimate the probability of future option exercises. Management uses the Black-Scholes model to solve for the expected life of options valued with the binomial model presented below. The assumptions used to value the Company’s options granted during the years presented and their expected lives were as follows:
Restricted Stock Units
Restricted stock units are awards that entitle the holder to receive shares of CSC’s common stock following a vesting period. Restricted stock units are restricted from transfer or sale and generally vest annually over a three- to five-year period, while some vest based upon the Company achieving certain financial or other measures. The fair value of restricted stock units is based on the market price of the Company’s stock on the date of grant. The grant date fair value is amortized to compensation expense on a straight-line basis over the requisite service period. The fair value of the restricted stock units that vested during each of the years 2012, 2011, and 2010 was $30 million, $13 million, and $6 million, respectively.
The Company’s restricted stock units activity is summarized below:
Retirement Plan
Upon completing three months of consecutive service, employees of the Company can participate in the Company’s qualified retirement plan, the SchwabPlan Retirement Savings and Investment Plan. The Company may match certain employee contributions or make additional contributions to this plan at its discretion. The Company’s total contribution expense was $59 million, $53 million, and $50 million in 2012, 2011, and 2010, respectively.
Deferred Compensation Plans
The Company’s deferred compensation plan for officers permits participants to defer the receipt of certain cash compensation. The deferred compensation liability was $127 million and $128 million at December 31, 2012 and 2011, respectively. The Company’s deferred compensation plan for non-employee directors permits participants to defer receipt of all or a portion of their director fees and to receive either a grant of stock options, or upon ceasing to serve as a director, the number of shares of CSC’s common stock that would have resulted from investing the deferred fee amount into CSC’s common stock.
- 75 -
Year Ended December 31, 2012 2011 2010
Weighted-average expected dividend yield .99% .85% .71% Weighted-average expected volatility 31% 36% 35% Weighted-average risk-free interest rate 1.8% 2.1% 2.8% Expected life (in years) 3.0 – 6.7 0.0 – 6.3 3.0 – 5.9
Weighted- Average Grant Number Date Fair Value of Units per Unit
Outstanding at December 31, 2011 8 $ 13.23 Granted 6 $ 13.60 Vested (2) $ 13.55 Forfeited (1) $ 13.29
Outstanding at December 31, 2012 11 $ 13.34
®

THE CHARLES SCHWAB CORPORATION Notes to Consolidated Financial Statements
(Tabular Amounts in Millions, Except Per Share Data, Option Price Amounts, Ratios, or as Noted)
As disclosed previously, the Company recorded total charges in 2010 of $320 million for settlements to resolve class action litigation and regulatory matters relating to the Schwab YieldPlus Fund .
In 2010, the Company decided to cover the net remaining losses recognized by Schwab money market mutual funds as a result of their investments in a single structured investment vehicle that defaulted in 2008 and recorded a charge of $132 million.
The components of income tax expense are as follows:
The temporary differences that created deferred tax assets and liabilities are detailed below:
- 76 -
21. Class Action Litigation and Regulatory Reserve and Money Market Mutual Fund Charges
22. Taxes on Income
Year Ended December 31, 2012 2011 2010
Current: Federal $ 489 $ 424 $ 326 State 28 52 50
Total current 517 476 376
Deferred:
Federal 5 44 (43) State - 8 (8)
Total deferred 5 52 (51)
Taxes on income $ 522 $ 528 $ 325
December 31, 2012 2011
Deferred tax assets:
Employee compensation, severance, and benefits $ 189 $ 173 Reserves and allowances 37 40 Facilities lease commitments 35 37 Net operating loss carryforwards 6 5 State and local taxes - 8 Other - 5
Total deferred tax assets 267 268 Valuation allowance (3) (1)
Deferred tax assets – net of valuation allowance 264 267
Deferred tax liabilities:
Net unrealized gain on securities available for sale (179) (5) Depreciation and amortization (166) (162) Capitalized internal-use software development costs (50) (42) Deferred loan costs (15) (20) Deferred cancellation of debt income (11) (11) Deferred Senior Note exchange (6) - Other (7) -
Total deferred tax liabilities (434) (240)
Deferred tax (liability) asset – net $ (170) $ 27
Amounts are included in accrued expenses and other liabilities and other assets at December 31, 2012 and 2011, respectively.
®
(1)
(1)

THE CHARLES SCHWAB CORPORATION Notes to Consolidated Financial Statements
(Tabular Amounts in Millions, Except Per Share Data, Option Price Amounts, Ratios, or as Noted) A reconciliation of the federal statutory income tax rate to the effective income tax rate is as follows:
A reconciliation of the beginning and ending amount of unrecognized tax benefits is as follows:
Resolving the above uncertain tax matters as of December 31, 2012, in the Company’s favor would reduce taxes on income by $8 million, net of the federal tax benefit.
Federal tax examinations for all years ending through December 31, 2007, have been completed. The years open to examination by state and local governments vary by jurisdiction.
Basic EPS is computed by dividing net income available to common stockholders by the weighted-average number of common shares outstanding during the period. The computation of diluted EPS is similar to the computation of basic EPS except that the denominator is increased to include the number of additional common shares that would have been outstanding if dilutive potential common shares had been issued. Dilutive potential common shares include the effect of outstanding stock options and unvested restricted stock awards and units. EPS under the basic and diluted computations is as follows:
- 77 -
Year Ended December 31, 2012 2011 2010
Federal statutory income tax rate 35.0% 35.0% 35.0% State income taxes, net of federal tax benefit 1.2 2.5 3.3 Non-deductible penalties - - 2.7 Other (0.2) 0.4 0.7
Effective income tax rate 36.0% 37.9% 41.7%
Includes the impact of a non-recurring state tax benefit of $20 million recorded in the third quarter of 2012. Includes the impact of regulatory settlements relating to the Schwab YieldPlus Fund in 2010.
December 31, 2012 2011
Balance at beginning of year $ 13 $ 11 Additions for tax positions related to the current year 1 1 Additions for tax positions related to prior years 1 2 Reductions due to lapse of statute of limitations (2) (1) Reductions for settlements with tax authorities (1) -
Balance at end of year $ 12 $ 13
23. Earnings Per Common Share
Year Ended December 31, 2012 2011 2010
Net income $ 928 $ 864 $ 454 Preferred stock dividends (45) - -
Net income available to common stockholders $ 883 $ 864 $ 454
Weighted-average common shares outstanding — basic 1,274 1,227 1,191 Common stock equivalent shares related to stock incentive plans 1 2 3
Weighted-average common shares outstanding — diluted 1,275 1,229 1,194
Basic EPS $ .69 $ .70 $ .38 Diluted EPS $ .69 $ .70 $ .38
Antidilutive stock options and restricted stock awards excluded from the calculation of diluted EPS totaled 74 million, 63 million, and 52 million shares in 2012, 2011, and 2010, respectively.
(1)
(2)
(1)
(2)
(1)
(1)

THE CHARLES SCHWAB CORPORATION Notes to Consolidated Financial Statements
(Tabular Amounts in Millions, Except Per Share Data, Option Price Amounts, Ratios, or as Noted)
CSC is a savings and loan holding company and Schwab Bank, CSC’s depository institution subsidiary, is a federal savings bank. CSC is subject to supervision and regulation by the Board of Governors of the Federal Reserve System (the Federal Reserve) and Schwab Bank is subject to supervision and regulation by the Office of the Comptroller of the Currency (the OCC). CSC is currently not subject to specific statutory capital requirements, however CSC is required to serve as a source of strength for Schwab Bank. Under the “Dodd-Frank Wall Street Reform and Consumer Protection Act,” CSC will be subject to new minimum leverage and minimum risk-based capital ratio requirements that will be set by the Federal Reserve that are at least as stringent as the current requirements generally applicable to insured depository institutions.
Schwab Bank is subject to regulation and supervision and to various requirements and restrictions under federal and state laws, including regulatory capital guidelines. Among other things, these requirements also restrict and govern the terms of affiliate transactions, such as extensions of credit and repayment of loans between Schwab Bank and CSC or CSC’s other subsidiaries. In addition, Schwab Bank is required to provide notice to and may be required to obtain approval of the OCC and the Federal Reserve to declare dividends to CSC. The federal banking agencies have broad powers to enforce these regulations, including the power to terminate deposit insurance, impose substantial fines and other civil and criminal penalties, and appoint a conservator or receiver. Under the Federal Deposit Insurance Act, Schwab Bank could be subject to restrictive actions if it were to fall within one of the lowest three of five capital categories. Schwab Bank is required to maintain minimum capital levels as specified in federal banking laws and regulations. Failure to meet the minimum levels could result in certain mandatory, and possibly additional discretionary actions by the regulators that, if undertaken, could have a direct material effect on Schwab Bank. At December 31, 2012, CSC and Schwab Bank met the capital level requirements.
The regulatory capital and ratios for Schwab Bank are as follows:
N/A Not applicable.
Based on its regulatory capital ratios at December 31, 2012 and 2011, Schwab Bank is considered well capitalized (the highest category) pursuant to banking regulatory guidelines. There are no conditions or events since December 31, 2012, that management believes have changed Schwab Bank’s capital category.
The Federal Reserve requires Schwab Bank to maintain reserve balances at the Federal Reserve Bank based on certain deposit levels. Schwab Bank’s average reserve requirement was $1.1 billion in both 2012 and 2011.
CSC’s principal U.S. broker-dealers are Schwab and optionsXpress, Inc. optionsXpress, Inc. is a wholly-owned subsidiary of optionsXpress. Schwab and optionsXpress, Inc. are both subject to Rule 15c3-1 under the Securities Exchange Act of 1934 (the Uniform Net Capital Rule). Schwab and optionsXpress, Inc. compute net capital under the alternative method permitted by the Uniform Net Capital Rule. This method requires the maintenance of minimum net capital, as defined, of the greater of 2% of aggregate debit balances arising from client transactions or a minimum dollar requirement ($250,000 for Schwab), which is based on the type of business conducted by the broker-dealer. Under the alternative method, a broker-dealer may not
- 78 -
24. Regulatory Requirements
Minimum Capital Minimum to be Actual Requirement Well Capitalized
Amount Ratio Amount Ratio Amount Ratio
December 31, 2012
Tier 1 Risk-Based Capital $ 5,707 20.0% $ 1,139 4.0% $ 1,709 6.0% Total Risk-Based Capital $ 5,760 20.2% $ 2,279 8.0% $ 2,848 10.0% Tier 1 Leverage $ 5,707 6.7% $ 3,412 4.0% $ 4,266 5.0% Tangible Equity $ 5,707 6.7% $ 1,706 2.0% N/A
December 31, 2011
Tier 1 Risk-Based Capital $ 4,984 23.4% $ 850 4.0% $ 1,276 6.0% Total Risk-Based Capital $ 5,036 23.7% $ 1,701 8.0% $ 2,126 10.0% Tier 1 Leverage $ 4,984 7.5% $ 2,642 4.0% $ 3,302 5.0% Tangible Equity $ 4,984 7.5% $ 1,321 2.0% N/A

THE CHARLES SCHWAB CORPORATION Notes to Consolidated Financial Statements
(Tabular Amounts in Millions, Except Per Share Data, Option Price Amounts, Ratios, or as Noted) repay subordinated borrowings, pay cash dividends, or make any unsecured advances or loans to its parent company or employees if such payment would result in a net capital amount of less than 5% of aggregate debit balances or less than 120% of its minimum dollar requirement.
optionsXpress, Inc. is also subject to Commodity Futures Trading Commission Regulation 1.17 (Reg. 1.17) under the Commodity Exchange Act, which also requires the maintenance of minimum net capital. optionsXpress, Inc., as a futures commission merchant, is required to maintain minimum net capital equal to the greater of its net capital requirement under Reg. 1.17 ($1 million), or the sum of 8% of the total risk margin requirements for all positions carried in client accounts and 8% of the total risk margin requirements for all positions carried in non-client accounts (as defined in Reg. 1.17).
Net capital and net capital requirements for Schwab and optionsXpress, Inc. at December 31, 2012, are as follows:
Schwab and optionsXpress, Inc. are also subject to Rule 15c3-3 under the Securities Exchange Act of 1934 and/or other applicable regulations, which require them to maintain cash or qualified securities in a segregated reserve account for the exclusive benefit of clients. In accordance with Rule 15c3-3, Schwab and optionsXpress, Inc. had portions of their cash and investments segregated for the exclusive benefit of clients at December 31, 2012. Amounts included in cash and investments segregated and on deposit for regulatory purposes represent actual balances on deposit, whereas cash and investments required to be segregated and on deposit for regulatory purposes at December 31, 2012 for Schwab and optionsXpress, Inc. totaled $29.2 billion. On January 3, 2013, Schwab and optionsXpress, Inc. deposited a net amount of $1.2 billion of cash into their segregated reserve bank accounts. Cash and investments required to be segregated and on deposit for regulatory purposes at December 31, 2011 for Schwab and optionsXpress, Inc. totaled $26.3 billion. On January 4, 2012, Schwab and optionsXpress, Inc. deposited a net amount of $1.1 billion of cash into their segregated reserve bank accounts.
Operating segments are defined as components of a company in which separate financial information is evaluated regularly by the chief operating decision maker, or decision-making group, in deciding how to allocate resources and in assessing performance. The Company structures its operating segments according to its clients and the services provided to those clients. The Company’s two reportable segments are Investor Services and Advisor Services.
In the first quarter of 2013, the Company realigned its reportable segments as a result of organizational changes. The segment formerly reported as Institutional Services was renamed to Advisor Services. Additionally, the Retirement Plan Services and Corporate Brokerage Services business units are now part of the Investor Services segment. Previously reported segment information has been revised to reflect these organizational changes. The Investor Services segment provides retail brokerage and banking services to individual investors, retirement plan services, and corporate brokerage services. The Advisor Services segment provides custodial, trading, and support services to independent investment advisors, and retirement business services to independent retirement plan advisors and recordkeepers whose plan assets are held at Schwab Bank. . Banking revenues and expenses are allocated to the Company’s two segments based on which segment services the client.
The accounting policies of the segments are the same as those described in note “2 – Summary of Significant Accounting Policies.” Financial information for the Company’s reportable segments is presented in the following table. For the computation of its segment information, the Company utilizes an activity-based costing model to allocate traditional income statement line item expenses (e.g., compensation and benefits, depreciation and amortization, and professional services) to the
- 79 -
Net Capital
% of Aggregate
Debit Balances
MinimumNet CapitalRequired
2% ofAggregate
Debit Balances
Net Capital in Excess of
Required Net Capital
Net Capital in Excess of
5% of Aggregate
Debit Balances
Schwab $ 1,365 9% $ 0.250 $ 297 $ 1,068 $ 623 optionsXpress, Inc. $ 87 40% $ 1 $ 5 $ 82 $ 76
25. Segment Information

THE CHARLES SCHWAB CORPORATION Notes to Consolidated Financial Statements
(Tabular Amounts in Millions, Except Per Share Data, Option Price Amounts, Ratios, or as Noted) business activities driving segment expenses (e.g., client service, opening new accounts, or business development) and a funds transfer pricing methodology to allocate certain revenues.
The Company evaluates the performance of its segments on a pre-tax basis, excluding items such as significant nonrecurring gains, impairment charges on non-financial assets, discontinued operations, extraordinary items, and significant restructuring and other charges. Segment assets and liabilities are not used for evaluating segment performance or in deciding how to allocate resources to segments. However, capital expenditures are used in resource allocation and are therefore disclosed. There are no revenues from transactions between the segments. Capital expenditures are reported gross, and are not net of proceeds from the sale of fixed assets.
Financial information for the Company’s reportable segments is presented in the following table:
Fees received from Schwab’s proprietary mutual funds represented 10% of the Company’s net revenues in both 2012 and 2011, and 14% in 2010. Except for Schwab’s proprietary mutual funds, which are considered a single client for purposes of this computation, no single client accounted for more than 10% of the Company’s net revenues in 2012, 2011, or 2010. Substantially all of the Company’s revenues and assets are generated or located in the U.S. The percentage of Schwab’s total client accounts located in California was 23% at December 31, 2012, 2011, and 2010.
The Company has evaluated the impact of events that have occurred subsequent to December 31, 2012, through the date the consolidated financial statements were filed with the SEC. Based on this evaluation, other than as recorded or disclosed within these consolidated financial statements and related notes, the Company has determined none of these events were required to be recognized or disclosed.
- 80 -
Investor Services Advisor Services Unallocated Total
Year Ended December 31, 2012 2011 2010 2012 2011 2010 2012 2011 2010 2012 2011 2010
Net Revenues Asset management and administration fees $ 1,436 $ 1,357 $ 1,275 $ 607 $ 571 $ 547 $ - $ - $ - $ 2,043 $ 1,928 $ 1,822 Net interest revenue 1,559 1,542 1,363 205 183 161 - - - 1,764 1,725 1,524 Trading revenue 612 667 598 255 260 232 1 - - 868 927 830 Other – net 123 98 80 62 62 55 71 - - 256 160 135 Provision for loan losses (15) (16) (24) (1) (2) (3) - - - (16) (18) (27) Net impairment losses on securities (29) (29) (34) (3) (2) (2) - - - (32) (31) (36)
Total net revenues 3,686 3,619 3,258 1,125 1,072 990 72 - - 4,883 4,691 4,248
Expenses Excluding Interest 2,693 2,569 2,331 739 731 694 1 (1) 444 3,433 3,299 3,469
Income before taxes on income $ 993 $ 1,050 $ 927 $ 386 $ 341 $ 296 $ 71 $ 1 $ (444) $ 1,450 $ 1,392 $ 779
Taxes on income 522 528 325
Net Income $ 928 $ 864 $ 454
Capital expenditures $ 98 $ 134 $ 102 $ 40 $ 56 $ 25 $ - $ - $ - $ 138 $ 190 $ 127
Depreciation and amortization $ 157 $ 122 $ 107 $ 39 $ 33 $ 38 $ - $ - $ 1 $ 196 $ 155 $ 146
Unallocated amount includes a pre-tax gain of $70 million relating to a confidential resolution of a vendor dispute in 2012. Unallocated amount primarily includes class action litigation and regulatory reserves of $320 million and money market mutual fund charges of $132 million in 2010.
26. Subsequent Events
(1)
(2)
(1)(2)

THE CHARLES SCHWAB CORPORATION Notes to Consolidated Financial Statements
(Tabular Amounts in Millions, Except Per Share Data, Option Price Amounts, Ratios, or as Noted)
Condensed Statements of Income
- 81 -
27. The Charles Schwab Corporation – Parent Company Only Financial Statements
Year Ended December 31, 2012 2011 2010
Interest revenue $ 6 $ 4 $ 3 Interest expense (97) (103) (86)
Net interest revenue (91) (99) (83) Other revenues – net (30) 8 6 Expenses excluding interest (23) (30) (18)
Loss before income tax benefit and equity in net income of subsidiaries (144) (121) (95) Income tax benefit 58 43 36
Loss before equity in net income of subsidiaries (86) (78) (59) Equity in net income of subsidiaries:
Equity in undistributed net income of subsidiaries 662 600 478 Dividends from bank subsidiary 50 150 - Dividends from non-bank subsidiaries 302 192 35
Net Income 928 864 454
Preferred stock dividends 45 - -
Net Income Available to Common Stockholders $ 883 $ 864 $ 454
Condensed Balance Sheets
December 31, 2012 2011
Assets
Cash and cash equivalents $ 1,339 $ 852 Receivables from subsidiaries 80 57 Other securities owned – at fair value 74 77 Loans to non-bank subsidiaries 404 363 Investment in non-bank subsidiaries 3,615 3,363 Investment in bank subsidiary 6,022 5,009 Other assets 88 68
Total assets $ 11,622 $ 9,789
Liabilities and Stockholders’ Equity
Accrued expenses and other liabilities $ 482 $ 158 Payables to subsidiaries 14 16 Long-term debt 1,537 1,901
Total liabilities 2,033 2,075
Stockholders’ equity 9,589 7,714
Total liabilities and stockholders’ equity $ 11,622 $ 9,789

THE CHARLES SCHWAB CORPORATION Notes to Consolidated Financial Statements
(Tabular Amounts in Millions, Except Per Share Data, Option Price Amounts, Ratios, or as Noted) Condensed Statements of Cash Flows
- 82 -
Year Ended December 31, 2012 2011 2010
Cash Flows from Operating Activities
Net income $ 928 $ 864 $ 454 Adjustments to reconcile net income to net cash provided by operating activities:
Equity in undistributed earnings of subsidiaries (662) (591) (478) Provision for deferred income taxes 9 3 3 Other 39 1 (3)
Net change in:
Receivables from brokers, dealers, and clearing organizations - - 11 Other securities owned 3 6 422 Other assets (21) 26 40 Accrued expenses and other liabilities (5) (76) (2)
Net cash provided by operating activities 291 233 447
Cash Flows from Investing Activities
Due from subsidiaries – net 43 24 63 Increase in investments in subsidiaries (307) (366) (1,025) Other investing activities - 8 4
Net cash used for investing activities (264) (334) (958)
Cash Flows from Financing Activities
Issuance of commercial paper 300 - - Issuance of long-term debt 350 - 701 Repayment of long-term debt (727) - (200) Premium paid on debt exchange (19) - - Net proceeds from preferred stock offering 863 - - Net proceeds from common stock offering - - 543 Dividends paid (337) (295) (288) Proceeds from stock options exercised and other 35 96 35 Other financing activities (5) 3 (6)
Net cash provided by (used for) financing activities 460 (196) 785
Increase (Decrease) in Cash and Cash Equivalents 487 (297) 274 Cash and Cash Equivalents at Beginning of Year 852 1,149 875
Cash and Cash Equivalents at End of Year $ 1,339 $ 852 $ 1,149

THE CHARLES SCHWAB CORPORATION Notes to Consolidated Financial Statements
(Tabular Amounts in Millions, Except Per Share Data, Option Price Amounts, Ratios, or as Noted)
- 83 -
28. Quarterly Financial Information (Unaudited)
FourthQuarter
Third Quarter
Second Quarter
First Quarter
Year Ended December 31, 2012:
Net Revenues $ 1,215 $ 1,196 $ 1,283 $ 1,189 Expenses Excluding Interest $ 871 $ 835 $ 851 $ 876 Net Income $ 211 $ 247 $ 275 $ 195 Net Income Available to Common Stockholders $ 189 $ 238 $ 261 $ 195 Weighted Average Common Shares Outstanding – Diluted 1,278 1,275 1,274 1,273 Basic Earnings Per Common Share $ .15 $ .19 $ .20 $ .15 Diluted Earnings Per Common Share $ .15 $ .19 $ .20 $ .15 Dividends Declared Per Common Share $ .06 $ .06 $ .06 $ .06 Range of Common Stock Price Per Share:
High $ 14.47 $ 14.43 $ 14.76 $ 15.38 Low $ 12.50 $ 12.14 $ 11.83 $ 11.61
Range of Price/Earnings Ratio :
High 21 22 22 23 Low 18 18 18 18
Year Ended December 31, 2011: Net Revenues $ 1,113 $ 1,181 $ 1,190 $ 1,207 Expenses Excluding Interest $ 861 $ 821 $ 804 $ 813 Net Income $ 163 $ 220 $ 238 $ 243 Net Income Available to Common Stockholders $ 163 $ 220 $ 238 $ 243 Weighted Average Common Shares Outstanding – Diluted 1,271 1,229 1,210 1,207 Basic Earnings Per Common Share $ .13 $ .18 $ .20 $ .20 Diluted Earnings Per Common Share $ .13 $ .18 $ .20 $ .20 Dividends Declared Per Common Share $ .06 $ .06 $ .06 $ .06 Range of Common Stock Price Per Share:
High $ 13.41 $ 16.72 $ 18.72 $ 19.45 Low $ 10.75 $ 11.03 $ 15.78 $ 17.16
Range of Price/Earnings Ratio :
High 19 25 31 34 Low 15 16 26 30
Price/earnings ratio is computed by dividing the high and low market prices by diluted earnings per common share for the preceding 12-month period ending on the last day of the quarter presented.
(1)
(1)
(1)

Report of Independent Registered Public Accounting Firm
To the Board of Directors and Stockholders of The Charles Schwab Corporation:
We have audited the accompanying consolidated balance sheets of The Charles Schwab Corporation and subsidiaries (the Company) as of December 31, 2012 and 2011, and the related consolidated statements of income, comprehensive income, stockholders’ equity, and cash flows for each of the three years in the period ended December 31, 2012. Our audits also included the financial statement schedule of the Company on page F-2. We also have audited the Company’s internal control over financial reporting as of December 31, 2012, based on criteria established in Internal Control – Integrated Framework issued by the Committee of Sponsoring Organizations of the Treadway Commission. The Company’s management is responsible for these financial statements and financial statement schedule, for maintaining effective internal control over financial reporting, and for its assessment of the effectiveness of internal control over financial reporting, included in the accompanying Management’s Report on Internal Control over Financial Reporting. Our responsibility is to express an opinion on these financial statements and financial statement schedule and an opinion on the Company’s internal control over financial reporting based on our audits.
We conducted our audits in accordance with the standards of the Public Company Accounting Oversight Board (United States). Those standards require that we plan and perform the audit to obtain reasonable assurance about whether the financial statements are free of material misstatement and whether effective internal control over financial reporting was maintained in all material respects. Our audits of the financial statements included examining, on a test basis, evidence supporting the amounts and disclosures in the financial statements, assessing the accounting principles used and significant estimates made by management, and evaluating the overall financial statement presentation. Our audit of internal control over financial reporting included obtaining an understanding of internal control over financial reporting, assessing the risk that a material weakness exists, and testing and evaluating the design and operating effectiveness of internal control based on the assessed risk. Our audits also included performing such other procedures as we considered necessary in the circumstances. We believe that our audits provide a reasonable basis for our opinions.
A company’s internal control over financial reporting is a process designed by, or under the supervision of, the company’s principal executive and principal financial officers, or persons performing similar functions, and effected by the company’s board of directors, management, and other personnel to provide reasonable assurance regarding the reliability of financial reporting and the preparation of financial statements for external purposes in accordance with generally accepted accounting principles. A company’s internal control over financial reporting includes those policies and procedures that (1) pertain to the maintenance of records that, in reasonable detail, accurately and fairly reflect the transactions and dispositions of the assets of the company; (2) provide reasonable assurance that transactions are recorded as necessary to permit preparation of financial statements in accordance with generally accepted accounting principles and that receipts and expenditures of the company are being made only in accordance with authorizations of management and directors of the company; and (3) provide reasonable assurance regarding prevention or timely detection of unauthorized acquisition, use, or disposition of the company’s assets that could have a material effect on the financial statements.
Because of the inherent limitations of internal control over financial reporting, including the possibility of collusion or improper management override of controls, material misstatements due to error or fraud may not be prevented or detected on a timely basis. Also, projections of any evaluation of the effectiveness of the internal control over financial reporting to future periods are subject to the risk that the controls may become inadequate because of changes in conditions, or that the degree of compliance with the policies or procedures may deteriorate.
In our opinion, the consolidated financial statements referred to above present fairly, in all material respects, the financial position of The Charles Schwab Corporation and subsidiaries as of December 31, 2012 and 2011, and the results of their operations and their cash flows for each of the three years in the period ended December 31, 2012, in conformity with accounting principles generally accepted in the United States of America. Also, in our opinion, such financial statement schedule, when considered in relation to the basic consolidated financial statements taken as a whole, presents fairly, in all material respects, the information set forth therein. Also, in our opinion, the Company maintained, in all material respects, effective internal control over financial reporting as of December 31, 2012, based on the criteria established in Internal Control – Integrated Framework issued by the Committee of Sponsoring Organizations of the Treadway Commission.
February 21, 2013, except for Notes 9 and 25, as to which the date is June 24, 2013
- 84 -
/s/ Deloitte & Touche LLP San Francisco, California

THE CHARLES SCHWAB CORPORATION Management’s Report on Internal Control Over Financial Reporting
Management of The Charles Schwab Corporation, together with its subsidiaries (the Company), is responsible for establishing and maintaining adequate internal control over financial reporting. The Company’s internal control over financial reporting is a process designed under the supervision of and effected by the Company’s chief executive officer and chief financial officer to provide reasonable assurance regarding the reliability of financial reporting and the preparation of published financial statements in accordance with accounting principles generally accepted in the United States of America.
As of December 31, 2012, management conducted an assessment of the effectiveness of the Company’s internal control over financial reporting based on the framework established in Internal Control – Integrated Framework issued by the Committee of Sponsoring Organizations of the Treadway Commission. Based on this assessment, management has determined that the Company’s internal control over financial reporting was effective as of December 31, 2012.
The Company’s internal control over financial reporting includes policies and procedures that pertain to the maintenance of records that, in reasonable detail, accurately and fairly reflect transactions and dispositions of assets; provide reasonable assurance that transactions are recorded as necessary to permit preparation of financial statements in accordance with accounting principles generally accepted in the United States of America, and that receipts and expenditures are being made only in accordance with authorizations of management and the directors of the Company; and provide reasonable assurance regarding prevention or timely detection of unauthorized acquisition, use or disposition of the Company’s assets that could have a material effect on the Company’s financial statements.
The Company’s internal control over financial reporting as of December 31, 2012, has been audited by Deloitte & Touche LLP, an independent registered public accounting firm, as stated in their report appearing on the previous page.
- 85 -