form 20-f - api.aenza.com.pe
TRANSCRIPT

UNITED STATES
SECURITIES AND EXCHANGE COMMISSION
Washington, D.C. 20549
FORM 20-F
☐ REGISTRATION STATEMENT PURSUANT TO SECTION 12(b) OR (g) OF THE SECURITIES EXCHANGE
ACT OF 1934
OR
☒ ANNUAL REPORT PURSUANT TO SECTION 13 OR 15(d) OF THE SECURITIES EXCHANGE ACT OF 1934
For the fiscal year ended December 31, 2018
OR
☐ TRANSITION REPORT PURSUANT TO SECTION 13 OR 15(d) OF THE SECURITIES EXCHANGE ACT OF
1934
OR
☐ SHELL COMPANY REPORT PURSUANT TO SECTION 13 OR 15(d) OF THE SECURITIES EXCHANGE
ACT OF 1934
Date of event requiring this shell company report
For the transition period from to
Commission file number 001-35991
GRAÑA Y MONTERO S.A.A. (Exact name of Registrant as specified in its charter)
N/A
(Translation of Registrant’s name into English)
Republic of Peru
(Jurisdiction of incorporation or organization)
Av. Paseo de la República 4667
Surquillo
Lima 34, Peru
(Address of principal executive offices)
Daniel Urbina Pérez, Chief Legal Officer
Tel. 011-51-1-213-6565
Av. Paseo de la República 4667
Surquillo
Lima 34, Peru
(Name, telephone, e-mail and/or facsimile number and address of company contact person)

Securities registered pursuant to Section 12(b) of the Act:
Title of each class Name of each exchange on which registered
Common Shares, par value s/.1.00 per share,
American Depositary Shares, each representing five
Common Shares
New York Stock Exchange*
New York Stock Exchange
* Not for trading purposes, but only in connection with the registration on the New York Stock Exchange of the American Depositary Shares
representing those common shares.
Securities registered pursuant to Section 12(g) of the Act:
None
Securities for which there is a reporting obligation
pursuant to Section 15(d) of the Act:
None
Indicate the number of outstanding shares of each of the issuer’s classes of capital or common stock as of the close of the period covered by the annual
report:
At December 31, 2018 729,434,192 shares of common stock
Indicate by check mark if the Registrant is a well-known seasoned issuer, as defined in Rule 405 of the Securities Act. Yes ☐ No ☒
If this report is an annual or transition report, indicate by check mark if the registrant is not required to file reports pursuant to Section 13 or 15(d) of the
Securities Exchange Act of 1934. Yes ☐ No ☒
Note – Checking the box above will not relieve any registrant required to file reports pursuant to Section 13 or 15(d) of the Securities Exchange Act of
1934 from their obligations under those Sections.
Indicate by check mark whether the Registrant (1) has filed all reports required to be filed by Section 13 or 15(d) of the Securities Exchange Act of 1934
during the preceding 12 months (or for such shorter period that the Registrant was required to file such reports), and (2) has been subject to such filing
requirements for the past 90 days. Yes ☐ No ☒
Indicate by check mark whether the Registrant has submitted electronically every Interactive Data File required to be submitted pursuant to Rule 405 of
Regulation S-T (§232.405 of this chapter) during the preceding 12 months (or for such shorter period that the Registrant was required to submit such
files). Yes ☒ No ☐
Indicate by check mark whether the Registrant is a large accelerated filer, an accelerated filer, a non-accelerated filer, or an emerging growth company.
See definitions of “large accelerated filer,” “accelerated filer,” and “emerging growth company” in Rule 12b-2 of the Exchange Act. (Check one):
Large accelerated filer ☒ Accelerated filer ☐ Non-accelerated filer ☐ Emerging growth company ☐
If an emerging growth company that prepares its financial statements in accordance with U.S. GAAP, indicate by check mark if the registrant has
elected not to use the extended transition period for complying with any new or revised financial accounting standards† provided pursuant to Section 13
(a) of the Exchange Act. ☐
†The term “new or revised financial accounting standard” refers to any update issued by the Financial Accounting Standards Board to its Accounting
Standards Codification after April 5, 2012.
Indicate by check mark which basis of accounting the Registrant has used to prepare the financial statements included in this filing:
U.S. GAAP ☐
International Financial Reporting Standards as issued
by the International Accounting Standards Board ☒ Other ☐
If “Other” has been checked in response to the previous question, indicate by check mark which financial statement item the Registrant has elected to
follow. Item 17 ☐ Item 18 ☐
If this is an annual report, indicate by check mark whether the registrant is a shell company (as defined in Rule 12b-2 of the Exchange
Act). Yes ☐ No ☒

(APPLICABLE ONLY TO ISSUERS INVOLVED IN BANKRUPTCY PROCEEDINGS DURING THE PAST FIVE YEARS)
Indicate by check mark whether the registrant has filed all documents and reports required to be filed by Sections 12, 13 or 15(d) of the Securities
Exchange Act of 1934 subsequent to the distribution of securities under a plan confirmed by a court. Yes ☐ No ☐
TABLE OF CONTENTS
Page
PART I. 1
ITEM 1. IDENTITY OF DIRECTORS, SENIOR MANAGEMENT AND ADVISERS 6
ITEM 2. OFFER STATISTICS AND EXPECTED TIMETABLE 6
ITEM 3. KEY INFORMATION 6
A. Selected Financial Data 6
B. Capitalization and Indebtedness 14
C. Reasons for the Offer and Use of Proceeds 14
D. Risk Factors 14
ITEM 4. INFORMATION ON THE COMPANY 36
A. History and Development of the Company 36
B. Business Overview 37
C. Organizational Structure 87
D. Property, Plant and Equipment 89
ITEM 4A. UNRESOLVED STAFF COMMENTS 89
ITEM 5. OPERATING AND FINANCIAL REVIEW AND PROSPECTS 89
A. Operating Results 90
B. Liquidity and Capital Resources 116
C. Research and Development, Patents and Licenses, Etc. 121
D. Trend Information 121
E. Off-Balance Sheet Arrangements 125
F. Tabular Disclosure of Contractual Obligations 125
G. Safe Harbor 126
ITEM 6. DIRECTORS, SENIOR MANAGEMENT AND EMPLOYEES 126
A. Directors and Senior Management 126
B. Compensation 132
C. Board Practices 133
D. Employees 135
E. Share Ownership 137
ITEM 7. MAJOR SHAREHOLDERS AND RELATED PARTY TRANSACTIONS 137
A. Major Shareholders 137
B. Related Party Transactions 138
C. Interests of Experts and Counsel 139
ITEM 8. FINANCIAL INFORMATION 139
A. Consolidated Statements and Other Financial Information 139
B. Significant Changes 141
ITEM 9. THE OFFER AND LISTING 141
A. Offer and Listing Details 141
B. Plan of Distribution 142
C. Markets 142
D. Selling Shareholders 144
E. Dilution 144
F. Expenses of the Issue 144
ITEM 10. ADDITIONAL INFORMATION 144
A. Share Capital 144
B. Memorandum and Articles of Association 144
C. Material Contracts 147
D. Exchange Controls 148
E. Taxation 148
F. Dividends and Paying Agents 153
G. Statement by Experts 153
H. Documents on Display 153
I. Subsidiary Information 154
ITEM 11. QUANTITATIVE AND QUALITATIVE DISCLOSURES ABOUT MARKET RISK 154
ITEM 12. DESCRIPTION OF SECURITIES OTHER THAN EQUITY SECURITIES 155
A. Debt Securities 155
B. Warrants and Rights 155
i

C. Other Securities 155
D. American Depositary Shares 155
PART II. 157
ITEM 13. DEFAULTS, DIVIDEND ARREARAGES AND DELINQUENCIES 157
ITEM 14. MATERIAL MODIFICATIONS TO THE RIGHTS OF SECURITY HOLDERS AND USE OF PROCEEDS 158
ITEM 15. CONTROLS AND PROCEDURES 158
A. Disclosure Controls and Procedures 158
B. Management’s Annual Report on Internal Control Over Financial Reporting 158
C. Attestation Report of the Registered Public Accounting Firm 160
D. Changes in Internal Control Over Financial Reporting 160
ITEM 16. [RESERVED] 161
ITEM 16A. AUDIT COMMITTEE FINANCIAL EXPERT 161
ITEM 16B. CODE OF BUSINESS CONDUCT AND ETHICS 161
ITEM 16C. PRINCIPAL ACCOUNTANT FEES AND SERVICES 162
ITEM 16D. EXEMPTIONS FROM THE LISTING STANDARDS FOR AUDIT COMMITTEES 163
ITEM 16E. PURCHASES OF EQUITY SECURITIES BY THE ISSUER AND AFFILIATED PURCHASERS 163
ITEM 16F. CHANGE IN REGISTRANT’S CERTIFYING ACCOUNTANT 163
ITEM 16G. CORPORATE GOVERNANCE 164
ITEM 16H. MINE SAFETY DISCLOSURE 165
ITEM 17. FINANCIAL STATEMENTS 165
ITEM 18. FINANCIAL STATEMENTS 165
ITEM 19. EXHIBITS 165
ii
PART I.
INTRODUCTION
Certain Definitions
All references to “we”, “us”, “our”, “our company”, “the group” and “Graña y Montero” in this annual report are to Graña y Montero
S.A.A., a publicly-held corporation (sociedad anónima abierta) organized under the laws of Peru. In this annual report, we refer to our principal
subsidiaries, joint operations, joint ventures and associated companies as follows: (i) in our Engineering and Construction (E&C) segment: GyM S.A. as
“GyM”; Vial y Vives—DSD S.A. as “Vial y Vives—DSD”; GMI S.A. as “GMI”; Morelco S.A.S. as “Morelco”; (ii) in our Infrastructure segment:
Norvial S.A. as “Norvial”; Survial S.A. as “Survial”; Concesión Canchaque S.A. as “Canchaque”; GyM Ferrovías S.A. as “GyM Ferrovías”;
Concesionaria La Chira S.A. as “La Chira”; GMP S.A. as “GMP”; and (iii) in our Real Estate segment: Viva GyM S.A. as “Viva GyM”; Inmobiliaria
Almonte S.A.C. as “Almonte” and Concar S.A. as “Concar.” For more information on our subsidiaries, joint operations, joint ventures or associated
companies, see notes 6a, 6c and 16 to our audited annual consolidated financial statements included in this annual report.
The gas pipeline concession of Gasoducto Sur Peruano S.A. (“GSP”) was terminated on January 24, 2017, and, as a result, we recognized
impairments with respect to our investment in GSP and our participation in the related construction consortium (Consorcio Constructor Ductos del Sur,
or “CCDS”). Both GSP and CCDS are in the process of being liquidated. Additionally, we have recently sold certain assets and businesses, including:
on April 24, 2017, the sale of our interest in Compañía Operadora de Gas del Amazonas (“COGA”); on June 6, 2017, the sale of our interest in GMD
S.A. (“GMD”); on April 11, 2018, the sale of our interest in Stracon GyM S.A. (“Stracon GyM”); and, on December 4, 2018, the sale of our interest in
CAM Chile S.A. (“CAM”) and CAM Servicios del Perú S.A. (“CAM Servicios”). In addition, we are in the process of marketing for sale our subsidiary
Adexus S.A. (“Adexus”). For more information, see “Item 5.A. Operating and Financial Review and Prospects—Operating Results—Recent
Developments.”
The term “U.S. dollar” and the symbol “US$” refer to the legal currency of the United States; the term “sol” and the symbol “S/.” refer to
the legal currency of Peru; the term “Chilean peso” and the symbol “CLP” refer to the legal currency of Chile; and the term “Colombian peso” and the
symbol “COP” refer to the legal currency of Colombia.
Presentation of Financial Information
Our consolidated financial statements included in this annual report have been prepared in soles and in accordance with International
Financial Reporting Standards (“IFRS”) issued by the International Accounting Standards Board (“IASB”). Our annual consolidated financial
statements as of December 31, 2017 and 2018 and for the years ended December 31, 2016, 2017 and 2018 have been audited by Moore Stephens in
accordance with the standards of the Public Company Accounting Oversight Board (United States).
Our consolidated financial statements for the year ended December 31, 2017 included in this annual report have been restated. In our
consolidated financial statements included in our annual report on Form 20-F for the year ended December 31, 2017, we inadvertently presented the
gain on the sale of GMD under “Gain from the sale of investments” in error and, accordingly, we have restated our 2017 income statement and the
related notes to reflect GMD as a discontinued operation. The previously issued consolidated financial statements of the company for the 2017 fiscal
year (and the related audit opinion) included in the company’s annual report on Form 20-F for the year ended December 31, 2017 should not be relied
upon. For more information, see note 2.31 to our audited annual consolidated financial statements included in this annual report.
We manage our business in three segments: Engineering and Construction (E&C); Infrastructure; and Real Estate. Prior to December 31,
2017, in addition to the foregoing segments, we had a Technical Services segment. However, we transferred Concar from this segment to our
Infrastructure segment beginning on April 1, 2017; on June 6, 2017, we sold our interest in our former technical services subsidiary, GMD; and we are
in the process of marketing for sale Adexus, our other technical services subsidiary. The historical segment financial information included in this annual
report has been adjusted accordingly. For information on our results of operations by business segment, see note 7 to our audited annual consolidated
financial statements included in this annual report.
As a result of the sale of GMD on June 6, 2017, we present GMD as a discontinued operation in our audited annual consolidated financial
statements for the years ended December 31, 2017 and 2018. We have reclassified our consolidated financial statements for the year ended
December 31, 2016, and selected financial information for the years ended December 31, 2014 and 2015, included in this annual report, to show GMD
as a discontinued operation. In addition, (i) on December 4, 2018, we sold our interests in each of CAM and CAM Servicios, (ii) on April 11, 2018, we
sold our interest in Stracon GyM, and (iii) we are in the process of marketing for sale our subsidiary Adexus. As a result, we present CAM, CAM
Servicios and Stracon GyM as discontinued operations, and Adexus as an investment held for sale, in our audited annual consolidated financial
statements for the year ended December 31, 2018. We have reclassified our consolidated financial statements for the years ended December 31, 2016
and 2017, and the selected financial information for the years ended December 31, 2014 and 2015, included in this annual report to show CAM, CAM
Servicios and Stracon GyM as discontinued operations and Adexus as an investment held for sale. We have also revised prior backlog data included in
this annual report to exclude the presentation of entities that are presented as discontinued operations.
1

We requested that the staff of the U.S. Securities and Exchange Commission (the “SEC”) grant relief from the financial statement filing
requirements of Rule 3-09 of Regulation S-X (“Rule 3-09”) pursuant to Section 2430 of the Division of Corporation Finance Financial Reporting
Manual, with respect to our investment in GSP. The SEC has not granted our company’s waiver request and, as a result, our company is required to file
with the SEC separate financial statements for GSP for 2015, 2016 and 2017, with 2016 being audited. However, it is currently impracticable for our
company to comply with this requirement, because the audit opinion that was issued with respect to GSP’s 2016 financial statements included a
disclaimer, our company’s loss of significant influence over GSP, and GSP’s limited management as the entity is in insolvency proceedings. We believe
that GSP’s financial statements would not provide additional material information to investors. However, we cannot assure you that that the SEC will
not take actions against our company relating to our non-compliance, among other matters, in the event of a capital raise, our company may be
temporarily unable to have a registration statement for a public offering of securities in the United States declared effective by the SEC. For more
information, see “Item 3.D. Key Information—Risk Factors—Risks Related to our Company—we are not fully compliant with our reporting
requirements under the Exchange Act because of our inability to provide audited financial statements for GSP in accordance with Rule 3-09 . For more
information on GSP, see notes 5(e), 5(f) and 16 to our audited annual consolidated financial statements included in this annual report.
Non-IFRS Data
In this annual report, we present EBITDA, a non-GAAP financial measure. A non-GAAP financial measure is generally defined as one that
purports to measure financial performance, financial position or cash flows but excludes or includes amounts that would not be so adjusted in the most
comparable IFRS measure. We present EBITDA because we believe it provides readers with a supplemental measure of the financial performance of
our core operations that facilitates period-to-period comparisons on a consistent basis. Furthermore, we regularly present EBITDA in our filings with the
Lima Stock Exchange in Peru. Our management uses EBITDA, among other measures, for internal planning and performance measurement purposes.
We believe that EBITDA is useful in evaluating our operating performance compared to other companies operating in our sectors because the
calculation of EBITDA generally eliminates the effects of financing and income taxes and the accounting effects of capital spending, which items may
vary for different companies for reasons unrelated to overall operating performance. EBITDA should not be construed as an alternative to net profit or
operating profit, as an indicator of operating performance, as an alternative to cash flow provided by operating activities or as a measure of liquidity (in
each case, as determined in accordance with IFRS). EBITDA, as calculated by us, may not be comparable to similarly titled measures reported by other
companies. For our definition of EBITDA and a reconciliation of EBITDA to the most directly comparable IFRS financial measure, see “Item 3.A. Key
Information—Selected Financial Data—Non-GAAP Financial Measure and Reconciliation.”
Currency Translations
Our consolidated financial statements are prepared in soles. For a description of our translation of amounts in currencies other than soles in
our consolidated financial statements, see note 2.4 to our audited annual consolidated financial statements included in this annual report.
We have translated some of the soles amounts contained in this annual report into U.S. dollars and some U.S. dollars amounts contained in
this annual report into soles, for convenience purposes only. Unless otherwise indicated or the context otherwise requires, the rate used to translate soles
amounts to U.S. dollars and U.S. dollars amounts into soles was S/.3.379 to US$1.00, which was the exchange rate reported for December 31, 2018 by
the Peruvian Superintendency of Banks, Insurance and Private Pension Fund Administrators (Superintendencia de Banca, Seguros y AFPs, or “SBS”).
We present our backlog in U.S. dollars. For contracts denominated in soles or other local currencies, amounts have been converted into U.S. dollars
based on the exchange rate published by the SBS on December 31 of the corresponding year. When we present our ratios of backlog and revenues in
this annual report, we similarly convert our revenues, which are reported in soles, into U.S. dollars based on the exchange rate reported for December 31
of the corresponding year. For conversions of macroeconomic indicators (particularly in “Item 5.D. Operating and Financial Review and
Prospects—Trend Information” in this annual report), average annual exchange rates for the currencies of each of the countries addressed are used. The
Federal Reserve Bank of New York does not report a noon buying rate for soles. The U.S. dollar equivalent information presented in this annual report
is provided solely for convenience of the reader and should not be construed as implying that the soles or other currency amounts represent, or could
have been or could be converted into, U.S. dollars at such rates or at any other rate.
Rounding
Certain figures included in this annual report have been subject to rounding adjustments. Accordingly, figures shown as totals in certain
tables may not be arithmetic aggregations of the figures that precede them.
2
Backlog
This annual report includes our backlog for our Engineering and Construction, Infrastructure and Real Estate segments. We do not include
backlog in this annual report in our Infrastructure segment for: (i) our Norvial toll road concession because its revenues from the concession are derived
from toll fees charged to vehicles using the highway, and, as a result, such revenues are dependent on vehicular traffic levels; and (ii) our Energy line of
business because: (a) our revenues from hydrocarbon extraction services are dependent on the amounts of oil and gas we produce and market prices,
which fluctuate significantly; (b) our revenues from our gas processing plant are dependent on the amount of gas we process and market prices for
natural gas liquids, which fluctuate significantly; and (c) our revenues from our fuel storage terminal operation partially depend on the volume of fuel
dispatched. When we present backlog on a segment basis, we do not include eliminations that are included in our consolidated backlog. Backlog is not a
measure defined by IFRS, and our methodology for determining backlog may not be comparable to the methodology used by other companies in
determining their backlog. Backlog is not audited. We have revised prior backlog data included in this annual report to exclude the presentation of
entities that are presented as discontinued operations. For our definition of backlog, see “Item 4.B. Information on the Company—Business
Overview—Backlog.” See also “Item 3.D. Key Information—Risk Factors—Risks Related to our Company—Our backlog and our ratio of historical
backlog to revenues may not be reliable indicators of future revenues or profit.”
The GSP gas pipeline concession was terminated on January 24, 2017, which had a significant impact on our backlog for our E&C and our
consolidated backlog. For more information, see “Item 5.A. Operating and Financial Review and Prospects—Operating Results—Recent
Developments.”
Reserves Estimates
This annual report includes our estimates for proved reserves in Blocks I and V, where GMP provides hydrocarbon extraction services to,
and Blocks III and IV, where GMP extracts hydrocarbon under license agreements with, Perupetro S.A. (“Perupetro”). These reserves estimates were
prepared internally by our team of engineers and have not been audited or reviewed by any independent external engineers. For further information on
these reserves estimates, see “Item 3.D. Key Information—Risks Relating to Our Company – Additional Risks Related to our Infrastructure Business”
and “Item 4.B. Information on the Company—Business Overview—Infrastructure—Principal Infrastructure Lines of Business—Energy—Oil and Gas
Production.”
Market Information
We make estimates in this annual report regarding our competitive position and market share, as well as the market size and expected
growth of the engineering and construction, infrastructure and real estate services industries in Peru and elsewhere in Latin America. We have made
these estimates on the basis of our management’s knowledge and statistics and other information, which we believe to be the most recently available as
of the date of this annual report, from government agencies, industry professional organizations, industry publications and other sources. While we
believe these estimates to be accurate as of the date of this annual report, we have not independently verified the data from third-party sources and our
internal data has not been verified by any independent source. We paid Great Place to Work ® Institute, a human resources consulting, research and
training firm, for our employees to participate in their market survey referenced in this annual report (Copyright © 2018 Great Place to Work ® Institute,
Inc. All rights reserved.). In this annual report we present gross domestic product (“GDP”) both on a nominal and real basis. Real GDP is nominal GDP
adjusted to exclude the effect of inflation. Unless otherwise indicated, references to GDP are to real GDP.
Measurements and Other Data
In this annual report, we use the following measurements:
• “m” means one meter, which equals approximately 3.28084 feet;
• “m2” means one square meter, which equals approximately 10.7630 square feet;
• “km” means one kilometer, which equals approximately 0.621371 miles;
• “hectare” means one hectare, which equals approximately 2.47105 acres;
• “tonne” means one metric ton, which equals approximately 2,204.6 pounds;
• “bbl” or barrel of oil means one stock tank barrel, which is equivalent to approximately 0.15898 cubic meters;
3

• “boe” means one barrel of oil equivalent, which equals approximately 160.2167 cubic meters, determined using the ratio of 5,658
cubic feet of natural gas to one barrel of oil;
• “cf” means one cubic foot;
• “M,” when used before bbl, boe or cf, means one thousand bbl, boe and cf, respectively;
• “MM,” when used before bbl, boe or cf, means one million bbl, boe and cf, respectively;
• “MW” means one megawatt, which equals one million watts; and
• “Gwh” means one gigawatt hour, which equals one billion watt hours.
In this annual report, we use the term accident incident rate with respect to our E&C segment, which is calculated as the number of injuries
divided by the total number of hours worked by all full-time employees of our E&C segment during the relevant year divided by 200,000 (which reflects
40 hours worked per week in a 50-week year by 100 equivalent full-time workers).
Forward-Looking Statements
This annual report contains forward-looking statements. Forward-looking statements convey our current expectations or forecasts of future
events. These statements involve known and unknown risks, uncertainties and other factors, including those listed under “Item 3.D. Key
Information—Risk Factors,” which may cause our actual results, performance or achievements to differ materially from the forward-looking statements
that we make.
Forward-looking statements typically are identified by words or phrases such as “may,” “will,” “expect,” “anticipate,” “aim,” “estimate,”
“intend,” “project,” “plan,” “believe,” “potential,” “continue,” “is/are likely to,” or other similar expressions. Any or all of our forward-looking
statements in this annual report may turn out to be inaccurate. Our actual results could differ materially from those contained in forward-looking
statements due to a number of factors, including, among others:
• the impact on our business reputation from our association with Odebrecht S.A. (“Odebrecht”) affiliates in Peru;
• the potential effects of investigations of our company and certain of our former directors and executive officers, or any future
investigations, regarding corruption or other illegal acts;
• uncertainty with regards to the timing and amount of the government payment we are entitled to receive in connection with the
termination of the GSP pipeline concession;
• our ability to comply with the covenants in our debt instruments or obtain waivers in the event of non-compliance;
• our ability to consummate asset sales on favorable terms on a timely basis, or at all;
• the potential impact of the class action civil suit against our company and certain of our former directors and our former and current
executive officers;
• global macroeconomic conditions, including commodity prices;
• economic, political and social conditions in the markets in which we operate, particularly in Peru, including the resignation of
former President Pedro Pablo Kuczynski in March 2018 following corruption allegations;
• political conflicts and deadlocks in Peru between the Peruvian Congress and the executive branch;
• major changes in Peruvian government policies at the national, regional or municipal levels, including in connection with
infrastructure concessions, investments in infrastructure and affordable housing subsidies;
• social conflicts in Peru that disrupt infrastructure projects, particularly in the mining sector;
• interest rate fluctuation, inflation and devaluation or appreciation of the sol in relation to the U.S. dollar (or other currencies in
which we receive revenue);
4

• our backlog may not be a reliable indicator of future revenues or profit;
• the level of capital investments and financings available for infrastructure projects of the types that we perform, both in the private
and public sectors;
• competition in our markets, both from local and international companies;
• performance under contracts, where a failure to meet schedules, cost estimates or performance targets on a timely basis could result
in reduced profit margins or losses and impact our reputation;
• developments, some of which may be beyond our control, that affect our reputation in our markets, including a deterioration in our
safety record;
• industry-specific operational risks, such as operator errors, mechanical failures and other accidents;
• availability and costs of energy, raw materials, equipment and labor;
• our ability to obtain financing on favorable terms, including our ability to obtain performance bonds and similar financings; required
in the ordinary course of our business;
• our ability to attract and retain qualified personnel;
• our ability to enter into joint operations, and rules involved in operating under joint operation or similar arrangements;
• our exposure to potential liability claims and contract disputes, including as a result of environmental damage alleged to have been
caused by our operations;
• our and our clients’ compliance with environmental, health and safety laws and regulations, and changes in government policies and
regulations in the countries in which we operate;
• negotiations of claims with our clients of cost and schedule variances and change orders on major projects;
• delays in client payments, and increased financing costs for working capital resulting from those delays;
• volatility in global prices of oil and gas;
• the cyclical nature of some of our business segments;
• limitations on our ability to operate our concessions profitably, including changes in traffic patterns, and limitations on our ability to
obtain new concessions;
• our ability to accurately estimate the costs of our projects;
• changes in real estate market prices, customer demand, preference and purchasing power, and financing availability and terms;
• our ability to obtain zoning and other license requirements for our real estate development;
• changes in tax laws;
• natural disasters, severe weather or other events that may adversely impact our business; and
• other factors identified or discussed under “Item 3.D. Key Information—Risk Factors.”
The forward-looking statements in this annual report represent our expectations and forecasts as of the date of this annual report. Except as
required by law, we undertake no obligation to update or revise publicly any forward-looking statements, whether as a result of new information, future
events or otherwise, after the date of this annual report.
5

ITEM 1. IDENTITY OF DIRECTORS, SENIOR MANAGEMENT AND ADVISERS
Not applicable.
ITEM 2. OFFER STATISTICS AND EXPECTED TIMETABLE
Not applicable.
ITEM 3. KEY INFORMATION
A. Selected Financial Data
The following selected consolidated financial data should be read together with “Part I. Introduction. Presentation of Financial
Information,” “Item 5. Operations and Financial Review and Prospects” and our audited annual consolidated financial statements included in this
annual report.
The following selected financial data as of December 31, 2017 and 2018 and for the years ended December 31, 2016, 2017 and 2018 have
been derived from our audited annual consolidated financial statements included in this annual report. The following selected financial data as of
December 31, 2014, 2015 and 2016 and for the years ended December 31, 2014 and 2015 have been derived from our audited annual consolidated
financial statements not included in this annual report. Our annual consolidated financial statements for the years ended December 31, 2016, 2017 and
2018 have been audited by Moore Stephens in accordance with the standards of the Public Company Accounting Oversight Board (United States). Our
consolidated financial statements for the year ended December 31, 2017 included in this annual report have been restated. In our consolidated financial
statements included in our annual report on Form 20-F for the year ended December 31, 2017, we inadvertently presented the gain on the sale of GMD
under “Gain from the sale of investments” in error and, accordingly, we have restated our 2017 income statement and the related notes to reflect GMD
as a discontinued operation. For more information, see note 2.31 to our audited annual consolidated financial statements included in this annual report.
For the year ended December 31,
2014 2015 2016(1)
2017
Restated 2018 2018
(in millions of S/.)
(in millions of
US$)(2)
Income Statement Data:
Revenues 4,861.0 5,542.3 4,137.3 4,014.0 3,899.5 1,154.0
Cost of sales (4,212.5) (5,210.6) (3,821.2) (3,511.6) (3,225.0) (954.4)
Gross profit 648.5 331.7 316.1 502.5 674.5 199.6
Administrative expenses (298.4) (291.3) (278.3) (322.5) (278.4) (82.4)
Other income and expenses, net(3) 5.2 18.3 (21.9) (33.3) (61.2) (18.1)
Profit (losses) from sale of investments 2.1 — 46.3 34.5 — —
Other (expenses) income, net (0.1) 0.3 (0.5) 0.5 — —
Operating profit 357.3 58.4 61.8 181.7 334.7 99.1
Financial (expense) income, net(3) (58.3) (97.7) (179.8) (137.0) (197.1) (58.3)
Share of the profit and loss obtained from associates and joint ventures under
the equity method of accounting 52.9 24.4 (590.1) 0.5 (3.7) (1.1)
Profit before income tax 351.9 (14.9) (708.1) 45.1 133.9 39.6
Income tax (104.3) (78.7) 152.2 (46.3) (113.3) (33.5)
Profit from continuing operations 247.6 (93.5) (556.0) (1.2) 20.6 6.1
Profit from discontinued operations 113.7 149.1 104.4 210.4 36.8 10.9
Net profit 361.2 55.6 (451.6) 209.2 57.4 17.0
Net profit (loss) attributable to controlling interest(4) 299.7 7.1 (509.7) 148.7 (83.2) (24.6)
Net profit (loss) attributable to non-controlling interest(4) 61.5 48.5 58.1 60.5 140.6 41.6
6

(1) For the effects on our results of operations for 2016 resulting from the termination of the GSP gas pipeline concession, see “Item 5.A. Operating
and Financial Review and Prospects—Operating Results—Recent Developments” and notes 5(e), 5(f), and 16 to our audited annual consolidated
financial statements included in this annual report. In particular, we recognized an impairment to our investment in GSP of S/.593.1 million in
2016, which is recorded in Share of the profit and loss obtained from associates and joint ventures under the equity method of accounting.
(2) Calculated based on an exchange rate of S/.3.379 to US$1.00 as of December 31, 2018.
(3) Reflects exchange losses due to the depreciation of the sol against the U.S. dollar and our U.S. dollar denominated liabilities. For more
information, see note 28 to our audited annual consolidated financial statements included in this annual report.
(4) We consolidate the results of our subsidiaries in our financial statements and we reflect the profit corresponding to the minority interests in our
subsidiaries under “net profit attributable to non-controlling interests” in our income statement. With respect to our joint operations, we recognize
in our consolidated financial statements the revenue and expenses, including our share of any asset, liability, revenue or expense we hold jointly
with partners. We reflect the results of our associated companies under the equity method of accounting in our consolidated financial statements
under the line item “share of the profit and loss in associates” in our income statement. See “Item 5.A. Operating and Financial Review and
Prospects—Operating Results—Factors Affecting Our Results of Operations—Acquisitions,” “—General—Accounting for Subsidiaries, Joint
Operations, Joint Ventures and Associated Companies” and note 2.2 to our audited annual consolidated financial statements included in this
annual report.
As of December 31,
2014 2015 2016(1) 2017 2018 2018
Balance Sheet Data: (in millions of S/.)
(in millions of
US$)(2)
Total current assets 4,635.7 5,200.4 4,328.7 3,891.9 2,985.5 883.5
Cash and cash equivalents 818.4 554.0 607.0 626.2 801.1 237.1
Accounts receivables 1,768.6 2,143.3 1,862.5 2,381.9 1,631.2 482.7
Outstanding work in progress 1,152.8 1,278.2 680.9 61.8 28.5 8.4
Inventories(3) 833.6 1,159.2 1,104.3 770.7 514.0 152.1
Total non-current assets 3,094.2 3,699.6 4,718.0 4,775.7 4,197.1 1,242.1
Long-term accounts receivables(4) 624.5 687.8 1,754.4 2,180.8 2,133.5 631.4
Investments in associates and
joint ventures 229.6 637.0 389.8 268.7 257.8 76.3
Property, plant and equipment 1,148.7 1,111.8 1,113.6 865.7 470.6 139.3
Intangible assets(5) 780.8 878.3 960.3 940.1 847.1 250.7
Total current liabilities 3,796.1 4,092.3 4,537.0 3,549.2 2,665.8 788.9
Short-term borrowings 1,425.5 1,265.1 2,007.1 1,093.4 865.6 256.2
Accounts payable(6) (7) 2,151.4 2,779.6 2,453.1 2,356.7 1,768.1 523.3
Total non-current liabilities 753.8 1,725.8 2,019.9 2,529.4 2,048.9 606.3
Long-term borrowings 624.8 1,310.3 1,341.0 1,544.2 1,274.1 377.1
Capital stock 660.1 660.1 660.1 660.1 729.4 215.9
Shareholders’ equity 2,691.7 2,558.8 1,980.4 2,123.3 2,088.4 618.0
Non-controlling interest 488.7 523.1 509.3 465.7 401.6 118.8
(1) For the effects on our financial condition as of December 31, 2016 resulting from the termination of the GSP gas pipeline concession, see “Item
5.A. Operating and Financial Review and Prospects—Operating Results—Recent Developments” and notes 5(e), 5(f) and 26 to our audited annual
consolidated financial statements included in this annual report.
(2) Calculated based on an exchange rate of S/.3.379 to US$1.00 as of December 31, 2018.
(3) Includes investments for the purchase of land by our Real Estate segment. These investments in land are recorded at acquisition cost and are not
marked-to-market for changes in fair value. See note 15 to our audited annual consolidated financial statements included in this annual report.
(4) Includes payments required to be made by the Peruvian government for the amounts we invest to purchase trains and other infrastructure for the
Lima Metro. See “Item 5.A. Operating and Financial Review and Prospects—Operating Results—Results of
Operations—General—Infrastructure” and note 11 to our audited annual consolidated financial statements included in this annual report.
(5) We recognize our investments in the construction of the highway of our Norvial concession as intangible assets. See note 18(c) to our audited
annual consolidated financial statements included in this annual report.
(6) Includes S/.684.3 million, S/.607.1 million, S/.810.8 million, S/.726.3 million and S/.496.5 million in advance payments made by our clients as of
December 31, 2014, 2015, 2016, 2017 and 2018, respectively, in connection with our E&C segment and the operation and maintenance of
infrastructure assets contracts. See “Item 5.A. Operating and Financial Review and Prospects—Operating Results—Results of
Operations—General—Engineering and Construction” and note 22 to our audited annual consolidated financial statements included in this annual
report.
(7) Includes our payable to Chubb Insurance Company (US$52.5 million as of December 31, 2016 and US$15.6 million as of December 31, 2017)
relating to the termination of the GSP gas pipeline concession, which was fully repaid as of December 31, 2018. For more information, see “Item
5.A. Operating and Financial Review and Prospects—Operating Results—Recent Developments” and “—Liquidity and Capital
Resources—Indebtedness.”
7

As of and for the year ended December 31,
2014 2015 2016(1)
2017
Restated 2018 2018
(in millions of S/.)
(in millions of
US$)(2)
Other Data:
EBITDA(3) (in millions of S/. or US$) 783.9 538.4 (240.5) 572.3 557.3 164.9
Gross margin 13.3% 6.0% 7.6% 12.5% 17.3% 17.3%
EBITDA margin(4) 16.13% 9.7% (5.8)% 14.3% 14.3% 14.3%
Outstanding shares (thousands) 660,054 660,054 660,054 660,054 729,434 215,873
Profit per share (in S/.or US$) 0.55 0.08 (0.68) 0.31 0.08 0.02
Profit attributable to controlling interest per share (in S/.or US$) 0.45 0.01 (0.77) 0.23 (0.13) (0.04)
Dividend per share (in S/.or US$)(5) 0.16 0.05 — — — —
Net debt(6)/ EBITDA ratio 1.1x 3.5x (11.4)x 3.5x 2.4x 2.4x
Backlog (in millions of US$) (Unaudited)(7) 3,765.4 3,918.4 3,011.6 2,388.4 1,257.2 1,257.2
Backlog/revenues ratio (Unaudited)(7) 1.6x 1.9x 1.8x 1.3x 1.1x 1.1x
(1) For the effects on our results of operations and backlog for 2016 resulting from the termination of the GSP gas pipeline concession, see “Item 5.A.
Operating and Financial Review and Prospects—Operating Results—Recent Developments” and notes 5(e), 5(f) and 16 to our audited annual
consolidated financial statements included in this annual report.
(2) Calculated based on an exchange rate of S/.3.379 to US$1.00 as of December 31, 2018.
(3) For further information on the definition of EBITDA, see “—Non-GAAP Financial Measure and Reconciliation.”
(4) Reflects EBITDA as a percentage of revenues.
(5) Payment of dividends for the year’s profit.
(6) Net debt is calculated as total borrowings (including current and non-current borrowings) less cash and cash equivalents.
(7) For further information on our backlog, see “Item 4.B. Business Overview—Backlog.” Does not include, in our Infrastructure segment, our
Norvial toll road concession and our Energy line of business. Backlog is calculated as of the last day of the applicable year. Revenues are
calculated for that year and converted into U.S. dollars based on the exchange rate published by the SBS on December 31 of the corresponding
year, which was S/.2.989 to US$1.00 as of December 31, 2014, S/.3.413 to US$1.00 as of December 31, 2015, S/.3.36 to US$1.00 as of
December 31, 2016, S/.3.245 to US$1.00 as of December 31, 2017 and S/.3.379 to US$1.00 as of December 31, 2018. Includes revenues only for
businesses included in our backlog.
The following tables set forth summary financial data for each of our business segments. For more information on the results of operations
of our segments, see “Item 5.A. Operating and Financial Review and Prospects—Operating Results—Results of Operations” and note 7 to our audited
annual consolidated financial statements included in this annual report. The effects of the termination of the GSP gas pipeline concession on our results
of operations and financial condition for 2016 are reflected in Corporate (the Parent Company Operations) and, with respect to CCDS, in our E&C
segment.
Beginning on April 1, 2017, we transferred Concar from our former Technical Services segment to our Infrastructure segment. For ease of
comparison, the historical segment financial information included in this annual report presents Concar in the Infrastructure segment. This change does
not impact our consolidated financial results.
1. Engineering & Construction
For the year ended December 31,
2014 2015 2016 2017 2018 2018
(in millions of S/.)
(in millions of
US$)(1)
Income Statement Data:
Revenues 3,718.0 4,352.7 2,936.8 2,331.9 1,960.9 580.3
Cost of sales (3,354.1) (4,244.4) (2,876.6) (2,155.4) (1,898.8) (561.9)
Gross profit 363.8 108.3 60.2 176.5 62.1 18.4
Administrative expenses (219.7) (243.6) (212.0) (188.2) (136.1) (40.3)
Other income and (expenses), net (12.5) 6.4 (14.2) (46.5) (13.5) (4.0)
Other (losses) gains, net — (0.2) — — — —
Operating profit 131.7 (129.2) (166.1) (58.1) (87.5) (25.9)
Financial (expense) income, net (44.8) (96.8) (50.8) (38.2) (67.7) (20.0)
Share of the profit or loss in associates under the equity method of accounting 48.2 15.0 16.5 31.0 11.4 3.4
Profit (loss) before income tax 131.1 (210.9) (200.4) (65.3) (143.9) (42.6)
8
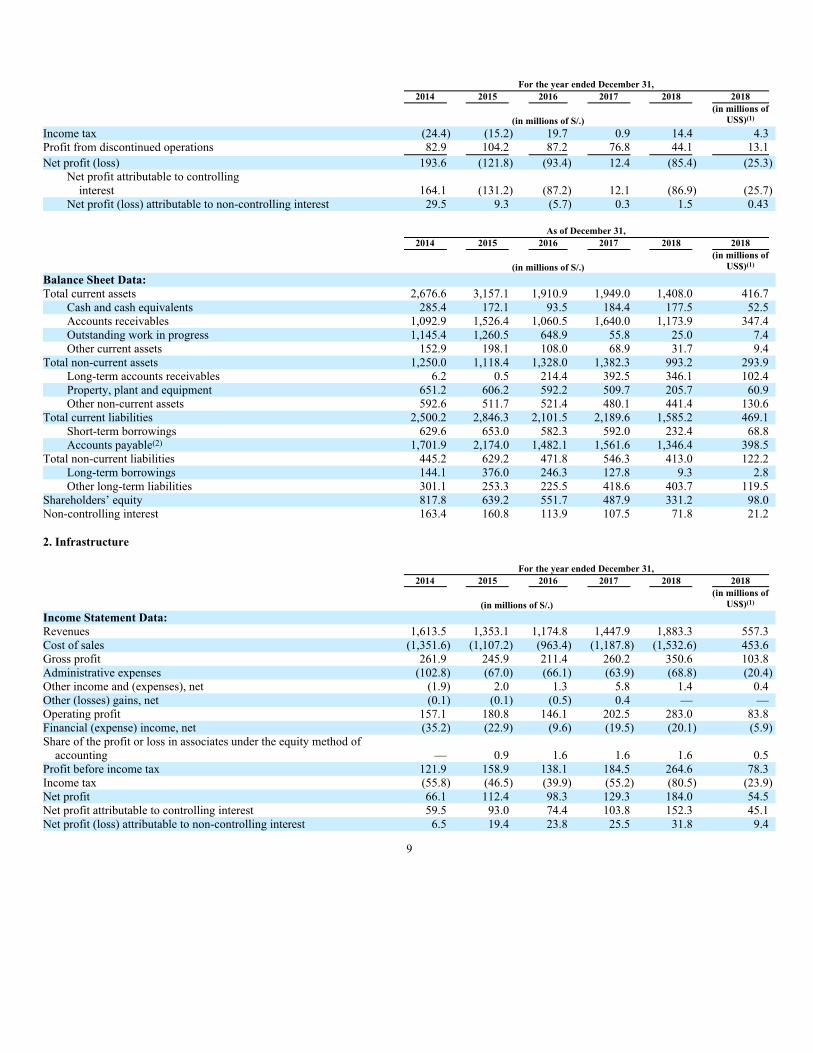
For the year ended December 31,
2014 2015 2016 2017 2018 2018
(in millions of S/.)
(in millions of
US$)(1)
Income tax (24.4) (15.2) 19.7 0.9 14.4 4.3
Profit from discontinued operations 82.9 104.2 87.2 76.8 44.1 13.1
Net profit (loss) 193.6 (121.8) (93.4) 12.4 (85.4) (25.3)
Net profit attributable to controlling
interest 164.1 (131.2) (87.2) 12.1 (86.9) (25.7)
Net profit (loss) attributable to non-controlling interest 29.5 9.3 (5.7) 0.3 1.5 0.43
As of December 31,
2014 2015 2016 2017 2018 2018
(in millions of S/.)
(in millions of
US$)(1)
Balance Sheet Data:
Total current assets 2,676.6 3,157.1 1,910.9 1,949.0 1,408.0 416.7
Cash and cash equivalents 285.4 172.1 93.5 184.4 177.5 52.5
Accounts receivables 1,092.9 1,526.4 1,060.5 1,640.0 1,173.9 347.4
Outstanding work in progress 1,145.4 1,260.5 648.9 55.8 25.0 7.4
Other current assets 152.9 198.1 108.0 68.9 31.7 9.4
Total non-current assets 1,250.0 1,118.4 1,328.0 1,382.3 993.2 293.9
Long-term accounts receivables 6.2 0.5 214.4 392.5 346.1 102.4
Property, plant and equipment 651.2 606.2 592.2 509.7 205.7 60.9
Other non-current assets 592.6 511.7 521.4 480.1 441.4 130.6
Total current liabilities 2,500.2 2,846.3 2,101.5 2,189.6 1,585.2 469.1
Short-term borrowings 629.6 653.0 582.3 592.0 232.4 68.8
Accounts payable(2) 1,701.9 2,174.0 1,482.1 1,561.6 1,346.4 398.5
Total non-current liabilities 445.2 629.2 471.8 546.3 413.0 122.2
Long-term borrowings 144.1 376.0 246.3 127.8 9.3 2.8
Other long-term liabilities 301.1 253.3 225.5 418.6 403.7 119.5
Shareholders’ equity 817.8 639.2 551.7 487.9 331.2 98.0
Non-controlling interest 163.4 160.8 113.9 107.5 71.8 21.2
2. Infrastructure
For the year ended December 31,
2014 2015 2016 2017 2018 2018
(in millions of S/.)
(in millions of
US$)(1)
Income Statement Data:
Revenues 1,613.5 1,353.1 1,174.8 1,447.9 1,883.3 557.3
Cost of sales (1,351.6) (1,107.2) (963.4) (1,187.8) (1,532.6) 453.6
Gross profit 261.9 245.9 211.4 260.2 350.6 103.8
Administrative expenses (102.8) (67.0) (66.1) (63.9) (68.8) (20.4)
Other income and (expenses), net (1.9) 2.0 1.3 5.8 1.4 0.4
Other (losses) gains, net (0.1) (0.1) (0.5) 0.4 — —
Operating profit 157.1 180.8 146.1 202.5 283.0 83.8
Financial (expense) income, net (35.2) (22.9) (9.6) (19.5) (20.1) (5.9)
Share of the profit or loss in associates under the equity method of
accounting — 0.9 1.6 1.6 1.6 0.5
Profit before income tax 121.9 158.9 138.1 184.5 264.6 78.3
Income tax (55.8) (46.5) (39.9) (55.2) (80.5) (23.9)
Net profit 66.1 112.4 98.3 129.3 184.0 54.5
Net profit attributable to controlling interest 59.5 93.0 74.4 103.8 152.3 45.1
Net profit (loss) attributable to non-controlling interest 6.5 19.4 23.8 25.5 31.8 9.4
9
As of December 31,
2014 2015 2016 2017 2018 2018
(in millions of S/.)
(in millions of
US$)(1)
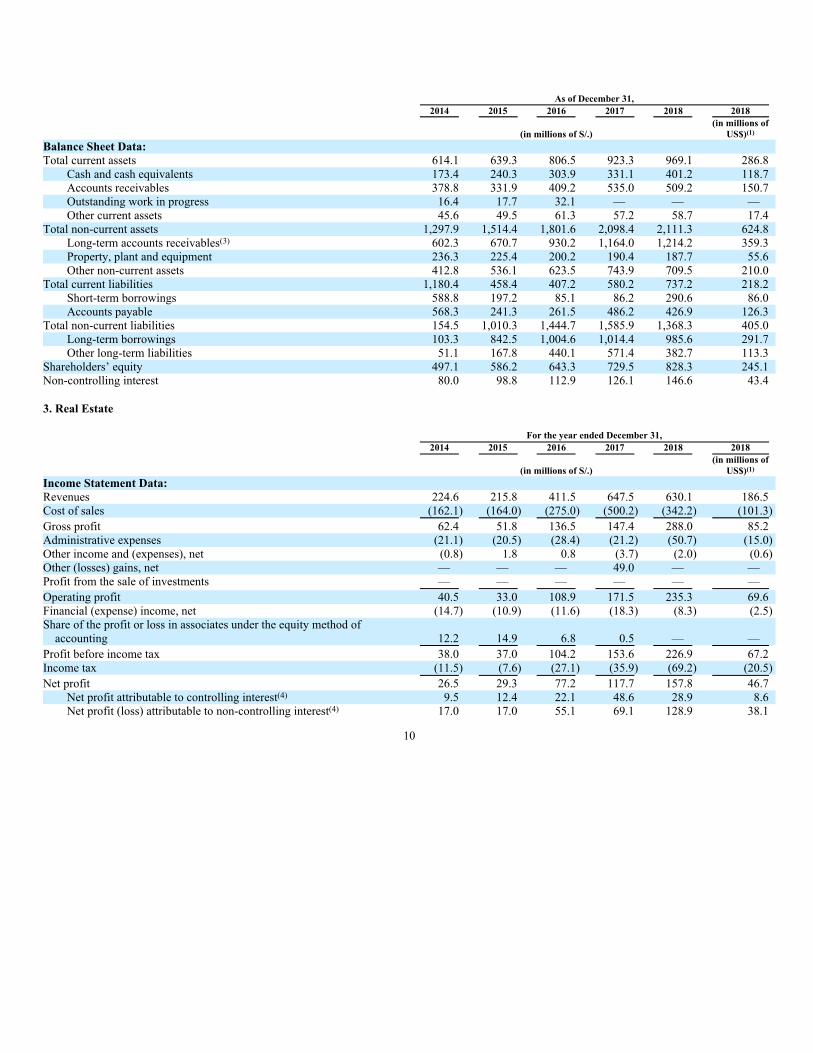
Balance Sheet Data:
Total current assets 614.1 639.3 806.5 923.3 969.1 286.8
Cash and cash equivalents 173.4 240.3 303.9 331.1 401.2 118.7
Accounts receivables 378.8 331.9 409.2 535.0 509.2 150.7
Outstanding work in progress 16.4 17.7 32.1 — — —
Other current assets 45.6 49.5 61.3 57.2 58.7 17.4
Total non-current assets 1,297.9 1,514.4 1,801.6 2,098.4 2,111.3 624.8
Long-term accounts receivables(3) 602.3 670.7 930.2 1,164.0 1,214.2 359.3
Property, plant and equipment 236.3 225.4 200.2 190.4 187.7 55.6
Other non-current assets 412.8 536.1 623.5 743.9 709.5 210.0
Total current liabilities 1,180.4 458.4 407.2 580.2 737.2 218.2
Short-term borrowings 588.8 197.2 85.1 86.2 290.6 86.0
Accounts payable 568.3 241.3 261.5 486.2 426.9 126.3
Total non-current liabilities 154.5 1,010.3 1,444.7 1,585.9 1,368.3 405.0
Long-term borrowings 103.3 842.5 1,004.6 1,014.4 985.6 291.7
Other long-term liabilities 51.1 167.8 440.1 571.4 382.7 113.3
Shareholders’ equity 497.1 586.2 643.3 729.5 828.3 245.1
Non-controlling interest 80.0 98.8 112.9 126.1 146.6 43.4
3. Real Estate
For the year ended December 31,
2014 2015 2016 2017 2018 2018
(in millions of S/.)
(in millions of
US$)(1)
Income Statement Data:
Revenues 224.6 215.8 411.5 647.5 630.1 186.5
Cost of sales (162.1) (164.0) (275.0) (500.2) (342.2) (101.3)
Gross profit 62.4 51.8 136.5 147.4 288.0 85.2
Administrative expenses (21.1) (20.5) (28.4) (21.2) (50.7) (15.0)
Other income and (expenses), net (0.8) 1.8 0.8 (3.7) (2.0) (0.6)
Other (losses) gains, net — — — 49.0 — —
Profit from the sale of investments — — — — — —
Operating profit 40.5 33.0 108.9 171.5 235.3 69.6
Financial (expense) income, net (14.7) (10.9) (11.6) (18.3) (8.3) (2.5)
Share of the profit or loss in associates under the equity method of
accounting 12.2 14.9 6.8 0.5 — —
Profit before income tax 38.0 37.0 104.2 153.6 226.9 67.2
Income tax (11.5) (7.6) (27.1) (35.9) (69.2) (20.5)
Net profit 26.5 29.3 77.2 117.7 157.8 46.7
Net profit attributable to controlling interest(4) 9.5 12.4 22.1 48.6 28.9 8.6
Net profit (loss) attributable to non-controlling interest(4) 17.0 17.0 55.1 69.1 128.9 38.1
10

As of December 31,
2014 2015 2016 2017 2018 2018
(in millions of S/.)
(in millions of
US$)(1)
Balance Sheet Data:
Total current assets 760.8 1,109.3 1,117.1 884.6 721.0 213.4
Cash and cash equivalents 54.3 74.5 58.9 85.2 93.3 27.6
Accounts receivables 75.6 114.4 111.2 155.3 179.3 53.1
Outstanding work in progress 631.0 920.4 — — — —
Other current assets(5) 117.4 91.7 947.0 644.1 448.4 132.7
Total non-current assets 9.7 14.7 113.6 78.5 98.5 29.2
Long-term accounts receivables(3) 7.3 11.3 17.9 9.8 36.3 10.7
Property, plant and equipment 36.2 34.7 13.0 11.6 9.2 2.7
Other non-current assets 64.1 30.9 82.7 57.0 53.0 15.7
Total current liabilities 266.6 555.1 515.8 352.1 310.1 91.8
Short-term borrowings 144.3 224.4 206.5 162.0 133.1 39.4
Accounts payable 120.1 330.7 291.2 144.8 172.5 51.1
Total non-current liabilities 138.9 159.6 104.2 44.1 37.2 11.0
Long-term borrowings 16.4 27.6 16.5 12.0 10.7 3.2
Other long-term liabilities 122.5 132.0 87.6 32.1 26.5 7.8
Shareholders’ equity 157.3 158.6 234.4 217.3 193.5 57.3
Non-controlling interest 315.4 327.6 376.3 349.6 278.7 82.5
(1) Calculated based on an exchange rate of S/.3.379 to US$1.00 as of December 31, 2018.
(2) Includes advance payments, which reflects advance payments made by our clients in connection with our E&C and Operation and Maintenance of
Infrastructure Assets contracts. See “Item 5.A. Operating and Financial Review and Prospects—Operating Results—Results of
Operations—General—Engineering and Construction” and note 22 to our audited annual consolidated financial statements included in this annual
report.
(3) Includes payments required to be made by the Peruvian government for the amounts we invest to purchase trains and other infrastructure for the
Lima Metro. See “Item 5.A. Operating and Financial Review and Prospects—Operating and Financial Review and Prospects—Operating
Results—Results of Operations—General—Infrastructure” and note 11 to our audited annual consolidated financial statements included in this
annual report.
(4) The net profit attributable to controlling interests of our Real Estate segment is significantly affected by the financing and commercial
arrangements we use to purchase land and to develop real estate projects. Depending on the level of non-controlling interests used to finance our
real estate projects, our Real Estate segment tends to have significant net profit attributable to non-controlling interests. See “Item 5.A. Operating
and Financial Review and Prospects—Operating Results—Results of Operations—General—Real Estate.”
(5) Includes inventories, which includes investments for the purchase of land by our Real Estate segment. These investments in land are recorded at
book value and are not marked to market for changes in fair value. See note 15 to our audited annual consolidated financial statements included in
this annual report.
Non-GAAP Financial Measure and Reconciliation
In this annual report, we present EBITDA, a non-GAAP financial measure. A non-GAAP financial measure is generally defined as one that
purports to measure financial performance, financial position or cash flows but excludes or includes amounts that would not be so adjusted in the most
comparable IFRS measure. We define EBITDA as net profit plus: financial (expense) income, net; income tax; and depreciation and amortization.
We present EBITDA because we believe it provides readers with a supplemental measure of the financial performance of our core
operations that facilitates period-to-period comparisons on a consistent basis. Furthermore, we regularly present EBITDA in our filings with the Lima
Stock Exchange in Peru. Our management uses EBITDA, among other measures, for internal planning and performance measurement purposes. We
believe that EBITDA is useful in evaluating our operating performance compared to that of other companies operating in our sectors because the
calculation of EBITDA and EBITDA generally eliminates the effects of financing and income taxes and the accounting effects of capital spending,
which items may vary for different companies for reasons unrelated to overall operating performance. EBITDA should not be construed as an
alternative to net profit or operating profit, as an indicator of operating performance, as an alternative to cash flow provided by operating activities or as
a measure of liquidity (in each case, as determined in accordance with IFRS). EBITDA, as calculated by us, may not be comparable to similarly titled
measures reported by other companies. The following table sets forth the reconciliation of our net profit to EBITDA on a consolidated basis.
11

For the year ended December 31,
2014 2015 2016
2017
Restated 2018 2018
(in millions of S/.)
(in millions of
US$)(1)
Net profit (loss) 361.2 55.6 (451.6) 209.2 57.4 17.0Financial expense 381.8 518.6 942.5 473.9 630.1 186.5Financial income (323.6) (420.9) (762.7) (336.8) (433.0) (128.2) Income tax 104.6 78.7 (152.2) 46.3 113.3 33.5Depreciation and amortization 260.0 306.4 183.4 179.7 189.5 56.1EBITDA 783.9 538.4 (240.5) 572.3 557.3 164.9
(1) Calculated based on an exchange rate of S/.3.379 to US$1.00 as of December 31, 2018.
The following table shows a reconciliation of the EBITDA for our three segments, Parent company operations and intercompany eliminations:
For the year ended December 31,
2014 2015 2016
2017
Restated 2018 2018
(in millions of S/.)
(in millions of
US$)(1)
Engineering and construction 407.0 158.3 19.3 120.0 19.2 5.69Infrastructure 257.2 272.2 237.8 300.9 411.5 121.8Real estate 56.5 52.8 121.4 177.3 241.0 71.3Parent company operations 258.2 (34.1) (1,025.2) 125.9 (27.8) 8.2Intercompany eliminations (245.4) 16.2 406.2 (151.8) (86.6) (25.6) EBITDA 783.9 538.4 (240.5) 572.3 557.3 164.9
(1) Calculated based on an exchange rate of S/.3.379 to US$1.00 as of December 31, 2018.
The following tables set forth the reconciliation of our net profit to EBITDA for each of our business segments and certain of our lines of business or subsidiaries within these segments. The effects of the termination of the GSP gas pipeline concession on our results of operations and financial condition for 2016 are reflected in Corporate (the Parent Company Operations) and, with respect to the related construction consortium (CCDS), in our E&C segment. Beginning on April 1, 2017, we transferred Concar from our Technical Services segment to our former Infrastructure segment. This change does not impact our consolidated financial results. For more information, see note 7 to our audited annual consolidated financial statements included in this annual report.
1. Engineering & Construction
For the year ended December 31,
2014 2015 2016 2017 2018 2018
(in millions of S/.)
(in millions of
US$)(2)
Net profit (loss) 193.6 (121.8) (93.5) 12.4 (85.4) (25.3) Financial expense 201.2 375.8 555.8 212.3 284.7 84.3Financial income (156.4) (279.0) (505.0) (174.1) (217.0) (64.2) Income tax 24.4 15.2 (19.7) (0.9) (14.4) (4.3) Depreciation and amortization 144.2 168.1 81.6 70.3 51.3 15.2EBITDA 407.0 158.3 19.3 120.0 19.2 5.7
2. Infrastructure
2.1 Full Segment
For the year ended December 31,
2014 2015 2016 2017 2018 2018
(in millions of S/.)
(in millions of
US$)(2)
Net profit 92.6 112.4 98.3 129.3 184.0 54.5Financial expense 101.6 78.2 101.7 62.6 143.1 42.4Financial income (71.2) (55.3) (92.0) (43.1) (123.1) (36.4) Income tax 56.6 46.5 39.9 55.2 80.5 23.8Depreciation and amortization 77.6 90.5 90.0 96.9 126.8 37.5EBITDA 257.2 272.3 237.8 300.9 411.5 121.8
12

2.2(a) All Toll Roads
For the year ended December 31,
2014 2015 2016 2017 2018 2018
(in millions of S/.)
(in millions of
US$)(2)
Net profit 43.0 53.5 44.9 55.0 29.2 8.6
Financial expense 19.0 10.8 14.9 7.7 28.6 8.5
Financial income (9.5) (14.8) (9.6) (3.5) (7.2) (2.1)
Income tax 16.2 18.8 15.5 20.9 8.8 2.6
Depreciation and amortization 11.4 10.9 11.1 11.0 42.9 12.7
EBITDA 80.1 79.2 76.8 91.1 102.3 30.3
2.2(b) Norvial
For the year ended December 31,
2014 2015 2016 2017 2018 2018
(in millions of S/.)
(in millions of
US$)(2)
Net profit 31.1 40.9 47.3 49.4 17.2 5.1
Financial expense 9.7 4.1 4.9 3.4 25.0 7.4
Financial income (0.4) (0.4) (1.6) (0.9) (1.0) (0.3)
Income tax 10.9 13.6 16.3 18.7 3.9 1.1
Depreciation and amortization 11.0 10.8 10.9 10.8 42.7 12.6
EBITDA 62.3 68.9 77.7 81.4 87.8 26.0
2.3 Mass Transit
For the year ended December 31,
2014 2015 2016 2017 2018 2018
(in millions of S/.)
(in millions of
US$)(2)
Net profit (loss) 12.1 18.8 23.9 19.5 87.1 25.8
Financial expense 39.8 7.9 20.5 18.4 72.5 21.4
Financial income (35.3) (4.9) (25.8) (14.0) (87.0) (25.8)
Income tax 10.8 8.1 10.9 9.5 38.0 11.3
Depreciation and amortization 0.9 0.1 0.1 0.1 0.2 0.1
EBITDA 28.3 30.0 29.6 33.5 110.8 32.8
2.4 Energy
For the year ended December 31,
2014 2015 2016 2017 2018 2018
(in millions of S/.)
(in millions of
US$)(2)
Net profit 62.7 20.2 12.0 38.1 65.0 19.2
Financial expense 30.6 50.3 61.7 34.8 37.9 11.2
Financial income (19.2) (30.5) (52.0) (23.3) (26.9) (7.9)
Income tax 29.8 7.7 5.3 13.2 26.3 7.8
Depreciation and amortization 58.1 74.2 72.5 79.4 76.6 22.7
EBITDA 162.0 121.8 99.5 142.1 178.9 52.9
13

2.5 Concar
For the year ended December 31,
2014 2015 2016 2017 2018 2018
(in millions of S/.)
(in millions of
US$)(2)
Net profit (loss) (26.5) 18.5 14.0 16.9 2.4 0.7
Financial expense 12.0 9.1 4.5 1.7 4.2 1.2
Financial income (7.2) (5.0) (4.6) (2.3) (1.4) (0.4)
Income tax (0.8) 11.4 6.7 11.4 6.9 2.0
Depreciation and amortization 7.1 5.3 6.4 6.4 7.1 2.1
EBITDA (15.3) 39.3 27.0 34.1 19.2 5.7
3. Real Estate
For the year ended December 31,
2014 2015 2016 2017 2018 2018
(in millions of S/.)
(in millions of
US$)(2)
Net profit 26.5 29.3 77.2 117.7 157.8 46.7
Financial expense 30.4 47.7 65.1 36.0 25.2 7.5
Financial income (15.6) (36.8) (53.5) (17.7) (16.9) (5.0)
Income tax 11.5 7.6 27.1 35.9 69.2 20.5
Depreciation and amortization 3.8 4.9 5.6 5.3 5.7 1.7
EBITDA 56.5 52.8 121.4 177.3 241.0 71.3
(1) For the effects on our results of operations for 2016 resulting from the termination of the GSP gas pipeline concession, see “Item. S.A. Operating
and Financial Review and Prospects—Operating Results—Recent Developments” and notes 5(e) and 16 to our audited annual consolidated
financial statements included in this annual report.
(2) Calculated based on an exchange rate of S/.3.379 to US$1.00 as of December 31, 2018.
(3) Our E&C segment EBITDA includes S/.48.2 million, S/.15.0 million,S/.16.5 million, S/.31.0 million and S/.11.4 in 2014, 2015, 2016, 2017 and
2018, respectively, which represents GyM’s 39.0% equity interest in Viva GyM’s net profit.
B. Capitalization and Indebtedness
Not applicable.
C. Reasons for the Offer and Use of Proceeds
Not applicable.
D. Risk Factors
Risks Related to Recent Developments
Our reputation has been adversely affected by our association with Odebrecht’s affiliates in Peru
We have participated in consortia with Odebrecht affiliates in Peru. Our reputation has been adversely affected as a result of the plea
agreements and criminal convictions of Odebrecht and certain key persons related to Odebrecht in connection with corruption, money laundering and
criminal organization. Peruvian authorities have initiated congressional inquiries and criminal investigations into the dealings of Odebrecht’s affiliates
in Peru, the scope of which include certain consortia in which we participated. Moreover, as a result, our company and certain of our former directors
and senior management have been the subject of congressional and criminal investigations relating to corruption allegations. These investigations are
ongoing.
Recent news reports have indicated that Odebrecht has executed a settlement and cooperation agreement with the Peruvian government
regarding several infrastructure projects in the country, including certain projects in which we have participated. According to news reports, under the
agreement Odebrecht has agreed to pay compensation to the Peruvian government over the course of several years and to cooperate with, and provide
evidence to, prosecutors in connection with ongoing investigations by this Peruvian government. According to news reports, former senior officers of
Odebrecht’s affiliate in Peru have indicated to Peruvian prospectors
14

(sometimes in apparent contradiction with prior statements) that certain of our former directors and senior management were aware that Odebrecht had
made corrupt payments to government officials in connection with certain projects in which we participated. We have undertaken an internal
investigation and we continue to review and assess the past practices of our company, to determine whether there has been any wrongdoing on the part
of our former or current directors, officers and employees.
Our reputation is a key factor in our clients’ evaluation of whether to engage our services, key industry players’ willingness to partner with
us, financial institutions’ willingness to provide us credit, and recruiting and retaining talented personnel to our company. The impact on our business
reputation related to our association with Odebrecht and the alleged actions of our former board members and executive officers has had, and is likely to
continue to have, a material adverse effect on our business, financial condition and results of operations.
Investigations regarding potential corruption or other illegal acts could have a material adverse effect on our business, financial condition and
results of operations
The Lava Jato commission of the Peruvian Congress has undertaken congressional inquiries into our company and other construction
companies in Peru, which have included certain of our company’s former directors and senior management.
Peruvian prosecutors have included José Graña Miró Quesada, a shareholder and the former Chairman of our company, in an investigation
for the crime of collusion, and Hernando Graña Acuña, a shareholder, a former board member of our company and chairman of our subsidiary GyM, for
the crime of money laundering against the Peruvian government, each in connection with the IIRSA South project concession (tranches II and III), in
which we participated with Odebrecht. Gonzalo Ferraro Rey, the former Chief Infrastructure Officer of our company, has also been included in an
investigation for the crime of money laundering in connection with the same project.
In connection with investigations relating to the IIRSA South project concession (tranches II and III), the Peruvian criminal prosecutor
moved to charge our company and our construction subsidiary, GyM, as criminal defendants in connection with the project. In response, the Peruvian
First National Preparatory Investigation Court (Primer Juzgado de Investigación Preparatoria Nacional) notified us of its decision to formally include
our company and GyM in its criminal investigation. We appealed the court’s decision and, in June 2018, the First Court of Appeals of the Superior
Court of Lima revoked the judicial order that indicted our company and GyM, among other corporate defendants, in the criminal investigation on
charges of collusion and other crimes and rejected the petition, without prejudice, made by the prosecutor to incorporate both companies in the
aforementioned process. Nevertheless, we cannot assure you that the criminal prosecutor will not file a new motion to charge our company and/or GyM
or that our position will ultimately prevail if such motion is filed.
Separately, in December 2018, the Peruvian First National Preparatory Investigation Court resolved to include our company and GyM as
civilly-responsible third parties in the investigations related to the IIRSA South project concession (tranches II and III) and GyM as a civilly-responsible
third party in the investigations related to Tranches 1 and 2 of the Lima Metro. These proceedings are ongoing.
Recent news reports have indicated that Odebrecht has executed a settlement and cooperation agreement with the Peruvian government
regarding several infrastructure projects in the country, including certain projects in which we have participated. According to news reports, under the
agreement Odebrecht has agreed to pay compensation to the Peruvian government over the course of several years and to cooperate with, and provide
evidence to, prosecutors in connection with ongoing investigations by this Peruvian government. According to news reports, former senior officers of
Odebrecht’s affiliate in Peru have indicated to Peruvian prospectors (sometimes in apparent contradiction with prior statements) that certain of our
former directors and senior management were aware that Odebrecht had made corrupt payments to government officials in connection with certain
projects in which we participated. We have undertaken an internal investigation and we continue to review and assess the past practices of our company,
to determine whether there has been any wrongdoing on the part of our former or current directors, officers and employees. In addition, a former
secretary of the IIRSA South project recently asserted that a former executive of our company was present at a meeting in 2011 in which the need to
reimburse illicit payments previously made by Odebrecht was mentioned. We continue to review and assess the past practices of our company to
determine whether there has been any wrongdoing on the part of our former or current officers and employees.
We cannot assure you that other of our former or current directors and senior management will not be included in the foregoing proceedings
as well, or that our company will not be included in other investigations or proceedings as criminal defendants or civilly-responsible third parties.
A conviction of corruption or settlements with government authorities could lead to criminal and civil fines as well as penalties, sanctions,
injunctions against future conduct, profit disgorgement, disqualifications from directly and indirectly engaging in certain types of business, the loss of
business licenses or permits or other restrictions. Moreover, our alleged involvement in corruption
15
investigations, and any findings or admissions of wrongdoing in such investigations, could further damage our reputation and have a material adverse
impact on our ability to compete for business. Such investigations may also adversely affect our ability to pursue strategic projects, and could potentially
result in the termination or modification of certain existing contracts or relationships. In addition, such investigations may affect the company’s ability
to secure financing in the future. Furthermore, investigations could continue to divert management’s attention and resources from other issues facing our
business.
In May 2018, Peruvian Supreme Decree No. 096-2018-EF set forth guidelines to determine the value of assets to be put in trust to guarantee
eventual compensation to the Peruvian government that is required for companies that have been partners of companies that have been, or whose
officers or representatives have been, convicted of, or have admitted to, corruption, money-laundering or similar crimes, which includes our company
and our subsidiary GyM. Following discussions with the Peruvian government during the fourth quarter of 2018, we established a trust in favor of the
Peruvian government, which we funded in the amount of S/.79.1 million (US$23.4 million) by assigning shares of our subsidiary GMI to such trust. We
cannot assure you that the Peruvian government will not claim the assets set forth in this trust or require that our company place additional assets in
trust, nor can we assure you that these assets will fully satisfy any eventual obligations we may have to the Peruvian government. Management has
estimated that the value of the contingency for the matters described above should not exceed US$45.8 million (S/.148.4 million).
We continue to evaluate alternatives to resolving ongoing investigations against our company and our subsidiary GyM. However, we cannot
assure you that these investigations will be resolved in a manner that is favorable to our company.
INDECOPI and Peruvian prosecutors have initiated investigations in response to news reports alleging that certain construction companies in Peru,
Brazil and Spain, including our company, colluded to receive public contracts
In July 2017, media reports alleged that certain construction companies in Peru, Brazil and Spain, including our company, colluded as a
“construction club” to receive public contracts. As a result of these reports, the Peruvian National Institute for the Defense of Free Competition and the
Protection of Intellectual Property (“INDECOPI”) has initiated an investigation regarding the anti-competitive activities of construction companies in
Peru, including our company. In July 2017, INDECOPI conducted a search of our facilities related to these allegations.
Separately, in December 2018, GyM was formally included as a civilly-responsible third party, along with eleven other construction
companies in the criminal investigation conducted by a Peruvian public prosecutor based on facts similar to those under investigation by INDECOPI. In
addition, a former employee of GyM has been included in a criminal investigation for collusion and other alleged crimes.
We cannot assure you that any of our company’s current or former directors or senior management will not be included in these
investigations in the future, nor can we predict the outcome of any such investigations, the timing thereof or how they may impact our business,
financial condition and results of operations.
We continue to review and assess the past practices of our company to determine whether there has been any wrongdoing on the part of our
former or current directors, officers and employees in relation to this matter. In addition, we continue to evaluate alternatives to resolve the ongoing
investigation against our company. However, we cannot assure you that this investigation will be resolved in a manner that is favorable to our company.
Our inability to provide audited financial statements for GSP in accordance with Rule 3-09 may result in enforcement actions by the SEC or may,
among other matters, cause us to be unable to complete a public offering in the United States
We have been unable to provide certain financial statements of GSP that are required by Rule 3-09 to be included in our company’s annual
report. Under Rule 3-09, we are required to present or generate financial statements of GSP as of December 31, 2015 and for the period from
November 2, 2015 to December 31, 2015, as of and for the year ended December 31, 2016 and as of and for the year ended December 31, 2017, with
the financial statements of GSP as of and for the year ended December 31, 2016 audited in accordance with the standards of the Public Company
Accounting Oversight Board. It is currently impracticable for our company to comply with this requirement, because the audit opinion that was issued
with respect to GSP’s 2016 financial statements included a disclaimer, our company’s loss of significant influence over GSP, and GSP’s limited
management as the entity is in insolvency proceedings.
We believe that the information presented by separate financial statements of GSP would not provide to our company’s investors additional
material information not already included in our company’s own consolidated financial statements included in this annual report. As a result, we do not
believe that the omission of those financial statements will have a material impact on a reader’s understanding of our financial condition or results of
operations. Nevertheless, we requested a waiver from the SEC from the requirement to file the consolidated financial statements of GSP described
above, and the SEC has not granted our waiver request.
16
As a result, we are currently not fully compliant with our reporting requirements with the U.S. Securities Exchange Act of 1934 (the
“Exchange Act”). The SEC may impose penalties or otherwise take action against our company. In addition, the SEC may not declare effective any
registration statement that we file that requires the financial statements under Rule 3-09 to be included. If, as a result, we are unable to complete a
registered offering, our ability to access the public capital markets in the United States would be impaired. Furthermore, the Rule 144 safe harbor for
certain sales of our ADSs in the United States is currently unavailable.
There is substantial uncertainty with regard to the amount, timing and manner in which the payment for the termination of the GSP gas pipeline
concession will be paid
There is substantial uncertainty with regards to the payment contemplated under the GSP gas pipeline concession contract as a result of the
termination of the gas pipeline concession, including with respect to the amount, timing and manner in which the payment will be made or if it will be
made at all.
Although the concession contract provides that payment must be made within one year of termination, the Peruvian Ministry of Energy and
Mines has not made payment or, to our knowledge, initiated the payment process or the auction process for a new concessionaire. As a result, we expect
to assert our rights against the Peruvian government by filing arbitration proceedings in May 2019, after the six-month period mandated by the
concession contract for the parties to discuss the matter. This will place us in an adversarial position with the Peruvian government. We cannot assure
you that this or any other claims that we pursue in connection with the termination of the gas pipeline concession will ultimately prevail in a timely
manner, or at all.
In 2016, in connection with efforts to restructure or sell Odebrecht’s participation in GSP, due to the corruption scandal surrounding
Odebrecht, Odebrecht contractually agreed to subordinate its claims under the concession to other GSP shareholders, Enagás and ourselves. In
January 2018, we received a notification that Odebrecht commenced arbitration proceedings against us and Enagás, seeking to invalidate the contractual
subordination. While we believe that the subordination arrangement with respect to Odebrecht’s claims in connection with the anticipated payment is
enforceable, we cannot assure you that our position will prevail.
In addition, we have made certain estimates in our consolidated financial statements with respect to the expected payment for the
termination of the GSP contract. In particular, after taking into account the S/.593.1 million impairment we recognized to our investment in GSP during
2016, we continued to record S/.218.3 million in connection with our investment in GSP as of December 31, 2016, 2017 and 2018. If our assumptions
and estimates are incorrect, our actual results could differ significantly from those reflected in our consolidated financial statements. Failure to receive
the expected payment on a timely basis, or at all, would have a material adverse effect on our business, financial condition and results of operations.
We are in default under one of our debt instruments for which we have obtained waivers, and historically we have been in default on other of our
debt instruments, and we cannot assure you that we will be able to obtain additional waivers in the event of the existing default or future defaults
We are currently in default under one of our debt instruments and we cannot assure you that we will be able to obtain a waiver. In addition,
in the past we were in default under certain of our debt instruments and procured waivers from our creditors under such instruments. We cannot assure
you that we will not breach the covenants under these or other of our debt instruments in the future and, in such event, that we would be able to obtain
the required waivers from our creditors. Failure to successfully obtain waivers could force us to precipitate the sale of assets, including on unfavorable
terms, to repay these debt instruments. Moreover, if we are not able to renegotiate the terms of these debt instruments or repay them promptly, our
ability to obtain financings, including performance guarantees or similar financings required under many of our business contracts, would be impaired,
which may have a material adverse effect on our business, financial condition and results of operations.
We may not be able to sell assets on favorable terms or at all
As part of our strategic action plan, our board of directors has approved the sale of certain non-strategic assets, in order to raise funds to
make payments in respect of debt related to the termination of the GSP gas pipeline concession. In accordance with this plan, we have undertaken
several divestitures. However, we cannot assure you that we will be able to continue to sell assets on favorable terms or at all. If we are not able to sell
assets on a timely basis, our ability to address our liquidity needs could be adversely affected and we may breach our payment obligations under our
debt related to the termination of the GSP gas pipeline concession.
Conversely, if we sell significant assets, our business and results of operations will be diminished.
17

A class action civil lawsuit in the United States may adversely affect our company
A securities class action civil lawsuit has been filed against our company and certain of our former directors and former and current
executive officers in the United States. The suit is in early stages, and we cannot assure you that our position will prevail. If our position does not
prevail, the case may have substantial adverse effects on our business, financial condition and results of operations.
We may be unable to access credit that we need to operate our business
Due to uncertainty relating to the investigations of our company, our creditors and other banks operating in the Peruvian market have placed
restrictions on our ability, and the ability of other construction companies, to acquire future credit lines or other financings. This may affect our ability to
obtain financing for new or existing projects on favorable terms or at all, and also may render us unable to compete for or win new projects.
be unavailable for a certain period of time, which may make it harder to effect such sales.
Risks Related to Our Company
Global economic conditions could adversely affect our financial performance
The global financial crisis and ensuing global recession in 2008 and 2009 had a significant adverse effect on the development of large-scale
infrastructure and real estate projects worldwide. Subsequently, global economic conditions, including slower growth in China, declines in global
commodity, in particular oil and gas prices, the appreciation of the U.S. dollar against foreign currencies, the withdrawal of investments from emerging
markets and continued concerns about the U.S. and European economies, generated economic uncertainty which affected private- and public-sector
investments. The United Kingdom voted to exit the European Union on June 23, 2016. As of the date hereof, the actions to be taken by the United
Kingdom to effectively exit the European Union and the duration of this process are uncertain. The results of the referendum in the United Kingdom
have caused, and are expected to continue to cause, volatility in financial markets, which in turn could have substantial adverse effects on our business,
financial condition and results of operations. On November 8, 2016, Mr. Donald J. Trump was elected president of the United States. President Trump
has implemented greater restrictions on free trade and limitations on immigration. Changes in social, political, regulatory and economic conditions in the
United States or in laws and policies governing foreign trade could create uncertainty in the international markets and could have a negative impact on
emerging market economies, including the Peruvian economy, which in turn could have a negative impact on our operations. Future global economic
conditions, in particular fluctuations in commodity prices and financings costs, may impact our clients’ investment decisions. Should our clients choose
to postpone or suspend new investments or delay or cancel the execution of existing projects as a result of global economic conditions, demand for our
products and services, including our backlog, would decline, which may result in a decline in revenues and in under-utilization of our capacity. In
addition, our business may be impacted by adverse economic developments even after economic conditions have improved because of the lag time
between when investments decisions are made and when the projects are executed. Furthermore, financial difficulties suffered by our clients, joint
operation partners, subcontractors or suppliers due to global economic conditions could result in payment delays or defaults, or increase our costs or
adversely impact our project execution. Accordingly, a global economic downturn could have a material adverse effect on our financial performance.
We face significant competition in each of our markets
Each of the markets in which we operate is competitive. We compete on the basis of, among other factors, price, performance, product and
service quality, skill and execution capability, client relations, reputation and brand, and health, safety and environmental record. We face significant
competition from both local and international players. Some of these competitors may have greater resources than us or specialized expertise in certain
sectors. In addition, a portion of our business is derived from open bidding processes which can be highly competitive. Certain of our markets are highly
fragmented with a large number of companies competing for market share. Our competitors may be more inclined to take greater or unusual risks or
accept terms and conditions in a contract that we might not deem acceptable. Moreover, we cannot assure you that we will not face new competition
from industry players entering or expanding their operations in our markets. If we are unable to compete effectively, our ability to continue to grow our
business or maintain our market share would be affected. In addition, because one of the factors on which we generally compete is price, increased
competition could impact our operating margins. Accordingly, our business and financial performance could be adversely affected by competition in our
markets.
18

A major change in Peruvian government policies could affect our business
Our business is significantly affected by national, regional and municipal government policies and regulations, including with respect to
infrastructure concessions or similar contracts to the private sector, public spending in infrastructure investment and government housing subsidies,
among others. Any adverse change in government policies with respect to these matters could result in a material adverse effect on our business and
financial performance.
Social conflicts may disrupt infrastructure projects
Despite Peru’s ongoing economic growth and stabilization, high levels of poverty and unemployment and social and political tensions
continue to be pervasive problems in the country. Peru has, from time to time, experienced social and political turmoil, including riots, nationwide
protests, strikes and street demonstrations. In recent years, certain regions experienced strikes and protests related mainly to the environmental impact of
mining activities, which resulted in commercial disruptions, including in the departments of Cajamarca and Arequipa. These protests may lead to the
suspension of mining projects. Social conflicts may disrupt, delay or suspend infrastructure projects in the future, which could have a material adverse
effect on our business and financial performance.
New projects may require the prior approval of local indigenous communities
In September 2011, Peru enacted Law No. 29,785, regarding the Prior Consultation Right of Local Indigenous Communities, in accordance
with the International Labor Organization Convention No. 169 (Ley del Derecho a la Consulta Previa a los Pueblos Indígenas y Originarios,
Reconocido en el Convenio 169 de la Organización Internacional del Trabajo). This law establishes a prior non-binding consultation procedure
(procedimiento de consulta previa) that the Peruvian government must carry out with local indigenous communities, whose rights may be directly
affected by new legislative or administrative measures, including the granting of certain permits or new concessions or similar contracts, such as for
mining, energy and oil and gas projects. Local indigenous communities do not have a veto right; and therefore, upon completion of this prior
consultation procedure, the Peruvian government retains the discretion to approve or reject the applicable legislative or administrative measure.
However, we cannot assure you that these consultation procedures will not negatively influence a decision by Peruvian government to grant us a permit,
concession or consent and, therefore, adversely affect new projects and concessions. Accordingly, our business and financial performance may be
materially and adversely affected.
Our backlog and our ratio of historical backlog to revenues may not be reliable indicators of future revenues or profit
Our backlog amount is subject to revision over time and our ability to realize revenues from our backlog is subject to a number of
uncertainties. Cancellations, scope adjustments or deferrals may occur, from time to time, with respect to contracts reflected in our backlog and could
reduce the amount of our backlog and the revenue and profits that we actually earn. For example, the termination of the GSP gas pipeline concession on
January 24, 2017 reduced our backlog as of December 31, 2016 by US$855 million, 30.2% of our E&C backlog and 21.4% of our total backlog as of
that date. Contracts may also remain in our backlog for an extended period of time and poor performance could also impact our profit from the contracts
in our backlog. In addition, our backlog is expressed in U.S. dollars based on period-end exchange rates while a significant portion of our contracts are
payable in soles or other local currencies. As a result, any depreciation of local currency would diminish the amount of revenues eventually earned
relative to backlog. For more information, see “Item 5.A. Operating and Financial Review and Prospects—Operating Results—Recent Developments.”
The amount of our backlog is not necessarily indicative of future revenues or profits related to the performance of the related contracts.
Our backlog may decline further. We cannot assure you that we will be able to obtain sufficient contracts in the future in number and
magnitude to increase our backlog. Additionally, the amount of new contracts that we obtain can fluctuate significantly from period to period due to
factors that are beyond our control.
The ratio of our historical backlog to revenues earned in subsequent years is volatile and substantially affected by a number of factors, some
of which are outside our control, including levels of contract scope adjustments and our ability to enter into new contracts (which are substantially
influenced by general macroeconomic conditions), delays and cancellations, foreign exchange rate movements and our ability to increase the scale of
our operations to expand the amount of work we carry out beyond that previously contracted. Accordingly, historical correlations between backlog and
revenues may not recur in future periods.
Our success depends on key personnel
Our success depends, to a significant degree, upon the services of our senior management, board of directors and other key personnel.
Members of our management team are not subject to long-term employment agreements or non-competition agreements with us. We cannot assure you
that we will be successful in retaining our current senior management or members of our board of directors, nor can we assure you that, in such event,
we would be able to find suitable replacements. In addition, the success of our business depends on our ongoing ability to attract, train and retain
qualified engineers and other personnel. In recent years, the availability in Peru of qualified personnel who have the necessary expertise and experience
has been lower than demand and, therefore, competition for human resources has become intense. We cannot assure that we will be able to hire and
retain the number of qualified personnel required to meet the needs of, or to grow, our business. If we are unable to attract, train and retain the qualified
personnel that we require at reasonable cost, our business and financial performance could be adversely affected.
19
Our success depends, to a large extent, on our reputation for the quality, reliability, timely delivery and safety of our products and services
We believe our track record and reputation are key factors in our clients’ evaluation of whether to engage our services and purchase our
products, encouraging key industry players to partner with us, and recruiting and retaining talented personnel to our company. Our reputation is based,
to a large extent, on the quality, reliability, timeliness and safety of our products and services. If our products do not meet expected standards or we fail
to meet our deadlines, our relationship with our clients and partners could suffer, the reputation of our company could be adversely affected, we may not
be invited to new bidding processes and our ability to capture new business could be severely diminished.
The nature of our business exposes us to potential liability claims and contract disputes
We may be subject to a variety of legal or administrative proceedings, liability claims or contract disputes. The government, clients and
other third parties may present claims against us for injury or damage caused, directly or indirectly, by our operations, for example for alleged failures in
our engineering and construction, the operation of our infrastructure concessions (such as our toll roads or the Lima Metro), and real estate
developments we sell. Although we have a range of insurance coverage policies and have adopted risk management and risk avoidance programs
designed to reduce potential liabilities, a catastrophic event resulting from the services we have performed or products we have provided could result in
significant professional or product liability, warranty or other claims against us as well as reputational harm, especially if public safety is impacted. We
may in the future be named as a defendant in legal proceedings where our clients or third parties may make a claim for damages or other remedies with
respect to our projects or other matters. Any liability not covered by our insurance, or in excess of our insurance limits, could result in a significant loss
for us, which may affect our financial performance.
We are susceptible to operational risks that could affect our business and financial performance
Our business is subject to numerous industry-specific operational risks, including natural disasters, adverse weather conditions, operator
error or other accidents, mechanical and technical failures, explosions and other events and accidents, many of which are beyond our control. Such
occurrences could result in injury or loss of life, severe damage to and destruction of property and equipment, business interruption, pollution and other
environmental damage, clean-up responsibilities, regulatory requirements, investigations and penalties, potential liability claims and contractual
disputes. In addition, such occurrences could materially impact our reputation. Although we maintain comprehensive insurance covering our assets and
operations at levels that our management believes to be adequate, our insurance coverage will not be sufficient in all circumstances or to protect against
all hazards. The occurrence of such an operational risk could have a material adverse effect on our business and financial performance.
Deterioration in our safety record could adversely affect our business and financial performance
Our ability to retain existing clients and attract new business is dependent on our ability to safely operate our business. Existing and
potential clients consider the safety record of their services providers to be of high importance in their decision to award service contracts. Some of our
activities, in particular in our E&C segment, can be high risk by their nature. If one or more accidents were to occur at a site, the affected client may
terminate or cancel our contract and may be less likely to continue to use our services. Although our track record on safety matters is consistent with
industry standards, we cannot assure you that we will not experience accidents in the future, causing our safety record to deteriorate. Accidents may be
more likely as we continue to grow, particularly if we are required to hire less experienced employees due to shortages of skilled labor. Moreover, often
times we do not perform these activities by ourselves and accidents can happen due to errors committed by partners and subcontractors over whom we
have no control. Because many of our clients require us to report our safety metrics to them as part of the bidding process and because a substantial part
of our client base is comprised of major companies with high safety standards, a general deterioration in our safety record could have a material adverse
impact on our business including our ability to bid for new contracts.
Any safety incidents or deterioration in our safety record could adversely impact our ability to attract and retain qualified employees. In
addition, we could also be subject to liability for damages as a result of accidents and could incur penalties or fines for violations of applicable safety
laws and regulations.
20

Increases in the prices of energy, raw materials, equipment or wages could increase our operating costs
Our business requires significant purchases of energy, raw materials and components, including, among others, large quantities of fuel,
cement and steel, as well as purchases or leases of equipment. Certain inputs used in our operations are susceptible to significant fluctuations in prices,
over which we may have little control. The prices of some of these inputs are affected to a significant extent by the prices of commodities, such as oil
and iron. Global oil prices increased in 2016 and 2017 and they decreased in 2018, and we cannot assure you that oil prices will not increase in the
future (although increased oil prices would benefit revenues in our Energy line of business). Substantial increases in the prices of such commodities
generally result in increases in our suppliers’ operating costs and, consequently, lead to increases in the prices they charge for their products. Moreover,
we do not have long-term contracts for the supply of our key inputs, and, as a result, if prices increase significantly or if we are required to find
alternative suppliers, our costs to procure these inputs may increase significantly. In addition, growing demand for labor, especially when coupled with
shortages of qualified employees in the countries where we operate, may result in significant wage inflation. To the extent that we are unable to pass
along to our clients increases in the prices of our key inputs or increases in the wages that we must pay, our operating margins could be materially
adversely impacted.
We may not be able to obtain financing on favorable terms
Our ability to undertake large investments (particularly in our Infrastructure and Real Estate segments) or consummate significant
acquisitions will depend on the availability of equity and debt financing. We cannot assure you that we will be able to obtain new financings in the
future on favorable terms or at all. Our ability to obtain financings will depend in part upon prevailing conditions in credit and capital markets, which
are beyond our control. In 2008 and 2009, global markets suffered turmoil, which significantly constrained the availability of new financings. In
addition, our ability to obtain new financing, or refinance existing debt, may at certain times be adversely affected by the cyclicality of our business,
particularly our E&C segment, as has occurred in the past. Furthermore, in response to the ensuing global economic recession in 2009, many countries,
in particular the United States as well as the countries where we operate, have maintained target interest rates at very low levels. However, more
recently, the U.S. Federal Reserve has begun to increase target interest rates in the United States. Emerging markets have been affected by this change in
the U.S. monetary policy, resulting in a withdrawal of investments and increased volatility in the value of their currencies. If interest rates rise
significantly in the United States, emerging market economies, including Peru, could find it more difficult and expensive to borrow capital and refinance
existing debt. Higher interest rates globally or in Peru would in turn impact our costs of funding. If adequate funds are not available, or are not available
on favorable terms, we may not be able to make future investments or pursue acquisitions or other opportunities.
We may not be able to recover on claims against clients for payment
If a client fails to pay our invoices on time or defaults in making its payments to us, we could incur significant losses. We occasionally bring
claims against clients for delayed payments, additional costs that exceed the contract price or for amounts not included in the original contract price,
including change orders. These types of claims can occur due to matters such as owner-caused delays or changes from the initial project scope, and,
occasionally, they can be the subject of lengthy proceedings. When these types of events occur and unresolved claims are pending, we may invest
significant working capital in projects to cover cost overruns pending the resolution of the relevant claims. Moreover, we have recently encountered
difficulties collecting on claims, even following successful arbitration awards, particularly against the government. A failure to promptly recover on
these types of claims and change orders could have a material adverse effect on our financial performance.
If we are unable to enter into consortia or other strategic alliances, our ability to compete for new business may be adversely affected
We may join with other companies to form joint operations or other strategic alliances to compete for a specific concession or contract,
including with partners that contribute expertise in a specific field. Because a consortium or alliance can often offer stronger combined qualifications
than a company on a stand-alone basis, these arrangements can be important to the success of a particular bid. If we are unable to enter into consortia or
other strategic alliances, our ability to compete for new business may be adversely affected.
Our consortia and other strategic alliances may be affected by disputes with, or the unsatisfactory performance by, our partners
Although we have a thorough partner selection process, consortia and other strategic alliances that we enter into as part of our business,
including arrangements where operating control may be shared with unaffiliated third parties, may involve risks not otherwise present when we operate
independently, including: sharing approval rights over major decisions; responsibility for our partners’ unpaid obligations or liabilities; ensuring ethical
and compliance behavior; and inconsistencies in our and our partners’ economic or business interests or goals. Any disputes between us and our partners
may result in delays, litigation or operational impasses. We may also incur liabilities as a result of action taken by our partners. In addition, if we
participate in consortia or other strategic alliances where we are not the controlling party, we may have limited control over operational, financial and
other management decisions and actions and the success of the consortium or other strategic alliance will depend largely on the performance of our
partners. These risks could adversely affect our ability to transact the business that is the object of such consortium or other strategic alliance, and could
result in the termination of the applicable concession or contract. Under these circumstances, we may be required to make additional investments and
provide additional services to ensure adequate performance and delivery. These additional obligations could result in reduced profits or, in some cases,
increased liabilities or significant losses for us. In addition, failure by a partner to comply with applicable laws or regulations could negatively impact
our business and, in the case of government contracts, could result in fines, suspension or even debarment from participating in bidding processes. As a
result, our business and financial performance could be adversely affected by disputes involving our consortia or other strategic alliances.
21

We are dependent upon third parties to complete many of our contractual obligations
We rely on third-party suppliers to provide a significant amount of the materials and equipment used in our businesses. A portion of the
work performed under our infrastructure concessions and, to a lesser extent, other contracts is performed by third-party subcontractors. As a result, the
timely completion and quality of our projects may depend on factors beyond our control, including the quality and timeliness of the delivery of materials
supplied for use in the project and the technical skills of subcontractors hired for the project. If we are unable to find qualified suppliers or hire qualified
subcontractors, our ability to meet our contractual obligations could be impaired. In addition, if the amount we are required to pay for supplies,
equipment or subcontractors exceeds what we have estimated, we may suffer losses under our contract. If a supplier or a subcontractor fails to provide
supplies, equipment or services as required under a negotiated arrangement for any reason, or provides supplies, equipment or services that are not of an
acceptable quality, we may be required to source those supplies, equipment or services on a delayed basis or at a higher price than anticipated, which
could impact our financial performance. In addition, faulty materials or equipment could result in claims against us for failure to meet contractual
specifications, and failure by suppliers or subcontractors to comply with applicable laws and regulations could negatively impact our reputation and our
business and, in the case of government contracts, could result in fines, suspension or even debarment from participating in bidding processes. These
risks may be intensified during economic downturns if these suppliers or subcontractors experience financial difficulties. As a result, our business and
financial performance may be adversely affected by our dependence on third-party providers.
Debarment from participating in government bidding processes would have a material adverse effect on our business and financial performance
We or one of our subsidiaries would face debarment from participating in government bidding processes for one to three years if, including
potentially as a result of the ongoing investigations against our company and GyM, we or they were found to have violated certain provisions of the
Peruvian State Contracting Law (Ley de Contrataciones del Estado). We and our subsidiaries are required to comply with a large number of contractual
obligations with the government in our business, and we cannot assure you that we will be in full compliance at all times. Moreover, the imposition of a
debarment on a subsidiary could affect the ability of our company or our other subsidiaries (not just the subsidiary that was debarred), to participate in
government bids under the Peruvian State Contracting Law. Approximately 11.6% of our 2018 revenues came from public-sector contracts in Peru. As
of December 31, 2018, 6.5% of our backlog is comprised of contracts with the public sector. As a result, if we are debarred from participating in
government bidding processes, our business and financial performance would be materially and affected.
Failure to comply with, or changes in, laws or regulations could have a material adverse effect on our business and financial performance
We operate in highly regulated industries. Our business and financial performance depends on our and our clients’ ability to comply on a
timely and efficient basis with extensive national, regional and municipal laws and regulations relating to, among other matters, environmental, health
and safety, building and zoning, labor, tax and other matters. The cost of complying with these laws and regulations can be substantial. In addition,
compliance with these laws and regulations can cause scheduling delays. Although we believe we are in compliance with all applicable concessions,
other similar contracts, laws and regulations in all material respects, we cannot assure you we have been or will be at all times in full compliance.
Failure by us or our clients to comply with our concessions, similar contracts or these laws and regulations could result in a range of adverse
consequences for our business, including subjecting us to significant fines, civil liabilities and criminal sanctions, requiring us to comply with costly
restorative orders, the shutdown of operations, and revocation of permits and termination of concessions or similar contracts. In addition, we cannot
assure you that future changes to existing laws and regulations, or stricter interpretation or enforcement of existing laws and regulations, will not impair
our ability to comply with such laws and regulations or increase our compliance costs.
We may be held liable for environmental damage caused by our operations
The nature of certain of our operations requires us to assume risks of causing environmental and other damages. We may be held liable for
the environmental damage we cause, including the incidental consequences of human exposure to hazardous substances or other environmental damage.
We may be subject to clean up costs or penalties in the event of certain discharges into the environment and/or environmental contamination and
damage. Our environmental liability insurance may not be sufficient or may not apply to certain types of environmental damage. Any substantial
liability for environmental damage could have a material adverse effect on our financial performance.
22

New environmental regulation as a result of climate change could impact our business and financial performance
Growing concerns about climate change could result in the imposition of additional or more stringent environmental requirements or
regulations. For example, there are ongoing international efforts to address greenhouse emissions, such as the Kyoto Protocol or the more recent Paris
Agreement, which are in various stages of negotiation and implementation. If more stringent environmental regulation is adopted in the countries where
we operate, we may be obliged to incur higher expenditures than anticipated, adversely affecting our financial performance. In addition, future
remediation requirements in the event that we are found responsible for environmental damage may be substantial and could impact our financial
condition. Moreover, more stringent environmental regulation could increase the costs of projects for our clients or, in some cases, prevent a project
from going forward, thereby potentially reducing the demand for our services. Accordingly, new environmental regulation could have a material adverse
effect on our business and financial performance.
We may not be able to effectively protect ourselves against financial market risks
Our operations are exposed to financial market risks, such as risks related to exchange rates, commodity prices and interest rates.
Fluctuations in currency, commodity prices or interest rates could adversely affect our financial performance. We cannot assure you that derivative
financial instruments will protect us from the adverse effects of financial market risks. While hedging transactions are intended to reduce market risks,
such transactions may expose us to other risks, such as counterparty risk. We may not be able to adequately protect ourselves against financial market
risks and may not ultimately achieve an economic benefit from our hedging strategy.
The loss of a key client in some of our lines of business may affect our business and financial performance
In some of our lines of business, such as our Infrastructure segment, a substantial amount of the revenue we receive is concentrated among a
limited number of clients, including the Peruvian government. If one or more of these major clients fail or delay in paying our fees, or if there is a
significant reduction or cancellation of business by one or more of these major clients, our business and financial performance may be adversely
affected. If we are not able to capture new clients to replace the loss of business from existing key clients, our financial performance may be adversely
affected.
Our use of the percentage-of-completion method of accounting for our Engineering and Construction segment could result in a reduction of
previously recorded profits
In accordance with IFRS, we measure and recognize a large portion of our revenues under the percentage-of-completion accounting
methodology. This methodology allows us to recognize revenues ratably over the life of a contract, without regard to the timing of receipt of cash
payments, by comparing the amount of the costs incurred to date against the total amount of costs expected to be incurred. The effect of revisions to
estimated costs, and thus revenues, is recorded when the amounts are known and can be reasonably estimated. These revisions can occur at any time and
could be material. On a historical basis, we believe that we have made reasonably reliable estimates of the progress towards completion on our long-
term contracts. However, given the uncertainties associated with these types of contracts and inherent in the nature of some of the industries in which we
operate, it is possible for actual costs to vary from estimates previously made, which may result in reductions or reversals of previously recorded profits.
Labor unrest could adversely affect our financial performance
All of our manual laborers and a portion of our employees are members of labor unions. Our practice is generally to extend benefits we
offer our unionized employees to non-unionized employees. In our E&C segment, collective bargaining agreements are negotiated at two levels, on an
annual basis between the Peruvian National Federation of Civil Construction and the Peruvian Chamber of Construction, without our direct
involvement, and on a per project basis directly between the unions and us in accordance with such annual agreement. We also have collective
agreements with our employees in certain of our business segments, which are also negotiated periodically. Although we consider that our relationship
with unions is currently positive, we cannot assure you that we will not experience work slowdowns, work stoppages, strikes or other labor disputes in
the future, which could result in the interruption or delay of our operations. Such interruptions or delays could have an adverse impact on our business,
including on the cost of our projects and our ability to make timely delivery. Moreover, our operations may also be affected by labor unrest in our
clients’ or our partners’ workforce.
The proceeds from our insurance policies may not be sufficient and we may not be insured against all risks
We maintain insurance coverage both as a corporate risk management strategy and in order to satisfy the requirements under certain
regulations and contracts. We cannot assure you that proceeds from our insurance policies, however, will be sufficient to cover the damages resulting
from any event covered by such policies. Certain risks are not covered under the terms of our insurance policies,
23

such as interruption of operations. In such event, we may incur significant expenses to rebuild our facilities, repair or replace our equipment, or cover
other damages. In addition, if any of our third-party insurers fail, abruptly cancel our coverage or otherwise cannot satisfy their insurance requirements
to us, then our overall risk exposure and operational expenses could be increased. Moreover, we may not be able to renew our insurance policies on
favorable terms, or at all. Although in the past we have been generally able to cover our insurance needs, we cannot assure you that we will be able to
secure all necessary insurance in the future.
An increase in import duties and controls, or other restrictions on our obtaining instruments and equipment, may have a material adverse effect on
our financial performance
Our future success depends in part on our ability to select and purchase high quality mechanical instruments and equipment at attractive
prices. While we have historically been able to do so, such instruments and equipment may become subject to higher import taxes than currently apply.
We cannot assure you that there will not be further increases in import taxes, changes in laws related to imports or the imposition of quotas by countries
from which we import mechanical instruments and equipment, any of which could have a material adverse effect on our business. Furthermore, our
ability to pay our instrument or equipment suppliers could be affected by our failure to obtain, on a timely basis, authorization from the Ministry of
Justice pursuant to Law 30,737 to make such payments. Such restrictions may limit our ability to purchase necessary instruments and equipment.
The government may declare the nullity of public bidding processes after we have been awarded a project or concession
Even if we win the public bidding for a project or concession, the government may subsequently declare the process void for political,
budgetary or other reasons and may cancel or terminate the project or concession awarded to us. For example, in June 2014, we were determined the
winner of a public bidding for a concession to operate the fare collection system of Lima’s integrated transportation system for a period of 16 years.
However, in January 2015, the Municipality of Lima notified us that the board of directors of the Instituto Metropolitano Protransporte de Lima –
Protransporte had declared the nullity of the public bidding process, based on a report issued by the Peruvian Ministry of Economy and Finance, which
concluded that the Ministry should have pronounced itself with respect to the concession prior to the bidding process instead of afterwards. We initiated
a judicial proceeding in July 2015 to challenge such declaration of nullity, which proceedings remain ongoing. If upheld by the courts, the declaration of
nullity of projects or concessions awarded to us could affect our future results of operations. Moreover, the uncertainty that results from these type of
decisions may adversely impact investor confidence in Peru and our business.
We may not be able to successfully expand outside of Peru
One of our long term strategies has been to continue to expand our operations outside of Peru, particularly in Chile and Colombia, and we
expect that our international operations could become a more significant part of our consolidated business in future. We cannot assure you that we will
be able to replicate our success in Peru in other countries. Our international expansion is subject to additional challenges, including: our ability to
assimilate cultural differences and practices; our limited familiarity with local laws, regulators and contractors; our ability to attract and manage foreign
personnel; the absence of a local workforce formed in our corporate values and familiar with our operations; competition in foreign markets, including
from industry players with significantly greater local experience and reputation; and other risks specific to these countries. Moreover, we may not be
able to make equity investments when needed by our foreign operations, due to restrictions imposed by Law 30,737 in our ability to transfer funds
abroad. Section II of Law 30,737, promulgated in March 2018, imposes certain restrictions on companies, such as our company, that have been partners
of groups that have been, or whose officers or representatives have been, convicted of, or have admitted to, corruption, money-laundering or similar
crimes. Among other things, the law requires that these companies submit money transfers abroad to the Peruvian Ministry of Justice for pre-approval,
and we cannot assure you that any such approvals will be granted in a timely manner or at all.
Many countries in Latin America have suffered significant economic, political and social crises in the past, and these events may occur
again in the future. If we are unable to overcome these challenges, we may not be able to successfully expand internationally.
We may not be able to make successful acquisitions
Part of our long-term strategy has been to evaluate strategic acquisition opportunities to expand our operations and geographic footprint,
especially in Chile and Colombia. We may not be able to identify appropriate acquisition opportunities, or, if we do, we may overpay for these
acquisitions or may not otherwise be able to negotiate terms and conditions that are acceptable to us. We may also face difficulties obtaining financing
to pay for acquisitions. Law 30,737 currently requires that payments we make abroad be submitted to the Peruvian Ministry of Justice for pre-approval,
and we cannot assure you that any such approvals will be granted in a timely manner or at all. In addition, we may not be able to obtain regulatory
approvals, including antitrust approvals, required to consummate acquisitions. Furthermore, even if we are able to successfully consummate an
acquisition, we may encounter challenges in integrating the acquired business effectively and profitably into our operations. The integration of an
acquisition involves a number of factors that may affect our operations, including diversion of management’s attention, difficulties in retaining
personnel and entry into unfamiliar
24

markets. Acquired businesses may not achieve the levels of productivity anticipated or otherwise perform as expected. Acquisitions may bring us into
businesses we have not previously conducted and expose us to additional business risks that are different from those we have traditionally experienced,
including new geographic, market, operating and financial risks. Moreover, acquisitions involve special risks, including the potential assumption of
unanticipated liabilities and contingencies. Even if such liabilities are assumed by the sellers, we may have difficulties enforcing our rights, contractual
or otherwise. We cannot assure you that future acquisitions will meet our strategic objectives.
Our IT security measures may be breached or compromised and we may sustain system outages
We rely on encryption, authentication technology and firewalls to provide security for confidential information, including personal data,
transmitted to and by us over the internet. A breach of our network security measures could result in the misappropriation of proprietary or personal
information or cause interruptions in our IT services or operations, could damage our reputation and harm our ability to deliver services to our clients.
This may result in client dissatisfaction and a loss of business. Our security measures may be inadequate to prevent security breaches, and we may be
required to expand significant capital and other resources to protect against the threat of security breaches and to alleviate problems caused by breaches
as well as by any unplanned unavailability of our IT systems caused by other reasons, which may adversely affect our business and financial
performance.
Our services may infringe upon the intellectual property rights of others
Our IT services, or third-party products we offer our clients, may infringe the intellectual property rights of third parties, and we may have
infringement claims asserted against us. These claims may harm our reputation, increase our costs and prevent us from offering certain services or
products. Any claims or litigation relating to intellectual property, even if ultimately decided in our favor, could be time-consuming and costly, injure
our reputation or require us to enter into royalty or licensing arrangements. Any limitation on our ability to provide a service or product could result in
our loss of revenue-generating opportunities and require us to incur additional expenses to develop new or modified solutions for future projects, which
may adversely affect our business and financial performance.
Additional Risks Related to our Engineering and Construction Business
We are vulnerable to the cyclical nature of the end-markets we serve
Demand for our engineering and construction services is dependent on conditions in the end-markets we serve, which include, among
others, the mining, power, oil and gas, transportation, real estate and other infrastructure sectors in Peru, as well as the mining sector in Chile and the
energy sector in Colombia. Consequently, our engineering and construction business is closely linked to the performance and growth of these sectors,
and it is exposed to many of the risks faced by our clients operating in these sectors, over which we have no control. These industries tend to be cyclical
in nature and, as a result, although downturns can impact our entire company, our engineering and construction business has historically been subject to
periods of very high and low demand. For example, between 2000 and 2003, there was a significant decline in activity in the Peruvian real estate and
construction sectors, which consequently affected our and our competitors’ business and financial performance during that time. Factors that can affect
these sectors include, among others, macroeconomic conditions, climate conditions, the level of private and public investment, the availability of credit,
changes in laws and regulations, and political and social stability. The mining and oil and gas sectors, in particular, are also driven by worldwide
demand for the underlying commodities, including, among others, silver, gold, copper, oil and gas, which can be affected by such other factors as global
economic conditions and geopolitical affairs. A decline in prices for minerals, oil and gas has had in the past, and could have in the future, a significant
impact on our clients’ exploration and production activities and, as a result, on their demand for our engineering and construction services. Accordingly,
continuing adverse developments in the end-markets served by our engineering and construction business could have a material adverse effect on our
financial performance.
Decreases in capital investments by our clients may adversely affect the demand for our services
Our engineering and construction business is directly affected by changes in private-sector and, to a lesser extent, public-sector investments
for large-scale infrastructure projects. In addition, our engineering and construction business is directly affected by the availability and cost of
financings for these projects. In the markets where we operate, investments and financings for large-scale projects have historically been influenced by
macroeconomic and other factors which are beyond our control, including in the case of public-sector investment, government spending levels. As a
result, we cannot assure you that clients will not choose to limit or not undertake new projects or delay, suspend or cancel existing projects. Further
reductions in anticipated capital investments or available financing for large-scale projects could have a material adverse effect on our financial
performance. Public and private investment in our markets slowed significantly during 2016, 2017 and 2018 as a result of market conditions. In the case
of Peru, public and private investment slowed significantly during 2016 and 2017, as a result of corruption investigations and political uncertainty. In
2018, Peru experienced a growth rate of 5.20% in private and public investment, but we cannot assure you that such growth will continue in subsequent
years.
25
Our revenues may fluctuate based on project cycles, which we may not control
The substantial majority of the revenues from our engineering and construction business is generated from project awards, the timing of
which may be unpredictable and outside of our control, especially considering the highly competitive bidding processes and complex and lengthy
negotiations they involve. These processes can be impacted by a wide variety of outside factors including governmental approvals, financing
contingencies and overall market and economic conditions. Moreover, because a significant portion of our revenues is generated from large-scale
projects, our results of operations can fluctuate quarterly or yearly depending on whether and when project awards occur and the commencement and
progress of work under awarded contracts. As a result, we are subject to the risk that revenues may not be derived from awarded projects as quickly as
anticipated.
Our business may be adversely affected if we incorrectly estimate the costs of our projects
We conduct our engineering and construction business under various types of contractual arrangements where costs are estimated in
advance. In some of our contracts (i.e., lump-sum, unit price and EPC), we bear the risk of some or all unanticipated cost overruns, including due to
inflation or certain unforeseen events. Risks under contracts which could result in cost overruns include: difficulties in performance of our
subcontractors, suppliers, or other third parties; changes in laws and regulations or difficulties in obtaining permits or other approvals; unanticipated
technical problems; unforeseen increases in the cost of inputs, components, equipment, labor, or the inability to obtain these on a timely basis; delays
caused by weather conditions; incorrect assumptions related to productivity or scheduling estimates; and project modifications that create unanticipated
costs or delays. These risks tend to be exacerbated for longer term contracts since there is increased risk that the circumstances under which we based
our original bid could change. In many of our contracts, we may not be able to obtain compensation for additional work performed or expenses incurred.
Our failure to estimate accurately the resources and time required to complete a project could adversely affect our profitability. Even under our cost-plus
contracts, our inability to complete projects within the estimated budget could affect our relationship with our clients and negatively impact awards of
future contracts. As a result, if we incorrectly estimate the costs of our projects, our business and financial performance could be adversely affected.
We may be unable to deliver our services in a timely manner
The success of our engineering and construction business depends on our ability to meet the standards and schedules required by our clients.
Significant delays that prevent us from providing our services on agreed time frames could adversely affect our client relations and reputation. Delays
may occur for a number of reasons, including: our inability to adequately foresee the needs of our clients; delays caused by our joint operation partners,
subcontractors or suppliers; insufficient production capacity; equipment failure; shortage of qualified workers; changes to customs regulations; and
natural disasters. Failure to finish construction by the contractual completion date set forth in the contract could result in costs that reduce our projected
profit margins, including a requirement to pay daily penalties and damages. If we are unable to meet deadlines, either due to internal problems or as a
result of events over which we have no control, we may lose the trust of our clients and, therefore, experience a decrease in the demand for our services.
In such event, our business and financial performance could be adversely affected.
We may not be able to obtain compensation for additional work or expenses incurred as a result of client-requested change orders
Clients often determine, after commencement of the project, to change various elements of the project. Some of our contracts may also
require that clients provide us with design or engineering information or with equipment or materials to be used on the project, and, in some cases, the
client may provide us with deficient design or engineering information or equipment or materials or may provide the information or equipment or
materials to us later than required by the project schedule. Our project contracts generally require the client to compensate us for additional work or
expenses incurred due to client requested change orders or failure of the client to provide us with specified design or engineering information or
equipment or materials. Under these circumstances, we generally negotiate with the client with respect to the amount of additional time required to
make these changes and the compensation to be paid to us. We are subject to the risk that we are unable to obtain, through negotiation, arbitration,
litigation or otherwise, adequate amounts to compensate us for the additional work or expenses incurred by us due to client-requested change orders or
failure by the client to timely provide required items. A failure to obtain adequate compensation for these matters could require us to record an
adjustment to amounts of revenue and gross profit that were recognized in prior periods. Any such adjustments, if substantial, could have a material
adverse effect on our financial performance.
We may have difficulty obtaining performance bonds that we require in the normal course of our operations
In our engineering and construction business, it is industry practice for customers to require performance bonds or other forms of credit
enhancement to secure, among other things, bids, advance payments and performance. We cannot assure you that in the future we will not encounter
difficulties in obtaining such performance bonds or credit enhancements. The Peruvian market for these types of credit instruments is small; moreover,
under Peruvian banking regulations, lenders are required to impose limits on the amount of credit they extend to a group of affiliated companies. Failure
to provide performance bonds or credit enhancements on terms required by clients may result in our inability to compete for or win new projects.
26

Additional Risks Related to our Infrastructure Business
A substantial or extended decline in oil prices may adversely affect our financial performance
A substantial part of the revenues of our infrastructure business depends upon prevailing prices for oil. Historically, oil prices and markets
have been volatile and are likely to continue to be volatile in the future. Moreover, global oil prices have fluctuated significantly in recent years, with the
average Brent crude prices declining from US$99.02 per barrel in 2014 to US$54.20 per barrel in 2017. In 2018, average Brent crude prices increased to
US$70.99 per barrel, but during the first quarter of 2019, decreased to US$63.23 per barrel. Oil is a commodity and its price is subject to wide
fluctuations in response to relatively minor changes in supply and demand for oil, market uncertainty, and a variety of additional factors beyond our
control. Those factors include, among others: global demand and supply; political developments in producing regions; weather conditions; governmental
regulations; international conflicts and acts of terrorism; the price and availability of alternative sources of energy; and overall local and global
economic conditions. Moreover, lower oil prices may not only decrease our revenues on a per unit basis, but may also reduce the amount of oil we can
produce economically, if any, and, as such, may have a negative impact on the reserves of the fields in which we operate. As result, our financial
performance could be materially and adversely affected by declines in oil prices.
Our reserves estimates depend on many assumptions that may turn out to be inaccurate and are not subject to review by independent reserve
auditors
The process of estimating oil and gas reserves is complex, although the fields where we produce oil and gas are mature (Block I has been in
production for over 100 years, Block III for approximately 100 years, Block IV for approximately 95 years and Block V for over 50 years). In order to
prepare our reserves estimates presented in this annual report, we must project production rates and timing of development expenditures as well as
analyze available geological, geophysical, production and engineering data, and the extent, quality and reliability of this data can vary. The process also
requires economic assumptions about matters such as oil prices, drilling and operating expenses, capital expenditures, taxes, and availability of funds.
Therefore, estimates of reserves are inherently imprecise. Moreover, our reserve estimates included in this annual report have been prepared internally
by our team of engineers, and have not been audited or reviewed by independent engineers. Future real production, oil and gas prices, revenues, taxes,
development expenditures, operating expenses and quantities of recoverable reserves will most likely vary from the estimates presented in this annual
report, and those variances may be material. Any significant variance could materially affect the estimated reserves of the fields in which we operate.
Our return on our investment in our concessions may not meet estimated returns
Our return on any investment in a concession is based on the terms and conditions of the concession, its duration and the amount of capital
invested as well as the amount of revenues collected, debt service costs, payment of penalties and other factors. For example, traffic volume at toll roads
may be affected by a number of factors beyond our control, including security conditions; general economic conditions; demographic changes; fuel
prices; reduction in commercial or industrial activities in the regions served by the roads; and natural disasters. Decreased traffic at Norvial could
adversely affect our financial performance. Although some of our concessions allow for adjustments based on economic conditions, certain concessions
provide that adjustment requests be approved only if certain limited events specified in our concession contracts have occurred. If a request of
adjustment is not granted, our financial performance could be affected. Given these factors and the possibility that governmental authorities could
implement policies that affect our contractual return on investment in a way that we did not anticipate, we cannot assure you that our return on any
investment under any concession will meet our estimates.
Governmental entities may terminate prematurely our concessions and similar contracts under various circumstances, some of which are beyond
our control
Our ability to continue operating our concessions and similar public-sector contracts depends on governmental authorities, which may
terminate the concession or contract pursuant to the provisions set forth therein or in accordance with applicable legislation, including the failure to
comply with any contractual terms (including the concessionaire’s default on debt) or applicable law. Moreover, the relevant governmental authority
may terminate and/or repossess a concession at any time, if, in accordance with applicable law, the governmental authority determines that it is in the
public interest to do so. The relevant governmental authority may also assume the operation of a concession in certain emergency situations, such as
war, public disturbance or threat to national security. In addition, in the case of force majeure, the relevant governmental authority may require us to
implement certain changes to our operations. If the government terminates any of our concessions, under Peruvian law, it is generally required to
compensate us for the amount of our unrecovered investment, unless the concession is revoked pursuant to applicable law or the terms of the concession
which would imply a serious breach of the concession’s terms by us. Such compensation process is likely to be time consuming and the amount paid to
us may not fully compensate us. We cannot assure you that we would receive such compensation on a timely basis or in an amount equivalent to the
value of our investment in a concession plus lost profits.
27

We are exposed to risks related to the operation and maintenance of our concessions and similar contracts
The operation and maintenance requirements under our concessions could encounter delays or cause us to exceed our budgeted costs for
such projects, which could limit our ability to realize the expected return on these projects, increase our operating or capital expenses and adversely
affect our business and financial performance. In addition, our operations may be adversely affected by interruptions or failures in the technology and
infrastructure systems that we use to support our operations, including toll road collection and traffic measurement systems. The Lima Metro in
particular may be susceptible to outages due to power loss, telecommunications failures and similar events. The failure of any of our technology systems
may cause disruptions in our operations, adversely affecting our profitability. While we have business continuity plans in place to reduce the adverse
impact of information technology system failures on our operations, we cannot assure you that these plans will be effective. Furthermore, accidents and
natural disasters may also disrupt the construction, operation or maintenance of our projects and concessions, which could adversely affect our business
and financial performance.
We may not be successful in obtaining new concessions
The market for infrastructure concessions in Peru is competitive. We compete with Peruvian and foreign companies for infrastructure
concessions in Peru, some of whom may have greater financial and other resources or particular expertise pertinent to a specific concession.
Additionally, our public-sector clients may face budget deficits that may prohibit the development of infrastructure concessions, which could affect our
business. We may also not be able to obtain additional concessions if the government decides not to award new concessions, due to budget constraints
or policy changes or because alternative financing mechanisms are used. Recently, the awarding of concessions and the use of public-private
associations in Peru have stalled, due in part to concerns related to the corruption scandal surrounding Odebrecht and its potential effect on government
officials in the country. Our inability to bid for or obtain new concessions may adversely affect our business and financial performance.
Our contract with Petroperú S.A. (“Petroperú”) for fuel storage at the South terminal is currently scheduled to expire in August 2019.
Moreover, cannot assure you whether or when we will undertake any of the projects that have been awarded to us but for which contract negotiations
are ongoing or stalled, in particular the concessions for Via Expresa Sur, with respect to which we recently received a letter from the Municipality of
Lima in which the Municipality communicated its desire to cease discussions to relaunch the project.
Additional Risks Related to our Real Estate Business
We are exposed to risks associated with the development of real estate
Our real estate business is subject to the risks that generally affect the real estate industry, such as availability and prices of suitable land,
environmental and zoning regulations, interruptions in supply and volatility of the prices of construction materials and equipment, and changes in the
demand for real estate. Our real estate business is specifically affected by the following risks: macroeconomic conditions in Peru that may impact the
growth of the real estate sector as a whole, particularly in the residential market, including an increase in unemployment or a decrease in wage levels; an
increase in prevailing interest rates or lack of available credit; changes in government subsidies for affordable housing; unfavorable real estate market
conditions, such as an oversupply of residential units or scarcity of suitable land in particular areas; the level of customer interest in our new projects or
the sales price per unit necessary to sell the unit may be lower than expected; customer perception of the security, convenience and attractiveness of our
projects and the areas in which they are located; cost overruns, many of which may be beyond our control, that exceed our estimates and affect our
profit margins, including the price of labor, land, insurance, taxes and public charges; the construction and sale of units may not be completed on
schedule; bankruptcy or significant financial difficulties of large industry players, which cause a loss of confidence in the industry; limitations when
contracting with government entities; and restrictions on real estate development imposed by local, regional and national authorities which often render
restrictive or higher bureaucratic laws and regulations. Recently, real estate sales have slowed due to modifications by the government to a program
(Bono de Buen Pagador) that encourages social interest housing sales as well as access to credit. The occurrence or continuation of any of the above
events may have a material adverse effect on our business and financial performance.
Real estate prices may not continue to rise and may decline
Real estate prices in Peru have risen significantly over the last decade. We cannot assure you that this increase in real estate prices does not
represent a bubble. Real estate prices in Peru may not continue to rise or may decline significantly, particularly if financing costs rise or consumer
confidence in the real estate market erodes. If real estate prices decline significantly, our business and financial performance could be materially and
adversely affected.
28

Our business may be adversely affected if we are not able to obtain the necessary licenses and/or authorizations for our developments in due time
Real estate development requires obtaining certain licenses, authorizations and registrations. In Peru, municipal authorities are responsible
for issuing most of the licenses that are required during the development stage, including zoning, demolition, construction and conformity (conformidad
de obra) licenses, among others. Currently, we have approximately 22 real estate projects in various stages of development. For some of these projects,
we have not yet initiated administrative proceedings with the appropriate authorities, or such proceedings are pending approval. A denial or an extended
delay in issuing licenses, authorizations or registrations, or an extended delay by municipal authorities in approving licensing procedures, may render
land unsuitable for development, delay the completion of planned projects, increase our costs or otherwise negatively impact the pricing of projects and
adversely affect our business and financial performance.
The scarcity of financing, an increase in interest rates or an increase in the security required by financial institutions as collateral may
adversely affect the ability or willingness of prospective buyers to purchase our real estate properties. In most cases, the purchasers of our residential or
commercial properties finance at least part of the purchase price with mortgage loans. In 2016, 2017 and 2018, approximately 95%, 88% and 92%,
respectively, of our residential units were sold to purchasers who received government subsidies to finance the purchase of homes. An increase in
interest rates, whether as a result of market conditions or government action or otherwise, may cause a decrease in the demand for our residential and
commercial properties and for land development. An increase in interest rates could also increase our own financing costs, which may, in turn, increase
the sale price of our projects and adversely affect our business and financial performance.
We may experience difficulties in finding desirable land and increases in the price of land may increase our cost of sales and decrease our earnings
The continued growth of our real estate business depends in large part on our ability to continue to acquire land at a reasonable cost. As
more developers enter or expand their operations in the Peruvian real estate sector, land prices could rise significantly and suitable land could become
scarce or overpriced due to increased demand or decreased supply. A resulting rise in land prices may increase our cost of sales and decrease our
earnings. We may not be able to acquire suitable land at reasonable prices in the future, which may have a negative impact on our financial performance.
Changing market conditions may adversely affect our ability to sell home inventories in our land and at expected prices
There is a lag between the time we acquire land and the time that we can bring the developed properties to market. Lag time varies by sector
and on a project-by-project basis. As a result, we face the risk that demand for real estate may decline or that other developments may occur during this
period that affect market conditions, and that we will not be able to dispose of developed properties or undeveloped land at expected prices or profit
margins or within anticipated time frames or at all. Significant expenditures associated with investments in real estate, such as maintenance costs,
architectural fees in high-end projects, construction costs and debt payments, cannot generally be reduced if changes in market conditions cause a
decrease in expected revenues from our properties. Moreover, the market value of home inventories and undeveloped land can fluctuate significantly
because of changing market conditions. As a result of these and other factors beyond our control, we may be forced to sell properties or land at a loss or
for prices that generate lower profit margins than we anticipate.
Determinations by INDECOPI may adversely affect our ability to enforce binding contracts
In resolving consumer protection complaints in the real estate and insurance sectors, INDECOPI has made determinations against real estate
developers resulting in the modification of contractual provisions applicable to purchasers. Some purchasers of real estate properties have taken
advantage of these INDECOPI determinations and filed complaints against developers before INDECOPI and/or made public claims through the media
seeking to obtain compensation for alleged deficiencies in housing construction as well as the modification of the terms of their contracts, which may
have a negative impact on our real estate business. Although we have a small number of such complaints in INDECOPI, an increase in consumer
complaints and consumer protective measures, particularly those resulting in the modification of contractual terms, may affect our ability to enforce our
contracts under their original terms if we are not able to counter such claims, which in turn may have a negative impact on our real estate business.
29

Risks Related to Peru
Economic, social and political developments in Peru could adversely affect our business and financial performance
The substantial majority of our operations are conducted in Peru and depend on economic and political developments in the country. As a
result, our business may be materially and adversely affected by economic downturns, currency depreciation, inflation, interest rate fluctuation,
government policies, regulation, taxation, social instability, political unrest, drug trafficking, terrorism and other developments in or affecting the
country, over which we have no control. In the past, Peru has experienced periods of severe economic recession, large currency devaluation and high
inflation. We cannot assure you that Peru will not experience similar adverse economic developments in the future. In addition, Peru has experienced
periods of political instability that has included a succession of regimes with differing economic policies and programs. Previous governments have
imposed controls on prices, exchange rates, local and foreign investments and international trade, restricted the ability of companies to dismiss
employees, expropriated private-sector assets and prohibited the remittance of profits to foreign investors. We cannot assure you that the Peruvian
government will continue to pursue open-market policies that stimulate economic growth and social stability.
Moreover, investigations against former or current government officials relating to bribery payments made by Odebrecht have, and may
continue to, result in political uncertainty in Peru. On March 22, 2018, President Pedro Pablo Kuczynski presented his resignation, due to allegations of
corruption for vote-buying in connection with the impeachment proceeding against him. On March 23, 2018, the Congress accepted his resignation and
his first vice president, Martín Vizcarra, was sworn in as acting president. We cannot assure you whether President Vizcarra will remain in office for the
remainder of the presidential term, which ends in July 2021. If President Vizcarra and the current second vice president both resign, the president of the
Congress would become acting president and the Congress would call for new elections.
Criminal investigations have been initiated against former presidents Alejandro Toledo, Ollanta Humala, Alan García and Pedro Pablo
Kuczynski. On April 17, 2019, former President Alan García committed suicide as prosecutors were preparing to detain him over matters relating to
criminal investigations.
Several corruption scandals regarding authorities at municipal, regional and national ministry-levels are also ongoing, and former and
current government officials have been detained. These corruption investigations have resulted in lower investments in large projects.
The political instability caused by these events could affect macroeconomic conditions in the country, including currency volatility, as well
as have a negative effect on our business.
Fluctuations in the value of the sol could adversely affect financial performance
Fluctuations in the value of the sol relative to the U.S. dollar could adversely affect Peru’s economy. In addition, fluctuations in the value of
the sol to the U.S. dollar can materially adversely affect our results of operations. In 2018, 32.5% and 55.6% of our revenues were denominated in soles
and U.S. dollars, respectively, whereas 63.0% and 23.1% of our costs of sales were denominated in soles and U.S. dollars, respectively. In the past the
exchange rate between the sol and the U.S. dollar has fluctuated significantly. We cannot assure you that the value of sol against other currencies will
not fluctuate significantly in the future, which could adversely affect the Peruvian economy and our business, financial condition and results of
operations.
In addition, although Peruvian law currently imposes no restrictions on the ability to convert soles to foreign currency and transfer foreign
currency outside of the country, in the 1980s and early 1990s, Peru imposed exchange controls, including controls affecting the remittance of dividends
to foreign investors. We cannot assure you that exchange controls in Peru will not be implemented in the future. The imposition of exchange controls
could have an adverse effect on the economy and on your ability to receive dividends from us as a holder of ADSs.
Inflation could adversely affect our financial performance
In the past, Peru has suffered through periods of hyperinflation, which have materially undermined the Peruvian economy and the
government’s ability to create conditions that support economic growth. A return to a high inflation environment would also undermine Peru’s foreign
competitiveness, with negative effects on the level of economic activity and employment.
As a result of reforms initiated in the 1990s, Peruvian inflation decreased significantly from four-digit inflation during the 1980s. The
Peruvian economy experienced annual inflation of 3.2% in 2014, 4.4% in 2015, 3.2% in 2016, 1.4% in 2017 and 4.8% in 2018, as measured by the
Peruvian Consumer Price Index (Índice de Precios al Consumidor del Perú).
30

If Peru experiences substantial inflation in the future, our costs of sales and administrative expenses could increase which could affect our
operating margins. Inflationary pressures may lead to governmental intervention in the economy, including the introduction of government policies that
may adversely affect the overall performance of the Peruvian economy. For example, in response to increased inflation, the Peruvian Central Bank,
which sets the Peruvian basic interest rate, may increase or decrease the basic interest rate in an attempt to control inflation or foster economic growth.
Changes in tax laws may increase our tax burden and, as a result, negatively affect our financial performance
The Peruvian Congress and government regularly implement changes to tax laws that may increase our tax burden. These changes may
include modifications in our tax rates and, on occasions, the enactment of temporary taxes that in some cases have become permanent taxes. Tax
reforms related to the Peruvian income tax, value added tax and tax code have recently been approved, but we are unable to estimate the impacts that
these reforms may have on business. The effects of any tax reforms that could be proposed in the future and any other changes that result from the
enactment of additional reforms have not been, and cannot be, quantified. However, any changes to our tax regime may result in increases in our overall
costs and/or our overall compliance costs, which could negatively affect our financial performance.
Earthquakes, severe weather and other natural disasters could adversely affect our business and financial performance
Peru is located in an area that experiences seismic activity and occasionally is affected by earthquakes. For example, in 2007, an earthquake
with a magnitude of 7.9 on the Richter scale struck the central coast of Peru, severally damaging the region south of Lima. Such conditions may result in
physical damage to our properties and equipment, closure of one or more of our project sites and infrastructure concessions, inadequate work forces in
our markets and temporary disruptions in the supply of construction materials. In addition, Peru has also experienced adverse climate conditions (due to
climate change or otherwise) and adverse weather patterns, such as El Niño, an oceanic and atmospheric phenomenon that causes a warming of
temperatures in the Pacific Ocean, resulting in heavy rains off the coast of Peru and potentially flooding. Poor weather conditions can have significant
adverse effects on our engineering and construction activities as well as on our operation and maintenance of infrastructure assets business. Any of these
factors may materially adversely affect the Peruvian economy and our business and financial performance.
A resurgence of terrorism in Peru could adversely affect the Peruvian economy and, as a result, our business and results of operations
In the past, Peru experienced severe terrorist activity that reached its peak of violence against the government and private sector in the late
1980s and early 1990s. In the mid-1990s, terrorist groups suffered significant defeats, including the arrest of leaders, resulting in considerable
limitations in their activities. Despite the suppression of terrorist activity, we cannot assure you that a resurgence of terrorism in Peru, or other criminal
activity, including drug trafficking, will not occur, or if there is such a resurgence, it will not disrupt the economy of Peru and our business.
The Peruvian economy could be affected by adverse economic developments in regional or global markets
Financial and securities markets in Peru are influenced, to varying degrees, by economic and market conditions in regional or global
markets. Although economic conditions vary from country to country, investors’ perceptions of events occurring in one country may adversely affect
cash flows and securities from issuers in other countries, including Peru. For example, the Peruvian economy was adversely affected by the political and
economic events that occurred in several emerging economies in the 1990s, including in Mexico in 1994, the Asian crisis in 1997, the economic crisis in
Russia in 1998, the Brazilian currency devaluation in 1999 and the Argentine crisis in 2001, which affected the market value of securities issued by
companies from markets throughout Latin America. In addition, Peru’s economy continues to be affected by events in the economies of its major
regional partners and in developed economies that are trading partners or that affect the global economy. The 2008-2009 global economic recession,
principally driven by the subprime mortgage market in the United States, substantially affected the international financial system, including Peru’s
securities market and economy. More recently, global economic conditions, including slower growth in China, low global commodity prices, in
particular oil and gas prices, and the appreciation of the U.S. dollar against foreign currencies generated economic uncertainty which may reduce the
confidence of foreign investors, causing volatility in the securities markets and affecting the ability of companies to obtain financing globally. The
United Kingdom voted to exit the European Union on June 23, 2016. As of the date hereof, the actions to be taken by the United Kingdom to effectively
exit the European Union and the duration of this process are uncertain. The results of the referendum in the United Kingdom have caused, and are
expected to continue to cause, volatility in financial markets, which in turn could have substantial adverse effects on our business, financial condition
and results of operations. On November 8, 2016, Mr. Donald J. Trump was elected president of the United States. President Trump has implemented
restrictions on free trade and limitations on immigration. Changes in social, political, regulatory and economic conditions in the United States or in laws
and policies governing foreign trade could create uncertainty in the international markets and could have a negative impact on emerging market
economies, including the Peruvian economy, which in turn could have a negative impact on our operations. The worsening of current global conditions
or a new economic or financial crisis could affect Peru’s economy, and, consequently, materially adversely affect our business and financial
performance.
31

Risks Related to Chile, Colombia and other Latin American Countries
We face risks related to our operations outside of Peru
Latin American economic, political and social conditions may adversely affect our business. Our financial performance may be significantly
affected not only by general economic, political and social conditions in Peru but also in other markets where we operate or intend to operate, including
Chile and Colombia. During 2016, 2017 and 2018, approximately 26.5%, 28.0% and 14.2%, respectively, of our revenues on a consolidated basis
derived from operations outside of Peru.
These countries have suffered significant economic, political and social crises in the past, and these events may occur again in the future.
We cannot predict whether changes in current administrations will result in changes in governmental policy and whether such changes will affect our
business. Instability in the region has been caused by many different factors, including: significant governmental influence over local economies;
substantial fluctuations in economic growth; high levels of inflation; changes in currency values; exchange controls or restrictions on expatriation of
earnings; high domestic interest rates; wage and price controls; changes in governmental economic or tax policies, including retroactive changes;
imposition of trade barriers, including import duties on information technology equipment; electricity rationing; liquidity of domestic capital and
lending markets; unexpected changes in regulation; expropriations; and high levels of organized crime, terrorism and social conflicts, as well as overall
political, social and economic instability. Moreover, macroeconomic conditions in these countries are highly influenced by global commodity prices,
including the price of copper for Chile and the price of oil and gas for Colombia.
Risks Related to our ADSs
We have identified material weaknesses in our internal control over financial reporting, and if we cannot maintain effective internal controls or
provide reliable financial and other information in the future, investors may lose confidence in the reliability of our consolidated financial
statements, which could result in a decrease in the value of our ADSs
Based on the assessment of our internal control over financial reporting as of December 31, 2018, as required by Section 404 of the U.S.
Sarbanes Oxley Act of 2002 (“SOX”), management has concluded that, as of
such date, our internal control over financial reporting was not effective at the reasonable assurance level due to control deficiencies that constituted
material weaknesses. These material weaknesses consisted of:
• deficiencies in the operational effectiveness of controls over SOX compliance, including those related to determining the
subsidiaries to be included in the scope of SOX testing, the review and formal approval of risk and control matrices, the updating
and approval of narratives and flowcharts, as well as the monitoring of detected control failures and the implementation of our
internal control system over financing reporting;
• deficiency in formally having an established and documented process for enterprise and fraud risk management, including the
implementation of a risk management system that includes a methodology, a process of identification, evaluation and quantification
of the risks, a continuous improvement plan and a monitoring and reporting process;
• deficiencies in the design and operational effectiveness of controls over segregation of duties to help ensure that personnel with
potential conflicts were not involved in non-compatible activities;
• deficiencies in the design and operational effectiveness of the controls established in the accounting closing process with respect to
the: (1) preparation and review of the annual and interim consolidated financial statements, (2) review, approval and supporting
documentation of certain accounting entries, (3) segregation of duties between preparation and approval of accounting entries, (4)
access control to spreadsheets used for manual accounting records in compliance with IFRS disclosures, (5) disclosure of
discontinued operations, and (6) complete, accurate and timely provision of information to the accounting department; and
• deficiencies in the design and operational effectiveness of controls established in the revenue recognition process with respect to the
criteria for, and the documentation supporting, the recognition of revenue and the determination of related provisions, including
construction contract revenues and contingent revenues.
Certain of these material weaknesses resulted in adjustments to the accounting for revenue and accounts receivable. Additionally, these
material weaknesses could result in other misstatements in our financial results and disclosures, which could result in a material misstatement to our
annual or interim consolidated financial statements not being prevented or detected. Because of these material weaknesses, management concluded that
we did not maintain effective internal control over financial reporting as of December 31, 2018, based on criteria in Internal Control-Integrated
Framework (2013) issued by the COSO.
32

For more information, see “Item 15. Controls and Procedures.” A “material weakness” is a deficiency, or combination of deficiencies, in
internal controls such that there is a reasonable possibility that a material misstatement in financial statements will not be prevented or detected in a
timely basis.
We are in the process of implementing measures to address these material weaknesses. We may not be able to remediate these identified
material weaknesses. Moreover, we may in the future discover other areas of our internal controls that have material weaknesses or that need
improvement, particularly with respect to businesses that we acquire.
Any failure to maintain an effective internal control over financial reporting, or implement required new or improved controls, could harm
our operating results or cause us to fail to meet our reporting obligations. If we are unable to conclude that we have effective internal control over
financial reporting, or if our independent registered public accounting firm is unable to provide us with an unqualified opinion regarding the
effectiveness of our internal control over financial reporting, investors could lose confidence in the reliability of our consolidated financial statements,
which could result in a decrease in the value of our ADSs.
The market price of our ADSs may fluctuate significantly, and you could lose all or part of your investment
Volatility in the market price of our ADSs may prevent you from being able to sell your ADSs at or above the price you paid for them. The
market price and liquidity of the market for our ADSs may be significantly affected by numerous factors, some of which are beyond our control and
may not be directly related to our operating performance. These factors include, among others: actual or anticipated changes in our results of operations,
quarterly fluctuations, or failure to meet expectations of financial market analysts and investors; investor perceptions of our prospects or our industries;
operating performance of companies comparable to us and increased competition in our industries; new laws or regulations or new interpretations of
laws and regulations applicable to our business; general economic trends in Peru; catastrophic events, such as earthquakes and other natural disasters;
and developments and perceptions of risks in Peru and in other countries.
Substantial sales of ADSs or common shares could cause the price of our ADSs or common shares to decrease
Significant shareholders hold a large number of our common shares. These securities are eligible for sale. The market price of our ADSs
could decline significantly if we or our significant shareholders sell securities in our company or the market perceives that we or our significant
shareholders intend to do so.
We may raise additional capital in the future through the issuance of equity securities, which may result in dilution of the interests of our
shareholders
We may need to raise additional capital and may opt for obtaining such capital through the public or private placement of debt securities or
securities convertible into our common shares. In the event of a public or private debt financing, or the financing through the issuance of securities
convertible into our common shares, such additional funds may be obtained with the exclusion of the preemptive rights of our shareholders, including
the investors in our common shares, which may dilute the percentage interests of investors in our common shares.
No shareholder or group of shareholders holds a majority of our common shares
As of the date of this annual report, our former chairman and members of his family beneficially own 13.48% of our outstanding share
capital. No shareholder or group of shareholders currently owns a majority of our common shares. In addition, there is no shareholders’ agreement
among any of our significant shareholders. Accordingly, no shareholder or group of shareholders may on its own determine the outcome of substantially
all matters submitted for a vote to our shareholders. In addition, a new investor or group of investors may in the future seek to acquire a significant stake
in, or control of, our company, subject to compliance with Peruvian tender offer requirements which require that a tender offer be made to all
shareholders upon, among other matters, acquisition of 25%, 50% and 60% of our voting rights. If a new investor or group of investors acquires a
significant stake in, or control of, our company, we cannot assure you that such investor or group of investors will not seek to change how our business
is managed.
33
Holders of ADSs may be unable to exercise voting rights with respect to our common shares underlying the ADSs at our shareholders’ meetings
As a holder of ADSs representing common shares being held by the depositary in your name, you may exercise voting rights with respect to
the common shares represented by the ADSs only in accordance with the deposit agreement relating to the ADSs. Holders of our common shares will
receive notice of shareholders’ meetings through publication of a notice 25 days in advance, in accordance with Peruvian law, in the official gazette in
Peru, a Peruvian newspaper of general circulation and the website of the Peruvian Securities Commission, and will be able to exercise their voting rights
by either attending the meeting in person or voting by proxy. ADS holders will not receive notice directly from us. Instead, pursuant to the deposit
agreement, we will notify the depositary, who will mail to holders of ADSs the notice of the meeting and a statement as to the manner in which voting
instructions may be given. To exercise their voting rights, ADS holders must instruct the depositary how to exercise the voting rights for the common
shares which underlie their ADSs. Due to these additional procedural steps involving the depositary, the process for exercising voting rights may take
longer for ADS holders than for holders of our common shares.
Holders of ADSs also may not receive voting materials in time to instruct the depositary to vote the common shares underlying their ADSs.
In addition, the depositary and its agents are not responsible for failing to carry out voting instructions of the holders of ADS or for the manner of
carrying out such instructions, unless such failure can be attributed to gross negligence, bad faith or willful misconduct on the part of the depositary or
its agents. Accordingly, holders of ADSs may not be able to exercise voting rights, and they will have little, if any, recourse if the underlying common
shares are not voted as requested.
Our shareholders’ ability to receive cash dividends may be limited
Our shareholders’ ability to receive cash dividends may be limited by the ability of the depositary to convert cash dividends paid in soles
into U.S. dollars. Under the terms of our deposit agreement with the depositary for the ADSs, the depositary will convert any cash dividend or other
cash distribution we pay on the common shares underlying the ADSs into U.S. dollars, if it can do so on a reasonable basis and can transfer the U.S.
dollars to the United States. If this conversion is not possible or if any government approval is needed and cannot be obtained, the deposit agreement
allows the depositary to distribute the foreign currency only to those ADR holders to whom it is possible to do so. If the exchange rate fluctuates
significantly during a time when the depositary cannot convert the foreign currency, you may lose some or all of the value of the dividend distribution.
Holders of ADSs may be unable to exercise preemptive or accretion rights with respect to the common shares underlying their ADSs
Under Peruvian corporate law, if we issue new common shares as part of a capital increase, unless otherwise agreed to by holders of 40% of
our subscribed voting common shares and, provided that such capital increase does not favor, directly or indirectly, certain shareholders to the detriment
of others, our shareholders will generally have the right to subscribe to a proportional number of common shares of the class held by them to maintain
their existing ownership percentage, which is known as preemptive rights. In addition, shareholders are entitled to the right to subscribe for the
unsubscribed common shares at the end of a preemptive rights offering, on a pro rata basis, which is known as accretion rights. You may not be able to
exercise the preemptive or accretion rights relating to common shares underlying your ADSs unless a registration statement under the Securities Act is
effective with respect to those rights or an exemption from the registration requirements of the Securities Act is available. We are not obligated to file a
registration statement with respect to the common shares relating to these preemptive and accretion rights, and we cannot assure you that we will file
any such registration statement. Unless we file a registration statement or an exemption from registration is available, you may receive only the net
proceeds from the sale of your preemptive and accretion rights by the depositary or, if the preemptive and accretion rights cannot be sold, they will be
allowed to lapse. As a result, U.S. holders of our ADSs may suffer dilution of their interest in our company upon future capital increases.
We are entitled to amend the deposit agreement and to change the rights of ADS holders under the terms of such agreement without the prior
consent of the ADS holders
We are entitled to amend the deposit agreement and to change the rights of the ADS holders under the terms of such agreement without the
prior consent of the ADS holders. Any change related to an increase in deposits or charges for book-entry securities services or any modification that
might hinder the rights of the ADS holders will be effective within 30 days after the ADS holders have received notice of such change or modification
and such holders will have no right to any compensation whatsoever.
Peru has different corporate disclosure and accounting standards than those you may be familiar with in the United States
Financial reporting and securities disclosure requirements in Peru differ in certain significant respects from those required in the United
States. There are also material differences among IFRS, Peruvian GAAP and U.S. GAAP. Accordingly, the information about us available to you will
not be the same as the information available to holders of shares issued by a U.S. company. In addition, the Peruvian Securities Market Law, which
governs open or publicly listed companies, such as us, imposes disclosure requirements that are more limited than those in the U.S. in certain important
respects. Although Peruvian law imposes restrictions on insider trading and price manipulation, applicable Peruvian laws are different from those in the
United States, and the Peruvian securities markets are not as highly regulated and supervised as the U.S. securities markets.
34

Our status as a foreign private issuer allows us to follow alternate standards to the corporate governance standards of the New York Stock
Exchange, which may limit the protections afforded to investors
We are a foreign private issuer within the meaning of the New York Stock Exchange (“NYSE”) corporate governance standards. Under
NYSE rules, a foreign private issuer may elect to comply with the practices of its home country and not to comply with certain corporate governance
requirements applicable to U.S. companies with securities listed on the exchange. We currently follow certain Peruvian practices concerning corporate
governance and intend to continue to do so. Accordingly, holders of our ADSs will not have the same protections afforded to shareholders of companies
that are subject to all NYSE corporate governance requirements.
For example, the NYSE listing standards provide that the board of directors of a U.S. listed company must have a majority of independent
directors at the time our company ceases to be a “controlled company.” Under Peruvian corporate governance practices, a Peruvian company is not
required to have a majority of independent members on its board of directors. The listing standards for the NYSE also require that U.S. listed
companies, at the time they cease to be “controlled companies,” have a nominating/corporate governance committee and a compensation committee (in
addition to an audit committee). Each of these committees must consist solely of independent directors and must have a written charter that addresses
certain matters specified in the listing standards. Under Peruvian law, a Peruvian company may, but is not required to, form special governance
committees, which may be composed partially or entirely of non-independent directors. In addition, NYSE rules require the independent non-executive
directors of U.S. listed companies to meet on a regular basis without management being present. There is no similar requirement under Peruvian law.
The NYSE’s listing standards also require U.S. listed companies to adopt and disclose corporate governance guidelines. In July 2002, the
Peruvian Securities Commission and a committee comprised of regulatory agencies and associations prepared and published a list of suggested
non-mandatory corporate governance guidelines called the “Principles of Good Governance for Peruvian Companies.” Although we have implemented
these measures, we are not legally required to comply with the corporate governance guidelines, only disclose whether or not we are in compliance.
Minority shareholders in Peru are not afforded equivalent protections as minority shareholders in other jurisdictions and investors may face
difficulties in commencing judicial and arbitration proceedings against our company or the controlling shareholder
Our company is organized and existing under the laws of Peru. Accordingly, investors may face difficulties in serving process on our
company, officers and directors or significant shareholders in the United States of certain other jurisdictions, and in enforcing decisions granted by
courts located in other jurisdictions against our company, our officers and directors or significant shareholders that are based on securities laws of
jurisdictions other than Peru.
In Peru, there are no proceedings to file class action suits or shareholder derivative actions with respect to issues arising between minority
shareholders and an issuer, its controlling shareholders or directors and officers. Furthermore, the procedural requirements to file actions by
shareholders differ from those of other jurisdictions, such as in the United States. As a result, it may be more difficult for our minority shareholders to
enforce their rights against us, our directors, officers or significant shareholders as compared to the shareholders of a U.S. company. The deposit
agreement provides that the depositary has no obligation to commence or become involved in any judicial proceedings and any other legal actions
relating to the ADSs or the deposit agreement, either on behalf of the ADS holders or on behalf of any other person.
Judgments of Peruvian courts with respect to our common shares will be payable only in soles
If proceedings are brought in the courts of Peru seeking to enforce our obligations in respect of the common shares, we will not be required
to discharge our obligations in a currency other than soles. Under Peruvian exchange control limitations, an obligation in Peru to pay amounts
denominated in a currency other than soles may be satisfied in Peruvian currency only at the exchange rate, as determined by the Peruvian Central Bank,
in effect on the date the judgment is obtained, and such amounts are then adjusted to reflect exchange rate variations through the effective payment date.
The then prevailing exchange rate may not afford non-Peruvian investors with full compensation for any claim arising out of or related to our
obligations under the ADSs.
If securities or industry analysts publish unfavorable research about our business or if they cease to follow our business, the price and trading
volume of the ADSs could decline
The trading market for the ADSs will depend, in part, on the research and reports that securities or industry analysts publish about us or our
business. If one or more of the analysts who covers us downgrades the ADSs or publishes unfavorable research about our business, the price of the
ADSs would likely decline. If one or more of these analysts ceases coverage of our company or fails to publish reports on us regularly, demand for the
ADSs could decrease, which could cause the price and trading volume of the ADSs to decline.
35

ITEM 4. INFORMATION ON THE COMPANY
A. History and Development of the Company
Graña y Montero has been operating in Peru since 1933 and it is listed on the Lima Stock Exchange since 1997. Set forth below are key
highlights in our company’s history:
• Graña y Montero traces its origins to its predecessor company GRAMONVEL, founded 85 years ago by, and named after, engineers
Alejandro Graña Garland, Carlos Montero Bernales and Carlos Graña Elizalde. We began primarily as a construction company.
• We expanded our operations internationally in 1943 with our contract to build a Nestle factory in Venezuela.
• In 1948, we began one of our largest projects since our founding—the construction of the city of Talara for the International
Petroleum Company, which was completed in 1957.
• In 1949, GRAMONVEL merged with Morris y Montero to form Graña y Montero Contratistas Generales S.A. (now GyM S.A., our
construction subsidiary), expanding its service offerings and increasing its capacity to undertake large-scale infrastructure projects.
• In 1983, we began a diversification strategy by developing complementary lines of business. In 1984, we founded GMP, our oil and
gas subsidiary. In 1985, we partnered with Sonda S.A. (a Chilean IT services company) to form GMD, our IT services subsidiary.
Beginning in 1987, we founded our real estate development business, currently Viva GyM.
• In 1996, we reorganized our subsidiaries and founded Graña y Montero, which became the principal shareholder of all our
subsidiaries. In 1997, we listed our company on the Lima Stock Exchange.
• In 1998, our company built Larcomar, a landmark shopping center in Lima that has become a popular tourist destination, which we
sold in 2010.
• In 2003, 2006 and 2007, we were awarded the concessions for the construction, operation and maintenance of the Norvial,
Canchaque and Survial toll roads, respectively.
• In 2007, we also developed the first large-scale affordable housing project in Lima, consisting of 3,400 apartment units and located
in the district of El Agustino.
• In 2011, we acquired 75.0% of CAM, a leading company in the electricity sector based in Chile, and formerly part of the Latin
American power generation and distribution company Enersis. In December 2018, our company sold its position in CAM to GDF
Suez Energie Services Chile Holding SpA and ENGIE Services Perú S.A.
• In 2012, we began operating the Lima Metro.
• In July 2013, we listed our company on the NYSE.
• In 2012 and 2013, we acquired 74.0% and 6.4%, respectively, of Ingeniería y Construcción Vial y Vives S.A. (“Vial y Vives”), an
engineering and construction company specializing in the Chilean mining sector. In August 2013, we acquired 86.0% of DSD
Construcciones y Montajes S.A. (“DSD Construcciones y Montajes”), a Chilean engineering and construction company specialized
in providing services to the energy, oil and gas, cellulose and mining sectors in Chile and Latin America. In July 2014, our
subsidiary Vial y Vives merged with DSD Construcciones y Montajes to form Vial y Vives-DSD S.A. (“Vial y Vives-DSD”),
through our subsidiary GyM Chile SpA, we hold an 86.2% interest in Vial y Vives-DSD. As of the date of this annual report, we
hold a 94.5% interest in Vial y Vives-DSD.
• In September 2014, our subsidiary Norvial established its first bond program for a maximum amount of S/.380 million or its
equivalent in U.S. dollars. Norvial undertook its first and second issuances under this program for amounts of S/.80 million and
S/.285 million, respectively, in July 2015.
• In December 2014, our subsidiary GyM S.A. acquired 70% of the share capital of Morelco S.A.S. (“Morelco”), a Colombian
engineering and construction company specialized in the oil and gas and other energy sectors.
• In April 2015, GMP started operations of its hydrocarbon extraction services in Blocks III and IV for Perupetro, in the provinces of
Talara and Paita in northern Peru.
36

Graña y Montero, S.A.A. was incorporated in 1996 and is a publicly-held corporation (sociedad anónima abierta) organized under the laws
of Peru. Our principal executive office is located at Avenida Paseo de la República 4667, Lima 34, Peru, and our main telephone number is
+511-213-6565. Our website address is www.granaymontero.com.pe. Information contained on, or accessible through, our website is not incorporated
in this annual report, and you should not consider any such information part of this annual report. The SEC maintains a website (http://www.sec.gov)
that contains reports, proxy and information statements, and other information regarding issuers that file electronically with the SEC.
For information on our organizational structure, see “Item 4.C. Information on the Company – Organizational Structure.”
For information on our capital expenditures and divestitures, see “Item 5.B. Operating and Financial Review and Prospects— Liquidity and
Capital Resources—Capital Expenditures.”
For information on the availability of filings we make electronically with the SEC, see “Item 10H. Additional Information—Documents on
Display.”
B. Business Overview
Overview
We are the largest engineering and construction company in Peru as measured by revenues during 2018, and one of the largest publicly-
traded engineering and construction company in Latin America as measured by market capitalization as of December 31, 2018, with strong
complementary businesses in infrastructure and real estate.
With 85 years of operations, we have a long track record of successfully completing the engineering and construction of many of Peru’s
landmark private- and public-sector infrastructure projects, such as the Lima International Airport and the Peru LNG gas liquefaction plant, and we
believe we have a track record of operational excellence in our markets. We have developed a highly-experienced management team, a talented pool of
more than 2,100 engineers and a skilled work force that share our core corporate values of quality, professionalism, reliability and efficiency. As a
company listed on the Lima Stock Exchange since 1997 and the NYSE since 2013, we also abide by the highest corporate governance standards in Peru.
Beginning in the mid-1980s, we leveraged our engineering and construction expertise into complementary lines of business, such as the
development, ownership, operation and maintenance of infrastructure assets (including the Lima Metro, Peru’s only urban railway system), real estate
development, and the provision of technical services primarily to infrastructure-related assets. We believe our business mix creates significant
opportunities across our lines of business, generates more stable revenues and earnings on a consolidated basis, and provides additional financial
stability to our company.
As a result of our performance in Peru, we have been requested by clients to undertake the engineering and construction of large and
complex projects outside our home market, such as the Pueblo Viejo gold mine for Barrick Gold in the Dominican Republic. Through the successful
execution of those projects, we have developed operational experience in other Latin American countries. We have further expanded our activities in
other key markets of the region through the acquisition of businesses with solid positions in those markets. In February 2011, we acquired a controlling
interest in Compañía Americana de Multiservicios (CAM), which is headquartered in Chile and provides technical services to power utility companies
in Chile, Peru and Colombia. In October 2012, we acquired a controlling interest in Vial y Vives, an engineering and construction company specializing
in the Chilean mining sector, and in August 2013, we acquired a controlling interest in DSD Construcciones y Montajes, a Chilean engineering and
construction company specialized in providing services to the energy, oil and gas, cellulose and mining sectors in Chile and Latin America. In
December 2014, we acquired a controlling interest in Morelco, an engineering and construction company specialized in the Colombian oil and gas and
other energy sectors.
37

The tables below show our backlog, revenues and EBITDA from 2014 to 2018.
During 2018, we generated revenues of S/.3,899.5 million (US$1,154 million), EBITDA of S/.557.3 million (US$164.9 million), and net
profit of S/.57.4 million (US$17 million) including net loss attributable to controlling interest of S/.83.2 million (US$24.6 million).
Our Strengths
We believe our company’s strengths provide us with significant competitive advantages. Our principal strengths include the following:
Leader in growing markets
We are the largest engineering and construction company in Peru as measured by revenues during 2018, and one of the largest publicly-
traded engineering and construction company in Latin America as measured by market capitalization as of December 31, 2018. Peru is undergoing a
period of development, with over 4.4% average annual real GDP growth between 2009 and 2018 and significant private and public investments in the
mining, power, oil and gas, transportation, real estate and other infrastructure sectors. We have completed some of the most complex and large-scale
infrastructure projects in the country, and we believe we are an integral part of Peru’s ongoing transformation with projects that contribute to the overall
economic development of the country. We believe our expertise, track record, scale and operational capabilities in Peru position us to take advantage of
the country’s favorable economic conditions and growth opportunities. We believe we are also a significant infrastructure concessionaire in Peru and a
large apartment building developer in Peru.
Long-standing track record for operational excellence
During our 85-year history, we have focused on the successful and on-time execution of complex projects, through our “deliver before
deadline” and “lean construction” initiatives. Our extensive experience has allowed us to gain deep market knowledge and expertise, which help us
better serve our clients and manage risks in our contractual arrangements. We believe we have a track record of operational excellence. We believe that
our track record of operational excellence are key factors in winning new and repeat business, as well as in partnering with strategic industry players and
attracting top talent to our company.
Complementary lines of business which generate more stable cash flows and create additional business opportunities across our segments
We have expanded our company by developing complementary lines of business, many of which have become leaders in their respective
markets. These lines of business create significant business opportunities across our segments, enabling us to capture a greater share of infrastructure
spending, and also generate cost synergies. One example is Norvial, a toll road concession operated within our Infrastructure segment. In addition to
managing the concession, we used our E&C segment to design and construct the expansion of the highway and, once constructed, we are now using our
Infrastructure segment to operate and maintain the highway. In addition to increasing our levels of consolidated activity, many of these lines of business
enable us to achieve more stable cash flows through medium and long-term client service contracts and concessions, which counter in part the
cyclicality of the engineering and construction business.
38

Significant backlog
Our backlog amounted to US$1,257.2 million as of December 31, 2018. We believe that our backlog, which as of December 31, 2018
represented approximately 1.09x of our related 2018 revenues, provides visibility as to our potential for growth in the coming years, although backlog
may not always be an accurate indicator of future revenues. See “Item 3.D. Key Information—Risk Factors—Risks Related to our Company—Our
backlog and our ratio of historical backlog to revenues may not be reliable indicators of future revenues or profit.” Moreover, we believe our backlog is
strategically targeted to our key end-markets such as mining, infrastructure, power, energy and real estate. Approximately 64.9% of our backlog as of
December 31, 2018 is comprised of contracts with the private sector. Furthermore, we continuously evaluate bidding on contracts arising from the
significant ongoing private and public investments in Latin America.
Proven ability to create and grow businesses organically and through acquisitions
We have proven our ability to extend our engineering and construction capabilities into complementary lines of business in a diverse range
of industries, some of which began as innovative start-ups in response to client needs. For example, in 1984, we created a new IT business division,
which grew and evolved through the years to become the second largest IT company in Peru (we sold this business in June 2017). In October 2012, we
acquired Vial y Vives, an engineering and construction company specializing in the Chilean mining sector which complements our leading E&C
practice in the mining sector. In August 2013, we acquired a controlling interest in DSD Construcciones y Montajes, a Chilean engineering and
construction company whose main focus is electromechanical works and assemblies in construction projects related to oil refineries, pulp and paper,
power plants and mining plants. In December 2014, we acquired a controlling interest in Morelco, an engineering and construction company specialized
in the Colombian oil and gas and other energy sectors. We believe that our proven ability to create new businesses, develop businesses organically and
acquire and successfully integrate new businesses into our platform is a key competitive advantage to expand our operations in Latin America.
Highly experienced management, talented engineers and skilled workforce, with shared core corporate values
Our senior management team has an average tenure within our company of approximately 10 years. We motivate our management through
performance-based compensation, which align their interests with those of our shareholders. In addition, through our efforts to attract, train and retain
our workforce, we have built a talented team of employees, including more than 2,100 engineers. We also have access to a network of approximately
132,000 manual laborers throughout Peru that can supplement our workforce when required by our construction pipeline. Thanks to our extensive and
talented team, we have the capability and scale to undertake large and complex projects in Peru and elsewhere.
We have developed a strong corporate culture based on principles of high quality, professionalism, reliability and efficiency, as well as
compliance. We safeguard the health and safety of our collaborators and of all the persons participating in our operations and services. To that end, we
provide safe work conditions, we manage risks in a timely manner and we promote a culture of prevention, starting from the leadership and commitment
of our senior management. In 2018, we had an accident incidence rate of 0.32, calculated over 200,000 hours worked.
Our Strategies
In response to the impact of our association with Odebrecht in certain projects in Peru and the termination of the GSP pipeline concession,
we are implementing a strategic action plan, as described in “Item 5.A. Operating and Financial Review and Prospects—Operating Results—Recent
Developments.”
Our vision is to be “the most reliable engineering services company in Latin America.” Our key long-term strategies to achieve this vision
include the following:
Be the contractor of choice for large-scale and complex projects in Peru and other key Latin American markets
We intend to enhance our position as a contractor of choice for large-scale and complex infrastructure projects in Peru and other key Latin
American markets, by (i) utilizing the scale, expertise and market knowledge we have accumulated during our more than 80-year operating history to
strengthen and expand our E&C segment; (ii) maintaining and further developing our long-standing client relationships based on our ongoing pursuit of
operational excellence; (iii) continuing to strategically partner with global industry leaders, such as Bechtel and Fluor, with complementary capabilities
for specific projects that we undertake; and (iv) leveraging our expertise in the mining sector with a view to becoming the premier mining services
provider throughout Latin America.
39

Maintain highly capitalized balance sheet
We seek to maintain a prudent and sustainable capital structure and a strong financial position to allow us to capitalize on additional
business opportunities as they arise. With the renegotiation and eventual repayment of debt related to GSP, we intend to regain our financially
disciplined approach by significantly limiting our debt incurrence to identified projects with repayment sources.
Continue fostering our core corporate values throughout the organization
We will continue to instill our core corporate values throughout our organization, while also transmitting these values to surrounding
communities. We will continue to attract and develop our human capital through various training, mentorship and reward programs in order to maintain
our position as the best company in Peru to learn and work in the engineering and construction field. We also seek to promote social welfare by
fostering relationships with the communities that surround our areas of operation. We strive to promote our corporate values to strengthen our
organization and improve our performance as well as to have a positive impact on the markets where we operate.
Engineering and Construction
Our E&C segment has an 85-year track record and is one of the most well-known engineering and construction groups in Peru, undertaking
a broad range of activities relating to: engineering; civil construction; electromechanic construction and building construction. We provide E&C services
for a diverse range of end-markets, focusing on the mining, power, oil and gas, transportation, real estate and other infrastructure sectors. The following
chart sets forth our 2018 revenues by end-market.
2018 E&C Revenues by End-Market
We mainly undertake private-sector projects, particularly projects with a high degree of complexity, which enable us to develop innovative
and tailor-made solutions to our clients. We provide our clients with an integral service offering by leveraging our various areas of expertise and
engaging in virtually all aspects of project execution, thereby capturing a larger share of investment projects.
In 1999, we began adopting the “lean construction” philosophy as a pillar in our design and construction projects. “Lean construction” aims
to create value for customers by better understanding and considering clients’ needs to improve project design, functionality and cost optimization.
“Lean construction” also provides techniques and tools that significantly reduce construction waste by improving planning reliability, process design,
coordination and collaboration.
40
Although we primarily undertake engineering and construction projects in Peru, our clients often ask us to undertake the engineering and
construction of large and complex projects in other countries, such as Mexico, the Dominican Republic, Bolivia, Panama and Chile. As a result, we have
developed extensive experience executing projects throughout Latin America. To further capitalize on our capabilities and expertise, we have expanded
our activities into other key markets, such as Chile and Colombia, which have been benefitting from high levels of investment and are aligned with our
areas of strategic focus. In 2018, approximately US$160.5 million (S/.542.1 million) of our E&C revenues were derived from international projects
outside of Peru.
The acquisition of Vial y Vives – DSD has solidified our presence in Chile. While we have been undertaking projects in Chile since 1995,
such as the construction of the transmission line and crusher of the Caserones mine for SCM Minera Lumina Copiapo, we believe we will benefit from
the established and long-lasting presence in the country of both Vial y Vives and DSD Construcciones y Montajes. Moreover, through the acquisition in
December 2014 of Morelco, an engineering and construction company focused on the oil and gas and other energy sectors, we established our presence
in the Colombian market.
Given the prevalence of mining operations in our principal markets—Peru has projected investment flows of approximately US$18.7 billion
(S/.63.19 billion) between 2018 and 2021, according to the Peruvian Ministry of Energy and Mines and the Ministry of Economy and Finance—we have
significant expertise with respect to specialized engineering and construction services for the mining sector. As a result, we believe we are one of the
leading mining construction companies in Latin America and we leverage this expertise both within our principal markets as well as to selectively
undertake complex projects across the region.
The table below sets forth selected financial information for our E&C business segment.
As of and for the year ended December 31,
2016(1) 2017 2018 2018
(in millions of S/., except as indicated)
(in millions of
US$)(2)
Revenues 2,936.8 2,331.9 1,960.9 580.3
Net profit (93.4) 12.4 (85.4) (25.3)
Net profit (loss) attributable to controlling (87.7) 12.1 (86.9) (25.7)
EBITDA 19.3 120.0 19.2 5.7
EBITDA margin 0.7% 5.1% 1.0% 1.0%
Backlog (in millions of US$)(3) 1,157.6 772.5 782.6 782.6
Backlog/revenues ratio(3) 1.3x 1.1x 1.3x 1.3x
(1) For the effects on our results of operations and backlog for 2016 resulting from the termination of the GSP gas pipeline concession, see “Item 5.A.
Operating and Financial Review and Prospects—Operating Results—Recent Developments” and notes 5.1(e), 19(i),19(ii) and 16 to our audited
annual financial statements included in this annual report.
(2) Calculated based on an exchange rate of S/.3.379 to US$1.00 as of December 31, 2018.
(3) For more information on our backlog, see “—Backlog.” Backlog is calculated as of the last day of the applicable year. Revenues are calculated for
such year and converted into U.S. dollars based on the exchange rate published by the SBS on December 31 of the corresponding year.
41

Principal Engineering and Construction Activities
The following chart sets forth our 2018 revenues by E&C activity.
2018 E&C Revenues by Activities
Civil Construction
Our civil construction activities focus on infrastructure projects, including earthworks, the construction of roads, highways, transportation
facilities (e.g., mass transit systems such as the Lima Metro), dams, hydroelectric plants, water supply and sewage projects, excavation, structural
concrete construction and tunneling. Our civil construction projects are generally large and complex, requiring the use of large construction equipment
and sophisticated managerial and engineering techniques.
Electromechanic Construction
Our electromechanic construction activities include the construction and assembly of concentrator plants, pipelines, transmission lines, gas
and oil networks, and substations, predominantly for energy projects and industrial plants.
Engineering Services
Our engineering activities consist of a broad range of services relating to engineering, supervision, geometrics and environmental
consultancy, including pre-investment studies, pre-feasibility studies, process design, project development, supervision of executive designs and
construction management, including construction site reviews.
Building Construction
Through our building construction activities, we respond to the demands of the Peruvian real estate market with a focus on the construction
of hotels, affordable housing projects, residential buildings, office buildings, shopping centers, and industrial plants.
Other Services
The other services we provide include procurement services, maintenance of plants and industrial facilities and rental of construction
equipment.
42

Major Projects
We have played an active role in the development of the infrastructure sector in Peru, as well as other countries in Latin America, including
the construction of roads, hotels, hospitals, shopping centers, housing developments, concentrator plants, hydroelectric power plants, thermal power
plants and transmission lines as well as water supply and sewage projects, irrigation projects and dam building, among others. Throughout our history,
we have participated, on our own or through minority or majority interests in joint operations, in a diverse range of landmark projects, including the
following:
• in 1948, Talara city in northern Peru for the International Petroleum Company, consisting of 2,000 homes, schools, churches, a
movie theater and airport;
• in 1950, a 430 km stretch of the Panamericana Sur highway;
• in 1952, the Rebagliati hospital, the largest public hospital in Peru;
• in 1960, the Cañón del Pato hydroelectric power plant, the second largest hydroelectric plant in Peru in terms of installed capacity;
• in 1961, the Jorge Chavez International Airport, Peru’s first international airport, located in Lima;
• in 1969, the Cuajone mining project, the largest copper mine and smelter complex in the world at that time and, in 1997, the Ilo
smelter and refinery for Southern Copper Corporation;
• in 1974, the Sheraton Hotel in Lima, and, in 1995, the Sheraton Hotel in Santiago, Chile;
• in 1988, the Chavimochic irrigation project, the most significant irrigation project in Peru;
• in 1992, the Four Seasons Hotel in Mexico City, Mexico;
• in 1995, the U.S. Embassy in Peru;
• in 1998, the Mantaro-Socobaya 605 km transmission line, which connected the country’s electrical grids;
• in 2000, the Marriott Hotel in Lima;
• in 2002, began providing open pit mining services, which are ongoing, to Brocal;
• in 2004, the Ralco hydroelectric power plant in Chile;
• in 2004, the gas fractionation plant and, in 2008, its expansion for Consorcio Camisea, Camisea project, the largest energy project in
Peru’s history;
• in 2005, the San Cristobal concentrator plant in Bolivia;
• in 2005, the Cerro Verde mine concentrator plant for Phelps Dodge; in 2008, the Cerro Corona concentrator plant for GoldFields;
• in 2008, the Parque Agustino real estate development project, the first major affordable housing project in Peru, which consists of
3,400 units;
• in 2009, the Westin Lima Hotel, one of the tallest buildings in Peru;
• in 2010, the Melchorita liquefaction plant for Peru LNG, Camisea project;
• in 2010, the Bayóvar plant for Vale;
• in 2010, the Gran Teatro Nacional, the most modern theater in Peru;
• in 2011, the Pueblo Viejo Mine concentrator plant for Barrick Gold Corp. in the Dominican Republic;
• in 2011, the first stretch of Line One of the Lima Metro for the Peruvian Ministry of Transport and Communications;
43

• in 2012, for project manager Bechtel, the Antapaccay copper concentrator developed by Xstrata Copper, the world’s fourth largest
copper producer;
• in 2013, expansion of the plant for Cementos Lima, the largest cement producer in Peru;
• in 2013, the Huanza hydroelectric plant for Compañía de Minas Buenaventura;
• in 2013, the leaching pad La Quinua for the Yanacocha mine;
• in 2014, the second stretch of Line One of the Lima Metro for the Peruvian Ministry of Transport and Communications;
• in 2014, construction of a natural gas distribution network for Contugas, providing access to natural gas for five districts south of
Lima;
• in 2014, construction of the Nueva Fuerabamba city, an integral real estate development project for the population surrounding the
Las Bambas mining project;
• in 2014, construction of a concentrator plant for the Toromocho copper mine, developed by Chinalco Mining;
• in 2014, construction of a primary crusher for Mina Caserones, developed by Minera Lumina Copiapo, which is expected to have a
daily production capacity of 144,230 tonnes;
• in 2015, construction of a copper concentrator plant for the Las Bambas mining project, managed by Bechtel and developed by
Xstrata Copper;
• in 2015, expansion of the process plant for the Cerro Verde mine, one of the biggest concentrator plants in Latin America;
• in 2015, engineering, procurement and construction of Guyana Goldfields’ Aurora gold project in Guyana, with the scope of works
including a 1.75 Mt/a processing plant, power station and integration management;
• in 2015, design, engineering, procurement and construction of a new stock pile and 10,000 conveyor belts for the Escondida Mine,
managed by Bechtel;
• in 2016, engineering, procurement and construction of the 510 MW Cerro del Águila S.A. hydroelectric plant for IC Power, which is
expected to represent approximately 10% of Peru’s installed generation capacity;
• in 2016, engineering, procurement and construction of La Chira, a waste water treatment plant for the city of Lima for which we also
have the concession through a joint operation with Acciona Agua;
• in 2016, engineering, procurement and construction of a concentrator plant for the La Inmaculada silver and gold project, developed
by Hochschild Mining. This project is expected to have a daily processing capacity of 3,500 tonnes;
• in 2016, construction of an Open Plaza shopping center in the city of Huancayo, province of Junin;
• in 2016, construction of civil works and electromechanical assembly of the combined cycle power plant in the Kelar combined cycle
thermoelectric plant located in Mejillones, Antofagasta Region, Chile;
• in 2017, prefabrication of certain products for the modernization of the Talara refinery in Peru;
• in 2017, electromechanical assembly of certain infrastructure in connection with the Cuajone mine improvement project in Peru;
• in 2017, various urban and industrial projects in the Lurin district of Lima, Peru, including moving earth for a road platform, a
secondary network for potable waters and sewage, and electrical distribution networks;
• in 2017, construction of a 20-story residential building on the Pezet Avenue of Lima;
44
• in 2017, construction of a pavillion at the Universidad del Pacifico, Peru;
• in 2017, construction of a multi-use hall at the Universidad ESAN in Peru;
• in 2018, construction and rehabilitation of an expressway known as Línea Amarilla for Vinci;
• in 2018, construction and design of the Talbot project, a luxury business complex consisting of offices and a hotel with
state-of-the-art technology in Lima; and
• in 2018, execution of civil works and assembly of structures for the wet area of the Toquepala mine in Southern Peru.
We currently have a diversified portfolio of ongoing projects, on our own or through majority or minority interests in joint operations, in a
wide range of sectors in Peru and the other countries where we operate, including the following:
• assembly of equipment and installation of pipelines, electricity and instrumentation for the wet area of Toquepala mine’s unit
expansion, which is scheduled to be completed in May 2019;
• execution of civil works in the Quellaveco mine for AngloAmerican, which is scheduled to be completed in July 2019;
• execution of complementary works for the auxiliary units of the Talara refinery for Cobra Perú (three contracts), which is scheduled
to be completed during the second half of 2020;
• expansion works in the Aceros Arequipa plant for Aceros Arequipa Corporation, which is scheduled to be completed in August
2019; and
• execution of electromechanical and civil works in the construction of the Mina Justa mine for Marcobre, which is scheduled to be
completed in May 2020.
Clients
We believe that we have developed long-term relationships with many clients as a result of our performance over the years and are focused
on the successful and on-time execution of complex projects, through our “deliver before deadline” and “lean construction” initiatives. Our extensive
experience of operational excellence has allowed us to gain deep market knowledge and expertise, which help us better serve our clients. The principal
clients of our E&C segment include renowned domestic and multinational mining, power, oil and gas, transportation and infrastructure development
companies, such as AngloAmerican, Southern Peru, Cobra Perú, Marcobre and Corporación Aceros Arequipa, Compañía Minera TECK Quebrada
Blanca S.A., Minera Spence S.A., ENAP Refinerías and Minera Escondida LTDA, among others.
Project Selection and Bidding
We win new engineering and construction contracts through private and public bidding processes or direct negotiation, from a variety of
sources, including potential client requests, proposals from existing or former clients, opportunities sought by our commercial team and from requests
by the Peruvian government. Approximately 82.5% of our 2018 revenues came from private-sector contracts. The Peruvian government and its agencies
typically award construction contracts through a public bidding process conducted in accordance with the Peruvian State Contracting Law (Ley de
Contrataciones del Estado). In the private sector, in addition to obtaining new projects, another important source of revenue involves increases in the
scope of work to be performed in connection with already existing projects. These arrangements are typically negotiated directly with the client, often
during the course of the work we are already performing for that client.
We have a designated team that oversees the management of project proposals and a commercial team that reviews and evaluates potential
projects in order to estimate costs. In considering whether to bid for a potential project, we principally consider the following factors: competition and
the probability of being awarded the project; project size; the client; our experience undertaking similar projects; and the availability of resources,
including human resources. As part of the project selection process, our commercial team performs a detailed cost analysis utilizing sophisticated
software we developed to assist in determining whether the project is viable and cost-effective. If we choose to pursue a project, a budget leader is
assigned to prepare the offer that is eventually presented to our potential client.
45

Despite the budgeting risks generally associated with engineering and construction contracts, our management believes that our experience
generally allows us to estimate our project costs accurately. Our project management teams also periodically review project budgets for inconsistencies
between budgeted and actual costs in order to recover for cost variations through contract renegotiation. Budgeting risks are also mitigated through
advance payments. Considering that we receive advance payments for most of our E&C contracts, our E&C projects typically do not require significant
working capital investment. Our E&C segment secures financing primarily to purchase machinery and equipment for our construction services.
We are required, in the majority of our construction contracts, to provide a performance bond to guarantee project performance and
completion, which remain in effect for the contract’s duration. We are also required to provide performance bonds to secure any advance payments
provided to us by our clients. These bonds are periodically reduced during the project’s execution in accordance with project advancement. After the
expiration of the contract term, we are typically required to provide an additional performance bond that remains valid for one year.
Contracts
We principally enter into four types of engineering and construction contracts:
• Cost-plus fee contracts. The contract price is based upon actual costs incurred for time and materials plus a fee, which may be a
percentage of the costs incurred or a pre-determined fee. Sometimes, cost-plus fee contracts include a target price, and a contractual
arrangement that determines our responsibility in the event the total cost of the project exceeds the target price or the benefit we
receive if the total contract price results in cost savings. Cost-plus fee contracts tend to involve the least budgeting risk for us.
• Unit price contracts. The contract price is based upon a price per unit (i.e., variable quantities of work priced at defined unit rates).
Each line item of the project budget, such as cubic meter of earth excavated or cubic meter of concrete poured, has a defined price,
but the quantities of the units may vary. Our bid price reflects our estimate of the costs that we expect to incur for each work unit.
These contracts typically include an “escalation” clause which is essentially an adjustment mechanism to account for Peruvian
inflation.
• Lump-sum contracts. The contract price is fixed. Our bid is meant to cover all costs and include a profit. The principal risk in these
types of contracts are errors in calculating our costs, including those of raw materials; miscalculation of the number of units or
workers needed to complete the project; unanticipated technical complexities; or other unexpected events or circumstances that may
increase our costs.
• Engineering, procurement and construction (EPC) contracts. EPC contracts, known as “single source” or “turn-key” contracts, are
also lump-sum contracts. Pursuant to EPC contracts, we provide a broad range of basic and detailed engineering services, including
preparation of the technical project specifications, detailed drawings and construction specifications; technical studies; and
identification of lists of materials and equipment necessary for the project. These contracts, which we utilize predominantly for our
mining contracts, require a high-level of expertise and generally involve the most budgetary risks for us.
For further information, see “Item 5.A. Operating and Financial Review and Prospects—Operating Results—Results of Operations.”
Raw Materials
The principal inputs we use in our E&C segment are, among others, fuel, cement and steel. These and the other products we require in our
E&C segment may be subject to the availability of raw materials, such as oil and iron, and commodity pricing fluctuations, which we monitor on a
regular basis. We typically aim to enter into master supply agreements for a period of six months to one year. Although we obtain the majority of our
inputs needs in Peru, we believe we have access to numerous global supply sources. The availability of these inputs, however, may vary significantly
from year to year due to various factors including client demand, producer capacity, market conditions, transport costs and specific material shortages,
and we may incur additional costs in obtaining them.
We purchase and lease the equipment we require for our E&C segment business from several local and international suppliers, currently
with no significant concentration with any particular suppliers. While we do not have difficulty obtaining the equipment we need, we may face
difficulties finding skilled personnel who are able to operate certain equipment and machinery.
46

Competition
We generally compete with some of the largest contractors in Peru and the other countries where we operate. Because the E&C sector is
highly competitive, the markets served by our business generally require substantial resources and highly-skilled and experienced technical personnel.
The principal competitors of our E&C segment include local companies such as Besalco S.A., Cosapi S.A., San Martín Contratistas Generales,
ICCGSA, JJC Contratistas Generales S.A., and international companies such as Techint S.A.C., SSK Montajes e Instalaciones S.A.C., Skanska del Perú
S.A., Mota-Engil Peru S.A., Salfacorp S.A., OHL, Acciona, Astaldi, Grupo FCC, Ismocol, Termotecnica, Masa, Thiess, Redpath, among others. For
certain projects, due to the size of the project, expertise required and other factors, we may choose to partner with our competitors, including the
aforementioned companies.
Competition for our E&C segment is driven by performance, skill and project execution capabilities for completing complex projects in a
safe, timely and cost-efficient manner, as well as price.
Infrastructure
We are an important toll road concessionaire in Peru, operating three toll roads. Moreover, we are the concessionaire for the Lima Metro,
the largest mass-transit rail system in Peru, and a waste water treatment plant. Additionally, we operate ten multiple fuel storage facilities, four
producing oil fields under long-term government contracts and we own a gas processing plant. Also, we provide services to maintain and operate
different infrastructure projects.
The table below sets forth selected financial information for our Infrastructure business segment.
As of and for the year ended December 31,
2016 2017 2018 2018
(in millions of S/., except as
indicated)
(in millions of
US$)(1)
Revenues 1,174.8 1,447.9 1,883.3 557.3
Net profit 98.3 129.3 184.0 54.5
Net profit attributable to controlling 74.4 103.8 152.3 45.1
EBITDA 237.8 300.9 411.5 121.8
EBITDA margin 20.2% 20.8% 21.8% 21.8%
Backlog (in millions of US$)(2) 519.0 544.8 520.8 520.8
Backlog/revenues ratio(2) 1.5x 1.2x 0.9x 0.9x
(1) Calculated based on an exchange rate of S/.3.379 to US$1.00 as of December 31, 2018.
(2) For more information on our backlog, see “—Backlog.” Does not include our Norvial toll road concession or our Energy line of business and our
jointly. Backlog is calculated as of the last day of the applicable year. Revenues are calculated for such year and converted into U.S. dollars based
on the exchange rate published by the SBS on December 31 of the corresponding year. Includes revenues only for businesses included in backlog.
Our strategy is to pursue concessions with the potential to generate business opportunities across our organization. Once we obtain a
concession, our goal is to be involved virtually in all aspects of project execution through the participation of our different business segments, from the
design and construction to the operation and maintenance of the infrastructure asset.
Through our Infrastructure segment we participate in a number of joint operations with the objective of bidding for government concessions
or other long-term contracts. When bidding, we occasionally look for partners to reduce our risks and achieve the level of expertise needed to meet the
demands of each particular project.
The following table shows selected information about our current concessions and long-term contracts as of December 31, 2018.
Project
Year
Granted
Initiated
Operations Expiration Characteristics
% Owned
by Us Status
Toll Roads:
Norvial(1) 2003 2003 2028 183 km 67.0% Operating
Survial 2007 2008 2032 750 km 99.9% Operating
Canchaque 2006 2010 2025 78 km 99.9% Operating
Mass Transit:
Lima Metro 2011 2012 2041 33.1 km 75.0% Operating
47

Project
Year
Granted
Initiated
Operations Expiration Characteristics
% Owned
by Us Status
Water Treatment:
La Chira
2010
June
2016 2037
Avg. treatment capacity of 6.3 m3/sec
(expected) 50.0% Operating
Energy:
Oil Production (2)
Block I 1995 1995 2021 Avg. daily production of 727 bbl (2018) 100.0% Operating
Block V 1993 1993 2023 Avg. daily production of 107 bbl (2018) 100.0% Operating
Block III 2015 2015 2045 Avg. daily production of 712 bbl (2018) 100.0% Operating
Block IV
2015 2015 2045
Avg. daily production of 1,898 bbl
(2018) 100.0% Operating
Gas Processing(3)
2006 2006 N/A
Avg. daily processing capacity of 44
MMcf (2018) 100.0% Operating
North and Central Fuel Terminals
2014 2014 2034
Aggregate storage capacity of 2.2
MMbbl 50.0% Operating
South Fuel Terminals
1997 1998
August
2019
Aggregate storage capacity of 1.4
MMbbl 50.0% Operating
(1) In June 2018, the company transferred economic rights over 48.8% of the share capital of Norvial to Inversiones en Autopistas S.A. by
transferring its Class B shares. Our company continues to possess 67% of voting rights of Norvial and an economic interest of 18.2% of Norvial’s
share capital. JJC Contratistas Generales S.A. owns the remaining 33.0%.
(2) Percentages owned in Energy reflect GMP’s ownership. We own 95% of GMP.
(3) We own a gas processing plant and have a long-term delivery and gas processing contract with Enel Generación Piura S.A.
Additionally, the Chavimochic concession was awarded in 2013 for the design, construction, operation and maintenance of major hydraulic
works in northern Peru. Affiliates of Odebrecht own 73.5% of the Chavimochic consortium, with the remaining 26.5% stake held by us. The second
phase of the hydraulic works project has not begun as a result of the government’s failure to deliver the required lands for the project. Chavimochic is
currently in discussions with the government in relation to the future of the project.
On November 11, 2013, we entered into a memorandum of understanding with Canada Pension Plan Investment Board (“CPPIB”), to create
an alliance regarding a partnership to invest in infrastructure projects in Latin America, mainly Peru, Chile and Colombia. This alliance is non-exclusive
and investments will be determined on a case-by-case basis. In December 2014, we undertook our first large investment with CPPIB, by formalizing an
agreement with Enagás (as defined below) and CPPIB whereby we acquired 51% of Tecgas and owner of 100% of the shares of COGA, the current
operator of TGP, while Enagás acquired 30% and CPPIB maintained 19% of the participation. COGA is dedicated to the management, operation,
maintenance, and integrity management of transport and distribution hydrocarbon pipelines and installations as well as industrial plants and ancillary
installations. COGA operates and maintains more than 1,430km of pipelines, one compression plant with 72,000 horse power and four pump stations
with 19,200 horse power each. COGA operates two pipelines: one which is 730 km and transports natural gas (GN) with a 1,275 MM cubic feet per day
capacity; and the other one which is 530 km and transports natural gas liquids (NGL) with a 130,000 barrels per day capacity. Both pipelines run from
Cusco to Ayacucho and Huancavelica, with the GN pipeline extending to Lurin and the NGL pipeline continuing to the Pisco fractionation plant. As this
is a joint operation, we do not include the results of our COGA venture in our consolidated results under our Infrastructure segment. On April 24, 2017,
we sold our interest in COGA.
On September 29, 2015, we entered into a memorandum of understanding with Odebrecht Latinvest to participate with a 20% stake in the
shareholder equity of Concesionaria Gasoducto Sur Peruano S.A., for an amount of US$215 million (S/.722.4 million). On November 2, 2015, we
acquired this 20% stake in GSP through a capital increase. The other shareholders are Odebrecht Latinvest with a 55% stake and Enagás with a 25%
stake. Concesionaria Gasoducto Sur Peruano S.A. was responsible for the design, financing,
48
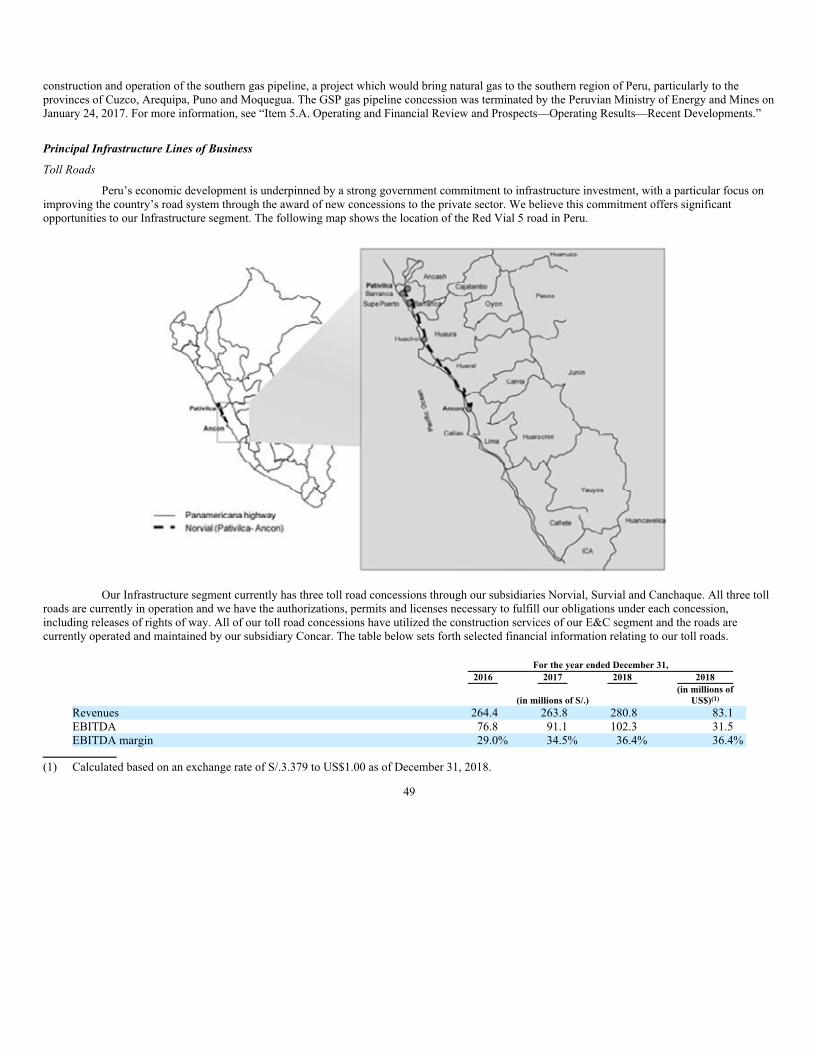
construction and operation of the southern gas pipeline, a project which would bring natural gas to the southern region of Peru, particularly to the
provinces of Cuzco, Arequipa, Puno and Moquegua. The GSP gas pipeline concession was terminated by the Peruvian Ministry of Energy and Mines on
January 24, 2017. For more information, see “Item 5.A. Operating and Financial Review and Prospects—Operating Results—Recent Developments.”
Principal Infrastructure Lines of Business
Toll Roads
Peru’s economic development is underpinned by a strong government commitment to infrastructure investment, with a particular focus on
improving the country’s road system through the award of new concessions to the private sector. We believe this commitment offers significant
opportunities to our Infrastructure segment. The following map shows the location of the Red Vial 5 road in Peru.
Our Infrastructure segment currently has three toll road concessions through our subsidiaries Norvial, Survial and Canchaque. All three toll
roads are currently in operation and we have the authorizations, permits and licenses necessary to fulfill our obligations under each concession,
including releases of rights of way. All of our toll road concessions have utilized the construction services of our E&C segment and the roads are
currently operated and maintained by our subsidiary Concar. The table below sets forth selected financial information relating to our toll roads.
For the year ended December 31,
2016 2017 2018 2018
(in millions of S/.)
(in millions of
US$)(1)
Revenues 264.4 263.8 280.8 83.1
EBITDA 76.8 91.1 102.3 31.5
EBITDA margin 29.0% 34.5% 36.4% 36.4%
(1) Calculated based on an exchange rate of S/.3.379 to US$1.00 as of December 31, 2018.
49

The charts below set forth the breakdown of our revenues and EBITDA from our toll road concessions for 2018.
Norvial
Under our Norvial concession, we operate and maintain part of the only major highway that connects Lima to the northwest of Peru. This
183-km road, known as Red Vial 5, runs from the cities of Ancón to Pativilca and has three toll stations. The concession was awarded to Norvial in
2003 for a 25-year term. In June 2018, the company transferred economic rights over 48.8% of the share capital of Norvial to Inversiones en Autopistas
S.A. by transferring its Class B shares. Our company continues to possess 67% of voting rights of Norvial and an economic interest of 18.2% of
Norvial’s share capital. JJC Contratistas Generales S.A. owns the remaining 33.0%.
Norvial’s revenue derives from the collection of tolls. For the Norvial toll road, the toll rate is set out in the Norvial concession agreement
and adjusted in accordance with a contractual formula that takes into account the sol/U.S. dollar exchange rate and Peruvian and U.S. inflation. We are
required to transfer 5.5% of our monthly toll revenue to the Peruvian Ministry of Transport and Communications and pay a 1% regulatory fee to the
Peruvian Supervisory Agency for Investment in Public Transportation Infrastructure.
Our obligations under the concession include expanding the already existing road by, among other things, adding two additional lanes. The
first stage of construction was completed in 2008, and the second stage commenced in the second quarter of 2014 and is expected to be completed by
October 2019. We estimate that our capital investment for the second stage will be approximately US$95 million (S/.319.2 million).
Unlike other toll roads in Peru, Norvial charges toll fees in both directions. Our road is highly transited both by heavy vehicles, primarily for
the purpose of transporting goods, and also by passenger vehicles, which typically use the road to access tourist destinations. The following table sets
forth average daily traffic volume and average toll fees charged for vehicle equivalents in respect to the Norvial toll road concession for 2016, 2017 and
2018.
For the year ended December 31,
2016 2017 2018
Average daily traffic by vehicle equivalents(1)24.140 24.965 26.095
Average toll fee charged for vehicle equivalents (in S/.) 14.3 14.76 15.22
(1) Each automobile is counted as one equivalent vehicle and commercial vehicles (such as trucks or buses) represent the number of equivalent
vehicles equal to the ratio between the toll rate applicable to commercial vehicles and that which is applicable to one automobile.
The table below sets forth selected financial information relating to Norvial.
For the year ended December 31,
2016 2017 2018 2018
(in millions of S/.)
(in millions of
US$)(1)
Revenues 216.3 149.5 163.1 48.3
Net profit 47.3 49.4 17.2 5.1
EBITDA 77.7 81.4 87.8 26.0
EBITDA margin 35.9% 54.5% 53.8% 53.8%
(1) Calculated based on an exchange rate of S/.3.379 to US$1.00 as of December 31, 2018.
50

Survial
Under our Survial concession, we operate and maintain a 750 km road from the San Juan de Marcona port to Urcos, Peru, which is
connected to an interoceanic road that runs up to the Peruvian-Brazilian border. The road has five toll stations and three weigh stations. The concession
was awarded to Survial in 2007 for a 25-year term. We own 99.9% of Survial. The following map shows the location of the road in Peru.
Our obligations under the concession include the construction of the road, which was completed in 2010.
Our revenue from this concession consists of an annual fee paid to Survial by the Peruvian Ministry of Transport and Communications in
consideration for the operation and maintenance of the road, which fee can vary depending on the amount of maintenance required due to road damages.
In 2016, 2017 and 2018 the fee amounted to US$8.1 million (S/.27.2 million), US$28.4 million (S/.92.2 million) and US$8.4 million (S/.28.3 million),
respectively. Our revenue in this concession does not depend on traffic volume.
Additional revenues of the concession are generated from the execution of additional works, work we perform as a result of catastrophic
events and emergency maintenance. These revenues are billed when approval is received from the grantor and/or the regulator of the work in progress.
In 2016, 2017 and 2018, the additional revenues amounted to US$0.6 million (S/.2.2 million), US$0.04 million (S/.0.1 million) and US$15.8 million
(S/.53.6 million), respectively.
Canchaque
Under our Canchaque concession, we operate and maintain a 78 km road from the towns of Buenos Aires to Canchaque, in Peru. The road
has one toll station. The concession was awarded to Canchaque in 2006 for a 15- year term. We own 99.9% of Canchaque. Our obligations under the
concession include the construction of the road, which was completed in 2009. Our revenue from this concession consists of an annual fee paid by the
Peruvian Ministry of Transport and Communications in consideration for the operation and maintenance of the road, which fee can vary depending on
the amount of road maintenance required due to road wear and tear. In 2016, 2017 and 2018, the fee amounted to US$2.5 million (S/.8.4 million),
US$5.1 million (S/.16.5 million) and US$7.7 million (S/.26.1 million), respectively. Our revenue in this concession does not depend on traffic volume.
The significant variation in 2018 was due to an additional disbursement by the Ministry of Transport and Communications of
US$5.4 million for maintenance.
Additional revenues of the concession are generated from the execution of additional works, work we perform as a result of catastrophic
events and emergency maintenance. These revenues are billed when approval is received from the grantor and/or the regulator of the work in progress.
In 2016, 2017 and 2018, the additional revenues amounted to US$0.09 million (S/.0.30 million), US$0.32 million (S/.1.0 million) and US$1.7 million
(S/.6.0 million), respectively.
51

Additional Toll Road Projects
We continuously evaluate infrastructure projects and strategically present public-private partnership proposals and participate in bidding
processes for road concessions. In 2012 we were awarded, and in 2013 we signed the contract for, a 40-year concession for the 4.6 km Vía Expresa Sur,
one of the main roads in Lima, which crosses the city from north to south. The road will connect downtown Lima to Panamericana Sur, a highway that
runs from Ecuador to Chile. Our estimate of the total investment under the concession, as submitted in our bid, is approximately US$200 million (S/.672
million). Such investment will be made during the construction phase, which was originally to be completed in 2018. Our revenue will derive from the
collection of a toll fee upon completion of the construction. The concession is expected to generate a minimum annual revenue of US$18 million
(S/.60.5 million) during the first two years of the concession term, US$19.6 million (S/.65.9 million) for the third year. If in a particular year, our annual
revenue is lower than the minimum guaranteed, we expect the government to compensate us for the difference, up to an amount not to exceed
US$10 million (S/.33.6 million). The beginning of the construction phase is subject to expropriation by the government of the land necessary for the
construction of the road. Moreover, in June of 2017, we signed Initial and Additional Acts of Suspension of the Concession with the Municipality of
Lima to freeze the responsibilities of the government, on the one hand, and the concessionaire, on the other hand, with respect to the concession until
June 2019. The concessionaire continues to act as custodian of certain assets of which it had taken possession and continues to maintain certain
performance guaranties in connection with the concession. The government and the concessionaire have agreed to meet and coordinate aspects of the
project, with the goal of resuming operations. However, with respect to the concession for Via Expresa Sur, we recently received a letter from the
Municipality of Lima in which the Municipality communicated its desire to cease discussions to relaunch the project. We cannot assure you that this
concession contract will be resumed.
A joint operation in which we have a 50% interest has been awarded, and is in the process of negotiating the terms for, a 37-year concession
for Via Expresa Javier Prado, a 20 km toll road that crosses Lima from east to west, traversing through eight districts. According to estimates from the
Municipality of Lima, the total investment in the concession is expected to amount to approximately US$700 million (S/.2,352 million). Such
investment will be made during the construction phase which is expected to take between five to seven years. Our revenue will derive from the
collection of a toll fee upon completion of the construction. This concession was awarded to the joint operation at the end of the 1990s and negotiations
were discontinued but were resumed in 2012. A project contract was approved by the City of Lima’s Council in November 2013 and was submitted to
the Peruvian Ministry of Economy and Finance, which requested additional studies prior to approving the project. Subsequently, on July 26, 2017, the
Municipality of Lima signed an agreement that annulled the granting of the concession. Our company has initiated legal action in Peru against such
decision, and the Municipality of Lima responded, but a decision remains pending. A preliminary injunction is pending that would prevent the
Municipality of Lima from granting the concession to another party. We cannot assure you that our position in these proceedings will prevail, nor can
we assure you if or when the concession contracts will be agreed or whether the contractual terms will be favorable to us.
These projects are not included in our backlog. See “Item 3.D. Key Information—Risk Factors—Risks Related to our Infrastructure
Business.”
Mass Transit
In 2011, we were awarded a 30-year concession for the operation of Line One of the Lima Metro, Peru’s only urban railway system. The
concession was awarded to our subsidiary GyM Ferrovías, in which we hold a 75% ownership interest, with the other 25% being held by Ferrovías
S.A.C. Our obligations under the contract include: (i) the operation and maintenance of the five trains provided by the government; (ii) the acquisition of
19 new trains on behalf of the Peruvian government, which will be the legal owner of such trains; (iii) the operation and maintenance of the 19 new
trains (24 trains in the aggregate); and (iv) the design and construction of the railway maintenance and repair yard, which was built by our E&C
segment. We currently have all 24 trains (including two backup trains) in operation. The construction of the second stretch of Line One was completed
in July 2014, and started operations on July 25, 2014.
We entered into the fourth addendum to the Lima Metro concession contract on July 11, 2016, in order to expand the transportation capacity
of Line One. In accordance with the fourth addendum, the expansion project involves: (i) the purchase of 20 new trains with five-car from Alstom;
(ii) the purchase of 39 new cars from Alstom, to be coupled with the 19 existing Alstom trains and the 20 new Alstom trains, resulting in a consolidated
fleet of 39 Alstom trains with a six-car configuration; and (iii) the expansion and improvement of the existing infrastructure, including revamping and
improvement of five stations, improvements in the electrical systems, a new access route to the maintenance workshop and new switches on the main
track. The construction of the expansion of the infrastructure will be carried out by our E&C segment and it is scheduled to be completed by the end of
2018 with the additional trains and rail cars to be delivered by the end of 2019.
As compensation for the investments of the expansion project, we are entitled to receive from the Ministry of Transportation and
Communication, an advance payment of 30% of each investment component as well as the balance of 70% of each investment component compensated
through an annual payment for complementary investments (pago annual por inversiones complementarias), which represents the unconditional and
irrevocable right to receive a series of 56 quarterly payments from the Ministry of Transportation and Communication. In 2016 we received the advance
payment of the trains and cars, and in the third quarter of 2017 we received the advance payment corresponding to the infrastructure expansion.
52
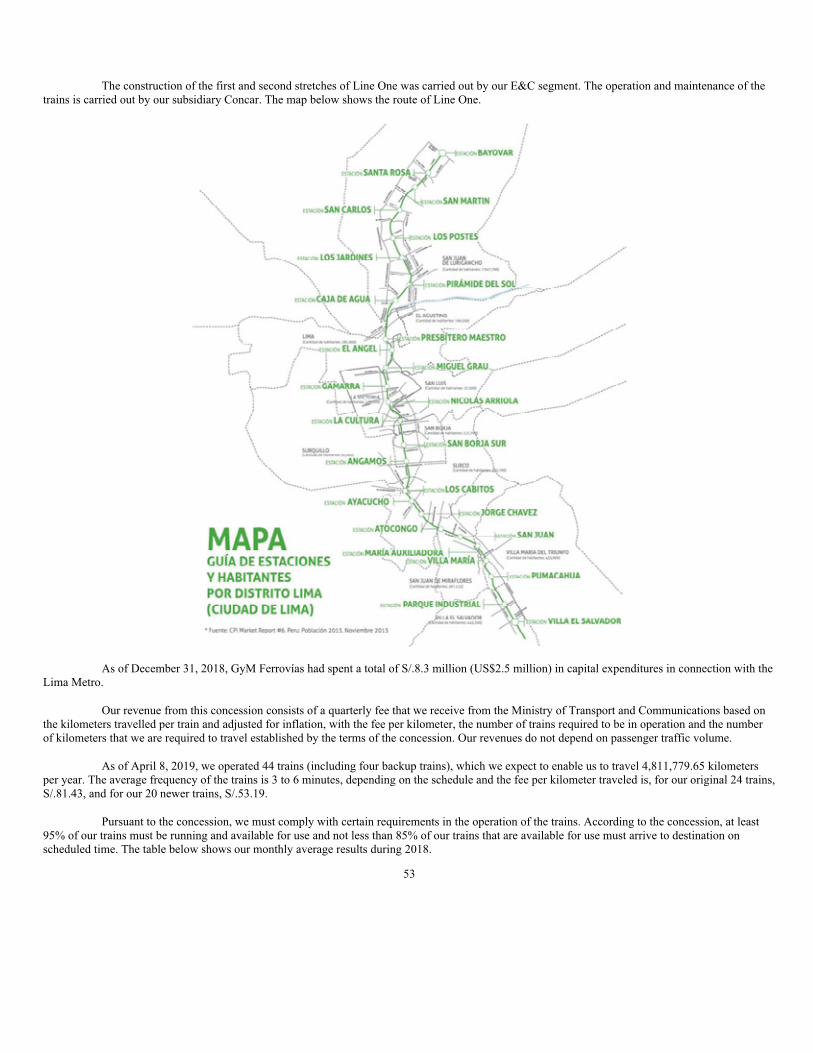
The construction of the first and second stretches of Line One was carried out by our E&C segment. The operation and maintenance of the
trains is carried out by our subsidiary Concar. The map below shows the route of Line One.
As of December 31, 2018, GyM Ferrovías had spent a total of S/.8.3 million (US$2.5 million) in capital expenditures in connection with the
Lima Metro.
Our revenue from this concession consists of a quarterly fee that we receive from the Ministry of Transport and Communications based on
the kilometers travelled per train and adjusted for inflation, with the fee per kilometer, the number of trains required to be in operation and the number
of kilometers that we are required to travel established by the terms of the concession. Our revenues do not depend on passenger traffic volume.
As of April 8, 2019, we operated 44 trains (including four backup trains), which we expect to enable us to travel 4,811,779.65 kilometers
per year. The average frequency of the trains is 3 to 6 minutes, depending on the schedule and the fee per kilometer traveled is, for our original 24 trains,
S/.81.43, and for our 20 newer trains, S/.53.19.
Pursuant to the concession, we must comply with certain requirements in the operation of the trains. According to the concession, at least
95% of our trains must be running and available for use and not less than 85% of our trains that are available for use must arrive to destination on
scheduled time. The table below shows our monthly average results during 2018.
53
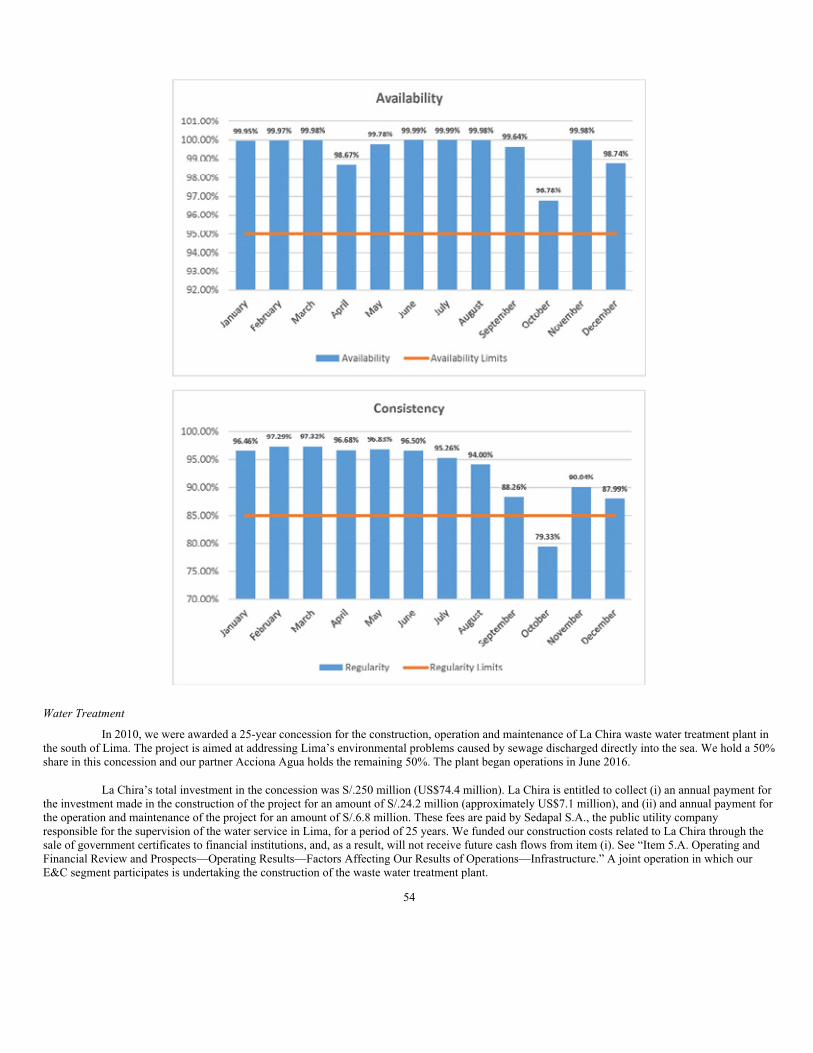
Water Treatment
In 2010, we were awarded a 25-year concession for the construction, operation and maintenance of La Chira waste water treatment plant in
the south of Lima. The project is aimed at addressing Lima’s environmental problems caused by sewage discharged directly into the sea. We hold a 50%
share in this concession and our partner Acciona Agua holds the remaining 50%. The plant began operations in June 2016.
La Chira’s total investment in the concession was S/.250 million (US$74.4 million). La Chira is entitled to collect (i) an annual payment for
the investment made in the construction of the project for an amount of S/.24.2 million (approximately US$7.1 million), and (ii) and annual payment for
the operation and maintenance of the project for an amount of S/.6.8 million. These fees are paid by Sedapal S.A., the public utility company
responsible for the supervision of the water service in Lima, for a period of 25 years. We funded our construction costs related to La Chira through the
sale of government certificates to financial institutions, and, as a result, will not receive future cash flows from item (i). See “Item 5.A. Operating and
Financial Review and Prospects—Operating Results—Factors Affecting Our Results of Operations—Infrastructure.” A joint operation in which our
E&C segment participates is undertaking the construction of the waste water treatment plant.
54

Energy
We currently operate three energy businesses within our Infrastructure segment: Exploration and Production; Natural Gas; and Transport
and Distribution. We operate and extract oil from four onshore fields (Block I, Block III, Block IV and Block V) located in the provinces of Talara and
Paita in northern Peru. We have two long-term hydrocarbon extraction service contracts with Perupetro, the Peruvian entity responsible for the
administration and supervision of all exploration and production contracts in Peru, under which we operate two oil producing fields, Blocks I and V. In
addition, we have two long-term license contracts with Perupetro, a state-owned oil and gas company, for two other blocks, Block III and IV, which
started operations in April 2015; oil production from these blocks is sold to Petroperú. During 2018, the oil production of our four blocks was
approximately 3,654 bbl per day. We also own and operate a natural gas processing plant located in northern Peru, which processes and fractions natural
gas liquids and delivers dry gas to a gas-fired power generation company under a long-term processing and fractionation agreement. In addition, we are
a 50% partner in two consortiums named Consorcio Terminales (CT) and Terminales del Peru (TP) both of which have contract with Petroperú, to
operate and maintain ten fuel storage terminals.
In addition, we are a 50% partner in Oil Tanking Andina Services S.A.C. (“OTAS”). This subsidiary operates a fuel terminal named
Terminal Marino Pisco Camisea under a contract subscribed with Pluspetrol to operate an export terminal for gasoline, diesel, propane and butane.
Additionally, through OTAS, we are also a 25% partner in Logística Químicos del Sur S.A. (“LQS”), which operates the Terminal de Químicos de
Matarani and which dispatched 53,656 tonnes of sodium hydrosulfide for international mining companies in 2018.
The table below sets forth selected financial information relating to our Energy line of business.
For the year ended December 31,
2016 2017 2018 2018
(in millions of S/.)
(in millions of
US$)(1)
Revenues 382.2 436.9 560.5 165.9
Net Profit 12.0 38.1 65.0 19.2
EBITDA 99.5 142.1 178.9 52.9
EBITDA margin 26.0% 32.5% 31.9% 31.9%
(1) Calculated based on an exchange rate of S/.3.379 to US$1.00 as of December 31, 2018.
The pie charts below set forth the breakdown of our revenues and EBITDA from our Energy line of business for 2018.
Oil and Gas Production
We operate and extract oil from four mature fields (Blocks I, III, IV and V) located in the provinces of Talara and Paita in northern
Peru. Two of these fields, Blocks I and V, are operated under long-term service contracts under which we provide hydrocarbon extraction services to
Perupetro. Hydrocarbons extracted from these two blocks belong to Perupetro, which in turn pays us, once a month, a variable fee per barrel of extracted
hydrocarbons. This extraction fee is based on a basket of international crude prices and the level of production. The other two fields, Blocks III and IV,
are operated under long-term license contracts with Perupetro. The hydrocarbons extracted are owned by our subsidiary GMP, which in turn pays
royalties, on a fortnightly basis, to Perupetro, based on
55
the average prices of three international crude oil prices: Fortis, Suez Blend and Oman Blend crudes. Our activities are focused on proved reserves
development and production and are conducted in mature oil fields, which have been producing oil for over 100 years in the case of Block I,
approximately 96 years in the case of Block III, approximately 95 years in the case of Block IV, and over 50 years in the case of Block V. We believe
our activities in these fields bear limited exploration risk.
The following table shows selected information about our fields.
Property Basin
GMP’s
Ownership Expiration
Developed
Acres
Undeveloped
Acres
Block I Talara 100% 2021 25,154 4,110
Block III Talara 100% 2045 7,475 80,986
Block IV Talara 100% 2045 8,400 64,550
Block V Talara 100% 2023 6,320 2,220
Block I:
We operate and extract oil and natural gas from Block I under a 20-year hydrocarbon extraction service contract with Perupetro, which was
extended for an additional 10-year term and expires in December 2021. Average daily production during 2018 was 720 barrels of crude oil. We operate
212 wells using various oil extraction systems and operate a network of production batteries and pipelines to collect, measure and deliver oil in
fiscalization point close to the Talara refinery. The field is located in the province of Talara, department of Piura, in northern Peru, approximately five
miles from the Talara refinery, the second largest refinery in the country. Block I is the oldest oil producing field in Peru and has been producing oil
since around 1890.
Block III:
We operate and extract oil and natural gas from Block III under a 30-year license agreement with Perupetro, which expires in April 2045.
Average daily production during 2018 was 756 barrels of crude oil. We operate 166 wells using various oil extraction systems and operate a network of
production batteries and pipelines to collect, measure and deliver oil in a fiscalization point close to the Talara refinery, which purchases the oil
according to a contract based on an average price of three international crude oil prices: Fortis Blend, Suez Blend and Oman crudes, as adjusted by
certain factors. The field is located between the provinces of Talara and Paita, department of Piura, in northern Peru, approximately 21 miles from the
Talara refinery.
Block IV:
We operate and extract oil and natural gas from Block IV under a 30-year license agreement with Perupetro, which expires in April 2045.
Average daily production during 2018 was 2,069 barrels of crude oil. We operate 284 wells using various oil extraction systems and operate a network
of production batteries and pipelines to collect, measure and deliver oil in a fiscalization point close to the Talara refinery, which purchases the oil
according to a contract based on an average price of three international crude oil prices: Fortis Blend, Suez Blend and Oman crudes, adjusted for costs
related to hydrocarbon transportation. The field is located in the province of Talara, department of Piura, in northern Peru, approximately 21 miles from
the Talara refinery.
Block V:
We operate and extract oil and natural gas from Block V under a 20-year hydrocarbon extraction service contract with Perupetro, which was
extended for an additional 10-year term and expires in October 2023. Average daily production during 2018 in this field was 109 barrels of crude oil.
We operate 41 wells in this field using various oil extraction systems. The Block V field is located in the province of Los Órganos, department of Piura,
Peru, close to the border with Ecuador. Block V has been producing oil since the 1950s.
The map below shows the geographic location of our oil producing blocks in northern Peru.
56

For Block I and Block V, we are entitled to a variable fee paid by Perupetro, which is based on the level of production of each field and a
price formula that is based on an average price of three international crude oil prices: Fortis blend, Suez blend and Oman crudes, and a discount over
this price of approximately of 72% per barrel. For Block III and Block IV, we pay royalties to Perupetro based on an average price of three international
crude oil prices: Fortis blend, Suez blend and Oman crudes. The royalties paid to Perupetro were US$18.79 per barrel during 2017 and US$23.17 per
barrel during 2018.
During 2016, 2017 and 2018, we received an average revenue (for all blocks) of US$38.55, US$49.19 and US$52.38, respectively, per
barrel of extracted oil, which was equivalent to approximately 88.52%, 91.84% and 73.72%, respectively, of average Brent crude oil prices in the same
years. We are not committed to provide a fixed volume of oil or natural gas under our four contracts.
We produce natural gas as a byproduct of the production of crude oil (an average of 6,196 MMcf per day during 2018). In Block I, we
provide natural gas to ENEL under a “take or pay” contract (an average of 5,332 MMcf per day during 2018), and we pay to Perupetro a fee which
varies depending on market conditions. The additional volume of natural gas extracted is sent to our Pariñas plant to be processed and commercialized
as liquid natural gas. In Block V, we reinject the natural gas produced back into the wells. In Block III, we use part of the produced gas as fuel to
operate wells equipment (pumping units) and we are looking for a market to sell the excess. In Block IV, we also use a volume of gas as fuel and the
residual volume is burnt. Our revenues for the sale of natural gas are not material relative to our oil production revenues.
Estimated Proved Reserves:
The following table sets forth estimated proved crude oil and natural gas reserves in Blocks I, III, IV and V as of December 31, 2018. We
have only included estimates of proved and have not included any estimates of probable and possible reserves.
Crude Oil
(Mbbl)
Natural Gas
(MMcf)
Crude Oil
Equivalents
(MBoe)
Block I:
Proved developed producing 722 7,761 2,101
Proved developed non—producing — — —
Proved undeveloped — — —
Total proved reserves 722 7,761 2,101
Block III:
Proved developed producing 2,519 — 2,519
Proved developed non—producing 22 — 22
Proved undeveloped 11,795 — 11,795
Total proved reserves 14,337 — 14,337
Block IV:
Proved developed producing 6,365 12,008 8,499
57
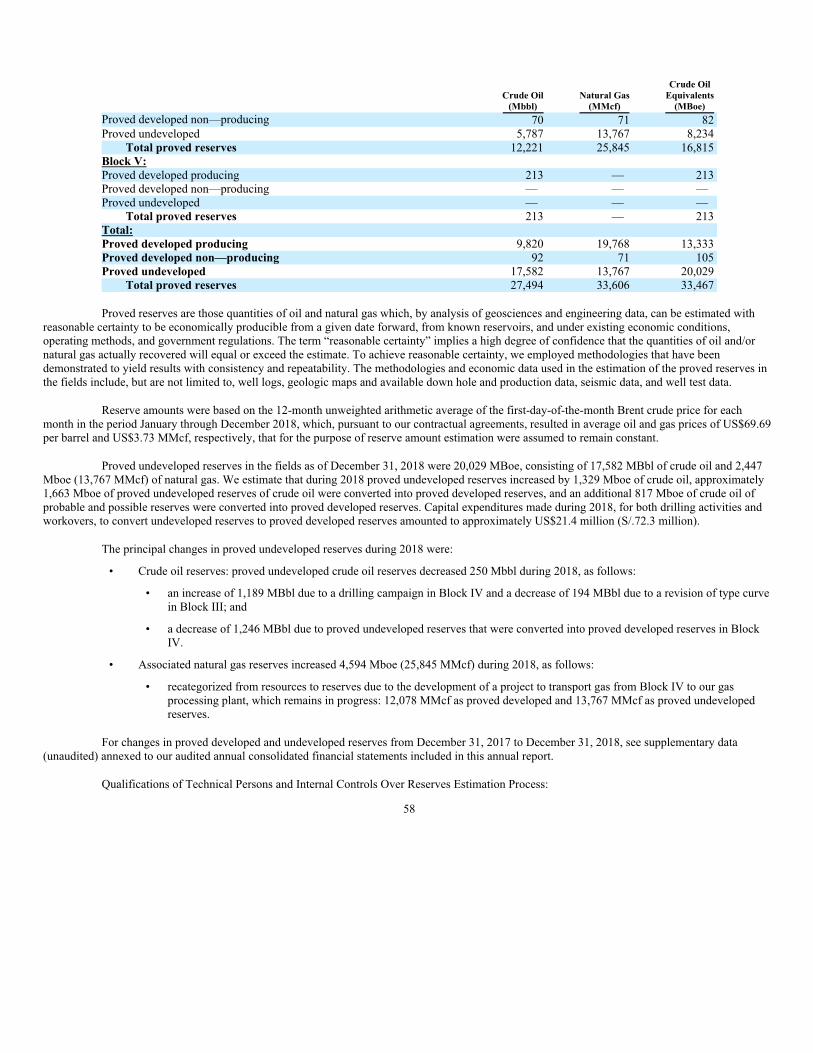
Crude Oil
(Mbbl)
Natural Gas
(MMcf)
Crude Oil
Equivalents
(MBoe)
Proved developed non—producing 70 71 82
Proved undeveloped 5,787 13,767 8,234
Total proved reserves 12,221 25,845 16,815
Block V:
Proved developed producing 213 — 213
Proved developed non—producing — — —
Proved undeveloped — — —
Total proved reserves 213 — 213
Total:
Proved developed producing 9,820 19,768 13,333
Proved developed non—producing 92 71 105
Proved undeveloped 17,582 13,767 20,029
Total proved reserves 27,494 33,606 33,467
Proved reserves are those quantities of oil and natural gas which, by analysis of geosciences and engineering data, can be estimated with
reasonable certainty to be economically producible from a given date forward, from known reservoirs, and under existing economic conditions,
operating methods, and government regulations. The term “reasonable certainty” implies a high degree of confidence that the quantities of oil and/or
natural gas actually recovered will equal or exceed the estimate. To achieve reasonable certainty, we employed methodologies that have been
demonstrated to yield results with consistency and repeatability. The methodologies and economic data used in the estimation of the proved reserves in
the fields include, but are not limited to, well logs, geologic maps and available down hole and production data, seismic data, and well test data.
Reserve amounts were based on the 12-month unweighted arithmetic average of the first-day-of-the-month Brent crude price for each
month in the period January through December 2018, which, pursuant to our contractual agreements, resulted in average oil and gas prices of US$69.69
per barrel and US$3.73 MMcf, respectively, that for the purpose of reserve amount estimation were assumed to remain constant.
Proved undeveloped reserves in the fields as of December 31, 2018 were 20,029 MBoe, consisting of 17,582 MBbl of crude oil and 2,447
Mboe (13,767 MMcf) of natural gas. We estimate that during 2018 proved undeveloped reserves increased by 1,329 Mboe of crude oil, approximately
1,663 Mboe of proved undeveloped reserves of crude oil were converted into proved developed reserves, and an additional 817 Mboe of crude oil of
probable and possible reserves were converted into proved developed reserves. Capital expenditures made during 2018, for both drilling activities and
workovers, to convert undeveloped reserves to proved developed reserves amounted to approximately US$21.4 million (S/.72.3 million).
The principal changes in proved undeveloped reserves during 2018 were:
• Crude oil reserves: proved undeveloped crude oil reserves decreased 250 Mbbl during 2018, as follows:
• an increase of 1,189 MBbl due to a drilling campaign in Block IV and a decrease of 194 MBbl due to a revision of type curve
in Block III; and
• a decrease of 1,246 MBbl due to proved undeveloped reserves that were converted into proved developed reserves in Block
IV.
• Associated natural gas reserves increased 4,594 Mboe (25,845 MMcf) during 2018, as follows:
• recategorized from resources to reserves due to the development of a project to transport gas from Block IV to our gas
processing plant, which remains in progress: 12,078 MMcf as proved developed and 13,767 MMcf as proved undeveloped
reserves.
For changes in proved developed and undeveloped reserves from December 31, 2017 to December 31, 2018, see supplementary data
(unaudited) annexed to our audited annual consolidated financial statements included in this annual report.
Qualifications of Technical Persons and Internal Controls Over Reserves Estimation Process:
58
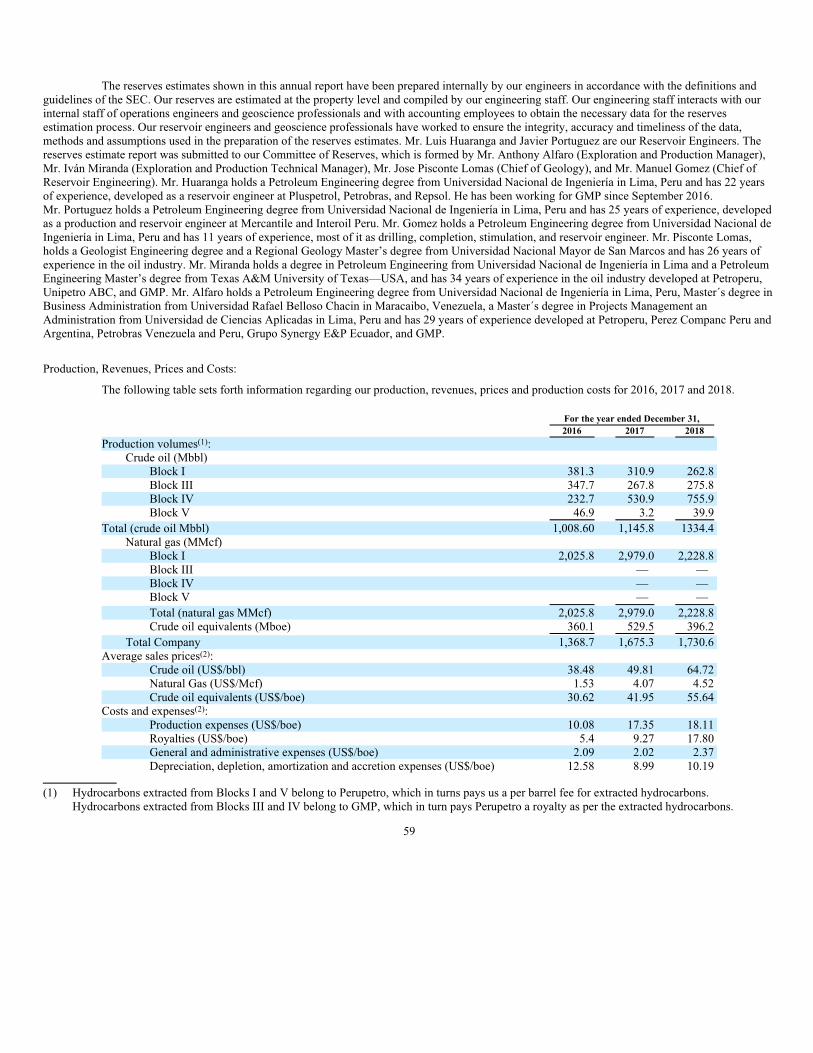
The reserves estimates shown in this annual report have been prepared internally by our engineers in accordance with the definitions and
guidelines of the SEC. Our reserves are estimated at the property level and compiled by our engineering staff. Our engineering staff interacts with our
internal staff of operations engineers and geoscience professionals and with accounting employees to obtain the necessary data for the reserves
estimation process. Our reservoir engineers and geoscience professionals have worked to ensure the integrity, accuracy and timeliness of the data,
methods and assumptions used in the preparation of the reserves estimates. Mr. Luis Huaranga and Javier Portuguez are our Reservoir Engineers. The
reserves estimate report was submitted to our Committee of Reserves, which is formed by Mr. Anthony Alfaro (Exploration and Production Manager),
Mr. Iván Miranda (Exploration and Production Technical Manager), Mr. Jose Pisconte Lomas (Chief of Geology), and Mr. Manuel Gomez (Chief of
Reservoir Engineering). Mr. Huaranga holds a Petroleum Engineering degree from Universidad Nacional de Ingeniería in Lima, Peru and has 22 years
of experience, developed as a reservoir engineer at Pluspetrol, Petrobras, and Repsol. He has been working for GMP since September 2016.
Mr. Portuguez holds a Petroleum Engineering degree from Universidad Nacional de Ingeniería in Lima, Peru and has 25 years of experience, developed
as a production and reservoir engineer at Mercantile and Interoil Peru. Mr. Gomez holds a Petroleum Engineering degree from Universidad Nacional de
Ingeniería in Lima, Peru and has 11 years of experience, most of it as drilling, completion, stimulation, and reservoir engineer. Mr. Pisconte Lomas,
holds a Geologist Engineering degree and a Regional Geology Master’s degree from Universidad Nacional Mayor de San Marcos and has 26 years of
experience in the oil industry. Mr. Miranda holds a degree in Petroleum Engineering from Universidad Nacional de Ingeniería in Lima and a Petroleum
Engineering Master’s degree from Texas A&M University of Texas—USA, and has 34 years of experience in the oil industry developed at Petroperu,
Unipetro ABC, and GMP. Mr. Alfaro holds a Petroleum Engineering degree from Universidad Nacional de Ingeniería in Lima, Peru, Master´s degree in
Business Administration from Universidad Rafael Belloso Chacin in Maracaibo, Venezuela, a Master´s degree in Projects Management an
Administration from Universidad de Ciencias Aplicadas in Lima, Peru and has 29 years of experience developed at Petroperu, Perez Companc Peru and
Argentina, Petrobras Venezuela and Peru, Grupo Synergy E&P Ecuador, and GMP.
Production, Revenues, Prices and Costs:
The following table sets forth information regarding our production, revenues, prices and production costs for 2016, 2017 and 2018.
For the year ended December 31,
2016 2017 2018
Production volumes(1):
Crude oil (Mbbl)
Block I 381.3 310.9 262.8
Block III 347.7 267.8 275.8
Block IV 232.7 530.9 755.9
Block V 46.9 3.2 39.9
Total (crude oil Mbbl) 1,008.60 1,145.8 1334.4
Natural gas (MMcf)
Block I 2,025.8 2,979.0 2,228.8
Block III — —
Block IV — —
Block V — —
Total (natural gas MMcf) 2,025.8 2,979.0 2,228.8
Crude oil equivalents (Mboe) 360.1 529.5 396.2
Total Company 1,368.7 1,675.3 1,730.6
Average sales prices(2):
Crude oil (US$/bbl) 38.48 49.81 64.72
Natural Gas (US$/Mcf) 1.53 4.07 4.52
Crude oil equivalents (US$/boe) 30.62 41.95 55.64
Costs and expenses(2):
Production expenses (US$/boe) 10.08 17.35 18.11
Royalties (US$/boe) 5.4 9.27 17.80
General and administrative expenses (US$/boe) 2.09 2.02 2.37
Depreciation, depletion, amortization and accretion expenses (US$/boe) 12.58 8.99 10.19
(1) Hydrocarbons extracted from Blocks I and V belong to Perupetro, which in turns pays us a per barrel fee for extracted hydrocarbons.
Hydrocarbons extracted from Blocks III and IV belong to GMP, which in turn pays Perupetro a royalty as per the extracted hydrocarbons.
59

(2) Crude oil sales volume differs from total production volume due to operational circumstances such as the inventory of product stored in our field
batteries at the end of each monthly measurement. “Average sales prices” refers to the fees received in consideration for our extraction services,
which do not equal the sales prices of crude oil. Average sales prices have been calculated using a basket price formula according to the service
and license contracts of each block. Such formulation is at a discount to global oil prices for Blocks I and V, and for Blocks III and IV we pay
royalties on the oil extracted. Per unit costs have been calculated using sales volumes.
Acreage, Productive and Development Wells, Drilling:
The following table sets forth certain information regarding the total developed and undeveloped acreage as of December 31, 2018.
Formation Developed Acreage Undeveloped Acreage
Block I
Pariñas 2,271 70
Mogollón 2,583 320
Basal Salina 1,850 100
Mesa 1,485 1,650
Total Block I 8,189 2,140
Block III
Salina Mogollón 7,475 3,983
Amotape 1,750 2,370
Total Block III 9,225 6,353
Block IV
Pariñas 4,155 3,402
Palegreda 5,292 3,951
Mogollón 1,470 2,606
Total Block IV 10,917 9,959
Block V
Verdún 530 650
Ostrea 175 115
Mogollón 1,350 120
Total Block V 2,055 885
Total 30,386 19,337
As of December 31, 2018, we had a total of 703 producing wells. Our wells are oil wells, many of which also produce natural gas. We do
not have interests in wells that only produce natural gas The following table shows the number of development and exploratory wells drilled during
2016, 2017 and 2018 in Blocks I, III, IV and V.
For the year ended December 31,
2016 2017 2018
Development Wells
Productive 11 22 33
Dry — — —
Total 11 22 33
Exploratory Wells
Productive — 1 —
Dry — — 1
Total — 1 1
During 2016, 2017 and 2018 we invested US$5.4 million (S/.18.1 million), US$16.5 million (S/.53.6 million) and US$20.2 (S/.68.4),
respectively, in drilling activities. During 2018, we drilled a total of 33 wells in Block IV (all of them are productive wells) and one exploratory well in
Block III (dry well).
Under the terms of our agreements with Perupetro, at the time the contract terminates, we are required to close non-producing wells that we
have drilled. As of December 31, 2018, we estimated that we will be required to close 62 wells in Block I in December 2021 and 6 wells in Block V in
October 2023, 40 wells in Block III and 50 wells in Block IV in December 2045. We have created a provision in our financial statements for the costs
relating to those well closings. See notes 5.1(d) and 18(d) to our audited annual consolidated financial statements included in this annual report.
60

Gas Processing Plant
We own a gas processing plant located 7 km north of the city of Talara in Piura, Peru. We currently have under a long-term delivery and gas
processing and fractioning contract with Enel Generación Piura (formerly known as EEPSA), according to which Enel Generación Piura delivers wet
natural gas that it purchases from onshore and offshore gas operators in the area. We then process and fraction the gas into two products: (i) dry natural
gas, which can be used as fuel in Enel Generación Piura’s gas-fired turbine; and (ii) natural gas liquids, which are sold in the Peruvian market. Under the
terms of the agreement, we are responsible for all operating costs of the gas processing plant but are also entitled to keep revenues from the sale of the
natural gas liquids to third parties after payment of a variable royalty, based on the volume of gas processed, to Enel Generación Piura. Our current gas
processing and fractionation contract with Enel Generación Piura expires in 2023.
Our gas processing plant has the capacity to process up to 44 MMcf per day. We processed 33.19 MMcf per day during 2016, 30.57 MMcf
per day during 2017 and 30.12 MMcf per day during 2018. Approximately 83% of the volume processed by our gas processing plant depends on the gas
volumes provided by Enel Generación Piura for processing and use on its gas-fired turbines. These volumes vary per month and depend upon the power
dispatch curve of Enel Generación Piura among Peruvian power generation plants. In rainy months (December to April) where hydroelectric power
generation in Peru is typically higher, gas volumes demanded by Enel Generación Piura are lower than in dryer months (May to November) in which
activity of thermal generators tends to be higher. Approximately 10% of the volume processed by our gas processing plant depends on the volumes of
gas extracted by GMP in Block I and 7% on the gas provided by CNPC, which we process and commercialize as liquid natural gas.
Fuel Storage Terminals
We are a 50% partner in Consorcio Terminales with a Peruvian affiliate of Oiltanking GmbH, one of the world’s largest operators of
independent terminals for bulk liquid storage. Consorcio Terminales had a contract with Petroperú to operate the North and South Fuel Terminals in
Peru, which expired in August 2014. In May 2014, there was a public bidding for the operation of the North, Center and South Terminals. In June 2014,
Terminales del Perú, a new consortium also integrated by our subsidiary GMP S.A. and Oiltanking Peru was awarded a concession for the operation of
the North and Central Fuel Terminals for Petroperú. The contracts have a 20-year term and consist of the operation of four terminals in the north and
one terminal in the center of the country, providing storage and dispatching bulk liquid fuel. The total amount of the committed investment for both
projects is approximately US$37.2 million (S/.125 million), while the total amount of the additional investment, which will be reimbursed, is
approximately US$186 million (S/.625 million). There was no winner in the public bidding for the operation of the South Fuel Terminals, and the
contract of Consorcio Terminales was extended through contract amendments: first, for an additional year until August 2015; subsequently, for two
more years until August 2017; in July 2017 for an additional year until August 2018; and in July 2018 for an additional year until August 2019. The
total amount of the additional investment required during the period from 2018-2019, which will be reimbursed, is approximately US$10 million
(S/.33.7 million). In November 2018, Petroperú initiated a public bidding for the operation of the South Terminals, in which we expect to participate,
that is expected to be awarded in June 2019.
Our open-access terminals offer our customers dependable and critical handling and storage services for refined petroleum liquid products,
maintaining high quality, safety and environmental standards. We provide storage, handling and loading and uploading services for a broad range of
refined petroleum liquid products, including gasoline, aircraft fuel, diesel and heavy fuel oil. We deliver the liquids into two types of transportation
systems, railroad cars and cistern trucks. Because of the strategic location of our assets, our deep-water access, inland terminals and our aggregate
storage capacity of 2.5 MMbbl in the North and Central Terminals and of 1.6 MMbbl in the South Terminals, we believe that we are well-positioned to
cover the needs of our clients, the two principal refineries in Peru. The map below shows the location of each of our fuel storage terminals in Peru.
61

Under the current contracts, Consorcio Terminales and Terminales del Perú receive revenues paid in connection with monthly reserved
volume in tanks for refined crude products (storage fee) and for volumes loaded and delivered into railroad cars or cistern trucks to each terminal
(throughput fee). The storage fee per barrel, is based upon reserved volumes whether they are received or not. The throughput fee is paid based on
effective barrels delivered per month. During 2016, 2017 and 2018, Consorcio Terminales and Terminales del Perú generated revenues of
US$74.1 million (S/.249.0 million), US$78.84 million (S/.255.8 million) and US$82.5 (S/.278.9 million) (we are entitled to 50% of the joint operation
revenues), respectively. Under the contracts, Consorcio Terminales and Terminales del Perú are responsible for paying the fuel terminals operating and
maintenance costs and also paying a royalty fee to Petroperú based on effective barrels delivered each month.
At the current stage of the contracts, any capital expenditure we invest in the fuel storage terminals can be recouped from any present and
future royalties we owe to Petroperú.
The South Terminal operation agreement has been extended to August 1, 2019. With respect to the North Terminal operation agreement, the
agreement with Consorcio Terminales expired on October 31, 2014, however, GMP and Oiltanking were granted a new operation agreement for the
terminal, this time under the ‘Terminales del Perú’ Consortium, which provided for a 20 year extension that will end on November 1, 2034.
Additionally, Terminales del Peru was granted with the operation agreement for the terminal del Centro-Callao, for 20 years commencing on
September 2, 2014 until September 1, 2034. In executing their operations, both Consorcio Terminales and Terminales del Perú are committed to develop
and follow a work program which must include an investment schedule. The work program performed included the installation of protection systems
and loading systems, among others, and was secured by a performance bond.
Other Terminal Operations
We are a 50% partner in Oiltanking Andina Services S.A.C. (“OTAS”). This subsidiary operates a fuel terminal named “Terminal Marino
Pisco Camisea” under a contract subscribed with Pluspetrol to operate an export terminal for gasoline, diesel, propane and butane. In 2018, this terminal
dispatched 23.9 million barrels of natural gas liquids. Additionally, through OTAS, we are also a 25% partner in LQS, which operates the “Terminal de
Químicos de Matarani,” which dispatched 53,656 tonnes of sodium hydrosulfide for international mining companies in 2018. During 2016, 2017 and
2018 these activities generated revenues in the aggregate of approximately US$6.3 million (S/.21.2 million), US$6.6 million (S/.21.4 million) and
US$6.6 million (S/.22.3 million), respectively.
Operation and Maintenance of Infrastructure Assets
We began providing our operation and maintenance of infrastructure assets services in 1994 when we were awarded the concession for the
Arequipa Matarani highway in southern Peru. With this experience, in 2003, we began providing operation and maintenance services to Norvial. In
2007, the Peruvian government initiated Proyecto Peru, a program aimed at maintaining roads not under concession to ensure their longevity. Proyecto
Peru allowed us to develop new business opportunities providing maintenance services to more than 4,000 km of public roads in Peru. We believe the
experience we have gained operating highway and transportation concessions positioned our company to capitalize on the Peruvian government’s
initiatives to increase infrastructure development.
Our revenue in the operation and maintenance of infrastructure assets is generated either from fees we charge to Norvial, Survial,
Canchaque, Pasco, Chinchaypujio, Chuquibambilla, Cora and the Lima Metro to operate and maintain our concessions or from government payments
through maintenance service contracts we have been awarded. As depicted in the chart below, we operate and maintain more than 2,936.30 km of
Peruvian roads and highways, including our own highway concessions, in addition to the Lima Metro.
62
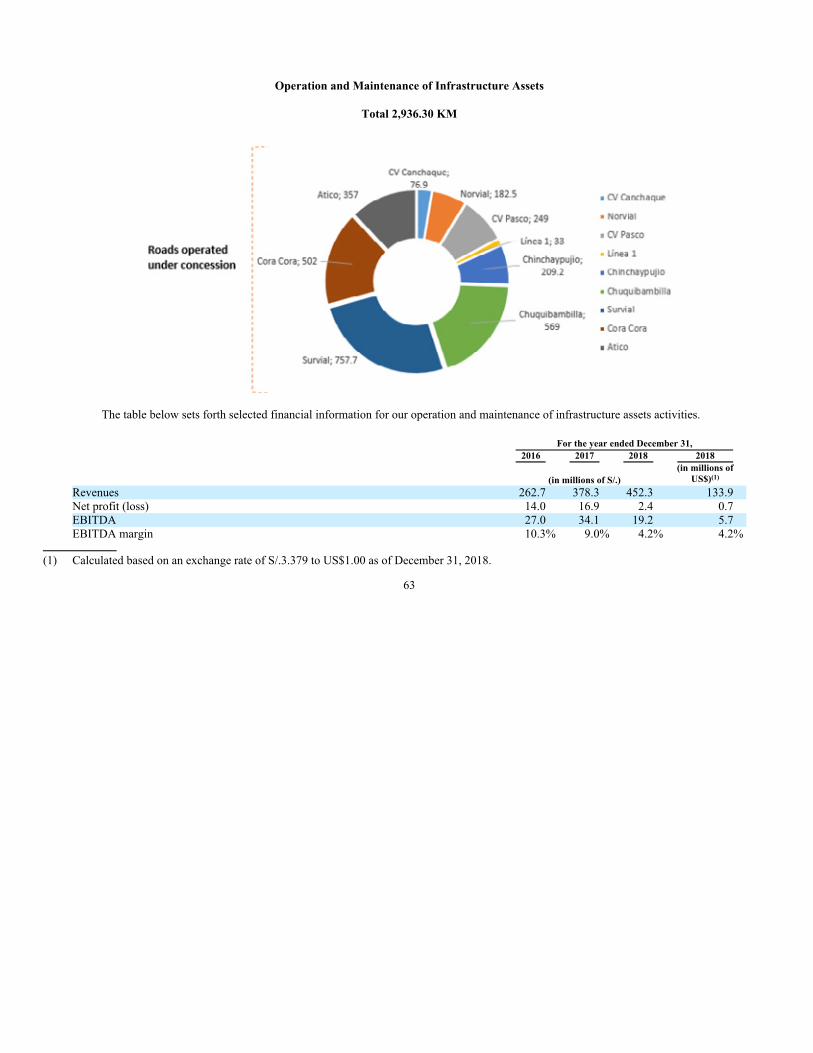
Operation and Maintenance of Infrastructure Assets
Total 2,936.30 KM
The table below sets forth selected financial information for our operation and maintenance of infrastructure assets activities.
For the year ended December 31,
2016 2017 2018 2018
(in millions of S/.)
(in millions of
US$)(1)
Revenues 262.7 378.3 452.3 133.9
Net profit (loss) 14.0 16.9 2.4 0.7
EBITDA 27.0 34.1 19.2 5.7
EBITDA margin 10.3% 9.0% 4.2% 4.2%
(1) Calculated based on an exchange rate of S/.3.379 to US$1.00 as of December 31, 2018.
63

The below map illustrates the roads in Peru for which we currently provide operation and maintenance services.
We provide the following road operation and maintenance services:
• Routine Maintenance. These services aim to preserve roads through ongoing maintenance, including: road demarcation; cleaning;
drainage; road fissure treatment, which seals cracks in roads to prevent water infiltration; slurry sealing; and micro-paving, which
seals asphalt to prevent aging and improve resistance to water and surface wear.
• Periodic Maintenance. These services entail activities that are performed periodically, intended to prevent the occurrence or
exacerbation of defects, conserve the structural integrity of roads and correct major defects.
• Emergency maintenance. This maintenance work is performed whenever the need arises, such as when natural disasters damage
road surfaces.
We also administer toll stations and weighing stations; offer road patrolling services; operate assistance call centers; and provide emergency
medical services.
The operation and maintenance services we provide to the Lima Metro aim to preserve the mass transit system through ongoing
maintenance, including cleaning of the trains and stations and providing train operators, among other services.
With respect to operation and maintenance contracts with the Peruvian government, we obtain new contracts through public bidding. With
respect to contracts with our Infrastructure segment, we participate in direct negotiation. Contract length typically ranges from three to five years.
Competition
Our ability to grow through successful bids for new infrastructure concessions or other long-term contracts could be affected as a result of
competition. We view our competition as including both Peruvian and international infrastructure concession operators including joint operations with
partners with specialized expertise in the relevant sector. Competition varies on a case-by-case basis, depending on the main purpose of the concession.
64

Real Estate
Our Real Estate segment is one of the largest apartment building developers in Peru, in terms of number of units sold and value of sales in
2018, and is focused on the development and sale of affordable housing and housing as well as other real estate projects. Since commencing our
operations in 1987, we have developed approximately 1,178,970 m2 of affordable housing (approximately 18,565 units); approximately 390,696 m2 of
housing (approximately 1,871 units); approximately 170,075 m2 of office space (approximately 902 offices); and approximately 43,000 m2 of shopping
centers (three shopping centers). Moreover, we are currently building approximately 328,834 m2 of affordable housing (approximately 2531 units);
approximately 27,304 m2 of housing (approximately 229 units). Our Real Estate segment also owns significant land parcels in Lima, comprising
approximately 786 hectares as of December 31, 2018, and we have sold undeveloped land in the past and intend to continue such sales in the future.
The table below sets forth selected financial information for our Real Estate business segment.
For the year ended December 31,
2016(1) 2017(1) 2018(1) 2018(1)
(in millions of S/., except as indicated)
(in millions of
US$)(2)
Revenues 411.5 647.5 630.1 186.5
Net profit 77.2 117.7 157.8 46.7
Net profit attributable to controlling 22.1 48.6 28.9 8.6
EBITDA 121.4 177.3 241.00 71.3
EBITDA margin 29.5% 27.4% 38.2% 38.2%
Backlog (in millions of US$)(3) 95.9 25.9 57.9 57.9
Backlog/revenues ratio(3) 0.8x 0.1x 0.3x 0.3x
(1) In 2016, 2017 and 2018 we recognized S/.97 million (US$28.9 million), S/.163.1 million (US$50.3 million) and S/.38.4 million (US$11.5
million), respectively, in revenues from land sales.
(2) Calculated based on an exchange rate of S/.3.379 to US$1.00 as of December 31, 2018.
(3) For more information on our backlog, see “—Backlog.” Backlog is calculated as of the last day of the applicable period. Revenues are calculated
for such period and converted into U.S. dollars based on the exchange rate published by the SBS at such period.
We undertake a significant amount of the activities in our Real Estate segment with partners through financing and commercial
arrangements we use to purchase land and to develop real estate projects. See “—Financing.” See also “Item 5.A. Operating and Financial Review and
Prospects—Operating Results—Results of Operations—General—Real Estate.” As a result, a significant amount of our net profit in the Real Estate
segment is attributable to the non-controlling interest of our partners.
Principal Real Estate Activities
Our real estate developments include the following products:
• affordable housing;
• housing; and
• commercial real estate.
We began developing affordable housing projects in 2001, following the Peruvian government’s efforts to address the country’s housing
deficit, particularly for low-income families. We launched the first major affordable housing project in Peru in 2007, Parque Agustino in Lima’s El
Agustino neighborhood. Since 2001, we have completed 16 affordable housing projects. As of December 31, 2018, we are developing six affordable
housing projects, which are in various stages of development, including three which are in the construction phase but also are still in the process of
obtaining the required approvals and permits. Three of our ongoing affordable housing projects consist of expansions of projects previously completed
by us. Affordable housing consists of apartments, usually ranging between 50 and 72 m2, that are purchased through government subsidies. The
Peruvian government has adopted the Nuevo Crédito Mi Vivienda and Techo Propio programs, among others, which promote access to affordable
housing in Peru by providing government subsidies to individuals for the purchase of homes. In order for a unit to qualify for the Nuevo Crédito
MiVivienda program, its selling price must range between S/.58,800 and S/.310,800. In order for a unit to qualify for the Techo Propio new housing
purchase program, its selling price must be less than S/.84,100 for a single family home or less than S/.105,000 for a multi-family dwelling.
65

In order to be eligible for an affordable housing subsidy under the Nuevo Crédito MiVivienda program, a purchaser must not own any other
home or have benefitted from a housing subsidy program in the past, among other requirements. A purchaser must also provide a down payment
between 10% and 30% of the total purchase amount. Housing subsidies under this program fluctuate between S/.6,500 and S/.17,500 which incentivize
purchasers with reduced monthly rates so long as they pay their mortgage loan payments on a timely basis. In order to be eligible for an affordable
housing subsidy under the Techo Propio program, a purchaser must have a monthly income that does not exceed approximately S/.2,617 and must not
have received any other government-sponsored housing benefit in the past, among other requirements. A Techo Propio purchaser must also show
proven savings equal to at least 10% of the total purchase amount. Housing subsidies under this program is S/.32,400. Purchasers of subsidized housing
under both programs are also not required to pay a value-added tax normally applicable to residential purchases.
We develop substantially all of our affordable housing projects on land purchased from the private sector. To the extent these projects meet
the requirements of a particular government subsidy program, purchasers can purchase units with government subsidies. Some of our affordable housing
projects, however, such as Parque Agustino, are developed through government bidding processes. Government subsidy programs like Nuevo Crédito
MiVivienda and Techo Propio have driven the demand for affordable housing in Peru, which has in turn increased our sales of affordable housing units.
Our housing developments consist of residential buildings comprised of apartments with a mid- to high-price range that do not qualify for
government subsidies. Since 1987, we have developed 38 housing developments. As of December 31, 2018, we are developing four housing projects,
one of which is in the construction stage, with the other three in the process of obtaining the required approvals and permits. Our housing units typically
range between 130 and 400 m2 in size.
Substantially all of our affordable housing and housing development projects are located in Lima. We have also purchased land to develop
four affordable housing projects in Piura, Chimbote and Huancayo, two cities north of Lima and one in the center of the country. We intend to develop
affordable housing projects in other cities outside of Lima.
The table below sets forth number of units sold and not yet delivered and number of units delivered, as well as the value of units sold and
our sales revenue for the periods indicated.
For the year ended December 31,
2016 2017 2018
Number of Units Delivered(1):
Affordable Housing 855 1,353 1,232
Housing 79 65 44
Total 934 1,418 1,276
Number of Units Sold and Not Yet Delivered(1):
Affordable Housing 1,620 1,152 1,810
Housing 97 43 75
Total 1,717 1,195 1,885
Total m2 Delivered:
Affordable Housing 48,460 78,004 70,986
Housing 19,398 20,978 13,752
Total 67,858 98,982 84,738
Total m2 Sold and Not Yet Delivered:
Affordable Housing 55,404 66,878 107,075
Housing 21,825 12,538 15,440
Total 77,229 79,416 122,515
Value of Units Delivered (in millions of S/.):
Affordable Housing 138.0 170 137
Housing 163.0 221 133
Total 301.0 391 270
(1) We typically pre-sell our affordable housing and housing units before construction begins and continue to sell during construction, although we
recognize revenues at the time of delivery of units.
66

We develop and sell office and commercial buildings, such as shopping centers. On certain occasions, we have operated our commercial
real estate and later sold it, such as Larcomar, a landmark shopping center which we built in 1998 and sold in 2010. We have also developed commercial
real estate buildings in connection with our affordable housing and housing projects, such as the Parque Agustino shopping center. Since 1987, we have
developed 16 office buildings, three shopping centers and one medical center. We are currently looking for a plot of land in order to develop a new
office building.
Land Bank
We typically purchase land to develop real estate projects with the intention to begin construction within a 12- to 18-month period after the
purchase of the land. We may also, from time to time, purchase land for subsequent resale. As of December 31, 2018, we owned approximately 135,120
hectares, of which 83% is located in Lima and 17% outside of Lima. We continually evaluate opportunities to purchase new land for our real estate
development projects.
On February 24, 2017, we sold our interest in Project Espacio (formerly known as Cuartel San Martín) to Urbi Propiedades S.A., our partner
in the project, for US$50 million (S/.168 million). On April 28, 2017, we also sold our interest (approximately 20.8%) in Promoción Inmobiliaria del
Sur S.A. (“PRINSUR”) of Inversiones Centenario, which owns approximately 937.7 hectares of undeveloped land also located in Lurin, to its partner
Inversiones Centenario S.A.A. for US$25 million (S/.84 million). For more information, see “Item 5.A. Operating and Financial Review and Prospect—
Operating Results—Recent Developments.”
We have a 50.45% interest in Almonte, which owned approximately 291.28 hectares as of December 31, 2018 of undeveloped land in
Lurin, located 30 km south of Lima. We previously sold 27 hectares of the land for industrial use. On May 31, 2018, Almonte signed a purchase
agreement with PRINSUR for the sale of 420.9 hectares of land for an aggregate amount of US$92.7 million, US$74.1 million of which has been paid,
with the remainder to be paid upon satisfaction of certain conditions precedent.
Financing
We generally fund land purchases for our housing and commercial real estate projects through cash from our operations. For our affordable
housing projects, we generally partner with real estate investment funds and insurance companies that provide between 60% and 70% of the total capital
required to purchase the land and cover certain pre-construction costs in exchange for equity in the project. Once we acquire land for a particular real
estate development project, we obtain working capital through a credit line from a financial institution, which we utilize to finance additional project
needs as they arise. We also obtain financing through pre-construction sales for our affordable housing and housing projects and, to a lesser extent, our
commercial real estate projects. Our affordable housing and housing projects generally require less outside financing because they are generally
financed with pre-construction sales.
Sales and Marketing
We typically pre-sell our affordable housing and housing units prior to and during construction, and use the related proceeds we receive to
finance the construction of the units. Our commercial and sales processes differ depending on the type of development and market segment of the
development. We primarily sell our real estate development projects through an internal sales force that is assigned to particular projects and, to a lesser
extent, external brokers on a non-exclusive, commission-fee basis. Our marketing efforts primarily consist of newspaper advertisements, radio and
television commercials, billboards and promotional offers for referrals. We also advertise our real estate projects on our website.
We believe our brand is associated with product quality, professional operations and reliable post-sale customer service. We provide
customer service call centers through which residents can report complaints or defects. Engineers respond with site visits, and repairs are made as long
as the property continues to be covered by the applicable warranty or guarantee.
For our affordable housing projects, we provide post-sale customer service through our Ayni program, which aims to preserve the long-term
value of our affordable housing developments by promoting a cooperative community life. Through this program, we distribute manuals that teach best
practices for living in communities, offer leadership workshops, budget workshops, promote small business development, facilitate conflict resolution
and provide other services. These services are provided for a six- to eight-month period following project delivery. In 2012, we initiated the Ayni
contest for residents of our affordable housing projects with the aim of stimulating the sustainability of their community. Participants present an
enhancement project for their community, such as a recreation center, and a jury selects the best project, which we fund and construct.
67
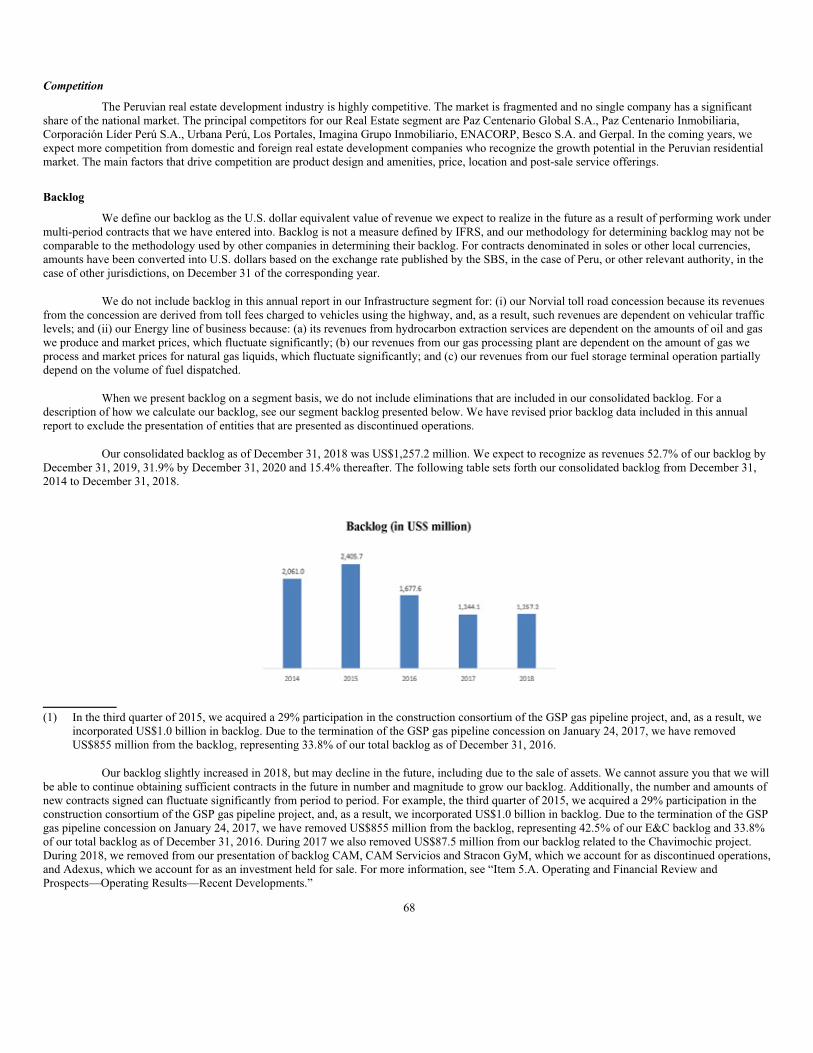
Competition
The Peruvian real estate development industry is highly competitive. The market is fragmented and no single company has a significant
share of the national market. The principal competitors for our Real Estate segment are Paz Centenario Global S.A., Paz Centenario Inmobiliaria,
Corporación Líder Perú S.A., Urbana Perú, Los Portales, Imagina Grupo Inmobiliario, ENACORP, Besco S.A. and Gerpal. In the coming years, we
expect more competition from domestic and foreign real estate development companies who recognize the growth potential in the Peruvian residential
market. The main factors that drive competition are product design and amenities, price, location and post-sale service offerings.
Backlog
We define our backlog as the U.S. dollar equivalent value of revenue we expect to realize in the future as a result of performing work under
multi-period contracts that we have entered into. Backlog is not a measure defined by IFRS, and our methodology for determining backlog may not be
comparable to the methodology used by other companies in determining their backlog. For contracts denominated in soles or other local currencies,
amounts have been converted into U.S. dollars based on the exchange rate published by the SBS, in the case of Peru, or other relevant authority, in the
case of other jurisdictions, on December 31 of the corresponding year.
We do not include backlog in this annual report in our Infrastructure segment for: (i) our Norvial toll road concession because its revenues
from the concession are derived from toll fees charged to vehicles using the highway, and, as a result, such revenues are dependent on vehicular traffic
levels; and (ii) our Energy line of business because: (a) its revenues from hydrocarbon extraction services are dependent on the amounts of oil and gas
we produce and market prices, which fluctuate significantly; (b) our revenues from our gas processing plant are dependent on the amount of gas we
process and market prices for natural gas liquids, which fluctuate significantly; and (c) our revenues from our fuel storage terminal operation partially
depend on the volume of fuel dispatched.
When we present backlog on a segment basis, we do not include eliminations that are included in our consolidated backlog. For a
description of how we calculate our backlog, see our segment backlog presented below. We have revised prior backlog data included in this annual
report to exclude the presentation of entities that are presented as discontinued operations.
Our consolidated backlog as of December 31, 2018 was US$1,257.2 million. We expect to recognize as revenues 52.7% of our backlog by
December 31, 2019, 31.9% by December 31, 2020 and 15.4% thereafter. The following table sets forth our consolidated backlog from December 31,
2014 to December 31, 2018.
(1) In the third quarter of 2015, we acquired a 29% participation in the construction consortium of the GSP gas pipeline project, and, as a result, we
incorporated US$1.0 billion in backlog. Due to the termination of the GSP gas pipeline concession on January 24, 2017, we have removed
US$855 million from the backlog, representing 33.8% of our total backlog as of December 31, 2016.
Our backlog slightly increased in 2018, but may decline in the future, including due to the sale of assets. We cannot assure you that we will
be able to continue obtaining sufficient contracts in the future in number and magnitude to grow our backlog. Additionally, the number and amounts of
new contracts signed can fluctuate significantly from period to period. For example, the third quarter of 2015, we acquired a 29% participation in the
construction consortium of the GSP gas pipeline project, and, as a result, we incorporated US$1.0 billion in backlog. Due to the termination of the GSP
gas pipeline concession on January 24, 2017, we have removed US$855 million from the backlog, representing 42.5% of our E&C backlog and 33.8%
of our total backlog as of December 31, 2016. During 2017 we also removed US$87.5 million from our backlog related to the Chavimochic project.
During 2018, we removed from our presentation of backlog CAM, CAM Servicios and Stracon GyM, which we account for as discontinued operations,
and Adexus, which we account for as an investment held for sale. For more information, see “Item 5.A. Operating and Financial Review and
Prospects—Operating Results—Recent Developments.”
68

The table below sets forth our ending backlog for 2016, 2017 and 2018 accounting for opening backlog for each year, annual contract
bookings and adjustments, cancellations during the year and annual revenues recognized.
2016 2017 2018
(in millions of US$)
Opening backlog (end of prior year) 2,405.7 1,677.6 1,244.1
Contract bookings and adjustments during the year 1,225.1 719.9 881.3
Cancellations during the year (855.0)
Revenues recognized during the year (1,098.2) (1,153.4) (868.2)
Ending backlog (end of current year) 1,677.6 1,244.1 1,257.2
The chart below sets forth our consolidated backlog breakdown by end-market, geography and client sector as of December 31, 2018.
69

The chart below shows the effects on our backlog of our participation in the GSP pipeline concession and the subsequent termination of the concession.
E & C Backlog
To include an engineering and construction contract in our backlog, we assume that each party will satisfy all of its respective obligations
under the contract. We also make assumptions, in agreement with the client, regarding the total expected contract price in the case of unit price and cost-
plus fee contracts and the amount of the contract that will be completed in each year. We adjust our backlog periodically to account for developments
related to each project. For projects related to joint operations or equity investments, we only include our percentage ownership of the joint operation’s
or equity investment’s backlog. Our E&C segment backlog does not include intersegment eliminations.
Our E&C backlog as of December 31, 2018 was US$782.6 million. We expect to recognize as revenues 66.4% of such backlog by
December 31, 2019 and 33.6% of such backlog thereafter. The following table sets forth of our E&C backlog from December 31, 2014 to December 31,
2018.
70

The following pie charts set forth our E&C backlog breakdown by end-market, geography, client sector and contract type as of
December 31, 2018.
The table below sets forth our ending E&C backlog for 2016, 2017 and 2018 accounting for opening backlog for each year, annual contract
bookings and adjustments, cancellations during the year and annual revenues recognized.
2016 2017 2018
(in millions of US$)
Opening backlog (end of prior year) 1,981.6 1,157.6 772.5
Contract bookings and adjustments during the year 890.1 357.7 582.6
Cancellations during the year(1) (855.0) — —
Revenues recognized during the year (859.0) (742.8) (572.5)
Ending backlog (end of current year) 1,157.6 772.5 782.6
(1) In the third quarter of 2015, we acquired a 29% participation in the construction consortium of the GSP gas pipeline project, and, as a result, we
incorporated US$1.0 billion in backlog. Due to the termination of the GSP gas pipeline concession on January 24, 2017, we have removed
US$855 million from the backlog, representing 42.5% of our E&C backlog as of December 31, 2016.
Infrastructure Backlog
In reflecting an Infrastructure contract in our backlog, we assume that each party will satisfy all of its respective obligations under the
contract. For our Infrastructure backlog, we only include contracted revenues expected to be paid during the next three years following the backlog
calculation date. Infrastructure backlog in this annual report does not include our Norvial toll road concession or our Energy line of business.
71

Our Infrastructure segment backlog does not include intersegment eliminations. We calculate our Infrastructure backlog as follows:
• for the Lima Metro, our Infrastructure backlog assumes that for 2019, we will operate 44 trains including 20 new trains, which in the
aggregate will travel 4.8 million kilometers for that year. Our backlog also assumes that for 2019, 2020 and 2021, we will operate 44
trains at full operation, which in the aggregate will travel 4.8 million kilometers per year;
• for our Survial and Canchaque concessions, we assume our contractually agreed upon annual fee, adjusted for inflation. For our
2017 and 2018 backlog, we utilize the same adjustment amount that was utilized for our 2016 fee, which has already been
negotiated; and
• for La Chira, for 2017 and 2018, backlog is calculated to include the fees we will receive under the concession for our operation and
maintenance, adjusted for inflation.
Our Infrastructure backlog as of December 31, 2018 was US$520.8 million. We expect to recognize as revenues 34.1% of our backlog by
December 31, 2019 and 65.9% of our backlog thereafter. The following chart sets forth the growth of our Infrastructure backlog from December 31,
2014 to December 31, 2018.
The following pie chart sets forth our Infrastructure backlog breakdown by line of business as of December 31, 2018.
72
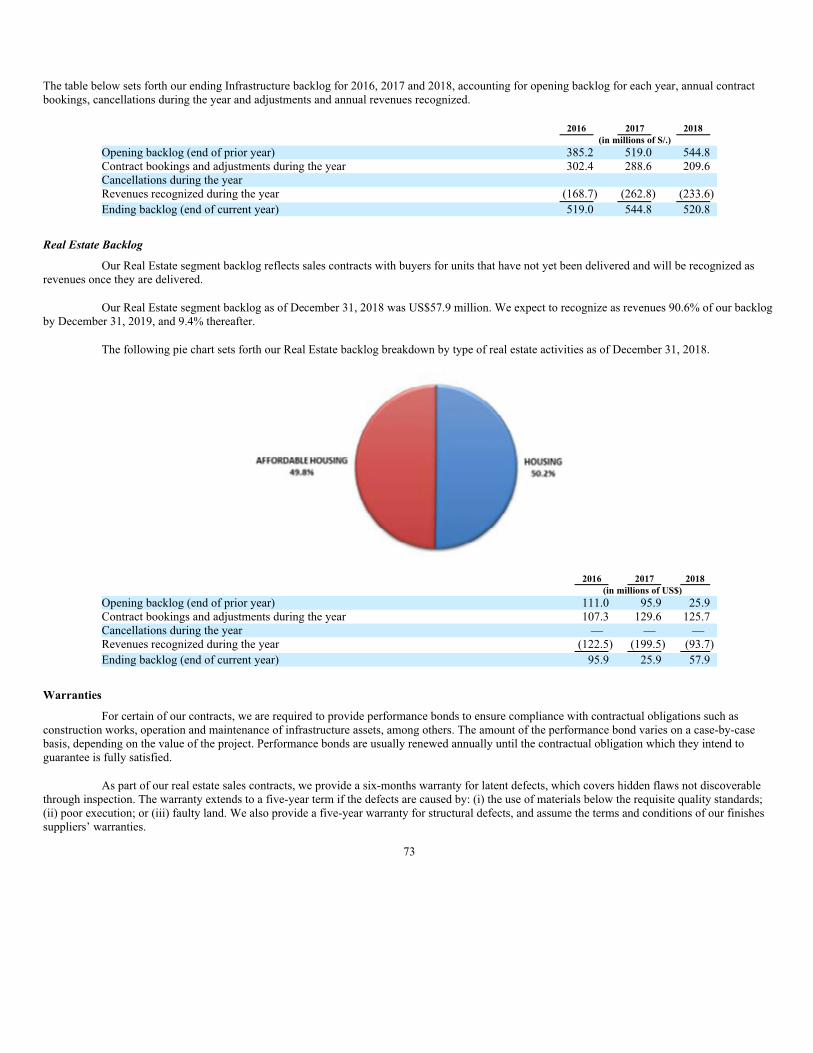
The table below sets forth our ending Infrastructure backlog for 2016, 2017 and 2018, accounting for opening backlog for each year, annual contract
bookings, cancellations during the year and adjustments and annual revenues recognized.
2016 2017 2018
(in millions of S/.)
Opening backlog (end of prior year) 385.2 519.0 544.8
Contract bookings and adjustments during the year 302.4 288.6 209.6
Cancellations during the year
Revenues recognized during the year (168.7) (262.8) (233.6)
Ending backlog (end of current year) 519.0 544.8 520.8
Real Estate Backlog
Our Real Estate segment backlog reflects sales contracts with buyers for units that have not yet been delivered and will be recognized as
revenues once they are delivered.
Our Real Estate segment backlog as of December 31, 2018 was US$57.9 million. We expect to recognize as revenues 90.6% of our backlog
by December 31, 2019, and 9.4% thereafter.
The following pie chart sets forth our Real Estate backlog breakdown by type of real estate activities as of December 31, 2018.
2016 2017 2018
(in millions of US$)
Opening backlog (end of prior year) 111.0 95.9 25.9
Contract bookings and adjustments during the year 107.3 129.6 125.7
Cancellations during the year — — —
Revenues recognized during the year (122.5) (199.5) (93.7)
Ending backlog (end of current year) 95.9 25.9 57.9
Warranties
For certain of our contracts, we are required to provide performance bonds to ensure compliance with contractual obligations such as
construction works, operation and maintenance of infrastructure assets, among others. The amount of the performance bond varies on a case-by-case
basis, depending on the value of the project. Performance bonds are usually renewed annually until the contractual obligation which they intend to
guarantee is fully satisfied.
As part of our real estate sales contracts, we provide a six-months warranty for latent defects, which covers hidden flaws not discoverable
through inspection. The warranty extends to a five-year term if the defects are caused by: (i) the use of materials below the requisite quality standards;
(ii) poor execution; or (iii) faulty land. We also provide a five-year warranty for structural defects, and assume the terms and conditions of our finishes
suppliers’ warranties.
73

Quality Assurance
In 2018, our operations were certified according to the following international standards:
ISO
9001
(QUALITY)
ISO
14001
(ENVIRONMENTAL)
OHSAS
18001
(SECURITY
AND SAFETY) OTHER
Engineering and
Construction GMI x x x
GyM x x x
Morelco x x x x
VyV - DSD x x x
Infrastructure GMP x x x
Ferrovias GyM x
Concar x x x
Viva GyM x
Engineering and Construction:
• GMI: ISO 14001, ISO 9001 and OHSAS 18001.
• GyM: ISO 9001 in project management control processes; ISO 14001 and OHSAS 18001 in engineering, procurement and
construction of electromechanical projects, civil works and buildings.
• Morelco: ISO 14001, ISO 9001 and OHSAS 18001; in addition, ASME ESTAMPES U/S NATIONAL BOARD ESTAMPER.
• Vial y Vives—DSD: ISO 14001, ISO 9001 and OHSAS 18001.
Infrastructure:
• GMP: ISO 14001, ISO 9001 and OHSAS 18001: certified for oil and gas production processes in lots III, IV, I and V; gas
processing at the Pariñas plant; reception, storage and dispatch of hydrocarbons-derived products in nine terminals (Pisco, Mollendo,
Ilo, Cusco, Juliaca, Eten, Salaverry, Chimbote and Supe).
• Ferrovias GyM: ISO 9001 for the operation and conservation of railway infrastructure and rolling stock of the Transport System -
Line 1.
• Concar: ISO 9001, ISO 14001 and OHSAS 18001.
• Viva GyM: OHSAS 18001 for its main office and the Los Parques de Comas project.
Corporate Social Responsibility
We are committed to the sustainable development of our operations. We seek to create long-term value and conduct business in a manner
that is not only economically viable, but also beneficial to greater society and environmentally responsible.
Our Sustainability Policy was approved by our board of directors on January 28, 2016, and its guidelines allow us to focus on seven
managerial priorities linked to our stakeholders: ethical conduct, development of people, operational excellence, health and safety, the environment,
communication and dialogue and sharing wellbeing.
The focuses of our social investment projects include education and capacity building to foster job creation and the promotion of
responsible citizen behavior, particularly among our users, suppliers and neighboring communities.
74

The following are key programs we perform for the benefit of society:
• Metro Culture: We conduct workshops that transform trains and train stations into centers of social and cultural education to
promote respect and tolerance. In 2018, we carried out 54 artistic presentations and incorporated approximately 27,000 people in
health campaigns.
• Road Safety Education: This program promotes our culture of safety and accident prevention by training communities surrounding
roads and highways that we operate or maintain. In 2018, approximately 4,000 road users participated in these workshops.
• Ayni: This social support program aims to improve the quality of life in urban areas by promoting respectful coexistence among new
owners of our real estate projects. The initiative trains neighbors on several legal and managerial matters and on conflict
management and leadership. In 2018, the program trained approximately 2,000 people.
• Development of local suppliers: We build the capacities of our local suppliers and help them to develop their businesses by
improving the quality of the goods and services they provide and encouraging the adoption of formal and responsible managerial
styles. In this way, we make local economies more dynamic.
• Labor Capabilities: This is a recruitment program where we share construction knowledge and train community members on
building techniques, risk prevention and leadership skills. In this way, we increase the employability of members of local
communities, generate formal jobs, reduce project risks, develop more efficient recruiting processes, and strengthen the trust with
local communities. In 2018, we trained approximately 750 participants, 75% of whom joined the Group.
• Cantera Program: This program is designed to attract and train young talents in engineering. In 2018, we recruited 8 young people
out of a total of 34 participants.
Regulatory Matters
Set forth below is a description of the regulatory framework applicable to our company. We believe we are in compliance, in all material
respects, with applicable laws and regulations in all of our business segments.
Engineering and Construction
Regulatory Framework Applicable to Contracts with the Public Sector
As of the date of this annual report, Peru’s Public Procurement Law, approved by Supreme Decree No.° 082-2019-EF (Texto Unico
Ordenado de Ley de Contrataciones del Estado) and its Regulations which, in turn, was approved by Supreme Decree No. 344-2018-EF, which entered
into force on January 30th, 2019, governs services and construction agreements entered into with public entities. Article 29 of Supreme Decree No.
344-2018-EF establishes that, at the beginning of the procurement process, the contracting public entity must prepare a technical file describing the
characteristics of the services it intends to purchase and the selection process for its counterparts, among other specifications.
The selection processes are established in Article 53 of Supreme Decree No. 344-2018-EF as follows:
• public biddings (licitación pública), applicable to goods and works;
• public tenders (concurso público), applicable to services, including consulting services;
• simplified award (adjudicación simplificada), applicable for the acquisition of any of the following: to (i) goods, if their value is
greater than S/33,200 and less than S/400,000; (ii) services, if their value is greater than S/33,200 and less than S/400,000; and
(iii) works, if their value is greater than S/33,200 and less than S/1,800,000;
• electronic reverse auction (subasta electronica inversa), applicable to goods and services with a value greater than S/33,200;
• selection of individual consultants (selección de consultores individuales), applicable for the hiring of qualified consultants who do
not need teams of personnel or additional professional support;
75

• price comparison (comparación de precios), applicable to goods and services that are easy to obtain in the market and that are not
manufactured, produced, supplied or provided under a particular description or set of instructions given by the contracting entity;
and
• direct contracting (contratación directa), applicable to goods and services, in emergency situations arising from catastrophic events,
involvement of national security, shortages, among other similar reasons.
As established in Article 70 of Supreme Decree No. 344-2018-EF, the selection processes include the following phases:
• in the case of public biddings, public tenders and simplified award: notice; registration of participants; submission and reply of
inquiries; submission and reply of comments; preparation of the terms and conditions of the selection process; submission of bids;
evaluation and qualification of bids; and award;
• in the case of the selection of individual consultants: notice; registration of participants; submission of bids; evaluation and
qualification of bids; and
• in the case of price comparison: notice, submission of bids, and adjudication.
Article 46 of Peru’s Public Procurement Law establishes that any participants in a public procurement processes must be registered in the
Peruvian National Suppliers Registry and must not be barred from contracting with the state. Article 9 of Supreme Decree No. 344-2018-EF establishes
that this registration has an indefinite validity and that all contractors must maintain their information up to date.
Bidders may participate in the selection process as part of a joint operation, in which case all members of the joint operation must be
registered in the Peruvian National Registry of Suppliers and will be jointly liable for all consequences arising from the joint operation’s participation in
the selection process and the execution of the agreement. Certain exceptions to the abovementioned joint liability for joint operations may apply, in
cases where a contractor proves that only one party is liable to be sanctioned due to the nature of the infraction, the joint operation formal undertaking or
the joint operation agreement.
GyM and GMI are registered in the Peruvian National Suppliers Registry as a construction and a consulting company, respectively.
Article 35 of Supreme Decree No. 344-2018-EF establishes the types of contracts that may be entered into by public entities:
• lump-sum (sistema a suma alzada), applicable when the amounts, scales and quality are determined in the terms and conditions of
the selection process. The bidder submits its proposal indicating a fixed amount and a term for the completion of the agreement;
• unit price, rates or percentages (sistema de precio unitario, tarifas o porcentajes), applicable when the nature of the service to be
provided does not allow an accurate determination of the required quantities;
• lump-sum and unit price, rates or percentages mix (esquema mixto de suma alzada y precios unitarios), applicable when accurate
determination of the quantities required for some of the components cannot be made; and
• fixed amount plus success fee (honorario fijo y comisión de éxito), applicable in contracts for rendering services. The fixed amount
and success fee may be estimated on the basis of percentages.
Article 36 of Supreme Decree No. 344-2018-EF establishes that, in the case of goods and works, the terms and conditions of the selection
process must indicate the execution type of the agreement as follows:
• “turn-key” (llave en mano), when completion is subject to the construction, equipment assembly and, if applicable, the assisted
operation of works. In case of goods procurement, the installation and commissioning of such goods are also included; and
• bid contest (concurso oferta), when completion is subject to the submission of the technical file and the completion of the works.
This completion type is only applicable to lump-sum contracts and public bidding selection process.
76

Peru’s Supervisory Authority on Public Procurement (Organismo Supervisor de las Contrataciones del Estado, or OSCE, by its Spanish
acronym) is a public-sector entity within the Peruvian Ministry of Economy and Finance, that oversees the selection processes carried out by public
entities; manages the Peruvian National Registry; imposes penalties to suppliers that violate the provisions set forth in Peru’s Public Procurement Law,
its Regulations and other related provisions; and informs the government’s General Comptroller Office (Contraloría General de la República) regarding
violations to the regulations when damages are caused against the State.
Pursuant to the recent amendments to the Public Procurement Law, companies sentenced for corruption charges, among other criminal
offences, or companies whose representatives have admitted committing corruption acts, will be prohibited from participating in public procurement
processes.
Regulatory Framework Applicable to Contracts with the Private Sector
Parties to a private-sector agreement may freely determine the contract type and its contents as long as it complies with certain legal
requirements, including the provisions set forth in Article 1353 of the Peruvian Civil Code (which states that all contracts, including innominate
contracts, must comply with the rules of Section VIII of the Peruvian Civil Code, absent a statute specific to said contract type that collides with said
rules). GyM and GMI participate in private-sector contracts for engineering and constructions.
Construction Activities in Peru
Legal Framework
Peru’s Law for the Promotion of Private Investment in Construction, approved by Legislative Decree No. 727 (Ley de Promoción de la
Inversión Privada en Construcción), states that construction activities in Peru are in the public interest and a national priority. According to Section F of
the Fourth review of the United Nations International Statistical Industrial Classification (ISIC), construction activities typically consist of the
construction of dwellings, buildings and stores; and the construction of large scale infrastructure projects such as highways, bridges, tunnels, railways,
irrigation systems, sewage systems, industrial facilities, pipelines and electric lines, among others. GyM has developed numerous projects in the
construction sector. Currently, our company focuses on buildings (ISIC Division 41), civil works (ISIC Division 42) and specialized activities (ISIC
Division 43).
Construction entities must comply with the National Building Regulations, approved by Supreme Decree No. 011-2006-VIVIENDA
(Reglamento Nacional de Edificaciones), which establishes that urban allotments and buildings must be developed in compliance with the rules
governing safety, functionality, accessibility, habitability and environmental impact. According to Technical Regulation No. G.030 of the National
Building Regulations, construction companies, such as GyM and GMI, are responsible for (i) executing works in accordance with project specifications
and applicable regulations; (ii) possessing sufficient organization and infrastructure to guarantee the feasibility of the project; (iii) appointing the party
responsible for the construction to assume its technical representation; (iv) providing the resources and materials to complete the project pursuant to the
terms of the agreement and required standards and within the approved budget; (v) executing subcontracts within contractual limitations; and
(vi) delivering to the client documented information regarding the executed works.
Notwithstanding any legal actions that the construction company may take against suppliers, manufacturers or subcontractors, the
construction company may be responsible for all the works, including those executed by subcontractors, and for the use of defective materials or
supplies.
Penalties for violating the National Building Regulation are determined by the municipal government in the jurisdiction where the project is
developed and set forth in its corresponding regulations. In addition, they may also pursue criminal actions or civil claims if applicable.
Safety Regulation in Construction Projects
The Law on Safety and Health at Work (Law No. 29,783) is intended to promote workplace accident prevention and applies to all business
sectors. The principal safety rules applicable to construction projects include the following:
• companies with 20 or more employees must establish a committee for the promotion of workplace safety and health that oversees
the implementation of the required internal safety and health regulation policy;
• all projects must have a safety and health plan consisting of all the technical and administrative mechanisms to guarantee the
physical integrity and health of workers and third parties during project execution;
• companies shall hire an occupational physician and establish an area of occupational medicine;
77

• companies shall perform periodic audits to verify whether internal safety and health regulations are in accordance with law;
• occupational diseases and work accidents detected during project execution must be recorded and the competent authority must be
notified in accordance with the Regulations of the Law on Safety and Health at Work, approved by Supreme Decree No.
005-2012-TR, and with Occupational Health Manual, approved by Ministerial Resolution No. 510-2005-MINSA;
• companies must provide for medical examinations of its employees prior to, during and at the termination of their employment
(subject to certain terms and conditions depending on whether the employees were engaged in high-risk activities);
• companies must show a safety and health plan; an index of frequency; and our company’s performance in safety and health in order
to be awarded public and private projects;
• use of individual protective equipment, including gloves, safety goggles, boots and helmets, is mandatory when risks to safety and
health cannot be prevented by other means; and
• personnel responsible for safety must comply with all requirements in Rule NTP 399.010.1 for fire prevention.
The Peruvian Ministry of Labor and Employment Promotion, the National Superintendence of Labor Inspection (the “SUNAFIL”) and the
Peruvian Ministry of Health are the competent organisms in the safety and health fields, respectively.
Safety Regulations Applicable to Subsectors
In addition to the Law on Safety and Health at Work applicable to all our business sectors, our Engineering and Construction segment must
also comply with the regulations set forth below.
Power and Utilities
GyM must comply with the Rules of Safety and Health at Work with Electricity, approved by Ministerial Resolution No.
111-2013-MEM-DM, for its activities relating to the construction of hydroelectric plants, transmission lines and substations. OSINERGMIN is the
authority responsible for supervising and enforcing compliance of the foregoing rules. The most relevant of the safety rules with which GyM must
comply include: (i) providing employees with necessary information regarding safety measures related to the tasks they perform; (ii) providing
employees with adequate safety equipment; and (iii) evaluating and remedying potential sources of danger.
Mining
GyM must comply with the Mining Occupational Health and Safety Regulation, approved by Supreme Decree No. 024-2016-EM, and other
related regulations for their mining-related construction activities including the construction of mineral processing plants and other mining-related
buildings, among others. In developing mining projects, our subsidiaries’ personnel must follow the safety programs and be familiar with internal rules
from their mining sector client. The SUNAFIL and OSINERGMIN are the authorities responsible for supervising and enforcing compliance of the
foregoing rules. The most relevant of the safety rules with which GyM must comply include: (i) creating an internal safety and health regulation policy
and selecting a manager responsible for its implementation; (ii) monitoring and recording workplace accidents and occupational diseases; (iii) providing
information to employees regarding the safety risks related to their work; (iv) providing employees necessary first aid and medical attention in the event
of a workplace accident; (v) providing employees the necessary tools, equipment or materials to perform their activities safely; and (vi) evaluating risks
in order to establish accident prevention and mitigation plans.
Oil and Gas
GMP must comply with the Hydrocarbons Safety Regulations, as approved by Supreme Decree No. 043-2007-EM, which are enforced by
the OSINERGMIN, while performing any hydrocarbon activities. The most relevant safety rules with which GMP must comply include: (i) assuring
that senior project managers are responsible for the safety and health of workers; (ii) assigning specialized personnel responsible for safety and health
matters; and (iii) monitoring and recording workplace accidents on a monthly basis.
78

Industrial Construction
GyM must comply with the Industrial Safety Regulation, approved by Supreme Decree No. 42-F (Reglamento de Seguridad Industrial), for
its activities relating to the construction of industrial plants. The most relevant of the safety rules with which GyM must comply include: (i) overseeing
that worksites are constructed, equipped and managed to provide security and protection to employees; (ii) instructing employees about risks to which
they are exposed related to their work and adopting necessary measures to avoid accidents and damage to employee health; and (iii) overseeing
inspections to verify the proper installation of safety equipment.
Registries and Permits
According to Supreme Decree No. 008-2013-TR, civil contractors must be registered in the National Civil Construction Works Registry and
comply with the rules of Ministerial Resolution No. 195-2007-TR which sets out the requirements for registration, including registering through the
corresponding local agency and filing an affidavit indicating compliance with the registration requirements before the effective date of registration.
GyM is currently registered in the National Civil Construction Contractors and Subcontractor Registry.
According to Supreme Decree No. 005-2008-EM mining contractors must register with the National Mining Contractors and Specialized
Companies Registry. GyM is currently registered. Proper registration requires the filing of a request with the Regional Agency of Energy and Mines
with jurisdiction in the area where the mining activities will take place. In addition, within five days upon commencement of construction, GyM must
provide in writing its employees with the following information: (i) the company’s legal name; (ii) the scope of the contract; (iii) the place of execution;
(iv) the applicable health and safety regulations; (v) the Safe Work Written Procedures (PETS); and, (vi) risk insurance policies.
Labor Law Requirements in Civil Construction
Labor law requirements in civil construction consist of the specific legal framework for civil construction workers and the general legal
framework applicable to the administrative personnel in the civil construction sector set forth in the Single Revised Text of the Labor Productivity and
Competitiveness Law, approved by Supreme Decree No. 003-97-TR.
Seasonality of services is one of the main features in the specific legal framework due to the temporary nature of construction contracts.
Consequently, certain general rules such as the trial period are not applicable to construction workers.
The principal terms and conditions relating to collective bargaining from our civil construction workers have been agreed upon and recorded
in the 2018-2019 agreement, dated September 11, 2018, and entered into between the Peruvian Chamber of Construction and the Federation of Civil
Construction Workers (Federación de Trabajadores en Construcción Civil). By means of the 2018-2019 agreement, the parties have, among other
things, agreed on an increase in the daily wage of such employees.
Supreme Decree No. 009-97-SA, Law No. 26,790 and Supreme Decree No. 003-98-SA require construction companies to have
complementary high-risk insurance for workers that perform high risk tasks. As of the date of this annual report, GyM has this insurance coverage.
The insurance coverage provides medical care for injured workers to allow them to achieve full recovery. Moreover, it provides pensions to
workers or their beneficiaries in case the worker becomes handicapped or dies as a result of a work accident or occupational disease.
Environmental Regulations
Section 24 of the General Environmental Law, approved by Law No. 28,611 (the “General Environmental Law”), provides that all human
activity likely to cause significant environmental impact is subject of regulation by the National System of Environmental Impact Assessment. The
Peruvian Ministry of the Environment, through the Environmental Supervising and Enforcement Agency (Organismo de Evaluación y Supervisión
Ambiental, or “OEFA”) supervises compliance with the law and enforces environmental rules related to mining, oil and gas and electricity.
In addition to being responsible for the impact that its activities, by action or omission, may have on the environment, GyM is also subject
to an environmental impact assessment and must obtain an environmental certification necessary to obtain project permits or licenses. GyM must also
adopt measures for the management of hazardous materials intrinsic to its activities to mitigate the negative environmental impact its activities may
have.
79
Civil Construction
Supreme Decree No. 015-2012-VIVIENDA (modified by the Supreme Decree No.° 019-2014-VIVIENDA and Supreme Decree No.
0082016-VIVIENDA) regulates the environmental aspects of projects related to housing, urbanism, construction and sanitation activities in urban or
rural areas. The National Directorate of Housing, Urbanism, Construction and Sanitation supervises the compliance and enforces the applicable rules.
Projects are categorized according to their environmental impact during and after their execution and different rules are established for each category
including compliance with the following environmental studies prior to starting construction works: (i) projects expected to cause minor environmental
impacts require an environmental impact statement; (ii) projects expected to cause moderate environmental impacts require a semi-detailed
environmental impact assessment; and (iii) projects expected to cause a major environmental impact require a detailed environmental impact
assessment.
Other Subsectors
Depending on the subsector in which it operates, GyM is required to follow specific environmental provisions issued by the competent
authorities. For example, with respect to hydrocarbon activities, the Ministry of Energy and Mines has enacted the Oil and Gas Environmental
Regulations, by means of Supreme Decree No. 039-2014-EM modified by Supreme Decree No.° 023-2018-EM
Tax Legal Regime Applicable to Construction
Section 63 of the Peruvian Income Tax Law, approved by Supreme Decree No. 179-2004-EF, establishes that construction companies
engaged in construction contracts for a period longer than one fiscal year can choose to be taxed under any of the following systems:
• allocate to each fiscal year the gross income resulting from applying the percentage of gross margin estimated for the work over the
amounts collected for the same work; or
• allocate to each fiscal year the gross income calculated by deducting the costs corresponding to the tasks performed during that year
from the amount collected or that is expected to be collected corresponding to that work.
In both situations, a special accounting registry must be kept for each project, which is meant to keep a record of the costs, expenses and
income of each project in an account separate from the general analytical accounts (cuentas analíticas de gestión).
Until December 31, 2012, construction companies could defer revenues related to each individual project until the total completion of the
project, provided the project was completed in three years or less. In such cases, the income was to be recognized in the fiscal year in which the project
concluded or was delivered. In case the project was scheduled to conclude in a period exceeding three years, the results would be determined in the third
year in accordance with the progress of the works over the three-year period. Beginning in the fourth year, results were determined following the
foregoing methods.
Starting on January 1, 2013, in accordance with Legislative Decree No. 1112, which amended the Peruvian Income Tax Law, construction
companies that adopted the deferral method are authorized to continue with the use of such method only with respect to income arising from the
execution of work contracts initiated prior to January 1, 2013, until their completion, and for execution of work contracts initiated on or after January 1,
2013 the deferral method is no longer accepted.
The Peruvian Income Tax Law also provides that the difference that may result from a comparison between the real gross income and the
income assessed pursuant to any of the methods described above shall be allocated to the fiscal year in which the work concluded. Additionally, the
company must apply the same system to all its construction contracts and must receive prior authorization from tax authorities to change the applied
system.
Prevention of Money Laundering and Financing of Terrorism
Regulations for money laundering and terrorism financing prevention, approved by SBS Resolution No. 789-2018 (which has replaced SBS
Resolution No. 486-2008 as of March 15, 2018), require construction and real estate companies to implement a money laundering and terrorism
financing prevention system, including, among others, the appointment of a compliance officer, setting up a registry of operations and notifying the
Financial Intelligence Unit of the SBS, the entity responsible for supervising and enforcing compliance, of any suspicious activity.
80

Infrastructure
Infrastructure and Public Services through Public Private Partnership Contracts
In recent years, the Peruvian state has implemented a new regulatory framework (Single Supreme Decree No. 254-2017-EF, Legislative
Decree No. 1224 and its regulations, approved by Supreme Decree No. 410-2015-EF) to set forth the procedures and mechanisms for enhancing private
investment for the development of public infrastructure, public services, any ancillary services, applied research projects and/or technological
innovation, through Public-Private Partnerships (PPP) and Projects with State Assets.
The main aspects of the new legal framework are the following:
1. The Ministry of Economy and Finance (Ministerio de Economía y Finanzas) is the governing authority of the National System for the
Promotion of Private Investment (SNPIP), composed by ministries and public agencies of the national government, the Agency for the
Promotion of Private Investment—ProInversión, and regional and local governments.
2. Private investment projects will comprise the following stages: (i) planning and programming, (ii) formulation, (iii) structuring,
(iv) transaction, and (v) contract execution. Great emphasis is given to the Evaluation Report (Informe de Evaluación), a document
determining the economic, financial and legal viability of a potential Public Private Partnership applying, where appropriate, the national
public investment system. Investors are entitled to receive from the Peruvian state: (a) in the case of self-financed projects, taxes and tolls to
be collected from final consumers; (b) in the case of co-financed projects, subsidies and payments from the public entity awarding the
project; and (c) any other financing structure agreed between the parties.
3. The management of Public Private Partnership contracts by the three levels of government (central, regional and local) is regulated.
4. For projects in regulated sectors, the monitoring of Public Private Partnership contracts is subject to the provisions of the Law No. 27,332,
Framework Law on Regulators. According to this law, OSIPTEL, OSITRAN, SUNASS and OSINERGMIN should primarily safeguard the
compliance of service levels agreed in Public Private Partnership contracts. For this purpose, Public Private Partnership contracts must
establish the necessary arrangements to ensure timely and efficient supervision during the contract execution stage. To this end, public
entities are required to ensure timely participation of regulatory agencies in the arbitration, when decisions and matters related to the
competence of those bodies are discussed.
5. Favorable opinions for the Public Private Partnership Agreements from the General Comptroller Office of Peru are required. The General
Comptroller will issue a report on any aspects that may jeopardize the financial capacity of the Peruvian state, according to Law No. 27,785,
Organic Law of the National Control System and the General Comptroller of Peru.
6. Investors interested in participating as bidders in private investment processes must review the list of restrictions and prohibitions
established in the Public Procurement Law. Whether an investor is barred from participating shall be determined through administrative
channels, and such restriction will apply to any expected strategic partners as well. Furthermore, it is stated that, the restriction would extend
to strategic partners and to companies who have exercised direct control over the investor, as indicated in the regulations approved by the
Superintendence of the Stock Market.
7. The development of projects related to assets owned by the Peruvian state (Legislative Decree No. 674, Law Promoting Private Investment
in State Enterprises) can be carried out by private sector initiatives, without committing any public resources or transferring any risks to
public entities, unless expressly required by law.
Each of our subsidiaries Norvial, Survial, Canchaque and GyM Ferrovías has entered into a concession agreement with ProInversión and the
Peruvian Ministry of Transportation and Communications. La Chira has entered into concession agreements with ProInversión and Sedapal S.A. The
abovementioned agreements were entered into in accordance with the provisions in force at the time of their execution.
Infrastructure Construction and Safety
Infrastructure concessionaires must assure that the construction companies they hire to construct infrastructure projects comply with the
foregoing rules relating to construction projects. In addition, companies engaged in road construction must comply with the guidelines issued by the
Road and Railways General Directorate of the Peruvian Ministry of Transportation and Communications and with the National Road Infrastructure
Management Regulation regarding road construction, maintenance and safety. These regulations establish procedures for authorizing road construction
and approving work contracts, among others.
81

Environmental Regulations
Peruvian environmental laws and regulations have become increasingly stringent over the last decade. All industries and projects are subject
to Peruvian laws and regulations concerning water, air and noise pollution, and the discharge of hazardous substances. The main legislation governing
environmental matters is the General Environmental Law; the Law of the National System of the Environmental Impact Evaluation, approved by Law
No. 27,446 (the “SEIA”); the regulations of the SEIA Law, approved by Supreme Decree No. 019-2009-MINAM; and several environmental
regulations that have been issued under the General Environmental Law, SEIA and other laws by the government with the collaboration of the Peruvian
Ministry of the Environment.
Since the enactment of the General Environmental Law in October 15, 2005, several technical environmental regulations have been issued
and this environmental regulatory framework is generally revised and updated regularly. Some regulations apply generally to Peruvian industries and
some technical regulations are issued for specific industries.
The main environmental rules applicable to infrastructure projects include those described above in “—Engineering and
Construction—Environmental Regulation.”
Peruvian Hydrocarbon Regulation
Our hydrocarbon operations are subject to governmental regulations as described below.
Exploration and Production
GMP is engaged in two major activities relating to the exploration and production of oil and gas: exploration and production of oil fields;
and providing services to the oil industry.
Exploration and Production of Oil Fields
Peru’s hydrocarbon legislation regarding oil and gas exploration and production activities includes, among others, the Hydrocarbon Organic
Law and the regulations governing the qualification of petroleum companies; the exploration and production of hydrocarbons; the transportation of
hydrocarbons; hydrocarbons pipelines and safety requirements in such activities.
The foregoing regulations define the roles of Peruvian government agencies which regulate the oil and gas industry; provide the framework
for the promotion and development of hydrocarbon activities based on the principles of private-sector competition and access to all economic activities;
and set the safety and security standards as well as the legal proceedings for carrying out operations.
The Peruvian Constitution establishes that the government is the sole proprietor of underground hydrocarbons within its national territory.
However, the Peruvian government has granted Perupetro, a state-owned company authorized to negotiate and enter into agreements for the exploration
and/or production of hydrocarbons, the ownership right over the hydrocarbons extracted which allows Perupetro to enter into such agreements.
Furthermore, the Peruvian Ministry of Energy and Mines, the Environmental Evaluation and Supervision Agency (“OEFA”) and OSINERGMIN
constitute public entities that play an active role in oil and gas regulation.
The Peruvian Ministry of Energy and Mines is responsible for devising energy and mining policies; supervising activities in the energy and
mining sectors; and promoting investments in those sectors. Within the Peruvian Ministry of Energy and Mines, the General Directorate of
Hydrocarbons (“DGH”) is responsible for regulating the development of oil and gas fields and the General Directorate of Energy-Related
Environmental Affairs (“DGAAE”) is responsible for reviewing and approving regulations related to environmental risks associated with hydrocarbon
exploration and production activities.
OEFA is a public entity ascribed to the Peruvian Ministry of the Environment and is responsible for evaluating and ensuring compliance
with applicable environmental rules covering hydrocarbon activities, as well as for initiating sanctioning proceedings when a breach of an
environmental regulation occurs. OSINERGMIN is a public entity ascribed to the Presidency of the Council of Ministers’ (Presidencia del Consejo de
Ministros) office and is responsible for ensuring compliance with safety and security standards in the hydrocarbon industry, as well as for sanctioning
proceedings. GMP is subject to the supervision, authority and regulations enacted by the foregoing agencies.
Regarding hydrocarbon exploration and production activities, companies are required to enter into either a licensing or a services agreement
with Perupetro; other contractual arrangements are permitted with prior approval from the Peruvian Ministry of Energy and Mines. The foregoing
agreements are governed by private law and must be approved by the Peruvian Ministry of Energy and Mines and the Peruvian Ministry of Economy
and Finance. In licensing agreements, licensees obtain authorizations to explore and produce hydrocarbons in a determined area, are granted ownership
over the extracted hydrocarbons and are subject to the payment of royalties. Licensees may trade the hydrocarbons with no limitations on sales prices,
except in the event of a national emergency.
82

Services agreements grant contractors the right to perform hydrocarbon exploration and production activities in a determined area and
receive compensation according to the production of hydrocarbons. The contractor is technically and financially responsible for the operations, but
Perupetro maintains the ownership over the hydrocarbons extracted. GMP is party to services agreements with respect to Blocks I and V, and to
licensing agreements with respect to Blocks III and IV. Each block has an independent contract with Perupetro.
Services and licensing agreements are intended for the development, production and eventually transportation of hydrocarbons, as well as
for certain storage activities. Services and licensing agreements commonly include a minimum performance schedule guaranteed by performance bonds
and require corporate guarantees to be issued to secure the contractor’s compliance to the provisions established by the parties.
Additionally, a company must be qualified by Perupetro prior to entering into hydrocarbon exploration and production agreements. In order
to qualify, a company must meet the standards under the Regulations on the Qualification of Petroleum Companies (approved by means of Supreme
Decree No. 030-2004-EM), requiring companies to demonstrate that they have the technical, legal and financial capacity to comply with all the
obligations they will assume under the agreement with Perupetro. Such capacities are measured according to the characteristics of the area to be
explored or produced, the expected investment required for the project, and the strict fulfillment of the rules regarding prior consultation (if applicable),
citizen participation and environmental issues related to the operation’s performance. Upon a positive evaluation, the company is issued a qualification
certificate from Perupetro that allows it to initiate the negotiations of the agreement. Notwithstanding the foregoing, the company remains responsible
for obtaining all other licenses, permits and approvals required by applicable regulation.
Under the current regulation, 30 years is the maximum term of services and licensing agreements for the production of crude oil. On the
other hand, natural gas and condensates-related services or licensing agreements have a maximum term of 40 years. Graña y Montero acts as GMP’s
guarantor in all of the Block I, Block III, Block V and Block VI contracts.
GMP must comply with Supreme Decree No. 043-2007-EM for its activities relating to hydrocarbons in all phases. The OSINERGMIN is
the authority responsible for the supervision and enforcement of the foregoing rules.
Services to the Petroleum Industry
Peruvian regulation provides that all companies that enter into a service agreement with any company that holds a licensing or services
agreement must be registered as a subcontractor in the Hydrocarbons Public Registry in case they render any of the following services: (i) geological
studies, geophysical studies, petroleum engineering related to drilling operations, production and well services; or (ii) construction of oil pipelines, gas
pipelines, refineries and their maintenance, and specialized transportation by land, air, sea or river. In order to register a company as a subcontractor in
the Hydrocarbons Public Registry, prior authorization from the General Directorate of Hydrocarbons (“DGH”) of the Peruvian Ministry of Energy and
Mines is required.
On June 1, 2004, GMP was included as a subcontractor for the petroleum industry in the Hydrocarbons Registry of Lima’s Public Registry
of Legal Entities; such registry remains in force as of the date of this annual report.
Environmental Regulations
The Peruvian Ministry of Energy and Mines is responsible for enacting environmental regulation for the oil and gas sector. The Oil and Gas
Environmental Protection Regulation, approved by Supreme Decree No. 039-2014-EM and modified by Supreme Decree No. 023-2018-EM, sets out
the legal framework and specific rules applicable to the exploration, production, refinement, processing, transportation, commercialization, storage and
distribution of hydrocarbons, with the aim of preventing, controlling and remedying the negative environmental impacts arising from the foregoing
activities.
The Peruvian Ministry of the Environment establishes general rules applicable to different activities in several sectors, in contrast to the
specific rules enacted by the Peruvian Ministry of Energy and Mines regarding the oil and gas sector. Environmental laws and regulations are enforced
by the National Environmental Enforcement Agency, OEFA (Organismo de Evaluación y Fiscalización Ambiental) which was created in 2008.
Sanctions range from warnings and fines to suspensions of activities and mitigation of environmental damages, among others. In this regard, a breach of
the obligations contemplated in the Environmental Impact Assessments in the hydrocarbons sector may originate fines up to 30,000 Tax Units
(approximately US$39 million or S/126 million) according to the applicable law.
83
The main environmental rules applicable to GMP’s hydrocarbon projects include:
• obtaining an environmental certification and adopting the necessary measures to prevent and/or mitigate environmental impacts
resulting from their activities;
• meeting minimum size, environmental and safety requirements applicable to worksites; handling and storing of hydrocarbons
pursuant to safety and environmental requirements; establishing programs to monitor environmental issues; and
• providing training on environmental matters related to employee and personnel activities and responsibilities, especially with respect
to regulations and procedures established for environmental protection and the environmental and legal consequences of
non-compliance.
Operation of Terminals
In accordance with the Glossary, Acronyms and Abbreviations for the Hydrocarbons Subsector approved by Supreme Decree
No. 032-2002-EM, a terminal is a facility that includes storage tanks, submarine lines or docks for receiving or dispatching liquid hydrocarbons and
facilities related to activities of storage and reception and/or dispatch of liquid hydrocarbon from/to vessels.
Consorcio Terminales and Terminales del Perú are two joint operations conducted by GMP and Oiltanking Peru S.A.C. which currently
operates ten of Petroperú’s terminals in Peru: (i) the South Terminals of Pisco, Mollendo, Ilo, Juliaca and Cuzco; and (ii) the North Terminals of Eten,
Salaverry, Chimbote and Supe; including Callao, respectively. Consorcio Terminales and Terminales del Perú provide hydrocarbons handling and
storage services in Peru for gasoline, aviation fuel and diesel, among others.
The operation of both the South and North Terminals was granted through the “South Terminal Operation Agreement” and the “North
Terminal Operation Agreement” (the “Operation Agreements”) dated February 2, 1998, by and among Petroperú and Consorcio Terminales. The
Operation Agreements resulted from two tenders in accordance with Legislative Decree No. 674, and mandate that Consorcio Terminales, as operator of
the terminals, be responsible for the storage, handling, additivation and dispatch of hydrocarbons in such facilities.
The initial term of the Operation Agreements was 15 years; however the parties agreed to extend the duration of the agreement to an
additional 18 months ending in August 2014. The purpose of this extension was to undertake the additional investments that were necessary to satisfy
the national demand increase and to perform operative and safety-related improvements to the facilities. In July of 2014, the operation agreements were
extended for an additional four years ending in July of 2018.
The South Terminal operation agreement has been extended to August 1, 2019. With respect to the North Terminal operation agreement, the
agreement with Consorcio Terminales expired on October 31, 2014, however, GMP and Oiltanking were granted a new operation agreement for the
terminal, this time under the ‘Terminales del Perú’ Consortium, which provided for a 20 year extension that will end on November 1, 2034.
Additionally, Terminales del Peru was granted with the operation agreement for the terminal del Centro-Callao, for 20 years commencing on
September 2, 2014 until September 1, 2034. In executing their operations, both Consorcio Terminales and Terminales del Perú are committed to develop
and follow a work program which must include an investment schedule. The work program performed included the installation of protection systems
and loading systems, among others, and was secured by a performance bond.
GMP’s activities as a part of Consorcio Terminales fall under the scope of the Hydrocarbons Storage Safety Regulation, approved by
Supreme Decree No. 052-93-EM. Consorcio Terminales is registered in the Hydrocarbon Registry of OSINERGMIN and is authorized to perform
transportation activities such as loading and unloading hydrocarbons from vessels on the terminals. This regulation establishes the conditions under
which GMP can operate and maintain storage facilities for hydrocarbons. For instance, the regulation specifies the technical requirements for storage
systems, which vary depending upon the kinds of hydrocarbons stored. Moreover, pursuant to this regulation, GMP must establish procedures to
minimize potential risks that these facilities present for employees, third parties and properties.
Gas Processing Plants
In accordance with the Glossary, Acronyms and Abbreviations for the Hydrocarbons Subsector, approved by Supreme Decree
No. 032-2002-EM, a processing plant is a facility where the natural characteristics of hydrocarbons are changed to break them into the different
compounds that comprise them, as well as the subsequent transformations to convert the hydrocarbons into fuel of specific qualities and suitable for
transportation. This includes the facilities where the impurities, hydrogen sulfide, carbon dioxide, water and hazardous components are removed from
natural gas.
84

Our processing and fractionation activities fall under the scope of regulations governing hydrocarbons refinement and processing including
regulations on the design, construction, operation and maintenance of refineries and hydrocarbons processing plants, the oil refining process, the
manufacture of natural asphalts, oil and lubricants, basic petrochemical activities and the processing of natural gas and condensates. In order to comply
with these regulations, GMP must take cautionary measures in order to protect the safety of its employees and its facilities, protect the environment,
preserve energy resources and ensure the quality of the products or services it delivers. For instance, GMP’s plant operations must be authorized by the
General Direction of Hydrocarbons and comply with fire safety regulations. In the event of an accident, GMP must notify the Peruvian Ministry of
Energy and Mines, the Peruvian Ministry of Labor and the Peruvian Social Security Administration.
Terms of our Concessions
Our concessions are subject to certain terms and conditions established in each concession agreement. During the term of the concessions,
we are responsible for the construction and maintenance of the infrastructure necessary to their operation. The concession agreements establish
minimum capital stock requirements for our concessionaire subsidiaries as follows: US$15 million (S/50 million), US$8 million (S/27 million),
US$0.8 million (S/2.7 million), S/46 million and S/100 million for Norvial, Survial, Canchaque, La Chira and the Lima Metro, respectively.
The concession agreements establish grounds for termination including mutual agreement of the parties thereto, force majeure and breach of
certain contractual obligations. Additionally, in the case of La Chira and the Lima Metro, the agreement can be terminated unilaterally by the grantor,
with the payment of compensation. On the expiration date, all of the assets that are essential for the operation of the concession are considered the
state’s property and no compensation is paid to the concessionaire.
In the event that changes in legislation or regulations that are exclusively related to the financial conditions of the earnings and/or costs
associated with the investment, operation or conservation of the infrastructure, affect the economic terms of the contract by 10% or more, the concession
agreements set forth economic terms adjustment mechanisms aimed at restoring the economic and financial equilibrium. See
“—Infrastructure—Principal Infrastructure Lines of Business.”
Real Estate
Since 1987, we have been operating in the Peruvian real estate sector. In 2008, we incorporated Viva GyM to concentrate the group’s
activities in this sector including promoting and managing real estate projects including affordable housing and housing and commercial real estate
projects.
Zoning Regulations
Article 79 of the Municipalities Organic Law (Law No. 27,972) establishes that municipal governments are the exclusive authority
responsible for approving urban and rural development plans, as well as the zoning of urban areas under their jurisdiction. Peruvian regulation states that
urban zoning refers to the division of a municipal jurisdiction in zones for specific usage, such as residential, commercial, industrial or mixed-use.
The main zoning rules applicable to our real estate projects include the following: obtaining a construction license from the corresponding
local municipality before commencing construction, reconstruction, conservation or repair of any property.
Environmental Regulations
The Environmental Protection Regulation for real estate, urbanism, construction and regularization related projects, approved by Supreme
Decree No. 015-2012-VIVIENDA (modified by the Supreme Decree No.° 019-2014-VIVIENDA and Supreme Decree No. 0082016-VIVIENDA), sets
out to prevent, mitigate, control and remedy negative environmental impacts that may arise from real estate developments. Prior to initiating
construction works, companies are required to obtain an environmental authorization from the Housing, Urbanism, Regularization or Construction
National Directorate of the Peruvian Ministry of Housing, Construction and Sanitation and to comply with the provisions set forth in the corresponding
environmental impact assessment.
The main environmental rules applicable to our real estate projects include the following:
• undertaking an environmental impact assessment; and
• requesting the environmental classification of our projects, which depends on the environmental risks associated therewith.
85

Licenses
Article 10 of the Single Revised Text of the Urban Habilitation and Buildings Law, approved by Supreme Decree No. 006-2017, establishes
the license requirements for urban habilitation and construction, depending on land size, the dimensions of the work to be undertaken and the financial
target.
Upon completion of the real estate development and construction stages, as the case may be, the following requirements must be met:
• for urban development, the reception of the works (recepción de la obra) must be requested to the corresponding municipal
government in compliance with Article 19 of the Single Revised Text of the Urban Habilitation and Buildings Law; and
• for construction, the conformity of the works (conformidad de obra) must be requested to the corresponding municipal government
in compliance with Article 28 of the Single Revised Text of the Urban Habilitation and Buildings Law, accompanying the request
with the construction plans and the construction statement (a description of the technical conditions and characteristics of the work
performed).
Exclusive and Common Property Real Estate Units Regimes
The Law on the Buildings Regularization, on the Factory Declaration Proceeding and on the Exclusive and Common Property Real Estate
Units Regime, approved by Law No. 27,157, establishes the legal regime applicable to real estate comprised of assets with exclusive and common
property, including, among others, (i) apartment buildings; (ii) condominiums; (iii) units under co-ownership; and (iv) commercial spaces, such as
galleries and malls. The foregoing construction projects must include internal by-laws prepared or approved by the sponsor or builder, or by the owners
with the vote of the majority of participating owners, the content of which is regulated in Article 42 of the aforementioned law. Articles 40 and 41 of the
foregoing law itemize the assets and services that qualify as common.
Owners of real estate units have the opportunity to choose between the exclusive and common property regime, and the independent and
co-ownership regime. The internal by-laws, the owner’s assembly minutes, all construction plans, architectural division plans, perimetric boundaries and
the construction statement must be registered in the Real Estate Registry of the corresponding jurisdiction. Upon completion of the proper registries,
units are registered independently from one another.
Fondo Mivivienda
The acquisition of affordable housing units developed by Viva GyM is often financed by Fondo Mivivienda S.A., a publicly owned
financial institution established in 1998 by Law No. 26,912, with the purpose of (i) promoting and financing the acquisition, bettering and construction
of houses, especially those of social interest; (ii) carrying out activities related to the fostering of capital flows to the housing financing market;
(iii) participating in the primary and secondary markets of mortgage credits; and (iv) contributing to the development of the capital markets.
Prevention of Money Laundering and Financing of Terrorism
SBS Resolution No. 789-2018 (that has replaced SBS Resolution No. 486-2008 as of March 15, 2018), as amended from time to time,
requires construction and real estate companies to implement a money laundering and terrorism financing prevention system, including, among others,
appointing a compliance officer, setting a registry of operations and notifying the Financial Intelligence Unit of the SBS, the entity responsible for
supervising and enforcing compliance to the resolution referred to herein, of any suspicious activity.
Public- and Private-Sector Contracts
Concar provides services in compliance with Peru’s Public Procurement Law and its Regulations, approved by Supreme Decree No.°
082-2019-EF (Texto Unico Ordenado de Ley de Contrataciones del Estado) and its Regulations, approved by Supreme Decree No. 344-2018, when
dealing with public counterparties; and with the regulation set forth in the Civil Code when dealing with private counterparties. Such regulations
establish the different types of selection processes which companies may undergo when contracting with the state, as well as the rules and conditions
applicable to such processes. They also establish general rules applicable to contractual relationships among private parties. See “—Engineering and
Construction” for more information on the applicable legal frameworks. Concar is registered with the Peruvian National Registry of Suppliers, required
to act as supplier for public entities.
86

Intellectual Property
Certain operations of GMI are protected by Peruvian Copyright Law, approved by Legislative Decree No. 822, specifically the engineering
drawings registered in the INDECOPI Copyright Registry. However, the company’s business and profitability are not dependent on patents or licenses;
industrial, commercial or financial contracts; or new manufacturing processes.
C. Organizational Structure
The following organizational chart sets forth our principal operating subsidiaries within our three business segments.
(1) In June 2018, the company transferred economic rights over 48.8% of the share capital of Norvial to Inversiones en Autopistas S.A. by
transferring its Class B shares. Our company continues to possess 67% of voting rights of Norvial and an economic interest of 18.2% of Norvial’s
share capital. JJC Contratistas Generales S.A. owns the remaining 33.00%.
(2) 36.10% of the share capital in Viva GyM is held by our subsidiary GyM.
The following charts set forth the principal activities of each of our three business segments:
87

The following is a brief description of our principal operating subsidiaries:
• Engineering and Construction:
• GyM S.A. (“GyM”), incorporated in Peru, is one of the oldest and largest construction companies in Peru. Graña y Montero
owns 98.24% of GyM; the remaining 1.76% is held by former and current company executives.
• Vial y Vives—DSD S.A. (“Vial y Vives—DSD”), incorporated in Chile, is an engineering and construction company
specialized in the mining sector and in providing services to the energy, oil and gas, and cellulose sector. GyM, through GyM
Chile SpA, owns 94.49% of Vial y Vives—DSD; Inversiones VyV S.A., a company controlled by the founders of Ingeniería y
Construcción Vial y Vives S.A., (which merged to form Vial y Vives—DSD) owns 1.36%; and the remaining 4.15% is held
by third parties.
• GMI S.A. Ingenieros Consultores (“GMI”), incorporated in Peru, is primarily engaged in engineering consultancy for projects
in the mining, hydrocarbons, electrical, agricultural, industrial, tourism and transportation sectors. Graña y Montero owns
89.41% of GMI; 5.0% is held by current and former company executives; and the remaining 5.59% is held by third parties.
• Morelco S.A.S. (“Morelco”), incorporated in Colombia, is a recognized specialist in electromechanical assemblies, civil
works, and services for the oil and gas and other energy sectors. Our subsidiary GyM S.A. owns 70.0% of Morelco, and the
remaining 30% is held by the Serna family in trust.
• Infrastructure:
• Toll Roads:
• Norvial, incorporated in Peru, is the concessionaire of the 183 km stretch between Ancón and Pativilca of the
Panamerican Highway. Norvial is comprised of common shares (Class A), and non-voting shares (Class B). In June
2018, the company transferred economic rights over 48.8% of the share capital of Norvial to Inversiones en Autopistas
S.A. by transferring its Class B shares. The company continues to possess 67% of voting rights of Norvial and an
economic interest of 18.2% of Norvial’s share capital. JJC Contratistas Generales S.A. owns the remaining 33.0%.
• Survial S.A. (“Survial”), incorporated in Peru, is the concessionaire of the 750 km highway between Marcona and Urcos
in Peru. Graña y Montero owns 99.995% of Survial, and the remaining 0.005% is held by Concar S.A.
• Concesión Canchaque S.A.C. (“Canchaque”), incorporated in Peru, is the concessionaire of the 78 km highway between
the towns of Buenos Aires and Canchaque in Peru. Graña y Montero owns 99.96% of Canchaque, and the remaining
0.04% is held by Concar S.A.
• Concar S.A., incorporated in Peru, is engaged in the operation and maintenance of infrastructure assets. Graña y
Montero S.A.A. owns 99.9983% of Concar and the remaining 0.0017% is held by GyM S.A.
• Mass Transit:
88

• GyM Ferrovías S.A. (“GyM Ferrovías”), incorporated in Peru, is the concessionaire of the Lima Metro. Graña y
Montero owns 75.0% of GyM Ferrovías; the other 25.0% is held by Ferrovías Participaciones S.A., a railway
infrastructure company.
• Water Treatment:
• Concesionaria La Chira S.A. (“La Chira”), incorporated in Peru, is the concessionaire of La Chira waste water treatment
plant in southern Lima, Peru. Graña y Montero owns 50.0% of La Chira; the other 50.0% is held by Acciona Agua S.A,
an affiliate of a waste water treatment and distribution company.
• Energy:
• GMP S.A. (“GMP”), incorporated in Peru, is engaged in the oil and gas business and provides hydrocarbon extraction
services to Perupetro S.A., a Peruvian state oil company; owns a gas processing plant; and, through a joint operation
with a Peruvian affiliate of Oiltanking GmbH, operates ten fuel terminals in Peru. Graña y Montero owns 95.0% of
GMP; the remaining 5.0% is held by a former company executive.
• Real Estate:
• Viva GyM S.A. (“Viva GyM”), incorporated in Peru, is focused on the development and sale of affordable housing and
housing, as well as other real estate projects such as office buildings and shopping centers. Graña y Montero directly
owns 63.44% of Viva GyM, with GyM owning an additional 36.10%; and the other 0.46% is owned by a company
executive.
D. Property, Plant and Equipment
Approximately 82.2% of our assets are located in Peru, with the remaining balance located in Chile and Colombia. At December 31, 2018,
the net book value of the company was US$139.3 million (S/.470.6 million). We currently lease certain machinery and equipment from vendors. The
term of our leasing contracts ranges from two to five years, depending on the nature of the equipment. Leased machinery and equipment are capitalized
for accounting purposes. Our principal executive offices, which we lease, are located at Av. Paseo de la República 4667, Surquillo, Lima 34, Peru and
Av. Petit Thouars 4957, Miraflores, Lima 18, Perú.
Insurance and Contingency Planning
We have insurance coverage for fire; strike, riot, malicious damage, vandalism and terrorism; loses or damages to construction machinery
and equipment; destruction or disappearance of property; civil liability, including physical harm to third parties; professional liability; transportation;
vehicle theft, collision, rollover, fire and accidents; and directors and officers liability. Additionally, we carry different policies for specific risks related
to our business segments. Our management considers this coverage to be sufficient to cover probable losses and damages, taking into consideration the
nature of our activities, the risks involved in our transactions and the advice of our insurance brokers.
We also have contingency plans in place in order to protect our company and the interests of our clients. In the event of an emergency, we
have procedures in place designed to minimize any resulting interruption in service to our most critical business processes.
ITEM 4A. UNRESOLVED STAFF COMMENTS
Not applicable.
ITEM 5. OPERATING AND FINANCIAL REVIEW AND PROSPECTS
The following discussion should be read in conjunction with our consolidated financial statements included in this annual report, which
have been prepared in accordance with IFRS issued by the IASB. The following discussion contains forward-looking statements that involve risks and
uncertainties. Our actual results may differ materially from those discussed in the forward-looking statements as a result of various factors, including,
without limitation, those set forth under “Part I. Introduction. Forward-Looking Statements” and “Item 3.D. Key Information—Risk Factors.”
89

A. Operating Results
Overview
We are the largest engineering and construction company in Peru as measured by revenues during 2018, and one of the largest publicly
traded engineering and construction companies in Latin America as measured by market capitalization as of December 31, 2018, with strong
complementary businesses in infrastructure and real estate services. With 85 years of operations, we have a long track record of successfully completing
the engineering and construction of many of the country’s landmark private and public sector infrastructure projects. Beginning in the mid-1980s, we
decided to leverage our engineering and construction expertise into complementary lines of business. We have also undertaken the engineering and
construction of large and complex projects outside our home market throughout our history. More recently, we have expanded our activities into other
key markets of the Latin American region through the acquisition of businesses with solid positions in those markets.
Recent Developments
Overview
We have participated in six consortia with affiliates of Odebrecht related to the construction and operation of infrastructure projects in Peru
during the period from 2005 to 2017. On December 21, 2016, Odebrecht entered into a plea agreement with U.S., Brazilian and other authorities in
which they admitted to making illegal bribery payments in connection with projects in various countries, including Peru. These projects include certain
consortia in which we participated. As a result of the plea agreement, Peruvian authorities have initiated congressional inquiries and criminal
investigations against our company and certain of our former directors and senior management.
Additionally, on January 24, 2017, the Peruvian government terminated the gas pipeline concession held by GSP, a consortium in which we
participated with Odebrecht affiliates, due to failure of GSP to obtain the required project financing by the stipulated deadline. The termination of the
GSP gas pipeline concession, despite the government payment contemplated under the concession contract, has had a material impact on our
consolidated financial results and backlog.
In response to these events, we have instituted a multi-step strategic action plan. This strategic action plan includes: (i) monitoring the
process for government payment resulting from the termination of the GSP gas pipeline concession; (ii) renegotiations with creditors of certain debts
that became due upon termination of the GSP gas pipeline concession contract; (iii) board approval of the sale of certain non-strategic assets to repay
debt related to GSP; (iv) an internal investigation relating to our participation in consortia with Odebrecht; (v) an assessment to strengthen our anti-
corruption compliance program; and (vi) changes to our board of directors and senior management.
See “Item 3.D. Key Information—Risk Factors —Risks Related to Recent Developments.”
Our Association with Odebrecht
We have participated in six construction and operation of infrastructure projects in Peru with affiliates of Odebrecht during the period from
2005 to 2017 (known as: IIRSA South Tranche II; IIRSA South Tranche III; IIRSA North; Electric Train Platform; Gasoducto Sur Peruano; and
Concesionaria Chavimochic S.A.C. (“Chavimochic”). Our stakes in these projects ranged from 17% to 33%. During 2018, none of these projects
(including Chavimochic) were currently ongoing. During the period from January 1, 2005 to December 31, 2018, 84% of the projects carried out by our
company, in terms of consolidated revenues, involved the private sector, while projects with Odebrecht accounted for less than 4% of our consolidated
revenues during this period. In its plea agreement, Odebrecht admitted to paying bribes in connection with the IRSA South Tranche II, the IRSA South
Tranche III and the Electric Train Platform.
Recent news reports have indicated that Odebrecht has executed a settlement and cooperation agreement with the Peruvian government
regarding several infrastructure projects in the country, including certain projects in which we have participated. According to news reports, under the
agreement Odebrecht has agreed to pay compensation to the Peruvian government over the course of several years and to cooperate with, and provide
evidence to, prosecutors in connection with ongoing investigations by this Peruvian government. According to news reports, former senior officers of
Odebrecht’s affiliate in Peru have indicated to Peruvian prospectors (sometimes in apparent contradiction with prior statements) that certain of our
former directors and senior management were aware that Odebrecht had made corrupt payments to government officials in connection with certain
projects in which we participated. We have undertaken an internal investigation and we continue to review and assess the past practices of our company,
to determine whether there has been any wrongdoing on the part of our former or current directors, officers and employees.
90
The Chavimochic concession, awarded in 2013 for the design, construction, operation and maintenance of major hydraulic works in
northern Peru, is the only project with a contract in effect in which we are currently associated with Odebrecht. Affiliates of Odebrecht own 73.5% of
the Chavimochic-related concessionaire company and construction consortium, and we hold the remaining 26.5% stake. As a result of the government’s
failure to deliver land required for the project, the project’s first phase, hydraulic works, cannot be concluded, and the project’s second phase cannot
begin. Since February 2017, the Chavimochic consortium has requested the termination of the concession in light of the government’s breach, and the
parties are currently in discussions, including for a potential sale of the project. As of December 31, 2018, our investment in this project amounted to
US$6.1 million (S/.20.5 million) and our portion of the performance guarantee amounted to US$9.5 million (S/.32.1 million).
Termination of the Gasoducto Sur Peruano Concession
In September 2015, we entered into a memorandum of understanding to invest US$215 million (S/.722 million) for a 20% stake in GSP, a
company that had previously been awarded the concession for the design, construction and operation of the southern gas pipeline, a project to deliver
natural gas to the southern region of Peru, particularly to the provinces of Cuzco, Arequipa, Puno and Moquegua. With our 20% investment
commitment made on November 2, 2015, an affiliate of Odebrecht owned a 55% interest and an affiliate of Enagás International, S.L. (“Enagas”)
owned a 25% interest in GSP. As of the date of this annual report, we have made total investments in the project in an amount of US$243 million
(S/.811 million).
On January 24, 2017, the Peruvian government terminated the concession due to GSP’s failure to obtain the required project financing by
the stipulated deadline. As a result, we recognized impairments with respect to our investment in GSP and our participation in CCDS.
In accordance with the concession contract, the Peruvian government is required to carry out an auction process to sell GSP’s assets and
obtain a new concessionaire within one year of the contract termination, with the funds raised in the sale to be used to pay the existing concessionaire
for its investment in the project. The amount of the termination payment is required to be no more than 100% and no less than 72.25% of the net
carrying amount (valor contable neto), as defined in the concession contract. Consequently, the auction process should initiate with a base price
equivalent to 100% of the net carrying amount. If the auction is unsuccessful in the first round, the government is required to undertake a second round,
with a base price equal to 85% of the net carrying amount; and, if the second round is unsuccessful, the government is required to undertake a third
round, with a base price equal to 72.25% of the net carrying amount. If a successful bidder is not obtained from such auction processes within one year
of the termination of the contract, the termination payment to the existing concessionaire would be 72.25% of the net carrying amount.
The Peruvian Ministry of Energy and Mines announced on April 18, 2017 that the auction process for the new concessionaire of the project
assets would be carried out during the first quarter of 2018, notwithstanding the requirements under the concession contract. On April 28, 2017, a third
party was appointed, through an adjudication process, as temporary custodian and administrator of the gas pipeline assets until the new bidder is
awarded the concession. Since that time, the Peruvian government has not indicated an intention to commence the auction process. Although the
concession contract provides that payment be made within one year of termination, the Peruvian Ministry of Energy and Mines has not made payment
or, to our knowledge, initiated the auction or payment process. Because this payment has not been made, GSP’s right to compensation pursuant to the
concession contract should be 100% of the net carrying amount.
In 2016, in connection with efforts to restructure or sell Odebrecht’s participation in GSP, due to the corruption scandal surrounding
Odebrecht, Odebrecht contractually agreed to subordinate its claims under the concession to the other project partners, Enagás and ourselves. As a
result, we and Enagas may be entitled to repayment of our percentage payment under the concession contract prior to Odebrecht. However, on
January 3, 2018, Odebrecht commenced arbitration proceedings against us, our subsidiary GyM and Enagás, seeking to invalidate the contractual
subordination.
On December 4, 2017, GSP voluntarily commenced bankruptcy proceedings in Peru. GSP’s assets will be liquidated purusant to Peruvian
law. GSP’s only substantially asset is the claim for government payment described above, as contemplated under the concession contract in the event of
termination.
On December 21, 2018, we formally initiated the procedure for direct negotiations with the Peruvian state regarding the termination
payment used by the government to GSP. This decision was taken considering that GSP had not taken any legal action to demand the payment despite
efforts by G&M at the general shareholders meeting of GSP. As a minority equity partner in GSP, G&M is entitled to initiate direct negotiations under
numeral 4 of Article 1219 of the Peruvian Civil Code which authorizes creditors to exercise the rights of its debtor, either by way of initiating our action
or assuming defense.
As of the date of this annual report, we have made investments in the GSP project of US$243 million (S/.811 million), which we financed in
part with borrowings. We have also assumed our proportional obligation to repay the project’s bridge loan in an amount of US$129 million (S/.436
million) and the project’s performance guarantee in amount of US$52.5 million (S/.177 million) and recorded them as other financial liabilities and
other accounts payable, respectively, in our consolidated financial statements as of December 31,
91
2018. We also recorded an account receivable for the same amounts, since we have the right to collect these amounts from GSP. According to our
estimates, under the terms of the concession contract, taking into account the subordination arrangement, and based on receiving payment equal to
72.25% of the net carrying amount, in accordance with IFRS, we recorded an impairment to our equity investment in GSP in the amount of
S/.593.1 million (approximately US$175.5 million) to reflect a write-off of equity value in GSP. Although GSP’s right to compensation pursuant to the
concession contract, due to the Peruvian government’s failure to pay, is 100% of the net carrying amount, our company has accounted for 72.25% due to
political uncertainty, GSP’s bankruptcy process with INDECOPI, and disagreements with the other GSP shareholders. In addition, our gross profit
decreased by S/.15.2 million (US$4.5 million) due to the impact of the early termination of the construction consortium (Consorcio Ductos del Sur), in
accordance with IFRS. Also, we registered a discount of the related long term account receivable in financial expenses of S/.77.4 million (US$22.9
million). Adding these effects, plus the deferred tax effect, we had a net impact of S/.498.0 (US$147.3 million) on our income statement for the year
ended December 31, 2016.
In addition, the termination of the GSP gas pipeline concession had reduced our backlog as of December 31, 2016, by US$855
(S/.2,889.0 million), representing 30.2% of our E&C backlog and 33.8% of our total backlog.
The effects of the termination of the GSP gas pipeline concession recorded in our consolidated financial statements as of and for the year
ended December 31, 2016 are based on our estimates, based on the terms of the concession contract, taking into account the subordination arrangement,
receiving payment equal to 72.25% of the net carrying amount and with the information that we have available to date. The actual impact on our results,
however, could change materially from our estimates. Moreover, we cannot assure you that we will receive the government payment provided for under
the GSP gas pipeline concession contract on a timely basis or at all. For more information, see notes 5(e) and 5(f) to our audited annual consolidated
financial statements included in this annual report.
Investigations
The Lava Jato commission of the Peruvian Congress, which was formed in November 2016 to investigate alleged bribes made by Brazilian
companies to Peruvian public officials, conducted congressional inquiries into our company and other construction companies in Peru. These
investigations have required certain of our company’s former board members and senior management to provide testimony at hearings before the
commission.
Peruvian prosecutors have included José Graña Miró Quesada, the former Chairman of our company, in an investigation for the crime of
collusion, and Hernando Graña Acuña, a shareholder, a former board member of our company and chairman of our subsidiary GyM, for the crime of
money laundering against the Peruvian government, each in connection with the IIRSA South project concession (tranches II and III), in which we
participated with Odebrecht. Gonzalo Ferraro Rey, the former Chief Infrastructure Officer of our company, has also been included in an investigation
for the crime of money laundering in connection with the same project.
In connection with investigations relating to the IIRSA South project concession (tranches II and III), the Peruvian criminal prosecutor
moved to charge our company and our construction subsidiary, GyM, as criminal defendants in connection with the projects. In response, the Peruvian
First National Preparatory Investigation Court (Primer Juzgado de Investigación Preparatoria Nacional) notified us of its decision to formally include
our company and GyM in its criminal investigation. We appealed the court’s decision and, in June 2018, the First Court of Appeals of the Superior
Court of Lima revoked the judicial order that indicted our company and GyM, among other corporate defendants, in the criminal investigation on
charges of collusion and other crimes and rejected the petition, without prejudice, made by the prosecutor to incorporate both companies in the
aforementioned process. Nevertheless, we cannot assure you that the criminal prosecutor will not file a new motion to charge our company and/or GyM
or that our position will ultimately prevail if such motion is filed.
Separately, in December 2018, the Peruvian First National Preparatory Investigation Court resolved to include our company and GyM as
civilly-responsible third parties in the investigations related to the IIRSA South project concession (tranches II and III) and GyM as a civilly-responsible
third party in the investigations related to Tranches 1 and 2 of the Lima Metro. These investigations are ongoing.
In July 2017, media reports alleged that certain construction companies in Peru, Brazil and Spain, including our company, colluded as a
“construction club” to receive public contracts. As a result of these reports, INDECOPI has initiated an investigation regarding the anti-competitive
activities of construction companies in Peru, including our company. In July 2017, the Peruvian government conducted a search of our facilities related
to these allegations. In January 2018 criminal prosecutors conducted a search of our facilities regarding the “construction club” investigation. We have
provided the information requested by the Peruvian criminal prosecutors. A former employee of GyM has been included in the investigation for
collusion and other alleged crimes. GyM has been included as civilly-responsible third party in the mentioned investigation along with eleven other
construction companies. In December 2018, GyM was formally included in this criminal investigation as civilly-responsible third party along with
eleven other construction companies.
92

We ce annot assure you that other of our former or current board members and executive officers will not be included in the foregoing
proceedings as civilly-responsible third parties or criminal defendants as well.
A conviction of corruption or resolutions with government authorities may lead to criminal and civil fines as well as penalties, sanctions,
injunctions against future conduct, profit disgorgement, disqualifications from directly and indirectly engaging in certain types of business, the loss of
business licenses or permits or other restrictions. Moreover, our involvement in corruption investigations, and any findings of wrongdoing in such
investigations, could further damage our reputation and have a material adverse impact on our ability to compete for business. Such investigations may
also adversely affect our ability to pursue strategic projects, and could potentially result in the termination or modification of certain existing contracts
or relationships. Also, such investigations may affect our company’s ability to secure financing in the future.
Emergency Decree and Subsequent Legislation
On February 13, 2017, the President of Peru issued an emergency decree (decreto de urgencia N° 003-2017), prohibiting groups that have
been, or whose officers or representatives have been convicted of, or have admitted to, corruption, money-laundering or similar crimes (whether in Peru
or elsewhere) from, among other things, transferring or selling any assets related to investments in Peru, including the proceeds of asset or equity sales,
or sending money abroad without a governmental authorization. Section II of Law 30737, promulgated in March 2018 to replace the aforementioned
emergency decree, includes companies that have been consortium partners of groups that have been, or whose officers or representatives have been,
convicted of, or have admitted to, corruption, money-laundering or similar crimes. Our company and our subsidiary GyM are two such companies. The
law requires that they: suspend money transfers abroad; implement a compliance program and disclose information to competent authorities; and create
a trust of assets to guarantee eventual compensation in favor of the Peruvian government. The Peruvian government is required to determine the amount
of such guarantee pursuant to Law 30,737. On May 9, 2018, Supreme Decree No. 096-2018-EF was passed, which provides guidelines for such
determination. Following discussions with the Peruvian government, in March 2019, we established the trust in favor of the Peruvian government and
funded the trust in the amount of S/.79.1 million (US$23.4 million) by assigning shares of our subsidiary GMI to such trust. We cannot assure you that
the Peruvian government will not claim the assets set forth in this trust or require that our company place additional assets in trust. Furthermore, we
cannot assure you that these laws will not be expanded, or that subsequent laws will not be passed, that impose further obligations or restrictions on our
company and our subsidiaries. Management has estimated that the value of the contingency for the matters described above should not exceed
US$45.8 million (S/.148.4 million).
Strategic Action Plan
In response to the events described above, we have instituted a multi-step strategic action.
Negotiation with Creditors
We have renegotiated three debt instruments related to GSP as follows:
• Syndicated Loan Related to our Equity Investment in GSP: As a result of the termination of the GSP gas pipeline concession, our
syndicated loan used to finance our equity investment in GSP became due. The principal amount outstanding under our syndicated
loan was US$37.50 million (S/126.70 million) as of December 31, 2018, and is US$31.45 million (S/103.95 million) as of the date
of this annual report. On June 27, 2017, we entered into an amendment to the credit agreement. According to the terms of the
amendment our syndicated loan matures on 2020, with required prepayments to be made with the proceeds of asset sales of 40% in
the first year and an additional 30% in the second year of the amendment. The syndicated loan continues to accrue interest at LIBOR
plus 4.90% per year. In addition, we are prohibited from paying dividends until the loan is repaid in full. Also, we have provided
additional security interests, including: (i) a first lien on our shares of GyM and Concar; (ii) a second priority lien on our shares of
Almonte; (iii) a first lien on certain real estate properties in Surquillo; (iv) liens on certain related amounts; (v) a second priority lien
on our shares of CAM and CAM Servicios; and (vi) a first lien on cash flows from the sale of certain assets. For additional
information on our syndicated loan, see “Item 5.B. Operating and Financial Review and Prospects—Liquidity and Capital
Resources”;
• Proportional guarantee of the GSP Bridge Loan: As a result of the termination of the GSP gas pipeline concession, our proportional
guarantee of the GSP bridge loan became due. On June 27, 2017 we entered in a new, US$78.7 million (S/.264.8 million) term loan
with Natixis, BBVA, SMBC and MUFJ, the proceeds of which were used to repay the GSP bridge loan. The new term loan matures
on 2020, with required prepayments to be made with the proceeds of asset sales of 40% in the first year and an additional 30% in the
second year of the closing date. The term loan accrues interest at
93

LIBOR plus 4.50% per year, which will increase to 5.00% during the second year and to 5.50% during the third year. In addition, we
will be prohibited from paying dividends until our guarantee is repaid in full. Also, we have provided the following security interests
to secure repayment of the term loan: (i) a first lien on our rights to receive the termination payment derived from the GSP
termination, (ii) a second priority lien on our shares of GyM and Concar; (iii) a second priority lien on our shares of Almonte; (iv) a
second priority lien on certain real estate properties in Miraflores and Surquillo; (v) a second priority lien on our shares of CAM and
CAM Servicios; and (vi) a first lien on cash flows from the sale of certain assets. The principal amount outstanding under the new
term loan was US$63.47 million (S/.214.46 million) as of December 31, 2018, and as of the date of this annual report, there is
US$47.25 million (S/.156.16) outstanding on the term loan.
• Proportional Repayment Obligations under the GSP Performance Guarantee: Upon the termination of the GSP gas pipeline
concession, our proportional repayment obligations under the GSP performance guarantee from Chubb Insurance Company in the
amount of US$52.5 milllion (S/.177.4 million) became due. On December 6, 2018, we paid the final installment with respect to our
our obligations to Chubb Insurance Company.
• In addition, in July 2017, we entered into a financial stability framework agreement with certain banks providing for new lines of
credit to support our financial stability and liquidity. As of December 31, 2018 and the date of this annual report, there is
US$59.44 million (S/200.83 million) outstanding.
For more information, see “—Liquidity and Capital Resources—Indebtedness.” We are currently in default under the financial stability
framework agreement. For more information, see “Item 13. Default. Dividend Arrearages and Delinquencies.
Asset Sales
In order to strengthen our liquidity and financial flexibility, particularly in the event of potential delays in receiving the government
payment contemplated under the GSP gas pipeline concession contract, and make payments on our debt related to the GSP project, our board has
approved the sale of non-strategic assets in the amount of up to US$350 million (S/.1,176 million) in proceeds.
As of the date of this annual report, we have entered into the following transactions:
• Sale of Cuartel San Martín: On February 3, 2017, our subsidiary Viva GyM sold all of its interests in the Cuartel San Martín real
estate project, which represented a 50% stake in the project, to its partner Urbi Propiedades S.A. for US$50 million (S/.163 million);
• Sale of Promoción Inmobiliaria del Sur: On February 24, 2017, our subsidiary Viva GyM sold all of its interests in PRINSUR,
which owns undeveloped land located in Lurin, representing 22.5% of the share capital, to its partner Inversiones Centenario S.A.A.
for US$25 million (S/.81 million);
• Sale of Shares in Red Eagle Mining Corporation: In February and March 2017, our subsidiary Stracon GyM sold shares of Red
Eagle Mining Corporation, representing 9.97% of the share capital, in a stock exchange transaction for US$13.3 million (S/.43.0
million);
• Sale of our Interest in COGA: On April 24, 2017, we sold our 51% interest in COGA to our partners Enagas and Carmen
Corporation for a price of US$21.5 million (S/.69.8 million). COGA is in charge of the operation and maintenance of TGP, the
trans-Andean gas pipeline from Camisea to the Pacific coast in Peru;
• Sale of our Interest in GMD: On June 6, 2017, we sold our 89.19% interest in GMD, our IT services subsidiary, to Advent
International for a price of US$84.7 million (S/.269.9 million);
• Sale of the building Petit Thouars: On September 29, 2017, we sold a building located in block 49 of Petit Thouars Avenue to
VOLCOMCAPITAL Deuda Perú for a price of US$20.5 million (S/.68.9 million);
• Sale of Almonte properties. On May 31, 2018, Almonte signed an agreement to sell 4,208,769 square meters of land for an aggregate
price of US$92.7 million. The amount of the sale proceeds corresponding to our company is proportional to its 50.45% ownership
stake; and
• Sale of our interest in CAM Chile and CAM Servicios: On December 4, 2018, we sold our 73.16% interest in CAM Chile and CAM
Servicios, our subsidiaries engaged in the operation and maintenance of electric utilities, to GDF Suez Energie Services Chile
Holding SpA and ENGIE Services Perú S.A., for a price of US$18.75 million (S/63.34 million).
94
• On June 11, 2018, we signed an investment agreement with BCI Perú, to monetize future dividends of Norvial. The amount of the
transaction is US$42.3 million, the proceeds of which were applied to the reduction of indebtedness related to GSP.
Additionally, on April 11, 2018, we sold our 88% interest in Stracon GyM for a price of US$77 million (S/.249 million).
Internal Investigation
In light of the events described above, we conducted an internal investigation led by external counsel with respect to our participation in
consortia with Odebrecht. The Risk, Compliance and Sustainability Committee of our board of directors was charged with monitoring the progress of
the internal investigation. The internal investigation, which concluded on November 1, 2017, identified no evidence to conclude that any company
personnel engaged in bribery in connection with any of our company’s public projects in Peru with Odebrecht or its subsidiaries, or that any company
personnel was aware of, or knowingly participated in, any corrupt payments made in relation to such projects.
Strengthening of Anti-Corruption Program
In 2017, we approved a plan to continue strengthening our anti-corruption compliance program. This has included the creation of a Risk,
Compliance and Sustainability Committee of our board of directors, the creation of a Corporate Risk and Compliance Function, the hiring of a Chief
Risk and Compliance Officer, and the reinforcement of our procedures related to the third-party risk evaluation and mitigation.
New CEO, New Board of Directors and Board Committee
On February 27, 2017, our former chairman of the board, our former CEO and board member, and our board member and the former
chairman of the board of our subsidiary GyM resigned from their positions. Effective March 2, 2017, we appointed a new CEO. On March 31, 2017, our
shareholders at the annual shareholders’ meeting appointed a new board of directors, replacing seven of our nine existing directors. For more
information, see “Item 6. Directors, Senior Management and Employees.”
Securities Class Action
Two securities class action complaints have been filed against us and certain of our former directors and current and former executive
officers in the Eastern District of New York during the first quarter of 2017. These complaints were consolidated into a single class action. The plaintiffs
filed a consolidated amended compliant on May 29, 2018. We moved to dismiss the complaint during the fourth quarter of 2018. The court has not yet
ruled on that motion, but has granted plaintiffs leave to file a further amended complaint. We continue to believe that we have meritorious defenses to
the claims asserted, and we intend to defend ourselves vigorously in these matters.
Restatement of Financial Results for Fiscal Year 2017
Our consolidated financial statements for the year ended December 31, 2017 included in this annual report have been restated. In our consolidated
financial statements included in our annual report on Form 20-F for the year ended December 31, 2017, we inadverently presented the gain on the sale
of GMD under “Gain from the sale of investments” in error and, accordingly, we have restated our 2017 income statement and the related notes to
reflect GMD as a discontinued operation. The previously issued consolidated financial statements of the company for the 2017 fiscal year (and the
related audit opinion) included in the company’s annual report on Form 20-F for the year ended December 31, 2017 should not be relied upon. For more
information, see note 2.31 to our audited annual consolidated financial statements included in this annual report.
Reclassification
On June 6, 2017, we sold our 89.19% interest in our former subsidiary, GMD. As a result, we present GMD as a discontinued operation in
our audited annual consolidated financial statements for the years ended December 31, 2017 and 2018. We have reclassified our consolidated financial
for the year ended December 31, 2016, and selected financial information for the years ended December 31, 2014 and 2015, included in this annual
report, to show GMD as a discontinued operation. In addition: (i) on December 4, 2018, we sold our 73.16% interests in each of CAM and CAM
Servicios, (ii) on April 11, 2018, we sold our interest in Stracon GyM, and (iii) we are in the process of marketing our subsidiary Adexus for sale. As a
result, we present CAM, CAM Servicios and Stracon GyM as discontinued operations, and Adexus as an investment held for sale, in our audited annual
consolidated financial statements for the year ended December 31, 2018. We have reclassified our consolidated financial information for the years
ended December 31, 2016 and 2017, and the selected financial information for the years ended December 31, 2014 and 2015 included in this annual
report, to show CAM, CAM Servicios and Stracon GyM as discontinued operations as Adexus as an investment held for sale.
95

Internal Control over Financial Reporting
In 2018, we identified material weaknesses regarding our internal control over financial reporting. For more information, see “Item 3. Key
Information—D. Risk Factors—We have identified material weaknesses in our internal control over financial reporting, and if we cannot maintain
effective internal control or provide reliable financial and other information in the future, investors may lose confidence in the reliability of our
consolidated financial statements, which could result in a decrease in the value of our ADSs” and “Item 15. Controls and Procedures.”
Factors Affecting Our Results of Operations
General
Peruvian, Chilean and Colombian Economic Conditions
73.5%, 72.0% and 86.1% of our revenues in 2016, 2017 and 2018 were derived from activities in Peru. Accordingly, our results of
operations are substantially affected by economic conditions in the country and our growth is driven in significant part by growth in the Peruvian
economy. In addition, 11.4%, 17.3% and 5.8% of our revenues in 2016, 2017 and 2018 were derived from activities in Chile and 9.2%, 4.7% and 8.1%
of our revenues in 2016, 2017 and 2018 were derived from activities in Colombia.
The Peruvian real GDP has grown at an average rate of 3.5% during the three years from 2016 to 2018. With increasing disposable income
and an expanding middle class, private consumption grew at an average annual rate of 3.2% in real terms from 2016 to 2018. In 2016, 2017 and 2018
private investment decreased at an average rate of 5.9% and increased 0.1% and 4.4%, respectively, in real terms, primarily due to lower investment in
mining. Inflation in Peru, as measured by the change in the consumer price index, was 3.2% in 2016, 1.4% in 2017 and 2.2% in 2018. The sol
appreciated versus the U.S. dollar by 1.5% in 2016 and 3.3% in 2017 and depreciated by 16.9% in 2018. Peru’s sovereign debt has been rated
investment grade by S&P, Fitch and Moody’s. At the end of 2018, Peruvian sovereign debt had one of the highest credit ratings in the South American
region, rated BBB+ by S&P (August 2013) and Fitch (March 2019), and A3 by Moody’s (August 2018).
The Chilean economy grew at an average annual rate of 2.3% during the three years from 2016 to 2018 in real terms. Total fixed investment
increased at an annual average rate of 2.5% in real terms during the three years from 2016 to 2018. Inflation in Chile, as measured by the change in the
consumer price index, was 2.7% in 2016, 2.3% in 2017 and 2.6% in 2018. The Chilean peso appreciated versus the U.S. dollar by 5.7% in 2016 and
7.8% in 2017 and depreciated by 12.8% in 2018. Chilean sovereign debt has the highest rating in the South America region, rated A+ by S&P (July
2017), A1 by Moody’s (July 2018) and A by Fitch (February 2019).
The Colombian real GDP grew at an average annual rate of 2.2% during the three years from 2016 to 2018. Inflation has decreased during
recent years, with inflation of 5.8% in 2016, 4.1% in 2017 and 3.1% in 2018. The Colombian peso apreciated against the U.S. dollar by 4.7% in 2016
and 0.6% in 2017 and depreciated by 7.5% in 2018. Colombia’s sovereign debt was rated BBB by Fitch in November 2018, BBB- by S&P in December
2017, and Baa2 by Moody’s in February 2018.
From 2014 to 2018 our revenues declined at a compound annual growth rate (CAGR) of 4.3%excluding acquisitions and asset sales). Our
organic revenues decreased 2.9% in 2018 from 2017, principally as a result of lower activity levels in our E&C segment in 2018.
Fluctuations in Exchanges Rates
We estimate that in 2018, 32.5%, 55.6% and 11.8% of our revenues were denominated in soles, U.S. dollars and other currencies
respectively, while 63.2%, 23.1% and 13.7% of our cost of sales during the year were denominated in soles, U.S. dollars and other currencies. In
addition, as of December 31, 2018, 56%, 41% and 3% of our total debt was denominated in soles, U.S. dollars and other currencies, respectively.
Accordingly, fluctuations in the value of these currencies can materially affect our results of operations. When the sol appreciates against the U.S.
dollar, our operating margins tend to decrease; when the sol depreciates against the U.S. dollar, our operating margins tend to increase (if everything
else were held equal). Conversely, the appreciation of the sol against the U.S. dollar tends to decrease our indebtedness and financial expenses as
expressed in soles; and the depreciation of the sol against the U.S. dollar tends to increase our indebtedness and financial expenses as expressed in soles.
We enter into derivatives, from time to time, to hedge part of our financial exposure to currency fluctuations. The value of the sol to the U.S. dollar
appreciated in 2016 and 2017, and depreciated in 2018, which impacted our results of operations.
We have included estimates of the approximate effects of fluctuations in exchange rates on our consolidated and segment revenues and
costs of sales in “—Results of Operations.” These estimates were calculated based on daily average exchange rates and estimated aggregate revenues
and cost of sales denominated in U.S. dollars, Chilean pesos and Colombian pesos, and were not calculated on a transaction by transaction basis. For
additional information on the effect of exchange rate fluctuations on our results of operations, see “Item 11. Quantitative and Qualitative Disclosures
about Market Risk—Exchange Rate Risk.”
96

Cost of Labor, Third-Party Services and Inputs
The largest components of our costs are: labor, which represented 25.3% of our cost of sales and 37.9% of our administrative expenses in
2018; services provided by third parties, which represented 33.0% of our cost of sales and 35.2% of our administrative expenses in 2018; and inputs
(including raw materials), which represented 23.4% of our cost of sales in 2018. For a breakdown of our cost of sales and administrative expenses, see
note 27 to our audited annual consolidated financial statements included in this annual report.
Our cost of labor is influenced by, among other factors, the number of our employees, as well as inflation, competition we face for
personnel in each of our business segments and the availability of qualified candidates. From 2016 to 2017 our personnel charges increased by 13.5%,
and from 2017 to 2018 our personnel charges decreased by 15.2%. Services provided by third parties include: subcontracting in our E&C segment, such
as carpentry work; advisory and consultancy work, including external audit and legal services; and renting of equipment. From 2016 to 2017 our costs
related to services provided by third parties decreased by 27.7% and from 2017 to 2018 our costs related to services provided by third parties decreased
by 15.4%. The principal inputs we use are fuel, cement and steel, which in the aggregate represented 20% of our total input costs in 2018. Our costs for
these inputs are affected by, among other factors, the growth or decline of our operations, market prices, including global prices in the case of fuel, and
transportation costs. We do not have long-term contracts for the supply of our key inputs. From 2016 to 2017, our input costs increased by 26.1%, and
from 2017 to 2018, our input costs decreased by 40%. Our cost of labor, third party services and inputs decreased in 2018 primarily due to lower activity
levels in our E&C segment.
Acquisitions and Dispositions
In September 2015, we acquired a 20% participation in the shareholder’s equity of Gasoducto Sur Peruano, the concessionaire of the
southern gas pipeline project for a total of US$215 million (S/.722 million). In addition, our subsidiary GyM participated with a 29% stake in the
construction consortium for this project (Consorcio Ductos del Sur), which represented approximately US$1.0 billion of our backlog as of December 31,
2015. The GSP gas pipeline concession was terminated on January 24, 2017, and as a result, we recognized impairments with respect to our investment
in GSP and our participation in CCDS. For more information, see “Item 5.A. Operating and Financial Review and Prospects—Operating
Results—Recent Developments.”
In order to strengthen our liquidity and financial flexibility, particularly in the event of potential delays in receiving the government
payment contemplated under the GSP gas pipeline concession contract, and make payments on our debt related to the GSP project, our board approved
the sale of non-strategic assets in the amount of up to US$350 million (S/.1,176 million) in proceeds. For a detailed description of the sale of these
non-strategic assets, see “Item 5.A. Operating and Financial Review and Prospects—Operating Results—Recent Developments—Strategic Action
Plan.”
Cyclicality
Our Engineering and Construction segment is cyclical as a result of being closely linked to the conditions, performance and growth of the
end-markets we serve, which include, among others, the mining, power, oil and gas, transportation, real estate and other infrastructure sectors in Peru, as
well as the mining sector in Chile and, the energy sector in Colombia. These industries tend to be cyclical in nature and tend to be affected by factors
such as macroeconomic conditions, climate conditions, the level of private and public investment, the availability of credit, changes in laws and
regulations and political and social stability. As a result, although downturns impact our entire company, our Engineering and Construction segment has
historically been subject to periods of very high and low demand. The mining and oil and gas sectors, in particular, are also driven by worldwide
demand for the underlying commodities, including, among others, silver, gold, copper, oil and gas, which can be affected by such other factors as global
economic conditions and geopolitical affairs. Furthermore, prevailing prices and expectations about future prices for minerals or oil and gas, costs of
exploration, production and delivery of product and similar factors can have a significant impact on our clients’ exploration and production activities
and, as a result, on their demand for our engineering and construction services.
Our Real Estate segment is also cyclical and is significantly affected by changes in general and local economic conditions, such as
employment levels and job growth, availability of financing for home buyers, interest rates, foreclosure rates, inflation, consumer confidence and
housing demand. In addition, in our Infrastructure segment, our Energy line of business is cyclical and affected by global supply and demand for oil.
97

Seasonality
Our business, on a consolidated basis, has not historically experienced seasonality. In our Infrastructure segment, we have experienced
moderate seasonality at (i) Norvial, due to heightened vehicular traffic activity during the summer season in the first quarter of the year, and (ii) GMP’s
gas processing plant, which typically closes for maintenance during the rainy season in the first quarter of the year, as demand for gas is lower during
this time.
Engineering and Construction
The principal driver of our E&C results is economic growth in Peru, particularly private and public investment in the country’s mining,
power, oil and gas, transportation, real estate and other infrastructure sectors. See “—Peruvian and Chilean Economic Conditions.”
Appropriate pricing and budgeting of our engineering and construction projects is also key to our results of operations in our E&C segment
and can be affected by such factors as competition, direct negotiations with clients as opposed to competitive bidding processes, the accuracy of our
estimation of project costs and unexpected cost overruns. The types of contracts in this segment consist of cost-plus fee, unit price, lump-sum and EPC
contracts. For a description of our E&C contracts, see “Item 4.B. Information on the Company—Business Overview—Engineering and
Construction—Contracts.” The nature of our contractual arrangements can affect our margins, both because, depending on the type of contract, the
burden of cost overruns may be placed on the client or on us, and because certain contractual arrangements tend to have lower gross margins. For the
years 2017 and 2018, our E&C segment has trended towards more contractual arrangements based on cost—plus fee and EPC contracts. The types of
contractual arrangements we enter into in our E&C segment vary significantly from period to period.
During 2016, we suffered lower activity levels in our E&C segment due to the completion of two large mining projects at the end of 2015
(Las Bambas and Cerro Verde). These lower activity levels were not fully compensated by new works at the GSP gas pipeline project in Peru and, to a
lesser extent, works in Chile and Colombia. The 2016 presidential elections in Peru and the subsequent change in administration also contributed to
lower activity levels in our E&C segment during 2016.
During 2017, activity levels in our E&C segment remained low as a result of the cancellation of the GSP and Chavimochic projects, and
also due to the ending of the bioenergy Zona Franca project in Colombia. The activity levels in 2017 in the E&C segment have been affected by political
and other issues related to the investigations described in “Item 5.A. Operating and Financial Review and Prospects—Recent Developments.”
During 2018, activity levels in our E&C segment decreased as a result of the divestment plan executed by our company. In April 2018, our
subsidiary GyM sold its 87.59% interest in Stracon GyM, our subsidiary that engaged contracts mining services in Perú. We also experienced lower
activity levels in our business units engaged in electromechanical and civil works.
Infrastructure
Traffic and Fees for Toll Roads
The majority of our toll roads revenues derive from the Norvial concession. Unlike our other toll road concessions, our revenues from the
Norvial concession depend on traffic volume. Traffic volume on the Norvial road increased 3.2% from 2016 to 2017 and 6.3% from 2017 to 2018
(based on vehicle equivalents, as defined in “Item 4.B. Information on the Company—Business Overview—Infrastructure—Principal Infrastructure
Activities—Toll Roads—Norvial”) due to the lower traffic resulting from the climactic phenomenon “El Niño,” which generated floods and mudslides
in northern Peru, during the first quarter of 2017. For the Norvial toll road, the toll rate is set out in the Norvial concession agreement and adjusted in
accordance with a contractual formula that takes into account the sol/U.S. dollar exchange rate and Peruvian and United States inflation. Under our
Survial and Canchaque road concessions, our revenues consist of annual fees paid by the Peruvian Ministry of Transport and Communications in
consideration for the operation and maintenance of the roads, which can vary depending on the amount of road maintenance required due to road wear
and tear.
Under the Norvial concession, we are required to expand certain stretches of the highway, by, among other things, adding two additional lanes. The first
stage of construction was completed in 2008 and the second stage started on April 2014 and is expected to be completed by October 2019 due to delays
in the government’s delivery of lands required for the project. We estimate that Norvial’s capital investment for the second stage will be approximately
US$95 million (S/.319.2 million).
98

Mass Transit
We generate revenue from our Lima Metro concession based on kilometers travelled per train, with the fee per kilometer, the number of
trains required to be in operation and the number of kilometers that we are required to travel established by the terms of the concession. Our revenues do
not depend on passenger traffic volume. Our results in this concession between 2016 and 2018 were influenced by the timely acquisition, set up,
reliability and proper operation of our trains. We currently have all 44 trains in operation (including three backup trains).
On July 11, 2016, we entered into the fourth addendum to the Lima Metro concession contract in order to expand the transportation capacity
of Line One. In accordance with the fourth addendum, the expansion project involves: (i) the purchase of 20 new trains with five-car from Alstom;
(ii) the purchase of 39 new cars from Alstom, to be coupled with the 19 existing Alstom trains and 20 new Alstom trains, resulting in a consolidated
fleet of 39 Alstom trains with a six-car configuration; and (iii) the expansion and improvement of the existing infrastructure, including revamping and
improvement of five stations, improvements in the electrical systems, a new access route to the maintenance workshop and new switches on the main
track.
Energy
A part of the revenues in our Infrastructure segment depends on global prices for oil. Under our hydrocarbon extraction service contracts,
we are entitled to a variable fee, which is based on the level of production of each field and a basket of international crude oil prices. Under our
contracts, we acquire the extracted hydrocarbons and pay royalties, which are also based on a basket of international crude prices and the level of
production. Historically, oil prices have been volatile and are likely to be volatile again in the future. During 2016, 2017 and 2018, average Brent crude
prices were approximately US$43.55, US$53.02 and US$69.69 per barrel, and the average fee we received in these years was US$38.54, US$49.19 and
US$64.72 per barrel of extracted oil, respectively. During the first quarter of 2019, the Brent crude price was approximately US$63.08 per barrel and
our fee was approximately US$58.83 per barrel of extracted oil. Because our activities are conducted in mature oil fields, which have been producing oil
for over 100 years in the case of Block I, approximately 100 years in the case of Block III, approximately 95 years in the case of Block IV and for over
50 in the case of years Block V, our oil production depends primarily on the level of our drilling and production activities.
Our Pariñas gas processing plant has a long-term delivery and gas processing and fractionation contract with Empresa Eléctrica de Piura
S.A. (ENEL), a thermal power generation subsidiary of the Endesa group. Under this contract, ENEL delivers natural gas that it purchases from onshore
and offshore gas producers in the Talara area. We are responsible for all operating costs of the gas processing plant but are entitled to keep revenues
from the sale of all resulting natural gas liquids to third parties after delivery of all dry gas and payment of a variable royalty to ENEL. Approximately
75% of the total volume of natural gas processed by our Pariñas gas processing plant depend upon gas volumes demanded by ENEL for its gas-fired
turbines, which can vary significantly. 15% of the volume of natural gas is extracted from our Block I. Prices for natural gas liquids can also fluctuate
significantly and are affected by market prices for crude oil. We processed 33.2 MMcf per day during 2016, 30.57 MMcf per day during 2017 and 30.12
MMcf per day during 2018. These volumes vary per month and depend upon the power dispatch curve of ENEL among Peruvian power generation
plants. In rainy months (December to April) where hydroelectric power generation in Peru is typically higher, gas volumes demanded by ENEL are
lower than in dryer months (May to November) in which activity of thermal generators tends to be higher.
In connection with our fuel storage terminal business, under three operation contracts with Petroperu, we receive revenues related to
monthly reserved volume in storage tanks for refined crude products (storage fee) and for volumes loaded and delivered into railroad cars or cistern
trucks to each terminal (throughput fee). These fees are adjusted annually to account for U.S. inflation. Our fuel storage activities in the North and
Central terminals are carried out under 20-year contracts, which expire in 2034. Our contract for the operation of the South terminals was to expire in
August 2017 but was extended for an additional year until August 2018 and again in July 2018 until August 2019.
Awarding and Timing of Infrastructure Concessions and Government Contracts
The results of operations of our Infrastructure segment are affected by our ability to win new concessions and government contracts, which
depend in part on government policies and our ability to compete effectively. As of December 31, 2018, we had six concessions as well as long-term
government contracts in this segment. These include the concession for Via Expresa Sur, with respect to which we recently received a letter from the
Municipality of Lima in which the Municipality communicated its desire to terminate the concession, and the concession for Chavimochic, for which
Chavimochic has requested the termination of the concession in light of the government’s failure to deliver the required lands for the project. Joint
operations in which we participate have been awarded one additional concession for Via Expresa Javier Prado for the expansion of another major
highway within the city of Lima. We cannot assure you that we will be able to negotiate the pending concessions on favorable terms or at all. A
consortium led by Odebrecht Latinvest, in which we acquired a 20% stake in September 2015, was awarded the concession for the southern gas pipeline
project in July 2014, however, the GSP gas pipeline concession was terminated by the Peruvian Ministry of Energy and Mines on January 24, 2017. For
more information, see “Item 5.A. Operating and Financial Review and Prospects—Operating Results—Recent Developments.”
99

Our results in the operation and maintenance of infrastructure assets depend on our ability to obtain contracts from the government or
infrastructure concessionaires, such as those in our Infrastructure segment, which depend on government policies and our ability to compete effectively.
In 2016, we received two new contracts (Chiquibambilla and Chincaypuijio, each with Provías Nacional); and in 2017, we were awarded two new
contracts (Cora Cora and C.V. Pasco, also with Provías Nacional). We typically obtain higher revenues from these contracts during the commencement
of services as we bring the road to proper operating condition, and lower revenues at the end of the contract term as services wind down.
Our results in our Infrastructure segment are also affected by the timing of the commencement of operations under our concessions, as well
as when we were required to undertake significant capital investments or major construction works under the terms of our concessions. Under our
Norvial and Lima Metro concessions, we are required to undertake capital investments during the initial years of the concessions for which we are
compensated throughout the term of the concessions by our toll rate in the case of the Norvial concession and tariffs in the case of the Lima Metro
concession. Under our Survial, Canchaque and La Chira concessions, we generate revenues in our Infrastructure segment from our construction
activities during the pre-operational phase, and once operations commence we generate revenues from fees related to operation and maintenance.
Survial, Canchaque and La Chira have financed their construction costs through the sale of government certificates of construction to financial
institutions at a discount from face value. Certificates of construction are negotiable instruments that the Peruvian government typically delivers upon
completion of each stage of a project and which entitle the holder to receive payment from the government equal to the capital investment made in the
corresponding stage upon completion of the entire project. Accordingly, the results of our Infrastructure segment may be affected by the discount rates
obtained on the sale of government certificates of construction. For more information on our obligations and compensation under our concessions, see
“Item 4.B. Information on the Company—Business Overview—Infrastructure.”
Real Estate
The results of operations of our Real Estate segment are driven by the number of units we develop and deliver in a reporting period, our mix
of unit sales (affordable housing versus housing), unit prices, land purchase prices and our costs of construction. These results are also affected by a
number of factors that may impact the Peruvian real estate sector as a whole, including: the availability of government subsidies for affordable housing;
prices of suitable land in particular areas; regulation of real estate development imposed by national, regional and local laws and regulators, and the time
required to obtain applicable construction permits and licenses; the unemployment rate and wage levels; prevailing interest rates and availability of
financing; the supply in the market; the level of customer interest in our new projects; and our costs, such as the price of labor, materials, insurance,
taxes and other public charges. We delivered 934, 1,418 and 1,276 units in 2016, 2017 and 2018, respectively.
The results of operations of our Real Estate segment are also significantly affected by our sales of land parcels. Due to the appreciation of
land prices in Peru, and because we record our land holdings at book value (i.e., without marking to market), our recent land sales have resulted in high
margins. Our board has approved the sale of non-strategic assets and, consequently, we have sold our interests in certain real estate projects as fully
described in “Item 5.A. Operating and Financial Review and Prospects—Operating Results—Recent Developments.”
In addition, the net profit attributable to controlling interests of our Real Estate segment is significantly affected by the financing and
commercial arrangements we use to purchase land and to develop real estate projects. Depending on the level of non-controlling interests used to
finance our real estate projects, our Real Estate segment tends to have significant net profit attributable to non-controlling interests. See “—Results of
Operations—General—Real Estate.”
Critical Accounting Estimates and Judgments
For information on critical accounting estimates and judgments, see note 5 to our audited annual consolidated financial statements included
in this annual report.
New Accounting Pronouncements, Amendments and Interpretations
For information on new accounting pronouncements, amendments and interpretations, see note 3.1 to our audited annual consolidated
financial statements included in this annual report.
100
Results of Operations
General
Accounting for Subsidiaries, Joint Operations, Joint Ventures and Associated Companies
Results of our subsidiaries, joint operations, joint ventures and associated companies are reflected in our financial results. We refer to our
subsidiaries as those entities over which we exercise control. We consolidate the results of our subsidiaries in our financial statements and we reflect the
profit corresponding to the minority interests in our subsidiaries under “profit attributable to non-controlling interests” in our income statement. Our
consolidation of the results of our subsidiaries include subsidiaries in which we have less than 50% of the equity. We refer to business activities in
which we share control with unrelated entities as joint arrangements, including joint operations and joint ventures, which are typically conducted
through an agreement with a third party to carry out specific projects. We contribute our assets to these projects and derive revenue from their use. In
our financial statements we recognize, in relation to our interest in a joint operation, our assets and liabilities, including our share of any asset or liability
we hold jointly with our partner, as well as our share of revenue and expense from the joint operation. We refer to our associated companies as those
entities over which we have significant influence but do not control. We reflect the results of our associated companies and joint ventures under the
equity method of accounting in our financial statements under the line item “share of the profit and loss in associates” in our income statement. For
further information, including a list of our subsidiaries, joint operations, joint ventures and associated companies, see notes 6a, 6c and 16 to our audited
annual consolidated financial statements included in this annual report.
Intersegment Transactions
Some of our segments from time to time provide services to our other segments. In 2018, we obtained 16.7% of the revenues in our E&C
segment from the construction of the expansion works of Line 1 at GyM Ferrovias; and 30% of the revenues in our operation and maintenance of
infrastructure assets line of business derived from services provided to Norvial, Survial, Canchaque and the Lima Metro. Accordingly, in such
circumstances, the segment providing services recognizes revenues and the segment receiving such services recognizes costs of sales relating to the
services provided. For example, in the case of La Chira, in which our E&C segment provides services to our Infrastructure segment, our E&C segment
recognizes revenues and our Infrastructure segment recognizes costs of sales with respect to the fees charged by our E&C segment for those services. In
consolidation, these intersegment revenues and cost of sales are eliminated in our financial results. Nonetheless, our Infrastructure segment, in
particular, may recognize gross profits or losses based on the difference between the fees the segment charges in accordance with concession terms and
costs it incurs relating to services provided by our other segments. For more information on our segments, see note 7 to our audited annual consolidated
financial statements included in this annual report.
Engineering and Construction
We obtain revenues in our E&C segment from the engineering and construction services we provide to our clients, which we recognize
under the percentage-of-completion method of accounting. For further information, see note 2.26 to our audited annual consolidated financial statements
included in this annual report. We receive unrestricted client advances in a substantial majority of our E&C projects, on average equal to approximately
10% of the contract price in 2018, which we record as an account payable. We typically invoice our clients on a periodic basis as each project
progresses, deducting from the related advances on a proportional basis. For further information, see note 21 to our audited annual consolidated
financial statements included in this annual report. Our cost of sales in our E&C segment includes labor, subcontractor expenses, materials, equipment,
and project-specific general expenses.
Infrastructure
In our Infrastructure segment, we recognize revenues and cost of sales as follows:
(1) Toll Roads:
• For Norvial, we obtain revenues for toll fees collected, minus deductions required to be transferred to the government as described
in “Item 4.B. Information on the Company—Business Overview—Infrastructure—Principal Infrastructure Activities—Toll
Roads—Norvial,” which we recognize upon receipt. Cost of sales for Norvial include fees paid to third parties (primarily our
subsidiary Concar) for operation and maintenance services as well as the amortization of the road concession registered as an
intangible asset in our financial statements; and
101

• For Survial and Canchaque, we obtain revenues for routine and periodic maintenance services, which we recognize in the period in
which the services are performed. Cost of sales for Survial and Canchaque include fees paid to third parties (primarily our subsidiary
Concar) for operation and maintenance services. We do not recognize the Survial and Canchaque concessions as intangible assets
and therefore do not amortize the concessions.
For further information, see notes 2.15(iii) and 18 to our audited annual consolidated financial statements included in this annual report.
(2) Mass Transit: We obtain revenues from our Lima Metro concession based on a tariff per kilometer traveled by our trains in operation in
accordance with a schedule established in our concession agreement, which we recognize in the period in which the services are performed. Under the
concession, the tariff is comprised of three components: (i) fees related to our operation and maintenance services; (ii) fees related to the Peruvian
government’s repayment of the amounts we invest to purchase trains, ongoing capital expenditures and other infrastructure for the Peruvian
government; and (iii) fees related to interest we charge to the Peruvian government in connection with the amounts we invest to purchase such trains,
ongoing capital expenditures and other infrastructure. In 2018, the fees related to items (i), (ii) and (iii) were S/.224 million, S/.10.9 million and
S/.43 million, respectively. We only recognize in our income statement the portion of the tariff that relates to items (i) and (iii) We record the amounts
paid by us that relate to item (ii) as long-term accounts receivables from the Peruvian government. Accordingly, tariff payments received relating to
item (ii) reduce our accounts receivables but do not impact our income statement, and we do not amortize our investments in our income statement as
our investment in the concession is recorded as an account receivable with the government rather than a depreciable investment.
We entered into the fourth addendum to the Lima Metro concession contract on July 11, 2016, in order to expand transportation capacity. In
accordance with the fourth addendum, the expansion project will involve: (i) the purchase of 20 new trains; (ii) the purchase of 39 new cars; and (iii) the
improvement and expansion of the existing infrastructure. As compensation for the investments of the expansion project, we will be entitled to receive
the following: (i) an advance payment of 30% of each investment component; and (ii) the balance of 70% of each investment component, compensated
through the annual payment for additional investments (pago anual por inversiones complementarias). We register the estimated compensation related
to the direct cost in the income statement, plus a margin in the same period. In 2018, the income related to the investment components was
S/.278 million.
For further information, see note 11 to our audited annual consolidated financial statements included in this annual report. Cost of sales for
the Lima Metro include fees paid to third parties (primarily our E&C segment, our subsidiary Concar and other subcontractors) for construction and
operation and maintenance services, energy, and our financing costs related to the purchase of trains.
(3) Water Treatment: We obtained revenues from the engineering design and construction of La Chira waste water treatment plant, which
we recognize based on the percentage-of-completion method of accounting. Since the plant began operating in August 2016, we obtain revenues only
for operation and maintenance services, which we recognize in the period in which the services are performed. During the construction phase in 2015
and 2016, cost of sales for La Chira included fees paid to third parties, primarily our E&C segment, for engineering and construction services. During
the operation phase, cost of sales for La Chira include personnel charges and maintenance of infrastructure.
(4) Energy: We obtain revenues from extraction services and license contracts related to oil and gas production, fuel storage services, and
the sale of natural gas liquids derived from our gas processing and fractionation services, which we recognize in the period in which the services are
performed and, in the case of sale of natural gas liquids, when the sale is made. Cost of sales for our energy line of business includes labor, materials,
amortization of oil wells, depreciation of the gas plant, maintenance and general expenses.
(5) Operation and Maintenance of Infrastructure Assets: We obtain revenues from our operation and maintenance of infrastructure assets
line of business for the operation and maintenance services we provide to the government and concessionaires (currently concessions within our
Infrastructure segment), which we recognize in the period in which the services are performed. We receive unrestricted advances with respect to our
service contracts with the government, that vary from approximately 10% to 30% of the contract price, which we record as an account payable. We
typically invoice our clients on a periodic basis as the project progresses, deducting from the related advances on a proportional basis. For further
information, see note 22 to our audited annual consolidated financial statements included in this annual report. Our cost of sales in this line of business
includes personnel costs, services provided by third parties, machinery and other materials (primarily trucks), and depreciation of equipment utilized to
provide services.
Real Estate
We obtain revenues in our Real Estate segment from sales of affordable housing and housing units, commercial buildings and land parcels,
which we recognize at the time of delivery of the unit or building and, in the case of land parcels, at the time of the sale. We typically pre-sell our
affordable housing and housing units prior to and during construction, and use the related proceeds we receive to finance the construction of the units.
These pre-sale funds are restricted and released from escrow to us periodically as construction
102

progresses. Our Real Estate cost of sales includes the cost to purchase land, costs of architectural design and construction (which usually includes
payments to third parties, primarily our E&C segment), licensing and permit costs, personnel costs, and fees to third parties related to sanitation or
electrical engineering. In 2018, our cost of land that is allocated to units delivered during these periods amounted to S/.40.8 million. We recognize land
purchases as inventory, and, accordingly, do not mark-to-market the value of our land for changes in fair value. For further information, see note 15 to
our audited annual consolidated financial statements included in this annual report.
In our Real Estate segment, we have significant net profit attributable to non-controlling interests. We hold a significant portion of our land
bank through Almonte in which we have a 50.45% interest, and we consolidate Almonte’s results in our financial statements. In addition, we undertake
a significant number of our real estate projects through entities in which we may have a majority interest, co-equal interest or minority interest; when we
have control over these entities, we consolidate their results in our financial statements regardless of whether we own a majority of the capital.
Furthermore, in connection with our affordable housing projects, we generally partner with real estate investment funds and insurance companies that
provide between 60% and 70% of the total capital required to purchase the land and cover certain pre-construction costs in exchange for equity in the
project. Although we typically own a minority interest in these projects, we consolidate their results in our financial statements because we exercise
control over the project. Accordingly, we reflect the profit corresponding to our real estate partners under net profit attributable to non-controlling
interests in our income statement. See “—Accounting for Subsidiaries, Joint Operations, Joint Ventures and Associated Companies.”
Comparison of Results of Operations of 2017 and 2018
The following table sets forth the components of our consolidated income statement for 2017 and 2018.
Year ended December 31,
2017
Restated 2018 Variation
(in millions of S/.) %
Revenues 4,014.0 3,899.5 (2.9)%
Cost of sales (3,511.6) (3,225.0) (8.2)%
Gross profit 502.4 674.5 34.3%
Administrative expenses (322.5) (278.4) (13.7)%
Other income (expenses) (33.3) (61.2) (83.8)%
Other (losses) gains, net 0.5 (0.1) (120.0)%
Profit from sale of investments 34.5 – NM
Operating profit 181.6 334.8 84.4%
Financial (expense) income, net (137.0) (197.1) 43.9%
Share of profit and loss in associates 0.5 (3.7) NM
Profit (loss) before income tax 45.1 134.0 197.1%
Income tax (46.3) (113.3) 144.7%
Net profit from continuing operations (1.2) 20.7 NM
Profit from discontinued operations 210.4 36.8 (82.5)%
Net profit (loss) 209.2 57.5 (72.5)%
Net profit (loss) attributable to controlling interest 148.7 (83.2) (156.0)%
Net profit attributable to non-controlling interest 60.5 140.6 132.4%
Revenues
Our total revenues decreased by 2.9%, or S/.114.5 million, from S/.4,014 million for 2017 to S/.3,899.5 million for 2018. Revenues
decreased due to the lower number of projects under execution in the E&C segment. This was offset, in part, by the increase of revenues in the Mass
Transit business, which increased due to expansion works and the operation of new trains. In addition, there was an increase in maintenance of works at
Concar, an increase in crude oil production (barrels per day) and higher oil prices. Revenues in the Real Estate segment reflected proceeds from the sale
of land by Almonte and were adversely impacted by fewer units being delivered during the year.
103

The following table sets forth a breakdown of our revenues by segment for 2017 and 2018.
Year ended December 31,
2017 2018 Variation
(in millions
of S/.) % of Total
(in millions
of S/.) % of Total %
Engineering and Construction 2,331.9 58.1% 1,960.9 50.3% (15.9)%
Infrastructure 1,447.9 36.1% 1,883.3 48.3% 30.1%
Real Estate 647.5 16.1% 630.1 16.2% (2.7)%
Corporate 70.0 1.7% 62.1 1.6% (11.3)%
Eliminations (483.4) (12.0)% (636.9) (16.3)% 31.8%
Total 4,014.0 100.0% 3,899.5 100.0% (2.9)%
Cost of Sales
Our total cost of sales decreased by 8.2%, or S/.286.6 million, from S/.3,511.6 million for 2017 to S/.3,255.0 million for 2018. This decrease
is mainly due to a reduction in revenues.
Gross Profit
Our gross profit increased by 34.3%, or S/.172.1 million, from S/.502.4 million for 2017 to S/.674.5 million for 2018. Our gross margin
(i.e., gross profit as a percentage of revenues) for 2018 was 17.3%, compared to 12.5% for 2017. In 2017, gross profit was impacted in our E&C
segment by efficiencies in the projects under execution, in our Infrastructure segment by an increase in oil prices, and in our Real Estate segment by the
sale of Cuartel San Martín in February 2017. During 2018, gross profit was impacted in our Infrastructure segment by expansion works and the
operation of new trains, in our E&C segment by an increase in oil prices, and in our Real Estate segment by the sale of land by Almonte. In our E&C
Segment gross profit was also impacted by works we performed, but which were not accepted by the client and costs not recognized in the Talara
refinery project.
The following table sets forth a breakdown of our gross profit by segment for 2017 and 2018.
Year ended December 31,
2017 2018 Variation
(in millions
of S/.) % of Total
(in millions
of S/.) % of Total %
Engineering and Construction 176.5 35.1% 62.1 9.2% (64.8)%
Infrastructure 260.2 51.8% 350.6 52.0% 34.7%
Real Estate 147.4 29.3% 288.0 42.7% 95.4%
Corporate (37.8) (7.5)% (10.6) (1.6)% 72.0%
Eliminations (43.8) (8.7)% (15.6) (2.3)% (64.4)%
Total 502.4 100.0% 674.5 100.0% 34.3%
Administrative Expenses
Our administrative expenses decreased by 13.7%, or S/.44.1 million, from S/.322.5 million for 2017 to S/.278.4 million for 2018. This
decrease is mainly due to a reduction of personnel in the E&C Segment and services provided by third parties principally relating to legal, accounting
and tax consultancy. As a percentage of revenues, our administrative expenses decreased to 7.1% in 2018 from 8.0% in 2017.
Other Income (Expenses)
Our other income (expenses) decreased by 83.8%, or S/.27.9 million, from S/.33.3 million in expenses for 2017 to S/.61.2 million in
expenses for 2018. In 2017, our other income included the sale of machinery and equipment, as well as the impairment of the Vial y Vives DSD brand.
In 2018, our other income included a provision related to the potential civil compensation in favor of the Peruvian state that may be required to pay in
connection with the investigations related to the IIRSA South project concession (tranches II and III) and Tranches 1 and 2 of the Lima Metro in which
our company and GyM have been included as civilly-responsible third parties as described under “Item 8A. Financial Information—Consolidated
Financial Statements and Other Information—Legal and Administrative Proceedings.”
104

Profit from Sale of Investments
In 2018, there was no profit from the sale of investments, compared to S/.34.5 million from the sale of the certain investments in 2017.
Operating Profit
Our operating profit increased 8.4%, or S/.153.2 million, from S/.181.6 million for 2017 to S/.334.8 million for 2018. Our operating margin
(i.e., operating profit as a percentage of revenues) was 8.6% for 2018, compared to 4.5% for 2017. The increase in operating margin is primarily due to
the increase in gross profit and the reduction of administrative expenses explained above.
The following table sets forth a breakdown of our operating profit by segment for 2017 and 2018.
Year ended December 31,
2017 2018 2018
(in millions
of S/.)
Percentage
of Total
(in millions
of S/.)
Percentage
of Total
Variation
%
Engineering and Construction (58.1) (32.0)% (87.5) (26.1)% (50.6)%
Infrastructure 202.5 111.5% 283.0 84.5% 39.8%
Real Estate 171.5 94.4% 235.3 70.3% 37.2%
Corporate (146.9) (80.9)% (1.9) (0.6)% (98.7)%
Eliminations 12.7 7.0% 25.1 7.5% 97.6%
Total 181.6 100.0% 334.8 100.0% 84.4%
The following discussion analyzes our key results of operations on a segment basis. For further information on our business segments, see
note 7 to our audited annual consolidated financial statements included in this annual report.
Engineering and Construction
The table below sets forth selected financial information related to our E&C segment.
Year ended December 31,
2017 2018 Variation
(in millions of S/.) %
Revenues 2,331.9 1,960.9 (15.9)%
Gross profit 176.5 62.1 (64.8)%
Operating profit (loss) (58.1) (87.5) (50.6)%
Revenues. Our E&C revenues decreased 15.9%, or S/.371.0 million, from S/.2,331.9 million for 2017 to S/.1,960.9 for 2018.
The decrease is due to fewer projects under execution resulting from lower levels of private investment in Peru. The following tables set
forth variations in our E&C revenues by business activities, types of contracts and end-markets:
Year ended December 31,
2017 2018
% %
Engineering services 8.4 9.4
Electromechanic construction 31.2 22.4
Civil construction 49.8 52.4
Building construction activities 10.6 8.8
Other Services — 7.1
Total 100.0 100.0
105

Year ended December 31,
2017 2018
% %
Cost + fee 1.6 1.0
Unit price 42.9 41.0
Lump sum 47.3 38.9
EPC contracts 8.2 19.1
Total 100.0 100.0
Year ended December 31,
2017 2018
% %
Mining 24.1 23.0
Real estate buildings 10.8 9.1
Power — 1.8
Oil and gas 31.4 40.6
Transportation 22.9 21.6
Water and sewage 2.0 1.3
Other end markets 8.7 2.6
Total 100.0 100.0
The breakdown of E&C revenues by different business activities, types of contracts and end-markets tends to vary from period to period due
to a variety of factors, including the timing of the execution of larger projects in any particular period, which is typically outside of our control.
Gross Profit. Our E&C gross profit decreased 64.8%, or S/.114.4 million, from S/.176.5 million for 2017 to S/.62.1 million for 2018. Our
E&C gross margin for 2018 was 3.2% compared to 7.6% for 2017. This reduction in our E&C gross profit was mainly due to works we performed, but
which were not accepted by the client and additional costs and expenses not recognized in the Talara refinery project as well as the deterioration of
accounts receivable.
Other income (expenses). Other income (expenses) increased in our E&C segment, from S/.46.5 million in expenses in 2017 to
S/.13.5 million in expenses for 2018, mainly due to the sale of machinery and equipment, the sale of the stake in one consortium, partially offset by the
provision for potential civil compensation in favor of the Peruvian state that may be required to pay in connection with the investigations related to the
IIRSA South project concession (tranches II and III) and Tranches 1 and 2 of the Lima Metro in which our company and GyM have been included as
civilly-responsible third parties as described under “Item 8A. Financial Information—Consolidated Financial Statements and Other Information—Legal
and Administrative Proceedings”.
Operating Profit (loss). Our E&C operating profit decreased S/.29.4 million, from a S/.(58.1) million loss for 2017 to a S/.(87.5) million
loss for 2018, due to the reduction of gross profit and partially offset by the reduction of administrative expenses as a consequences of the reduction of
personnel. Our E&C operating margin was (4.5)% for 2018, compared to (2.5)% for 2017.
Infrastructure
The table below sets forth selected financial information related to our Infrastructure segment.
Year ended December 31,
2017 2018 Variation
(in millions of S/.) %
Revenues 1,447.9 1,883.3 30.1%
Gross profit 260.2 350.6 34.7%
Operating profit 202.5 283.0 39.8%
Revenues. The table below sets forth the breakdown of our Infrastructure revenues by principal lines of business.
106

Year ended December 31,
2017 2018 Variation
(in millions of S/.) %
Toll Roads 263.8 280.8 6.4%
Mass Transit 365.8 586.3 60.3%
Water Treatment 3.2 3.3 3.1%
Energy 436.9 560.5 28.3%
Operation and Maintenance of Infrastructure Assets 378.3 452.3 19.6%
Total 1,447.9 1,883.3 30.1%
Our Infrastructure revenues increased 30.1% or S/.435.4 million, from S/.1,447.9 million for 2017 to S/.1883.3 million for 2018. The
variation in our Infrastructure revenues principally reflected the following:
• Toll Roads: a 6.4%, or S/.17 million, increase in revenues, from S/.263.8 million for 2017 to S/.280.8 for 2018, primarily due to the
increase in traffic and more maintenance works;
• Mass Transit: a 60.3%, or S/.220.5 million, increase in revenues, from S/.365.8 million for 2017 to S/.586.3 million for 2018,
primarily due to the revenues recognized for the advance of the construction of the infrastructure expansion and the operation of new
trains;
• Water Treatment: a 3.1%, or S/.0.1 million, increase in revenues, from S/.3.2 million for 2017 to S/.3.3 million for 2018, primarily
due to the larger volume of treated wastewater during 2018 compared to 2017;
• Energy: a 28.3%, or S/.123.6 million, increase in revenues, from S/.436.9 million for 2017 to S/.560.5 million for 2018, primarily
due to an increase in our barrel daily production (3,651 barrel daily production in 2018 versus 3,140 barrel daily production in
2017), and better results in our fuel terminals business (3.9 MM barrels in storage per month in 2018 versus 3.39 MM barrels in
storage per month in 2017, and 3.35 MM barrels dispatched per month in 2018 versus 3.43 MM barrels dispatched per month in
2017). Additionally, gas processing levels in our gas processing plant were lower (30.12 MMcf per day in 2018 to 30.57 MMcf per
day in 2017), and the prices of liquefied petroleum gas (“LPG”) increased from US$48.18/bbl in 2017 to US$59.36 in 2018. The
price of HAS (CGN) went from US$49.44/bbl in 2017 to US$59.36 in 2018; and
• Operation and Maintenance of Infrastructure Assets: a 19.6%, or S/.74.0 million, increase in revenues, from S/.378.3 million for
2017 to S/.452.3 million for 2018, due to new contracts awarded during 2017 that initiated works in 2018.
Gross Profit. The table below sets forth the breakdown of our Infrastructure gross profit by principal lines of business.
Year ended December 31,
2017 2018 Variation
(in millions of S/.) %
Toll Roads 89.9 70.5 (21.6)%
Mass Transit 48.7 122.6 151.7%
Water Treatment 0.4 0.6 50.0%
Energy 71.8 120.4 67.7%
Operation and Maintenance of Infrastructure Assets 49.3 36.6 (25.8)%
Total 260.2 350.6 34.7%
Our Infrastructure gross profit increased 34.7%, or S/.90.4 million, from S/.260.2 for 2017 to S/.350.6 million for 2018. Our Infrastructure
gross margin was 18.6% for 2018 and 18% for 2017 as well. The variation in our Infrastructure gross profit principally reflected the following:
• Toll Roads: a 21.6%, or S/.19.4 million, decrease in gross profit, from S/.89.9 million for 2017 to S/.70.5 million for 2018. Our toll
roads gross margin decreased from 34.1% for 2017 to 25.1% for 2018 as a consequence of the amortization of the investment made
in the Norvial toll road during 2017;
• Mass Transit: a 151.7%, or S/.73.9 million, increase in gross profit, from S/.48.7 million for 2017 to S/.122.6 million for 2018,
primarily due to the expansion works and the operation of new trains. Our gross margin for 2018 was 20.9%, compared to 13.3% in
2017.
107
• Water Treatment: a 50%, or S/.0.2 million, increase in gross profit for 2018, from S/.0.4 million gross profit for 2017 to
S/.0.6 million gross profit for 2018, due to the larger volume of treated wastewater during 2018 compared 2017. Our water treatment
gross margin was 18.2% for 2018, compared to 12.5% for 2017;
• Energy: a 67.7%, or S/.48.6 million, increase in gross profit, from S/.71.8 million for 2017 to S/.120.4 million for 2018, primarily
due to the increase in the price of oil from US$52.84 in 2017 to US$69.29 in 2018. Our energy gross margin was 21.5% for 2018,
compared to 16.4% for 2017; and
• Operation and Maintenance of Infrastructure Assets: a 25.8%, or S/.12.7 million, decrease in gross profit, from S/.49.3 million for
2017 to S/.36.6 million for 2018, due to the impairment of provisions as the result of the passage of time of the Red Vial 1 Road and
the Red Vial 3 Road, two contracts with the regional government of Cuzco, Peru. Our operation and maintenance of infrastructure
assets gross margin was 8.1% for 2018, compared to 13.0% for 2017.
Operating Profit. The table below sets forth the breakdown of our Infrastructure operating profit by principal lines of business.
Year ended December 31,
2017 2018 Variation
(in millions of S/.) %
Toll Roads 80.1 59.4 (25.8)%
Mass Transit 33.4 110.6 231.1%
Water Treatment 0.1 0.3 200.0%
Energy 61.1 100.7 64.8%
Operation and Maintenance of Infrastructure Assets 27.7 12.1 (56.3)%
Total 202.5 283.0 39.8%
Our Infrastructure operating profit increased 39.8%, or S/.80.5 million, from S/.202.5 million for 2017 to S/.283.0 million for 2018. Our
Infrastructure operating margin was 15.0% for 2018, compared to 14.0% for 2017. The variation in our Infrastructure operating profit principally
reflected the following:
• Toll Roads: a 25.8%, or S/.20.7 million, decrease in operating profit, from S/.80.1 million for 2017 to S/.59.4 million for 2018,
primarily due to the reduction of gross profit and an increase in administrative expenses due to extraordinary legal expenses in
respect of a road accident. Our toll roads operating margin was 21.2% for 2018, compared to 30.4% for 2017;
• Mass Transit: a 231.1%, or S/.77.2 million, increase in operating profit, from an operating profit of S/.33.4 million for 2017 to
S/.110.6 million for 2018, primarily due to the increase in gross profit and the reduction of administrative expenses compared to
2017, including due to extraordinary legal expenses related to arbitrages and a fine from the Peruvian tax authority (SUNAT). Our
mass transit operating margin for 2018 was 18.9%, compared to 9.1% for 2017;
• Water Treatment: a 200%, or S/.0.2 million, increase in operating profit, from an operating profit of S/.0.1 million in 2017 to an
operating profit of S/.0.3 in 2018, mainly due to the increase in gross profit and the reduction of administrative expenses as in 2017
there were extraordinary expenses for studies made for a potential expansion of the plant. Our water treatment operating margin for
2018 was 9.1%, compared to 3.1% for 2017;
• Energy: a 64.8%, or S/.39.6 million, increase in operating profit, from S/.61.1 million for 2017 to S/.100.7 million for 2018,
primarily due to the increase in gross profit partially offset by an increase in administrative expenses as a consequence of an increase
in services provided by third parties related to IT, accounting and tax consultancy. Our Energy operating margin was 18.0% for
2018, compared to 14.0% for 2017; and
• Operation and Maintenance of Infrastructure Assets: a S/.56.3%, or S/.15.6 million decrease in operating profit, from a
S/.27.7 million profit in 2017 to a S/.12.1 million profit for 2018, primarily due to the amortization of an intangible assets that had
resulted from the purchase of an asset. Our Operation and Maintenance of Infrastructure Assets operating margin was 2.7% for
2018, compared to 7.3% for 2017.
Real Estate
The table below sets forth selected financial information related to our Real Estate segment.
108
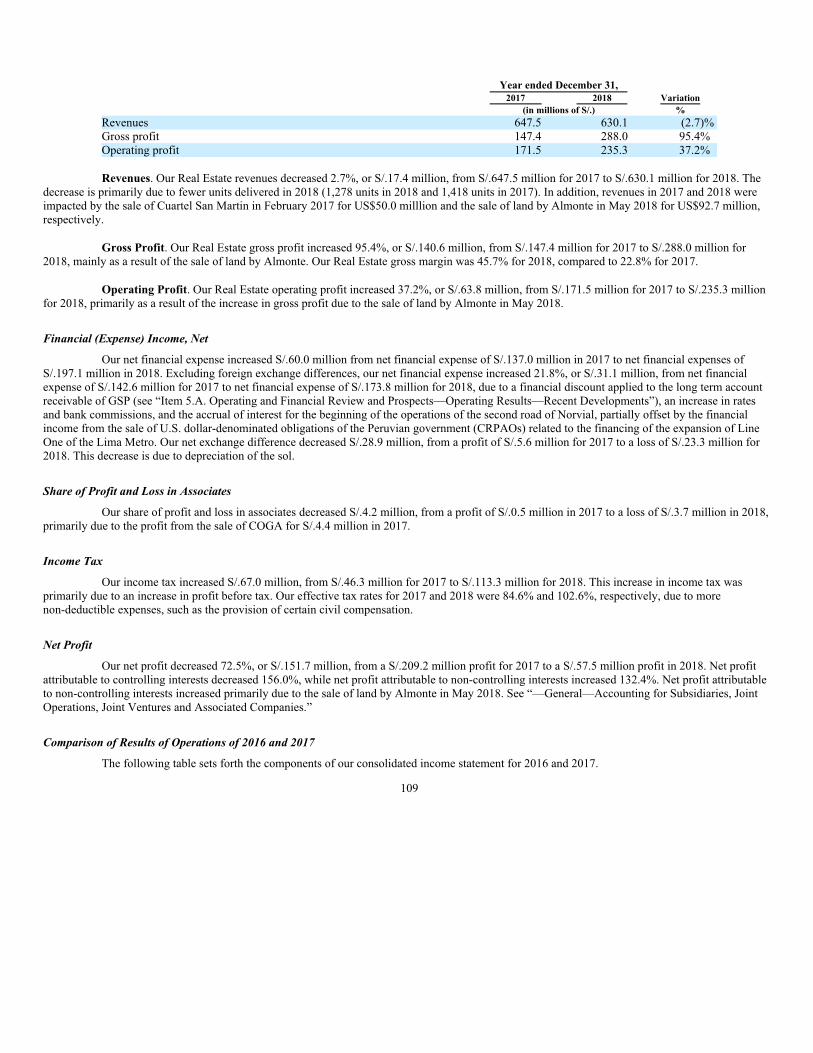
Year ended December 31,
2017 2018 Variation
(in millions of S/.) %
Revenues 647.5 630.1 (2.7)%
Gross profit 147.4 288.0 95.4%
Operating profit 171.5 235.3 37.2%
Revenues. Our Real Estate revenues decreased 2.7%, or S/.17.4 million, from S/.647.5 million for 2017 to S/.630.1 million for 2018. The
decrease is primarily due to fewer units delivered in 2018 (1,278 units in 2018 and 1,418 units in 2017). In addition, revenues in 2017 and 2018 were
impacted by the sale of Cuartel San Martin in February 2017 for US$50.0 milllion and the sale of land by Almonte in May 2018 for US$92.7 million,
respectively.
Gross Profit. Our Real Estate gross profit increased 95.4%, or S/.140.6 million, from S/.147.4 million for 2017 to S/.288.0 million for
2018, mainly as a result of the sale of land by Almonte. Our Real Estate gross margin was 45.7% for 2018, compared to 22.8% for 2017.
Operating Profit. Our Real Estate operating profit increased 37.2%, or S/.63.8 million, from S/.171.5 million for 2017 to S/.235.3 million
for 2018, primarily as a result of the increase in gross profit due to the sale of land by Almonte in May 2018.
Financial (Expense) Income, Net
Our net financial expense increased S/.60.0 million from net financial expense of S/.137.0 million in 2017 to net financial expenses of
S/.197.1 million in 2018. Excluding foreign exchange differences, our net financial expense increased 21.8%, or S/.31.1 million, from net financial
expense of S/.142.6 million for 2017 to net financial expense of S/.173.8 million for 2018, due to a financial discount applied to the long term account
receivable of GSP (see “Item 5.A. Operating and Financial Review and Prospects—Operating Results—Recent Developments”), an increase in rates
and bank commissions, and the accrual of interest for the beginning of the operations of the second road of Norvial, partially offset by the financial
income from the sale of U.S. dollar-denominated obligations of the Peruvian government (CRPAOs) related to the financing of the expansion of Line
One of the Lima Metro. Our net exchange difference decreased S/.28.9 million, from a profit of S/.5.6 million for 2017 to a loss of S/.23.3 million for
2018. This decrease is due to depreciation of the sol.
Share of Profit and Loss in Associates
Our share of profit and loss in associates decreased S/.4.2 million, from a profit of S/.0.5 million in 2017 to a loss of S/.3.7 million in 2018,
primarily due to the profit from the sale of COGA for S/.4.4 million in 2017.
Income Tax
Our income tax increased S/.67.0 million, from S/.46.3 million for 2017 to S/.113.3 million for 2018. This increase in income tax was
primarily due to an increase in profit before tax. Our effective tax rates for 2017 and 2018 were 84.6% and 102.6%, respectively, due to more
non-deductible expenses, such as the provision of certain civil compensation.
Net Profit
Our net profit decreased 72.5%, or S/.151.7 million, from a S/.209.2 million profit for 2017 to a S/.57.5 million profit in 2018. Net profit
attributable to controlling interests decreased 156.0%, while net profit attributable to non-controlling interests increased 132.4%. Net profit attributable
to non-controlling interests increased primarily due to the sale of land by Almonte in May 2018. See “—General—Accounting for Subsidiaries, Joint
Operations, Joint Ventures and Associated Companies.”
Comparison of Results of Operations of 2016 and 2017
The following table sets forth the components of our consolidated income statement for 2016 and 2017.
109

Year ended December 31,
2016
2017
Restated Variation
(in millions of S/.) %
Revenues 4,137.3 4,014.0 (3.0)%
Cost of sales (3,821.2) (3,511.6) (8.1)%
Gross profit 316.1 502.4 58.9%
Administrative expenses (278.3) (322.5) 15.9%
Other income (expenses) (21.9) (33.3) 52.1%
Other (losses) gains, net (0.5) 0.5 (200.0)%
Profit from sale of investments 46.3 34.5 (25.5)%
Operating profit 61.7 181.6 194.3%
Financial (expense) income, net (179.8) (137.0) (23.8)%
Share of profit and loss in associates (590.1) 0.5 (100.1)%
Profit before income tax (708.2) 45.1 (106.4)%
Income tax 152.2 (46.3) (130.4)%
Net Profit from continuing operations (556.0) (1.2) (99.8)%
Profit from discontinued operation 104.4 210.4 101.5%
Net Profit (loss) (451.6) 209.2 (146.3)%
Net Profit attributable to controlling interest (509.7) 148.7 (129.2)%
Net Profit attributable to non-controlling interest 58.1 60.5 4.1%
Revenues
Our total revenues decreased by 3.0 %, or S/.123.3 million, from S/.4,137.3 million for 2016 to S/.4,014.0 million for 2017. Revenues
decreased due mainly to a reduction of revenues in the E&C segment as a consequence of fewer projects under execution. This was offset, in part, by an
increase in revenues of GMP due to an increase in the average price of oil, as well as an increase in production. Revenues in the Mass Transit business
increased due to expansion works, along with major maintenance works by Survial and new contracts awarded during 2016 that initiated works in 2017
for Concar. Revenues in the Real Estate segment increased due to the sale of Cuartel San Martín and also due to an increase in units delivered.
The following table sets forth a breakdown of our revenues by segment for 2016 and 2017.
Year ended December 31,
2016 2017 Variation
(in millions
of S/.) % of Total
(in millions
of S/.) % of Total %
Engineering and Construction 2,936.8 71.0% 2,331.9 58.1% (20.6)%
Infrastructure 1,174.8 28.4% 1,447.9 36.1% 23.2%
Real Estate 411.5 9.9% 647.5 16.1% 57.4%
Corporate 62.1 1.5% 70.0 1.7% 12.7%
Eliminations (447.9) (10.8)% (483.4) (12.0)% 7.9%
Total 4,137.3 100.0% 4,014.0 100.0% (3.0)%
Cost of Sales
Our total cost of sales decreased by 8.1%, or S/. 309.6 million, from S/.3,821.2 million for 2016 to S/.3,511.6 million for 2017. This
decrease is mainly due to the reduction of revenues.
Gross Profit
Our gross profit increased by 58.9% or S/.186.3 million, from S/.316.1 million for 2016 to S/.502.4 million for 2017. Our gross margin (i.e.
gross profit as a percentage of revenues) for 2017 was 12.5% compared to 7.6 % for 2016. In 2016, gross profit was impacted by the early termination
of GSP construction consortium in our E&C segment and partially offset by the profit generated by the sale of land of Almonte in our Real Estate
segment. During 2016, gross profit was also impacted in our Infrastructure segment by the decrease in oil price. During 2017, gross profit was impacted
in our E&C segment by efficiencies in the projects under execution, in our Infrastructure Segment by an increase in oil price, in our Real Estate segment
by the sale of Cuartel San Martín.
110

The following table sets forth a breakdown of our gross profit by segment for 2016 and 2017.
Year ended December 31,
2016 2017 Variation
(in millions
of S/.) % of Total
(in millions
of S/.) % of Total %
Engineering and Construction 60.2 19.0% 176.5 35.1% 193.2%
Infrastructure 211.4 66.9% 260.2 51.8% 23.1%
Real Estate 136.5 43.2% 147.4 29.3% 8.0%
Corporate (0.2) (0.1)% (37.8) (7.5)% NM
Eliminations (91.9) (29.1)% (43.8) (8.7)% (52.3)%
Total 316.1 100.0% 502.4 100.0% 58.9%
Administrative Expenses
Our administrative expenses increased by 15.9 %, or S/.44.2 million, from S/.278.3 million for 2016 to S/.322.5 million for 2017. This
increase is mainly due to an increase in services provided by third parties principally relating to legal, accounting and tax consultancy. As a percentage
of revenues, our administrative expenses increased to 8 % in 2017 from 6.7% in 2016.
Other Income (Expenses)
Our other income (expenses) increased by 52.1%, or S/.11.4 million, from S/.21.9 million in expenses for 2016 to S/.33.3 million in
expenses for 2017. In 2016, our other income included the sale of machinery and equipment, price adjustments as well as a reversion of legal and tax
provisions in connection with the acquisition of Morelco, and extraordinary income from the settlement agreement reached in connection with the legal
proceeding related to the Collahuasi project in Chile. In 2017, our other income included the sale of machinery and equipment, as well as the
impairment of the Vial y Vives DSD brand.
Profit from Sale of Investments
We registered a profit of S/.34.5 million from the sale of the certain investments, mainly due to the sales of Red Eagle Mining, PRINSUR
and COGA in 2017.
The following table sets forth a breakdown of our operating profit by segment for 2016 and 2017.
Operating Profit
Our operating profit increased 194.3%, or S/.119.9 million, from S/.61.7 million for 2016 to S/.181.6 million for 2017. Our operating
margin (i.e., operating profit as a percentage of revenues) was 4.5% for 2017 compared to 1.5% for 2016. The increase in operating margin is primarily
due to the increase in profit from the sales of investments and, to a lesser extent, to the increase in gross profit.
Year ended December 31,
2016 2017 Variation
(in millions
of S/.) % of Total
(in millions
of S/.) % of Total %
Engineering and Construction (166.1) (269.2)% (58.1) (32.0)% (65.0)%
Infrastructure 146.1 236.8% 202.5 111.5% 38.6%
Real Estate 108.9 176.5% 171.5 94.4% 57.5%
Corporate 4.4 7.1% (146.9) (80.9)% NM
Eliminations (31.6) (51.2)% 12.7 7.0% (140.2)%
Total 61.7 100.0% 181.6 100.0% 194.3%
The following discussion analyzes our key results of operations on a segment basis. For further information on our business segments, see
note 7 to our audited annual consolidated financial statements included in this annual report.
Engineering and Construction
The table below sets forth selected financial information related to our E&C segment.
111

Year ended December 31,
2016 2017 Variation
(in millions of S/.) %
Revenues 2,936.8 2,331.9 (20.6)%
Gross profit 60.2 176.5 193.2%
Operating profit (166.1) (58.1) (65.0)%
Revenues. Our E&C revenues decreased 20.6%, or S/.604.9 million, from S/.2,936.8 million for 2016 to S/.2,331.9 million for 2017.
The reduction is due to fewer projects under execution resulting from lower levels of private investment in Peru. The following tables set
forth variations in our E&C revenues by business activities, types of contracts and end-markets:
Year ended December 31,
2016 2017
% %
Engineering services 4.5 8.4
Electromechanic construction 44.6 31.2
Civil construction 35.5 49.8
Building construction activities 15.3 10.6
Other Services — —
Total 100.0 100.0
Year ended December 31,
2016 2017
% %
Cost + fee 3.6 1.6
Unit price 16.9 42.9
Lump sum 79.5 47.3
EPC contracts — 8.2
Total 100.0 100.0
Year ended December 31,
2016 2017
% %
Mining 10.7 24.1
Real estate buildings 15.9 10.8
Power 5.1 —
Oil and gas 54.0 31.4
Transportation 5.2 22.9
Water and sewage 4.6 2.0
Other end markets 4.6 8.7
Total 100.0 100.0
The breakdown of E&C revenues by different business activities, types of contracts and end-markets tends to vary from period to period due
to a variety of factors, including the timing of the execution of larger projects in any particular period, which is typically outside of our control.
Gross Profit. Our E&C gross profit increased 193.2%, or S/.116.3 million, from S/.60.2 million for 2016 to S/.176.5 million for 2017. Our
E&C gross margin for 2017 was 7.6% compared to 2.0% for 2016. This increase in our E&C gross profit was mainly due to efficiencies implemented in
the different projects under execution.
Other income (expenses). Other income (expenses) increased in our E&C segment, from S/.14.2 million in expenses for 2016 to a
S/.46.5 million expenses in 2017, mainly because while this item usually includes sales of machinery and equipment, in 2017, it also included the
impairment of the Vial y Vives DSD brand.
112

Operating Profit. Our E&C operating profit increased S/.108.0 million, from a S/.166.1 million loss for 2016 to a S/.58.1 million loss for
2017, due to an increase of gross profit, a reduction of administrative expenses, related to a reduction of personnel and lower expenses relating to bid
proposals, and the profit from the sale of the shares of Red Eagle Mining owned by Stracon GyM. Our E&C operating margin was (2.5)% for 2017
compared to (5.7)% for 2016.
In addition, our E&C segment had a S/.0.3 million profit in 2017, compared to a S/.5.7 million loss in 2016, relating to minority interests
held by Vial y Vives in several of its projects undertaken in Chile, as well as the minority participation of GyM in Viva GyM reflected under “share of
profit and loss in associates” in our audited annual consolidated financial statements.
Infrastructure
The table below sets forth selected financial information related to our Infrastructure segment.
Year ended December 31,
2016 2017 Variation
(in millions of S/.) %
Revenue 1,174.8 1,447.9 23.2
Gross profit 211.4 260.2 23.1
Operating profit 146.1 202.5 38.6
Revenues. The table below sets forth the breakdown of our Infrastructure revenues by principal lines of business.
Year ended December 31,
2016 2017 Variation
(in millions of S/.) %
Toll Roads 264.4 263.8 (0.2)
Mass Transit 247.0 365.8 48.1
Water Treatment 18.5 3.2 (82.7)
Energy 382.2 436.9 14.3
Operation and Maintenance of Infrastructure Assets 262.7 378.3 44.0
Total 1,174.8 1,447.9 23.2
Our Infrastructure revenues increased 23.2% or S/.273.1 million, from S/.1,174.8 million for 2016 to S/.1,447.9 million for 2017. The
variation in our Infrastructure revenues principally reflected the following:
• Toll Roads: a 0.2%, or S/.0.6 million, decrease in revenues, from S/.264.4 million for 2016 to S/.263.8 million for 2017, primarily
due to the timing of the work for the second stage of the Norvial toll road and partially offset by an increase in revenues in Survial
due to more maintenance works executed on the road;
• Mass Transit: a 48.1%, or S/.118.8 million, increase in revenues, from S/.247.0 million for 2016 to S/.365.8 million for 2017,
primarily due to the revenues recognized for the advance of the construction of the infrastructure expansion;
• Water Treatment: a 82.7%, or S/.15.3 million, decrease in revenues, from S/.18.5 million for 2016 to S/.3.2 million for 2017,
primarily due to conclusion of the construction works of the La Chira waste water treatment plant. The operation of the plant started
in the second quarter of 2016;
• Energy: a 14.3%, or S/.54.7 million, increase in revenues, from S/.382.2 million for 2016 to S/.436.9 million for 2017, primarily due
to an increase in our barrel daily production (3,140 barrel daily production in 2017 versus 2,756 in 2016), as well as an increase in
international oil prices (average price per basket of oils of US$52.84 bbl in 2017 versus US$41.8 bbl in 2016), and better results in
our fuel terminals business (3.39 MM barrels in storage per month in 2017 versus 3.18 MM barrels in storage per month in 2016,
and 3.43 MM barrels dispatched per month in 2017 versus 3.34 MM barrels dispatched per month in 2016). Additionally, even
though gas processing levels in our gas processing plant were lower (33.2 MMcf per day in 2016 to 30.57 MMcf per day in 2017),
this was partially offset by the increase in prices of liquefied petroleum gas (“LPG”). The price of LPG went from US$41.87/bbl in
2016 to US$48.18/bbl in 2017 and the price of HAS (CGN) went from US$35.64/bbl in 2016 to US$49.44/bbl in 2017; and
• Operation and Maintenance of Infrastructure Assets: a 44.0%, or S/.115.6 million, increase in revenues, from S/.262.7 million for
2016 to S/.378.3 million, due to new contracts awarded during 2016 that initiated works in 2017.
113

Gross Profit. The table below sets forth the breakdown of our Infrastructure gross profit by principal lines of business.
Year ended December 31,
2016 2017 Variation
(in millions of S/.) %
Toll Roads 75.8 89.9 18.6
Mass Transit 42.5 48.7 14.6
Water Treatment 5.7 0.4 (93.0)
Energy 42.1 71.8 70.5
Operation and Maintenance of Infrastructure Assets 45.3 49.3 8.8
Total 211.4 260.2 23.1
Our Infrastructure gross profit increased 23.1%, or S/.48.8 million, from S/.211.4 million for 2016 to S/.260.2 for 2017. Our Infrastructure
gross margin was 18% for 2017 and 18% for 2016 as well. The variation in our Infrastructure gross profit principally reflected the following:
• Toll Roads: a 18.6%, or S/.14.1 million, increase in gross profit, from S/.75.8 million for 2016 to S/.89.9 million for 2017. Our Toll
Roads gross margin increased from 28.7% for 2016 to 34.1% for 2017, as a consequence of the fewer construction works that have
lower margins during 2017;
• Mass Transit: a 14.6%, or S/.6.2 million, increase in gross profit, from S/.42.5 million for 2016 to S/.48.7 million for 2017, primarily
due to more expansion works in 2017. Our gross margin for 2017 was 13.3%, compared to 17.2% for 2016, due to lower margins in
those expansion works;
• Water Treatment: a 93.0%, or S/.5.3 million, decrease in gross profit for 2017, from S/.5.7 million gross profit for 2016 to
S/.0.4 million gross profit for 2017, due to the conclusion of construction works. Our Water Treatment gross margin was 12.5% for
2017 compared to 30.8% for 2016;
• Energy: a 70.5%, or S/.29.7 million, increase in gross profit, from S/.42.1 million for 2016 to S/.71.8 million for 2017, primarily due
to the increase of international oil prices. Our Energy gross margin was 16.4% for 2017 compared to 11.0% for 2016; and
• Operation and Maintenance of Infrastructure Assets: a 8.8%, or S/.4.0 million, increase in gross profit, from S/.45.3 million for
2016 to S/.49.3 million for 2017, due to new contracts awarded during 2016 that initiated works. Our Operation and Maintenance of
Infrastructure Assets gross margin was 13.0% for 2017 compared to 17.2% for 2016, arising largely from certain high-costs delays
in financing working capital.
Operating Profit. The table below sets forth the breakdown of our Infrastructure operating profit by principal lines of business.
Year ended December 31,
2016 2017 Variation
(in millions of S/.) %
Toll Roads 65.7 80.1 21.9
Mass Transit 29.5 33.4 13.2
Water Treatment 4.9 0.1 (98.0)
Energy 25.4 61.1 140.6
Operation and Maintenance of Infrastructure Assets 20.6 27.7 34.5
Total 146.1 202.5 38.6
Our Infrastructure operating profit increased 38.6%, or S/.56.4 million, from S/.146.1 million for 2016 to S/.202.5 million for 2017. Our
Infrastructure operating margin was 14.0% for 2017 compared to 12.4% for 2016. The variation in our Infrastructure operating profit principally
reflected the following:
• Toll Roads: a 21.9%, or S/.14.4 million, increase in operating profit, from S/.65.7 million for 2016 to S/.80.1 million for 2017,
primarily due to the increase in gross profit given that administrative expenses remained at the same level. Our Toll Roads operating
margin was 30.4% for 2017 compared to 24.8% for 2016;
114

• Mass Transit: a 13.2%, or S/.3.9 million, increase in operating profit, from an operating profit of S/.29.5 million for 2016 to
S/.33.4 million for 2017, primarily due to the increase of gross profit, partially offset by an increase in administrative expenses due
to structuring fees and costs of the financing of the expansion. Our Mass Transit operating margin for 2017 was 9.1%, compared to
11.9% for 2016;
• Water Treatment: a 98.0%, or S/.4.8 million, decrease in operating profit, from an operating profit of S/.4.9 million for 2016 to
S/.0.1 million in 2017, mainly due to the decrease in gross profit. Our Water Treatment operating margin for 2017 was 3.1%
compared to 26.5% for 2016; and
• Energy: a 140.6%, or S/.35.7 million, increase in operating profit, from S/.25.4 million for 2016 to S/.61.1 million for 2017,
primarily due to the increase in gross profit given that the administrative expenses remained at the same level. Our Energy operating
margin was 14.0% for 2017 compared to 6.6% for 2016; and
• Operation and Maintenance of Infrastructure Assets: a S/.34.5%, or S/.7.1 million increase in operating profit, from a
S/.20.6 million profit for 2016 to a S/.27.7 million profit in 2017, primarily due to the increase in gross profit given that the
administrative expenses remained at the same level as 2016. Our Operation and Maintenance of Infrastructure Assets operating
margin was 7.3% for 2017 compared to 7.8% for 2016.
Real Estate
The table below sets forth selected financial information related to our Real Estate segment.
Year ended December 31,
2016 2017 Variation
(in millions of S/.) %
Revenue 411.5 647.5 57.4
Gross profit 136.5 147.4 8.0
Operating profit 108.9 171.5 57.5
Revenues. Our Real Estate revenues increased 57.4%, or S/.236.0 million, from S/.411.5 million for 2016 to S/.647.5 million for 2017. The
increase is primarily due to the sale of Cuartel San Martín in 2017 for S/.162.3 million, compared to the sale of land in Almonte for S/.97.0 million in
2016, as well as more units delivered in 2017 (1,418 units in 2017 and 938 units in 2016).
Gross Profit. Our Real Estate gross profit increased 8.0%, or S/.10.9 million, from S/.136.5 million for 2016 to S/.147.4 million for 2017,
mainly as a result of sale of Cuartel San Martín and units delivered during 2017 with higher margins. Our Real Estate gross margin was 22.8% for 2017
compared to 33.2% for 2016, this is due to the fact that the sale of Almonte had larger margins than the sale of Cuartel San Martín.
Operating Profit. Our Real Estate operating profit increased 57.7%, or S/.62.6 million, from S/.108.9 million for 2016 to S/.171.5 million
for 2017, primarily as a result of the increase in our gross profit and the sale of an investment, PRINSUR.
Financial (Expense) Income, Net
Our net financial expense decreased S/.42.8 million from net financial expenses of S/.179.8 million in 2016 to net financial expenses of
S/.137.0 million in 2017. Excluding foreign exchange differences, our net financial expense decreased 14.6%, or S/.24.5 million, from net financial
expenses of S/.167.1 million for 2016 to net financial expenses of S/.142.6 million for 2017 due to a reduction of debt and due to the fact that no
additional discounts in long term accounts receivables of GSP beyond those registered in 2016 were registered in 2017. Our net exchange difference
increased S/.18.1 million, from a loss of S/.12.5 million for 2016 to a profit of S/.5.6 million for 2017. This increase is due to the appreciation of the sol
against the U.S. dollar from 2016 to 2017.
Share of Profit and Loss in Associates
Our share of profit and loss in associates increased S/.590.6 million from a loss of S/.590.1 million in 2016 to a profit of S/.0.5 million in
2017. In 2016 we registered the impairment of our investment in GSP as a consequence of the cancellation of the concession on January 24, 2017. There
were no additional impairments in 2017. For more information, see “Item 5.A. Operating and Financial Review and Prospects—Operating
Results—Recent Developments.”
115
Income Tax
Our income tax increased S/.198.5 million, from a negative income tax of S/.152.2 million in 2016 to an income tax of S/.46.3 million for
2017. This increase in income tax was primarily due to an increase in profit before tax. Our effective tax rates for 2017 and 2016 were 102.6% and
20.5%, respectively.
Net Profit
Our net profit increased 146.3%, or S/.660.8 million, from a S/.451.6 million loss for 2016 to a S/.209.2 million profit for 2017. Net profit
attributable to controlling interests decreased 129.2%, while net profit attributable to non-controlling interests increased 4.1%. Net profit attributable to
non-controlling interests increased primarily due to increases arising from our Real Estate segment. See “—General—Accounting for Subsidiaries, Joint
Operations, Joint Ventures and Associated Companies.”
B. Liquidity and Capital Resources
Our principal sources of liquidity have historically been cash flows from operating activities and, to a lesser extent, equity capitalization and
indebtedness. Our principal uses of cash (other than in connection with our operating activities) have historically been: capital expenditures in all our
business segments, including acquisitions and investments in our infrastructure concessions; servicing of our debt; and payment of dividends.
As a result of the termination of the GSP gas pipeline concession, we have renegotiated three debt instruments as follows: (i) we amended
the terms of our syndicated loan related to our equity investment in GSP; (ii) we repaid our proportional guarantee of the GSP bridge loan and entered a
new term loan; and (iii) we amended the terms of our proportional repayment obligations under the GSP performance guarantee.
In order to strengthen our liquidity and financial flexibility, particularly in the event of potential delays in receiving the government
payment contemplated under the GSP gas pipeline concession contract, and make payments on our debt related to the GSP project, our board has
approved the sale of non-strategic assets in the amount of up to US$350 million (S/.1,176 million) in proceeds. For more information, see “Item 5.A.
Operating and Financial Review and Prospects—Operating Results—Recent Developments.”
On November 6, 2018, our company’s general meeting of shareholders and board of directors approved an offering and sale of our
company’s common shares in a private placement. Accordingly, in December 2018, our company issued and sold a total of 69,380,402 common shares
to certain of our company’s existing shareholders that exercised preemptive rights in accordance with Peruvian law. Additionally, on April 2, 2019, our
company issued and sold 142,483,633 common shares pursuant to the private placement, of which: (i) 55,291,877 shares were paid in full and (ii)
87,191,786 shares were paid 50% with 50% to be paid by July 1, 2019. In total, our company issued and sold 211,864,065 common shares, with the
proceeds amounting to US$130 million to use to reduce debt, to pay our vendors and for working capital of one of our company’s subsidiaries.
We believe that our sources of cash will be sufficient to cover our working capital needs in the ordinary course of business. We believe that
our cash from operations and our other sources of cash are sufficient to satisfy our current capital expenditures and debt service obligations through the
next twelve months.
We are currently in default under one of our debt instruments. In addition, in the past we were in default under certain of our debt
instruments and procured waivers from our creditors under such instruments. For more information, see “Item 13. Defaults, Divided Arrearages and
Delinquencies.”
We had credit lines with various financial institutions for a total amount of US$1,427.3 million as of December 31, 2017 and
US$661.6 million as of December 31, 2018. However, our banks have currently restricted us from taking out further lines of credit to finance new
operations. See “—A. Operating Results—Recent Developments—Emergency Decree and Subsequent Legislation.”
At December 31, 2018, our cash and cash equivalents totaled S/.801.1 million (US$237.1 million), of which S/.76.3 million (US$22.6
million) was held by our foreign subsidiaries. We intend to distribute any excess cash to our company. We are not currently required to accrue or pay
any material taxes associated with the repatriation of these funds. In addition, our foreign subsidiaries have no contractual restrictions, and we are not
aware of any material legal restrictions, on their ability to transfer funds to us in the form of cash dividends, loans or advances.
Cash Flows
The table below sets forth certain components of our cash flows for 2016, 2017 and 2018.
116

Year ended December 31,
2016 2017 2018
(in millions of S/.)
Net cash provided by (used in) operating activities 333.7 491.2 279.3
Net cash provided by (used in) investing activities (373.7) 348.9 137.9
Net cash provided by (used in) financing activities (85.8) (786.1) (300)
Net increase (net decrease) in cash 45.8 54.0 117.1
Cash Flow from Operating Activities
Net cash flow used in in operating activities in 2018 was lower than in 2017. For 2018, this reflects the reduction of accounts payable
according to terms with our suppliers, and a decrease in accounts receivable due to a reduction in accounts advanced to suppliers, taxes paid in advance
and other accounts receivable.
Net cash flow used in operating activities in 2017 was greater than in 2016. For 2017, this reflects an increase in account payables during
the year, due to the renegotiation of terms with our suppliers to pay in longer periods.
Cash Flow from Investing Activities
Net cash flow provided by investing activities in 2018 was lower than in 2017. In 2018, we sold more property, plant and equipment than
we did in 2017.
Net cash flow provided by investing activities in 2017 was higher than in 2016. In 2017, there was more cash flow from the sale of assets
than cash flow used in investments.
Cash Flow from Financing Activities
Net cash flow provided by financing activities in 2018 was lower than in 2017. This is primarily due to less reduction of debt during the
course of the year compared to 2017, and the capital increase approved at the end of the year.
Net cash flow provided by financing activities in 2017 was higher than in 2016. This is primarily due to the reduction of GSP debt with the
sale of assets.
Indebtedness
As of December 31, 2018, we had a total outstanding indebtedness of S/.2,139.7 million (US$633.2 million) as set forth in the table below.
Segment Type
Debt Amount
Total in
millions
of S/.
Total in
millions
of US$
Weighted
average
interest
rate
Range of Maturity
Dates
(in
millions
of
US$)
(in
millions
of S/.)
(in
millions
of
CLP)(1)
(in
millions
of
COP) Minimum Maximum
E&C Leasing 2.4 — 1,901.4 1,364.1 18.8 5.6 3.9% 02/01/2019 02/01/2023
Promissory Note 18.6 154.9 — 5,038.9 222.9 66.0 7.1% 01/01/2019 31/12/2020
Infrastructure Leasing 0.7 5.1 — — 7.6 2.2 6.1% 20/01/2019 01/11/2021
Long term loan 94.0 937.0 — — 1,254.7 371.3 5.7% 25/07/2019 25/11/2039
Promissory Note 4.1 — — — 13.9 4.1 15.8% 04/01/2019 22/02/2019
Real Estate Leasing — 12.1 — — 12.1 3.6 7.8% 02/01/2019 01/07/2022
Promissory Note — 131.7 — — 131.7 39.0 8.0% 18/01/2019 26/01/2020
Corporate Long term loan(2) 141.5 — — — 478.0 141.5 8.4% 11/06/2019 10/12/2020
Total 261.3 1,240.8 1,901.4 6,403.0 2,139.7 633.2
(1) Includes debt held by Vial y Vives—DSD that is denominated in Chilean pesos.
(2) Does not include our payable to Chubb Insurance Company related to our proportional repayment obligation under the GSP performance
guarantee, which was repaid in full on December 6, 2018.
117
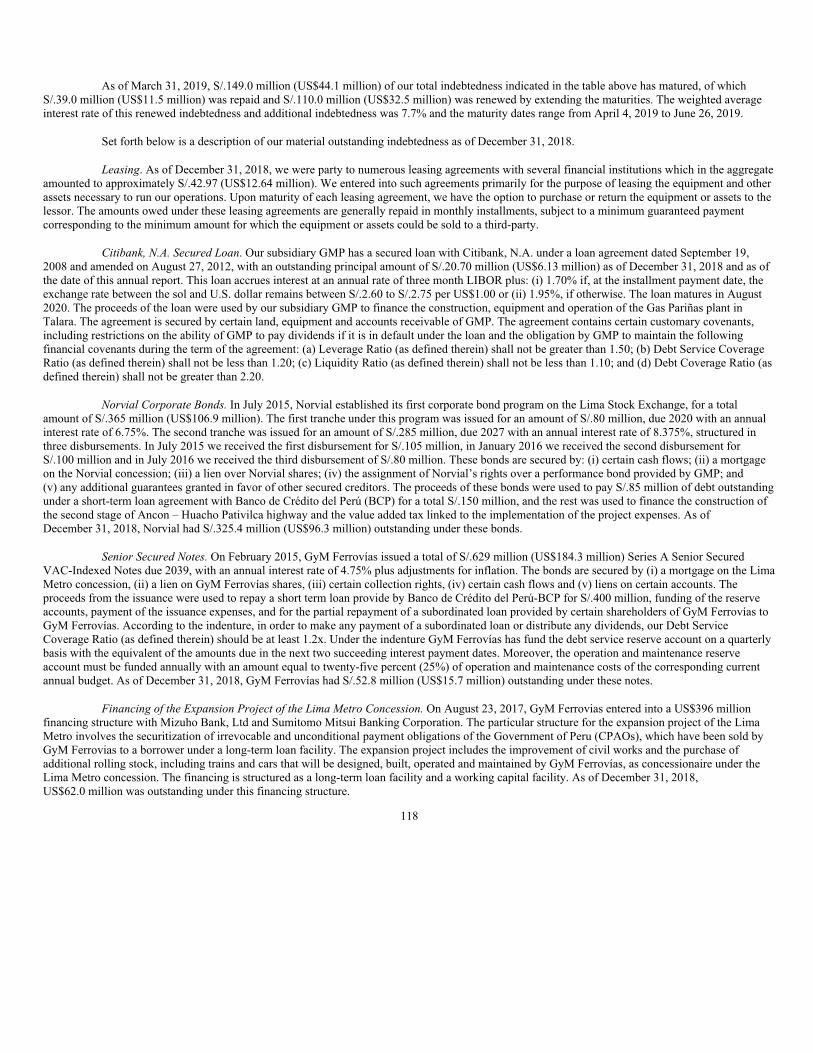
As of March 31, 2019, S/.149.0 million (US$44.1 million) of our total indebtedness indicated in the table above has matured, of which
S/.39.0 million (US$11.5 million) was repaid and S/.110.0 million (US$32.5 million) was renewed by extending the maturities. The weighted average
interest rate of this renewed indebtedness and additional indebtedness was 7.7% and the maturity dates range from April 4, 2019 to June 26, 2019.
Set forth below is a description of our material outstanding indebtedness as of December 31, 2018.
Leasing. As of December 31, 2018, we were party to numerous leasing agreements with several financial institutions which in the aggregate
amounted to approximately S/.42.97 (US$12.64 million). We entered into such agreements primarily for the purpose of leasing the equipment and other
assets necessary to run our operations. Upon maturity of each leasing agreement, we have the option to purchase or return the equipment or assets to the
lessor. The amounts owed under these leasing agreements are generally repaid in monthly installments, subject to a minimum guaranteed payment
corresponding to the minimum amount for which the equipment or assets could be sold to a third-party.
Citibank, N.A. Secured Loan. Our subsidiary GMP has a secured loan with Citibank, N.A. under a loan agreement dated September 19,
2008 and amended on August 27, 2012, with an outstanding principal amount of S/.20.70 million (US$6.13 million) as of December 31, 2018 and as of
the date of this annual report. This loan accrues interest at an annual rate of three month LIBOR plus: (i) 1.70% if, at the installment payment date, the
exchange rate between the sol and U.S. dollar remains between S/.2.60 to S/.2.75 per US$1.00 or (ii) 1.95%, if otherwise. The loan matures in August
2020. The proceeds of the loan were used by our subsidiary GMP to finance the construction, equipment and operation of the Gas Pariñas plant in
Talara. The agreement is secured by certain land, equipment and accounts receivable of GMP. The agreement contains certain customary covenants,
including restrictions on the ability of GMP to pay dividends if it is in default under the loan and the obligation by GMP to maintain the following
financial covenants during the term of the agreement: (a) Leverage Ratio (as defined therein) shall not be greater than 1.50; (b) Debt Service Coverage
Ratio (as defined therein) shall not be less than 1.20; (c) Liquidity Ratio (as defined therein) shall not be less than 1.10; and (d) Debt Coverage Ratio (as
defined therein) shall not be greater than 2.20.
Norvial Corporate Bonds. In July 2015, Norvial established its first corporate bond program on the Lima Stock Exchange, for a total
amount of S/.365 million (US$106.9 million). The first tranche under this program was issued for an amount of S/.80 million, due 2020 with an annual
interest rate of 6.75%. The second tranche was issued for an amount of S/.285 million, due 2027 with an annual interest rate of 8.375%, structured in
three disbursements. In July 2015 we received the first disbursement for S/.105 million, in January 2016 we received the second disbursement for
S/.100 million and in July 2016 we received the third disbursement of S/.80 million. These bonds are secured by: (i) certain cash flows; (ii) a mortgage
on the Norvial concession; (iii) a lien over Norvial shares; (iv) the assignment of Norvial’s rights over a performance bond provided by GMP; and
(v) any additional guarantees granted in favor of other secured creditors. The proceeds of these bonds were used to pay S/.85 million of debt outstanding
under a short-term loan agreement with Banco de Crédito del Perú (BCP) for a total S/.150 million, and the rest was used to finance the construction of
the second stage of Ancon – Huacho Pativilca highway and the value added tax linked to the implementation of the project expenses. As of
December 31, 2018, Norvial had S/.325.4 million (US$96.3 million) outstanding under these bonds.
Senior Secured Notes. On February 2015, GyM Ferrovías issued a total of S/.629 million (US$184.3 million) Series A Senior Secured
VAC-Indexed Notes due 2039, with an annual interest rate of 4.75% plus adjustments for inflation. The bonds are secured by (i) a mortgage on the Lima
Metro concession, (ii) a lien on GyM Ferrovías shares, (iii) certain collection rights, (iv) certain cash flows and (v) liens on certain accounts. The
proceeds from the issuance were used to repay a short term loan provide by Banco de Crédito del Perú-BCP for S/.400 million, funding of the reserve
accounts, payment of the issuance expenses, and for the partial repayment of a subordinated loan provided by certain shareholders of GyM Ferrovías to
GyM Ferrovías. According to the indenture, in order to make any payment of a subordinated loan or distribute any dividends, our Debt Service
Coverage Ratio (as defined therein) should be at least 1.2x. Under the indenture GyM Ferrovías has fund the debt service reserve account on a quarterly
basis with the equivalent of the amounts due in the next two succeeding interest payment dates. Moreover, the operation and maintenance reserve
account must be funded annually with an amount equal to twenty-five percent (25%) of operation and maintenance costs of the corresponding current
annual budget. As of December 31, 2018, GyM Ferrovías had S/.52.8 million (US$15.7 million) outstanding under these notes.
Financing of the Expansion Project of the Lima Metro Concession. On August 23, 2017, GyM Ferrovias entered into a US$396 million
financing structure with Mizuho Bank, Ltd and Sumitomo Mitsui Banking Corporation. The particular structure for the expansion project of the Lima
Metro involves the securitization of irrevocable and unconditional payment obligations of the Government of Peru (CPAOs), which have been sold by
GyM Ferrovias to a borrower under a long-term loan facility. The expansion project includes the improvement of civil works and the purchase of
additional rolling stock, including trains and cars that will be designed, built, operated and maintained by GyM Ferrovías, as concessionaire under the
Lima Metro concession. The financing is structured as a long-term loan facility and a working capital facility. As of December 31, 2018,
US$62.0 million was outstanding under this financing structure.
118

BCP Loan. In December 2015, our subsidiary GMP S.A. and Oiltanking Peru S.A.C. subscribed in equal parts to a medium term loan credit
agreement for up to US$100 million with Banco de Crédito del Peru, comprised of (i) a medium term tranche for up to US$70 million (for additional
investments) with an annual interest rate of 6.04% and a term of five years, and (ii) a medium term tranche for up to US$30 million (for committed
investments) with an annual interest rate of 6.32% and a term of eight years. The tranches of the loan mature in 2024 and 2027, respectively. The
proceeds of this loan are to finance Terminales del Peru’s obligations in the operation contracts that it maintains with Petroperu in regards to the Central
Terminal (corresponding to the Callao Port), and North Terminals (corresponding to the Etén, Salaverry, Chimbote and Supe Ports). As of
December 31, 2018, GMP S.A. had US$24.6 million (S/.83.0 million) outstanding under this loan.
Syndicated Loan. In December 2015 we entered into a medium term loan credit agreement for up to US$200 million (S/.672 million) with
Credit Suisse AG, Cayman Islands Branch, and Credit Suisse Securities (USA) LLC. The term of the loan is five years, with quarterly installments
starting on the 18th month. The loan accrued interest at a rate of three months Libor plus 3.9% per year. The proceeds were used to finance our equity
participation in GSP, which was the concessionaire of the southern gas pipeline project. As of December 31, 2018, the principal amount outstanding
under this loan was US$37.5 million (S/.127 million) and, as of the date of this annual report, the principal amount outstanding under this loan is
US$31.45 million (S/.103.45 million).
As a result of the termination of the GSP gas pipeline concession, in June 2017, we entered into an amendment to the credit agreement.
According to the terms of the amendment, our syndicated loan matures in December 2020, with required prepayments to be made with the proceeds of
asset sales of 40% in the first year and an additional 30% in the second year of the amendment. The syndicated loan continues to accrue interest at
LIBOR plus 4.90% per year. In addition, we are prohibited from paying dividends until the loan is repaid in full. Also, we have provided additional
security interests, so that the amended syndicated loan will be secured by: (i) a first lien on our shares of GyM and Concar; (ii) a first lien on our shares
of Almonte; (iii) a first lien on certain real estate properties in Surquillo; (iv) liens on certain related accounts; (v) a second priority lien on our shares of
CAM and CAM Servicios; and (vi) a first lien on cash flows from the sale of certain assets.
The amendment to the credit agreement contains certain covenants, including the obligation by us to maintain the following financial ratios
during the term of the agreement: (i) the Consolidated EBITDA to Consolidated Interest Expense Ratio (as defined therein) shall not be less than 3.5:1.0
commencing on April 1, 2018 and thereafter; (ii) the Consolidated Leverage Ratio (as defined therein) shall not be greater than (a) 3.5:1.0 at any time
during the period commencing on December 31, 2016 and ending on March 31, 2017; (b) 3.5:1.0 at any time during the period commencing on April 1,
2017 and ending on June 30, 2017; (c) 3.0:1.0 at any time during the period commencing on July 1, 2017 and ending on September 30, 2017; and
(d) 2.5:1.0 at any time thereafter; and (iii) the Debt Service Coverage Ratio (as defined therein) as of the last day of any fiscal quarter of the borrower,
falling on or after the first anniversary of the closing date, shall not be less than 1.5:1.0 commencing on April 1, 2018 and thereafter. Furthermore, the
agreement contains a covenant restricting the CAM Chile Leverage Ratio (as defined therein) from exceeding 2.5:1.0 at any time. The agreement also
imposes limitations, in an event of default, on ours and our subsidiaries’ ability to distribute dividends, including, among others, that we may only
distribute cash dividends to our stockholders out of 40% of our net income available for distribution in accordance with IFRS, as reflected in our audited
consolidated financial statements for the fiscal year most recently ended.
GSP Bridge Loan and New Term Loan. With the termination of the GSP gas pipeline concession, our proportional guarantee under the GSP
bridge loan became due. As of December 31, 2016, there was US$129 million (S/.433.4 million) of principal amount outstanding under our corporate
guarantee. The principal amount outstanding under the GSP bridge loan has been entirely paid. On June 27, 2017 we entered into a new
US$78.7 million (S/.264.8 million) term loan with Natixis, BBVA, SMBC and MUFJ, the proceeds of which were used to prepay GSP bridge loan. The
new term loan matures on 2020, with required prepayments to be made with the proceeds of asset sales of 40% in the first year and an additional 30% in
the second year of the amendment. The agreement with respect to such term loan contains a covenant restricting the Consolidated Leverage Ratio (as
defined therein) from exceeding 3.5:1.0 at any time and the CAM Chile Leverage Ratio (as defined therein) from exceeding 2.5:1.0 at any time. The
term loan accrues interest at LIBOR plus 4.50% per year, which will increase to 5.00% during the second year and to 5.50% during the third year. In
addition, we will be prohibited from paying dividends until the loan is repaid in full. Also, the term loan will be secured by: (i) a first lien on our rights
to receive the termination payment derived from the GSP termination (the “VCN”), (ii) a second priority lien on our shares of GyM and Concar; (iii) a
second priority lien on our shares of Almonte; (iv) a second priority lien on certain real estate properties in Surquillo; (v) a second priority lien on our
shares of CAM; (vi) a second priority lien on our shares of CAM Servicios; and (vii) a first lien on cash flows from the sale of certain assets. The
principal amount outstanding under the new term loan was US$63.47 million (S/.214.46 million) as of December 31, 2018, and as of the date of this
annual report, there is US$47.25 million (S/.156.16) outstanding on the term loan.
GSP Performance Guarantee. Upon the termination of the GSP gas pipeline concession, our proportional repayment obligations under the
GSP performance guarantee from Chubb Insurance Company in the amount of US$52.5 milllion (S/.177.4 million) became due. On December 6, 2018,
we paid the final installment with respect to our our obligations to Chubb Insurance Company.
119

Financial Stability Framework Agreement. On July 31, 2017, we, and certain of our subsidiaries, GyM, Construyendo País S.A., Vial y
Vives — DSD and Concesionaria Vía Expresa Sur S.A., entered into a Financial Stability Framework Agreement (together with certain complementary
contracts, the “Framework Agreement”) with the following financial entities: Scotiabank Perú S.A., Banco Internacional del Perú S.A.A., BBVA Banco
Continental, Banco de Crédito del Perú, Citibank del Peru SA and Citibank N.A. The Framework Agreement aims to: (i) grant GyM a syndicated
revolving line of credit for working capital for up to US$1.6 million and S/.143.9 million, which may be increased by an additional US$14 million
subject to certain conditions; (ii) grant GyM a line of credit of up to US$51.6 million and S/.33.6 million; (iii) grant us, GyM, Construyendo País S.A.,
Vial y Vives – DSD and Concesionaria Vía Expresa Sur S.A. a non-revolving line of credit to finance reimbursement obligations under performance
bonds; (iv) grant a syndicated line of credit in favor of us and GyM for the issuance of performance bonds up to an amount of US$100 million (which
may be increased by an additional US$50 million subject to compliance with certain conditions); and (v) to commit to maintain existing standby letters
of credit issued at the request of GyM and us, as well as the request of Construyendo País S.A., Vial y Vives – DSD and Concesionaria Vía Expresa Sur
S.A. In April 2018, we repaid US$72.7 million of the facility with the proceeds of the sale of Stracon GyM and in July of 2018 we repaid an additional
of US$ 15.4 million. As of December 31, 2018, there was US$59.44 million outstanding under this agreement.
As of December 31, 2018 and as of the date hereof, our construction subsidiary GyM is under a continuing default under the Financial
Stability Framework Agreement with respect to its failure to comply with certain ratios between Tranche A (client invoices) and Tranche B (client
provisions). No event of default has been formally notified to GyM by the lenders, and our subsidiary has requested a waiver from the lenders, which is
pending. If duly notified to GyM by the lenders, the consequence of this default would be to transfer certain amounts due under Tranche A to Tranche
B, for which payment is not due until July 2019. As of December 31, 2018, there was US$43.7 million (S/.147.8 million) outstanding under Tranche A
and US$15.7 million (S/.53.0 million) outstanding under Tranche B of the facility, for a total of US$59.4 million.
Derivative Financial Instruments
In August 2012, our subsidiary GMP entered into two interest rate swaps with Citibank, N.A. to hedge its exposure to fluctuations in
LIBOR under its unsecured loan with Citibank, N.A. described above. These interest rate swaps establish a fixed annual rate of 5.05%, payable at each
interest payment date under the loan.
We did not execute any derivative financial instruments from 2013 until the date hereof, other than as described above. For additional
information about our derivative financial instruments and borrowings, see notes 2.9 and 19 to our audited annual consolidated financial statements
included in this annual report.
Capital Expenditures
The table below provides our total capital expenditures incurred in 2016, 2017 and 2018.
2016 2017 2018
(in millions
of S/.)
(in millions
of US$)
(in millions
of S/.)
(in millions
of US$)
(in millions
of S/.)
(in millions
of US$)
E&C(1)(2) Capital expenditure 116.8 34.8 49.4 15.2 (40.2) (11.9)
Divestitures — — (11.8) (3.6) (257.6) (76.2)
Total E&C 116.8 34.8 37.6 11.6 (297.8) (88.1)
Infrastructure Capital expenditure 146.8 43.7 122.6 37.8 131.7 39.0
Divestitures — — — — — —
Total Infrastructure 146.8 43.7 122.6 37.8 131.7 39.0
Real Estate(3) Capital expenditure 49.7 14.8 39.7 12.2 (4.9) (1.5)
Divestitures — — (36.3) (11.2) — —
Total Real Estate 49.7 14.8 3.4 1.0 (4.9) (1.5)
Corporate(2) Capital expenditure 529.5 157.6 (-0.6) (0.2) 2.2 0.6
Divestitures (107.6) (32.0) (121.7) (37.5) (12.1) (3.6)
Total Corporate 421.9 125.6 (122.3) (37.7) (10.0) (3.0)
TOTAL(4)(5) 735.2 218.8 41.2 12.7 (181.0) (53.6)
(1) In our consolidated financial statements, in accordance with IFRS, we record in “cash flow used in investing activities” with respect to equipment
leases only the amounts paid during the period as opposed to the total amount of lease payments, which is included in the table above.
(2) Includes S/.73.4 million, S/.0 million and S/.0 million of capital expenditures related to acquisitions in 2016, 2017 and 2018, respectively.
(3) Includes S/.13.9 million, S/.1.0 and S/.8.3 million in investments in 2016, 2017 and 2018, respectively, for the purchase of land by our Real Estate
segment, which in accordance with IFRS are recorded in our consolidated financial statements as “inventory.”
120

(4) In our consolidated financial statements, in accordance with IFRS, we record as “cash flow used in investing activities” with respect to equipment
leases only the amounts paid during the period as opposed to the total amount of lease payments which is included in the table above.
(5) Divestitures are related to the sale of non-strategic assets, and minor divestitures are in capital expenditures.
Capital expenditures for our E&C segment of approximately S/.116.8 million (US$34.8 million), S/.49.9 million (US$15.2 million) and S/.
(40.2) million (US$(11.9) million), in 2016, 2017 and 2018, respectively, primarily correspond to the purchase and sale of equipment and machinery
and, to a lesser extent, investments relating to mining services contracts. In 2016, capital investments in the E&C segment also included S/.51.1 million
(US$15.2 million) with respect to an additional stake in Vial y Vives- DSD. In 2017, capital investments in the E&C segment only included the
purchase and sale of equipment and machinery. In 2018, capital investments in the E&C segment only included the sale of equipment.
Capital expenditures for our Infrastructure segment of approximately S/.146.8 million (US$43.7 million), S/.122.6 million (US$37.8
million) and S/.131.7 million (US$39 million) in 2016, 2017 and 2018, respectively, correspond to periodic maintenance and the construction of the
second stage of our Norvial toll road concession and, in our Energy line of business, oil development drilling activities as well as improvements for our
gas processing plant and investments in the Lima Metro. In 2016, capital expenditures mainly corresponded to the start of the campaign to drill wells in
Block IV, the expansion of tanks at Terminales del Peru and the construction of the second stage of our Norvial toll road concession. In 2017, capital
expenditures for our Infrastructure segment continued with the construction and maintenance of second stage of Norvial toll road concession, and also
investments incurred in drilling wells in Blocks IV. In 2018, capital expenditures for our infrastructure segment also included the continuation of drilling
wells and, to a lesser extent, the maintenance of the Lima Metro and the second stage of our Norvial toll road concession.
Capital expenditures for our Real Estate segment of approximately S/.49.7 million (US$14.8 million), S/.39.7 million (US$12.2 million) and
S/.(4.9) million (US$(1.5) million) in 2016, 2017 and 2018, respectively, primarily correspond to the purchase of land for real estate projects,
including the Pezet and Paul Harris projects in 2016, an additional purchase for the Paul Harris project in 2017, and the liquidation of Panorama project,
and an additional purchase for the Paul Harris project in 2018.
In 2016, corporate segment investments were S/ 529.5 million, which mainly included S/426.4 million (US$127 million) for the acquisition
of our 20% stake in GSP and S/.22.3 million (US$6.6 million) for an additional stake in Adexus. In 2017 and 2018, there were no relevant corporate
segment investments, as the company initiated a divestment process of non-strategic assets.
Divestitures in 2016 consisted of S/.107.6 million (US$32.0 million) relating to the sale of our 1.64% stake in Transportadora de Gas del
Perú S.A. (TGP). Divestitures in 2017 consisted of approximately S/.169.8 million (US$52.3 million) relating to the sale of our stake in Red Eagle of
Stracon GyM, the sale of our 22.5% stake held in our associate, PRINSUR, the sale of our 89.19% interest in GMD, our IT services subsidiary, and the
sale of our 51% interest in COGA to our partners, Enagas and Carmen Corporation. Divestitures in 2018 consisted of S/.269.7 million (US$79.8
million) relating to the sale of our interests in Stracon GyM, CAM Chile and CAM Servicios.
We have budgeted S/.268.8 million (US$79.6 million) in capital expenditures for 2019. Our current plans for our E&C segment contemplate
capital expenditures in 2019 of approximately S/.11.5 million (US$3.4) million, mainly for the purchase of equipment and machinery. Our current plans
for our Infrastructure segment contemplate capital expenditures in 2019 of approximately S/.230.4 million (US$68.2 million), principally for
investments in oil development drilling activities. Our current plans for our Real Estate segment contemplate expenditures in 2019 of approximately
S/.59.9million (US$17.7 million) for the purchase of land for real estate development projects. Our current plans for our Corporate segment contemplate
divestitures in 2019 of approximately S/.33 million (US$9.8 million).
These estimates are subject to change. We routinely evaluate acquisitions, new infrastructure concessions, land purchases and other
investment or divestiture opportunities that are aligned with our strategic goals, particularly in Peru, Chile and Colombia. We cannot assure you that we
will find opportunities on terms that we consider to be favorable to us, whether we will be able to take advantage of such opportunities should they arise,
or the timing of and funds required by such opportunities. In addition, should we undertake any such investments, we expect to finance these
opportunities with a combination of cash on hand, new borrowings and/or financial contributions from partners, depending on a variety of commercial
considerations at such time. See “Part I. Forward-Looking Statements.”
C. Research and Development, Patents and Licenses, Etc.
Not applicable.
D. Trend Information
121

Our Main Market: Peru
The following sets forth key macroeconomic trends in our markets, Peru, Chile and Colombia. For additional information on trends in our
business, see “Item 5.A. Operating and Financial Review and Prospects—Operating Results—Factors Affecting our Results of Operations” and “Item
4.B. Business Overview—Backlog.”
Overview of the Peruvian Economy
Our results are substantially affected by economic conditions prevailing in Peru. The Peruvian economy has been one of the fastest growing
economies globally during the period from 2014 to 2018. According to the Peruvian Central Bank, Peruvian real GDP grew at an average rate of 3.24%
during that period, one of the highest rates in South America. The economic expansion during this period was a result of robust domestic demand,
increase in investment, price stability, increase in foreign direct investment, and an improvement in public finances, among other factors.
Nominal GDP per capita has increased from S/. 21,959.3 in 2014 to S/. 23,670.2 in 2018, a 7.79%% increase. Average annual inflation,
measured by the change in the CPI index, was 2.9% in the period from 2014 to 2018. On the other hand, Peru’s Sol, depreciated from an average of
S/.2.84 per US$1.00 in 2014 to an average of S/.3.29 per US$1.00 in 2018, a depreciation of 14.3%. Peru’s sovereign debt has been granted investment
grade rating by S&P, Fitch and Moody’s. At the end of 2018, Peruvian sovereign debt had one of the highest credit ratings in the South American
region, rated BBB+ by S&P (August 2013) and Fitch (March 2019) and A3 by Moody’s (August 2018).
The following table sets forth the main economic indicators of the Peruvian economy from 2014 to 2018:
2014 2015 2016 2017 2018
Nominal GDP (US$ billions) 202.8 192.3 195.3 215.1 225.3
Nominal GDP / capita (US$) 6,455.0 6,172.7 6,204.5 6,756.7 7,005.1
Real GDP growth rates (% based on local currency GDP) 2.4 % 3.3 % 4.0 % 2.5 % 4%
Private consumption growth rate 3.9 % 4.0 % 3.3 % 2.5 % 3.8%
Private investment growth rate (2.3%) (4.3%) (5.9%) 0.1 % 4.4%
Foreign direct investment growth rate (15.2%) 4.9 % (17.0%) (1.4%) (8.8%)
Public expenditure (consumption and investment) growth rate 3.6 % 3.6 % (0.2%) 1.1 % 4.3%
Total private and public fixed investment growth rate(1) (2.1%) (5.3%) (4.6%) 0.0 % 5.2%
Exports growth rate (0.9%) 4.0 % 9.5 % 8.5 % 2.5%
Imports growth rate (1.4%) 2.4 % (2.2%) 4.0 % 3.4%
Inflation (measured by change in CPI) 3.2 % 4.4 % 3.2 % 1.4 % 2.2%
Average exchange rate (S/./US$) 2.84 3.19 3.38 3.26 3.29
End of period exchange rate (S/./US$) 2.99 3.41 3.36 3.25 3.38
Central Bank interest rate (end of period) 3.50 % 3.75 % 4.25 % 3.25 % 2.80%
Population (million)(1) 31.4 31.1 31.5 31.8 32.5
Unemployment rate(1) 6.0 % 6.4 % 6.7 % 6.7 % 6.6%
Total public debt (US$ billions) 38.6 41.8 46.7 53.6 57.9
Public debt/nominal GDP (%) 20.0 % 23.3 % 23.8 % 24.8 % 25.7%
Net reserves (US$ billions) 62.3 61.5 61.7 63.6 60.2
Net reserves/nominal GDP (%) 30.7 % 32.0 % 31.6 % 29.6 % 26.7%
Fiscal surplus (deficit)/nominal GDP (%) (0.3%) (2.1%) (2.6%) (3.1%) (2.4%)
Source: Peruvian Central Bank, SBS, Ministry of Economy and Finance, National Statistical Institute of Peru (INEI), IMF.
(1) 2018 projected by IMF.
The following table sets forth real gross domestic product by expenditure for the years indicated.
GDP by Expenditure (% of GDP unless otherwise stated) 2014 2015 2016 2017 2018
Government consumption 12.2 12.6 12.0 11.8 11.5
Private consumption 63.0 65.5 65.5 64.8 64.7
Total fixed investment 26.3 24.6 22.6 21.1 22.4
Public sector 5.6 5.0 4.8 4.6 4.8
122

GDP by Expenditure (% of GDP unless otherwise stated) 2014 2015 2016 2017 2018
Private sector 20.1 19.3 17.8 16.9 17.6
Change in inventories(1) 0.6 0.3 (0.0 ) (0.5 ) (0.6)
Exports of goods and services 22.4 21.0 22.1 24.3 25.0
Imports of goods and services 24.0 23.7 22.2 22.0 23.0
Net exports (1.6 ) (2.7 ) (0.1 ) 2.3 2.0
GDP (in billions of US$) 202.8 192.3 195.3 215.1 225.3
Source: Peruvian Central Bank
(1) Defined as the difference between the volume at the end of the period and the volume at the beginning of the period; valued at the average price
over the period.
Key Industry Sectors Relating to Our Business in Peru
Construction and Infrastructure
The Peruvian construction industry nominal GDP is estimated at US$13.3 billion and accounted for 5.9% of the country’s nominal GDP in
2018 according to the Peruvian Central Bank. Construction GDP grew at an average of 0.5% annually in real terms during the five years from 2014 to
2018. The following table illustrates, from 2014 to 2018, the average real growth rate in both private investment and construction in Peru vis-à-vis the
average real GDP growth rate.
Growth of Real Private Investment GDP and Real Construction Sector GDP vs. Real GDP
Source: Peruvian Central Bank.
Mining
Peru is a poly-metallic resources producer and exports several metals including silver, copper, zinc, gold and lead, among others. Peru is
also a major contributor to global metal reserves. According to the U.S. Geological Survey of 2018, Peru holds 15.9% of global silver reserves, 12.3%
of global zinc reserves, 11.4% of global copper reserves and 4.4% of global gold reserves, as of March 2019. According to the Peruvian Central Bank,
mining exports reached approximately US$ 28.8 billion and represented 59% of total Peruvian exports in 2018.
As of December 2017, the Peruvian Ministry of Energy and Mines estimates 48 mining projects at various stages of development involving
an estimated investment of US$59.1 billion.
Mining Investment Projects by Level of Development
Number of
Projects
US$
billion
Under construction 7 10.1
Detailed Engineering 5 4.9
Feasibility 14 14.6
Pre-feasibility 22 29.4
Total 48 59.1
123
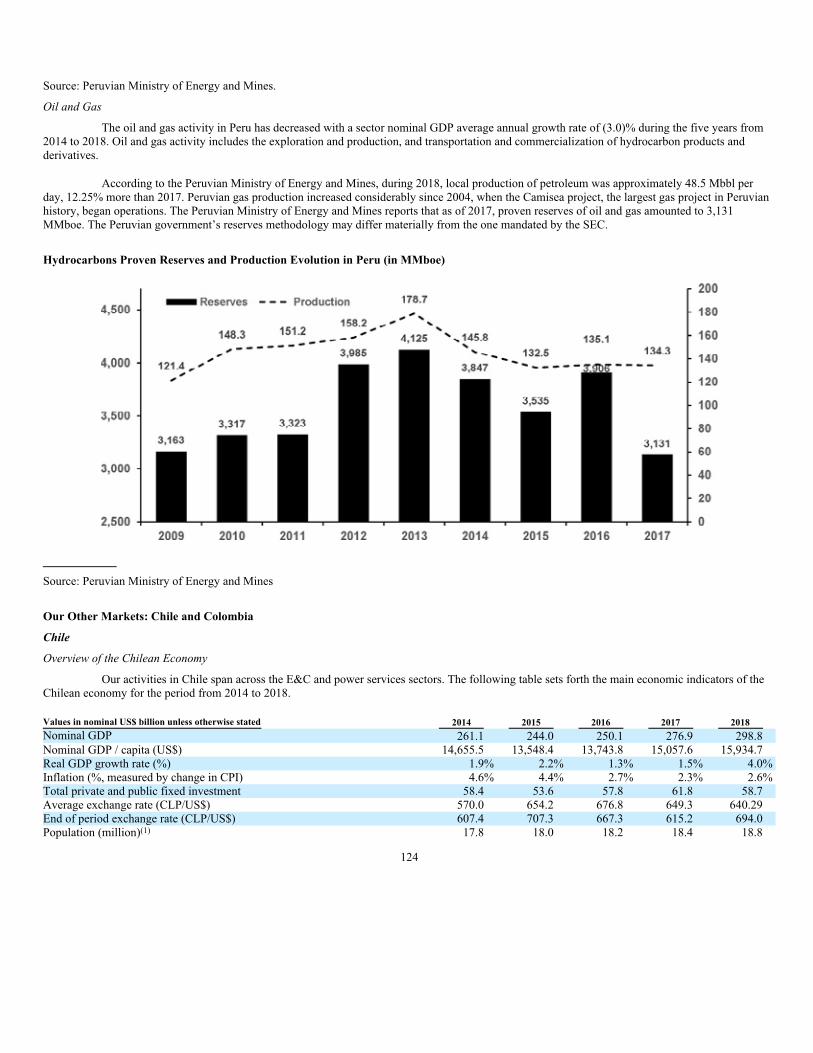
Source: Peruvian Ministry of Energy and Mines.
Oil and Gas
The oil and gas activity in Peru has decreased with a sector nominal GDP average annual growth rate of (3.0)% during the five years from
2014 to 2018. Oil and gas activity includes the exploration and production, and transportation and commercialization of hydrocarbon products and
derivatives.
According to the Peruvian Ministry of Energy and Mines, during 2018, local production of petroleum was approximately 48.5 Mbbl per
day, 12.25% more than 2017. Peruvian gas production increased considerably since 2004, when the Camisea project, the largest gas project in Peruvian
history, began operations. The Peruvian Ministry of Energy and Mines reports that as of 2017, proven reserves of oil and gas amounted to 3,131
MMboe. The Peruvian government’s reserves methodology may differ materially from the one mandated by the SEC.
Hydrocarbons Proven Reserves and Production Evolution in Peru (in MMboe)
Source: Peruvian Ministry of Energy and Mines
Our Other Markets: Chile and Colombia
Chile
Overview of the Chilean Economy
Our activities in Chile span across the E&C and power services sectors. The following table sets forth the main economic indicators of the
Chilean economy for the period from 2014 to 2018.
Values in nominal US$ billion unless otherwise stated 2014 2015 2016 2017 2018
Nominal GDP 261.1 244.0 250.1 276.9 298.8
Nominal GDP / capita (US$) 14,655.5 13,548.4 13,743.8 15,057.6 15,934.7
Real GDP growth rate (%) 1.9 % 2.2 % 1.3 % 1.5 % 4.0%
Inflation (%, measured by change in CPI) 4.6 % 4.4 % 2.7 % 2.3 % 2.6%
Total private and public fixed investment 58.4 53.6 57.8 61.8 58.7
Average exchange rate (CLP/US$) 570.0 654.2 676.8 649.3 640.29
End of period exchange rate (CLP/US$) 607.4 707.3 667.3 615.2 694.0
Population (million)(1) 17.8 18.0 18.2 18.4 18.8
124

Values in nominal US$ billion unless otherwise stated 2014 2015 2016 2017 2018
Unemployment rate 6.4% 6.2% 6.5% 7.0% 6.7%
Public Debt / nominal GDP (%) 14.0% 16.0% 21.3% 24.9% 25.6
Net reserves / nominal GDP (%) 15.5% 15.8% 16.2% 14.1% 14.5%
Fiscal surplus (deficit) / nominal GDP (%) (1.5%) (2.1%) (2.7%) (2.8%) (3.1%)
Source: Chilean Central Bank, Chilean Government Budget Office, IMF, Global Insight
(1) 2018 projected by the IMF
The Chilean real GDP grew at an average annual rate of 2.2% during the five years from 2014 to 2018 in real terms. The country’s nominal
GDP per capita has increased 24.2% from CLP 8.9 million in 2014 to CLP 11.1 million in 2018. This expansion was mainly driven by a strong domestic
demand in real terms: total consumption grew on average at 3.2% per year during the five years from 2014 to 2018. Inflation has remained stable since
2014, averaging 3.3% between 2014 and 2018, in line with the Chilean Central Bank’s inflation target of 3% +/- 1%. Chilean sovereign debt has the
highest rating in the South America region, rated A+ by S&P (July 2017), A1 by Moody’s (July 2018) and A by Fitch (February 2019).
Colombia
Overview of the Colombian Economy
Our current activities in Colombia involve technical services provided primarily to the power services sector. The following table sets forth
the main economic indicators of the Colombian economy for the period from 2014 to 2018.
Values in nominal US$ billion unless otherwise stated 2014 2015 2016 2017 2018
Nominal GDP 377.9 288.4 280.4 309.2 266.4
Nominal GDP / capita (US$) 7,928.1 5,983.0 5,751.6 6,272.4 5,349.1
Real GDP growth rate (%) 4.6 % 3.1 % 2.0 % 1.8 % 2.7%
Inflation (%, measured by change in CPI) 3.7 % 6.8 % 5.8 % 4.1 % 3.1%
Total private and public fixed investment 76.5 60.7 66.7 66.7 64.6
Average exchange rate (COP/US$) 2,001.1 2,771.5 3,051.0 2,951.3 2,956.6
End of period exchange rate (COP/US$) 2,392.5 3,149.5 3,000.7 2,984.0 3,208.6
Population (million)(1) 47.7 48.2 48.7 49.3 49.8
Unemployment rate(1) 8.7 % 8.6 % 8.7 % 8.6 % 9.7%
Public Debt / nominal GDP (%) 37.7 % 41.4 % 42.8 % 45.3 % 50.4%
Net reserves / nominal GDP (%) 12.5 % 16.2 % 16.6 % 15.4 % 14.2%
Fiscal surplus (deficit) / nominal GDP (%) (2.6%) (3.1%) (3.9%) (3.3%) (3.1%)
Source: Colombian National Department of Administration of Statistics (DANE), Colombian Central Bank, Colombian Treasury Department, IMF,
Global Insight
(1) 2018 projected by the IMF
Colombian real GDP grew at an average annual rate of 2.8% during the five years from 2014 to 2018. The country’s nominal GDP per
capita has decreased 9.5% from COP 19.0 mm in 2014 to COP 17.2 mm in 2018. Inflation has increased in recent years, averaging 4.7% per year from
2014 to 2018, higher than the Colombian Central Bank’s inflation target of 3% +/- 1%. On the other hand, the Colombian peso depreciated from an
average of COP 2,001.1 per US$1.00 in 2014 to an average of COP 2,956.6 per US$1.00 in 2018. Colombia’s sovereign debt currently holds BBB
rating from Fitch (November 2018) BBB- from S&P (December 2017), and Baa2 from Moody’s (February 2018). Colombia is also recognized for its
investor-friendly legal regime.
E. Off-Balance Sheet Arrangements
As of December 31, 2018, we did not have off-balance sheet arrangements that have or are reasonably likely to have a current or future
effect on our company’s financial condition, changes in financial condition, revenues or expenses, results of operations, liquidity, capital expenditures or
capital resources that is material to investors.
For information about performance guarantees and similar instruments that we obtained in the ordinary course of business, see note 32 to
our audited annual consolidated financial statements included in this annual report.
F. Tabular Disclosure of Contractual Obligations
125
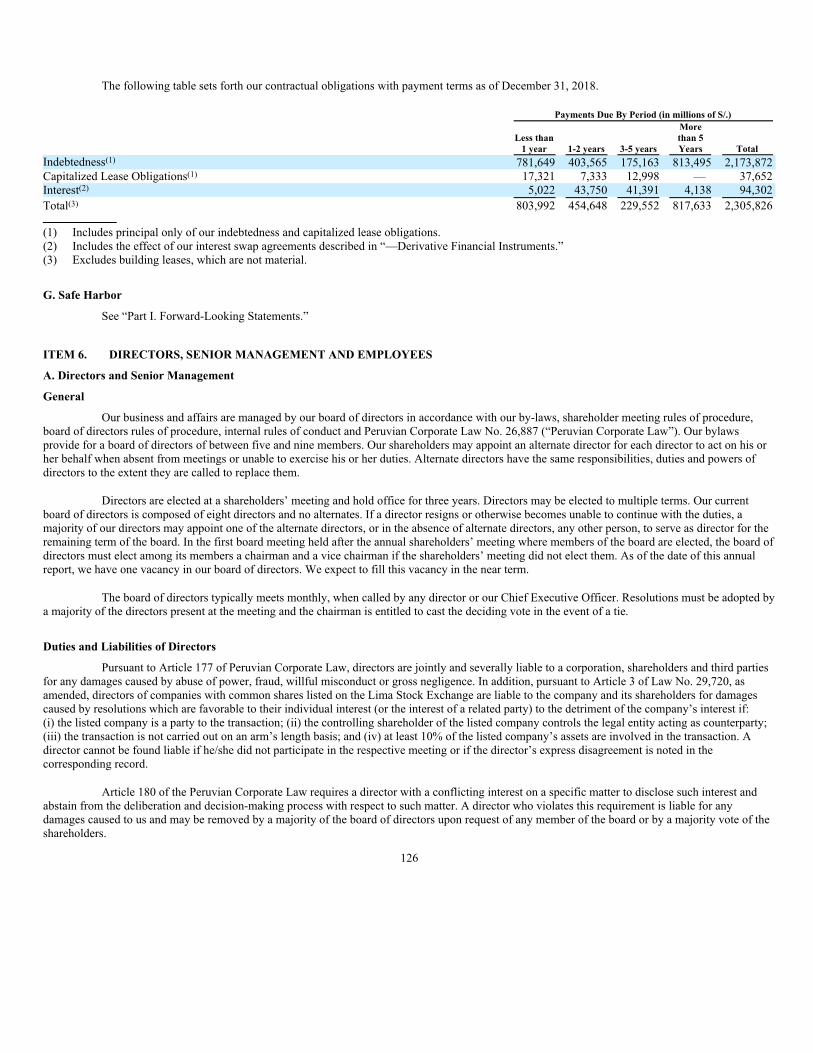
The following table sets forth our contractual obligations with payment terms as of December 31, 2018.
Payments Due By Period (in millions of S/.)
Less than
1 year 1-2 years 3-5 years
More
than 5
Years Total
Indebtedness(1)781,649 403,565 175,163 813,495 2,173,872
Capitalized Lease Obligations(1) 17,321 7,333 12,998 — 37,652
Interest(2) 5,022 43,750 41,391 4,138 94,302
Total(3) 803,992 454,648 229,552 817,633 2,305,826
(1) Includes principal only of our indebtedness and capitalized lease obligations.
(2) Includes the effect of our interest swap agreements described in “—Derivative Financial Instruments.”
(3) Excludes building leases, which are not material.
G. Safe Harbor
See “Part I. Forward-Looking Statements.”
ITEM 6. DIRECTORS, SENIOR MANAGEMENT AND EMPLOYEES
A. Directors and Senior Management
General
Our business and affairs are managed by our board of directors in accordance with our by-laws, shareholder meeting rules of procedure,
board of directors rules of procedure, internal rules of conduct and Peruvian Corporate Law No. 26,887 (“Peruvian Corporate Law”). Our bylaws
provide for a board of directors of between five and nine members. Our shareholders may appoint an alternate director for each director to act on his or
her behalf when absent from meetings or unable to exercise his or her duties. Alternate directors have the same responsibilities, duties and powers of
directors to the extent they are called to replace them.
Directors are elected at a shareholders’ meeting and hold office for three years. Directors may be elected to multiple terms. Our current
board of directors is composed of eight directors and no alternates. If a director resigns or otherwise becomes unable to continue with the duties, a
majority of our directors may appoint one of the alternate directors, or in the absence of alternate directors, any other person, to serve as director for the
remaining term of the board. In the first board meeting held after the annual shareholders’ meeting where members of the board are elected, the board of
directors must elect among its members a chairman and a vice chairman if the shareholders’ meeting did not elect them. As of the date of this annual
report, we have one vacancy in our board of directors. We expect to fill this vacancy in the near term.
The board of directors typically meets monthly, when called by any director or our Chief Executive Officer. Resolutions must be adopted by
a majority of the directors present at the meeting and the chairman is entitled to cast the deciding vote in the event of a tie.
Duties and Liabilities of Directors
Pursuant to Article 177 of Peruvian Corporate Law, directors are jointly and severally liable to a corporation, shareholders and third parties
for any damages caused by abuse of power, fraud, willful misconduct or gross negligence. In addition, pursuant to Article 3 of Law No. 29,720, as
amended, directors of companies with common shares listed on the Lima Stock Exchange are liable to the company and its shareholders for damages
caused by resolutions which are favorable to their individual interest (or the interest of a related party) to the detriment of the company’s interest if:
(i) the listed company is a party to the transaction; (ii) the controlling shareholder of the listed company controls the legal entity acting as counterparty;
(iii) the transaction is not carried out on an arm’s length basis; and (iv) at least 10% of the listed company’s assets are involved in the transaction. A
director cannot be found liable if he/she did not participate in the respective meeting or if the director’s express disagreement is noted in the
corresponding record.
Article 180 of the Peruvian Corporate Law requires a director with a conflicting interest on a specific matter to disclose such interest and
abstain from the deliberation and decision-making process with respect to such matter. A director who violates this requirement is liable for any
damages caused to us and may be removed by a majority of the board of directors upon request of any member of the board or by a majority vote of the
shareholders.
126

Pursuant to Article 181 of Peruvian Corporate Law, shareholders are entitled to protect the interest of a company through derivative law
suits against directors in order to remedy or prevent a wrong to the corporation. In addition, pursuant to Article 4 of Law No. 29,720, with respect to
companies listed on the Lima Stock Exchange, a shareholder holding shares which represent at least 10% of the paid capital may bring said action
against the directors.
Board of Directors
The following sets forth our directors and their respective positions as of the date of this annual report. The term of the current board of
directors expires in March 2020, on the third anniversary from the date of election.
Name Position
Year of
Birth
Year of First
Appointment
Augusto Baertl Montori Chairman of the Board 1945 2017
Rafael Venegas Vidaurre Vice Chairman of the Board (Independent)* 1950 2017
Carlos Montero Graña Director 1942 1996
Pedro Pablo Errazuriz Domínguez Director (Independent)* 1961 2014
Roberto Abusada Salah Director 1946 2017
Alfonso de Orbegoso Baraybar Director (Independent)* 1962 2017
Manuel del Río Jiménez Director (Independent)* 1952 2017
Ernesto Balarezo Valdez Director (Independent)* 1967 2018
* Independent member under the Exchange Act independence standards.
The following sets forth selected biographical information for each of the members of our board of directors. The business address of each
of our current directors is Av. Paseo de la República 4667, Surquillo, Lima 34, Peru.
Augusto Baertl Montori. Mr. Baertl is a mine engineer from the Universidad Nacional de Ingeniería with postgraduate programs at Harvard
Business School and at Northwestern University. He has assumed important senior management positions in Peruvian and international mining and oil
companies. For 30 years, Mr. Baertl held various positions in the mining company Milpo, ranging from mine superintendent, assistant manager and
COO, to CEO. From 1997 to 2003, he served as president and CEO of Compañía Minera Antamina. Since 1997 he has been CEO of Agrícola Chapi
S.A., and since 2003, he has been the executive president of Gestora de Negocios e Inversiones.
Mr. Baertl is the former chairman of the board of directors of the National Society of Mining, Oil and Energy at the Institute of Mining
Engineers of Peru, as well as of the Latin American Business Council (CEAL) and of the Chamber of Commerce Canada- Peru. He has also been
chairman of the board of Atlas Copco Peru, Downing Teal-Peru, and Petroperu. In addition, he has been member of the board of directors of different
companies such as Milpo, Atacocha, Huarón, Chungar, Castrovirreyna Mining Corporation, Interbank, BISA, Graña y Montero S.A.A., Norsemont and
of the Prospectors and Developers Association of Canada (PDAC). He is currently chairman of the board of Agrícola Chapi, as well as a member of the
board of Alturas Minerals, Chinalco International, FIMA, Stevia One and Ligabue Catering Perú S.A.C. He is also an active member of the board of
directors of the National Society of Mining, Petroleum and Energy and COMEX. He has also participated in the board of directors of various non-profit
institutions.
Rafael Venegas Vidaurre. Mr. Venegas is an industrial and systems engineer from Universidad Nacional de Ingeniería and holds post-
graduate specializations in administrative and finance processes at A. Andersen School in Chicago, and has completed the Management and CEO
programs at the Graduate School Kellogg, as well as the strategic planning, human management and marketing program at Harvard University. He has
been CEO of Banco Internacional de Colombia, Citibank Peru, BankBoston Peru, Banco Sudamericano, Hermes/Brinks and, from 2010 to 2016, of
Rimac Seguros y Reaseguros.
In addition, Mr. Venegas has served as director of several institutions and companies such as Diners Peru, Profuturo AFP, Banco
Financiero, Scotiabank Perú, Compass Group Peru and as chairman of the board of directors in Citileasing, Citicorp S.A.B., Clínica Internacional and
Rímac EPS.
Carlos Montero Graña. Mr. Montero is a civil engineer from Universidad Nacional de Ingeniería, and completed postgraduate studies in the
senior management program at the University of Piura. He has been director of Graña y Montero S.A.A. since August 1996 to date. Mr. Montero is also
chairman of the board of our subsidiary Concar S.A. and director of our subsidiary GMP S.A. He previously served as managing director of our
subsidiary GyM until 2007, and was director of IPAE, GMD, GMI and UNICON.
Pedro Pablo Errázuriz Domínguez. Mr. Errázuriz is a civil engineer from Universidad Católica de Chile, with a master’s degree in
engineering sciences from the same university and a master’s degree in operational research (Finance) from the London School of Economics. He is
currently a partner of Veta Tres and director of companies. Until March 2014, he served as Minister of Transport and
127

Telecommunications in the Chilean administration of president Sebastián Piñera, a position he assumed in 2011. He has been a director of several
companies representing the Ontario Teachers’ Pension Plan Holding and CEO of its investments’ subsidiary in Chile, AndesCan, between 2009 and
2011. At the same time, he served as chairman of the board of Biodiversa, Esval, Aguas del Valle and SAESA Group. He was CEO and president of the
board of the health services company ESSBIO. He was also CEO of Lan Express between 2000 and 2006 and Vice President of corporate planning for
Lan Chile between 1999 and 2000. Mr. Errázurriz has been a member of the Graña y Montero board from 2014 to date.
Roberto Abusada Salah. Mr. Abusada studied Economics at Universidad Católica del Perú and at Cornell and Harvard Universities in the
USA. He holds a Bachelor’s degree in economics from Universidad Católica as well as a master’s and PhD in economics from Cornell University. He
has been senior advisor to the Minister of Economy during the years of the Peruvian economic reform (1993 and 1997). In 1994 he co-founded the
Peruvian Institute of Economics (IPE), which he presides over. Dr. Abusada has taught economics at Universidad Católica del Perú, Universidad del
Pacífico, UPC, ESAN and Boston University. He was director of the program of graduates in economics of the Universidad Católica and in the 1980s he
held the positions of vice minister of commerce, vice minister of economy and member of the board of directors of the Central Reserve Bank. He has
been director of the Corporación Andina de Fomento, as well as of Graña y Montero S.A.A. and TECSUP. He has been a member of the Global
Strategic Advisory Group (GSAG) of the Konrad Adenauer Foundation. He has been a consultant to the United Nations (UNIDO, Vienna) World Bank,
Inter-American Development Bank and various governments. He is currently an Ad Honorem advisor of the Peruvian government for matters of the
Pacific Alliance and representative of the presidency of the council of ministers to the board of the fiscal stabilization fund and chairman of the board of
GMD, director in GMP S.A. and UNACEM S.A.A.
Dr. Abusada has written several books and academic articles in various economic areas and is currently writing a fortnightly opinion
column at El Comercio newspaper in Lima, Peru.
Alfonso de Orbegoso Baraybar. Mr. de Orbegoso is a lawyer from Pontificia Universidad Católica del Perú. He holds a master’s degree
from Duke University School of Law and has completed specialization courses at the London School of Economics, Georgetown University and The
McDonough School of Business. During 1991 and 1998 was partner of the Ludowieg, Andrade & Associates law firm and during 1998 to 2013 he
served as legal vice president and regulatory affairs at Nextel del Perú S.A. During 2014 and 2015 he served as vice president legal, regulatory and
interconnection at Nextel Telecomunicações Ltda, Brazil.
Manuel del Río Jiménez. Mr. Del Río is a mechanical engineer from Pontificia Universidad Católica del Perú and holds a master’s degree in
industrial management from the Krannert Graduate School of Management — Purdue University — Indiana, USA. From July 2013 to September 2016,
he was partner in tax & legal at KPMG in Peru and responsible for transactions, transfer pricing, corporate finance and business development.
During 2010 and 2013, he was the lead partner in the practice of advisory at KPMG in Peru. Previously, and since joining KPMG in 2004
until 2010, he was the managing partner of the transfer pricing division of KPMG Tax & Legal in Peru. He has more than nine years as leader of the
financial control area and CFO of Citibank Perú. He was vice president of Profuturo AFP as well as member of the executive committee and director for
ten years. In addition to this, he has been in charge of the professional and medical equipment business unit at Philips for eight years. Moreover, for ten
years he has held various positions in the industrial and internal consulting sectors of Philips Peruana. He has taught several courses and lectures at the
Pontificia Universidad Católica del Perú, as well as in private companies.
Ernesto Balarezo Valdez. Mr. Balarezo has a Master´s Degree in Industrial Management and a Bachelor´s Degree in Industrial Engineering,
both degrees obtained at the University of Texas A&M in United States. He holds post-graduate specializations in Management, Finance, Human
Resources, at Institutions such as Institute of Directors (IoD), Harvard, Wharton, INSEAD, IESE, among others. He is currently working as a partner
and director of Comunal Coworking. In the previous three years, he held the positions of Executive Vice President for the Americas at Gold Fields
Limited, and CEO of Gold Fields La Cima S.A. He previously worked for sixteen years for the Hochschild Group. His last position was as Vice
President of Operations at Hochschild Mining. He was also Chief Executive Officer of Hochschild Mining in Mexico and then in Peru, as well as
Deputy Chief Executive Officer and Chief Financial Officer in Cementos Pacasmayo. He has also been Director of several companies related to the
Hochschild Group and Gold Fields Ltd and Director—Founder of the Peruvian—South African Chamber. He has also contributed as Director of Peru
2021 and in IPAE Acción Empresarial.
Executive Officers
Our executive officers oversee our business and are responsible for the execution of the decisions of the board of directors. Our executive officers
are appointed for an indefinite period of time and their term of office may be terminated by our board of directors at its discretion. The following table
presents information concerning the current executive officers of our company and their respective positions:
128

Name Position
Year of
Birth
Year of
Appointment
Year of First
Employment
at the
Company
Luis Díaz Olivero Chief Executive Officer 1970 2017 1993
Mónica Miloslavich Hart Chief Financial Officer 1966 2009 1993
Daniel Urbina Pérez Chief Legal Officer 1969 2018 2018
Marlene Negreiros Bardales Chief Human Resources Officer 1972 2019 2019
Antonio Cueto Saco Chief Operating Officer 1966 2017 1996
Rolando Ponce Vergara Chief Executive Officer of Viva GyM 1963 2008 1993
Renato Rojas Balta Chief Executive Officer of GyM 1972 2014 1995
Luis Fukunaga Mendoza Chief Executive Officer of GMI 1970 2018 2002
Reynaldo Llosa Martinto Chief Executive Officer of GMP 1960 2014 2014
Jorge Luis Izquierdo Ramirez Chief Executive Officer of CONCAR 1973 2019 1999
Manuel Wu Rocha Chief Executive Concessions Officer 1977 2018 2001
Mario Gálvez Abad Chief Executive Officer of GyM Ferrovías 1972 2018 2017
Antonio Rodríguez Canales Chief Executive Officer of Morelco 1963 2018 1999
Alejandro Palma Jara Chief Executive Officer of Vial y Vives-DSD 1959 2018 2018
Carlos Gómez Pinto Chief Audit Executive 1961 2018 2018
Javier Vaca Terron Regional Manager of Engineering and Construction 1970 2018 2008
Fernando Dyer Estrella Chief Risk and Compliance Officer 1962 2017 2017
Manuel Fernández Pollan Chief Executive Officer of Qualys/Chief of
Information Technology 1958 2019 2016
Julia Sobrevilla Perea Corporate Affairs Offer 1969 2018 2018
The following sets forth selected biographical information for each of our executive officers:
Luis Francisco Díaz Olivero. Mr. Díaz joined the group in 1993, and has been our chief executive officer since March 2, 2017 and was our
deputy chief executive officer from February to March 2, 2017. Before that, he served as chief operating officer since 2015, as infrastructure officer
between April 2013 and December 2014, and as the chief executive officer of our subsidiary GMP between 2011 and April 2013. He holds a degree in
industrial engineering, and an MBA from University of Pittsburgh. He also served as the deputy chief executive officer of GMP from 2009 to 2011;
chief financial officer of Graña y Montero from 2004 to 2009; and chief financial officer of our subsidiary GyM from 2001 to 2004. He is a member of
the boards of directors of GyM, GMP and Viva GyM.
Mónica Miloslavich Hart. Mrs. Miloslavich joined the group in 1993 and has served as our chief financial officer since 2009. She holds a
degree in economics from Universidad de Lima. She worked as chief financial officer of Graña y Montero Edificaciones S.A.C. from 1998 to 2004, and
as chief financial officer of our subsidiary GyM from 2004 to 2009.
Daniel Urbina Pérez. Mr. Urbina joined the group in 2018 as Chief Legal Officer. Before that, he served as general counsel for Inkia
Energy since 2008, as vice president for Standard Chartered Bank between July 2005 and October 2008, as head of legal and compliance for Banco
Standard Chartered between March 2000 and July 2005, as director general of the legal department for the Ministry of the Presidency between June
1999 and March 2000, as advisor to the Minister for the Advancement of Women between July 1997 and July 1998 and as associate for Benites
Mercado & Ugaz between July 1993 and July 1998. He holds a law degree and an LLM from Columbia University and is authorized to practice law in
Peru and New York.
Marlene Negreiros Bardales joined the group in February 2019 as Corporate Human Resources Officer. Before that, she served as
Corporate Human Resources Officer in Gloria Group, and prior to that, she served as a Global Human Resources Director in AJE Group. She holds a
degree in business administration from Universidad Peruana de Ciencias Aplicadas, a Human Resources Business Partner certification from Human
Resources Certification Institute (HRCI), and a postgraduate certification in Human Resources from INCAE Executive Education and the MCDonough
School of Business from Georgetown University.
Antonio Cueto Saco. Mr. Cueto joined the group in 1996 and has been our chief operating officer since 2017. Previously, he was our
infrastructure area officer since January 2015. He formerly served as country manager in Chile and held different management positions in the group.
He holds a degree in economics from Universidad Católica del Perú and has a Masters degree in business administration from Universidad del Pacífico.
He also has master’s in management and finance from HEC (France). He is a director of our subsidiaries GMP, GyM Ferrovías, Norvial, La Chira,
Concesionaria Vía Expresa Sur, Survial and GMI.
129

Rolando Ponce Vergara. Mr. Ponce joined the group in 1993 and has served as the chief executive officer of our subsidiary Viva GyM since
2008, and as our chief real estate area officer since 2014. He holds a degree in civil engineering from Universidad Ricardo Palma. He also holds a
master’s degree in construction and real estate business management from Pontificia Universidad Católica de Chile-Politécnica de Madrid, Spain. He
previously served as manager of GyM’s real estate division. He is currently a member of the boards of directors of our subsidiaries Viva GyM and
Almonte.
Renato Rojas Balta. Mr. Rojas joined the group in 1995, and he has served as the chief executive officer of GyM since February 2014. Prior
to that, he held the position of manager of GyM’s civil works division from 2010 to 2014, and of assistant manager of that same division from 2002 to
2010. He holds a degree in civil engineering from Pontificia Universidad Católica del Perú. In addition, he pursued a master’s in company management
at Universidad de Piura. He is currently the chief executive officer of our subsidiary GyM.
Luis Fukunaga Mendoza. Mr. Fukunaga joined the group in 2002 and has been our roads concessions manager in the infrastructure area
since October 2012. He also served as director of our subsidiaries Survial, Norvial, Concesionaria Vía Expresa Sur and Concar. In addition, he has held
several management positions, including chief executive officer of Survial S.A and Concesión Canchaque S.A.C. He is a civil engineer with a degree
from Universidad de Piura. He also completed an MBA at ESAN with studies at Kenan Flagler Business School–University of North Carolina at Chapel
Hill, and completed a financial management Program at Universidad de Piura. He is currently a director of our subsidiary GMI.
Reynaldo Llosa Martinto. Mr. Llosa joined the group in 2014, and has served as the chief executive officer of GMP since February 2014.
He holds a degree in mechanical engineering from University of Houston, as well as an MBA from Universidad de Piura. He has completed several
technical and executive programs, including certificate programs at Rice University and Northeastern Kellogg School of Management. He served as the
chief executive officer of BPZ Energy from 2010 to 2013. Prior to that, he had worked in Schlumberger for 25 years, the last 15 of which he spent in
management positions.
Jorge Luis Izquierdo Ramirez. Mr. Izquierdo joined the group in 1999 and was appointed chief human resources management officer in
December 2015. Prior to that, he was our chief operational excellence officer between 2011 and 2015. In addition, from 2011 to 2013, he worked as
chief officer of the Learning Center (currently known as Academia), and had previously served as project management officer. He holds a degree in
civil engineering from Pontificia Universidad Católica del Perú, and a master’s degree in construction management from University of California,
Berkeley. He is currently a director of our subsidiary Concar.
Manuel Wu Rocha. Mr. Wu is a civil engineer from the Pontificate Catholic University of Peru and holds a master’s degree in business
administration from the University of Piura, Peru. He joined the group in 2001, and acted as chief technical officer for the oil and gas, electricity,
infrastructure and sanitation areas of GyM S.A. from 2003 until 2007. He became manager of purchases and logistics of GyM S.A. in 2007, and general
manager of the consortium Lima Actividades Comerciales comprised by GyM S.A. and Aguas de Barcelona from 2009 until 2011. Since 2011, he has
worked as chief executive officer of GyM Ferrovias S.A. Mr. Wu is currently Chief Executive Concessions Officer.
Mario Gálvez Abad. Mr. Gálvez joined the group in January 2017, assuming the Deputy General Manager of our subsidiary GyM Ferrovías.
He holds a bachelor’s degree in economics with complementary studies in negotiation, project evaluation and credit risk. He has more than 15 years of
experience in commercial and consumer banking. He served as general manager at Aeropuertos del Perú and also held the position of Administration
and Finance Manager at the same company. He is currently a director of our subsidiary GyM Ferrovías.
Antonio Rodriguez Canales. Mr. Rodríguez joined the group in 1999, and has been our chief commercial officer from 2015 to 2017. He
previously served as chief investment officer, from 2010 to 2014. Before that, he was the chief executive officer of Larcomar from 1999 to 2010. He
also served as director of our subsidiaries CAM and GMD and is currently a director of our subsidiary Morelco. He holds a degree in accounting from
Universidad de Lima, a master’s in business administration from ESAN, and a master’s in business administration from Birmingham Business School in
the UK.
Alejandro Palma Jara. Mr. Palma joined Vial y Vives – DSD in June 2018 as Mining Commercial Manager, and was appointed as Interim
General Manager in January 2019. He is a Construction Engineer (Chile) and holds a Masters in Civil Engineering in Geotechnical Engineering and
Infrastructure from the University of Hannover (Germany), and has been recognized as well as a Diplom-Bau Ingenieur in Germany. He has over 34
years of national and international professional experience in construction, mining consulting and engineering. He is also a Qualified Person at the
Registro Público de Personas Competentes en Recursos y Reservas Mineras of Chile. He was general manager at SRK Consulting Chile for 15 years,
Board Director in Chile for 13 years, Board Director of SRK Consulting (Global) for 10 years, Board Director and Vice President of SRK Consulting
(Argentina) for 7 years and Board Director of SRK Consulting (North America (USA-Canada-Mexico)) for 3 years. He was also, from July 2016 until
February 2018, Vice President Mining Consulting for South America and Vice President for Ausenco Chile & Argentina. He was a key player
introducing successfully in Chile the first double shield Tunneling Boring Machine TBM for the 7.9 Km long Tunnel Sur Los Bronces from Anglo
American and worked as project director until the excavation was completed. He led directly the Prefeasibility Study for the 95 ktpd iron ore project
Dominga (US$2.4 Billion), with more than 130,000 manhours with a scope from mine to port (including R&R estimation), and also led most of the
large projects carried out at SRK for 15 years.
130

Sergio Morales Contreras. Mr. Morales joined the group in 2016, and has served as the chief executive officer of Adexus S.A since April
2017. He holds a degree in civil industrial engineer from Santiago of Chile University. He has completed several technical and executive programs. He
served as commercial manager of Adexus from June 2016 to April 2017. Prior to that, he worked at American Movil Group for nine years and also at
Unisys Company for 11 years. He is currently a director of Adexus.
Javier Vaca Terron. Mr. Vaca graduated as a Civil Engineer, Channels and Ports from the Polytechnic University of Madrid in 1996. He
joined the Spanish company, Ferrovial Agroman, participating in the study of international works and directing the execution of projects in Madrid. In
2004, he completed an Executive MBA master’s degree at IESE and joined Grupo Assignia as Director of International Production at the construction
company, developing his work mainly in Latin America. In 2007, he was assigned new responsibilities within the Assignia group, as CEO of another
group company, Eductrade, dedicated to foreign trade in the field of Health and Education. In 2014, he returned to the construction industry, this time
directing the Business Development and Studies, Hiring and Institutional Relations Areas of the Spanish FCC. In 2016, he joined the OHL company as
Southern Cone Zone Director, based in Santiago, Chile. In February 2018, he joined Graña y Montero as Regional Manager of the Engineering and
Construction Area.
Carlos Gómez Pinto. Mr. Gómez has worked for Seagrams, Coca-Cola, Merril Lynch and Pacific Exploration & Production, in various
leadership positions including as a CFO, Vice President of Internal Audit, Corporate Governance, Risks, Compliance, and Corporate Finance Manager.
His experience includes responsibilities for implementing re-engineering processes, identifying non-value added activities and helping departments
change their structure and improve work process efficiency. Currently, Mr. Gomez is a senior executive of Graña y Montero as Corporate Internal
Auditor. Mr. Gomez is a Licensed International Financial Advisor and board member of certain companies and non-profit organizations. Mr. Gomez
earned a bachelor’s degree in Economics at Rosario University, a top private university in Colombia. He also obtained a MBA from Southern New
Hampshire University in the USA.
Fernando Dyer Estrella. Mr. Dyer is the Chief Risk and Compliance Officer of Graña y Montero, and is responsible for our company’s
Corporate Risk and Compliance Program. Fernando has more than 30 years of international experience in audit, finance, internal controls, governance,
ethics, compliance and management at leading multinationals. His experience includes the design, implementation, management and leading
international programs on risk assessment, code of conduct, whistle blower, due diligence, anti-corruption, anti-money-laundering and international
sanctions aimed to deter, detect and protect companies from crimes (focused on FCPA and UK Bribery Act). Mr. Dyer holds an MBA form Université
de Genève (Switzerland), specialized in International Management, and a BA in Accounting from the Universidad del Pacífico (Perú). He is a Certified
Anti-Money Laundering Specialist (CAMS) by the Association of Certified Anti-Money Laundering Specialists (USA), a Certified Corporate
Compliance & Ethics Professional (CCEP) by the Society of Corporate Compliance and Ethics (USA), and an International Faculty of the International
Training Compliance and International Compliance Association – ICT/ICA – (United Kingdom). Mr. Dyer speaks English, French and Spanish fluently.
Manueal Fernández Pollan. Mr. Fernández joined the Group in December 2015 as chief executive officer of Adexus in Chile. He also
served as director the Corporate Management of Services of GyM, is the President of Adexus and a director of CAM. Mr. Fernández holds a Bachelor’s
degree in Industrial Engineering from the Polytechnic University of Madrid, an MBA from CEPADE in Madrid and a Master’s in Strategic Planning
and Finance from IDE in Madrid. He has worked for 10 years at Emerson Network Power, the last three years as Vice President of Sales and Regional
Operations of Latin America. Before that he was chief executive officer for the Andean Countries (Colombia, Ecuador, Venezuela and Peru). Previously
he worked in the Telefónica group, occupying different positions in Spain and Latin America, the last two years in Peru as chief executive officer of
Telefónica Servicios Compartidos and Vice President of Resources of Telefónica del Perú. Mr. Fernandez is currently a director of our subsidiary
QUALYS and Chief Information Technology.
Julia Sobrevilla Perea. Ms. Sobrevilla joined Graña y Montero in April 2018 as Corporate Affairs Officer. She joins Graña y Montero most
recently from Coca-Cola Perú, where she was Public Affairs Director from 2012 to 2018. Before joining Coca-Cola Ms. Sobrevilla was Institutional
Relations Manager at Grupo ACP, a Peruvian group dedicated to microfinance in Latin America. Prior to that, from 2002 to 2010 she was Country
Representative for Population Services International, a Washington, DC-based not for profit, serving in Rwanda, Mexico and Mozambique. Previously
she held several positions in MTV Networks and Nickelodeon Latin America from 1994 to 2001, based in Miami, Florida. She holds a Bachelors in
Linguistics and Literature from the Pontificia Universidad Católica del Perú and completed Masters Courses in Communication at Stanford University.
She sits on the board of SERNANP (Servicio Nacional de Areas Naturales Protegidas), Kunan and Premio Protagonistas del Cambio UPC.
131

Executive Commission
The Executive Commission is currently comprised by our Chief Executive Officer, Chief Operating Officer, the Business Segment
Executive Officer for each of the three segments, our Chief Financial Officer, our Chief Legal Officer, Public Affairs Officer, our Chief Human
Resources Officer, our Chief Audit Executive, our Chief Risk and Compliance Officer and Corporate Information Technology Officer. The Executive
Commission evaluates, at the management level, among other matters, our strategic plan, annual budget and annual investment plan.
Business Segments Executive Commission
The Business Segments Executive Commissions are comprised by the Business Segment Executive Officer and the CEOs of the companies
in each of the relevant business segments. Each Business Segment Executive Commission evaluates the applicable business segment’s annual budget,
finances and operations as well as a summary of the information discussed in the Executive Commission.
Kinship
None.
B. Compensation
Compensation of Directors and Executive Officers
Director compensation must be approved by a majority of shareholders at our annual shareholders’ meeting.
In 2018, total compensation paid to our board of directors amounted to S/.2.6 million including compensation paid to directors that serve on
our subsidiaries’ board of directors. In 2018, total compensation paid to our executive officers amounted to S/.23.8 million. See “Item 4.B Information
on the Company—Business Overview—Regulatory Matters—Labor Regulations” for additional information on profit sharing regulatory requirements.
Neither we nor any of our subsidiaries have entered into any agreement that provides for any benefit or compensation to any director or
senior executive upon expiration of his or her term or termination of employment. Under Peruvian law, unless we dismiss someone for justified cause,
we are required to pay the dismissed employee (but not directors) 1.5x annual salary for every year with our company for a period not to exceed 12
years. We are not required to make such payments in the event of voluntary termination. Although we have no ongoing obligation to do so, in the past
we have provided, and in the future we may provide, such benefits to our executive officers upon their retirement. We have not set aside or reserved any
amounts to provide for pension, retirement or other similar benefits.
Executive Compensation Plan
We establish and pay executive compensation in compliance with applicable labor and tax regulations and corporate governance standards
and in accordance with market conditions.
We establish pay scales taking into consideration executives’ responsibilities, including the degree of complexity of those responsibilities,
power of decision-making and scope of supervision entrusted.
The fixed salary component of compensation is established for each position based on a pay scale. Fixed salary includes family allowance
and cost of living payments, if applicable. We evaluate executives at least once a year to develop action plans in furtherance of continuously improving
management performance.
The variable component of compensation is paid to executives and other employees for meeting specific goals, and is related both to his or
her performance and our financial results. Variable compensation is typically paid as an annual incentive.
In addition, labor regulation establishes a mandatory profit sharing provision of 5% of our total annual taxable income, to be distributed
among all employees, calculated based on a formula established by law that considers the days worked in the year and remuneration.
Our executives also receive additional benefits, typically non-pecuniary. The benefits granted include: (i) a vehicle owned and maintained
by our company, with the purpose of facilitating transportation of executives in the performance of their functions; (ii) a fuel allowance to offset
transportation costs in the performance of their functions; and (iii) an insurance policy, including work accident and high risk coverage.
132

In addition, we have established a plan for certain executives effective March 2013 that awards cash bonuses for the exclusive use of
purchasing shares of our company or of our subsidiaries. The executive must agree to hold the shares for a specific period. If the executive is no longer
employed with our company during such period, we are entitled to repurchase the shares at the original purchase price. This benefit is awarded at the
discretion and subject to the approval of the Human Resource Management Committee of our board of directors.
C. Board Practices
Board Committees
We have four board committees comprised of members of our board of directors.
Audit and Process Committee
Our Audit and Process Committee is comprised of three directors, all of which are independent under the Exchange Act. The current
members of our Audit and Process Committee are Mr. Pedro Pablo Errazuriz Domínguez, Mr. Manuel del Río (chairman of the committee) and
Mr. Alfonso de Orbegoso. These directors have extensive business and economic experience in Peru. Mr. Manuel del Río qualifies as an “audit
committee financial expert” in accordance with NYSE independence standards and applicable SEC rules. Our Audit and Process Committee oversees
our corporate accounting and financial reporting process. The Audit and Process Committee is responsible for:
• reviewing our financial statements;
• evaluating our internal controls and procedures, and identifying deficiencies;
• recommending to our annual shareholders’ meeting the appointment of our external auditors, determining their compensation,
retention and oversight, and resolving any disagreements that may arise between management and our external auditors;
• evaluating our company’s compliance with the Board of Director’s internal regulation, as well as with general principles of
corporate governance;
• informing our board of directors regarding any issues that arise with respect to the quality or integrity of our financial statements,
our compliance with legal or regulatory requirements, the performance and independence of the external auditors, or the
performance of the internal audit function;
• establishing procedures for the reception, retention and treatment of complaints regarding accounting, internal controls or other
auditing matters, including the confidential, anonymous submission by our employees of concerns regarding questionable
accounting or auditing matters;
• independently engaging its own counsel and any other advisers it deems necessary to fulfill its functions; and
• establishing policies and procedures to pre-approve audit and permissible non-audit services.
Our board of directors has adopted a written charter for our Audit and Process Committee, which is available on our website at
www.granaymontero.com.pe.
Human Resource Management Committee
Our Human Resource Management Committee is comprised of three directors, all of which are independent in accordance with NYSE
independence standards. The current members of the committee are Mr. Rafael Venegas (chairman of the committee), Mr. Pedro Pablo Errázuriz and
Mr. Ernesto Balarezo. The Human Resource Management Committee is responsible for:
• reporting to our board of directors on the appointment and dismissal of senior executives;
133

• reviewing and approving corporate goals and objectives relevant to CEO compensation, evaluating the CEO’s performance in light
of those goals and objectives, and determining and approving CEO compensation;
• establishing compensation arrangements for senior executives in accordance with the financial results of our company; proposing
measures to ensure transparency in the remuneration of directors and senior executives;
• evaluating our human resources policies;
• reporting to our board of directors on matters regarding related party transactions that could result in a conflict of interest;
establishing our social responsibility policies; and
• appointing third-party independent compensation consultants, and establishing the compensation of and overseeing the third-party
independent compensation consultants;
As a foreign private issuer, we are not required to maintain a compensation committee that complies with all of the U.S. laws and
regulations and NYSE requirements applicable to U.S. issuers.
Strategy and Investment Committee
Our Strategy and Investment Committee is comprised of four directors, with independent members under NYSE independence standard,
currently comprising the majority of the committee. The current members of the committee are Mr. Augusto Baertl, Mr. Rafael Venegas and
Mr. Ernesto Balarezo Valdez (chairman of the committee). Once appointed, the new member of our board of directors is expected to be appointed to this
committee.
The Strategy and Investment Committee is responsible for:
• establishing our investment policies;
• approving our annual investment plan; and
• analyzing the projects that would require an investment greater than US$5 million.
Risk, Compliance and Sustainability Committee
Our Risk, Compliance and Sustainability Committee is comprised of four directors, with independent members under NYSE independence
standard, currently comprising the majority of the committee. The current members of the committee are Mr. Alfonso de Orbegoso Baraybar (chairman
of the committee), Mr. Augusto Baertl and Mr. Manuel del Río. Once appointed, the new member of our board of directros is expected to be appointed
to this committee. The Risk, Compliance and Sustainability Committee is responsible for:
• approving the structure, and evaluating the performance of the organization, in matters of risks and compliance;
• approving the policies and limits of exposure to risk, monitoring the risk profile of our company, and supervising the development
of the risks and compliance area;
• ensuring compliance with our company’s policies, in particular with the anti-corruption policy and the sustainability policy, as well
as with applicable laws. This committee can also propose policies, directives and/or complementary procedures that contribute to
strengthening the responsible management of our company; and
• supervising and reporting to our board of directors on social responsibility practices and management.
Operating Board Committees
We also have two operating board committees that meet monthly and are comprised of members of our board of directors, including at least
one independent member under NYSE independence standards per committee.
134

Engineering and Construction Committee
Our Engineering and Construction Committee supervises the operations of our E&C segment. The current members of the committee are
Mr. Augusto Baertl and Mr. Alfonso de Orbegoso. Once appointed, the new member of our board of directors is expected to be appointed to this
committee.
Infrastructure Committee
Our Infrastructure Committee supervises the operations of our Infrastructure segment. The current members of the committee are
Mr. Rafael Venegas, Mr. Manuel del Río and Mr. Pedro Pablo Errazuriz.
D. Employees
We have developed an extensive and talented team, including more than 1,700 engineers, which gives us the capability and scale to
undertake large and complex projects. We also have access to a network of approximately 132,000 manual laborers throughout Peru that can supplement
our workforce when required by our projects. Moreover, we have the flexibility to engage our own workers on projects outside Peru, avoiding the need
to seek new employees in other countries.
As of December 31, 2018, we had a total of 11,891 full-time employees, including approximately 4,279 manual laborers, a number that
fluctuates depending on our project backlog. At such date, we also worked with 2,506 employees of subcontractors. Occasionally, we employ
subcontractors for particular aspects of our projects, such as carpenters, specialists in elevator installation and specialists in glassworks. We are not
dependent upon any particular subcontractor or group of subcontractors. As of December 31, 2018, 69% of our employees worked outside Peru. The
following table sets forth a breakdown of our employees by category as of December 31, 2018.
Salaried Employees E&C Infrastructure Real Estate Corporate TOTAL
Engineers 1,229 434 29 37 1,729
Other Professionals 480 260 33 130 903
Technical specialists 1,070 2,081 42 26 3,219
Manual Laborers(1) 4,279 — — — 4,279
Joint operation employees(2) 1,627 134 — — 1,761
Subtotal 8,685 2,909 104 193 11,891
Subcontracted employees 1,166 1,340 — — 2,506
Total 9,851 4,249 104 193 14,397
(1) The number of manual laborers, who form part of our network of approximately 132,000 manual laborers, varies in relation to the number and
size of projects we have in process at any particular time.
(2) Includes engineers, professionals, technical specialists and manual laborers employed by our joint operations.
135

The following chart sets forth the changes of our total employees from December 31, 2015 to December 31, 2018.
Our talent development system has allowed us to develop a team of professionals with the ability to design and implement sophisticated
projects. Our talent management process broadly focuses on attracting, developing and training employees.
We have implemented programs to attract young and qualified candidates. Our “Cantera” Program offers various types of internships and
training opportunities to engineering students and recent graduates, rewarding the most successful candidates with the opportunity to work as full-time,
permanent employees. Our focus is not only to attract talented people but also to retain them.
Through our Graña y Montero Academy, we offer continuing education opportunities through a wide selection of courses and training
programs targeted at each level. We believe the knowledge that our employees gain through these programs is reflected in the way they work and relate
to our clients, adding value in every step. During 2018, we invested more than US$0.36 million in continuing education, reaching approximately
341,802 training hours for our employees.
We place significant emphasis on instilling our core corporate values of quality, professionalism, reliability and efficiency on our
employees, and on promoting safety, environmental sustainability and social responsibility throughout the entire organization. Our Code of Conduct and
Charter of Ethics regulate the conduct of our employees while promoting the foregoing values. In addition, our employees participate in ethics seminars
on a periodic basis.
Substantially all of our manual laborers and some of our other employees are members of labor unions. Our practice is generally to extend
the benefits we offer our unionized employees to non-unionized employees. We consider our current relationship with unions to be positive.
In our E&C segment, collective bargaining agreements are negotiated at two levels: (i) on an annual basis between the National Federation
of Civil Construction and the Peruvian Chamber of Construction, without our direct involvement; and (ii) on a per project basis directly between the
unions and our project committees, in accordance with such annual agreement. In addition, some of our personnel in our gas processing plant belongs to
the labor union Unicode Workers Union GMP S.A. We currently have collective bargaining agreements with some of our gas processing plant workers.
In the case of the operation and maintenance of our electricity infrastructure business, some of our personnel in CAM Perú are subject to a collective
bargaining agreement. These collective bargaining agreements are negotiated on an annual basis.
Safety
We safeguard the health and safety of our employees and of all the persons present in our operations and services. To that end, we provide
safe work conditions, we manage risks in a timely manner and we promote a culture of prevention, starting from the leadership and commitment of our
senior management.
136
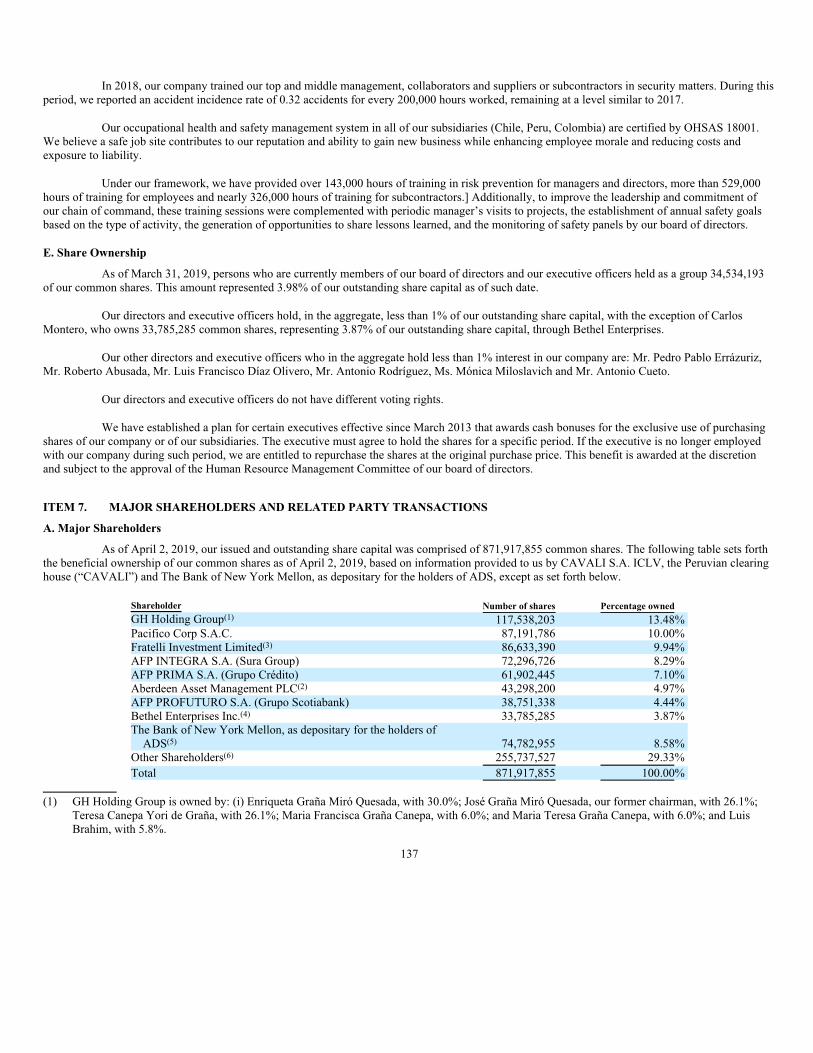
In 2018, our company trained our top and middle management, collaborators and suppliers or subcontractors in security matters. During this
period, we reported an accident incidence rate of 0.32 accidents for every 200,000 hours worked, remaining at a level similar to 2017.
Our occupational health and safety management system in all of our subsidiaries (Chile, Peru, Colombia) are certified by OHSAS 18001.
We believe a safe job site contributes to our reputation and ability to gain new business while enhancing employee morale and reducing costs and
exposure to liability.
Under our framework, we have provided over 143,000 hours of training in risk prevention for managers and directors, more than 529,000
hours of training for employees and nearly 326,000 hours of training for subcontractors.] Additionally, to improve the leadership and commitment of
our chain of command, these training sessions were complemented with periodic manager’s visits to projects, the establishment of annual safety goals
based on the type of activity, the generation of opportunities to share lessons learned, and the monitoring of safety panels by our board of directors.
E. Share Ownership
As of March 31, 2019, persons who are currently members of our board of directors and our executive officers held as a group 34,534,193
of our common shares. This amount represented 3.98% of our outstanding share capital as of such date.
Our directors and executive officers hold, in the aggregate, less than 1% of our outstanding share capital, with the exception of Carlos
Montero, who owns 33,785,285 common shares, representing 3.87% of our outstanding share capital, through Bethel Enterprises.
Our other directors and executive officers who in the aggregate hold less than 1% interest in our company are: Mr. Pedro Pablo Errázuriz,
Mr. Roberto Abusada, Mr. Luis Francisco Díaz Olivero, Mr. Antonio Rodríguez, Ms. Mónica Miloslavich and Mr. Antonio Cueto.
Our directors and executive officers do not have different voting rights.
We have established a plan for certain executives effective since March 2013 that awards cash bonuses for the exclusive use of purchasing
shares of our company or of our subsidiaries. The executive must agree to hold the shares for a specific period. If the executive is no longer employed
with our company during such period, we are entitled to repurchase the shares at the original purchase price. This benefit is awarded at the discretion
and subject to the approval of the Human Resource Management Committee of our board of directors.
ITEM 7. MAJOR SHAREHOLDERS AND RELATED PARTY TRANSACTIONS
A. Major Shareholders
As of April 2, 2019, our issued and outstanding share capital was comprised of 871,917,855 common shares. The following table sets forth
the beneficial ownership of our common shares as of April 2, 2019, based on information provided to us by CAVALI S.A. ICLV, the Peruvian clearing
house (“CAVALI”) and The Bank of New York Mellon, as depositary for the holders of ADS, except as set forth below.
Shareholder Number of shares Percentage owned
GH Holding Group(1)117,538,203 13.48%
Pacifico Corp S.A.C. 87,191,786 10.00%
Fratelli Investment Limited(3) 86,633,390 9.94%
AFP INTEGRA S.A. (Sura Group) 72,296,726 8.29%
AFP PRIMA S.A. (Grupo Crédito) 61,902,445 7.10%
Aberdeen Asset Management PLC(2) 43,298,200 4.97%
AFP PROFUTURO S.A. (Grupo Scotiabank) 38,751,338 4.44%
Bethel Enterprises Inc.(4) 33,785,285 3.87%
The Bank of New York Mellon, as depositary for the holders of
ADS(5) 74,782,955 8.58%
Other Shareholders(6) 255,737,527 29.33%
Total 871,917,855 100.00%
(1) GH Holding Group is owned by: (i) Enriqueta Graña Miró Quesada, with 30.0%; José Graña Miró Quesada, our former chairman, with 26.1%;
Teresa Canepa Yori de Graña, with 26.1%; Maria Francisca Graña Canepa, with 6.0%; and Maria Teresa Graña Canepa, with 6.0%; and Luis
Brahim, with 5.8%.
137

(2) Based on filings on Schedule 13F filed with the SEC on March 31, 2018.
(3) Based on a Form 13G filed with the SEC on June 8, 2018.
(4) Mr. Carlos Montero, through Bethel Enterprises Inc., indirectly owns 33,785,285 common shares, representing 3.87% of our outstanding share
capital.
(5) Excluding AFP PRIMA S.A., AFP INTEGRA S.A., Aberdeen Asset Management PLC, and Fratelli Investment Limited’s beneficial ownership of
our common shares as of December 31, 2018.
(6) Among other shareholders, the following directors and executive officers hold directly or indirectly common shares of our outstanding share
capital: Mr. Roberto Abusada, a member of our board of directors, Mr. Pedro Pablo Errazuriz, a member of our board of directors, Mr. Luis
Francisco Díaz Olivero, Chief Executive Officer, Ms. Mónica Miloslavich, our Chief Financial Officer, Mr. Antonio Rodríguez, Chief Investment
Officer, and Mr. Antonio Cueto, Chief Operations Officer, hold in aggregate less than 1% of our outstanding share capital.
As of December 31, 2018, 26 record holders of our common shares were located in the United States (including Bank of New York Mellon,
as depositary for the holders of ADS), according to CAVALI.
Certain of our directors and executive officers directly or indirectly own shares of our subsidiaries: Mr. Renato Rojas, Chief Executive
Officer of GyM, owns 108,854 common shares of GyM, representing 0.04% of its outstanding capital share; Mr. Rolando Ponce, Chief Executive
Officer of Viva GyM owns 1,111,690 shares of Viva GyM, representing 0.46% of its outstanding capital share; and Eduardo Villa Corta, chief executive
officer of GMI, owns 108,854 shares of GyM, representing 0.0421% of its outstanding capital share, and 23,747 shares of GMI, representing 0.279%.
Additionally, on April 2, 2019, our company issued and sold 142,483,633 common shares pursuant to a private placement, of which: (i)
55,291,877 shares were paid in full and (ii) 87,191,786 shares were paid 50% with 50% to be paid by July 1, 2019. For more information, see “Item 5.
—Liquidity and Capital Resources.”
The following table sets forth the changes in beneficial ownership of our common shares from December 31, 2016, to December 31, 2018,
based on information provided to us by CAVALI and the depositary for the holders of ADS. ADS data as of December 31, 2016 and 2017 was provided
by JPMorgan Chase Bank NA, as depositary. ADS data as of December 31, 2018 was provided by The Bank of New York Mellon, as depositary.
As of December 31, 2016 As of December 31, 2017 As of December 31, 2018
Shareholders No. of Shares
Percentage
Owned No. of Shares
Percentage
Owned No. of Shares
Percentage
Owned
GH Holding Group(1)117,538,203 17.81 117,538,203 17.81 117,538,203 16.11
AFP PRIMA S.A. 4,387,824 0.66 74,011,175 11.21 61,902,445 8.49
IN-CARTADM (AFP Integra-Sura Group) 38,384,976 5.82 72,223,691 10.94 72,296,726 9.91
PR-CARTADM (Profuturo AFP-Grupo Scotiabank) 36,968,166 5.60 23,136,533 3.51 38,751,338 5.31
Aberdeen Asset Management PLC(2) 35,501,465 5.38 49,730,025 7.53 43,298,200 5.94
Bethel Enterprises Inc.(3) 33,785,285 5.12 33,785,285 5.12 33,785,285 4.63
JPMorgan Chase Bank NA, as depositary for the holders of
ADS(4) 229,683,570 34.80 96,482,855 14.62 — —
The Bank of New York Mellon, as depositary for the holders of
ADS(5) — — — — 75,050,020 10.29
(1) GH Holding Group is owned by: Enriqueta Graña Miró Quesada, with 30.0%; José Graña Miró Quesada, our former chairman, with 26.1%;
Teresa Canepa Yori de Graña, with 26.1%; Maria Francisca Graña Canepa, with 6.0%; and Maria Teresa Graña Canepa, with 6.0%; and Luis
Brahim, with 5.8%.
(2) Based on filings on Schedule 13F filed with the SEC on December 31, 2017.
(3) Mr. Carlos Montero indirectly owns 33,785,285 common shares, representing 5.12% of our outstanding share capital, through Bethel Enterprises
Inc.
(4) Excluding Aberdeen Asset Management PLC’s beneficial ownership of our common shares as of December 31, 2015 and December 31, 2016. As
of December 31, 2017, excludes shares of Aberdeen Asset Management PLC, AFP PRIMA S.A. and AFP INTEGRA S.A.
(5) Depositary change reported through Form 6-K filed on December 10, 2018.
Our major shareholders do not have different voting rights.
B. Related Party Transactions
Peruvian Law Concerning Related Party Transactions
Peruvian law sets forth certain restrictions and limitations on transactions with certain related parties.
Valuation: from a tax standpoint, the value of those transactions must be equal to the fair market value assessed under transfer pricing rules,
i.e., the value agreed to by non-related parties under the same or similar circumstances. Similarly, companies with securities registered in the Peruvian
Public Registry of Securities (Registro Público del Mercado de Valores), such as us, are required to comply with the following rules:
138

• The directors and managers of our company cannot, without the prior authorization of the board of directors, (i) receive in the form
of a loan money or assets of our company; or (ii) use, for their own benefit or for the benefit of related parties, assets, services or
credits of our company.
• The execution of agreements that involve at least 5% of the assets of our company with persons or entities related to directors,
managers or shareholders that own, directly or indirectly, 10% of the share capital, requires the prior authorization of the board of
directors (with no participation of the director involved in the transaction, if any).
• The execution of agreements with a party controlled by our company’s controlling shareholder requires the prior authorization of the
board of directors and an evaluation of the terms of the transaction by an external independent company (audit companies or other
determined by Resolución SMV N° 029-2018-SMV-01).
Independent review: the external independent company that reviews the transaction should not be related to the parties involved therein, nor
to directors, managers or shareholders that own at least 10% of the share capital of such parties involved.
Terms and conditions: As a general policy, we do not enter into transactions with directors and executive officers on terms more favorable
than what we would offer third parties. Any related party transaction we have entered into in the past has been in the ordinary course of business and on
an arm’s length basis.
Approve and accounting: Article 30 of the internal regulations of our board of directors establishes a review procedure for identifying,
approving and accounting for related party transactions. Related party transactions are defined as any transaction entered into by and among our
company and any shareholder that owns 1% or more of our company’s or of our subsidiaries’ outstanding shares, directors, senior executives and
persons related to them. The Risk, Compliance and Sustainability Committee is responsible for approving each such transaction considering market
conditions and potential benefits for us and the related party. For ordinary course transactions carried out under market conditions, the authorization is
delegated to the operations of the business line. For more information, see “Item 6. Directors Senior Management and Employees—Management.”
Related Party Transactions
We enter into certain related party transactions in the ordinary course of our business. No such transactions in effect during 2018 (other than
the sale of Stracon GyM) were material to our company or, to our knowledge, to any such related party, nor were any such transactions unusual in their
nature or condition. Related party transactions with the following parties were in effect in 2018:
• Our subsidiary Viva GyM paid a total of US$166,500 for advertising and publishing services to Editora El Comercio S.A., a
company where Mr. José Graña Miró Quesada, the former Chairman of our Board of Directors and current shareholder, is a
shareholder.
• In April 2018, we sold our 87.59% interest in Stracon GyM for US$76.82 million to Stracon SAC, a company of which Steve
Dixon, the former chief executive officer of Stracon GyM, holds 36.84%.
• We signed a consulting agreement with Augusto Baertl, the Chairman of our Board of Directors, in the amount of US$124,000. The
consulting agreement renews annually.
• In September 2018, our subsidiary GyM signed loan agreements with Mr. Renato Eduardo Rojas Balta, chief executive officer of
our subsidiary GyM, and members of his family, under which GyM borrowed an aggregate of US$319,820, at 10% interest, to pay
tax debts of the company. In November 2018, GyM repaid these loans in full.
• On January 30, 2019, an associated company of Viva GyM, Obratres SAC, sold to Antonio Rodriguez, chief executive officer of our
subsidiary Morelco, three apartments in the JAUS—Barranco Project, for a total of US$696,000.
C. Interests of Experts and Counsel
Not applicable.
ITEM 8. FINANCIAL INFORMATION
A. Consolidated Statements and Other Financial Information.
See Item 18 of this annual report on Form 20-F.
139

Legal and Administrative Proceedings
We may, from time to time, become subject to various legal and administrative proceedings that are incidental to the ordinary conduct of
our business. We are currently not party to any material legal or administrative proceedings, other than as described below. As of December 31, 2018,
we had recorded provisions amounting to S/.84.7 million in connection with legal and administrative proceedings. See note 23 to our audited annual
consolidated financial statements included in this annual report.
Two securities class action complaints have been filed against us and certain of our former directors and current and former executive
officers in the Eastern District of New York during the first quarter of 2017. These complaints were consolidated into a single class action. The plaintiffs
filed a consolidated amended compliant on May 29, 2018. We moved to dismiss the complaint during the fourth quarter of 2018. The court has not yet
ruled on that motion, but has granted plaintiffs leave to file a further amended complaint. We continue to believe that we have meritorious defenses to
the claims asserted, and we intend to defend ourselves vigorously in these matters.
The Lava Jato commission of the Peruvian Congress, which was formed in November 2016 and tasked with investigating the alleged bribes
of Brazilian companies to Peruvian public officials, conducted congressional inquiries into our company and other construction companies in Peru.
Certain of our company’s former board members and executive officers have been required to give testimony at hearings before the commission, during
which they have affirmed that our company was unaware of Odebrecht’s illicit activities.
Peruvian prosecutors have included José Graña Miró Quesada, the former Chairman of our company, in an investigation for the crime of
collusion, and Hernando Graña Acuña, a shareholder, a former board member of our company and chairman of our subsidiary GyM for the crime of
money laundering against the Peruvian government, each in connection with the IIRSA South project concession (tranches II and III), in which we
participated. Gonzalo Ferraro Rey, the former Chief Infrastructure Officer of our company, has also been included in an investigation for the crime of
money laundering in connection with the same project.
In connection with investigations relating to the IIRSA South project concession (tranches II and III), the Peruvian criminal prosecutor
moved to charge our company and our construction subsidiary, GyM, as criminal defendants in connection with the projects. In response, the Peruvian
First National Preparatory Investigation Court (Primer Juzgado de Investigación Preparatoria Nacional) notified us of its decision to formally include
our company and GyM in its criminal investigation. We appealed the court’s decision and, in June 2018, the First Court of Appeals of the Superior
Court of Lima revoked the judicial order that indicted our company and GyM, among other corporate defendants, in the criminal investigation on
charges of collusion and other crimes and rejected the petition, without prejudice, made by the prosecutor to incorporate both companies in the
aforementioned process. Nevertheless, we cannot assure you that the criminal prosecutor will not file a new motion to charge our company and/or GyM
or that our position will ultimately prevail if such motion is filed.
Separately, in December 2018, the Peruvian First National Preparatory Investigation Court resolved to include our company and GyM as
civilly-responsible third parties in the investigations related to the IIRSA South project concession (tranches II and III) and GyM as a civilly-responsible
third party in the investigations related to Tranches 1 and 2 of the Lima Metro. These investigations are ongoing.
In July 2017, media reports alleged that certain construction companies in Peru, Brazil and Spain, including our company, colluded as a
“construction club” to receive public contracts. As a result of these reports, INDECOPI initiated an investigation regarding the anti-competitive
activities of construction companies in Peru, including our company. In July 2017, the Peruvian government conducted a search of our facilities related
to these allegations. Separately, a former employee of GyM has been included in a criminal investigation for collusion and other alleged crimes. In
January 2018 criminal prosecutors conducted a search of our facilities regarding the “construction club” investigation. We have provided the
information requested by the Peruvian criminal prosecutors. A former employee of GyM has been included in the investigation for collusion and other
alleged crimes. In December 2018, GyM was formally included in this criminal investigation as civilly-responsible third party along with eleven other
construction companies.
A conviction of corruption or resolutions with government authorities may lead to criminal and civil fines as well as penalties, sanctions,
injunctions against future conduct, profit disgorgement, disqualifications from directly and indirectly engaging in certain types of business, the loss of
business licenses or permits or other restrictions. Moreover, our involvement in corruption investigations, and any findings of wrongdoing in such
investigations, could further damage our reputation and have a material adverse impact on our ability to compete for business. Such investigations may
also adversely affect our ability to pursue strategic projects, and could potentially result in the termination or modification of certain existing contracts
or relationships. Also, such investigations may affect our company’s ability to secure financing in the future.
140
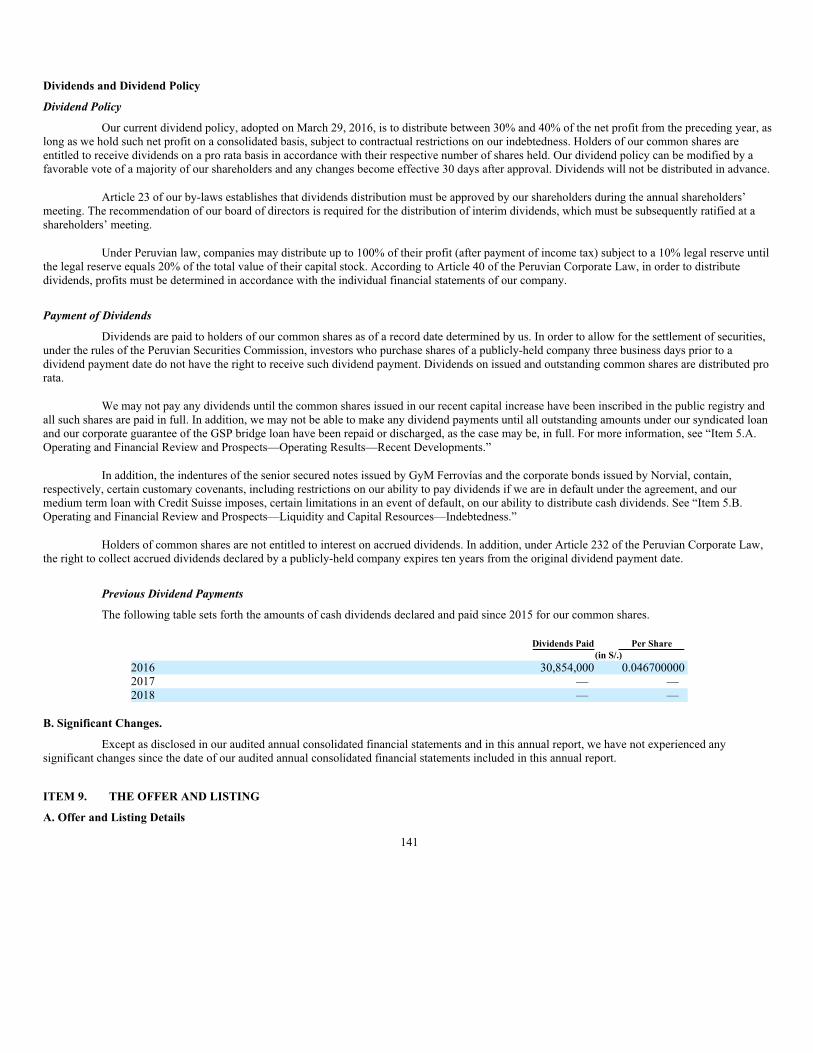
Dividends and Dividend Policy
Dividend Policy
Our current dividend policy, adopted on March 29, 2016, is to distribute between 30% and 40% of the net profit from the preceding year, as
long as we hold such net profit on a consolidated basis, subject to contractual restrictions on our indebtedness. Holders of our common shares are
entitled to receive dividends on a pro rata basis in accordance with their respective number of shares held. Our dividend policy can be modified by a
favorable vote of a majority of our shareholders and any changes become effective 30 days after approval. Dividends will not be distributed in advance.
Article 23 of our by-laws establishes that dividends distribution must be approved by our shareholders during the annual shareholders’
meeting. The recommendation of our board of directors is required for the distribution of interim dividends, which must be subsequently ratified at a
shareholders’ meeting.
Under Peruvian law, companies may distribute up to 100% of their profit (after payment of income tax) subject to a 10% legal reserve until
the legal reserve equals 20% of the total value of their capital stock. According to Article 40 of the Peruvian Corporate Law, in order to distribute
dividends, profits must be determined in accordance with the individual financial statements of our company.
Payment of Dividends
Dividends are paid to holders of our common shares as of a record date determined by us. In order to allow for the settlement of securities,
under the rules of the Peruvian Securities Commission, investors who purchase shares of a publicly-held company three business days prior to a
dividend payment date do not have the right to receive such dividend payment. Dividends on issued and outstanding common shares are distributed pro
rata.
We may not pay any dividends until the common shares issued in our recent capital increase have been inscribed in the public registry and
all such shares are paid in full. In addition, we may not be able to make any dividend payments until all outstanding amounts under our syndicated loan
and our corporate guarantee of the GSP bridge loan have been repaid or discharged, as the case may be, in full. For more information, see “Item 5.A.
Operating and Financial Review and Prospects—Operating Results—Recent Developments.”
In addition, the indentures of the senior secured notes issued by GyM Ferrovías and the corporate bonds issued by Norvial, contain,
respectively, certain customary covenants, including restrictions on our ability to pay dividends if we are in default under the agreement, and our
medium term loan with Credit Suisse imposes, certain limitations in an event of default, on our ability to distribute cash dividends. See “Item 5.B.
Operating and Financial Review and Prospects—Liquidity and Capital Resources—Indebtedness.”
Holders of common shares are not entitled to interest on accrued dividends. In addition, under Article 232 of the Peruvian Corporate Law,
the right to collect accrued dividends declared by a publicly-held company expires ten years from the original dividend payment date.
Previous Dividend Payments
The following table sets forth the amounts of cash dividends declared and paid since 2015 for our common shares.
Dividends Paid Per Share
(in S/.)
2016 30,854,000 0.046700000
2017 — —
2018 — —
B. Significant Changes.
Except as disclosed in our audited annual consolidated financial statements and in this annual report, we have not experienced any
significant changes since the date of our audited annual consolidated financial statements included in this annual report.
ITEM 9. THE OFFER AND LISTING
A. Offer and Listing Details
141
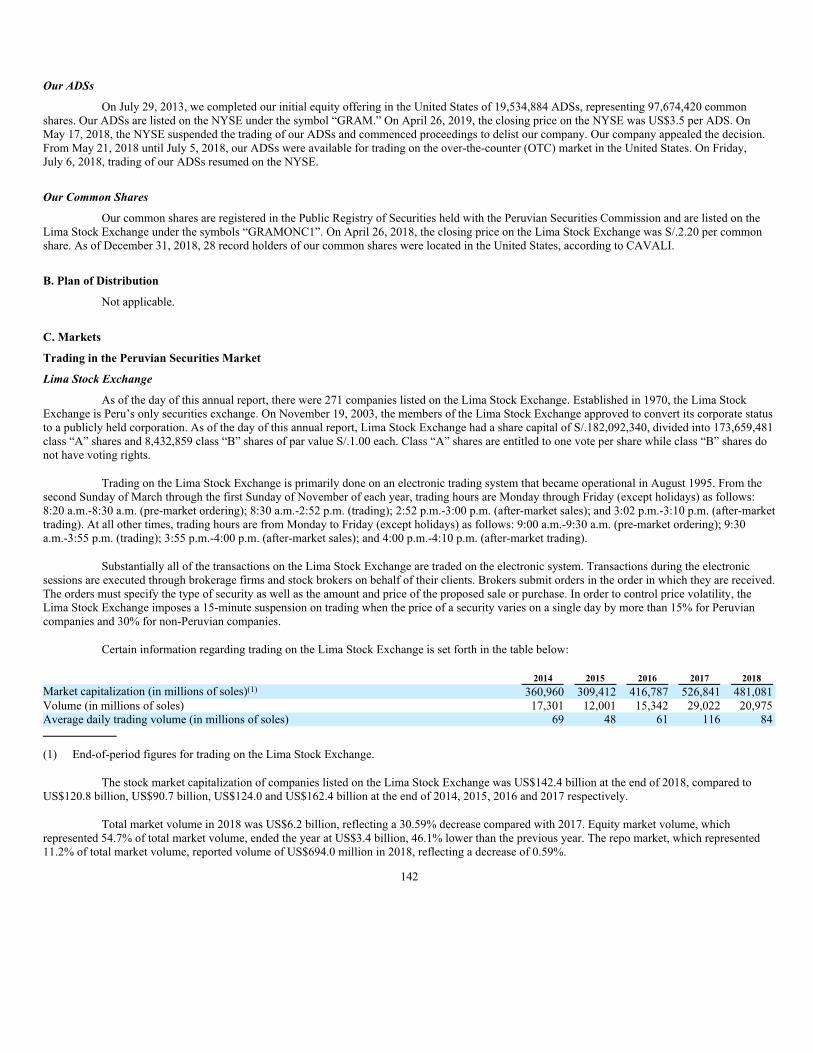
Our ADSs
On July 29, 2013, we completed our initial equity offering in the United States of 19,534,884 ADSs, representing 97,674,420 common
shares. Our ADSs are listed on the NYSE under the symbol “GRAM.” On April 26, 2019, the closing price on the NYSE was US$3.5 per ADS. On
May 17, 2018, the NYSE suspended the trading of our ADSs and commenced proceedings to delist our company. Our company appealed the decision.
From May 21, 2018 until July 5, 2018, our ADSs were available for trading on the over-the-counter (OTC) market in the United States. On Friday,
July 6, 2018, trading of our ADSs resumed on the NYSE.
Our Common Shares
Our common shares are registered in the Public Registry of Securities held with the Peruvian Securities Commission and are listed on the
Lima Stock Exchange under the symbols “GRAMONC1”. On April 26, 2018, the closing price on the Lima Stock Exchange was S/.2.20 per common
share. As of December 31, 2018, 28 record holders of our common shares were located in the United States, according to CAVALI.
B. Plan of Distribution
Not applicable.
C. Markets
Trading in the Peruvian Securities Market
Lima Stock Exchange
As of the day of this annual report, there were 271 companies listed on the Lima Stock Exchange. Established in 1970, the Lima Stock
Exchange is Peru’s only securities exchange. On November 19, 2003, the members of the Lima Stock Exchange approved to convert its corporate status
to a publicly held corporation. As of the day of this annual report, Lima Stock Exchange had a share capital of S/.182,092,340, divided into 173,659,481
class “A” shares and 8,432,859 class “B” shares of par value S/.1.00 each. Class “A” shares are entitled to one vote per share while class “B” shares do
not have voting rights.
Trading on the Lima Stock Exchange is primarily done on an electronic trading system that became operational in August 1995. From the
second Sunday of March through the first Sunday of November of each year, trading hours are Monday through Friday (except holidays) as follows:
8:20 a.m.-8:30 a.m. (pre-market ordering); 8:30 a.m.-2:52 p.m. (trading); 2:52 p.m.-3:00 p.m. (after-market sales); and 3:02 p.m.-3:10 p.m. (after-market
trading). At all other times, trading hours are from Monday to Friday (except holidays) as follows: 9:00 a.m.-9:30 a.m. (pre-market ordering); 9:30
a.m.-3:55 p.m. (trading); 3:55 p.m.-4:00 p.m. (after-market sales); and 4:00 p.m.-4:10 p.m. (after-market trading).
Substantially all of the transactions on the Lima Stock Exchange are traded on the electronic system. Transactions during the electronic
sessions are executed through brokerage firms and stock brokers on behalf of their clients. Brokers submit orders in the order in which they are received.
The orders must specify the type of security as well as the amount and price of the proposed sale or purchase. In order to control price volatility, the
Lima Stock Exchange imposes a 15-minute suspension on trading when the price of a security varies on a single day by more than 15% for Peruvian
companies and 30% for non-Peruvian companies.
Certain information regarding trading on the Lima Stock Exchange is set forth in the table below:
2014 2015 2016 2017 2018
Market capitalization (in millions of soles)(1)360,960 309,412 416,787 526,841 481,081
Volume (in millions of soles) 17,301 12,001 15,342 29,022 20,975
Average daily trading volume (in millions of soles) 69 48 61 116 84
(1) End-of-period figures for trading on the Lima Stock Exchange.
The stock market capitalization of companies listed on the Lima Stock Exchange was US$142.4 billion at the end of 2018, compared to
US$120.8 billion, US$90.7 billion, US$124.0 and US$162.4 billion at the end of 2014, 2015, 2016 and 2017 respectively.
Total market volume in 2018 was US$6.2 billion, reflecting a 30.59% decrease compared with 2017. Equity market volume, which
represented 54.7% of total market volume, ended the year at US$3.4 billion, 46.1% lower than the previous year. The repo market, which represented
11.2% of total market volume, reported volume of US$694.0 million in 2018, reflecting a decrease of 0.59%.
142

The total number of operations in the market in 2018 decreased by 28.3%, closing the year at 113,828 operations. The number of operations
in the equity market in 2018 decreased by 30.6% to 102,503 operations.
In 2015, the S&P/BVL Peru General Index (Índice S&P/BVL Peru General) reached 9,849 points, decreasing 33.4% compared to 2014. In
2016, it reached 15,567 points, increasing 58.1% compared to 2015. In 2017, it reached 19,974 points, increasing 28.3% compared to 2016. In 2018, it
reached 19,350 points, decreasing 3.1% compared to 2017.
Regulation of the Peruvian Securities Market
The regulatory framework for the Peruvian securities market is established in the Securities Market Law approved by Legislative Decree
No. 861, whose unified sole text was enacted by Supreme Decree No. 093-2002-EF, as amended (Ley del Mercado de Valores), and the resolutions
issued from time to time by the Peruvian Securities Commission. The purpose of the Securities Market Law is to promote the ordered development and
transparency of the Peruvian securities markets, adequate protection for investors and the principles under which the Peruvian securities market is
intended to operate. The Securities Market Law contains the general rules for: (i) primary and secondary public offerings of securities; (ii) public
offering of securities for acquisitions and sales; (iii) local and international offerings, including simultaneous offerings; (iv) the Public Registry of
Securities (Registro Público del Mercado de Valores); (v) reporting obligations of material information (hechos de importancia) by the issuers of
securities recorded in the Public Registry of Securities and by the entities that are subject to the regulation and supervision of the Peruvian Securities
Commission; (vi) the enforcement of insider trading; (vii) privileged information and confidentiality regulations and prohibitions against price
manipulation; (viii) the broker-dealers; (ix) the Lima Stock Exchange; (x) CAVALI (the settlement and registry entity for transactions executed on the
Lima Stock Exchange); (xi) other entities that are required to be registered at the Peruvian securities market Public Registry of Securities; (xii) capital
market instruments and operations, including securitizations; and (xiii) mutual funds and investments funds publicly placed and their respective
management companies.
The Peruvian securities market is regulated and supervised by the Peruvian Securities Commission (Superintendencia de Mercado de
Valores), a governmental entity reporting to the Peruvian Ministry of Economy and Finance, with functional, administrative, economic, technical and
budgetary autonomy. The Peruvian Securities Commission is governed by the Superintendent, designated by the Peruvian Ministry of Economy and
Finance, and by a five-member board of directors convened by the Superintendent (who acts as Chairman of the board). The other four members are
appointed by the government under applicable legislation. The Peruvian Securities Commission issues from time to time resolutions which provide
specific regulations or may impose sanctions in cases of violations of the Securities Market Law or the resolutions issued by the Peruvian Securities
Commission.
The Peruvian Securities Commission, in order to achieve the Securities Market Law´s purposes, has broad regulatory and supervisory
powers, including (i) issuing general mandatory rules; (ii) supervision and oversight of compliance with applicable legislation (including the power to
order inspections and require the submission of information and documentation by entities that are under its jurisdiction and summon and interrogate
any person that may contribute to its investigations); (iii) imposing sanctions; (iv) managing the Peruvian securities market public registry; (v) verifying
that public offerings meet filing requirements and that the securities subject to such offerings are duly recorded at the Peruvian securities market public
registry of securities; (vi) authorizing the incorporation and functioning of entities under its scope of supervision; and (vii) monitoring the content and
accuracy of the financial and other information that is filed with the Peruvian Securities Commission. The Peruvian Securities Commission is
responsible for the enactment, interpretation and enforcement of rules and regulations issued under the Securities Market Law.
Disclosure Obligations
Issuers of securities registered with the Peruvian Securities Commission are required to disclose material information relating to the issuer.
Pursuant to the Securities Market Law and relevant regulations enacted thereunder, all material information in connection with the issuer of registered
securities (such as our common shares), its activities or securities issued or secured by such issuer which may influence the liquidity or price of such
securities must be disclosed. Accordingly, issuers must file with the Peruvian Securities Commission mainly two types of information: (i) financial
information, including unaudited interim financial statements on a quarterly basis (which are not required to be subject to limited review by external
auditors), and audited annual consolidated financial statements on an annual basis, and (ii) material information relating to the issuer and its activities
that may significantly affect the price, offering or trading of the issued securities, and in general, all the information that may be relevant for investors to
be able to make investment decisions.
In order to comply with the foregoing disclosure obligations, issuers must disclose information to the Peruvian Securities Commission and,
if the securities are listed, with the Lima Stock Exchange as soon as practicable but not later than the day on which the event took place or the issuer
became aware of such information.
143

D. Selling Shareholders
Not applicable.
E. Dilution
Not applicable.
F. Expenses of the Issue
Not applicable.
ITEM 10. ADDITIONAL INFORMATION
A. Share Capital
Not applicable.
B. Memorandum and Articles of Association
Set forth below is certain information relating to our share capital, including brief summaries of certain material provisions of our bylaws,
Peruvian Corporate Law and certain other laws and regulations of Peru, all as in effect as of the date hereof.
General
We are a publicly-held corporation under Peruvian Corporate Law and registered with the Public Registry of Corporations in Lima. We are
listed on the Lima Stock Exchange and the NYSE.
Our by-laws provide that our principal corporate purposes are to engage in any and all activities related to the construction and real estate
businesses; to provide services related to the mining and hydrocarbons industries; to participate in all stages of development of public services and other
infrastructure concessions; and to provide management and corporate services to related and third parties. In addition, our company can realize
investments and corporate transactions, including the acquisition, holding and transfer of securities of Peruvian and foreign companies.
Shareholders’ Liability
Under Peruvian Corporate Law, holders of our common shares cannot vote on matters with respect to which they have a conflict of interest.
Under Article 133 of the Peruvian Corporate Law, a shareholder must abstain from voting when faced with a conflict of interest. A
resolution approved in disregard of this provision may be challenged under Article 139 of the Peruvian Corporate Law and the shareholders that
participated in the determination in breach of this provision, if their vote was key in attaining the required majority, may be held jointly liable.
Redemption and Rights of Withdrawal
Under Article 200 of the Peruvian Corporate Law, holders of our common shares have redemption rights if: (i) we change our corporate
purpose; (ii) a change occurs in the place of organization to a foreign country; or (iii) any transformation, merger or significant spin-off occurs with
respect to our company.
Preemptive and Accretion Rights
If we increase our share capital, holders of our common shares have the right to subscribe to new common shares on a pro rata basis.
Holders of common shares have preemptive rights in order to maintain their share interest in our share capital, unless the capital increase (i) results from
a conversion of debt to common shares, (ii) is approved by shareholders representing at least 40% of the subscribed voting shares provided that the
capital increase does not favor, directly or indirectly, certain shareholders to the detriment of others, or (iii) results from a corporate reorganization.
Shareholders who are in default of any payments relating to subscribed but unpaid shares may not exercise their preemptive rights.
144
Voting Rights and Dividends
Holders of common shares are entitled to one vote per share, with the exception of the election of the board of directors, where each holder
is entitled to one vote per share per nominee. Each holder’s votes may be cast for a single nominee or distributed among the nominees at the holder’s
discretion. To that effect, each of our common shares gives the holder the right to as many votes as there are directors to be elected. Shareholders may
pool votes in favor of one person or distribute them among various persons. Those candidates for the board who receive the most votes are elected
directors. Holders of common shares may attend and vote at shareholders’ meetings either in person or through a proxy.
Holders of common shares have the right to participate in the distribution of dividends and shareholder equity resulting from liquidation.
Our by-laws do not establish a maximum time limit for the payment of the dividends. However, according to Article 232 of the Peruvian Corporate
Law, the right to collect past-due dividends in the case of companies that are publicly held companies, such as ours, expires ten years after the date on
which the dividend payment was due.
Our share capital may be increased by a decision of holders of common shares at a shareholders’ meeting. Capital reductions may be
voluntary or mandatory and must be approved by holders of common shares at a shareholders’ meeting. Capital reductions are mandatory when
accumulated losses exceed 50% of the capital and to the extent such accumulated losses are not offset by accumulated earnings and capital increases
within the following fiscal year. Capital increases and reductions must be communicated to the Peruvian Securities Commission, the Lima Stock
Exchange and the Peruvian tax authority (SUNAT). Voluntary capital reductions must also be published in the official gazette El Peruano and in a
widely circulated newspaper in the city in which we are located.
Liquidation Rights
If we are liquidated, our shareholders have the right to receive net assets resulting from the liquidation, after we comply with our obligation
to pay all our creditors and after discounting any existing dividend liabilities. For this reason, we cannot assure that we will be able to reimburse 100%
of the book value of the common shares in case of bankruptcy or liquidation.
Ordinary and Extraordinary Meetings
Pursuant to Peruvian Corporate Law and our by-laws, the annual shareholders’ meeting must be held during the three-month period after the
end of each fiscal year. Additional shareholders’ meetings may be held during the year. Because we are a publicly-held corporation, we are subject to
the special control of the Peruvian Securities Commission, as provided in Article 253 of the Peruvian Corporate Law. If we do not hold the annual
shareholders’ meeting during the three-month period after the end of each fiscal year or any other shareholders’ meeting required by our by-laws, a
public notary or a competent judge shall call for such a meeting at the request of at least one shareholder of the common shares. Such meeting will take
place within a reasonable period of time.
Pursuant to the Peruvian Corporate Law, other shareholders’ meetings are convened by the board of directors when deemed convenient by
our company or when it is requested by notarized letter by the holders of at least 5% of our common shares which voting rights are not suspended
according to Peruvian Law. Pursuant to section 255 of the Peruvian Corporate Law, if the board expressly or implicitly refuses to convene the
shareholders’ meeting, a notary public or a competent judge will call for such meeting at the request of holders of at least 5% of our common shares. If a
notary public or competent judge calls for a shareholders’ meeting, the place, date and hour of the meeting, the agenda, the person who will preside the
meeting and the notary public who will certify the resolutions of the meeting shall be indicated in the meeting notice. If the meeting called is other than
the annual shareholders’ meeting or a shareholders’ meeting required by the Peruvian Corporate Law or the by-laws, the agenda will contain those
matters requested by the shareholders who requested the meeting.
Notices of Meetings
Since we are a publicly-held corporation, notice of shareholders’ meetings must be given by publication of a notice. The publication shall
occur at least 25 days prior to any shareholders’ meeting in the Peruvian Official Gazette, El Peruano, and in a widely circulated newspaper in the city in
which we are located.
Quorum and Voting Requirements
According to Article 33 of our by-laws and Article 257 of the Peruvian Corporate Law, shareholders’ meetings called for the purpose of
considering a capital increase or decrease, the issuance of obligations, a change in the by-laws, the sale in a single act of assets with an accounting value
that exceeds 50% of our share capital, a merger, division, reorganization, transformation or dissolution, are subject to a first, second and third quorum
call, with each of the second and third quorum call to occur upon the failure of the preceding one. A quorum for the first call requires the presence of
shareholders holding 50% of our total common shares. For the second
145

call, the presence of shareholders holding at least 25% of our total common shares is adequate, while for the third call there is no quorum requirement.
These decisions require the approval of the majority of the common shares represented at the shareholders’ meeting. Shareholders’ meetings convened
to consider all other matters are subject to a first and second quorum call, with the second quorum call to occur upon the failure of the first quorum.
In accordance with Peruvian Corporate Law, only those holders of common shares whose names are registered in our company’s stock
ledger not less than 10 days in advance of a meeting will be entitled to attend the shareholders’ meeting and to exercise their rights.
Limitations on the Rights of Non-Residents or Foreign Shareholders
There are no limitations under our by-laws or Peruvian Corporate Law on the rights of non-residents or foreign shareholders to own
securities or exercise voting rights with respect to our securities.
Disclosure of Shareholdings and Tender Offer Regulations
Disclosure of Shareholdings
There are no provisions in our by-laws governing the ownership threshold above which share ownership must be disclosed.
However, according to Article 10 of CONASEV Resolution Nº 090-2005-EF-94.10, as amended, we must inform the Peruvian Securities
Commission of the members of our economic group, comprised by our subsidiaries, and a list of our holders of common shares owning more than a 5%
share interest, as well as any change to such information.
Tender Offer Regulations
Peruvian securities regulations include mandatory takeover rules applicable to the acquisition of control of a publicly held company.
Subject to certain conditions, such regulations generally establish the obligation to launch a tender offer when a person or group of persons
acquires a significant interest in a publicly held company. According to the provisions set forth in CONASEV Resolution No. 009-2006-EF-94.10, a
person acquires a significant interest in a listed company when such person (i) holds or has the power to exercise directly or indirectly 25%, 50% or 60%
of the voting rights in a listed company, or (ii) has the power to appoint or remove the majority of the board members or to amend its by-laws.
A tender offer may be launched prior or following an acquisition of the significant interest. The tender offer may be launched after the
“significant interest” is acquired if it is acquired (i) by means of an indirect transaction, defined as a relevant acquisition or interest increase through the
acquisition of securities issued by a company that in turn holds share capital of the target company; (ii) as a consequence of a public sale offer, or (iii) in
no more than four transactions within a three-year period.
This mandatory procedure has the effect of alerting other shareholders and the market that an individual or financial group has acquired a
significant percentage of a company’s voting shares, and gives other shareholders the opportunity to sell their shares at the price offered by the
purchaser. The purchaser is required to launch a tender offer unless: (i) shareholders representing 100% of the voting rights consent in writing,
(ii) voting shares are acquired by a depositary in order to subsequently issue ADSs, or (iii) voting shares are acquired pursuant to the exercise of
preemptive rights.
Changes in Capital
Our by-laws do not establish special conditions to increase or reduce our share capital beyond what is required under Peruvian Corporate
Law.
Anti-Takeover Provisions
Our by-laws do not contain any provision that would have the effect of delaying, deferring or preventing a change of control.
Board of Directors
For additional information regarding our board of directors, see “Item 6. Directors, Senior Management and Employees—Directors and
Senior Management.”
146
Form and Transfer
Common shares may be either physical share certificates in registered form or book-entry securities in the CAVALI S.A. ICLV book-entry
settlement system also in registered form. Furthermore, in the case of shares represented in book entries, the issuance of new shares which result from
share splits or similar corporate events must also be represented in said form.
Furthermore, the Peruvian Corporate Law forbids publicly-held corporations, such as us, from including in their by-laws stipulations
limiting the transfer of their shares or restraining their trading in other ways. According to Article 18 of our by-laws, we cannot recognize a
shareholders’ agreement that contemplates limitations, restrictions or preferential rights on the transfer of shares, even if such an agreement is recorded
in our stock ledger (matrícula de acciones) or in CAVALI. As of the date of this annual report, no shareholders’ agreement is recorded in our stock
ledger.
Arbitration
Our by-laws include an arbitration clause applicable to disputes arising from the interpretation of our bylaws or Peruvian Corporate Law
and their complementary provisions, among our company, our management and our shareholders. Any such arbitration will be subject to the regulations
of the Arbitration Center of the Lima Chamber of Commerce. The material terms of the arbitration clause are as follows:
• any dispute, controversy or claim arising out of the performance and the interpretation of the by-laws and any action or remedy set
forth in the Peruvian Corporate Law (Ley General de Sociedades) among us, our current or former shareholders and/or our current
or former management shall be settled by arbitration;
• any dispute, controversy or claim between us and a third party shall be also settled by arbitration, if agreed upon by all parties either
expressly or tacitly;
• arbitrations shall be conducted before a panel of three arbitrators;
• arbitrators shall consider only the applicable law for their award (arbitration in law and not arbitration in equity);
• each party to a dispute shall appoint an arbitrator within 10 business days from receiving the notice of arbitration. The two selected
arbitrators shall appoint the third arbitrator. If one of the parties fails to appoint its arbitrator within 10 business days, the Center of
Arbitration of the Lima Chamber of Commerce shall appoint the arbitrator;
• the rules of the Center of Arbitration of the Lima Chamber of Commerce shall apply to the arbitration; and
• the arbitration clause is not applicable to the cases that must be submitted to the jurisdiction of the courts or of the Superintendencia
del Mercado de Valores, such as when arbitration would present hardship to minority shareholders or when Peruvian law otherwise
requires it.
The arbitration clause does not apply to claims based on violations of U.S. securities laws.
C. Material Contracts
Syndicated Loan
In December 2015 we entered into a medium term loan credit agreement for up to US$200 million (S/.672 million) with Credit Suisse AG,
Cayman Islands Branch, and Credit Suisse Securities (USA) LLC. As a result of the termination of the GSP gas pipeline concession, in June 2017, we
entered into an amendment to the credit agreement. See “Item 5. Operating and Financial Review and Prospects—Liquidity and Capital
Resources—Indebtedness.” This agreement and the amendments thereto have been incorporated by reference as Exhibit 10.01 to this annual report.
Term Loan
As a result of the termination of the GSP gas pipeline concession, our proportional guarantee of the GSP bridge loan became due. On
June 27, 2017 we entered into a new US$78.7 million (S/.264.8 million) term loan with Natixis, BBVA, SMBC and MUFJ, the proceeds of which were
used to prepay GSP bridge loan in full. The principal amount outstanding under the new term loan was US$63.47 million (S/.214.46 million) as of
December 31, 2018, and as of the date of this annual report, US$47.25 million (S/.156.16) is outstanding on the term loan. For more information, see
“Item 5. Operating and Financial Review and Prospects—Liquidity and Capital Resources—Indebtedness.” This agreement and the amendments thereto
have been incorporated by reference as Exhibit 10.02 to this annual report.
147

Financial Stability Framework Agreement
On July 31, 2017, we, and certain of our subsidiaries, GyM, Construyendo País S.A., Vial y Vives—DSD and Concesionaria Vía Expresa
Sur S.A., entered into a Financial Stability Framework Agreement with the following financial entities: Scotiabank Peru S.A.A., Banco Internacional del
Perú S.A.A., BBVA Banco Continental, Banco de Crédito del Perú, Citibank del Perú S.A. and Citibank N.A. As of December 31, 2018 and the date of
this annual report, US$59.44 million (S/200.83 million) was outstanding under the Financial Stability Framework Agreement. For more information, see
“Item 5. Operating and Financial Review and Prospects—Liquidity and Capital Resources—Indebtedness.” This agreement and the amendments thereto
have been incorporated by reference as Exhibit 10.03 to this annual report.
GSP Concession and Subordination Arrangements
In November 2015 we acquired a 20% interest in GSP, an entity which, on July 22, 2014, signed a concession agreement with the
government of Peru to build, operate and maintain the natural gas pipeline transportation system to satisfy the demand of certain cities in the southern
region of Peru.
On January 24, 2017, the government of Peru terminated the contract, due to the impossibility of obtaining financial closing. In accordance
with the concession contract, the Peruvian government is required to carry out an auction process to sell GSP’s assets and obtain a new concessionaire
within one year of the contract termination, with the funds raised in the sale to be used to pay the existing concessionaire for its investment in the
project. Although the concession contract provides that payment must be made within one year of termination, the Peruvian Ministry of Energy and
Mines has not made payment or, to our knowledge, initiated the payment process. A summary of these provisions of the concession contract have been
incorporated by reference as Exhibit 10.04 to this annual report.
In 2016, in connection with efforts to restructure or sell Odebrecht’s participation in GSP, due to the corruption scandal surrounding
Odebrecht, Odebrecht contractually agreed to subordinate its claims under the concession to the other project partners, Enagás and ourselves. As a
result, we and Enagas may be entitled to repayment of our percentage payment under the concession contract prior to Odebrecht. However, on
January 3, 2018, Odebrecht commenced arbitration proceedings against us, our subsidiary GyM and Enagás, seeking to invalidate the contractual
subordination. This agreement and the amendments thereto have been incorporated by reference as Exhibit 10.05 to this annual report.
For more information, see “Item 5.A. Operating and Financial Review and Prospects—Operating Results—Recent Developments.”
D. Exchange Controls
Since August 1990, there have been no exchange controls in Peru and all foreign exchange transactions are based on free market exchange
rates. Prior to August 1990, the Peruvian foreign market consisted of several alternative exchange rates. Additionally, during the 1990s, the Peruvian
currency experienced a significant number of large devaluations, and Peru has consequently adopted, and operated under, various exchange rate control
practices and exchange rate policies, ranging from strict control over exchange rates to market determination of rates. Current Peruvian regulations on
foreign investment allow the foreign holders of equity shares of Peruvian companies to receive and repatriate 100 percent of the cash dividends
distributed by such companies. Such investors are allowed to purchase foreign exchange at free market currency rates through any member of the
Peruvian banking system and transfer such foreign currency rates through any member of the Peruvian banking system and transfer such foreign
currency outside Peru without restriction.
E. Taxation
Peruvian Tax Considerations
The following is a general summary of material Peruvian tax matters under Peruvian law, as in effect on the date of this annual report, and
describes the principal tax consequences of ownership of ADSs and common shares by non-resident individuals or entities (“Non-Peruvian Holders”).
Legislative, judicial or administrative changes or interpretations may, however, be forthcoming. Any such changes or interpretations could affect the tax
consequences to holders of ADSs and common shares and could alter or modify the conclusions set forth herein. This summary is not intended to be a
comprehensive description of all of the tax considerations that may be relevant to a decision to make an investment in the ADSs or common shares. In
addition, it does not describe any tax consequences arising under the laws of any taxing jurisdiction other than Peru or applicable to an individual or
entity resident of Peru or to a person with a permanent establishment in Peru.
148
For purposes of Peruvian taxation:
• individuals are residents of Peru, if they are Peruvian nationals who have established their place of residence in Peru or if they are
foreign nationals with a permanence of more than 183 days in Peru in any 12-month period (in the latter case, the condition of
Peruvian resident can only be acquired as of the 1st of January of the year following the fulfillment of residence conditions); and
• legal entities are residents of Peru if they are established or incorporated in Peru.
Cash Dividends and Other Distributions
Cash dividends paid to Non-Peruvian Holders with respect to common shares and amounts distributed with respect to ADSs have been
subject to Peruvian withholding income tax at a rate of 5% since 2017. As a general rule, the distribution of additional common shares representing
profits, the distribution of shares which differ from the distribution of earnings or profits, as well as the distribution of preemptive rights with respect to
common shares, which are carried out as part of a pro rata distribution to all shareholders, will not be subject to Peruvian income tax or withholding
taxes.
Capital Gains
Pursuant to Article 6 of the Peruvian income tax law, individuals and domiciled entities in Peru are subject to Peruvian income tax on their
worldwide income while non-domiciled entities – including branches, agencies (agencias), and permanent establishment (establecimientos permanents)
of non-domiciled entities – are subject to Peruvian income tax only on their Peruvian source income.
Peruvian income tax law provides that income derived from the disposal of securities issued by Peruvian entities is considered Peruvian
source income and is therefore subject to income tax. Under current Peruvian income tax law, capital gains resulting from the disposal of American
Depositary Receipts (ADRs) that represent shares issued by Peruvian entities are considered Peruvian source income and therefore are subject to
Peruvian income tax. Peruvian income tax law also provides that the taxable income resulting from the disposal of securities is equal to the difference
between the sale price of the securities (which may not be less than their fair market value) and their tax basis.
Notwithstanding the foregoing, capital gains resulting from the disposal of ADSs or the beneficial interest in ADSs that represent shares
issued by a Peruvian entity are not considered Peruvian source income, and therefore are not subject to Peruvian income tax.
In the event ADSs are exchanged into common shares and such common shares are disposed of, capital gains resulting therefrom will be
subject to an income tax rate of either 5% or 30%, depending on where the transaction takes place. If the transaction is consummated in Peru, any capital
gain will be subject to an income tax rate of 5%; and if the transaction is performed outside of Peru, any capital gain will be subject to a 30% income tax
rate. Peruvian income tax law regulations have stated with respect to the transfer of common shares, that transactions are deemed to be consummated in
Peru if the common shares are transferred through the Lima Stock Exchange.
From 2016 through December 31 of 2019, pursuant to the Law 30341, capital gains resulting from a transfer of: (i) Common shares and
investment shares, (ii) ADRs and Global Depositary Receipts (GDRs), (iii) Exchange Trade Funds (ETF) units that have underlying shares and/or
securities representing debt, (iv) representative securities of debt, (v) Certificates of participation in mutual funds for investment in securities,
(vi) Certificates of participation in investment Funds in Rent of Real Property (FIRBI) and certificates of participation in Trustee of Securitization for
Investment in Rent of Real Estate (FIBRA), and (vii) Negotiable invoices, will be exempt from income tax, provided, however, that the following
conditions are met:
With respect to (i), (ii) and convertible bonds:
(a) The transfer must be performed through a centralized trading mechanism supervised by the Securities Market Superintendence;
(b) In any 12-month period, neither the seller or any person related to him must dispose of more than 10% of the total number of
common shares issued by the company through one or more simultaneous or successive operations; and
149
(c) The shares must have a “market presence”, meaning that transactions in respect of those shares for a value exceeding four Tax Units
(currently, S/.4,200.00) shall have occurred in at least 27 business days out of any 180 business day period including the date of the
transaction.
With respect to (iii), (iv), (v) and (vi):
(a) The transfer must be performed through a centralized trading mechanism supervised by the Securities Market Superintendence; and
(b) The shares must have a “market presence,” meaning that transactions in respect of those shares for a value exceeding four Tax Units
(currently, S/.4,200.00) shall have occurred in at least 27 business days out of any 180 business day period including the date of the
transaction.
With respect to (vii), the transfer must be performed through a centralized trading mechanism supervised by the Securities Market
Superintendence.
Any gain resulting from the conversion of ADSs into common shares or common shares into ADSs will not be subject to taxation in Peru.
Likewise, it is important to notice that if after applying the exemption, the issuer delisted the securities from the Registry of the Lima Stock
Exchange, in whole or in part, in an act or progressively, within the next 12 months after the disposal is made, the exemption that is applied to the
securities unlisted is lost.
Any Non-Peruvian Holder entities who acquires common shares will have the following tax basis: (i) for common shares purchased by the
transferor, the acquisition price paid for the shares; (ii) for common shares received by the transferor as a result of a share capital increase because of a
capitalization of net profits, the par value of such common shares; (iii) for other common shares received free of any payment, tax basis will be: (x) zero
or the cost borne by the transferor, in the case of individuals and (y) the fair market value at the time of the acquisition, in the case of entities; and
(iv) for common shares of the same type acquired at different opportunities and at different values, the tax basis will be the weighted average cost. In
cases where common shares are sold by Non-Peruvian Holders outside the Lima Stock Exchange, the tax basis must be certified by the Peruvian tax
administration prior to the time payment is made to the transferor; otherwise it would not be possible to deduct the tax basis and the 30% Peruvian
income tax would apply to the total sale price. Under Peruvian income tax law, tax basis certification is granted by the Peruvian tax authorities within 30
business days after the filing of the corresponding application. If the Peruvian tax authorities do not respond within the abovementioned period, the tax
basis calculation will be deemed automatically approved.
In any transaction relating to Peruvian securities through the Lima Stock Exchange, CAVALI will act as withholding agent of the Peruvian
income tax. If the purchaser is a resident in Peru and the sale is not performed through the Lima Stock Exchange, the purchaser will act as withholding
agent. In other cases, the transferor shall be obliged to self-assess the tax and pay it to the Peruvian tax authorities within the first 12 business days of the
month following the transfer.
Other Considerations
No Peruvian estate or gift taxes are imposed on the gratuitous transfer of ADSs or common shares. No stamp, transfer or similar tax applies
to any transfer of ADSs or common shares, except for commissions payable by seller and buyer to the Lima Stock Exchange (0.021% of value sold,
provided that the Lima Stock Exchange applies a discount of 90% of such commission if stock is included in the Good Corporate Governance Index),
fees payable to the Peruvian Securities Commission (0.0135% of value sold, provided that the Peruvian Securities Commission applies a discount of
90% of the abovementioned commission if stock is included in the Good Corporate Governance Index), brokers’ fees (about 0.05% to 0.50% of value
sold by legal entities) and value added tax (at the rate of 18%) on commissions and fees. Any investor who sells its common shares on the Lima Stock
Exchange will incur these fees and taxes upon purchase and sale of the common shares.
United States Federal Income Tax Considerations
The following summary describes certain United States federal income tax consequences to a United States Holder (as defined below) of the
purchase, ownership and disposition of our common shares and ADSs as of the date of this annual report. Except where noted, this summary deals only
with common shares and ADSs held as capital assets (generally, property held for investment). As used herein, the term “United States Holder” means a
beneficial owner of common shares or ADSs that is for United States federal income tax purposes:
150

• an individual citizen or resident of the United States;
• a corporation (or other entity treated as a corporation for United States federal income tax purposes) created or organized in or under
the laws of the United States, any state thereof or the District of Columbia;
• an estate the income of which is subject to United States federal income taxation regardless of its source; or
• a trust if it (i) is subject to the primary supervision of a court within the United States and one or more United States persons have
the authority to control all substantial decisions of the trust, or (ii) has a valid election in effect under applicable United States
Treasury regulations to be treated as a United States person.
This summary does not represent a detailed description of the United States federal income tax consequences applicable to you in light of
your particular circumstances and does not address the United States federal income tax consequences applicable to you if you are subject to special
treatment under the United States federal income tax laws, including if you are:
• a dealer in securities or currencies;
• a financial institution;
• a regulated investment company;
• a real estate investment trust;
• an insurance company;
• a tax-exempt organization;
• a person holding our common shares or ADSs as part of a hedging, integrated or conversion transaction, a constructive sale or a
straddle;
• a trader in securities that has elected the mark-to-market method of accounting for your securities;
• a person liable for alternative minimum tax;
• a person who owns or is deemed to own 10% or more of our stock (by vote or value);
• a person required to accelerate the recognition of any item of gross income with respect to our common shares or ADSs as a result of
such income being recognized on an applicable financial statement;
• a partnership or other pass-through entity for United States federal income tax purposes; or
• a person whose “functional currency” is not the U.S. dollar.
The discussion below is based upon the provisions of the Internal Revenue Code of 1986, as amended (the “Code”), and regulations, rulings
and judicial decisions thereunder as of the date hereof, and such authorities may be replaced, revoked or modified so as to result in United States federal
income tax consequences different from those discussed below. There is currently no income tax treaty between the United States and Peru that would
provide for United States federal income tax consequences different than the consequences under the foregoing authorities. In addition, this summary is
based, in part, upon representations made by the depositary to us and assumes that the deposit agreement, and all other related agreements, will be
performed in accordance with their terms.
If a partnership (or other entity or arrangement treated as a partnership for United States federal income tax purposes) holds our common
shares or ADSs, the tax treatment of a partner in the partnership will generally depend upon the status of the partner and the activities of the partnership.
If you are a partner of a partnership holding our common shares or ADSs, you should consult your tax advisors.
This summary does not address the effects of the Medicare tax on net investment income or other United States income tax consequences
such as United States federal estate or gift tax consequences, and does not address the effects of any state, local or non-United States tax laws. If you are
considering the purchase, ownership or disposition of our common shares or ADSs, you should consult your own tax advisors concerning the United
States federal income tax consequences to you in light of your particular situation as well as any consequences arising under the laws of any other taxing
jurisdiction.
151

ADSs
If you hold ADSs, for United States federal income tax purposes, you generally will be treated as the owner of the underlying common
shares that are represented by such ADSs. Accordingly, deposits or withdrawals of common shares for ADSs will not be subject to United States federal
income tax.
Taxation of Dividends
The gross amount of distributions, other than certain pro rata distributions of common shares, on the ADSs or common shares (including
amounts withheld to reflect Peruvian withholding taxes) will be taxable as dividends, to the extent paid out of our current or accumulated earnings and
profits, as determined under United States federal income tax principles.
To the extent that the amount of any distribution (including amounts withheld to reflect Peruvian withholding taxes) exceeds our current and
accumulated earnings and profits for a taxable year, as determined under United States federal income tax principles, the distribution will first be treated
as a tax-free return of capital, causing a reduction in the adjusted basis of the ADSs or common shares, and the balance in excess of adjusted basis will
be taxed as capital gain recognized on a sale or exchange. However, we do not expect to keep earnings and profits in accordance with United States
federal income tax principles. Therefore, you should expect that a distribution will generally be treated as a dividend. Such dividends (including any
withheld taxes) will be includable in your gross income as ordinary income on the day actually or constructively received by you, in the case of the
common shares, or by the depositary, in the case of ADSs. Such dividends will not be eligible for the dividends received deduction allowed to
corporations under the Code.
With respect to non-corporate United States Holders, certain dividends received from a qualified foreign corporation may be subject to
reduced rates of taxation. A non-United States corporation is treated as a qualified foreign corporation with respect to dividends received from that
corporation on common shares (or ADSs backed by such shares) that are readily tradable on an established securities market in the United States. United
States Treasury Department guidance indicates that our ADSs, which are listed on the NYSE, will be considered readily tradable on an established
securities market in the United States. Based on existing guidance, it is not entirely clear whether our common shares will be considered readily tradable
on an established securities market in the United States because only the ADSs, not the underlying common shares, are listed on a securities market in
the United States. We believe that dividends we pay on our common shares that are represented by ADSs, but not our common shares that are not so
represented, will meet such conditions required for the reduced tax rates. There can be no assurance that our ADSs will be considered readily tradable
on an established securities market in later years. Non-corporate United States Holders that do not meet a minimum holding period requirement during
which they are not protected from the risk of loss or that elect to treat the dividend income as “investment income” pursuant to Section 163(d)(4) of the
Code will not be eligible for the reduced rates of taxation regardless of our status as a qualified foreign corporation. In addition, the rate reduction will
not apply to dividends if the recipient of a dividend is obligated to make related payments with respect to positions in substantially similar or related
property. This disallowance applies even if the minimum holding period has been met. You should consult your own tax advisors regarding the
application of these rules given your particular circumstances.
The amount of any dividend paid in soles will equal the U.S. dollar value of the soles received, calculated by reference to the exchange rate
in effect on the date the dividend is actually or constructively received by you, in the case of the common shares, or by the depositary, in the case of
ADSs, regardless of whether the soles are converted into U.S. dollars at that time. If the soles received as a dividend are converted into U.S. dollars on
the date they are received, you generally will not be required to recognize foreign currency gain or loss in respect of the dividend income. If the soles
received as a dividend are not converted into U.S. dollars on the date of receipt, you will have a tax basis in the soles equal to their U.S. dollar value on
the date of receipt. Any gain or loss realized on a subsequent conversion or other disposition of the soles will be treated as United States source ordinary
income or loss.
Subject to certain conditions and limitations, Peruvian withholding taxes on dividends may be treated as foreign taxes eligible for credit
against your United States federal income tax liability. For purposes of calculating the foreign tax credit, dividends paid on the ADSs or common shares
will be treated as foreign source income and will generally constitute passive category income. However, in certain circumstances, if you have held the
ADSs or common shares for less than a specified minimum period during which you are not protected from risk of loss, or are obligated to make
payments related to the dividends, you will not be allowed a foreign tax credit for any Peruvian withholding taxes imposed on dividends paid on the
ADSs or common shares. If you do not elect to claim a United States foreign tax credit, you may instead claim a deduction for Peruvian income tax
withheld, but only for a taxable year in which you elect to do so with respect to all foreign income taxes paid or accrued in such taxable year. The rules
governing the foreign tax credit are complex. You are urged to consult your tax advisors regarding the availability of the foreign tax credit under your
particular circumstances.
152
Taxation of Capital Gains
For United States federal income tax purposes, you will recognize taxable gain or loss on any sale or exchange of ADSs or common shares
in an amount equal to the difference between the amount realized for the ADSs or common shares and your tax basis in the ADSs or common shares, in
each case as determined in U.S. dollars. Such gain or loss will generally be capital gain or loss. Capital gains of non-corporate United States Holders
derived with respect to capital assets held for more than one year are eligible for reduced rates of taxation. The deductibility of capital losses is subject
to limitations.
If a Peruvian income tax is withheld on the sale or other disposition of our ADSs or common shares, your amount realized will include the
gross amount of the proceeds of that sale or other disposition before deduction of the Peruvian income tax. See “—Peruvian Tax
Considerations—Capital Gains” for a description of when a sale or other disposition of our ADSs or common shares may be subject to taxation by Peru.
Any gain or loss recognized by you will generally be treated as United States source gain or loss for foreign tax credit purposes. Consequently, in the
case of gain from the disposition of ADSs or common shares that is subject to Peruvian income tax, you may not be able to benefit from the foreign tax
credit for that Peruvian income tax (i.e., because the gain from the disposition would be United States source), unless you can apply the credit (subject to
applicable limitations) against United States federal income tax payable on other income from foreign sources. Alternatively, you may take a deduction
for the Peruvian income tax if you do not take a credit for any foreign taxes paid or accrued during the taxable year. You are urged to consult your tax
advisors regarding the tax consequences if Peruvian income tax is imposed on a disposition of ADSs or common shares, including the availability of the
foreign tax credit under your particular circumstances.
Passive Foreign Investment Company
We do not believe that we are, for United States federal income tax purposes, a passive foreign investment company (a “PFIC”), and we
expect to operate in such a manner so as not to become a PFIC. If, however, we are or become a PFIC, you could be subject to additional United States
federal income taxes on gain recognized with respect to the ADSs or common shares and on certain distributions, plus an interest charge on certain taxes
treated as having been deferred under the PFIC rules. Non-corporate United States Holders will not be eligible for reduced rates of taxation on any
dividends received from us (as discussed above under “—Taxation of Dividends”) if we are a PFIC in the taxable year in which such dividends are paid
or in the preceding taxable year.
Information Reporting and Backup Withholding
In general, information reporting will apply to dividends in respect of our ADSs or common shares and the proceeds from the sale,
exchange or other disposition of our ADSs or common shares that are paid to you within the United States (and in certain cases, outside the United
States), unless you are an exempt recipient. Backup withholding may apply to such payments if you fail to provide a taxpayer identification number or
certification of exempt status or fail to report in full dividend and interest income.
Any amounts withheld under the backup withholding rules will be allowed as a refund or a credit against your United States federal income
tax liability provided the required information is furnished to the Internal Revenue Service in a timely manner.
The above description is not intended to constitute a complete analysis of all tax consequences relating to the acquisition, ownership or
disposition of our ADSs or common shares. You should consult your own tax advisors concerning the overall tax consequences to you, including the
consequences under laws other than United States federal income tax laws, of an investment in our ADSs or common shares.
F. Dividends and Paying Agents
Not applicable.
G. Statement by Experts
Not applicable.
H. Documents on Display
We are subject to the informational requirements of the U.S. Securities Exchange Act of 1934, or the Exchange Act. Accordingly, we are
required to submit reports and other information to the SEC, including annual reports on Form 20-F and reports on Form 6-K. In addition, the SEC
maintains an Internet website at http://www.sec.gov, from which you can electronically access these materials.
153

As a foreign private issuer, we are required to file with the SEC annual reports on Form 20-F, but we are not subject to the same disclosure
requirements as a domestic U.S. registrant under the Exchange Act. For example, we are not required to prepare and issue quarterly reports. However,
we have furnished, and intend to continue to furnish, our shareholders with quarterly reports containing unaudited financial data for the first three
quarters of each fiscal year. In addition, as a foreign issuer, we are not subject to the proxy rules under Section 14 of the Exchange Act and our officers
and directors are subject to Section 16 of the Exchange Act relating to insider short-swing profit disclosure and recovery regime.
We send the depositary a copy of all notices that we give relating to meetings of our shareholders or to distributions to shareholders or the
offering of rights and a copy of any other report or communication that we make generally available to our shareholders. The depositary makes all these
notices, reports and communications that it receives from us available for inspection by registered holders of ADSs at its office. The depositary mails
copies of those notices, reports and communications to you if we ask the depositary to do so and furnish sufficient copies of materials for that purpose.
We file financial statements and other periodic reports with the Peruvian Securities Commission in Peru. Issuers of securities registered with
the Peruvian Securities Commission are required to disclose material information relating to the issuer. Pursuant to the Securities Market Law and
relevant regulations enacted thereunder, all material information in connection with the issuer of registered securities, its activities or securities issued or
secured by such issuer which may influence the liquidity or price of such securities must be disclosed. Accordingly, issuers must file with the Peruvian
Securities Commission mainly two types of information: (a) financial information, including unaudited interim financial statements on a quarterly basis
(which are not required to be subject to limited review), and audited annual consolidated financial statements on an annual basis, and (b) material
information relating to the issuer and its activities that may significantly affect the price, offering or negotiation of the issued securities, and in general,
all the information that may be relevant for investors to be able to make investment decisions.
I. Subsidiary Information
See the notes 2.2 and 6 to our audited annual consolidated financial statements included in this annual report for a description of our
subsidiaries.
ITEM 11. QUANTITATIVE AND QUALITATIVE DISCLOSURES ABOUT MARKET RISK
We are exposed to a number of market risks arising from our normal business activities, including the possibility that changes in currency
exchange rates or interest rates will adversely affect future cash flows and profit or the value of our financial assets and liabilities. From time to time, we
enter into derivative transactions to hedge against foreign currencies and interest rate fluctuations. For further information regarding our market risk, see
note 4 to our audited annual consolidated financial statements included in this annual report.
Exchange Rate Risk
We are exposed to market risk associated with changes in foreign currency exchange rates. Our revenues and costs, and our assets and
liabilities, are denominated in soles, U.S. dollars, Chilean pesos and, to a lesser extent, other currencies. In 2018, we estimate that 32.53%, 55.63% and
11.83% of our revenues were denominated in soles, U.S. dollars and other currencies (principally Chilean pesos), respectively, while 63.22%, 23.11%
and 13.67% of our cost of sales during the year were denominated in soles, U.S. dollars and other currencies. In addition, as of December 31, 2018,
56%, 41% and 3% of our total debt was denominated in soles, U.S. dollars and other currencies, respectively. If, at December 31, 2018, the sol had
strengthened/weakened by 2% against the U.S. dollar, with all other variables remaining constant, or pre-tax profit for the year would have
increased/decreased by S/.0.5 million.
Interest Rate Risk
We may from time to time incur variable interest rate indebtedness, and accordingly our financial expenses are affected by changes in
interest rates. Based upon our indebtedness at December 31, 2018, and taking into account our interest rate derivative instruments, a change in interest
rates of five percent (or 500 basis points) would impact our net profit by S/.0.75 million annually.
Commodity Price Risk
We are exposed to market risk associated with changes in commodity prices, primarily for oil, steel and cement, which in aggregate
represented a majority of our total input cost in 2018. We do not have long-term contracts for the supply of these key inputs. Based upon our
consumption of these inputs during 2018, a 10% increase/decrease in the prices of each of oil, steel and cement would have increased/decreased our
costs of sales by S/.1.0 million, S/.6.8 million and S/.1.7 million, respectively. However, based on our production of oil during 2018, a
10% increase/decrease in the price of oil would have increased/decreased our revenues by S/.29.3 million.
154

ITEM 12. DESCRIPTION OF SECURITIES OTHER THAN EQUITY SECURITIES
A. Debt Securities
Not applicable.
B. Warrants and Rights
Not applicable.
C. Other Securities
Not applicable.
D. American Depositary Shares
Fees and Expenses
The depositary may charge each person to whom ADSs are issued, including, without limitation, issuances against deposits of common
shares, issuances in respect of common share distributions, rights and other distributions, issuances pursuant to a stock dividend or stock split declared
by us or issuances pursuant to a merger, exchange of securities or any other transaction or event affecting the ADSs or deposited securities, and each
person surrendering ADSs for withdrawal of deposited securities or whose ADRs are cancelled or reduced for any other reason, US$5.00 or less for
each 100 ADSs (or any portion thereof) issued, delivered, reduced, cancelled or surrendered, as the case may be. The depositary may sell (by public or
private sale) sufficient securities and property received in respect of a common share distribution, rights and/or other distribution prior to such deposit to
pay such charge.
The following additional charges shall be incurred by the ADR holders, by any party depositing or withdrawing common shares or by any
party surrendering ADSs or to whom ADSs are issued (including, without limitation, issuance pursuant to a stock dividend or stock split declared by us
or an exchange of stock regarding the ADRs or the deposited securities or a distribution of ADSs), whichever is applicable:
• a fee of US$1.50 per ADR or ADRs for transfers of certificated or direct registration ADRs;
• a fee of US$0.05 or less per ADS for any cash distribution made pursuant to the deposit agreement;
• a fee of US$0.05 or less per ADS per calendar year (or portion thereof) for services performed by the depositary in administering the
ADRs (which fee may be charged on a periodic basis during each calendar year and shall be assessed against holders of ADRs as of
the record date or record dates set by the depositary during each calendar year and shall be payable in the manner described in the
next succeeding provision);
• a fee for the reimbursement of such fees, charges and expenses as are incurred by the depositary and/or any of the depositary’s
agents (including, without limitation, the custodian and expenses incurred on behalf of holders in connection with compliance with
foreign exchange control regulations or any law or regulation relating to foreign investment) in connection with the servicing of the
common shares or other deposited securities, the sale of securities, the delivery of deposited securities or otherwise in connection
with the depositary’s or the custodian’s compliance with applicable law, rule or regulation (which charge shall be assessed on a
proportionate basis against holders as of the record date or dates set by the depositary and shall be payable at the sole discretion of
the depositary by billing such holders or by deducting such charge from one or more cash dividends or other cash distributions);
• a fee for the distribution or sale of securities pursuant to paragraph 10 of the deposit agreement, such fee being in an amount equal to
the US$0.05 per ADS issuance fee for the execution and delivery of ADSs which would have been charged as a result of the deposit
of such securities (treating all such securities as if they were common shares) but which securities or the net cash proceeds from the
sale thereof are instead distributed by the depositary to those holders entitled thereto;
• stock transfer or other taxes and other governmental charges;
155

• cable and facsimile transmission and delivery charges incurred at your request in connection with the deposit or delivery of common
shares;
• transfer or registration fees for the registration of transfer of deposited securities on any applicable register in connection with the
deposit or withdrawal of deposited securities; and
• expenses of the depositary in connection with the conversion of foreign currency into U.S. dollars.
We will pay all other charges and expenses of the depositary and any agent of the depositary (except the custodian) pursuant to agreements
from time to time between us and the depositary. The charges described above may be amended from time to time by agreement between us and the
depositary.
Our depositary has agreed to reimburse us for certain expenses we incur that are related to establishment and maintenance of the ADR
program, including investor relations expenses and exchange application and listing fees. The amounts of reimbursements available to us are not based
upon the amounts of fees the depositary collects from investors. The depositary collects its fees for issuance and cancellation of ADSs directly from
investors depositing common shares or surrendering ADSs for the purpose of withdrawal or from intermediaries acting on their behalf. The depositary
collects fees for making distributions to investors by deducting those fees from the amounts distributed or by selling a portion of distributable property
to pay the fees. The depositary may collect its annual fee for depositary services by deduction from cash distributions, or by directly billing investors, or
by charging the book-entry system accounts of participants acting for them. The depositary will generally set off the amounts owing from distributions
made to holders of ADSs. If, however, no distribution exists and payment owing is not timely received by the depositary, the depositary may refuse to
provide any further services to holders that have not paid those fees and expenses owing until such fees and expenses have been paid. At the discretion
of the depositary, all fees and charges owing under the deposit agreement are due in advance and/or when declared owing by the depositary.
During 2018, the depositary reimbursed us for expenses in an aggregate amount of US$90,718 (S/.306,538).
156

PART II.
ITEM 13. DEFAULTS, DIVIDEND ARREARAGES AND DELINQUENCIES
Financing of the Expansion Project of the Lima Metro Concession
On August 23, 2017, GyM Ferrovias entered into a US$396 million financing structure with Mizuho Bank, Ltd and Sumitomo Mitsui
Banking Corporation. The particular structure for the expansion project of the Lima Metro involves the securitization of irrevocable and unconditional
payment obligations of the Government of Peru (CPAOs), which have been sold by GyM Ferrovias to a borrower under a long-term loan facility. The
expansion project includes the improvement of civil works and the purchase of additional rolling stock, including trains and cars that will be designed,
built, operated and maintained by GyM Ferrovías, as concessionaire under the Lima Metro concession. The financing is structured as a long-term loan
facility and a working capital facility.
During 2018, GyM Ferrovias was in continuing default under the financing of the expansion project due to the non-delivery of our audited
consolidated financial statements for the 2016 fiscal year, in our capacity as guarantor of the obligations of GyM Ferrovias under the agreement. The
financing required that we provide the financial statements no later than April 4, 2018. Also, the financing required that we deliver our audited
consolidated financial statements for the 2017 fiscal year by May 15, 2018. We were not able to deliver those financial statements on time. We
requested a waiver from the lenders, which we received on July 2, 2018, by which time we had already delivered our audited financial statements for the
2016 and 2017 years.
Syndicated Loan
Due to the termination of the GSP gas pipeline concession on January 24, 2017, we were in breach of our covenants, including our
Consolidated Leverage Ratio, under our syndicated loan as of December 31, 2016, as the effects on our financial condition and results of operations of
the concession termination were taken into account for the purposes of calculating compliance with our financial covenants for 2016. However, as of
December 31, 2017 our Consolidated Leverage Ratio (as defined therein) was 2.2x, no more than 3.5x as required under the syndicated loan. Upon the
termination of the GSP gas pipeline concession on January 24, 2017, we were required to prepay our syndicated loan. We amended the terms of our
syndicated loan, including certain financial covenants and certain prepayment requirements.
During 2018, and due to the accounting adjustments in connection to the termination of the GSP gas pipeline concession, we were again
under certain continuing defaults under the syndicated loan with respect to certain financial ratios and the failure to timely deliver our audited
consolidated financial statements for the 2016 and 2017 fiscal years. The syndicated loan required that we provide the financial statements for the 2016
and 2017 fiscal years no later than April 30, 2018. As of March 31, 2018, our Consolidated Leverage Ratio (as defined therein) was 2.6, rather than no
more than 2.50 as required under the syndicated loan. We have requested a waiver from the lenders, which we received on August 17, 2018, by which
time we had already delivered our audiated financial statements for the 2016 and 2017 years.
GSP Bridge Loan and New Term Loan.
With the termination of the GSP gas pipeline concession, our proportional guarantee under the GSP bridge loan became due. As of
December 31, 2017, there was US$72.5 million (S/.235.2 million) of principal amount outstanding under our corporate guarantee. On June 27, 2017 we
entered into a new US$78.7 million (S/.264.8 million) term loan with Natixis, BBVA, SMBC and MUFJ, the proceeds of which were used to prepay
GSP bridge loan.
In 2018, we were under certain defaults under the new term loan with respect to the failure to timely deliver by April 30, 2018 our audited
consolidated financial statements for the 2016 and 2017 fiscal years, which we delivered in July 2018. In addition, the company was in default as of
December 31, 2018 due to its failure to make payment on June 27, 2018 of 40% of the amounts outstanding under the term loan. The company
requested a waiver, which it formally received from the lenders on January 31, 2019, concurrent with which the company repaid the amounts that were
overdue (US$16.2 million).
Financial Stability Framework Agreement
As of December 31, 2018 and as of the date hereof, our construction subsidiary GyM is under a continuing default under the Financial
Stability Framework Agreement with respect to its failure to comply with certain ratios between Tranche A (client invoices (facturas)) and Tranche B
(client provisions). No event of default has been formally notified to GyM by the lenders, and our subsidiary has requested a waiver from the lenders,
which is pending. If duly notified to GyM by the lenders, the consequence of this default would be to transfer certain amounts due under Tranche A to
Tranche B, for which payment is not due until July 2019. As of December 31, 2018, there was US$43.7 million (S/.147.8 million) outstanding under
Tranche A and US$15.7 (S/.53.0) outstanding under Tranche B of the facility, for a total of $US$59.4 million.
157
For more information, see “Item 5.A. Operating and Financial Review and Prospects—Operating Results—Recent Developments” and
“Item 5.B. Operating and Financial Review and Prospects—Liquidity and Capital Resources—Indebtedness.”
ITEM 14. MATERIAL MODIFICATIONS TO THE RIGHTS OF SECURITY HOLDERS AND USE OF PROCEEDS
Material Modifications to the Rights of Security Holders
None.
Use of Proceeds
On November 6, 2018, our company’s general meeting of shareholders and board of directors approved an offering and sale of our
company’s common shares pursuant to a private placement. In December 2018, our company issued and sold a total of 69,380,402 common shares, to
certain of our company’s existing shareholders that exercised preemptive rights in accordance with Peruvian law. On April 2, 2019, our company issued
and sold 142,483,633 common shares pursuant to the private placement, of which: (i) 55,291,877 shares were paid in full and (ii) 87,191,786 shares
were paid 50% with 50% to be paid by July 1, 2019. In total, our company issued and sold 211,864,065 common shares with the proceeds used to
reduce debt, to pay our vendors and for working capital of one of our company’s subsidiaries.
ITEM 15. CONTROLS AND PROCEDURES
CONTROLS AND PROCEDURES
A. Disclosure Controls and Procedures
Management, with the participation of the company’s Chief Executive Officer and Chief Financial Officer, performed an evaluation of the
effectiveness of our disclosure controls and procedures as defined in Rules 13a-15(e) and 15d-15(e) of the Exchange Act. Our disclosure controls and
procedures are designed to ensure that information required to be disclosed in the reports we file or submit under the Exchange Act is recorded,
processed, summarized and reported within the time periods specified in the SEC’s rules and forms, and that such information is accumulated and
communicated to our management, including the Chief Executive Officer and the Chief Financial Officer, to allow timely decisions regarding required
disclosures. Any controls and procedures, no matter how well designed and operated, can provide only reasonable assurance of achieving the desired
control objective. Based on this evaluation, our Chief Executive Officer and Chief Financial Officer concluded that, as of December 31, 2018, our
disclosure controls and procedures were not effective as a result of the material weaknesses in internal control over financial reporting described below.
B. Management’s Annual Report on Internal Control Over Financial Reporting
Management is responsible for establishing and maintaining adequate internal control over financial reporting for our company as such term
is defined by Exchange Act rules 13(a)-15(f) and 15(d)-15(f). In order to evaluate the effectiveness of internal control over financial reporting, as
required by Section 404 of the U.S. Sarbanes-Oxley Act of 2002 (“SOX”), management has conducted an assessment, including testing, using the
criteria in Internal Control-Integrated Framework (2013), issued by the Committee of Sponsoring Organizations of the Treadway Commission (COSO).
Our company’s system of internal control over financial reporting is designed to provide reasonable assurance regarding the reliability of financial
reporting and the preparation of financial statements for external purposes in accordance with generally accepted IFRS accounting principles. Because
of its inherent limitations, internal control over financial reporting may not prevent or detect misstatements. Also, projections of any evaluation of
effectiveness to future periods are subject to the risk that controls may become inadequate because of changes in conditions, or that the degree of
compliance with the policies or procedures may deteriorate.
We have established a continuous testing process throughout the year. From this assessment of the effectiveness of our internal control over
financial reporting as of December 31, 2018, we have identified certain material weaknesses. A material weakness is a deficiency, or combination of
deficiencies, in internal control over financial reporting, such that there is a reasonable possibility that a material misstatement of our annual and interim
consolidated financial statements will not be prevented or detected on a timely basis. The material weaknesses identified are described below:
• deficiencies in the operational effectiveness of controls over SOX compliance, including those related to determining the subsidiaries to be
included in the scope of SOX testing, the review and formal approval of risk and control matrices, the updating and approval of narratives and
flowcharts, as well as the monitoring of detected control failures and the implementation of our internal control system over financing reporting;
• deficiency in formally having an established and documented process for enterprise and fraud risk management, including the implementation of a
risk management system that includes a methodology, a process of identification, evaluation and quantification of the risks, a continuous
improvement plan and a monitoring and reporting process;
• deficiencies in the design and operational effectiveness of controls over segregation of duties to help ensure that personnel with potential conflicts
were not involved in non-compatible activities;
• deficiencies in the design and operational effectiveness of the controls established in the accounting closing process with respect to the:
(1) preparation and review of the annual and interim consolidated financial statements, (2) review, approval and supporting documentation of
certain accounting entries, (3) segregation of duties between preparation and approval of accounting entries, (4) access control to spreadsheets
used for manual accounting records in compliance with IFRS disclosures, (5) disclosure of discontinued operations, and (6) complete, accurate
and timely provision of information to the accounting department; and
158

• deficiencies in the design and operational effectiveness of controls established in the revenue recognition process with respect to the criteria for,
and the documentation supporting, the recognition of revenue and the determination of related provisions, including construction contract
revenues and contingent revenues.
Conclusion
These material weaknesses resulted in adjustments to the accounting for revenue and accounts receivable. Additionally, these material
weaknesses could result in other misstatements in our financial results and disclosures, which could result in a material misstatement to our annual or
interim consolidated financial statements not being prevented or detected. Because of these material weaknesses, management concluded that we did not
maintain effective internal control over financial reporting as of December 31, 2018, based on criteria in Internal Control-Integrated Framework
(2013) issued by the COSO.
Moore Stephens SCAI S.A. (a member firm of Moore Stephens International), an independent registered public accounting firm, which has
audited and reported on the consolidated financial statements as of and for the year ended December 31, 2018 contained in this annual report on Form
20-F, has issued an attestation report on our internal control over financial reporting as of December 31, 2018.
Remediation Plan
We are in the process of implementing significant improvements to our internal control over financial reporting, as described in our annual
report on Form 20-F for fiscal year 2017 and as described herein. As part of this process, we are taking remedial actions to address the material
weaknesses that have been identified with respect to our internal control over financial reporting.
We are currently preparing a draft company risk manual that includes a methodology, a process of identification, evaluation and
quantification of risks, a continuous improvement plan and a monitoring and reporting process. In parallel and for the key processes, management is
identifying significant risks and their impact to prioritize their review and control enhancement and monitor their implementation as necessary.
As of December 31, 2018, we completed the implementation of controls over substantially all (and as of the date hereof, we have completed
the implementation of controls over all) of our subsidiaries to comply with the SOX requirements, and the testing of these controls in design and
effectiveness over financial reporting will be performed in 2019.
In relation to controls on segregation of duties, we have completed the identification of the conflicted accesses to our accounting and key
systems, and a remediation plan is in progress. This plan includes making changes to those accesses in order to ensure there is no conflict over the
segregation of duties.
We will continue providing proper training to our accounting team in matters related to IFRS, and to employees responsible for our internal
controls, to ensure they have an appropriate level of knowledge and can build on our experience with those controls, specifically, relating to monitoring
and accounting, in order to execute their control responsibilities. In addition, controls over the accounting process are under review to ensure that
information is provided to the accounting department in a complete, accurate and timely fashion, financial statements are assessed, supporting
documentation of accounting entries is provided, there is a correct segregation of duties between preparation and approval of accounting entries, and
access control to spreadsheets used for manual accounting are kept correctly. In addition, as part of this plan, controls in revenue recognition will be
reinforced with the implementation of policies and procedures in accordance with IFRS.
Furthermore, moving forward, we will continue to monitor and assess our remediation activities to address the material weaknesses
described above through remediation as soon as practicable. The implementation of these measures may not fully address the material weaknesses in our
internal control over financial reporting described above.
The process of designing and implementing an effective reporting system is a continuous effort that requires us to anticipate and react to
changes in our business and the economic and regulatory environments and to devote significant resources to maintain a financial reporting system that
is adequate to satisfy our reporting obligations. See “Item 3. Key Information— D. Risk Factors — We have identified material weaknesses in our
internal control over financial reporting, and if we cannot maintain effective internal controls or provide reliable financial and other information in the
future, investors may lose confidence in the reliability of our consolidated financial statements, which could result in a decrease in the value of our
ADSs.” If we fail to implement and maintain an effective system of internal control, we may be unable to accurately report our results of operations or
prevent fraud or fail to meet our reporting obligations, and investor confidence and the market price of our ADSs may be materially and adversely
affected.
159

C. Attestation Report of the Registered Public Accounting Firm
See Item 18. Financial Statements.
D. Changes in Internal Control Over Financial Reporting
During 2018, the company made changes to its internal control over financing reporting to address material weaknesses identified during
2017. The company continued implementing its remedial plan as described in Item 15.B. of the annual report for the 2017 fiscal year. Specifically, the
company addressed material weaknesses in its control environment, the timely accounting for signed contracts, controls over the accounting of
inventory, and the role of the internal audit function, as follows:
During 2017 and 2018, the company, through its senior management, began to implement programs to strengthen the tone of the top of the
organization affecting how the organization performs risk management, financial analysis, accounting and financial reporting. These activities have
included during 2018: the launch of an updated code of ethics to all officers and employees; ethics training programs, which have been completed by
90% of employees; conflicts of interest declarations for all employees; the strengthening of our hiring process; the launch of a communication program
for all employees with respect to the company’s compliance policies; the implementation of an updated organizational structure, including the review
and adjustment of the delegation of authority; the development of a plan to implement the new internal control system across the company, the
completion of which is ongoing; and the implementation of a due diligence program to third parties (partners and suppliers) as part of the
implementation of a fraud risk program.
During 2018, the company began the review of the main processes to identify deficiencies in controls to address risks related to material
misstatements. This review included the following processes: accounting closing, inventory, signing of contracts, segregation of duties, project
management, and new business development.
One of the material weaknesses identified in 2017 was the timely accounting for signed contracts. During 2018, this process was reviewed and
changes were made to ensure that all signed contracts were accounted for on a timely basis. The deficiencies identified in 2017 with respect to the
accounting for inventory were related to inventory reviews that were not performed on a timely basis. During 2018, inventory reviews were performed
in all our applicable subsidiaries and actions were taken to address discrepancies.
Additionally, the company’s internal audit function was reorganized. A new Chief Executive Auditor, who reports directly to the Audit
Committee, was appointed in January 2018. Additionally, we hired personnel within the internal audit department with the appropriate training and
experience in auditing to ensure that our internal control system and processes are executed adequately.
160
ITEM 16. [RESERVED]
ITEM 16A. AUDIT COMMITTEE FINANCIAL EXPERT
Mr. Manuel del Río qualifies as an “audit committee financial expert” and is independent under the Exchange Act.
ITEM 16B. CODE OF BUSINESS CONDUCT AND ETHICS
We are committed to responsible, honest, transparent and ethical conduct. Our management system enables us to communicate our
corporate values and principles to all levels of the organization, offers a confidential reporting mechanism (canal ético), and has a governance structure,
independent from management, to investigate and remedy potential breaches of our code.
We have adopted a code of business conduct and it applies to our directors, officers and employees. Our code of business conduct is
available on our website www.granaymontero.com.pe. Information on our website is not incorporated by reference in this annual report.
If we make any substantive amendment to the code of business conduct or if we grant any waiver, including any implicit waiver, from a
provision of the code of business conduct that applies to our chief executive officer, chief financial officer or controller, we will disclose the nature of
such amendment or waiver in our website or in our next Form 20-F to be filed with the SEC to the extent required under applicable rules. During the
year ended December 31, 2018, no such waiver was granted. Certain amendments to our code of business conduct were made as described below.
In 2015, we reinforced our ethics management system as a preventative measure. Our board of directors approved an anti-corruption
compliance program, which establishes the leadership and commitment of senior management on this matter, defines supervisory bodies and the
reporting lines, establishes new policies and procedures, identifies additional internal controls, and proposes training plans for the entire organization.
This program applies to all companies in the group and to any third parties that may act on our behalf. Within the program, the anti-corruption policy
provides the guidelines required to avoid acts of corruption in our business or in our relations with any state entity, and reinforces the obligation to have
accounting records and internal controls.
During 2016, our efforts regarding compliance and prevention were focused on the deployment of the anti-corruption program across our
companies. As part of this process, we implemented in our web-based platform a training program with respect to the principal anti-corruption
guidelines. Additionally, we have included anti-corruption matters in our board of directors’ periodic agenda, and we also have established a compliance
officer who reports to the Audit and Processes Committee. We continue performing due diligence in connection with acquisitions, and used the “Know
Your Partner” initiative (2015), through which preventive assessments were performed on potential strategic partners, suppliers and potential recipients
of grants in 2016. In this regard, anti-corruption clauses were included in contracts with suppliers and a specific procedure was implemented for
charitable donations.
In March 2017, our board of directors created the Risk, Compliance and Sustainability Committee to enhance our ethics and compliance
program. That committee then created the Risk and Compliance Corporate Function, which reports to the committee. A new Chief Risk and Compliance
Officer for the group was appointed on July 1, 2017 to enhance and develop further our ethics and compliance program. Our board of directors also
appointed an External Advisory Council to provide the Board with independent advice and recommendations on corporate governance and compliance
matters. The first meeting was held in Lima on October 10, 2017. In 2017, we launched training sessions, combined with specialized courses addressed
to middle and senior managers as well as to all members of our board of directors.
161

On February 5, 2018 we launched a revised, risk-based due diligence corporate policy with respect to our employees and existing and
potential third-parties. The first phase began immediately and we renewed the due diligence with our partners and customers. We also trained our
commercial force and managers on the new policy and launched a modern, risk-based approach supported by proven tools that have been worldwide.
We are currently undergoing the second phase, which was launched in September 2018 and focuses on due diligence with our suppliers and
sub-contractors.
On the May 11, 2018, the chairman of our board of directors launched the group’s new Code of Business Conduct. We consolidated, in a
single, enhanced document, our previous Ethics Charter and our Code of Conduct, and complemented it with additional relevant topics in accordance
with benchmarks from peer organizations, best practices and guidance from international organizations.
From September to December 2018, 1,200 leaders within our organization were trained through 48 face-to-face sessions in matters related
to compliance, such as conflict of interest, ethical management and anti-corruption norms. The Risks and Compliance staff, as well as the Chief Risk
and Compliance Officer and the Chief Executive Officer conducted the training sessions. Once these face-to-face trainings were carried out, e-learning
trainings were launched to the rest of our employees. 88% of the target group had completed the e-learning trainings by December 31, 2018.
On October 29, 2018, we concluded the recruitment of all approved positions for the Risk and Compliance function across Peru, Colombia
and Chile. The function is independent from management and reports directly to the Risk, Compliance and Sustainability Committee of the Board of
Directors through the Chief Risk and Compliance Officer. The function is structured in four areas (each area has a manager in charge and a specialist):
(i) Risks and Monitoring, (ii) Ethics and Training, (iii) Due Diligence and Research, (iv) Integration into the Business Area, and (v) Country
Compliance Officer. The staff of the Risk and Compliance function bring various experience in matters of risk, ethics and compliance at both the
national and international level and have completed undergraduate and post-graduate studies in a variety of areas, including risk, law, administration,
finance, accounting, auditing, economics, engineering, compliance, ethics and human resources.
In November 2018, we initiated an active corporate communication campaign to re-launch our confidential reporting mechanism (canal
ético). This included re-iterating our company values and encouraging employees and management to report cases where they have identified activities
outside of those values. In 2018, this confidential reporting mechanism increased the number of cases reported, which has helped to strengthen our
internal controls.
ITEM 16C. PRINCIPAL ACCOUNTANT FEES AND SERVICES
Audit and Non-Audit Fees
The following table sets forth the fees billed to us by our current independent registered public accounting firm, Moore Stephens, in
connection with its audit of our annual consolidated financial statements for the fiscal years ended December 31, 2017 and 2018, which are included in
this report.
For the year ended December 31,
2017 2018
(in thousands of S/.)
Audit fees 4,932.4 5,406
Audit-related fees — —
Tax fees — —
All other fees — —
Total fees 4,932.4 5,406
Audit fees in the table above are the aggregate fees billed and billable by our independent auditor in connection with the audit of, or audit
procedures in connection with, our annual consolidated financial statements and review of our internal controls.
Audit-related fees in the tables above relate to accounting consultation.
Tax fees in the tables above are fees billed relating to tax compliance services.
Our Audit and Process Committee is responsible for the oversight of the independent auditors and has established pre-approval procedures
for the engagement of our registered public accounting firm for audit and non-audit services. Such services can only be contracted if they are approved
by the Audit and Process Committee, they comply with the restrictions provided under applicable rules and they do not jeopardize the independence of
our auditors. All services provided by our current independent auditor for our fiscal years ended December 31, 2017 and 2018 were pre-approved by our
Audit and Process Committee.
162

ITEM 16D. EXEMPTIONS FROM THE LISTING STANDARDS FOR AUDIT COMMITTEES
None.
ITEM 16E. PURCHASES OF EQUITY SECURITIES BY THE ISSUER AND AFFILIATED PURCHASERS
None.
ITEM 16F. CHANGE IN REGISTRANT’S CERTIFYING ACCOUNTANT
(a) Dismissal of Independent Registered Public Accounting Firm
Our company and Gaveglio, Aparicio y Asociados S.C. de R.L., a member firm of PricewaterhouseCoopers (“PwC”) determined that PwC
lacked independence from our company with respect to our company’s financial statements for the fiscal year 2016 as a consequence of non-audit
services provided by PwC to our company beginning in the fourth quarter of the fiscal year 2016. The services related to our company’s testing of
internal controls in accordance with the Sarbanes-Oxley Act. As a result, our company and PwC mutually agreed on October 4, 2017 to our company’s
dismissal of PwC as auditor of our company’s consolidated financial statements for the fiscal year 2016. Our company’s Audit and Process Committee
and Board of Directors participated in and approved the decision to dismiss PwC and recommended the appointment of our company’s new independent
registered public accounting firm.
(b) New Audit of 2015
The independence issue described above did not affect the independence of PwC with respect to PwC’s audit of our company’s consolidated
financial statements for the fiscal years 2014 and 2015. The audit reports of PwC on our company’s consolidated financial statements for the fiscal years
2014 and 2015 did not contain any adverse opinion or a disclaimer of opinion and were not qualified or modified as to uncertainty, audit scope or
accounting principles.
On or about March 23, 2018, PwC informed our company that it would not authorize the use of its 2015 audit opinion in connection with
the filing of our company’s annual report on Form 20-F without conducting substantial additional procedures. PwC could not give any assurance as to
when it could complete such additional procedures and stated it could take several months. PwC informed our company that professional standards
required the performance of substantial additional procedures with respect to the 2015 consolidated financial statements because of publicly reported
procedural developments since the firm’s dismissal in October 2017 concerning the cumulative effect of the decision of the Peruvian court to include
three former executives of our company and our company in its ongoing criminal investigation relating to projects involving Odebrecht, coupled with a
2015 agreement that was first provided to PwC in May 2017 while PwC was conducting the audit for the fiscal year 2016.
On April 17, 2018, to avoid further delay, our company appointed Moore Stephens SCAI S.A. (“Moore Stephens”) as its new independent
registered public accounting firm for the fiscal year 2015 and announced that the previously issued consolidated financial statements of our company for
the 2015 fiscal year (and the related audit opinion of PwC) should no longer be relied upon. Among other factors, as our company’s current auditor,
Moore Stephens, was in the process of completing its audit work with respect to the 2016 fiscal year (see (d) below) and thus, in our company’s view,
could more timely and efficiently complete the 2015 audit processes as well.
(c) Disagreements and Reportable Events
During the 2015 and 2016 fiscal years and the subsequent interim period through October 4, 2017, there were no “disagreements” (as
described in Item 16.F(a)(1)(iv) of Form 20-F) with PwC on any matter of accounting principles or practices, financial statement disclosure or auditing
scope or procedures, which disagreements, if not resolved to the satisfaction of PwC, would have caused them to make reference thereto in their reports
on the financial statements for such years.
During the 2015 and 2016 fiscal years and the subsequent interim period through October 4, 2017, there were “reportable events” (as that
term is defined in Item 16.F(a)(1)(v) of Form 20-F) as follows: (i) as disclosed in our company’s annual report on Form 20-F for the 2015 fiscal year,
our company’s management and PwC each concluded that our company did not maintain effective internal control over financial reporting as of
December 31, 2015, because of a material weakness related to inadequate controls over segregation of duties in certain activities in some subsidiaries;
(ii) PwC advised our company that our company did not maintain effective internal control over financial reporting as of December 31, 2016 as a result
of the material weaknesses described in Item 15.B of our company’s annual report on Form 20-F for the fiscal year ended December 31, 2016, except
that the following items were not advised by PwC: (1) inadequate oversight by the Audit Committee regarding the role of the Internal Audit
Department, (2) a control environment not always sufficient to ensure adequate enterprise risk management (including fraud risk), and (3) the
conclusion which states that there
163

were no significant impacts in our consolidated financial statements because clarifying addendums were signed by the parties; and (iii) at the time of
PwC’s dismissal, as described in (a) above, PwC’s audit of the consolidated financial statements for the fiscal year 2016 was not complete, including the
final resolution of matters related to the accounting for two contracts and any related implications from the finalization of the internal investigation
conducted by our company.
The Audit and Process Committee of our company discussed the subject matter of each of the reportable events with PwC. Our company
authorized PwC to fully respond to the inquiries of the successor accountant concerning these reportable events.
Our company has requested that PwC furnish it with a letter addressed to the SEC stating whether or not it agrees with the above statements.
A copy of such letter, dated May 15, 2018, is filed as Exhibit 16.01 to our company’s annual report on Form 20-F for the fiscal year ended
December 31, 2016.
(d) Appointment of New Independent Registered Public Auditing Firm
A shareholders’ meeting of our company held on November 2, 2017 appointed Moore Stephens as the new independent auditor for the
fiscal year 2016.
On April 17, 2018, the Audit and Process Committee of our company appointed Moore Stephens to audit the 2015 fiscal year. The
shareholders’ meeting of our company held on May 14, 2018 ratified the appointment.
During the 2015 and 2016 fiscal years and the subsequent interim period through April 16, 2018, our company did not consult with Moore
Stephens regarding either (i) the application of accounting principles to a specified transaction, either completed or proposed, or the type of audit
opinion that might be rendered on our company’s consolidated financial statements, other than in connection with the ongoing audit work by Moore
Stephens of our company’s consolidated financial statements for the 2016 fiscal year; or (ii) any matter that was either the subject of a disagreement or a
reportable event.
ITEM 16G. CORPORATE GOVERNANCE
We are a “foreign private issuer” within the meaning of the NYSE corporate governance standards. Under NYSE rules, a foreign private
issuer may elect to comply with the practices of its home country and not to comply with certain corporate governance requirements applicable to U.S.
companies with securities listed on the exchange.
We currently follow certain Peruvian practices concerning corporate governance and intend to continue to do so. There are significant
differences in the Peruvian corporate governance practices as compared to those followed by United States domestic companies under the NYSE’s
listing standards.
The NYSE listing standards provide that the board of directors of a U.S. listed company must have a majority of independent directors.
Under Peruvian corporate governance practices, a Peruvian company is not required to have a majority of independent members on its board of
directors. However we currently have a majority of independent directors on our board in accordance with NYSE independence standards. Our Audit
and Process Committee is comprised of independent directors under SEC rules applicable to foreign private issuers. Additionally, our Human Resource
Management Committee is currently comprised of independent directors, while our Investment Committee and our Risk, Compliance and Sustainability
Committee are currently comprised of a majority of independent directors, in each case under NYSE independence standards. Our Human Resource
Management Committee is not the equivalent of, or wholly comparable to, a U.S. compensation committee.
The listing standards for the NYSE also require that U.S. listed companies have a nominating/corporate governance committee and a
compensation committee (in addition to an audit committee). Each of these committees must consist solely of independent directors and must have a
written charter that addresses certain matters specified in the listing standards. Under Peruvian law, a Peruvian company may, but is not required to,
form such committees, which may be composed partially or entirely of non-independent directors. Accordingly, we do not have a nominating/corporate
governance committee and a compensation committee.
In addition, NYSE rules require the independent non-executive directors of U.S. listed companies to meet on a regular basis without
management being present. There is no similar requirement under Peruvian law, accordingly, we do not have such meetings.
The NYSE’s listing standards also require U.S. listed companies to adopt and disclose corporate governance guidelines. In July 2002, the
Peruvian Securities Commission and a committee comprised of regulatory agencies and associations prepared and published a list of suggested
non-mandatory corporate governance guidelines called the “Principles of Good Governance for Peruvian Companies.” These principles are disclosed on
the Peruvian Securities Commission web page http://www.smv.gob.pe and the Lima Stock Exchange web page http://www.bvl.com.pe. Although we
have implemented a number of these measures and have been selected to form part of the Best Corporate Governance Practices Index of the Lima Stock
Exchange, we are not required to comply with the referred corporate governance guidelines by law or regulation.
164
ITEM 16H. MINE SAFETY DISCLOSURE
Not applicable.
ITEM 17. FINANCIAL STATEMENTS
Not applicable.
ITEM 18. FINANCIAL STATEMENTS
See our consolidated financial statements beginning at page F-1 of this annual report. See also Oil and Gas Supplementary Schedules
beginning on page S-1.
ITEM 19. EXHIBITS
The agreements and other documents filed as exhibits to this annual report are not intended to provide factual information or other
disclosure other than with respect to the terms of the agreements or other documents themselves, and you should not rely on them for that purpose. In
particular, any representations and warranties made by us in these agreements or other documents were made solely within the specific context of the
relevant agreement or document and for the benefit of the other parties to the agreements and they may not describe the actual state of affairs as of the
date they were made or at any other time.
Exhibit Number Description
1.01* By-Laws of the Registrant, as currently in effect
2.01** Registrant’s Form of American Depositary Receipt
2.02** Deposit Agreement, dated as of December 31, 2018, among the Registrant, The Bank of New York Mellon, as depositary,
and all owners and holders from time to time of American depositary shares issued thereunder
8.01 Subsidiaries of the Registrant
10.01*** Credit Agreement, dated as of December 10, 2015, by and among, inter alia, Graña y Montero, as borrower, and Credit
Suisse AG, Cayman Islands Branch, as administrative agent.
10.01.1*** Amendment No. 1, dated as of December 22, 2015, to the Credit Agreement, dated as of December 10, 2015, by and
among, inter alia, Graña y Montero, as borrower, and Credit Suisse AG, Cayman Islands Branch, as administrative agent.
10.01.2*** Amendment No. 2, dated as of February 1, 2016, to the Credit Agreement, dated as of December 10, 2015, by and among,
inter alia, Graña y Montero, as borrower, and Credit Suisse AG, Cayman Islands Branch, as administrative agent.
10.01.3*** Amendment No. 3, dated as of February 12, 2016, to the Credit Agreement, dated as of December 10, 2015, by and among,
inter alia, Graña y Montero, as borrower, and Credit Suisse AG, Cayman Islands Branch, as administrative agent.
10.01.4*** Amendment No. 4, dated as of February 29, 2016, to the Credit Agreement, dated as of December 10, 2015, by and among,
inter alia, Graña y Montero, as borrower, and Credit Suisse AG, Cayman Islands Branch, as administrative agent.
10.01.5*** Amendment No. 5, dated as of April 15, 2016, to the Credit Agreement, dated as of December 10, 2015, by and among,
inter alia, Graña y Montero, as borrower, and Credit Suisse AG, Cayman Islands Branch, as administrative agent.
10.01.6*** Waiver and Amendment No. 6, dated as of September 15, 2016, to the Credit Agreement, dated as of December 10, 2015,
by and among, inter alia, Graña y Montero, as borrower, and Credit Suisse AG, Cayman Islands Branch, as administrative
agent.
165

Exhibit Number Description
10.01.7*** Amendment No. 7, dated as of December 16, 2016, to the Credit Agreement, dated as of December 10, 2015, by and among,
inter alia, Graña y Montero, as borrower, and Credit Suisse AG, Cayman Islands Branch, as administrative agent.
10.01.8*** + Amendment No. 8, dated as of June 27, 2017, to the Credit Agreement, dated as of December 10, 2015, by and among, inter
alia, Graña y Montero, as borrower, and Credit Suisse AG, Cayman Islands Branch, as administrative agent.
10.01.9*** Amendment No. 9, dated as of October 12, 2017, to the Credit Agreement, dated as of December 10, 2015, by and among,
inter alia, Graña y Montero, as borrower, and Credit Suisse AG, Cayman Islands Branch, as administrative agent.
10.02*** Loan Agreement, dated as of June 27, 2017, by and among, inter alia, Graña y Montero, as borrower, and Natixis, New York
Branch, as administrative agent.
10.02.1*** Waiver and Amendment, dated as of March 26, 2018, to the Credit Agreement, dated as of June 27, 2017, by and among, inter
alia, Graña y Montero, as borrower, and Natixis, New York Branch, as administrative agent.
10.03*** English translation of Financial Stability Framework Agreement, dated as of July 31, 2017, by and among, inter alia, Graña y
Montero, as borrower, and Scotiabank Perú S.A.A., Banco Internacional del Perú S.A.A., BBVA Banco Continental, Banco de
Crédito del Perú, Citibank del Perú S.A. and Citibank, N.A., as lenders.
10.04*** English translation of Section 20 of Concession Agreement, dated as of July 22, 2014, by and among the Peruvian Ministry of
Energy and Mines, as contracting authority and the concessionaire party thereto.
10.05*** English translation of Memorandum of Understanding, dated as of September 26, 2017, by and among Graña y Montero,
Negocios de Gas S.A., Enagás S.A., Odebrecht S.A., and Inversiones en Infraestructura de Transporte por Ductos S.A.C.
10.05.1*** English translation of Rights Subordination Agreement, dated as of April 29, 2016, by and among Odebrecht Latinvest Peru
Ductos, S.A., Odebrecht S.A., Enagás, S.A., Graña y Montero, Negocios de Gas S.A., Inversiones en Infraestructura de
Transporte por Ductos S.A.C., and Gasoducto Sur Peruano S.A.
10.05.1.1*** English translation of Addendum No. 1, dated as of June 24, 2016, to the Rights Subordination Agreement, dated as of
April 29, 2016, by and among, inter alia, Odebrecht Latinvest Peru Ductos, S.A., Odebrecht S.A., Enagás, S.A., Graña y
Montero, GyM S.A., Negocios de Gas S.A., Inversiones en Infraestructura de Transporte por Ductos S.A.C., Gasoducto Sur
Peruano S.A., Odebrecht Perú Ingeniería y Construcción S.A.C., and Constructora Norberto Odebrecht S.A., Sucursal del
Perú.
10.05.1.2*** English translation of Addendum No. 2 and Assignment Agreement, dated as of August 11, 2016, to the Rights Subordination
Agreement, dated as of April 29, 2016, by and among, inter alia, Odebrecht Latinvest Peru Ductos, S.A., Odebrecht S.A.,
Enagás, S.A., Graña y Montero, GyM S.A., Negocios de Gas S.A., Inversiones en Infraestructura de Transporte por Ductos
S.A.C., Gasoducto Sur Peruano S.A., Odebrecht Perú Ingeniería y Construcción S.A.C., and Constructora Norberto Odebrecht
S.A., Sucursal del Perú.
10.05.1.3*** English translation of Modification to Addendum No. 2 and Assignment Agreement, dated as of October 25, 2016, to the
Rights Subordination Agreement, dated as of April 29, 2016, by and among, inter alia, Odebrecht Latinvest Peru Ductos, S.A.,
Odebrecht S.A., Enagás, S.A., Graña y Montero, GyM S.A., Negocios de Gas S.A., Inversiones en Infraestructura de
Transporte por Ductos S.A.C., Gasoducto Sur Peruano S.A., Odebrecht Perú Ingeniería y Construcción S.A.C., and
Constructora Norberto Odebrecht S.A., Sucursal del Perú.
12.01 Certification of the Chief Executive Officer pursuant to Section 302 of the Sarbanes-Oxley Act
12.02 Certification of the Chief Financial Officer pursuant to Section 302 of the Sarbanes-Oxley Act
13.01**** Certification of the Chief Executive Officer pursuant to 18 U.S.C. Section 1350, as adopted pursuant to Section 906 of the
Sarbanes-Oxley Act
13.02**** Certification of the Chief Financial Officer pursuant to 18 U.S.C. Section 1350, as adopted pursuant to Section 906 of the
Sarbanes-Oxley Act
16.01*** Letter dated May 15, 2018 by Gaveglio, Aparicio y Asociados S.C. de R.L., a member firm of PricewaterhouseCoopers, as
required by Item 16F of Form 20-F.
101. INS XBRL Instance Document
101. SCH XBRL Taxonomy Extension Schema Document
166

Exhibit Number Description
101. CAL XBRL Taxonomy Extension Calculation Linkbase Document
101. DEF XBRL Taxonomy Extension Definition Linkbase Document
101. LAB XBRL Taxonomy Extension Label Linkbase Document
101. PRE XBRL Taxonomy Extension Presentation Linkbase Document
* Incorporated herein by reference to exhibit 1.01 of the Registrant’s Form 20-F (File No. 333-172855) filed with the SEC on April 30, 2014.
** Incorporated herein by reference to exhibit 1 to the Registrant’s registration statement on Form F-6 (File No. 333-228727) filed with the SEC on
December 10, 2018.
*** Incorporated herein by reference to the Registrant’s Form 20-F (File No. 333-172855) filed with the SEC on May 15, 2018.
**** This certification will not be deemed “filed” for purposes of Section 18 of the Exchange Act (15 U.S.C. §78r), or otherwise subject to the liability
of that section. Such certification will not be deemed to be incorporated by reference into any filing under the Securities Act or the Exchange Act,
except to the extent that the Registrant specifically incorporates it by reference.
+ Confidential treatment requested.
167

(All amounts expressed in thousands of S/ unless otherwise stated)
GRAÑA Y MONTERO S.A.A. AND SUBSIDIARIES
CONSOLIDATED FINANCIAL STATEMENTS
DECEMBER 31, 2016, 2017 AND 2018

GRAÑA Y MONTERO S.A.A. AND SUBSIDIARIES
CONSOLIDATED FINANCIAL STATEMENTS
DECEMBER 31, 2016, 2017 AND 2018
CONTENTS Page
Report of Independent Registered Public Accounting Firm 1-2
Consolidated Statement of Financial Position 3
Consolidated Statement of Income 4
Consolidated Statement of Comprehensive Income 5
Consolidated Statement of Changes in Equity 6
Consolidated Statement of Cash Flows 7-8
Notes to the Consolidated Financial Statements 9 – 112
S/ = Peruvian Sol
US$ = United States dollar
Report of Independent Registered Public Accounting Firm
To the Board of Directors and Shareholders of Graña y Montero S.A.A. and its subsidiaries
Opinions on the Financial Statements and Internal Control over Financial Reporting
We have audited the accompanying consolidated statements of financial position of Graña y Montero S.A.A. and its subsidiaries (the “Company”) as of
December 31, 2018 and 2017 and the related consolidated statements of income, comprehensive income, changes in equity, and cash flows for each of
the three years in the period ended December 31, 2018, and the related notes. In our opinion, the financial statements present fairly, in all material
respects, the financial position of the Company as of December 31, 2018 and 2017 and the results of their operations and their cash flows for each of the
three years in the period ended December 31, 2018, in conformity with International Financial Reporting Standards as issued by the International
Accounting Standards Board. Also, in our opinion, the Company did not maintain, in all material respects, effective internal control over financial
reporting as of December 31, 2018, based on criteria established in Internal Control—Integrated Framework (2013), issued by the Committee of
Sponsoring Organizations of the Treadway Commission (COSO) because the following material weaknesses in internal control over financial reporting
existed as of that date:
- Deficiencies in a formally established and documented process for enterprise and fraud risk management.
- Deficiencies in the design and operational effectiveness of controls over segregation of duties to help ensure that personnel with potential conflicts
were not involved in incompatible activities.
- Deficiencies in the design and operational effectiveness of the controls established in the accounting closing process with respect to the preparation
and review of the annual and interim financial statements, including controls over the review, approval, and supporting documentation related to
journal entries.
- Deficiencies in the design and operational effectiveness of controls established with respect to the recognition of revenue and determination of
related estimates, including construction contract revenues and contingent revenues.
- Deficiencies in the operational effectiveness of controls over SOX compliance.
A material weakness is a deficiency, or a combination of deficiencies, in internal control over financial reporting, such that there is a reasonable
possibility that a material misstatement of the annual or interim financial statements will not be prevented or detected on a timely basis. The material
weaknesses referred to above are described in Management Report on Internal Control over Financial Reporting appearing under Item 15. We
considered these material weaknesses in determining the nature, timing, and extent of audit tests applied in our audit of the 2018 consolidated financial
statements, and our opinion regarding the effectiveness of the Company’s internal control over financial reporting does not affect our opinion on those
consolidated financial statements.
A company’s internal control over financial reporting is a process designed to provide reasonable assurance regarding the reliability of financial
reporting and the preparation of financial statements for external purposes in accordance with generally accepted accounting principles. A company’s
internal control over financial reporting includes those policies and procedures that (i) pertain to the maintenance of records that, in reasonable detail,
accurately and fairly reflect the transactions and dispositions of the assets of the company; (ii) provide reasonable assurance that transactions are
recorded as necessary to permit preparation of financial statements in accordance with generally accepted accounting principles, and that receipts and
expenditures of the company are being made only in accordance with authorizations of management and directors of the company; and (iii) provide
reasonable assurance regarding prevention or timely detection of unauthorized acquisition, use, or disposition of the company’s assets that could have a
material effect on the financial statements.
Because of its inherent limitations, internal control over financial reporting may not prevent or detect misstatements. Also, projections of any evaluation
of effectiveness to future periods are subject to the risk that controls may become inadequate because of changes in conditions, or that the degree of
compliance with the policies or procedures may deteriorate.
- 1 -

Emphasis of Certain Matters
As discussed in Note 1 to the financial statements, Graña y Montero S.A.A. has been included as civilly liable third party in the investigations in
connection with the IIRSA Project and GyM S.A. (a subsidiary of Graña y Montero S.A.A.) has been included as civilly liable third party in the IIRSA
project, the Construction of the Electric Train project and the Constructors’ Club. The Note also states that GyM S.A. is being investigated by a
Peruvian regulatory entity for the existence of an alleged cartel called the Constructors’ Club. The Company’s Management does not rule out the
possibility of finding, in the future, adverse evidence, nor does it rule out that authorities or third parties will find, in the future, adverse evidence not
currently known to date during the investigations being conducted.
As discussed in Note 2.31 to the consolidated financial statements, the Company has restated the consolidated statement of income for the year ended
December 31, 2017, which included the net gain on the sale of the former subsidiary GMD (S/218.3 million (US$64.6 million)) in the “Gain from the
sale of investments” line item rather than the “Profit from discontinued operations” line item. While there was no effect of the restatement on Net profit,
the restatement had the effect of reducing the operating profit, (loss) profit from continuing operations and earnings (loss) per share from continuing
operations attributable to owners for 2017.
Basis for Opinion
The Company’s management is responsible for these financial statements, for maintaining effective internal control over financial reporting, and for its
assessment of the effectiveness of internal control over financial reporting included in the Management’s Report on Internal Control over Financial
Reporting referred to above. Our responsibility is to express opinions on these financial statements and on the Company’s internal control over financial
reporting based on our audits.
We are a public accounting firm registered with the Public Company Accounting Oversight Board (United States) (“PCAOB”) and are required to be
independent with respect to the Company in accordance with the U.S. federal securities laws and the applicable rules and regulations of the Securities
and Exchange Commission and the PCAOB.
We conducted our audits in accordance with the standards of the PCAOB. Those standards require that we plan and perform the audit to obtain
reasonable assurance about whether the financial statements are free of material misstatement, whether due to error or fraud, and performing procedures
that respond to those risks. Such procedures included examining, on a test basis, evidence regarding the amounts and disclosures in the financial
statements. Our audits also included evaluating the accounting principles used and significant estimates made by management, as well as evaluating the
overall presentation of the financial statements. Our audit of internal control over financial reporting included obtaining an understanding of internal
control over financial reporting, assessing the risk that a material weakness exists, and testing and evaluating the design and operating effectiveness of
internal control based on the assessed risk. Our audits also included performing such other procedures as we considered necessary in the circumstances.
We believe that our audits provide a reasonable basis for our opinions.
/s/ Moore Stephens SCAI S.A.
Moore Stephens SCAI S.A.
We have served as the Company’s auditor since 2017.
Bogota, Colombia
April 30, 2019
- 2 -

GRAÑA Y MONTERO S.A.A. AND SUBSIDIARIES
CONSOLIDATED STATEMENT OF FINANCIAL POSITION
(All amounts are expressed in thousands of S/ unless otherwise stated)
The accompanying notes on pages 9 to 113 are an integral part of the consolidated financial statements.
- 3 -
ASSETS
As at
December 31,
As at
December 31,
Note 2017 2018
Current assets
Cash and cash equivalents 9 626,180 801,140
Financial asset at fair value
through profit or loss 181 —
Trade accounts receivables, net 11 1,515,673 1,007,828
Work in progress, net 12 61,804 28,538
Accounts receivable from
related parties 13 100,752 34,903
Other accounts receivable 14 765,445 588,451
Inventories, net 15 770,711 514,047
Prepaid expenses 33,478 10,549
3,874,224 2,985,456
Non-current assets classified as
held for sale 37 17,722 247,798
Total current assets 3,891,946 3,233,254
Non-current assets
Long-term trade accounts
receivable, net 11 907,587 1,020,067
Long-term work in progress,
net 12 28,413 32,212
Long-term accounts receivable
from related parties 13 773,930 778,226
Prepaid expenses 38,082 33,697
Other long-term accounts
receivable 14 470,852 302,957
Investments in associates and
joint ventures 16 268,671 257,765
Investment property 45,687 29,133
Property, plant and equipment,
net 17 865,735 470,554
Intangible assets, net 18 940,070 847,095
Deferred income tax asset 25 436,697 425,436
Total non-current assets 4,775,724 4,197,142
Total assets 8,667,670 7,430,396
LIABILITIES AND EQUITY
As at
December 31,
As at
December 31,
Note 2017 2018
Current liabilities
Borrowings 19 1,056,764 826,474
Bonds 20 36,655 39,167
Trade accounts payable 21 1,453,046 1,079,531
Accounts payable to related
parties 13 55,174 55,941
Current income tax 85,543 25,807
Other accounts payable 22 848,500 632,669
Provisions 23 13,503 6,197
Total current liabilities 3,549,185 2,665,786
Non-current liabilities classified
as held for sale 37 — 225,828
Total current liabilities 3,549,185 2,891,614
Non-current liabilities
Borrowings 19 633,299 376,198
Long-term bonds 20 910,912 897,875
Other long-term accounts
payable 22 852,473 574,110
Long-term accounts payable to
related parties 13 25,954 21,849
Provisions 23 33,914 103,411
Derivative financial instruments 383 61
Deferred income tax liability 25 72,472 75,347
Total non-current liabilities 2,529,407 2,048,851
Total liabilities 6,078,592 4,940,465
Equity 24
Capital 660,054 729,434
Legal reserve 132,011 132,011
Voluntary reserve 29,974 29,974
Share Premium 881,795 992,144
Other reserves (169,671) (170,620)
Retained earnings 589,167 375,417
Equity attributable to controlling
interest in the Company 2,123,330 2,088,360
Non-controlling interest 465,748 401,571
Total equity 2,589,078 2,489,931
Total liabilities and equity 8,667,670 7,430,396

GRAÑA Y MONTERO S.A.A. AND SUBSIDIARIES
CONSOLIDATED STATEMENT OF INCOME
(All amounts are expressed in thousands of S/ unless otherwise stated)
For the year
ended December 31,
Note 2016 2017 2018
(as restated)
Revenues from construction activities 2,713,013 2,214,108 1,961,100
Revenues from services provided 869,106 956,300 1,003,623
Revenue from real estate and sale of goods 555,190 843,605 934,739
4,137,309 4,014,013 3,899,462
Cost of construction activities (2,683,703) (2,107,206) (1,921,112)
Cost of services provided (763,193) (770,792) (741,172)
Cost of real estate and goods sold (374,324) (633,563) (562,689)
27 (3,821,220) (3,511,561) (3,224,973)
Gross profit 316,089 502,452 674,489
Administrative expenses 27 (278,303) (322,454) (278,433)
Other income and expenses 29 (22,360) (32,869) (61,335)
Gain (loss) from the sale of investments 46,336 34,545 (7)
Operating profit 61,762 181,674 334,714
Financial expenses 28 (198,055) (150,777) (247,982)
Financial income 28 18,225 13,742 50,925
Share of the profit or loss in associates and joint ventures 16 a) b) (590,066) 473 (3,709)
(Loss) profit before income tax (708,134) 45,112 133,948
Income tax 30 152,182 (46,305) (113,318)
(Loss) profit from continuing operations (555,952) (1,193) 20,630
Profit from discontinued operations 37 104,354 210,431 36,785
(Loss) profit for the year (451,598) 209,238 57,415
(Loss) profit attributable to:
Owners of the Company (509,699) 148,738 (83,188)
Non-controlling interest 58,101 60,500 140,603
(451,598) 209,238 57,415
Earnings (loss) per share from continuing operations attributable to owners of the Company during
the year 35 (0.772) 0.225 (0.125)
The accompanying notes on pages 9 to 113 are an integral part of the consolidated financial statements.
- 4 -
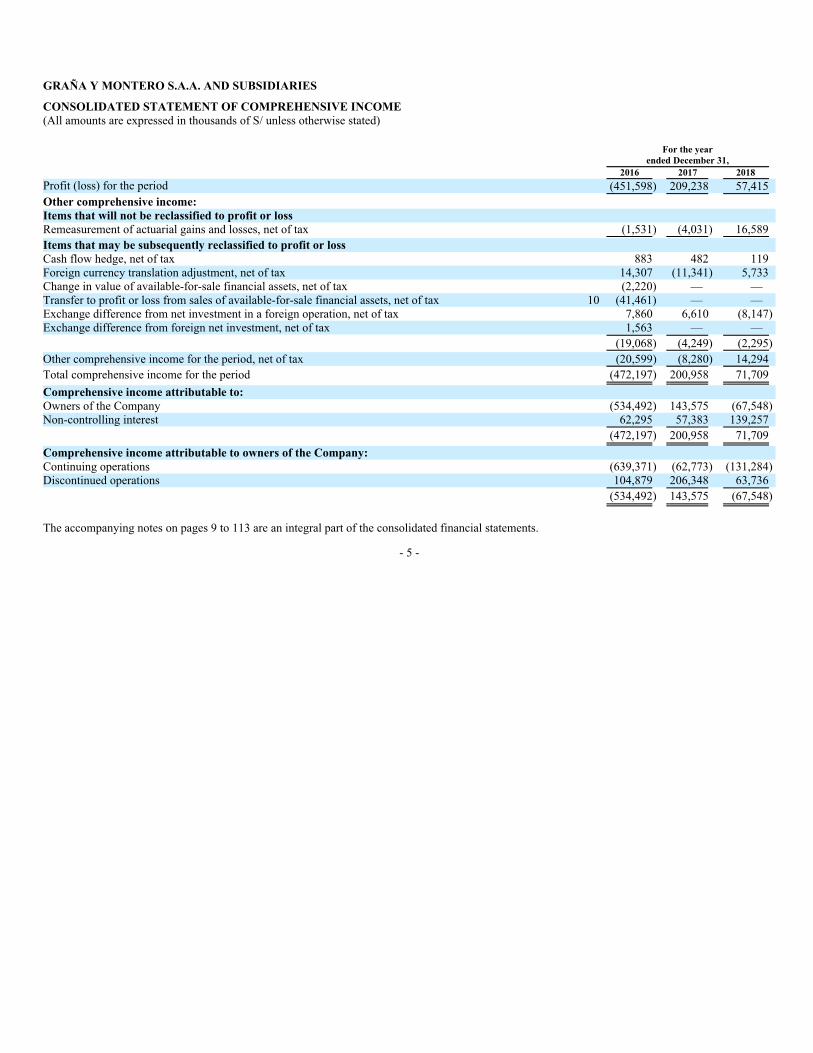
GRAÑA Y MONTERO S.A.A. AND SUBSIDIARIES
CONSOLIDATED STATEMENT OF COMPREHENSIVE INCOME
(All amounts are expressed in thousands of S/ unless otherwise stated)
For the year
ended December 31,
2016 2017 2018
Profit (loss) for the period (451,598) 209,238 57,415
Other comprehensive income:
Items that will not be reclassified to profit or loss
Remeasurement of actuarial gains and losses, net of tax (1,531) (4,031) 16,589
Items that may be subsequently reclassified to profit or loss
Cash flow hedge, net of tax 883 482 119
Foreign currency translation adjustment, net of tax 14,307 (11,341) 5,733
Change in value of available-for-sale financial assets, net of tax (2,220) — —
Transfer to profit or loss from sales of available-for-sale financial assets, net of tax 10 (41,461) — —
Exchange difference from net investment in a foreign operation, net of tax 7,860 6,610 (8,147)
Exchange difference from foreign net investment, net of tax 1,563 — —
(19,068) (4,249) (2,295)
Other comprehensive income for the period, net of tax (20,599) (8,280) 14,294
Total comprehensive income for the period (472,197) 200,958 71,709
Comprehensive income attributable to:
Owners of the Company (534,492) 143,575 (67,548)
Non-controlling interest 62,295 57,383 139,257
(472,197) 200,958 71,709
Comprehensive income attributable to owners of the Company:
Continuing operations (639,371) (62,773) (131,284)
Discontinued operations 104,879 206,348 63,736
(534,492) 143,575 (67,548)
The accompanying notes on pages 9 to 113 are an integral part of the consolidated financial statements.
- 5 -

GRAÑA Y MONTERO S.A.A. AND SUBSIDIARIES
CONSOLIDATED STATEMENT OF CHANGES IN EQUITY
FOR THE YEAR DECEMBER 31, 2016, 2017 AND 2018
(All amounts are expressed in thousands of S/ unless otherwise stated)
Attributable to the controlling interests of the Company
Number
of shares
In thousands Capital
Legal
reserve
Voluntary
reserve
Share
Premium
Other
reserves
Retained
earnings Total
Non-controlling
interest Total
Balances as of January 1, 2016 660,054 660,054 132,011 29,974 897,532 (143,784) 982,987 2,558,774 523,138 3,081,912
(Loss) profit for the year — — — — — — (509,699) (509,699) 58,101 (451,598)
Cash flow hedge — — — — — 839 — 839 44 883
Adjustment for actuarial gains and losses — — — — — — (1,121) (1,121) (410) (1,531)
Foreign currency translation adjustment — — — — — 9,885 — 9,885 4,422 14,307
Change in value of available-for-sale
financial assets — — — — — (2,220) — (2,220) — (2,220)
Transfer to profit or loss for sale of
investment of available-for-sale
financial assets, net of tax — — — — — (41,461) — (41,461) — (41,461)
Exchange difference from net investment
in a foreign operation — — — — — 7,722 — 7,722 138 7,860
Transfer to profit or loss of exchange
difference from net investment in a
foreign operation, net of tax — — — — — 1,563 — 1,563 — 1,563
Comprehensive income of the year — — — — — (23,672) (510,820) (534,492) 62,295 (472,197)
Transactions with shareholders:
- Dividend distribution (Note 36 d) — — — — — — (30,853) (30,853) (25,473) (56,326)
- Contributions (devolution) of
non-controlling shareholders, net (Note
36 c) — — — — — — — — (19,099) (19,099)
- Additional acquisition of non-controlling
interest (Note 36 a) — — — — (15,167) — — (15,167) (35,972) (51,139)
- Sale to non-controlling interest — — — — 99 — — 99 236 335
- Purchase of subsidiaries — — — — — — — — 4,153 4,153
- Deconsolidation of former subsidiary — — — — — — 2,063 2,063 35 2,098
Total transactions with shareholders — — — — (15,068) — (28,790) (43,858) (76,120) (119,978)
Balances as of December 31, 2016 660,054 660,054 132,011 29,974 882,464 (167,456) 443,377 1,980,424 509,313 2,489,737
Balances as of January 1, 2017 660,054 660,054 132,011 29,974 882,464 (167,456) 443,377 1,980,424 509,313 2,489,737
Profit for the year — — — — — — 148,738 148,738 60,500 209,238
Cash flow hedge — — — — — 458 — 458 24 482
Adjustment for actuarial gains and losses — — — — — — (2,948) (2,948) (1,083) (4,031)
Foreign currency translation adjustment — — — — — (9,166) — (9,166) (2,175) (11,341)
Exchange difference from net investment
in a foreign operation — — — — — 6,493 — 6,493 117 6,610
Comprehensive income of the year — — — — — (2,215) 145,790 143,575 57,383 200,958
Transactions with shareholders:
- Dividend distribution (Note 36 d) — — — — — — — — (59,677) (59,677)
- Contributions (devolution) of
non-controlling shareholders, net — — — — — — — — (33,197) (33,197)
- Additional acquisition of non-controlling
interest (Note 36 a) — — — — (669) — — (669) (273) (942)
- Deconsolidation of former subsidiary — — — — — — — — (7,801) (7,801)
Total transactions with shareholders — — — — (669) — — (669) (100,948) (101,617)
Balances as of December 31, 2017 660,054 660,054 132,011 29,974 881,795 (169,671) 589,167 2,123,330 465,748 2,589,078
Balances as of January 1, 2018 660,054 660,054 132,011 29,974 881,795 (169,671) 589,167 2,123,330 465,748 2,589,078
- IFRS adoption — — — — — — (52,564) (52,564) (979) (53,543)
Initial balances restated 660,054 660,054 132,011 29,974 881,795 (169,671) 536,603 2,070,766 464,769 2,535,535
(Loss) profit for the year — — — — — — (83,188) (83,188) 140,603 57,415
Cash flow hedge — — — — — 113 — 113 6 119
Adjustment for actuarial gains and losses — — — — — — 16,589 16,589 — 16,589
Foreign currency translation adjustment — — — — — 6,930 — 6,930 (1,197) 5,733
Exchange difference from net investment
in a foreign operation — — — — — (7,992) — (7,992) (155) (8,147)
Comprehensive income of the year — — — — — (949) (66,599) (67,548) 139,257 71,709
Transactions with shareholders:
- Dividend distribution (Note 36 d) — — — — — — — — (102,772) (102,772)
- Contributions (devolution) of
non-controlling shareholders, net — — — — — — — — (84,442) (84,442)
- Additional acquisition of non-controlling
interest (Note 36 a) — — — — (9,583) — — (9,583) (4,050) (13,633)
- Capital Increase 69,380 69,380 — — 68,223 — — 137,603 — 137,603
- Deconsolidation CAM Group — — — — — — (42,878) (42,878) 18,221 (24,657)
- Deconsolidation Stracon GyM — — — — 51,709 — (51,709) — (29,412) (29,412)
Total transactions with shareholders 69,380 69,380 — — 110,349 — (94,587) 85,142 (202,455) (117,313)
Balances as of December 31, 2018 729,434 729,434 132,011 29,974 992,144 (170,620) 375,417 2,088,360 401,571 2,489,931

The accompanying notes on pages 9 to 113 are an integral part of the consolidated financial statements.
- 6 -

GRAÑA Y MONTERO S.A.A. AND SUBSIDIARIES
(All amounts are expressed in thousands of S/ unless otherwise stated)
CONSOLIDATED STATEMENT OF CASH FLOWS
For the year
ended December 31,
Note 2016 2017 2018
OPERATING ACTIVITIES
(Loss) profit before income tax (603,780) 255,543 170,733
Adjustments to profit not affecting cash flows from operating activities:
Depreciation 27 205,522 199,794 125,419
Amortization of other assets 27 82,743 86,557 112,072
Impairment of inventories 27 36,353 40,908 —
Impairment of accounts receivable and other accounts receivable 27 419,584 19,109 65,076
Reversal of impairment of inventories — — (26,993)
Debt condonation 5.1-f) (431,484) — —
Impairment of property, plant and equipment 27 9,263 14,680 5,664
Impairment of intangible assets 29 54,308 49,609 —
Financial expenses-CCDS 7,004 — —
Expenses for liquidation of works - CCDS 164 — —
Indemnification (33,600) 3,220 686
Profit on fair value of financial asset at fair value through profit or loss 31 (34) —
Change in the fair value of the liability for put option 23 (984) (1,400) (6,122)
Provisions 23 9,486 9,510 75,369
Proceeds from the returned sale of Morelco (6,658) — —
Remeasurement of purchase consideration of Morelco (7,166) — —
Financial expense,net 106,739 138,016 177,649
Other provisions in CCDS 24,915 — —
Share of the profit and loss in associates and joint ventures under the equity method of accounting 16 a) b) 589,710 (1,327) 3,709
Reversal of provisions 23 (17,883) (1,044) (6,218)
Disposal of assets 3,951 5,438 16,327
Disposal of investments 1,227 106 —
(Profit) loss on sale of property, plant and equipment 17 (18,393) (26,883) 7,105
Loss on sale of financial assets at fair value through profit or loss 221 — —
Loss on sale of non-current asset held for sale 22 45 —
(Profit) loss on sale of available-for-sale financial assets 10 (46,337) (25,768) 1,529
Profit on sale of investments in subsidiaries — (244,313) (73,642)
Loss on remeasurement of accounts receivable 76,864 15,807 25,110
Loss on remeasurement of investment 6,832 — —
Net variations in assets and liabilities:
Trade accounts receivable and unbilled working in progress 115,263 (213,126) (236,011)
Other accounts receivable (85,234) 33,196 190,354
Other accounts receivable from related parties 84,448 (245,688) 24,609
Inventories 33,709 279,867 200,575
Pre-paid expenses and other assets (99) (6,494) 18,309
Trade accounts payable (87,553) 463,401 10,917
Other accounts payable 156,261 49,319 (311,848)
Other accounts payable to related parties 45,902 (66,819) 92,613
Provisions (2,756) (1,680) (6,615)
Interest payment (171,572) (173,662) (188,704)
Payments for purchases of intangibles - Concessions (97,711) (20,178) (10,305)
Payment of income tax (125,619) (144,545) (178,094)
Net cash provided by operating activities 333,693 491,164 279,273
- 7 -

GRAÑA Y MONTERO S.A.A. AND SUBSIDIARIES
(All amounts are expressed in thousands of S/ unless otherwise stated)
CONSOLIDATED STATEMENT OF CASH FLOWS
For the year
ended December 31,
Note 2016 2017 2018
INVESTING ACTIVITIES
Sale of investment 107,341 391,786 222,971
Sale of property, plant and equipment 66,086 127,221 31,852
Sale of financial asset at fair value through profit or loss 1,427 98 —
Sale of non-current assets held for sale 117 43,367 16,244
Refunding for price adjustment - Morelco 6,658 — —
Return of contributions 1,963 — —
Interest received 15,370 6,992 36,508
Dividends received 16 a) b) 27,992 3,758 1,823
Payment for purchase of investments properties (17,543) (1,183) (209)
Payments for intangible purchase (45,706) (97,112) (86,799)
Payments for purchase and contributions on investment in associate and joint ventures (389,657) (2,116) (3,770)
Payments for property, plant and equipment purchase (147,732) (123,941) (80,765)
Net cash (applied to) provided by investing activities (373,684) 348,870 137,855
FINANCING ACTIVITIES
Loans received 3,941,750 1,415,113 1,018,744
Bonds issued 178,640 — —
Amortization of loans received (3,914,570) (2,044,256) (1,265,920)
Amortization of bonds issued (25,281) (39,151) (28,914)
Payment for transaction costs for debt (650) (31,286) —
Dividends paid to owners of the parent (30,853) — —
Dividends paid to non-controlling interest 36 d) (25,473) (43,942) (102,772)
Cash received (return of contributions) from non-controlling shareholders (19,099) (33,197) (59,053)
Capital increase 24 — — 137,603
Acquisition or sale of interest in a subsidiary of non-controlling shareholders (18,702) (942) 389
Net cash provided by (applied to) financing activities 85,762 (777,661) (299,923)
Net increase (net decrease) in cash 45,771 62,373 117,205
Exchange difference (1,219) (34,867) 57,756
Cash and cash equivalents at the beginning of the year 554,002 598,554 626,060
Cash and cash equivalents at the end of the year 9 598,554 626,060 801,021
NON-CASH TRANSACTIONS:
Debt capitalization 8,308 — —
Interest debt capitalization — 26,015 3,361
Acquisition of assets through finance leases 65,336 48,507 2,365
Recognition of debt due to termination of GSP 608,247 —
Accounts payable to the non-controlling interest for purchase of investments — — 14,022
Return of contribution in inventories — — 25,389
Dividends declared to non-controlling interest — 15,735 —
Deconsolidation from non-controlling interest — 7,801 54,069
The accompanying notes on pages 9 to 113 are an integral part of the consolidated financial statements.
- 8 -

GRAÑA Y MONTERO S.A.A. AND SUBSIDIARIES
NOTES TO THE CONSOLIDATED FINANCIAL STATEMENTS
DECEMBER 31, 2016, 2017 AND 2018
1 GENERAL INFORMATION
a) Incorporation and operations
Graña y Montero S.A.A. (hereinafter the Company) was incorporated in Peru on August 12, 1996, as a result of the equity spin-off of Inversiones
GyM S.A. (formerly Graña y Montero S.A.). The Company’s legal address is Av. Paseo de la Republica 4675, Surquillo Lima, Peru and is listed
on the Lima Stock Exchange and the New York Stock Exchange (NYSE).
The Company is the parent of the Graña y Montero Group that includes the Company and its subsidiaries (hereinafter, the “Group”) and is mainly
engaged in holding investments in different Group companies. Additionally, the Company provides services of general management, financial
management, commercial management, legal advisory, human resources management and leases office space to the Group companies.
The Group is a conglomerate of companies with operations including different business activities, the most significant are engineering and
construction, infrastructure (public concession ownership and operation) and real estate businesses. See details of operating segments in Note 7.
b) Authorization for the issue of the financial statements
The consolidated financial statements for the year ended December 31, 2018, have been prepared and issued with Management and Board of
Directors’ authorization on March 7, 2019, and will be submitted for consideration and approval at the General Shareholders’ Meeting to be held
within the term established by Peruvian law. Management expects that the consolidated financial statements as of December 31, 2018, will be
approved with no changes.
c) Current situation of the Company
1) Projects conducted in association with companies of the Odebrecht Group
Our company and one of its subsidiaries participated as minority partners in certain entities that developed six infrastructure projects
in Peru with companies belonging to the group Odebrecht (hereinafter Odebrecht). In 2016, Odebrecht entered into a Plea
Agreement with the authorities of the United States Department of Justice and the Office of the District Attorney for the Eastern
District of New York by which it admitted corruption acts in connection with two of these projects (tranches 2 and 3 of the
Interoceanica Sur highway (“IIRSA Sur”) and the project to construct the Lima Metro (Electric Train)). As a result of this
agreement, the Peruvian authorities opened investigations for admitted illicit activities.
i) IIRSA Sur
With respect to the investigations conducted in relation to IIRSA Sur, the Public Prosecutor’s Office indicted the former Chairman
of the Board of Directors, for collusion; a former Director, and a former executive of the Company, for money laundering.
Subsequently, Graña y Montero S.A.A. and GyM S.A. were incorporated as subjects investigated in the case described above. The
companies appealed this decision, and later the Superior Court ruled in favor of both companies.
In addition, Graña y Montero S.A.A. and GyM S.A. have been incorporated as civilly liable third parties in the investigation process,
which means that the court will assess whether these entities are obligated to compensate the Peruvian Government for damages
suffered as a result of the facts under investigation.
- 9 -

ii) Electric Train
GyM S.A. has been incorporated as a civilly liable third party in the process related to the Electric Train construction project,
tranches 1 and 2. However, hitherto, no current or past director or officer of the Company has been incorporated in the investigation.
2) The Construction Club
On July 11, 2017, the Peruvian Commission for Free Competition (“Indecopi”) initiated an investigation against several construction
companies, including GyM S.A., about the existence of an alleged cartel called the Construction Club. Throughout the investigation,
GyM S.A. has provided to Indecopi with all the information requested and continues collaborating with the ongoing investigations.
The Company’s former commercial manager is under a criminal investigation, as well as other individuals related to other
construction companies. GyM S.A. has been incorporated in the criminal proceedings as a civilly liable third party along with 11
other construction companies.
3) Independent Investigation related to businesses with Odebrecht Group
On January 9, 2017, the Board of Directors approved a plan to conduct an internal investigation related to six projects executed in
association with Odebrecht.
On March 30, 2017, the Board of Directors created a Risk, Compliance and Sustainability Committee who was in charge of the
oversight of the investigation independent from management. The external investigation was entrusted to the law firm Simpson,
Thatcher and Bartlett, who reported exclusively to the Risk, Compliance and Sustainability Committee in order to preserve the
independence of the investigation.
The independent investigation concluded on November 2, 2017, and found no evidence for determining that the Group or any of its
former or current directors or executives had intentionally or knowingly participated in acts of corruption related to the six projects
developed in association with Odebrecht.
We were informed by the press in February 2019, that Odebrecht has signed an effective collaboration agreement with the
Prosecutor´s Office and the Ad Hoc Prosecutor’s Office in which, among other things, it is determined that Odebrecht will pay the
Peruvian Government an indemnity calculated according to the parameters established in Law No. 30737 and that Odebrecht will
collaborate with the Prosecutor’s Office providing all the relevant information it has about the facts under investigation.
4) Anticorruption Law - effects on the Group
Law 30737 and its regulation issued by Supreme Decree 096-2018-EF have mitigated the Company and subsidiaries exposure to the
cases described in subsections 1) and 2) above. These rules set clear guidelines to estimate the potential compensation reducing the
uncertainty derived from the legal proceedings, by among other things, preventing the imposition of liens or attachments of assets
that would impair its ability to operate.
- 10 -

The benefits of the mentioned rules are subject to the fulfillment of the following obligations:
• The obligation to set up a trust that will guarantee any eventual payment obligation of an eventual civil compensation in favor
of the Peruvian Government;
• The obligation not to transfer funds abroad without the prior consent of the Ministry of Justice;
• The implementation of a compliance program; and
• The obligation to disclose information to the authorities and to collaborate in the investigation.
The Group has designed a compliance program which is currently under implementation. In addition, it fully cooperates with the authorities in its
investigations and has executed a trust agreement with the Ministry of Justice that provides to the terms and conditions that govern the trust that
will secure its contingent obligations for an amount confirmed by authorities of S/73.5 million (equivalent to US$22.3 million) (Note 23).
On the other hand, based on the standards indicated and their guidelines, management has estimated that the value of the contingency for the cases
described above should not exceed US$45.8 million (equivalent to S/148.4 million).
If The Construction Club case is deemed incorporated within the scope of the referenced law, then the value of the assets assigned to the trust
would need to be increased by approximately US$3 million (equivalent to S/10.1 million), and the potential contingency would increase by
approximately US$3.1 million (equivalent to S/10.5 million).
Nonetheless, the Company, through its external attorneys, continues to conduct an ongoing evaluation of the information related to the criminal
investigations described in this Note 1 in order to keep its defense prepared in the event of any new charges arises during those investigations. In
conducting the aforementioned evaluation, the Company does not rule out the possibility of finding, in the future, adverse evidence nor does rule
out that authorities or third parties will find, in the future, adverse evidence not currently known to date during the investigations being conducted.
2 SUMMARY OF SIGNIFICANT ACCOUNTING POLICIES
The principal accounting policies applied in the preparation of these consolidated financial statements are set out below. These policies have been
consistently applied in all the years presented, unless otherwise stated.
2.1 Basis of preparation
The consolidated financial statements of the Company and its subsidiaries have been prepared in accordance with International Financial
Reporting Standards (IFRS) and interpretations issued by the IFRS Interpretations Committee (IFRIC) applicable to companies reporting under
IFRS. The financial statements comply with IFRS as issued by the IASB in force as of December 31, 2017, and December 31, 2018, respectively.
The consolidated financial statements have been prepared under the historical cost convention, except for derivative financial instruments,
financial assets at fair value through profit or loss, and available-for-sale financial assets measured at fair value. The financial statements are
presented in thousands of Peruvian Sol unless otherwise stated.
The preparation of the consolidated financial statements in conformity with IFRS requires the use of certain critical accounting estimates. Also
requires that the management exercise its critical judgment in the process of applying the Group’s accounting policies. The areas involving a
higher degree of judgment or complexity, or areas where assumptions and estimates are significant to the consolidated financial statements are
disclosed in Note 5.
- 11 -
2.2 Consolidation of financial statements
a) Subsidiaries
Subsidiaries are entities over which the Company has control. Subsidiaries are fully consolidated from the date on which control is transferred to
the Group. They are deconsolidated from the date that control ceases.
The Group applies the acquisition method to account for business combinations. Identifiable assets acquired, liabilities and contingent liabilities
assumed in a business combination are measured initially at their fair values at the acquisition date.
The Group evaluates the measurement of the non-controlling interest on an acquisition-by-acquisition basis. At December 31, 2017, and 2018, the
measurements of the non-controlling interest in the Group´s acquisitions were made at the non-controlling interest´s proportionate share of the
recognized amounts of the acquiree´s identifiable net assets.
Business acquisition-related costs are expensed as incurred.
Any contingent consideration assumed by the Group with the selling party is recognized at fair value at the acquisition date. Subsequent changes
to the fair value of the contingent consideration are recognized in accordance with IFRS 9 “Financial Instruments” as profit or loss.
Goodwill is initially measured as the excess of the acquisition cost, the fair value at the acquisition date of any interest previously acquired plus
the fair value of the non-controlling interest, over the net identifiable assets acquired and liabilities and contingent liabilities assumed. If the
acquisition cost is less than the fair value of the net assets of the subsidiary acquired, the difference is recognized in profit or loss at the time of
acquisition.
For consolidating subsidiaries, balances, income, and expenses from transactions between Group companies are eliminated. Profits and losses
resulting from inter-company transactions that are recognized as assets are also eliminated. Group companies use common accounting practices,
except for those that are specifically required for specific businesses.
b) Changes in ownership interests in subsidiaries without change of control
Transactions with non-controlling interests that do not result in loss of control are accounted for as equity transactions, in other words as
transactions with owners in their capacity as owners. The difference between the fair value of any consideration paid and the relevant share
acquired of the carrying value of net assets of the subsidiary is recorded in equity. Gains or losses on disposals to non-controlling interest are also
recorded in equity at the time of disposal.
c) Disposal of subsidiaries
When the Group ceases to have control over a subsidiary, any retained interest in the entity is re-measured at its fair value at the date when control
is lost, with the change in carrying amount recognized in profit or loss at such date. The fair value is the initial carrying amount for the purposes of
subsequently accounting for the retained interest as an associate, joint venture or financial asset. In addition, any amounts previously recognized in
other comprehensive income in respect of that entity are accounted for as if the Group had directly disposed of the related assets or liabilities. This
may mean that the amount previously recognized in other comprehensive income is reclassified to profit or loss.
- 12 -
d) Joint arrangements
Contracts in which the Group and one or more of the contracting parties have joint control on the relevant joint activities are called joint
arrangements.
Investments in joint arrangements are classified as either joint operations or joint ventures depending on the contractual rights and obligations of
each investor. The Group has assessed the nature of its joint arrangements and determined them to be both joint ventures as well as joint
operations.
Joint ventures are accounted for using the equity method. Under this method, interests in joint ventures are initially recognized at cost and
adjusted thereafter to recognize the Group’s share of the post-acquisition profits or losses and movements in the comprehensive income statement.
The Group assesses on an annual basis whether there is any objective evidence that the investment in the joint ventures and associate is impaired.
If this is the case, the Group calculates the amount of impairment as the difference between the recoverable amount of the associate and its
carrying value and recognizes the impairment loss in share of the profit or loss in associates and joint ventures under the equity method of
accounting in the income statement. In addition, the Group stops the use of the equity method if the entity ceases to be an operating entity.
Joint operations are joint arrangements whereby the parties that have joint control of the arrangement, have rights over the assets, and obligations
for the liabilities, relating to the arrangement. Each party recognizes its assets, liabilities, revenue and cost and its share of any asset or liability
jointly held and, on any revenue, or cost arisen from the joint operation.
In the Group, joint operations mainly relate to consortiums (entities without legal personality) created exclusively for the development of a
construction contract. Considering that the only objective of the consortium is to develop a specific project, all revenue and costs are included
within revenue from construction activities and cost of construction activities, respectively.
e) Associates
Associates are all entities over which the Group has significant influence but not control, generally accompanying a holding of between 20% and
50% of the voting rights. Investments in associates are accounted for using the equity method (see section d) above).
Profits and losses resulting from transactions between the Group and its associates are recognized in the Group’s consolidated financial statements
only to the extent of unrelated investor’s interests in the associates. Unrealized losses are eliminated unless the transaction provides evidence of an
impairment of the asset transferred. Accounting policies of associates are changed where necessary to ensure consistency with the policies
adopted by the Group.
Impairment losses are measured and recorded in accordance with section d) above.
2.3 Segment reporting
Operating segments are reported in a consistent manner with internal reporting provided to Management of the Group.
If an entity changes the structure of its internal organization in a manner that causes the composition of its reportable segments to change, the
Group restates the information for earlier periods unless the information is not available.
2.4 Foreign currency translation
a) Functional and presentation currency
The consolidated financial statements are presented in soles, which is the functional and presentation currency of the Group. All subsidiaries, joint
arrangements, and associates use the Peruvian Sol as their functional currency, except for foreign entities, for which the functional currency is the
currency of the country in which they operate.
- 13 -

b) Transactions and balances
Foreign currency transactions are translated into the functional currency using prevailing the exchange rates at the date of the transactions or
valuation when items are re-measured. Foreign exchange gains and losses resulting from the settlement of such transactions are recognized in the
consolidated income statement, except when deferred in other comprehensive income.
Exchange differences arising on loans from the Company to its subsidiaries in foreign currencies are recognized in the separate financial
statements of the Company and separate financial statements of the subsidiaries. In the consolidated financial statements, such exchange
differences are recognized in other comprehensive income and are re-classified in the income statement on the disposal of the subsidiary or debt
repayment to the extent such loans qualify as part of the “net investment in a foreign operation”.
Foreign exchange gains and losses of all monetary items are included in the income statement within financial income or expense.
c) Group companies
The results and financial position of all the Group entities (none of which has the currency of a hyperinflationary economy) that have a functional
currency different from the presentation currency of the Group are translated into the presentation currency as follows:
i) Assets and liabilities for each statement of financial position are translated using the closing exchange rate prevailing at the date of the
consolidated statement of financial position;
ii) income and expenses for each income statement are translated at the average exchange rate (unless this average is not a reasonable
approximation of the cumulative effect of the rates prevailing on the transaction dates, in which case income and expenses are translated
using the exchange rate on the date of the transaction);
iii) capital is translated by using the historical exchange rate for each capital contribution made; and
iv) all exchange differences are recognized as separate components in other comprehensive income (loss), within foreign currency translations
adjustment.
Goodwill and fair value adjustments arising from the acquisition of a foreign entity are treated as assets and liabilities of the foreign entity and are
translated at the closing exchange rate. Exchange differences are recognized in other comprehensive income.
2.5 Public services concession agreements
Concession agreements signed between the Group and the Peruvian Government entitle the Group, as a Concessionaire, to assume obligations for
the construction or improvement of infrastructure and which qualify as public service concessions are accounted as defined by IFRIC 12 “Service
Concession Arrangements”. The consideration to be received from the Government for the services of constructing or improving public
infrastructure is recognized as a financial asset or as an intangible asset, as set forth below.
a) It is recognized as a financial asset to the extent that it has a contractual right to receive cash or other financial assets either because the
Government secures the payment of specified or determinable amounts or because the Government will cover any difference arising from
the amounts actually received from public service users in relation with the specified or determinable amounts. These financial assets are
recognized initially at fair value and subsequently at amortized cost (the financial model).
- 14 -
b) It is recognized as an intangible asset to the extent that the service agreement grants the Group a contractual right to charge users of the
public service. The resulting intangible asset is measured at cost and is amortized as described in Note 2.15 (intangible asset model).
c) It is recognized as a financial asset and an intangible asset when the Group recovers its investment partially by a financial asset and partially
by an intangible asset (bifurcated model).
2.6 Cash and cash equivalents
In the consolidated statements of financial position and cash flows, cash and cash equivalents include cash on hand, on-demand bank deposits,
other highly liquid investments with original maturities of three months or less and bank overdrafts. In the consolidated statement of financial
position, bank overdrafts are included in the balance of financial obligations as current liabilities.
2.7 Financial assets
2.7.1 Classification and measurement
The Group classifies its financial assets, according to its subsequent measurement, in the following categories: i) amortized cost; ii) financial
assets at fair value through other comprehensive income and iii) financial assets at fair value through profit or loss. The classification depends on
the purpose for which the financial assets were acquired on the basis of the Group’s business model for managing the financial assets and the
characteristics of the contractual cash flows of the financial asset.
Management determines the classification of its financial assets at the date of its initial recognition and re-evaluates this classification at the date
of each closing of its consolidated financial statements. As of December 31, 2017, and 2018, the Group only maintains financial assets in the
following categories:
a) Amortized cost
This category is the most relevant for the Group. The Group measures financial assets at amortized cost if the following conditions are met:
i) The financial asset is held within a business model with the objective of maintaining the financial assets to obtain the contractual cash flows;
and
ii) The contractual terms of the financial asset generate cash flows, on specific dates, that are only payments of the principal and interest on the
amount of the outstanding principal.
Financial assets at amortized cost are subsequently measured using the effective interest method and are subject to impairment. Profits and losses
are recognized in profits or losses when the asset is written off, modified or impaired.
Trade accounts receivable, accounts receivable from related companies, other accounts receivable, work in progress and cash and cash equivalents
are included in current assets except for those over twelve months after the date of the consolidated statement of financial position. The latter are
classified as non-current assets.
b) Financial assets at fair value through other comprehensive results
Financial assets at fair value through other comprehensive income of the Group are classified in this category when they meet the following
conditions:
i) keep them within a business model whose objective is achieved by obtaining contractual cash flows and selling financial assets; and
- 15 -

ii) the contractual terms of the financial asset give rise, on specific dates, to cash flows that are only payments of the principal and interest on the
outstanding principal amount.
The investment account at Inversiones en Autopistas S.A. is included in this category.
c) Financial assets at fair value through profit or loss
Financial assets that do not meet the criteria of amortized costs or fair value through other comprehensive income are measured at fair value
through profit or loss. The result in a debt investment that is subsequently measured at fair value through gains and losses is recognized in the
consolidated statement of comprehensive income in the period in which it occurs.
Financial assets at fair value through profit or loss are non-derivative financial assets designated by the Group at their fair value upon initial
recognition and are held for sale. These are included in current assets.
2.7.2 Derecognition of financial assets
The Group derecognizes a financial asset when the contractual rights over the cash flows of the financial asset expire, or when it transfers the
rights to receive the contractual cash flows in a transaction in which all the risks and benefits of ownership of the financial asset are substantially
transferred, or does not transfer or retain substantially all the risks and benefits related to the property and does not retain control over the assets
transferred.
The Group participates in transactions in which it transfers the assets recognized in its statement of financial position but retains all or
substantially all the risks and advantages of the assets transferred, and/or control over them. In these cases, the assets transferred are not
derecognized and are measured on a basis that reflects rights and obligations that the Group has retained.
2.8 Impairment of financial assets
IFRS 9 requires to register expected credit losses of all financial assets, except for those that are carried at fair value with an effect on results,
estimating it over 12 months or for the entire life of the financial instrument (“lifetime”). In accordance with the provisions of the standard, the
Group applies the simplified approach (which estimates the loss for the entire life of the financial instrument), for the commercial debtors of the
rental business line of the real estate sector, and the general approach for the trade accounts receivables, work in progress and other accounts
receivable; the same that requires evaluating whether or not a significant increase in risk exists to determine whether the loss should be estimated
based on 12 months after the reporting date or during the entire life of the asset.
The Group has established a policy to conduct an evaluation, at the end of each reporting period, to identify whether the asset has suffered a
significant increase in credit risk since the initial date. Both the credit losses expected at 12 months and the expected credit losses during the life
of the asset are calculated individually or collectively, depending on the nature of the portfolio.
For financial assets for which the Group has no reasonable expectation of recovering, either the entire outstanding amount or a portion thereof, the
gross carrying amount of the financial asset is reduced. This is considered a decrease in (partial) accounts of the financial asset.
2.9 Derivative financial instruments and hedging activities
Derivatives are initially recognized at fair value on the date a derivative contract is entered into and are subsequently re-measured at their fair
value at the end of each reporting period. The method of recognizing the resulting gain or loss depends on whether the derivative is designated as
a hedging instrument, and if so, the nature of the item being hedged.
- 16 -

The Group designates certain derivatives as hedges of a particular risk associated with a recognized asset or liability (fair value hedge) or a highly
probable forecast transaction (cash flow hedge). Derivatives are initially recognized at fair value on the date of subscription of the contract and are
subsequently recognized at their fair value. The method to recognize the gain or loss resulting from changes in the fair values of the derivatives
depends on the nature of the item being covered.
The Group documents, at the inception of the transaction, the relationship between hedging instruments and hedged items, as well as its risk
management objectives and strategy for undertaking various hedging transactions. The Group also documents its assessment, both at hedge
inception and on an ongoing basis, of whether the derivatives that are used in hedging transactions are highly effective in offsetting changes in fair
values or cash flows of hedged items.
The fair values of various derivative instruments used for hedging purposes and changes in the account reserves for hedging in equity are
disclosed in Note 8. The full fair value of a hedging derivative is classified as a non-current asset or liability when the remaining maturity period
of the hedged item is more than 12 months and as a current asset or liability when the remaining maturity period of the hedged item is less than 12
months. Trading derivatives are classified as a current asset or liability.
Cash flow hedge
The effective portion of changes in the fair value of derivatives that are designated and qualify as fair value hedges is recognized as other
comprehensive income. The gain or loss relating to the ineffective portion is recognized immediately in the income statement. Amounts
accumulated in equity are reclassified to profit or loss in the periods when the hedged item affects profit or loss (for example, when the forecasted
sale that is hedged takes place).
The gain or loss relating to the effective portion of interest rate swaps hedging variable rate borrowings is recognized in the income statement as
“Financial income or Financial expenses”.
However, when the forecasted transaction that is hedged results in the recognition of a non-financial asset (for example, inventory or fixed assets),
the gains or losses previously deferred in equity are transferred from equity and are included in the initial measurement of the cost of the
non-financial asset. The deferred amounts are ultimately recognized in cost of goods sold in the case of inventory or depreciation in the case of
fixed assets.
When a hedging instrument expires or is sold, or when a hedge no longer meets the criteria for hedge accounting, any cumulative gain or loss
existing in equity at that time remains in equity and is recognized when the forecasted transaction is ultimately recognized in the income
statement. When a forecasted transaction is no longer expected to occur, the cumulative gain or loss that was reported in equity is immediately
transferred to the income statement within “other income and expenses, net”.
2.10 Trade accounts receivables
Trade receivables are amounts due from customers for goods or services sold by the Group. If the collection is expected in one year or less, they
are classified as current assets. If not, they are presented as non-current assets.
Trade receivables are recognized initially at fair value and subsequently measured at amortized cost using the effective interest method, less any
provision for impairment, except for receivables of less than one year that are stated at a nominal amount which is similar to their fair values since
they are short term.
Also includes the management estimates related to the engineering and construction, corresponding to rights of executed services that have not
been approved by customers (Progress level valuation).
- 17 -

2.11 Work in progress
This account includes the balance of work in progress costs incurred that relates to future activities of the construction contracts and the
constructions phase in concessions (see Note 2.26 for detail on Revenue from construction activities).
Changes in estimates of contract revenues and costs can increase or decrease the estimated margin. When a change in the estimate is known, the
cumulative impact of the change is recorded in the period in which it is known.
2.12 Inventories
The inventories include land, works in progress and finished buildings related to the real estate activity, materials used in the construction activity.
a) Real estate activity
Land used for the execution of real estate projects is recognized at acquisition cost. Work in progress and finished real estate includes the costs of
design, materials, direct labor, borrowing costs (directly attributable to the acquisition, construction, production of the asset), other indirect costs
and general expenses related to the construction phase.
Net realizable value is the estimated selling price in the ordinary course of business, less applicable variable selling expenses. The Group reviews
annually whether inventories have been impaired identifying three groups of inventories to measure their net realizable value: i) land bought for
future real estate projects which are compared to their net appraisal value; if the acquisition value is higher, a provision of impairment is made; ii)
land under construction, impairment is measured based on cost projections; if these costs are higher than selling prices of each real estate unit, an
estimate is made for impairment; and iii) completed real estate units; these inventory items are compared to the selling prices less selling
expenses; if these selling expenses are higher, a provision for impairment is made.
For the reductions in the carrying amount of these inventories to their net realizable value, a provision is made for impairment of inventories with
a charge to profit or loss for the year in which those reductions occur.
b) Exploration and extraction activities
Inventories are valued at production costs or net realizable value (NRV), the one with the lowest result, on the basis of the weighted average
method. The NRV represents the value at which it is estimated to make oil, gas and its derivatives LPG and HAS, which is calculated on the basis
of international prices at which discounts that are usually granted are deducted. Miscellaneous supplies, materials, and spare parts are valued at
cost or replacement value, whichever is less based on the average method. The cost of inventories excludes financing expenses and exchange
differences. Inventories to be received are recorded at cost by the specific identification method.
The Group constitutes a devaluation of materials charged to income for the year in cases in which the book value exceeds its recoverable value.
c) Other activities
Materials and supplies are recorded at cost by the weighted average method or at their replacement value, the lower. The cost of these items
includes freight and non-refundable applicable taxes.
The devaluation of these items is estimated on the basis of specific analysis made by the Management on its rotation. If it is identified that the
book value of the stocks of materials and supplies exceeds their replacement value, the difference is charged to income in the year in which this
situation is determined.
- 18 -
2.13 Investment property
Investment properties are shown at cost less accumulated depreciation and impairment losses, if any. Subsequent costs attributable to investment
properties are capitalized only if it is probable that future economic benefits will flow to the Company and the cost of these assets can be
measured reliably; if not, they are recognized as expenses when incurred.
Repair and maintenance expenses are recognized in profit and loss when they are incurred. If the property’s carrying amount is greater than its
estimated recoverable amount, an adjustment to reduce the carrying amount to the recoverable amount is recognized.
Depreciation is determined at rates calculated to write off cost, less estimated residual value, of each asset on a straight-line basis over its
estimated useful life. Significant components with useful lives substantially different are treated separately for depreciation purposes. The
estimated useful lives of those properties range from 3 to 33 years.
The investment properties held by the Group correspond to: (i) “Agustino Plaza” Shopping Center, located in the El Agustino District, and (ii) the
stores situated within the stations of Line 1 of the Lima Metro; the properties owned by the subsidiary VIVA GyM SA have an estimated fair
value of US$19.2 million, equivalent to S/64.3 million as of December 31, 2018 (US$34.5 million, equivalent to S/112.7 million, as of
December 31 of 2017).
These investment properties have been leased under the modality of an operating lease.
2.14 Property, plant and equipment
Property, plant and equipment are stated at historical cost less accumulated depreciation and impairment losses, if any. Historical cost includes
expenditure that is directly attributable to the acquisition of these items.
Subsequent costs are included in the asset’s carrying amount or are recognized as a separate asset, as appropriate, only when it is probable that
future economic benefits associated with the item will flow to the Group and the cost of the item can be measured reliably. Repairs and
maintenance expense are charged to the income statement during the financial period in which they are incurred.
Assets under construction are capitalized as a separate component. At their completion, the cost of such assets is transferred to their definitive
category.
Replacement units are major spare parts in which depreciation starts when the units are installed for use within the related asset.
Depreciation of machinery, equipment and vehicles recognized as “Major equipment” are depreciated based on their hours of use. Under this
method, the total number of work hours that machinery and equipment is capable of producing is estimated and a charge per hour is determined.
The depreciation of other assets that do not qualify as “Major equipment” is calculated under the straight-line method to allocate their cost less
their residual values over their estimated useful lives, as follows:
Years
Buildings and facilities Between 3 and 33
Machinery and equipment Between 4 and 10
Vehicles Between 2 and 10
Furniture and fixtures Between 2 and 10
Other equipment Between 2 and 10
- 19 -

Residual values and useful lives are reviewed and adjusted as appropriate at each reporting date. Gains and losses on disposals are recognized in
“Other income and expenses, net” in the income statement. Regarding joint operations that carry out construction activities, the difference
between the proceeds from disposals of fixed assets and their carrying amount is shown within “revenue from construction activities” and “cost of
construction activities”, respectively.
2.15 Intangible assets
i) Goodwill
Goodwill arises on the acquisition of subsidiaries and represents the excess of the purchase consideration, the amount of any non-controlling
interest and the acquisition-date fair value of any previous equity interest in the acquiree over the fair value of the net identifiable assets acquired.
If the total of the consideration transferred, the non-controlling interest recognized and previously held interest measured at fair value is less than
the fair value of the net assets of the subsidiary acquired, the difference is recognized directly in the consolidated statement of income.
Goodwill acquired in a business combination is allocated to each cash-generating units (CGU), or group of CGUs, that is expected to benefit from
the synergies of the combination. Goodwill is monitored at the operating segment level.
Goodwill impairment reviews are performed at least annually and when events or changes in circumstances indicate a potential impairment. Any
impairment is recognized immediately as an expense in item “Other income and expenses, net” and cannot be reversed later.
ii) Trademarks
Trademarks acquired separately are shown at historical cost. Trademarks acquired in a business combination are recognized at fair value at the
acquisition date. Management has determined that these trademarks have indefinite useful lives.
Trademark impairment reviews are performed at least annually and when events or changes in circumstances indicate a potential impairment. Any
impairment is recognized immediately as an expense in item “Other income and expenses, net”.
iii) Concession rights
The intangible asset consisting of the right to charge users for the services related to service concessions agreements (Note 2.5 and Note 6.b) is
initially recorded at the fair value of construction or improvement services. Before amortization is started, an impairment test is performed; it is
amortized under the straight-line method, from the date revenue starts using the lower of its estimated expected useful life or effective period of
the concession agreement.
iv) Contractual relationships with customers
Contractual relationships with customers are assets resulting from business combinations that were initially recognized at fair value as determined
based on the expected cash flows from those relations over an estimated period of time based on the time period those customers will remain as
customers of the Group (the estimation of useful life is based on the contract terms which fluctuate between 5 and 9 years). The useful life and the
impairment of these assets are individually assessed.
v) Cost of development wells
Costs incurred in preparing wells to extract hydrocarbons in Blocks I, III, IV, and V, located in Talara, are capitalized as part of intangible assets.
These costs are amortized over the useful lives of the wells (estimated to be five years for Blocks I and V and the unit of production method for
Blocks III and IV), which is less than the period of the service agreement signed with Perupetro.
- 20 -

vi) Software and development costs
Development costs that are directly attributable to the design and testing of identifiable and unique software products controlled by the Group are
recognized as intangible assets when the following criteria are met:
• It is technically feasible to complete the software product so that it will be available for use;
• management intends to complete the software product and use or sell it;
• there is the ability to use or sell the software product;
• it can be demonstrated how the software product will probably generate future economic benefits;
• technical, financial and other resources are available to complete the development and to use or sell the software product; and
• expenses incurred during its development can be reliably measured.
Other development expenditures that do not meet these criteria are expensed as incurred. Development costs previously recognized as an expense
are not recognized as an asset in a subsequent period. Computer software development costs recognized as assets are amortized over their
estimated useful lives, which fluctuate between 2 to 15 years.
vii) Land use rights
Refers to the rights maintained by the subsidiary Promotora Larcomar S.A. Land use of rights are stated at historical cost less amortization and
any accumulated impairment losses. The useful life of this asset is based on the agreement signed (60 years) and may be extended if agreed by
parties. Amortization will begin when it becomes ready for its intended use by Management.
2.16 Impairment of non-financial assets
Assets subject to amortization are subject to impairment tests when events or circumstances occur that indicate that their book value may not be
recovered. Impairment losses are measured as the amount by which the book value of the asset exceeds its recoverable value. The recoverable
value of the assets corresponds to the higher of its fair value and its value in use. For purposes of the impairment assessment, assets are grouped at
the lowest levels in which they generate identifiable cash flows (cash-generating units). The book value of non-financial assets other than
goodwill that have been subject to write-offs for impairment is reviewed at each reporting date to verify possible reversals of impairment.
2.17 Financial liabilities
The financial liabilities of the Group include trade accounts payable, accounts payable to related parties, remuneration and other accounts payable.
All financial liabilities are initially recognized at fair value and subsequently valued at amortized cost using the effective interest rate method.
Financial liabilities are classified as current liabilities if the payment must be made within a year or less (or in the normal operating cycle of the
business if it is greater). Otherwise, they are presented as non-current liabilities.
2.18 Trade accounts payable
Trade payables are obligations to pay for goods or services that have been acquired in the ordinary course of business. Accounts payable are
classified as current liabilities if payment is due within one year or less (or in the normal operating cycle of the business if longer). If not, they are
presented as non-current liabilities.
- 21 -

Accounts payable are initially recognized at their fair value and subsequently are amortized at amortized cost using the effective interest method,
except for accounts payable within less than one year that are recorded at their nominal value that is similar to their fair value due to its maturity in
the short term.
2.19 Other financial liabilities
Corresponds to the loans and bonds issued by the Group, which are initially recognized at their fair value, net of the costs incurred in the
transaction. These financial liabilities are subsequently recorded at amortized cost; any difference between the funds received (net of transaction
costs) and the redemption value is recognized in the income statement during the period of the loan using the effective interest method.
The costs incurred to obtain these financial liabilities are recognized as transaction costs to the extent that it is probable that part or the entire loan
will be received. In this case, these charges are deferred until the time the loan is received.
2.20 Borrowing costs
Debt costs are recognized at the income statement in the period in which they have been incurred, except for intangible assets and inventories in
which the borrowing costs are capitalized.
General and specific borrowing costs directly attributable to the acquisition, construction or production of qualified assets, which are assets that
necessarily take a substantial period (more than 12 months) to reach their condition of use or sale, are added to the cost of said assets until the
period when the assets are substantially ready for use or sale. The Group suspends the capitalization of borrowing costs during the periods in
which the development of activities of a qualified asset has been suspended. The income obtained from the temporary investment of specific loans
that have not yet been invested in qualified assets is deducted from the borrowing costs eligible for capitalization.
2.21 Current and deferred income tax
Income tax expense comprises current and deferred tax. Tax expense is recognized in the income statement, except to the extent that it relates to
items recognized in other comprehensive income or equity. In this case, tax is also recognized in the statement of comprehensive income or
directly in equity, respectively.
The current income tax is calculated based on the tax laws enacted at the date of the statement of financial position in the countries where the
Company and its subsidiaries operate and generate taxable income. Management, where appropriate, establishes provisions based on amounts
expected to be paid to the tax authorities.
Deferred tax is recognized on temporary differences arising between the tax bases of assets and liabilities and their carrying amounts in the
financial statements. Deferred income tax assets are recognized only to the extent that it is probable that future taxable profit will be available
against which the temporary differences can be utilized. Deferred income tax is determined using tax rates (and legislation) that have been enacted
as of the date of the statement of financial position and that are expected to be applicable when the deferred income tax is realized or paid.
Deferred income tax is provided on temporary differences arising on investments in subsidiaries and associates, except for deferred income tax
liability where the timing of the reversal of the temporary difference is controlled by the Group, and it is probable that the temporary difference
will not reverse in the foreseeable future. Deferred income tax arising from the initial recognition of goodwill is not recognized; likewise, the
deferred tax is not recorded if it arises from the initial recognition of an asset or liability in a transaction that is not a combination of businesses
that does not affect the accounting or tax profit or loss at the time of the transaction
- 22 -

2.22 Employee benefits
The Group recognizes a liability when the employee has rendered services in exchange for which is entitled to receive future payments and an
expense when the Group has consumed the economic benefit from the service provided by the employee in exchange for the benefits in question.
The Group determines employee benefits in accordance with current labor and legal regulations and classifies them as short-term benefits, post-
employment benefits, long-term benefits, and termination benefits.
Short-term benefits are those other than termination indemnities, whose payment is settled in the twelve months following the end of the period in
which the employees have rendered the services; they correspond to current remunerations (salaries, and salaries and contributions to social
security), annual paid and sick absences, participation in profits and incentives and other non-monetary benefits.
Post-employment benefits are those other than termination benefits that are paid after completing the period of employment with the entity.
Retirement benefits or post-employment benefit plans can be classified into (i) Defined contribution plans and (ii) Defined benefit plans. The
Group maintains defined benefit plans and therefore assumes the actuarial risk.
Long-term benefits are those benefits that must be paid more than twelve months after the end of the period in which the services were rendered.
As of December 31, 2017, and 2018, the Group does not grant benefits in this category.
Termination benefits are those benefits payable as a result of (i) the entity’s decision to terminate the employee’s contract before the retirement
date, and (ii) the employee’s decision to voluntarily accept the conclusion of the relationship of work.
Short-term benefits:
a) Current salaries and wages
The current remunerations are constituted by salaries, wages, contributions to social security, statutory bonuses and compensation for the time of
services. Salaries, wages, and contributions to social security are settled on a monthly basis.
Entities of the Group recognize the expense and the related liability for statutory bonuses based on applicable laws and regulations effective in
Peru, Chile, Bolivia, Guyana, and Colombia. In Peru bonuses correspond to two monthly payments, settled one in July and one in December of
each year.
The compensation for time of service corresponds to the indemnification rights of the staff, and is accrued based on the consideration of the
service calculated according to the legislation in force in each country in which the entities that make up the Group operate and determine as
follows: (i) in Peru it is equivalent to half the remuneration in force at the date of payment and this is effected by deposit in bank accounts
designated by the workers in the months of May and November of each year; (ii) In Colombia, it is equivalent to 8.33% of the monthly
remuneration, (iii) in Bolivia, the calculation is made taking into account the average salary or wages of the last three months. In Chile and
Guyana, this benefit is not available.
b) Annual paid absences
Annual holidays are recognized on an accrual basis. The provision for the estimated obligation resulting from the services rendered by employees
is recognized on the date of the consolidated statement of financial position and corresponds; (i) one month for personnel in Peru, (ii) fifteen days
for personnel in Colombia, and (iii) in the case of Chile, they are subject to the worker’s seniority and range from fifteen to thirty days.
- 23 -

c) Workers’ profit sharing and incentives
The workers’ profit sharing is determined on the basis of the legal provisions in force in each country where the entities that make up the Group
operate, as follows: (i) in Peru it is equivalent to 5% of the taxable base determined by each Company of the Group, in accordance with current
income tax legislation, (ii) in Chile, workers’ participation is a component of the remuneration (equivalent to 4.75 minimum wages per year) and
not a determinable percentage of the profit, (iii) in Colombia these benefits are not provided to employees.
Post-employment benefits
The indirect subsidiary Cam Chile Spa has a pension plan for its staff. The liability recognized in the statement of financial position with respect
to defined benefit plan is measured based on the present value of the obligation at the end of the reporting period less the fair value of the planned
assets.
The present value of the defined benefit obligations is determined by discounting the estimated future cash flows using the interest rates of high-
quality corporate bonds denominated in the currency in which the benefits will be paid and with maturity periods similar to the obligations for
pension plans. In countries where there is no market with instruments with similar characteristics, the market rate of government bonds will be
used.
The remeasurements that arise from adjustments and changes in the actuarial assumptions are recorded in other comprehensive income in the
period in which they arise.
Termination benefits
The Group entities recognize the liability and expense for severance payments when they occur, based on the legal provisions in force in each
country. In accordance with the legislation of Peru, the compensation for arbitrary dismissal for personnel with an indefinite contract amounts to
1.5 times the monthly remuneration for each year worked.
In Colombian legislation, compensation depends on the remuneration received; in the legislation of Chile is granted compensation of 30 days of
salary for each year worked with a maximum salary of 330 days.
2.23 Provisions
a) General
Provisions are recognized when i) the Group has a present legal or constructive obligation as a result of past events; ii) it is probable that an
outflow of resources will be required to settle the obligation; and iii) the amount has been reliably estimated. Provisions are reviewed at year -
end. If the time value of money is significant, provisions are discounted using a pre-tax rate that reflects, when applicable, the specific risks
related to the liability. Reversal of the discount due to the passage of time results in the obligation being recognized with a charge to the income
statement as a financial expense.
Contingent obligations when their existence will only be confirmed by future events or their amount cannot be reliably measured. Contingent
assets are not recognized, and are disclosed only if it is probable that the Group will generate an income from economic benefits in the future.
- 24 -

b) Provision for the closure of production wells
The subsidiary GMP S.A. recognizes a provision for the closure of operating units that correspond to the legal obligation to close oil production
wells once the production phase has been completed. At the initial date of recognition, the liability that arises from this obligation measured at its
fair value and discounted at its present value, according to the valuation techniques established by IFRS 13, “Fair Value Measurement”, and is
simultaneously charged to the intangible account in the consolidated statement of financial position.
Subsequently, the liability is increased in each period to reflect the financial cost considered in the initial measurement of the discount, and the
capitalized cost is depreciated based on the useful life of the related asset. When a liability is settled, the subsidiaries recognize any gain or loss
that may arise. The fair value changes estimated for the initial obligation and the interest rates used to discount the flows they are recognized as an
increase or decrease in the book value of the obligation and the asset to which they relate to, any decrease in the provision, and any decrease of the
asset that may exceed the carrying amount of said asset is immediately recognized in the consolidated statement of income.
If the review of the estimated obligation results in the need to increase the provision and, accordingly, increase the carrying amount of the asset,
the subsidiaries should also take into consideration if the said increase corresponds to an indicator that the asset has been impaired and, if so,
impairment tests are to be carried out (Note 2.16).
2.24 Put option arrangement
The subsidiary GyM S.A. signed a sale option contract on the equity of its subsidiary Morelco SAS (Note 33 b) that allows the shareholder to
reallocate its shares over a period of 10 years. The amount payable under the option is initially recognized at the present value of the
reimbursement under “Other accounts payable”, directly charged to equity. The charge to equity is recorded separately as put options subscribed
on the non-controlling interest, adjacent to the non-controlling interest in the net assets of the consolidated subsidiaries.
Subsequently, the financial liability is updated by changes in the assumptions on which the estimation of the expected cash flows is based and by
the financial component due to the passage of time. The effects of this update are recognized in results. In the event that the option expires without
being exercised, the liability is written off with the corresponding adjustment to equity.
2.25 Capital
Common shares are classified as equity.
Incremental costs directly attributable to the issue of new shares or options are shown in equity, as a deduction, of the proceeds, net of taxes.
When any Group company purchases Company’s equity shares (treasury shares), the consideration paid, including any directly attributable
incremental costs (net of income taxes) is deducted from equity attributable to the company’s equity holders until the shares are canceled, placed
or reissued. When such shares are subsequently reissued, any consideration received, net of any directly attributable incremental transaction costs
and the related income tax effects is included in equity attributable to the Group’s equity holders.
2.26 Revenue recognition from contracts with customers
Revenues from contracts with customers are recognized, for each performance obligation, either during a period of time or at a specific time,
depending on which method best reflects the transfer of control of the underlying products or services to the obligation of particular performance
with the client.
- 25 -

The Group recognizes the income through the application of the five steps defined in the regulation i) identification of the contract with the client;
ii) identification of performance obligations in the contract; iii) determination of the price of the transaction; iv) allocation of the transaction price
for performance obligations; and v) recognition of income when (or as) a performance obligation is satisfied.
Subsequently, the Group policy of recognition of each type of income according to IFRS 15:
i) Engineering and construction
The Company recognizes revenues from engineering and construction contracts over time, as performance obligations are satisfied, due to the
continuous transfer of control to the customer. Engineering and construction contracts are generally accounted for as a single unit of account (a
single performance obligation) and are not segmented between types of services.
Construction
Revenues from construction contracts are recognized using the percentage-of-completion method which is based on the completion of a physical
proportion of the overall work contract considering total costs and revenues estimated at the end of the project. Under this method, revenues are
determined based on the proportion of actual physical completion compared to the total contracted physical construction commitment.
The contract generates assets when the costs incurred are greater than the cost associated with those revenues. Otherwise liabilities are generated
for the accrued costs not invoiced.
When it is probable that the total costs of the contract will exceed the related revenue, the expected loss is immediately recognized.
When the construction contract profit cannot be estimated reliably, the associated revenue is recognized to the extent of costs incurred are
recoverable. Revenue is billed once approval is received by the owners of the work in progress.
Revenues for additional works come from a modification or instruction received from the client to make a change in the scope of work or the
price, or both, and which may result in an increase or decrease in contract revenue. A modification is included in the contract revenue when the
customer is likely to approve the modification, as well as when the amount of income arising from such modification can be measured reliably.
A claim is an amount that the Group seeks to collect from the customer or third party as reimbursement for costs not included in the contract price.
Claims are included in contract revenue only when it is probable that the cost incurred are recoverable and the amount can be reliably measured.
Engineering
Revenues from engineering services are recognized using the method of the level of progress on the basis of the progress or percentage of
completion in the accounting periods in which the services are provided. In this type of income there is a single performance obligation, which is
performed when the service is provided over time, based on the degree of progress.
ii) Real-estate – Real estate, urban and industrial lots
Sale of Real estate
Revenue from sales of real estate properties is recognized when control over the property has been transferred to the client with the delivery
record. Revenue is measured based on the price agreed under the contract. Until this is met, the incomes received will be counted as customer
advances. These sales contracts have two performance obligations: i) the one corresponding to the transfer of the property,
- 26 -

which includes the common areas of the building where these real estate are located, and ii) the one corresponding to the transfer of the common
area outside the real estate assets but that are part of the real estate projects, which are recognized when the common area has been delivered.
Sale of urban lots
Revenue related to sales of urban lots is recognized when control over the property is transferred to the customer. Until this is met, the incomes
received will be recognized as customer advances. Revenue is measured based on the transaction price agreed under the contract. These sales
contracts have a single performance obligation for the sale of lots, which is executed upon delivery of the sale of the assets.
Sale of industrial lots
Revenue related to sales of industrial lots is recognized when control over the property has been transferred to the customer. Until this is met, the
incomes received will be counted as customer advances. These sales contracts have two performance obligations: i) transfer of the industrial lot
and ii) urban authorization of the industrial lot.
iii) Infrastructure
Income for provided services of oil and gas extraction, fuel dispatch and other services
Revenues from the provision of these services are recognized using the level of advance method based on the progress or percentage of
completion in the accounting periods in which the provision of the service takes place. In this type of income there is a single performance
obligation, which is performed when the service is provided over time, based on the level of progress.
Income from the sale of oil and derivative products
Revenue from the sale of goods is recognized when the control of the assets is transferred to the customer, which is when the goods are delivered.
In this type of income there is only one performance obligation for the sale of oil; which is executed at the delivery of the goods.
Income from concession services
Revenues from concession services correspond to operation and maintenance services, and are recognized according to its nature in the
accounting periods in which the service is provided. In this type of income there is only one performance obligation, executed when the service is
provided.
2.27 Recognition of cost and expenses
Construction contracts
The costs of construction contracts are recognized as an expense in the period in which they are incurred.
Contract costs include all direct costs such as materials, labor, subcontracting costs, manufacturing and supply costs of equipment, start-up costs
and indirect costs. Periodically, the Group evaluates the reasonableness of the estimates used in the determination of the
percentage-of-completion. If, as a result of this evaluation, there are modifications to the revenue or cost previously estimated, or if the total
estimated cost of the project exceeds expected revenues, an adjustment is made in order to reflect the effect in results of the period in which the
adjustment or loss is incurred.
When the outcome of a construction work cannot be estimated reliably, the revenue of the contract is recognized only up to the amount of the
contractual costs incurred and that are likely to be recovered.
- 27 -

Costs for sale of oil and derivative products
The costs of the services rendered and the costs of sales of petroleum and derivative products are recognized when they are incurred,
simultaneously with the recognition of related revenues. Other costs and expenses are recognized as they accrue, regardless of when they are paid
and are recorded in the accounting periods to which they relate.
Costs for concession operation services
The costs of the operation and maintenance services are recognized when they are incurred, simultaneously with the recognition of related
revenues. Other costs and expenses are recognized as they are accrued, regardless of when they are paid and are recorded in the accounting
periods with which they are related.
2.28 Leases
a) The Group as a lessee
Operating leases
Leases in which a significant portion of the risks and rewards of ownership are retained by the lessor are classified as operating leases. Payments
made under operating leases, including prepayments (net of any incentives received from lessor) are recognized in the consolidated income
statement under the straight-line method over the lease term. The Group’s major kinds of operating leases are leases of machinery, computer
equipment, printing equipment, among others.
Finance leases
Leases in which the Group assumes substantially all the risks and rewards of ownership of an asset are classified as finance leases. Each lease
payment is allocated between the liability and finance charges so as to produce a constant periodic rate of interest on the remaining balance of the
liability for each period. The corresponding rental obligations, net of finance charges, are included in other payables, short- and long-term in the
consolidated statement of financial position. The interest element of the finance cost is charged to the consolidated income statement of over the
lease period so as to produce a constant periodic rate of interest on the remaining balance of the liability for each period. The property, plant and
equipment acquired under finance leases are depreciated over the useful life of the asset or the lease term.
b) The Group as a lessor
Operating leases and the leased assets are stated in the statement of financial position based on the nature of the asset. Revenue from operating
leases are recognized under the straight-line method over the lease term and the incentives given to lessees reduce the revenue obtained from
leases.
2.29 Dividend distribution
Dividend distribution to the Group shareholders is recognized as a liability in the financial statements in the period in which the dividends are
approved.
2.30 Significant non-operating items
Significant non-operating items are separately shown in the financial statements when they are necessary to provide an adequate understanding of
the Group’s financial performance. These material items are income or expenses shown separately due to their nature or significant amount.
- 28 -

2.31 Restatement of the Statement of Income as of December 31, 2017
The consolidated statement of income for the year ended December 31, 2017 included the net gain on the sale of our former subsidiary GMD
(S/218.3 million (US$64.6)) under the “Gain from the sale of investments” line item, rather than the “Profit from discontinued operations” line
item in accordance with IAS 8, Accounting Policies, changes in Accounting Estimates and errors, such amount has been restated in application of
IFRS 5 paragraph 33 a).
2017
Audited
Restatement
GMD (i)
2017
Restated
Revenues 6,080,142 — 6,080,142
Operating costs (5,407,355) — (5,407,355)
Gross profit (loss) 672,787 — 672,787
Administrative expenses (429,181) — (429,181)
Other (expenses) income, net (20,545) — (20,545)
Gain (loss) from the sale of investments 274,363 (218,264) 56,099
Operating profit (loss) 497,424 (218,264) 279,160
Financial expenses (185,445) — (185,445)
Financial income 15,407 — 15,407
Share of the profit or loss in associates and joint ventures 1,327 — 1,327
Profit (loss) before income tax 328,713 (218,264) 110,449
Income tax (123,037) 63,940 (59,097)
Profit (loss) from continuing operations 205,676 (154,324) 51,352
Profit from discontinued operations 3,562 154,324 157,886
Profit of the year 209,238 209,238
Earnings per share attributable to owners of the Company during the year 0.225 0.225
Loss per share from continuing operations attributable to owners of the
Company during the year 0.220 (0.014)
(i) In application of IAS 8 paragraph 42, line items affected of the Statement of Income are disclosed.
2.32 Reclassified discontinued operations from 2016 and 2017
As part of the divestment process, the results of operations of the following entities have been reclassified to discontinued operations for the year
ended December 31, 2016 and 2017: i) sale of investments in subsidiaries completed in 2018 (Stracon GyM S.A., CAM Chile SpA, CAM
Servicios del Peru S.A., and; ii) planned sale of subsidiary Adexus S.A. See Note 37. These reclassifications have no effect on net profit (loss) as
previously reported.
3 STANDARDS, AMENDMENTS, AND INTERPRETATION ADOPTED IN 2018
3.1. Current standards, amendments, and interpretations adopted
The following current standards, amendments to the policies and interpretations were adopted by the Group on January 1, 2018:
• IFRS 9, financial instruments comprise mainly: i) the classification and measurement of financial assets and financial liabilities; ii) the new
impairment model for the recognition of expected credit losses; and iii) the new hedge accounting model.
• IFRS 15, income resulting from revenues from contracts with customers, outlines a single integral model for the entities that will be used in
accounting for the income derived from contracts with customers. It replaces the previous income recognition guide, including IAS 18,
income, IAS 11, construction contracts and related interpretations.
• The amendments to IFRS 15 clarify how to: i) identify a performance obligation in a contract; ii) determine if a company is a director or an
agent and iii) determine whether the income from the granting of a license should be recognized at a specific time or over time. In addition,
the amendments to IFRS 15 include two additional transition exceptions.
• The amendments to IFRS 2, payment on the basis of the shares, provide accounting requirements for i) the effects of the conditions of
becoming and not becoming a beneficiary (Vesting and no-Vesting) in the measurement of cash payments settled on the basis of shares; ii)
payment transactions based on shares with a net settlement characteristic for the withholding tax obligations; and iii) a modification of the
terms and conditions of a payment based on assets that change the classification of a payment transaction in cash to payment in equity.
• The amendments to IAS 28, investments in associates and joint ventures, clarify that the choice to measure at fair value through profit or
loss an investment in an associate or a joint venture that retains an entity that is a capital organization of the risk, or other qualifying entity,
is available for each investment in an associate or joint venture on the basis of investment by investment, after its initial recognition.

• Interpretation of IFRIC 22, Transactions in foreign currency and anticipated consideration, clarifies that: i) the date of the transaction, in
order to determine the exchange rate, is the date of initial recognition of the non-monetary asset paid in advance and of the liability for
deferred income; and ii) if there are several payments or collections in advance, a transaction date is established for each payment or
collection.
• Transfers of real estate investments (amendments to IAS 40, real estate investments) state that an entity will transfer real property to, or
from, real estate investments when, and only when, there is evidence of a change in use. A change in use occurs if the property meets, or
fails to meet, the definition of real estate investment. A change in management’s intentions for the use of a property by itself does not
constitute evidence of a change in use.
Current standards, amendments, and interpretations adoption did not have a significant impact on the Group’s financial statements, except for
IFRS 9, IFRS 15 and the amendments to IFRS 15, described below.
IFRS 9 “Financial Instruments”
a) Transition
IFRS 9, financial instruments, replaced IAS 39, financial instruments: recognition and measurement and was applied in accordance with the
transitional provisions of IFRS 9, which require an entity to apply IFRS 9 in accordance with IAS 8, Accounting policies, change in accounting
estimates and errors. The transitional provisions of IFRS 9 for the classification and measurement of financial assets and financial liabilities
require an entity to retrospectively apply the requirements of IFRS 9.
In accordance with the optional exception of IFRS 9, the Group chose not to redo comparative figures.
IFRS 9 does not apply to financial assets and financial liabilities that have been written off on the date of the initial adoption (i.e. the date an entity
applies IFRS 9 for the first time), which for the Group corresponds to January 1, 2018).
b) Main changes
In general, the main changes introduced by IFRS 9 relating to the classification and measurement of financial assets, the introduction of a new
impairment model based on expected credit losses (instead of losses incurred under IAS 39) and the accounting treatment of hedges.
- 29 -

Classification and measurement of financial assets and liabilities
The table below explains the original measurement categories under IAS 39 and the new measurement categories under IFRS 9 for each class of
financial assets of the Group and financial liabilities as of January 1, 2018:
IAS 39 IFRS 9
Financial assets
Measurement
category Balance
Measurement
category Balance
Cash and cash equivalents Loans and accounts receivables 626,180 Amortized cost 626,180
Trade accounts receivables and other
account receivables Loans and accounts receivables 1,447,629 Amortized cost 1,447,629
Unbilled work in progress Loans and accounts receivables 672,163 Amortized cost 672,163
Financial assets related to Concession
arrangements Loans and accounts receivables 952,780 Amortized cost 952,780
Accounts receivable from related
parties Loans and accounts receivables 874,682 Amortized cost 872,110
Other accounts receivable Fair value through profit or loss 181 Fair value through profit or loss 181
IAS 39 IFRS 9
Financial liabilites
Measurement
category Balance
Measurement
category Balance
Other financial loans Amortized cost 1,561,754 Amortized cost 1,561,754
Finance leases Amortized cost 128,309 Amortized cost 128,309
Accounts payable and other accounts
payable Amortized cost 2,054,217 Amortized cost 2,054,217
Accounts payable to related parties Amortized cost 81,128 Amortized cost 81,128
Derivative financial instruments used
in hedging transactions
Fair value through other
comprehensive income 383
Fair value through other
comprehensive income 383
c) New Impairment Model
The model of credit loss incurred by IAS 39 was replaced by the expected credit loss model by IFRS 9. The expected credit losses are the present
value of all unpaid amounts over the expected life of the financial instrument.
The new impairment model generally requires entities to recognize the expected credit losses in gains and losses for all financial assets, including
those that originated or acquired recently. Although IFRS 9 does not require recognition of a provision for the loss in the initial recognition of the
new financial asset, it is required for the following reporting date. This treatment is different from that of IAS 39, which did not require
recognizing any impairment unless and until a loss event occurred after the initial recognition of the financial asset.
Under IFRS 9, impairment is measured as i) expected credit losses in 12 months; or ii) expected credit losses over the life of the instrument.
The Group applies the simplified approach (which estimates the lifetime loss of the financial instrument), for the commercial debtors of the Real
Estate business line of income, and the general approach for trade accounts receivable, pending work in progress receivable and other accounts
receivable; the same that requires evaluating whether or not a significant increase in risk exists to determine whether the loss should be estimated
based on 12 months after the reporting date or during the entire life of the asset.
- 30 -

The Group has established a policy to conduct an evaluation, at the end of each reporting period, to identify whether the asset has suffered a
significant increase in credit risk since the initial date. Both the credit losses expected at 12 months and the expected credit losses during the life
of the asset are calculated individually or collectively, depending on the nature of the portfolio.
d) Hedge accounting
As permitted by IFRS 9, the Group continues to apply the requirements contained in IAS 39 for hedge accounting.
At the beginning of a hedging operation, the Group documents the relationship between the hedging instruments and the elements covered, as well
as its risk management objectives and its strategy for carrying out various hedging transactions. The Group also documents its assessment, both at
the beginning of the hedges and subsequently as to whether the derivative financial instruments used in hedging transactions are highly effective
in offsetting changes in the fair values or cash flows of the hedged items.
The effective portion of changes in the fair value of derivative financial instruments that are designated as hedges of a particular risk associated
with a recognized asset or liability or with a highly probable projected transaction is recognized in Other Comprehensive Income (OCI). The gain
or loss related to the ineffective part, if any, is recognized immediately in the consolidated statement of profit and loss.
The realized gain or loss recognized in the settlement of a hedging instrument designated as a cash flow hedge will be reclassified to the gains on
the same basis as the cash flows received from the hedged item. When a hedging instrument no longer meets the criteria for hedge accounting, the
accumulated gains or losses existing in OCI at that time are recognized in the profits immediately.
IFRS 15 “Revenue from Contracts with Customers” and amendments of IFRS 15
IFRS 15 introduces a 5-step model for revenue recognition for contracts with customers. This model requires that an entity: 1) identify the
contract with the client; 2) identify performance obligations related to that contract; 3) determine the transaction price of the contract; 4) assigning
said transaction price among the performance obligations; and 5) recognize income when (or as) the performance obligations are met. In addition
to recognition and measurement, IFRS 15 also provides new requirements in the presentation and disclosures.
a) Transition
The Group chose to adopt IFRS 15 using the modified retrospective method, with the recognition of transitory adjustments in the opening of
retained income at the date of initial application (January 1, 2018), without restating comparative figures.
IFRS 15 provides for certain optional practical expedients, including those related to the initial adoption of the standard. The Group applied the
following practical expedients after the adoption of IFRS 15 on January 1, 2018:
Practical Resource Description
Contract The Group applied IFRS 15 retrospectively only to contracts that have not been completed as of January 1,
2018.
Contract modifications The Group did not separately evaluate the effects of each contract modification before January 1, 2018.
Instead, it reflects the cumulative effect of all modifications that occurred prior to January 1, 2018, when:
i) satisfied and unsatisfied performance obligations were identified;
ii) the prices of the transaction were determined, and
iii) the transaction price was assigned to satisfied and unsatisfied performance obligations.
- 31 -

The Group evaluated the impact of the adoption of IFRS 9 and IFRS 15 in its consolidated financial statements; the impacts in Equity as of
January 1, 2018, are shown as follows:
As of 1 January 2018
IAS 18/39
Balance
IFRS 9
Adjustments
IFRS 15
Adjustments
IFRS
Balance
Retained earnings 589,167 (2,572) (49,992) 536,603
As a result of the evaluation of IFRS 15, an adjustment of S/49.99 million has been made, which corresponds mainly to the reversal of variable
considerations that came from customer claims for reimbursement of costs that are currently in the process of arbitration. In relation to the
evaluation of IFRS 9, S/2.57 million was adjusted corresponding to the impairment of financial assets with related parties. The adoption of the
new standards did not affect the other comprehensive results.
The new accounting policies on revenue recognition are described in note 2.26.
3.2. Standards and amendments issued to be adopted at a later date
The following standard has been issued and is applicable to the Group for annual periods as of January 1, 2019, and after, its early application is
permitted for entities that adopted IFRS 15:
• IFRS 16, leases, provides a complete model for the identification of lease agreements and their treatment in the financial statements of both
tenants and lessors. It will replace IAS 17, leases, and its interpretation guides.
Considerations in the application of IFRS 16:
It is required that IFRS 16 be applied for annual reporting periods as of January 1, 2019. The Group is not adopting IFRS 16 in advance.
IFRS 16 introduces a single-lease accounting model for lessees that will result in the recognition in the balance sheet of most of its leases with few
potential exceptions. The Group expects that the adoption of IFRS 16 will result in a substantial increase in its assets and liabilities due to the
recognition of assets for the right to use the underlying asset and a lease liability that reflects the present value of the lease payments futures. The
depreciation expense of the right-of-use asset and the interest expense of the lease liability will replace the operating lease expenses recognized in
IAS 17.
During the year 2018, the Group evaluated the impact of the application of IFRS 16 in its consolidated financial statements. In this way, the Group
is reviewing its leasing portfolio and is working on the change of certain internal processes and controls, including the implementation of a new
lease management and accounting system. The Group is also evaluating the options of transition and the practical resources available in IFRS 16.
The following amendments to the standards have been issued and are applicable to the Group for its annual periods as of January 1, 2019, and
subsequently, its early application is permitted:
• The functions of a prepayment with negative compensation (amendments to IFRS 9, financial instruments) allow financial assets with a
prepayment option that could result in the holder of the option receiving compensation for early termination to meet the single payments of
the principal and interest if certain specific criteria are met.
• Long-term interests in associates and joint ventures (amendments to IAS 28, investments in associates and joint ventures) clarify that an
entity applies IFRS 9, including its impairment requirements, to long-term investments in an associate or joint venture which is part of the
net investment in the associate or joint venture, but to which the equity participation method is not applied.
• Amendments to IFRS 3, business combinations, indicate that an entity will reimburse its previously held interest in a joint operation when it
obtains control of the business.
• Amendments to IFRS 11, joint agreements, indicate that an entity will not reimburse its previously held interest in a joint operation when it
obtains joint control of the business.
• Amendments to IAS 12, income tax, clarify that all the consequences of dividend income tax (that is, the distribution of profits) must be
recognized in profit or loss, regardless of how the tax arises.
- 32 -

• Amendments to IAS 23, borrowing costs, clarify that, if a specific loan is still pending after the related asset is ready for its intended use or
sale, that loan becomes part of the funds that an entity borrows in general when calculating the capitalization rate on general loans.
• Modification of the plan, reduction or liquidation (amendments to IAS 19, benefits for employees) specifies how an entity determines
pension expenses when changes occur in a defined benefit pension plan. When carried out - a correction, restriction or settlement - IAS 19
requires an entity to set aside its net defined benefit or net asset liability. The amendments require an entity to use the updated assumptions
of this remeasurement to determine the current cost of the service and the net interest for the rest of the reporting period after the change in
the plan.
It is not expected that other IFRS or IFRIC interpretations that are not yet implemented may have a significant impact on the consolidated
financial statements.
4 FINANCIAL RISK MANAGEMENT
Financial risk management is carried out by the Group’s Management. Management oversees the general management of risks in specific areas,
such as foreign exchange rate risk, price risk, cash flow, and fair value interest rate risk, credit risk, the use of derivative and non-derivative
financial instruments and the investment of excess liquidity as well as financial risks and carries out periodic supervision and monitoring.
4.1 Financial Risk Factors
The Group’s activities expose it to a variety of financial risks: market risk (including foreign exchange risk, price risk, fair value interest rate risk
and cash flow interest rate risk), credit risk and liquidity risk. The Group’s overall risk management program focuses on the unpredictability of
financial markets and seeks to minimize potential adverse effects on the Group’s financial performance. The Group uses derivative financial
instruments to hedge certain risk exposures in one of its subsidiaries and considers the use of other derivatives in the event that it identifies risks
that may generate an adverse effect for the Group in the short and medium-term.
a) Market risks
i) Foreign exchange risk
The Group is exposed to exchange rate risk as a result of the transactions carried out locally in foreign currency and due to its operations
abroad. As of December 31, 2017, and 2018 this exposure is mainly concentrated in fluctuations of U.S. dollar, the Chilean and Colombian
Pesos. The foreign exchange risk of the investments in Mexico, Bolivia, and Panama are not significant due to the volume of operations.
At December 31, 2018, the consolidated statement of financial position includes the following:
2017 2018
S/(000) USD(000) S/(000) USD(000)
Assets 1,851,309 570,511 2,273,132 674,753
Liabilities 1,982,007 610,788 2,042,176 604,383
- 33 -

The Group’s exchange gains and losses for the Peruvian Sol, the Chilean and Colombian Pesos exposure against the U.S. dollar was:
2016 2017 2018
Gain 742,930 329,751 382,104
Loss (755,680) (323,927) (405,380)
If at December 31, 2018 the Peruvian Sol, the Chilean and Colombian Pesos had strengthened/weakened by 2% against the U.S. dollar, with
all other variables held constant, the pre-tax profit for the year would have increased/decreased by S/0.5 million (S/0.1 million in 2017 and
S/0.3 million in 2016).
The consolidated statement of changes in equity comprises a foreign currency translation adjustment originated by its subsidiaries. The
statement financial position includes assets and liabilities in functional currency equivalent to:
2017 2018
Assets Liabilities Assets Liabilities
CLP 77,199,082 74,447,874 48,129,848 49,728,313
COP 101,300,811 74,319,654 163,560,697 76,978,655
The Group’s foreign exchange translation adjustment for 2018 was positive for S/5.7 million (negative for S/11.3 million in 2017).
ii) Price risk
Management considers that the exposure of the Group to the price risk of its investments in mutual funds, bonds, and equity securities is low
since the invested amounts are not significant. Any fluctuation in their fair value will not have any significant impact on the balances
reported in the consolidated financial statements.
iii) Cash flow and fair value interest rate risk
The Group’s interest rate risk mainly arises from its long-term borrowings. Borrowings issued at variable rates expose the Group to cash
flow interest rate risk. Borrowings issued at fixed rates expose the Group to fair value interest rate risk. Group policy is to maintain most of
its borrowings at fixed rate instruments; 46.9% of total debt in 2018 (57.8% in 2017) was contracted at fixed rates and 53.1% at variable
rates (42.2% in 2017) which consisted of a 27.7% fixed rate plus VAC (adjusted for inflation) and the remaining 25.4% at a variable rate
(22.9% fixed rate + VAC and the remaining 19.3% at a variable rate in 2017).
The debt subject to fixed rate plus VAC is related to a bond issued in Peruvian Sol to finance the GyM Ferrovias Project, Metro Line 1
(Note 20). Any increase in the interest rate resulting from higher inflation will have no significant impact on the Group’s profit because
these revenues are also adjusted for inflation.
During 2018 and 2017 borrowings at variable rates are denominated in Peruvian Sol, and U.S. dollars and the Group’s policy is to manage
their cash flow risk by using interest-rate swaps, which are recognized under hedge accounting. However, regarding the variable rate loans
related to GSP (Note 19 a-ii), Management decided to assume the risk since it expects to pre-pay them before due.
If at December 31, 2018, the Libor rate plus three months had increased/decreased by 5%, with all other variables held constant, the pre-tax
profit for the year would have increased/decreased by S/0.75 million (S/0.49 million in 2017). In 2018 and 2017 there was no significant
ineffectiveness in the cash flow hedge.
- 34 -
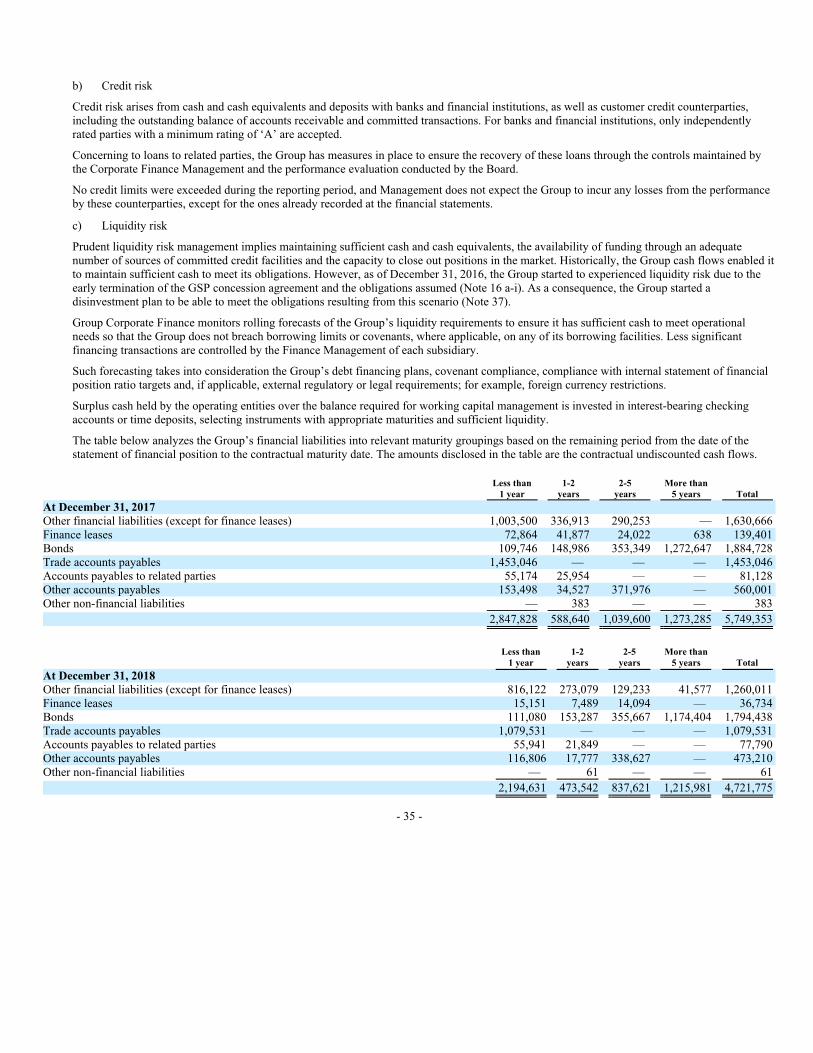
b) Credit risk
Credit risk arises from cash and cash equivalents and deposits with banks and financial institutions, as well as customer credit counterparties,
including the outstanding balance of accounts receivable and committed transactions. For banks and financial institutions, only independently
rated parties with a minimum rating of ‘A’ are accepted.
Concerning to loans to related parties, the Group has measures in place to ensure the recovery of these loans through the controls maintained by
the Corporate Finance Management and the performance evaluation conducted by the Board.
No credit limits were exceeded during the reporting period, and Management does not expect the Group to incur any losses from the performance
by these counterparties, except for the ones already recorded at the financial statements.
c) Liquidity risk
Prudent liquidity risk management implies maintaining sufficient cash and cash equivalents, the availability of funding through an adequate
number of sources of committed credit facilities and the capacity to close out positions in the market. Historically, the Group cash flows enabled it
to maintain sufficient cash to meet its obligations. However, as of December 31, 2016, the Group started to experienced liquidity risk due to the
early termination of the GSP concession agreement and the obligations assumed (Note 16 a-i). As a consequence, the Group started a
disinvestment plan to be able to meet the obligations resulting from this scenario (Note 37).
Group Corporate Finance monitors rolling forecasts of the Group’s liquidity requirements to ensure it has sufficient cash to meet operational
needs so that the Group does not breach borrowing limits or covenants, where applicable, on any of its borrowing facilities. Less significant
financing transactions are controlled by the Finance Management of each subsidiary.
Such forecasting takes into consideration the Group’s debt financing plans, covenant compliance, compliance with internal statement of financial
position ratio targets and, if applicable, external regulatory or legal requirements; for example, foreign currency restrictions.
Surplus cash held by the operating entities over the balance required for working capital management is invested in interest-bearing checking
accounts or time deposits, selecting instruments with appropriate maturities and sufficient liquidity.
The table below analyzes the Group’s financial liabilities into relevant maturity groupings based on the remaining period from the date of the
statement of financial position to the contractual maturity date. The amounts disclosed in the table are the contractual undiscounted cash flows.
Less than 1-2 2-5 More than
1 year years years 5 years Total
At December 31, 2017
Other financial liabilities (except for finance leases) 1,003,500 336,913 290,253 — 1,630,666
Finance leases 72,864 41,877 24,022 638 139,401
Bonds 109,746 148,986 353,349 1,272,647 1,884,728
Trade accounts payables 1,453,046 — — — 1,453,046
Accounts payables to related parties 55,174 25,954 — — 81,128
Other accounts payables 153,498 34,527 371,976 — 560,001
Other non-financial liabilities — 383 — — 383
2,847,828 588,640 1,039,600 1,273,285 5,749,353
Less than 1-2 2-5 More than
1 year years years 5 years Total
At December 31, 2018
Other financial liabilities (except for finance leases) 816,122 273,079 129,233 41,577 1,260,011
Finance leases 15,151 7,489 14,094 — 36,734
Bonds 111,080 153,287 355,667 1,174,404 1,794,438
Trade accounts payables 1,079,531 — — — 1,079,531
Accounts payables to related parties 55,941 21,849 — — 77,790
Other accounts payables 116,806 17,777 338,627 — 473,210
Other non-financial liabilities — 61 — — 61
2,194,631 473,542 837,621 1,215,981 4,721,775
- 35 -

4.2 Capital management risk
The Group’s objectives when managing capital are to safeguard the Group’s ability to continue as a going concern in order to provide returns for
shareholders, benefits for other stakeholders and to maintain an optimal capital structure to reduce the cost of capital. In 2017 the situation of the
Group had lead Management to monitor deviations that might cause the non-compliance of covenants and may hinder renegotiation of liabilities
(Note19-a).
In order to maintain or adjust the capital structure, the Group may adjust the amount of dividends paid to shareholders, return capital to
shareholders, issue new shares or sell assets to reduce debt.
The Group monitors capital based on the gearing ratio. This ratio is calculated as net debt divided by total capital. Net debt is calculated as total
borrowings (including current and non-current borrowings), less cash and cash equivalents. Total capital is calculated as ‘equity’ as shown in the
consolidated statement of financial position plus net debt.
As of December 31, 2017, and 2018, the gearing ratio is presented below indicating the Group’s strategy to keep it in a range from 0.10 to 0.70.
2017 2018
Total financial liabilities and bonds 2,637,630 2,139,714
Less: Cash and cash equivalents (626,180) (801,140)
Net debt 2,011,450 1,338,574
Total equity 2,589,078 2,489,931
Total capital 4,600,528 3,828,505
Gearing ratio 0.44 0.35
4.3 Fair value estimation
For the classification of the type of valuation used by the Group for its financial instruments at fair value, the following levels of measurement
have been established.
• Level 1: Measurement based on quoted prices in active markets for identical assets or liabilities.
• Level 2: Measurement based on inputs other than quoted prices included within Level 1 that are observable for the asset or liability, either
directly (that is, as prices) or indirectly (that is, derived from prices).
• Level 3: Measurement based on inputs for the asset or liability that are not based on observable market data (that is, unobservable inputs,
generally based on internal estimates and assumptions of the Group).
- 36 -

The table below shows the Group’s assets and liabilities measured at fair value on December 31, 2017, and 2018:
Level 1 Level 2 Total
At December 31, 2017
Financial assets
Financial assets at fair value through profit or loss 181 — 181
Financial liabilities
Derivatives used for hedging — 383 383
At December 31, 2018
Financial liabilities
Derivatives used for hedging — 61 61
There were no transfers between levels 1 and 2 during the year.
5 CRITICAL ACCOUNTING ESTIMATES AND JUDGMENTS
Estimates and judgments used are continuously evaluated and are based on historical experience and other factors, including expectations of
future events that are believed to be reasonable under the circumstances.
5.1 Critical accounting estimates and assumptions
The Group makes estimates and assumptions concerning the future. The resulting accounting estimates will, by definition, seldom equal the
related actual results. The estimates and assumptions that have a significant risk of causing a material adjustment to the carrying amounts of assets
and liabilities within the next financial year are addressed below.
a) Estimated impairment of goodwill and other intangible assets with an indefinite useful life
Impairment reviews are undertaken annually to determine if goodwill arising from business acquisitions and other intangible assets with indefinite
useful life are impaired, in accordance with the policy described in Note 2.15-i). For this purpose, goodwill is allocated to the different CGU to
which it relates while other intangible assets with indefinite useful life are assessed individually. The recoverable amounts of the CGU and of
other intangible assets with indefinite useful life have been determined based on the higher of their value-in-use and fair value less costs to sell.
This evaluation requires the exercise of Management’s professional judgment to analyze any potential indicators of impairment as well as the use
of estimates in determining the value in use, including preparing future cash flows, macro-economic forecasts as well as defining the interest rate
at which said cash flows will be discounted.
If the Group experiences a significant drop in revenues or a drastic increase in costs or changes in other factors, the fair value of their business
units might decrease. If management determines that the factors reducing the fair value of the business are permanent, those economic factors will
be taken into consideration to determine the recoverable amount of those business units and therefore, goodwill, as well as other intangible assets
with indefinite useful life may be deemed to be impaired, which may cause their write-down.
In accordance with the impairment evaluations carried out by Management, losses due to deterioration of goodwill and trademarks have been
recognized; they were generated by the decrease in the expected flows as a reduction of the contracts’ “backlog”.
- 37 -

At December 31, 2017, and 2018 the Group has performed a sensitivity analysis increasing or decreasing the assumptions of gross margin,
discount rate, and revenue and terminal growth rate by a 10%, with all the other variables held constant, as follows:
Difference between recoverable amount and carrying amounts
2017 2018
Goodwill
Gross margin (10%) +10% (10%) +10%
Engineering and construction 81.31% 143.63% 0.51% 41.12%
Electromechanical 197.30% 620.85% (9.73%) 38.89%
IT equipment and services 0.32% 38.87% 42.60% 101.27%
Telecommunication services 465.17% 1339.26% — —
Discount rate: (10%) 10% (10%) 10.00%
Engineering and construction 146.07% 86.86% 39.19% 6.65%
Electromechanical 478.08% 354.39% 29.36% 2.97%
IT equipment and services 30.06% 11.25% 77.06% 48.93%
Telecommunication services 2190.66% 1967.37% — —
Terminal growth rate: (10%) +10% (10%) +10%
Engineering and construction 107.41% 117.91% 18.48% 23.30%
Electromechanical 402.19% 416.25% 12.90% 16.34%
IT equipment and services 18.54% 20.52% 59.73% 62.91%
Telecommunication services 2232.86% 2394.81% — —
Difference between recoverable amount and carrying amounts
2017 2018
Trademarks
Revenue growth rate: (10%) +10% (10%) +10%
Morelco 16.37% (4.79%) 75.00% 116.27%
Vial y Vives - DSD (40.72%) (63.32%) 27.40% 55.71%
Adexus 22.10% (0.10%) 21.40% 48.38%
Discount rate: (10%) +10% (10%) +10%
Morelco (7.21%) 22.92% 126.00% 72.33%
Vial y Vives - DSD (58.56%) (45.65%) 29.54% 55.99%
Adexus (2.13%) 28.02% 56.26% 18.49%
Terminal growth rate: (10%) +10% (10%) +10%
Morelco 8.61% 3.17% 91.70% 99.82%
Vial y Vives - DSD (51.36%) (54.47%) 38.99% 44.26%
Adexus 13.27% 8.86% 31.90% 48.38%
In 2018, if the discount rate or terminal growth rate had been 10% below or 10% above Management’s estimates, the Group would not have
recognized a provision for impairment of goodwill; however, at the same variation, the Group would have to recognized a provision for
impairment of the Electromechanical GMA (in 2017 would nor have recognized a provision for impairment).
In 2018, if the revenue growth rate, terminal growth rate or the discount rate had been 10% or had been 10% above Management’s estimates, the
Group would have not recognized a provision for impairment in trademarks (in 2017, would have recognized a provision for impairment of
trademark in Morelco, Vial y Vives-DSD and Adexus).
At December 31, 2017, as a result of these evaluations, an impairment was identified and recorded in the Engineering and Construction CGU,
trademark impairment in Vial y Vives-DSD and goodwill impairment in Morelco (Note 18).
- 38 -

b) Income taxes
Determination of the tax obligations and expenses requires interpretations of the applicable tax laws and regulations. The Group seeks legal and
tax counsel before making any decision on tax matters.
Deferred tax assets and liabilities are calculated on the temporary differences arising between the tax basis of assets and liabilities and the amounts
stated in the financial statement of each entity that makes up the Group, using the tax rates in effect in each of the years in which the difference is
expected to reverse. Any change in tax rates will affect the deferred income tax assets and liabilities. This change will be recognized in the income
statement in the period in which the change takes effect.
Deferred tax assets are recognized only to the extent that it is probable that future taxable profits will be available against which deductible
temporary differences and tax loss carryforwards can be utilized. For this purpose, the Group takes into consideration all available evidence,
including factors such as historical data, projected income, current operations, and tax planning strategies. A tax benefit related to a tax position is
only recognized if it is more likely than not that the benefit will ultimately be realized.
The Group’s maximum exposure to tax contingencies amounts to S/15.7 million.
c) Percentage of completion revenue recognition
Revenues from construction contracts are recognized using the percentage-of-completion method which is based on the completion of a physical
proportion of the overall work contract considering total costs and revenues estimated at the end of the project (Note 2.26 i).
As of December 31, 2016, 2017 and 2018, a sensitivity analysis was performed considering a 10% increase/decrease in the Group’s gross
margins, as follows:
2016 2017 2018
Revenues 2,713,013 2,214,108 1,961,100
Gross profit 29,310 106,902 32,685
% 1.08 4.83 1.67
Plus 10% 1.19 5.31 1.84
Increase in profit before income tax 2,975 10,667 3,399
32,285 117,569 36,084
Less 10% 0.97 4.35 1.50
Decrease in profit before income tax (2,975) (10,667) (3,399)
26,335 96,235 29,286
- 39 -

d) Provision for well closure costs
At December 31, 2018, the present value of the estimated provision for the closure of 158 wells located in Talara amounted to S/20.3 million
(S/16.8 million as of December 31, 2017, for the closure of 144 wells). The well closure liability is adjusted to reflect the changes that resulted
from the passage of time and from reviews of either the date of occurrence or the amount of the present value of the originally estimated
obligations (Note 18-d).
The Group estimates the present value of its future obligation for well closure costs, or well closure liability, and increases the carrying amount of
the asset that will be withdrawn in the future and that is shown under the heading of intangibles in the consolidated statement of financial position.
The pre-tax discount rate used for the present value calculation was 2.46% for Block I and 2.51% for Block V (2.09% for block I and 2.27% for
block V for the year 2017), and 2.98% for Blocks III and IV, (2.72% for the year 2017) based on 3, 5 and 30-year rate used on U.S. bonds
effective at December 31, 2018.
If on December 31, 2017, and 2018, the estimated rate had increased or decreased by 10%, with all variables held constant, the impact on pre-tax
profit would not have been significant.
e) Impairment of investment in Gasoducto Sur Peruano
Based on the termination of the concession agreement, on which Gasoducto Sur Peruano S.A. (GSP) acts as concessionaire (Note 16 a-i), the
Group identified potential impairment indicators affecting the recoverability of its investment. Consequently, the Group has applied the rules
stated in IAS 36 “Impairment of assets” to determine the recoverable amount of this investment.
In that process, the Group has applied judgment to weight the various uncertainties surrounding the amount that can be recovered from this
investment. Management has determined the recoverable amount assuming two key factors: (i) the amount that GSP will recover as a result of the
public auction, and (ii) the validity of its right to subordinate the Odebrecht Group’s debts in GSP.
With relation to the amount to be recovered by GSP, the Group is assuming recovery of the minimum amount established in the concession
agreement, which is equivalent to 72.25% of the Net Carrying Amount (NCA) of the Concession assets. This amount, in substance, represents a
minimum payment to be obtained by GSP based on a public auction (liquidation) to be set up for the adequate transfer of the Concession’s assets
to a new Concessionaire within a year, under the relevant contractual terms and conditions.
With relation to the validity of its right to subordinate the Odebrecht Group’s liabilities in GSP, Management´s assessment, in consultation with its
legal advisors, is that although some uncertainties exist, these do not represent a material risk for exercising this right.
The concession agreement also established two additional tranches of 85% or 100% of the NCA to be recovered as a result of a public auction,
depending on several factors. In any of these scenarios, the Group would be able to recover its total investment, and no additional impairment
would be necessary to be recognized.
The calculation of the impairment estimate assumes a GSP settlement process in accordance with Peruvian legislation, whereby the value of the
asset to be recovered is applied first to the payments of liabilities in the different categories of creditors and the remainder, if the case, to the
payment of the shareholders, taking into account the existing subordination agreements.
f) Impairment of the joint operation in Consorcio Constructor Ductos del Sur (CCDS)
CCDS was mainly engaged in performing the engineering, procurement and construction work for Gasoducto Sur Peruano S.A. (GSP). Due to the
early termination of GSP, the Group applied the rules stated in IAS 36 “Impairment of assets” and IAS 37 “Provisions” to determine the
recoverable amounts of the assets and
- 40 -
liabilities to be recorded, respectively. As of December 31, 2016, adjustments were made to the audited financial statements of CCDS; as a result,
the following adjustments were included in the financial statements of our subsidiary GyM S.A., resulting in a loss of S/15.2 million:
S/000
Income for debt forgiveness (i) 431,484
Indemnification income 33,600
Work in progress impairment (ii) (410,199)
Other provisions (24,915)
Inventories impairment (iii) (33,824)
Financial expenses (7,004)
Property, plant and equipment impairment (4,143)
Others (liability) asset, net (164)
(15,165)
(i) The extinguished trade accounts payable relates to the recognition of the project estimated margin recorded as a liability (Note 2.17).
(ii) The recoverable of work in progress relates to the minimum secured payment to be obtained from GSP.
(iii) Inventories are assets specific in nature and cannot be traded in an active market.
5.2 Critical judgments in applying the accounting policies
Consolidation of entities in which the Group holds less than 50%
The Group owns some direct and indirect subsidiaries of which the Group has control even though it has less than 50% of the voting rights. These
subsidiaries mainly comprise indirect subsidiaries in the real estate business owned through Viva GyM S.A., having the power to affect the
relevant activities that impact the subsidiaries’ returns, even though the Group holds interest between 30% and 50%. Additionally, the Group has
control de facto by a contractual agreement with the majority investor over Promotora Larcomar S.A. of which it owns 46.55% of the equity
interest.
Consolidation of entities in which the Group does not have joint control but holds rights and obligations over the assets and liabilities
The Group assesses, on an ongoing basis, the nature of the contracts signed with one or more parties. If no control or joint control is determined to
be held by the Group, but it has rights over assets and obligations for liabilities under the arrangement, then the Group recognizes its assets,
liabilities, revenue and expenses and its share of any jointly controlled assets or liabilities and any revenue or expense arising under the
arrangement as a joint operation in accordance with IFRS 11 - Joint arrangements (Note 2.2-d).
6. INTERESTS IN OTHER ENTITIES
The consolidated financial statements include the accounts of the Group and its subsidiaries. Additionally, the consolidated financial statements of
the Group include its interest in joint operations in which the Company or certain subsidiaries have joint control with their partners (Note 2.2-d).
- 41 -

a) Main subsidiaries
The following table shows the principal direct and indirect subsidiaries classified by operating segment (Note 7):
Name Country Economic activity
Engineering and Construction:
GyM S.A. Peru,
and Colombia
Civil construction, electro-mechanic assembly, buildings management and implementing housing
development projects and other related services.
GyM Chile S.p.A. Chile Electromechanical assemblies and services to energy, oil, gas and mining sector.
Vial y Vives - DSD S.A. Chile Electromechanical assemblies and services. Develop activities related to the construction of
engineering projects, civil construction projects and electromechanical assemblies, as well as
architectural design and installations in general. Construction and assemblies and
electromechanical services in the sectors of energy, oil, gas and mining.
GMI S.A. Peru, Mexico,
and Bolivia
Advisory and consultancy services in engineering, carrying out studies and projects, managing
projects and supervision of works.
Morelco S.A.S Colombia and
Ecuador
Providing construction and assembly services, supplying equipment and material to design, build,
assemble, operate and maintain all types of mechanical engineering, instrumentation, and civil
work.
Infrastructure:
GMP S.A. Peru Oil and oil by-products extraction services, as well as providing storage and fuel dispatch
services.
Oiltanking Andina Services S.A. Peru Operation of the gas processing plant of Pisco - Camisea.
Transportadora de Gas Natural
Comprimido Andino S.A.C.
Peru Supply, process and market natural gas and its derivative products.
Concar S.A. Peru Highway and roads concessions operation and maintenance.
GyM Ferrovias S.A. Peru Concession for the operation of the public transportation system of the Line 1 of the Lima Metro
(Metro de Lima Metropolitana).
Survial S.A. Peru Concession for constructing, operating and maintaining Section 1 of the “Southern Inter-oceanic”
highway.
Norvial S.A. Peru Concession for restoring, operating and maintaining the “Ancon - Huacho - Pativilca” section of
the Panamericana Norte road.
- 42 -

Name Country Economic activity
Concesion Canchaque S.A.C. Peru Concession for operating and maintaining of the Buenos Aires - Canchaque highway.
Concesionaria Via Expresa Sur
S.A.
Peru Concession for designing, constructing, operating and maintaining the Via Expresa - Paseo de la
Republica in Lima.
Real estate:
VIVA GyM S.A. Peru Developing and managing real estate projects directly or together with other partners.
Parent company operation:
Adexus S.A. Chile, Peru,
Colombia and
Ecuador
IT solutions services.
CAM Holding S.p.A. Chile Electric and technological services for the power industry.
Generadora Arabesco S.A. Peru Implementing projects related to electric power-generating activities.
Larcomar S.A. Peru Exploiting land right to use the Larcomar Shopping Center.
Promotora Larcomar S.A. Peru Building a hotel complex on a plot of land located in the district of Miraflores.
Promotores Asociados de
Inmobiliarias S.A.
Peru Operating in the real-estate industry and engaged in the development and sale of office premises
in Peru.
Negocios del Gas S.A. Peru Construction, operation, and maintenance of the pipeline system to transport natural gas and
liquids.
Inversiones en Autopistas S.A. Peru Holding company of shares, participation or any other credit instrument or investment document.
- 43 -

The following table shows the Group’s subsidiaries and related interest as of December 31, 2018:
Percentage of
common shares
directly held by
Parent (%)
Percentage of
common shares
held by
Subsidiaries (%)
Percentage of
common
shares held by
the group (%)
Percentage of
common shares
held by non-
controlling
interests (%)
Engineering and Construction:
GyM S.A. 98.24% — 98.24% 1.76%
- Morelco S.A.S. — 70.00% 70.00% 30.00%
GyM Chile SpA — 94.49% 99.99% 0.01%
- V y V – DSD S.A. — 94.49% 94.49% 5.51%
GMI S.A. 89.41% — 89.41% 10.59%
- Ecotec — 99.99% 99.99% 0.01%
- Gm Ingenieria y Construcción de CV — 99.00% 99.00% 1.00%
- Gm Ingeniería Bolivia S.R.L. — 99.00% 99.00% 1.00%
- Consorcio Vial La Concordia — 88.00% 88.00% 12.00%
Infrastructure:
GMP S.A. 95.00% — 95.00% 5.00%
- Oiltanking Andina Services S.A. — 50.00% 50.00% 50.00%
- Transportadora de Gas Natural
Comprimido Andino S.A.C. — 99.93% 99.93% 0.07%
Concar S.A. 99.99% — 99.99% 0.01%
GyM Ferrovias S.A. 75.00% — 75.00% 25.00%
Survial S.A. 99.99% — 99.99% 0.01%
Norvial S.A. 67.00% — 67.00% 33.00%
Concesión Canchaque S.A. 99.96% — 99.96% 0.04%
Concesionaria Vía Expresa Sur S.A. 99.98% 0.02% 100.00% —
Percentage of
common shares
directly held by
Parent (%)
Percentage of
common shares
held by
Subsidiaries (%)
Percentage of
common
shares held by
the group (%)
Percentage of
common shares
held by non-
controlling
interests (%)
Real Estate:
Viva GyM S.A. 63.44% 36.10% 99.54% 0.46%
Parent company operations:
Generadora Arabesco S.A. 99.00% — 99.00% 1.00%
Larcomar S.A. 79.66% — 79.66% 20.34%
Promotora Larcomar S.A. 46.55% — 46.55% 53.45%
Promotores Asociados de Inmobiliarias S.A. 99.99% — 99.99% 0.01%
Negocios del Gas S.A. 99.99% 0.01% 100.00% —
Agenera S.A. 99.00% 1.00% 100.00% —
Inversiones en Autopistas S.A. 100.00% — — —
Cam Holding S.p.A. 100.00% — 100.00% —
Adexus S.A. 99.99% 0.01% 100.00% —
- 44 -

The following table shows the Group’s subsidiaries and related interest as of December 31, 2017:
Percentage of
common shares
directly held by
Parent (%)
Percentage of
common shares
held by
Subsidiaries (%)
Percentage of
common
shares held by
the group (%)
Percentage of
common shares
held by non-
controlling
interests (%)
Engineering and Construction:
GyM S.A. 98.23% — 98.23% 1.77%
Stracon GyM S.A. — 87.59% 87.59% 12.41%
GyM Chile SpA — 99.99% 99.99% 0.01%
V y V – DSD S.A. — 94.49% 94.49% 5.51%
Morelco S.A.S. — 70.00% 70.00% 30.00%
GMI S.A. 89.41% — 89.41% 10.59%
Infrastructure:
GMP S.A. 95.00% — 95.00% 5.00%
Oiltanking Andina Services S.A. — 50.00% 50.00% 50.00%
Transportadora de Gas Natural
Comprimido Andino S.A.C. — 99.93% 99.93% 0.07%
Concar S.A. 99.75% — 99.75% 0.25%
GyM Ferrovias S.A. 75.00% — 75.00% 25.00%
Survial S.A. 99.99% — 99.99% 0.01%
Norvial S.A. 67.00% — 67.00% 33.00%
Concesión Canchaque S.A. 99.96% — 99.96% 0.04%
Real Estate:
Viva GyM S.A. 63.44% 36.10% 99.54% 0.46%
Parent company operations:
Cam Holding S.p.A. 100.00% — 100.00% —
Coasin Instalaciones Ltda. — 100.00% 100.00% —
CAM Servicios del Perú S.A. 73.16% — 73.16% 26.84%
Adexus S.A. 99.99% 0.01% 100.00% —
Generadora Arabesco S.A. 99.00% — 99.00% 1.00%
Larcomar S.A. 79.66% — 79.66% 20.34%
Promotora Larcomar S.A. 46.55% — 46.55% 53.45%
Promotores Asociados de Inmobiliarias
S.A. 99.99% — 99.99% 0.01%
Negocios del Gas S.A. 99.99% 0.01% 100.00% —
Agenera S.A. 99.00% 1.00% 100.00% —
Inversiones en Autopistas S.A. 99.99% 0.01% 100.00% —
In June 2018, the Company increased its interest in the shares of Adexus S.A. to 100% (Note 33-a). All investments in subsidiaries have been
included in the consolidation. The percentage of voting rights in those subsidiaries is directly held by the Parent Company and do not significantly
differ from the percentage of shares held.
In 2017, the Group sold GMD S.A. and, in 2018, the subsidiary Cam Servicios del Peru S.A. was sold as well as the following indirect
subsidiaries: i) Stracon GyM S.A. through GyM S.A. and ii) Cam Chile SpA, through Cam Holding SpA. These investments were deconsolidated
from the Company, and their operations are shown in Note 37.
In August 2016, the Company had acquired additional interest in the share capital of Adexus S.A. to obtain control (Note 33-a).
- 45 -
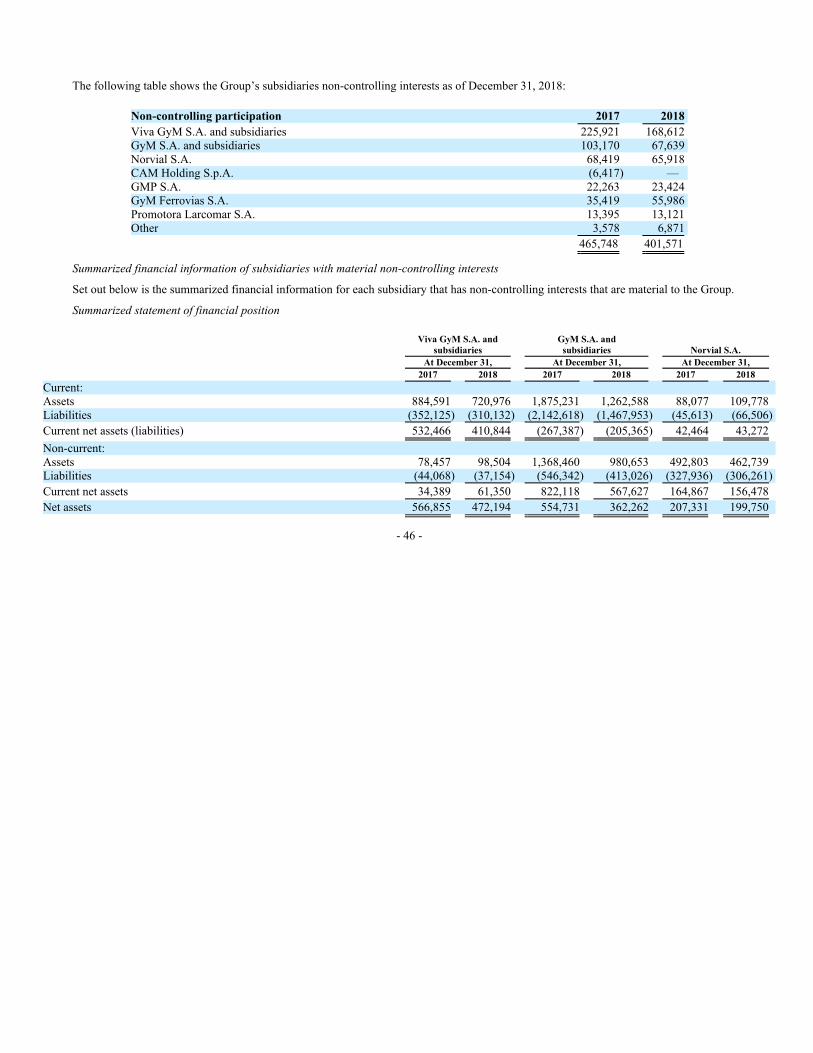
The following table shows the Group’s subsidiaries non-controlling interests as of December 31, 2018:
Non-controlling participation 2017 2018
Viva GyM S.A. and subsidiaries 225,921 168,612
GyM S.A. and subsidiaries 103,170 67,639
Norvial S.A. 68,419 65,918
CAM Holding S.p.A. (6,417) —
GMP S.A. 22,263 23,424
GyM Ferrovias S.A. 35,419 55,986
Promotora Larcomar S.A. 13,395 13,121
Other 3,578 6,871
465,748 401,571
Summarized financial information of subsidiaries with material non-controlling interests
Set out below is the summarized financial information for each subsidiary that has non-controlling interests that are material to the Group.
Summarized statement of financial position
Viva GyM S.A. and
subsidiaries
GyM S.A. and
subsidiaries Norvial S.A.
At December 31, At December 31, At December 31,
2017 2018 2017 2018 2017 2018
Current:
Assets 884,591 720,976 1,875,231 1,262,588 88,077 109,778
Liabilities (352,125) (310,132) (2,142,618) (1,467,953) (45,613) (66,506)
Current net assets (liabilities) 532,466 410,844 (267,387) (205,365) 42,464 43,272
Non-current:
Assets 78,457 98,504 1,368,460 980,653 492,803 462,739
Liabilities (44,068) (37,154) (546,342) (413,026) (327,936) (306,261)
Current net assets 34,389 61,350 822,118 567,627 164,867 156,478
Net assets 566,855 472,194 554,731 362,262 207,331 199,750
- 46 -
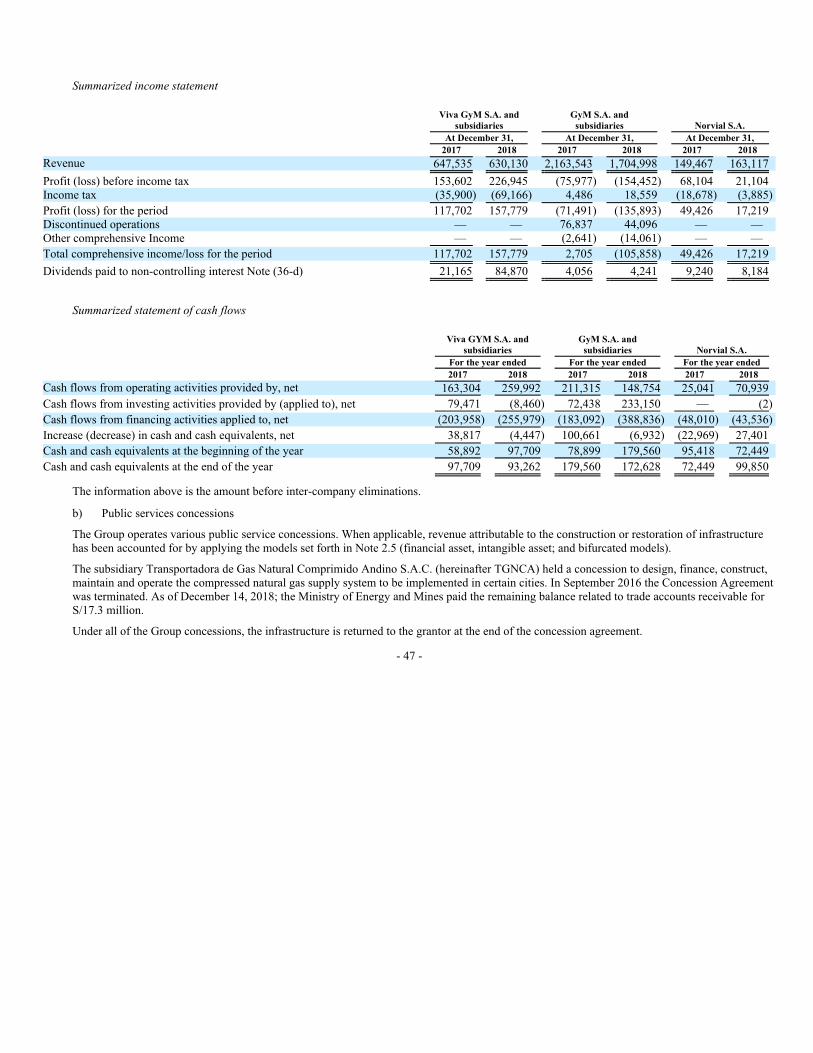
Summarized income statement
Viva GyM S.A. and
subsidiaries
GyM S.A. and
subsidiaries Norvial S.A.
At December 31, At December 31, At December 31,
2017 2018 2017 2018 2017 2018
Revenue 647,535 630,130 2,163,543 1,704,998 149,467 163,117
Profit (loss) before income tax 153,602 226,945 (75,977) (154,452) 68,104 21,104
Income tax (35,900) (69,166) 4,486 18,559 (18,678) (3,885)
Profit (loss) for the period 117,702 157,779 (71,491) (135,893) 49,426 17,219
Discontinued operations — — 76,837 44,096 — —
Other comprehensive Income — — (2,641) (14,061) — —
Total comprehensive income/loss for the period 117,702 157,779 2,705 (105,858) 49,426 17,219
Dividends paid to non-controlling interest Note (36-d) 21,165 84,870 4,056 4,241 9,240 8,184
Summarized statement of cash flows
Viva GYM S.A. and
subsidiaries
GyM S.A. and
subsidiaries Norvial S.A.
For the year ended For the year ended For the year ended
2017 2018 2017 2018 2017 2018
Cash flows from operating activities provided by, net 163,304 259,992 211,315 148,754 25,041 70,939
Cash flows from investing activities provided by (applied to), net 79,471 (8,460) 72,438 233,150 — (2)
Cash flows from financing activities applied to, net (203,958) (255,979) (183,092) (388,836) (48,010) (43,536)
Increase (decrease) in cash and cash equivalents, net 38,817 (4,447) 100,661 (6,932) (22,969) 27,401
Cash and cash equivalents at the beginning of the year 58,892 97,709 78,899 179,560 95,418 72,449
Cash and cash equivalents at the end of the year 97,709 93,262 179,560 172,628 72,449 99,850
The information above is the amount before inter-company eliminations.
b) Public services concessions
The Group operates various public service concessions. When applicable, revenue attributable to the construction or restoration of infrastructure
has been accounted for by applying the models set forth in Note 2.5 (financial asset, intangible asset; and bifurcated models).
The subsidiary Transportadora de Gas Natural Comprimido Andino S.A.C. (hereinafter TGNCA) held a concession to design, finance, construct,
maintain and operate the compressed natural gas supply system to be implemented in certain cities. In September 2016 the Concession Agreement
was terminated. As of December 14, 2018; the Ministry of Energy and Mines paid the remaining balance related to trade accounts receivable for
S/17.3 million.
Under all of the Group concessions, the infrastructure is returned to the grantor at the end of the concession agreement.
- 47 -

The concessions held by the Group are as follows as of December 31, 2018:
Name of
Concession Description
Estimated
investment Consideration
Ordinary
shares held
Concession
termination
Accounting
model
Survial S.A. This company operates and
maintains a 750 km road from the
San Juan de Marcona port to
Urcos, Peru, which is connected
to an interoceanic road. The road
has five toll stations and three
weigh stations.
US$98.9 million Transaction secured by the
Peruvian Government involving
from annual payments for the
maintenance and operation of the
road, which is in charge of the
Peruvian Ministry of Transport and
Communications (MTC).
99.90% 2032 Financial asset
Canchaque S.A.C. This company operates and
periodically maintains a 78 km
road which connects the towns of
Buenos Aires and Canchaque, in
Peru The road has one toll station.
US$29 million Transaction secured by the
Peruvian Government regardless
the traffic volume.
Revenue is secured by an annual
minimum amount of US$
0.3 million.
99.96% 2025 Financial asset
Concesionaria. La
Chira S.A.
Designing, financing,
constructing, operating and
maintaining project called “Planta
de Tratamiento de Aguas
Residuales y Emisario Submarino
La Chira”. The Project will treat
approximately 25% of
wastewaters in Lima.
S/250 million Transaction secured by the
Peruvian Government consisting of
monthly and quarterly payments
settled by Sedapal’s collection
trust.
50.00% 2036 Financial asset
GyM Ferrovias S.A. Concession for the operation of
Line 1 of the Lima Metro, Peru’s
only urban railway system in
Lima city, which
includes (i) operation and
maintenance of the five existing
trains, (ii) operation and
maintenance and the acquisition
of 19 trains on behalf of the
Peruvian Government and (iii)
design and construction of the
repair yard and maintenance of
railway.
S/549.8 million Transaction secured by the
Peruvian Government involving a
quarterly payment received from
MTC based on km travelled per
train.
75.00% 2041 Financial asset
- 48 -

Name of
Concession Description
Estimated
investment Consideration
Ordinary
shares held
Concession
termination
Accounting
model
Norvial S.A. The Company operates and
maintains part of the only
highway that connects Lima to
the northwest of Peru. This
183 km road known as Red Vial 5
runs from the cities of Ancón to
Pativilca and has three toll
stations.
US$152 million From users (self-financed
concession; revenue is derived
from collection of tolls).
67.00% 2028 Intangible
Via Expresa Sur S.A. The Company obtained the
concession for designing,
financing, building, operating and
maintaining the infrastructure
associated with the Vía Expresa
Sur Project.
This project involves the second
stage expansion of the Via
Expresa - Paseo de la Republica,
between Av. Republica de
Panama and and Panamericana
highway.
US$196.8 million The contract gives the right of
collection from users; however
the Peruvian Government shall
pay the difference when the
operating revenue obtained is
below US$18 million during the
first two years and below
US$19.7 million from the third
year to the fifteenth year of the
effective period of the financing,
with a ceiling of US$10 million.
In June 2017, the contract was
suspended temporarily for one
year by agreement between the
Concessionaire and the grantor.
The suspension was extended for
an additional year.
99.98% 2053 Bifurcated
Recaudo Trujillo S.A.C. Design, implementation,
operation, technological
maintenance and renewal
(estimate) of the single system of
electronic collection.
Design, implementation,
operation and maintenance of the
Clearing house Implementation of
the Fleet Control Center, as well
as training to personnel.
US$40.2 million Economic consideration resulting
from applying the “price for
validation” considering daily
validations input on the system to
be managed through a trust.
95.00% 2036 Intangible
- 49 -

c) Main joint operations
At December 31, 2018, the Group is a partner to 46 Joint Operations with third parties (64 at December 31, 2017, and 69 at December 31, 2016).
The table below lists the Group’s major Joint Operations.
Percentage of interest
Joint operations 2016 2017 2018
Graña y Montero S.A.A.
- Concesionaria la Chira S.A. 50.00% 50.00% 50.00%
GyM S.A.
- Consorcio Constructor Alto Cayma 50.00% 50.00% 50.00%
- Consorcio Alto Cayma 49.00% 49.00% 49.00%
- Consorcio Lima Actividades Comerciales 50.00% 50.00% 50.00%
- Consorcio Norte Pachacutec 49.00% 49.00% 49.00%
- Consorcio La Chira 50.00% 50.00% 50.00%
- Consorcio Río Urubamba 50.00% 50.00% 50.00%
- Consorcio Vial Quinua 46.00% 46.00% 46.00%
- Consorcio Rio Mantaro 50.00% 50.00% 50.00%
- Consorcio GyM – CONCIVILES 66.70% 66.70% 66.70%
- Consorcio Construcciones y Montajes CCM 25.00% 25.00% 25.00%
- Consorcio HV GyM 50.00% 50.00% 50.00%
- Consorcio Stracon Motta Engil JV 50.00% 50.00% —
- Consorcio Huacho Pativilca 67.00% 67.00% 67.00%
- Consorcio Constructor Chavimochic 26.50% 26.50% 26.50%
- Consorcio Constructor Ductos del Sur 29.00% 29.00% 29.00%
- Consorcio Italo Peruano 48.00% 48.00% 48.00%
- Consorcio Menegua 50.00% 50.00% 50.00%
- Consorcio Energia y Vapor 50.00% 50.00% 50.00%
- Consorcio Ermitaño 50.00% 50.00% 50.00%
- Consorcio para la Atención y Mantenimiento de Ductos 50.00% 50.00% 50.00%
- Consorcio Lima Actividades Comerciales Sur 50.00% 50.00% 50.00%
- Consorcio CDEM — 85.00% 85.00%
- Consorcio Chicama - Ascope — 50.00% 50.00%
- Consorcio TNT Vial y Vives - DSD Chile LTDA — 50.00% 50.00%
- Consorcio La Gloria 49.00% 49.00% 49.00%
- Consorcio GyM Sade Skanska 50.00% 50.00% 50.00%
- Constructora Incolur DSD Limitada 50.00% 50.00% 50.00%
- Consorcio Chiquintirca — 40.00% 40.00%
- Consorcio Vial ICAPAL — 10.00% 10.00%
GMP S.A.
- Consorcio Terminales 50.00% 50.00% 50.00%
- Terminales del Peru 50.00% 50.00% 50.00%
GMD S.A.
- Consorcio Cosapi-Data - GMD S.A. 70.00% — —
- Consorcio The Louis Berger Group Inc. - GMD 66.45% — —
- Consorcio Procesos Digitales 43.65% — —
- Consorcio GMD S.A. - Indra S.A. 50.00% — —
- Consorcio Fabrica de Software 50.00% — —
- Consorcio Gestion de Procesos Electorales (ONPE) 50.00% — —
- Consorcio Lima Actividades Sur 50.00% — —
- Consorcio Latino de Actiuvidades Comerciales de Clientes Especiales 50.00% — —
- Consorcio Latino de Actividades Comerciales de 75.00% — —
- Consorcio Gestion de Procesos Junta de Gobernadores 45.00% — —
- Consorcio Soluciones Digitales 38.00% — —
- Consorcio de Gestion de la Informacion 56.00% — —
- Consorcio de la disponibilidad PKI 70.00% — —
- 50 -

Percentage of interest
Joint operations 2016 2017 2018
CONCAR S.A.
- Consorcio Ancón-Pativilca 67.00% 67.00% 67.00%
- Consorcio Peruano de Conservación 50.00% 50.00% 50.00%
- Consorcio Manperán 67.00% 67.00% 67.00%
- Consorcio Vial Sierra 50.00% 50.00% 100.00%
- Consorcio Vial Ayahuaylas — 99.00% 99.00%
- Consorcio Vial Sullana — 99.00% 99.00%
-Consorcio Vial del Sur — 99.00% 99.00%
Viva GyM S.A.
- Consorcio Panorama 35.00% 35.00% —
CAM HOLDING S.p.A
- Consorcio Mecam 50.00% 50.00% —
- Consorcio Seringel 50.00% 50.00% —
GMI S.A.
- Consorcio Poyry-GMI — 40.00% 40.00%
- Consorcio Internacional Supervisión Valle Sagrado — 33.00% 33.00%
- Consorcio Supervisor Ilo — 55.00% 55.00%
All of the joint arrangements listed above operate in Peru, Chile, and Colombia.
The table below provides a description of the main activities carried out by these joint operations:
Joint Operations in Economic activity
Graña y Montero S.A.A. Construction, operation and maintenance of La Chira wastewater treatment plant in the south of Lima. The project is
aimed to solve Lima’s environmental problems caused by sewage discharged directly into the sea.
GyM S.A. Theses joint operations are carried out through the four divisions of the engineering and construction segment (Note
7).
GMP S.A. Consorcio Terminales and Terminales del Peru provide services for receiving, storing, shipping and transporting
liquid hydrocarbons, such as gasoline, jet fuel, diesel fuel and residual among others.
CONCAR S.A. Concar’s joint operations provides rehabilitation service, routine and periodic maintenance of the road; and road
conservation and preservation services.
The consolidated financial statements do not include any other type of entities in addition to those mentioned above, such as trust funds or special
purpose entities.
7 SEGMENT REPORTING
Operating segments are reported consistently with the internal reports that are reviewed by the Group’s chief decision-maker; that is, the
Executive Committee, which is led by the Corporate General Manager. This Committee acts as the maximum authority in operations decision
making and is responsible for allocating resources and evaluating the performance of each operating segment.
- 51 -

The Group’s operating segments are assessed by the activities of the following business units: (i) engineering and construction, (ii) infrastructure,
and (iii) real estate.
As set forth under IFRS 8, reportable segments based on the level of revenue is: ‘engineering and construction’. However, the Group has
voluntarily decided to report on all its operating segments as detailed in this Note.
The revenues derived from foreign operations (Chile, Colombia, Bolivia, and Guyana) comprise 14.2% of the Group’s total revenue reported in
2018 (10.6% in 2017 and 13.2% in 2016).
Sales between segments are carried out at arm’s length, are not material, and are eliminated on consolidation. The revenue from external parties is
measured in a manner consistent with that in the income statement. Sale of goods relate to the real estate segment. Revenue from services relate to
all other segments.
Group sales and receivables are not concentrated in a few customers. There is no external customer that represents 10% or more of the Group’s
revenue.
The principal activities of the Group in each operating segments are as follows:
a) Engineering and construction: This segment includes from traditional engineering services such as structural, civil and design engineering,
and architectural planning to advanced specialties including process design, simulation, and environmental services at three divisions; i)
civil works, such as the construction of hydroelectric power stations and other large infrastructure facilities; (ii) electro-mechanic
construction, such as concentrator plants, oil, and natural gas pipelines, and transmission lines; iii) building construction, such as office
buildings, residential buildings, hotels, affordable housing projects, shopping centers, and industrial facilities.
b) Infrastructure: The Group has long-term concessions or similar contractual arrangements in Peru for three toll roads, the Lima Metro, a
wastewater treatment plant in Lima, four producing oil fields, a gas processing plant and operation and maintenance services for
infrastructure assets.
c) Real Estate: The Group develops and sells homes targeted to low and middle-income population sectors which are experiencing a
significant increase in disposable income, as well as, office and commercial space to a lesser extent.
d) Parent Company Operation corresponds to the services which the Holding company provides, management, logistics and accounting
services, among others.
The Executive Committee uses adjusted earnings before interest, tax, depreciation, and amortization (EBITDA) to assess the performance of
operating segments.
Profit before income tax reconciles to EBITDA as follows:
2016 2017 2018
(as restated)
(Loss)/profit before income tax (708,134) 45,112 133,948
Discontinued operations 104,354 210,431 36,785
Financial cost, net 179,829 137,035 197,057
Depreciation 118,832 109,342 86,335
Amortization 64,572 70,383 103,174
EBITDA (*) (240,546) 572,303 557,299
- 52 -

EBITDA for each segment is as follows:
2016 2017 2018
Engineering and construction 19,255 119,987 19,242
Infrastructure 237,752 300,935 411,502
Real state 121,420 177,286 240,991
Parent company operations (1,025,197) 125,938 (27,802)
Intercompany eliminations 406,546 (151,843) (86,634)
Total EBITDA (240,546) 572,303 557,299
Backlog refers to the expected future revenue under signed contracts and legally binding letters of intent. The breakdown by operating segments
as of December 31, 2018, and the dates in which they are estimated to be realized is shown in the following table:
Annual Backlog
2018 2019 2020 2021+
Engineering and construction 2,644,386 1,755,890 725,351 163,145
Infrastructure 1,759,849 600,630 570,114 589,108
Real state 195,566 — 177,135 18,431
Intercompany eliminations (351,865) (115,748) (119,221) (116,897)
4,247,936 2,240,772 1,353,379 653,787
- 53 -

The following table shows the Group’s financial statements by operating segments:
Infrastructure
Engineering
and
construction Energy
Toll
roads Transportation
Water
treatment
Real
estate
Parent
Company
Operations Eliminations Consolidated
As of December 31, 2017
Assets.-
Cash and cash equivalent 184,401 43,878 121,901 161,073 4,204 85,187 25,536 — 626,180
Financial asset at fair value through profit or
loss 181 — — — — — — — 181
Trade accounts receivables 891,252 64,364 128,124 108,706 604 45,897 274,522 2,204 1,515,673
Work in progress 55,774 — — — — — 6,030 — 61,804
Accounts receivable from related parties 230,607 2,746 62,525 3,072 8,852 69,382 76,006 (352,438) 100,752
Other accounts receivable 518,123 55,959 66,765 31,381 1,922 40,026 51,269 — 765,445
Inventories 46,499 15,093 8,685 19,457 — 643,882 45,702 (8,607) 770,711
Prepaid expenses 4,470 1,168 2,354 10,312 164 216 14,794 — 33,478
1,931,307 183,208 390,354 334,001 15,746 884,590 493,859 (358,841) 3,874,224
Non-current assets classified as held for sale 17,722 — — — — — — — 17,722
Total current assets 1,949,029 183,208 390,354 334,001 15,746 884,590 493,859 (358,841) 3,891,946
Long-term trade accounts receivable 58,997 — 14,747 793,991 — — 39,852 — 907,587
Long-term work in progress — — 28,413 — — — — — 28,413
Long-term accounts receivable from related
parties 258,479 — 27,660 — — — 637,415 (149,624) 773,930
Prepaid expenses — — 24,585 13,115 892 — — (510) 38,082
Other long-term accounts receivable 75,030 53,917 11,159 255,179 7,348 9,811 58,408 — 470,852
Investments in associates and joint ventures 111,513 7,344 — — — 1 2,216,343 (2,066,530) 268,671
Investment property — — — — — 45,687 — — 45,687
Property, plant and equipment 509,700 171,226 18,572 580 60 11,621 171,563 (17,587) 865,735
Intangible assets 203,390 160,288 492,424 323 — 1,022 71,363 11,260 940,070
Deferred income tax asset 165,227 5,507 11,057 — — 10,316 238,560 6,030 436,697
Total non-current assets 1,382,336 398,282 628,617 1,063,188 8,300 78,458 3,433,504 (2,216,961) 4,775,724
Total assets 3,331,365 581,490 1,018,971 1,397,189 24,046 963,048 3,927,363 (2,575,802) 8,667,670
Liabilities.-
Borrowings 591,987 46,924 2,589 — — 162,031 253,233 — 1,056,764
Bonds — — 24,361 12,294 — — — — 36,655
Trade accounts payable 955,015 62,659 85,329 81,161 132 43,724 225,966 (940) 1,453,046
Accounts payable to related parties 114,198 3,664 60,857 83,841 14 37,396 102,976 (347,772) 55,174
Current income tax 29,379 1,282 1,122 — 161 45,299 8,300 — 85,543
Other accounts payable 492,362 12,487 68,994 27,058 49 63,654 183,895 1 848,500
Provisions 6,682 5,204 — — — 20 1,597 — 13,503
Total current liabilities 2,189,623 132,220 243,252 204,354 356 352,124 775,967 (348,711) 3,549,185
Borrowings 127,773 101,549 1,945 — — 12,010 390,022 — 633,299
Long-term bonds — — 319,549 591,363 — — — — 910,912
Other long-term accounts payable 379,043 — 52,349 349,987 158 32,058 38,878 — 852,473
Long-term accounts payable to related parties 4,306 — 836 89,023 23,445 — 62,841 (154,497) 25,954
Provisions 8,587 16,707 — — — — 8,620 — 33,914
Derivative financial instruments — 383 — — — — — — 383
Deferred income tax liability 26,633 8,957 8,606 20,789 210 — 7,277 — 72,472
Total non-current liabilities 546,342 127,596 383,285 1,051,162 23,813 44,068 507,638 (154,497) 2,529,407
Total liabilities 2,735,965 259,816 626,537 1,255,516 24,169 396,192 1,283,605 (503,208) 6,078,592
Equity attributable to controlling interest in the
Company 487,923 299,411 323,987 106,256 (123) 217,290 2,629,428 (1,940,842) 2,123,330
Non-controlling interest 107,477 22,263 68,447 35,417 — 349,566 14,330 (131,752) 465,748
Total liabilities and equity 3,331,365 581,490 1,018,971 1,397,189 24,046 963,048 3,927,363 (2,575,802) 8,667,670
- 54 -

Operating segments financial position
Segment reporting
Infrastructure
Engineering
and
construction Energy
Toll
roads Transportation
Water
treatment
Real
estate
Parent
Company
Operations Eliminations Consolidated
As of December 31, 2018
Assets.-
Cash and cash equivalent 177,455 34,816 168,460 191,178 6,700 93,262 129,269 — 801,140
Financial asset at fair value through profit or loss — — — — — — — — —
Trade accounts receivables 583,842 54,350 78,013 226,919 598 63,038 1,068 — 1,007,828
Work in progress 24,962 — — — — — 3,576 — 28,538
Accounts receivable from related parties 203,583 492 40,820 758 9,930 60,759 98,308 (379,747) 34,903
Other accounts receivable 386,467 37,611 28,492 31,012 199 55,508 49,160 2 588,451
Inventories 27,852 18,823 9,206 25,282 — 448,328 — (15,444) 514,047
Prepaid expenses 3,825 1,345 3,068 874 135 81 1,221 — 10,549
1,407,986 147,437 328,059 476,023 17,562 720,976 282,602 (395,189) 2,985,456
Non-current assets classified as held for sale — — — — — — 247,798 — 247,798
Total current assets 1,407,986 147,437 328,059 476,023 17,562 720,976 530,400 (395,189) 3,233,254
Long-term trade accounts receivable 14,455 — 33,380 966,202 — 6,030 — — 1,020,067
Long-term work in progress — — 32,212 — — — — — 32,212
Long-term accounts receivable from related
parties 254,660 — 39,341 — — — 744,655 (260,430) 778,226
Prepaid expenses — — 28,214 5,152 840 — — (509) 33,697
Other long-term accounts receivable 77,028 63,797 7,058 64,817 7,346 30,268 52,645 (2) 302,957
Investments in associates and joint ventures 114,676 7,230 — — — 5,604 2,213,023 (2,082,768) 257,765
Investment property — — — — — 29,133 — — 29,133
Property, plant and equipment 205,678 171,430 14,585 1,586 109 9,237 69,088 (1,159) 470,554
Intangible assets 160,088 183,614 466,153 749 — 1,105 23,514 11,872 847,095
Deferred income tax asset 166,624 5,025 11,876 — 620 17,127 218,201 5,963 425,436
Total non-current assets 993,209 431,096 632,819 1,038,506 8,915 98,504 3,321,126 (2,327,033) 4,197,142
Total assets 2,401,195 578,533 960,878 1,514,529 26,477 819,480 3,851,526 (2,722,222) 7,430,396
Liabilities.-
Borrowings 232,409 26,621 15,384 209,463 — 133,105 209,492 — 826,474
Bonds — — 25,745 13,422 — — — — 39,167
Trade accounts payable 777,130 49,254 61,233 104,652 121 31,173 55,968 — 1,079,531
Accounts payable to related parties 179,351 1,933 46,099 65,256 58 35,085 91,754 (363,595) 55,941
Current income tax 5,898 2,797 1,398 9,888 226 4,219 1,381 — 25,807
Other accounts payable 389,896 13,147 72,823 11,677 631 106,286 38,209 — 632,669
Provisions 521 5,412 — — — 264 — — 6,197
Non-current liabilities classified as held for sale — — — — — — 225,828 — 225,828
Total current liabilities 1,585,205 99,164 222,682 414,358 1,036 310,132 622,632 (363,595) 2,891,614
Borrowings 9,314 87,166 556 — — 10,684 268,478 — 376,198
Long-term bonds — — 299,637 598,238 — — — — 897,875
Other long-term accounts payable 357,146 — 31,477 154,756 1,656 26,470 2,605 — 574,110
Long-term accounts payable to related parties 8,880 — 1,167 81,207 23,445 — 183,826 (276,676) 21,849
Provisions 32,122 20,234 — — — — 51,055 — 103,411
Derivative financial instruments — 61 — — — — — — 61
Deferred income tax liability 5,564 24,541 7,010 37,178 — — 1,054 — 75,347
Total non-current liabilities 413,026 132,002 339,847 871,379 25,101 37,154 507,018 (276,676) 2,048,851
Total liabilities 1,998,231 231,166 562,529 1,285,737 26,137 347,286 1,129,650 (640,271) 4,940,465
Equity attributable to controlling interest in the
Company 331,178 323,943 332,406 171,594 340 193,483 2,708,803 (1,973,387) 2,088,360
Non-controlling interest 71,786 23,424 65,943 57,198 — 278,711 13,073 (108,564) 401,571
Total liabilities and equity 2,401,195 578,533 960,878 1,514,529 26,477 819,480 3,851,526 (2,722,222) 7,430,396
- 55 -

Operating segment performance
Segment Reporting
Infrastructure
Engineering Parent
and Water Real Company
construction Energy Toll roads Electric Train treatment estate operations Eliminations Consolidated
Year 2016 -
Revenue 2,936,831 382,211 527,104 247,040 18,459 411,518 62,070 (447,924) 4,137,309
Gross profit (loss) 60,191 42,129 121,114 42,474 5,698 136,539 (171) (91,885) 316,089
Administrative expenses (212,048) (17,260) (35,084) (12,951) (787) (28,429) (35,967) 64,223 (278,303)
Other income and expenses (14,246) 542 262 9 — 835 (5,842) (3,920) (22,360)
Gain from the sale of investments — — — — — — 46,336 — 46,336
Operating (loss) profit (166,103) 25,411 86,292 29,532 4,911 108,945 4,356 (31,582) 61,762
Financial expenses (60,806) (10,801) (7,390) (2,810) (37) (14,388) (116,554) 14,731 (198,055)
Financial income 9,987 1,040 2,225 8,037 86 2,817 20,924 (26,891) 18,225
Share of the profit or loss in associates and joint ventures 16,505 1,615 — — — 6,850 (1,036,888) 421,852 (590,066)
(Loss) profit before income tax (200,417) 17,265 81,127 34,759 4,960 104,224 (1,128,162) 378,110 (708,134)
Income tax 19,731 (5,308) (22,213) (10,904) (1,433) (27,054) 192,131 7,232 152,182
(Loss) profit from continuing operations (180,686) 11,957 58,914 23,855 3,527 77,170 (936,031) 385,342 (555,952)
Profit from discontinued operations 87,239 — — — — — 1,423 15,692 104,354
(Loss) profit for the year (93,447) 11,957 58,914 23,855 3,527 77,170 (934,608) 401,034 (451,598)
(Loss) profit attributable to:
Owners of the Company (87,710) 9,369 43,656 17,892 3,527 22,105 (932,961) 414,423 (509,699)
Non-controlling interest (5,737) 2,588 15,258 5,963 — 55,065 (1,647) (13,389) 58,101
(93,447) 11,957 58,914 23,855 3,527 77,170 (934,608) 401,034 (451,598)
- 56 -

Operating segment performance
Segment Reporting
Infrastructure
Engineering Parent
and Water Real Company
construction Energy Toll roads Transportation treatment estate operations Eliminations
Consolidated
(as restated)
Year 2017 -
Revenue 2,331,907 436,876 642,127 365,771 3,152 647,535 70,050 (483,405) 4,014,013
Gross profit (loss) 176,473 71,825 139,196 48,696 445 147,383 (37,771) (43,795) 502,452
Administrative expenses (188,162) (15,854) (32,453) (15,279) (317) (21,189) (100,968) 51,768 (322,454)
Other income and expenses (46,445) 5,138 1,061 5 — (3,700) 10,512 560 (32,869)
Gain from the sale of investments — — — — — 49,002 (18,672) 4,215 34,545
Operating (loss) profit (58,134) 61,109 107,804 33,422 128 171,496 (146,899) 12,748 181,674
Financial expenses (46,655) (13,423) (6,892) (8,000) (50) (21,918) (81,310) 27,471 (150,777)
Financial income 8,491 1,965 3,257 3,606 26 3,569 35,431 (42,603) 13,742
Share of the profit or loss in associates and joint ventures 30,982 1,584 — — — 456 142,595 (175,144) 473
Profit (loss) before income tax (65,316) 51,235 104,169 29,028 104 153,603 (50,183) (177,528) 45,112
Income tax 877 (13,151) (32,290) (9,544) (228) (35,900) 44,032 (101) (46,305)
Profit (loss) from continuing operations (64,439) 38,084 71,879 19,484 (124) 117,703 (6,151) (177,629) (1,193)
Profit from discontinued operations 76,837 — — — — — 123,603 9,991 210,431
Profit (loss) for the period 12,398 38,084 71,879 19,484 (124) 117,703 117,452 (167,638) 209,238
Profit (loss) attributable to:
Owners of the Company 12,078 33,714 55,620 14,613 (124) 48,647 125,182 (140,992) 148,738
Non-controlling interest 320 4,370 16,259 4,871 — 69,056 (7,730) (26,646) 60,500
12,398 38,084 71,879 19,484 (124) 117,703 117,452 (167,638) 209,238
- 57 -

Operating segment performance
Segment Reporting
Infrastructure
Engineering
and
construction Energy Toll roads Transportation
Water
treatment
Real
estate
Parent
Company
operations Eliminations Consolidated
Year 2018 -
Revenue 1,960,863 560,506 733,148 586,329 3,270 630,130 62,098 (636,882) 3,899,462
Gross profit (loss) 62,095 120,360 107,092 122,567 592 287,959 (10,564) (15,612) 674,489
Administrative expenses (136,066) (20,898) (35,626) (12,007) (295) (50,730) (62,891) 40,080 (278,433)
Other income and expenses (13,509) 1,243 (11) 31 — (1,971) (47,778) 660 (61,335)
Gain from the sale of investments (7) — — — — — — — (7)
Operating profit (loss) (87,487) 100,705 71,455 110,591 297 235,258 (121,233) 25,128 334,714
Financial expenses (82,861) (15,631) (28,762) (20,604) — (14,700) (121,938) 36,514 (247,982)
Financial income 15,122 4,593 4,631 35,147 559 6,397 38,614 (54,138) 50,925
Dividends — — — — — — 8,344 (8,344) —
Share of the profit or loss in associates
and joint ventures 11,366 1,608 — — — (10) 84,138 (100,811) (3,709)
(Loss)/profit before income tax (143,860) 91,275 47,324 125,134 856 226,945 (112,075) (101,651) 133,948
Income tax 14,361 (26,275) (15,737) (38,018) (517) (69,166) 22,866 (832) (113,318)
(Loss) profit from continuing
operations (129,499) 65,000 31,587 87,116 339 157,779 (89,209) (102,483) 20,630
Profit from discontinued operations 44,096 — — — — — (3,708) (3,603) 36,785
(Loss) profit for the period (85,403) 65,000 31,587 87,116 339 157,779 (92,917) (106,086) 57,415
Profit (loss) attributable to:
Owners of the Company (86,857) 59,866 26,731 65,337 339 28,921 (85,715) (91,810) (83,188)
Non-controlling interest 1,454 5,134 4,856 21,779 — 128,858 (7,202) (14,276) 140,603
(85,403) 65,000 31,587 87,116 339 157,779 (92,917) (106,086) 57,415
- 58 -
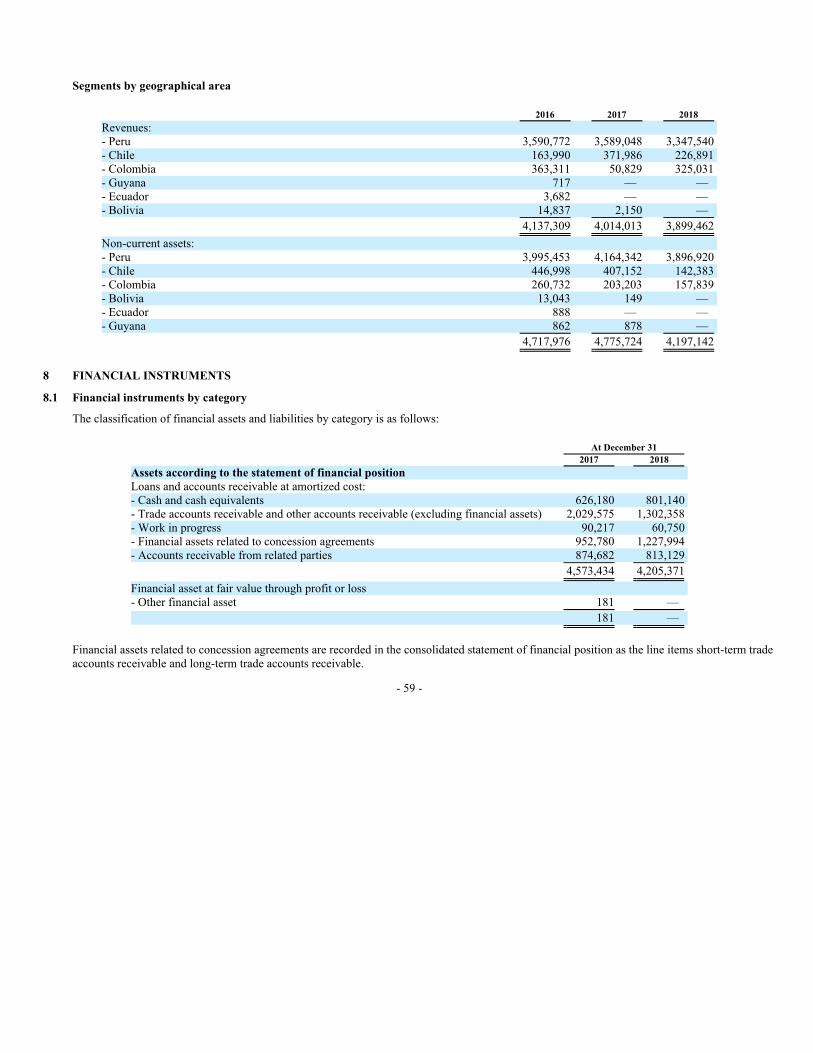
Segments by geographical area
2016 2017 2018
Revenues:
- Peru 3,590,772 3,589,048 3,347,540
- Chile 163,990 371,986 226,891
- Colombia 363,311 50,829 325,031
- Guyana 717 — —
- Ecuador 3,682 — —
- Bolivia 14,837 2,150 —
4,137,309 4,014,013 3,899,462
Non-current assets:
- Peru 3,995,453 4,164,342 3,896,920
- Chile 446,998 407,152 142,383
- Colombia 260,732 203,203 157,839
- Bolivia 13,043 149 —
- Ecuador 888 — —
- Guyana 862 878 —
4,717,976 4,775,724 4,197,142
8 FINANCIAL INSTRUMENTS
8.1 Financial instruments by category
The classification of financial assets and liabilities by category is as follows:
At December 31
2017 2018
Assets according to the statement of financial position
Loans and accounts receivable at amortized cost:
- Cash and cash equivalents 626,180 801,140
- Trade accounts receivable and other accounts receivable (excluding financial assets) 2,029,575 1,302,358
- Work in progress 90,217 60,750
- Financial assets related to concession agreements 952,780 1,227,994
- Accounts receivable from related parties 874,682 813,129
4,573,434 4,205,371
Financial asset at fair value through profit or loss
- Other financial asset 181 —
181 —
Financial assets related to concession agreements are recorded in the consolidated statement of financial position as the line items short-term trade
accounts receivable and long-term trade accounts receivable.
- 59 -

At December 31
2017 2018
Financial liabilities according to the statement of financial position
Other financial liabilities at amortized cost
- Other financial liabilities 1,561,754 1,169,184
- Finance leases 128,309 33,488
- Bonds 947,567 937,042
- Trade and other accounts payable (excluding non-financial liabilities) 2,054,217 1,552,741
- Accounts payable to related parties 81,128 77,790
4,772,975 3,770,245
Hedging derivatives:
- Derivative financial instruments 383 61
8.2 Credit quality of financial assets
The credit quality of financial assets that are neither past due nor impaired can be assessed by reference to external risk ratings (if available) or
historical information about counterparty default rates.
- 60 -

At December 31 the credit quality of financial assets is shown as follows:
At December 31,
2017 2018
Cash and cash equivalents (*)
Banco de Credito del Peru (A+) 224,834 350,403
Citibank (A) 110,846 134,990
Banco Continental (A+) 100,882 114,067
Banco Scotiabank (A+) 71,608 73,039
Fondo de Inversion Alianza — 39,051
Banco de la Nacion (A) 17,776 23,766
Banco Bogota (A) 25,609 16,782
Banco Interbank (A) 14,937 14,075
Banco Santander - Peru (A) — 12,221
Banco de Credito e Inversiones - Chile (AA+) 1,105 5,909
Banco Santander - Chile (AAA) 22,041 3,325
Banco de Chile (AAA) 4,337 49
Banco Interamericano de Finanzas (A) 5,551 126
Banco Scotiabank de Guyana (A) — 121
Others 7,388 8,273
606,914 796,197
The ratings in the table above “A” and “AAA” represent high-quality credit ratings. For banks located in Peru, the ratings are derived from risk
rating agencies authorized by the Peruvian banking and insurance regulator “Superintendencia de Banca, Seguros y AFP” (SBS). For banks
located in Chile, the ratings are derived from risk rating agencies authorized by the Chilean Securities and Insurance Supervisor
“Superintendencia de Valores y Seguros” (SVS).
(*) The difference between the balances shown above with the balances shown in the statement of financial position corresponds to cash on hand and
in-transit remittances (Note 9).
The credit quality of customers is assessed in three categories (internal classification):
A: New customers/related parties (less than six months),
B: Existing customers/related parties (with more than six months of trade relationship) with no previous default history; and
- 61 -

C: Existing customers/related parties (with more than six months of trade relationship) with previous default history.
2017 2018
Trade accounts receivable (Note 11 and Note 12)
Counterparties with no external risk rating
A 6,042 140,594
B 2,313,187 1,762,557
C 194,248 185,494
2,513,477 2,088,645
Receivable from related parties and joint operators (Note 13)
B 874,682 813,129
The total balance of trade accounts receivable and receivable from related parties is in compliance with contract terms and conditions; none have
been re-negotiated.
9 CASH AND CASH EQUIVALENTS
At December 31 this account comprises:
2017 2018
Cash on hand 16,468 1,377
Cash in-transit 2,798 3,566
Bank accounts (a) 493,666 647,832
Time deposits (b) 113,248 148,365
626,180 801,140
(a) The Group maintains deposits in local and foreign banks, are available and earn interest at market rates. This includes reserve funds for bond
payments issued by subsidiaries GyM Ferrovias S.A. and Norvial S.A.; for the year 2018 S/133 million and S/13 million, respectively (for the
year 2017 S/108 million and S/16 million, respectively).
(b) Time deposits have maturities less than 90 days and may be renewed upon maturity. These deposits earn interest that fluctuates between 2.5% and
3.5%.
As of December 31, 2017, and 2018, time deposits are mainly from subsidiaries:
2017 2018
Graña y Montero S.A.A. — 110,281
GyM Ferrovias S.A. 36,757 32,000
GyM S.A. 30,497 1,906
Concesionaria la Chira S.A. — 4,170
GMP S.A. 3,238 7
Viva GyM S.A. 17,879 1
Concar S.A. 13,611 —
Concesion Canchaque 11,000 —
Other minors 266 —
113,248 148,365
Reconciliation to the cash flow statement
- 62 -

The above figures reconcile to the amount of cash shown in the statement of cash flows at the end of the financial year as follows:
2016 2017 2018
Cash and cash equivalent on Consolidated statement of financial position 606,950 626,180 801,140
Bank overdrafts (Note 19) (8,396) (120) (119)
Balances per consolidated statement of cash flows 598,554 626,060 801,021
10 OTHER FINANCIAL ASSETS
On April 2016, the Company sold their 1.64% of interest held in Transportadora de Gas del Peru S.A. (TGP) for S/107.3 million, resulting in a net
profit of S/46.3 million, as shown in the income statement, within “Profit (loss) on sale of investments”. The balance of its investment at the date
of sale was S/117.1 million.
The cumulative amount of fair values at the date of sale amounting to S/41.5 million (S/56 million of gain on fair value and S/14.6 million of
income tax), as recognized in the statement of comprehensive income was transferred to profits for the period.
11 TRADE ACCOUNTS RECEIVABLES, NET
At December 31 this account comprises:
2017 2018
Current Non-current Current Non-current
Invoice receivables 459,722 819,699 907,007 469,510
Unbilled receivables 1,069,299 87,888 113,464 550,557
1,529,021 907,587 1,020,471 1,020,067
(-) Impairment of account receivables (13,348) — (12,643) —
1,515,673 907,587 1,007,828 1,020,067
The fair value of current receivables is similar to their carrying amount since their average collection turnover is less than 60 days. These current
receivables do not bear interest and have no specific guarantees.
The non-current portion of the trade accounts receivable is related to the financial asset model (Note 2.5) of subsidiary GyM Ferrovias S.A.
At December 31, 2018, the fair value of non-current accounts receivable amounted to S/1,060 million (S/835 million at December 31, 2017),
which was calculated under the discounted cash flows method, using rates of 7.33% (6.33% at December 31, 2017).
Unbilled receivables are documents related to estimates for services rendered that were not billed by the Engineering and Construction segment
related to estimates of the completion advance percentage. Until such revenues are billed, they are recorded in the unbilled receivables account.
As of December 31, 2018, the carrying value of non-current unbilled receivables is similar to their fair value, as they were recorded using the
discounted cash flow method, using a rate of 1.71%.
Rights for concessions in progress correspond to future collection rights for public service concessions that are still in the pre-operational stage.
- 63 -

At December 31, 2018, current and non-current unbilled receivables mainly from the following subsidiaries are as follows:
Unbilled receivables 2017 2018
GyM S.A. 581,946 14,455
GyM Ferrovias 354,763 558,179
Concar S.A. 52,508 38,770
Survial S.A. 30,647 19,138
GMI S.A. 19,699 26,622
Norvial S.A. 7,057 2,885
Cam Holding SPA 85,366 —
Others 25,201 3,972
1,157,187 664,021
Aging of trade accounts receivable is as follows:
2017 2018
Current 2,157,656 1,866,913
Past due up to 30 days 118,158 37,750
Past due from 31 days up to 180 days 141,120 25,854
Past due from 181 days up to 360 days 1,962 17,660
Past due over 360 days 17,712 92,361
2,436,608 2,040,538
The Group has recognized impairment amounting to S/3.1 million (S/0.7 million in 2017 and S/3.1 in 2016) in the consolidated statement of
income (Note 27). The maximum exposure to credit risk at the reporting date is the carrying amount of the accounts receivable and unbilled work
in progress (Note 12).
12 WORK IN PROGRESS, NET
At December 31 this account comprises:
2017 2018
Current Non-current Current Non-current
Unbilled receivable concessions in progress — 28,413 — 32,212
Work in Progress 61,804 — 28,538 —
61,804 28,413 28,538 32,212
Concession rights in progress correspond to future collection rights for public service in Concesionaria Via Expresa Sur S.A. that is in the pre-
operational stage and has been suspended until July 2019 (Note 6-b).
- 64 -

Work in progress include all expenses incurred by the Group comprising future activities to be carried out under construction contracts currently
effective. The Group estimates that all incurred cost will be billed and collected.
At December 31, 2018 and 2017 work in progress that remained to be billed are shown net of any advances received from customers for
S/13.5 million and S/15.3 million, respectively, under the terms and conditions set forth in each specific agreement. These advances are mostly
related to subsidiary GyM S.A.
13 TRANSACTIONS WITH RELATED PARTIES AND JOINT OPERATORS
a) Transactions with related parties
Major transactions between the Company and its related parties are summarized as follows:
2016 2017 2018
Revenue from sales of goods and services:
- Associates — 3,367 1,704
- Joint operations 36,901 18,138 56,560
36,901 21,505 58,264
Purchase of goods and services:
- Associates 739 2,776 2,130
- Joint operations 3,228 14,191 601
3,967 16,967 2,731
Inter-company transactions are based on prevailing price lists and terms and conditions that would be agreed with third parties.
b) Key management compensation
Key management includes directors (executive and non-executive), members of the Executive Committee and Internal Audit Management. The
compensation paid or payable to key management in 2018 amounted to S/58 million (S/90.5 million in 2017, which includes S/25.6 million to
discontinued operations, S/106.9 million in 2016, which includes S/82 million to discontinued operations) and only relates to short-term benefits.
- 65 -
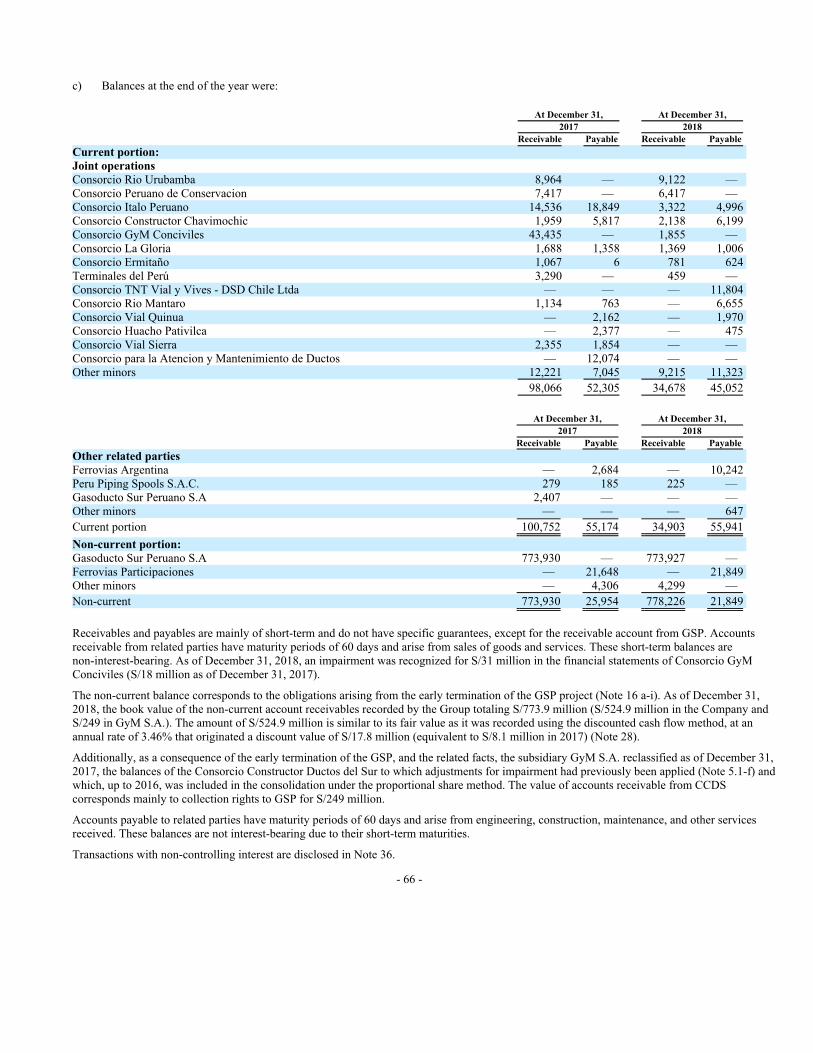
c) Balances at the end of the year were:
At December 31, At December 31,
2017 2018
Receivable Payable Receivable Payable
Current portion:
Joint operations
Consorcio Rio Urubamba 8,964 — 9,122 —
Consorcio Peruano de Conservacion 7,417 — 6,417 —
Consorcio Italo Peruano 14,536 18,849 3,322 4,996
Consorcio Constructor Chavimochic 1,959 5,817 2,138 6,199
Consorcio GyM Conciviles 43,435 — 1,855 —
Consorcio La Gloria 1,688 1,358 1,369 1,006
Consorcio Ermitaño 1,067 6 781 624
Terminales del Perú 3,290 — 459 —
Consorcio TNT Vial y Vives - DSD Chile Ltda — — — 11,804
Consorcio Rio Mantaro 1,134 763 — 6,655
Consorcio Vial Quinua — 2,162 — 1,970
Consorcio Huacho Pativilca — 2,377 — 475
Consorcio Vial Sierra 2,355 1,854 — —
Consorcio para la Atencion y Mantenimiento de Ductos — 12,074 — —
Other minors 12,221 7,045 9,215 11,323
98,066 52,305 34,678 45,052
At December 31, At December 31,
2017 2018
Receivable Payable Receivable Payable
Other related parties
Ferrovias Argentina — 2,684 — 10,242
Peru Piping Spools S.A.C. 279 185 225 —
Gasoducto Sur Peruano S.A 2,407 — — —
Other minors — — — 647
Current portion 100,752 55,174 34,903 55,941
Non-current portion:
Gasoducto Sur Peruano S.A 773,930 — 773,927 —
Ferrovias Participaciones — 21,648 — 21,849
Other minors — 4,306 4,299 —
Non-current 773,930 25,954 778,226 21,849
Receivables and payables are mainly of short-term and do not have specific guarantees, except for the receivable account from GSP. Accounts
receivable from related parties have maturity periods of 60 days and arise from sales of goods and services. These short-term balances are
non-interest-bearing. As of December 31, 2018, an impairment was recognized for S/31 million in the financial statements of Consorcio GyM
Conciviles (S/18 million as of December 31, 2017).
The non-current balance corresponds to the obligations arising from the early termination of the GSP project (Note 16 a-i). As of December 31,
2018, the book value of the non-current account receivables recorded by the Group totaling S/773.9 million (S/524.9 million in the Company and
S/249 in GyM S.A.). The amount of S/524.9 million is similar to its fair value as it was recorded using the discounted cash flow method, at an
annual rate of 3.46% that originated a discount value of S/17.8 million (equivalent to S/8.1 million in 2017) (Note 28).
Additionally, as a consequence of the early termination of the GSP, and the related facts, the subsidiary GyM S.A. reclassified as of December 31,
2017, the balances of the Consorcio Constructor Ductos del Sur to which adjustments for impairment had previously been applied (Note 5.1-f) and
which, up to 2016, was included in the consolidation under the proportional share method. The value of accounts receivable from CCDS
corresponds mainly to collection rights to GSP for S/249 million.
Accounts payable to related parties have maturity periods of 60 days and arise from engineering, construction, maintenance, and other services
received. These balances are not interest-bearing due to their short-term maturities.
Transactions with non-controlling interest are disclosed in Note 36.
- 66 -
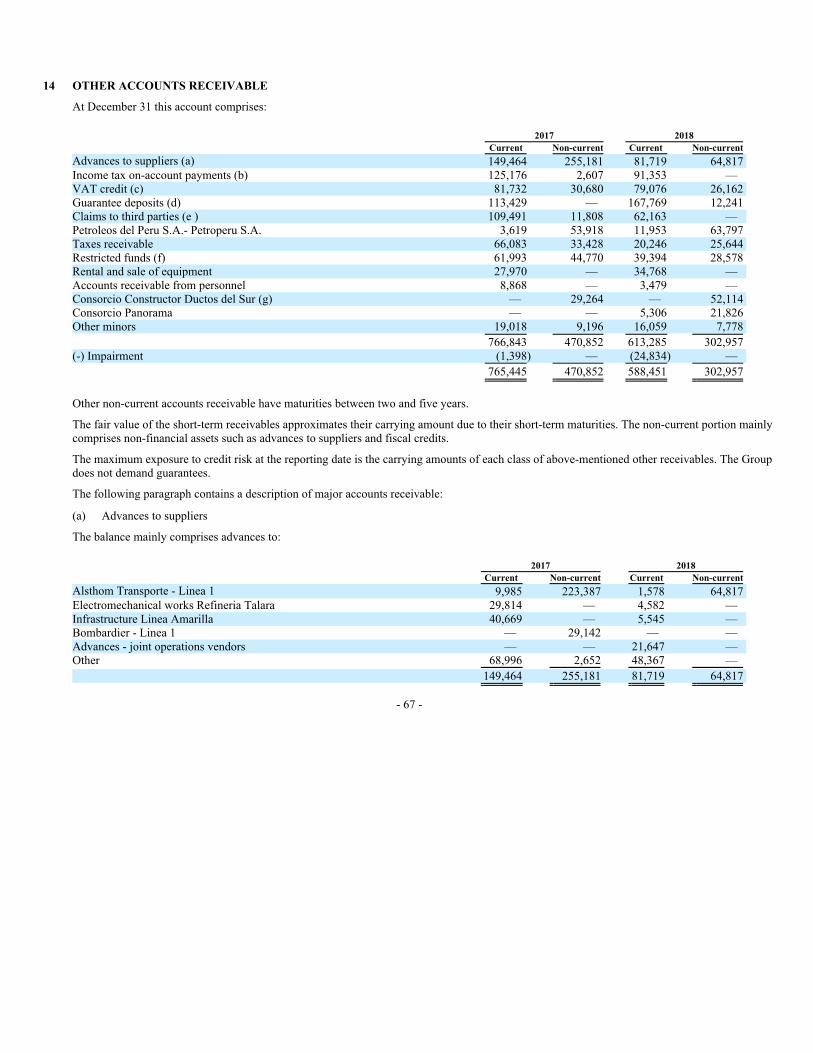
14 OTHER ACCOUNTS RECEIVABLE
At December 31 this account comprises:
2017 2018
Current Non-current Current Non-current
Advances to suppliers (a) 149,464 255,181 81,719 64,817
Income tax on-account payments (b) 125,176 2,607 91,353 —
VAT credit (c) 81,732 30,680 79,076 26,162
Guarantee deposits (d) 113,429 — 167,769 12,241
Claims to third parties (e ) 109,491 11,808 62,163 —
Petroleos del Peru S.A.- Petroperu S.A. 3,619 53,918 11,953 63,797
Taxes receivable 66,083 33,428 20,246 25,644
Restricted funds (f) 61,993 44,770 39,394 28,578
Rental and sale of equipment 27,970 — 34,768 —
Accounts receivable from personnel 8,868 — 3,479 —
Consorcio Constructor Ductos del Sur (g) — 29,264 — 52,114
Consorcio Panorama — — 5,306 21,826
Other minors 19,018 9,196 16,059 7,778
766,843 470,852 613,285 302,957
(-) Impairment (1,398) — (24,834) —
765,445 470,852 588,451 302,957
Other non-current accounts receivable have maturities between two and five years.
The fair value of the short-term receivables approximates their carrying amount due to their short-term maturities. The non-current portion mainly
comprises non-financial assets such as advances to suppliers and fiscal credits.
The maximum exposure to credit risk at the reporting date is the carrying amounts of each class of above-mentioned other receivables. The Group
does not demand guarantees.
The following paragraph contains a description of major accounts receivable:
(a) Advances to suppliers
The balance mainly comprises advances to:
2017 2018
Current Non-current Current Non-current
Alsthom Transporte - Linea 1 9,985 223,387 1,578 64,817
Electromechanical works Refineria Talara 29,814 — 4,582 —
Infrastructure Linea Amarilla 40,669 — 5,545 —
Bombardier - Linea 1 — 29,142 — —
Advances - joint operations vendors — — 21,647 —
Other 68,996 2,652 48,367 —
149,464 255,181 81,719 64,817
- 67 -

(b) Income tax on-account payments
This balance mainly consists of income tax payments and credits in the following subsidiaries:
2017 2018
Current Non-current Current Non-current
GyM S.A. 84,923 — 55,377 —
GMI S.A. 542 — 3,877 —
GMP S.A. 19,318 — 8,511 —
CONCAR S.A. 4,565 — 8,563 —
VIVA GyM S.A. 6,121 — 8,114 —
Graña y Montero S.A.A. — — 6,463 —
GyM Ferrovías S.A. 3,606 — — —
Others 6,101 2,607 448 —
125,176 2,607 91,353 —
(c) Tax credit related to VAT on the following subsidiaries:
2017 2018
Current
Non-
current Current
Non-
current
GyM S.A. 50,326 530 38,653 530
VIVA GyM S.A. 10,894 9,983 511 6,744
GyM Ferrovías S.A. 8,653 — 25,453 —
Negocios del gas S.A. — 8,411 — 8,411
Concesionaria Vesur S.A. — 5,319 1,015 5,059
Graña y Montero S.A.A. 1,571 — 9,821 —
GMP S.A. 3,992 — 456 —
CONCAR S.A. 1,551 — 2,382 —
NORVIAL S.A. — 3,209 — 1,997
Others 4,745 3,228 785 3,421
81,732 30,680 79,076 26,162
Management considers that this VAT-fiscal credit will be recovered in the normal course of future operations of these subsidiaries.
(d) Guarantee deposits
Guarantee deposits are the funds retained by customers for work contracts assumed basically by the subsidiary GyM S.A. These deposits are
retained by the customers to secure the Subsidiary’s compliance with its obligations under the contracts. The amounts retained will be recovered
once the contracted work is completed.
(e) Third-Party Claims
Includes mainly an amount of S/27.2 million related to the claim from the resolution of the Sale and Purchase Contract for the Development of the
Large Scale Real Estate Project for Social Housing Construction “Ciudad Alameda de Ancon” subscribed by the subsidiary Viva GyM together
with the Ministry of Housing, and Fondo Mi Vivienda.
This Sale and Purchase Contract was rightfully terminated due to the impossibility of executing its terms and conditions since it became
impossible to install proper potable water and sewerage services for the housing units that were to be developed within the term limit established
in the Contract. As a consequence, and in accordance with the provisions of Civil Code 1372, the parties are obliged to fully reimburse the
executed benefits to date, which results in the reimbursement of S/22 million by the Ministry of Housing and S/5.2 million by the Fondo Mi
Vivienda to Viva GyM.
- 68 -

(f) Restricted Funds
Includes guarantee accounts for the credit agreement subscribed between the Company and Credit Suisse AG amounting to S/28 million, as
reserve for the payment of interest; and S/11 million from Viva GyM S.A. for bank guarantee.
(g) Consorcio Constructor Ductos del Sur
In 2018, it refers to the recognition of debts to subcontractors for S/21.6 million and rights for the collection of a penalty for termination of the
contract for S/30.6 million.
15 INVENTORIES
At December 31 this account comprises:
2017 2018
Land 317,337 230,689
Work in progress - real estate 150,537 135,376
Finished properties 203,209 76,027
Construction materials 51,131 27,852
Merchandise and supplies 90,504 53,310
812,718 523,254
(-) Impairment of inventories (42,007) (9,207)
770,711 514,047
- 69 -
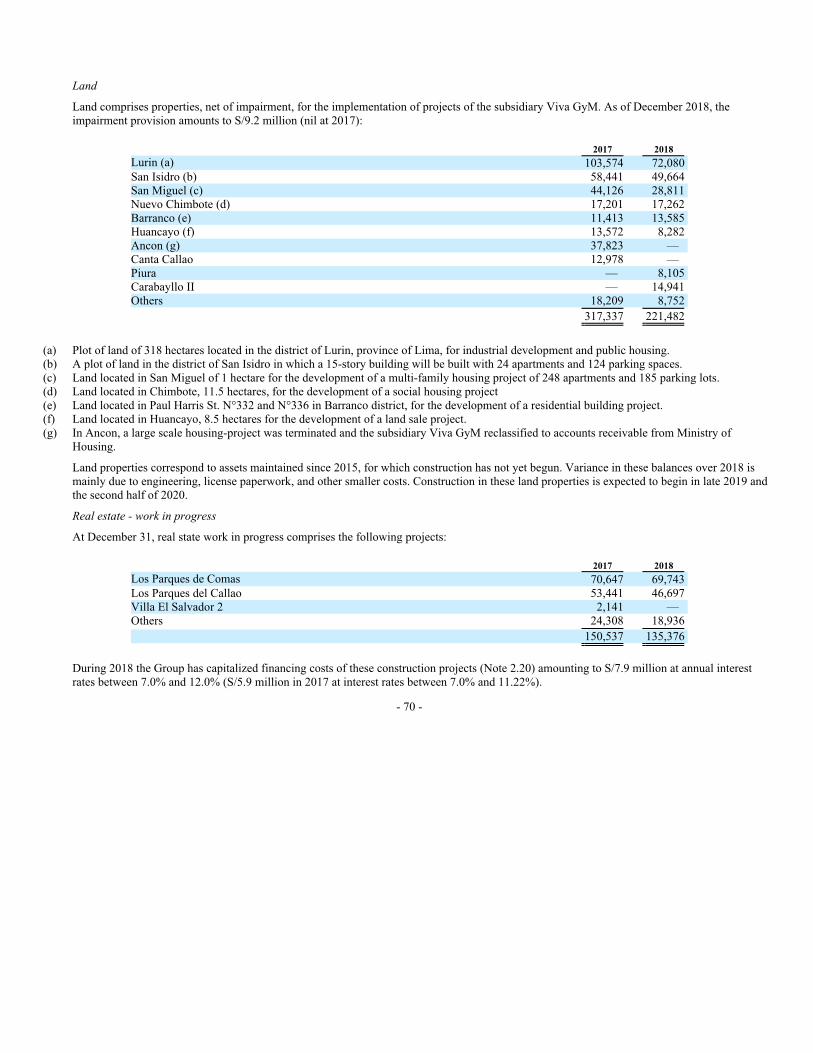
Land
Land comprises properties, net of impairment, for the implementation of projects of the subsidiary Viva GyM. As of December 2018, the
impairment provision amounts to S/9.2 million (nil at 2017):
2017 2018
Lurin (a) 103,574 72,080
San Isidro (b) 58,441 49,664
San Miguel (c) 44,126 28,811
Nuevo Chimbote (d) 17,201 17,262
Barranco (e) 11,413 13,585
Huancayo (f) 13,572 8,282
Ancon (g) 37,823 —
Canta Callao 12,978 —
Piura — 8,105
Carabayllo II — 14,941
Others 18,209 8,752
317,337 221,482
(a) Plot of land of 318 hectares located in the district of Lurin, province of Lima, for industrial development and public housing.
(b) A plot of land in the district of San Isidro in which a 15-story building will be built with 24 apartments and 124 parking spaces.
(c) Land located in San Miguel of 1 hectare for the development of a multi-family housing project of 248 apartments and 185 parking lots.
(d) Land located in Chimbote, 11.5 hectares, for the development of a social housing project
(e) Land located in Paul Harris St. N°332 and N°336 in Barranco district, for the development of a residential building project.
(f) Land located in Huancayo, 8.5 hectares for the development of a land sale project.
(g) In Ancon, a large scale housing-project was terminated and the subsidiary Viva GyM reclassified to accounts receivable from Ministry of
Housing.
Land properties correspond to assets maintained since 2015, for which construction has not yet begun. Variance in these balances over 2018 is
mainly due to engineering, license paperwork, and other smaller costs. Construction in these land properties is expected to begin in late 2019 and
the second half of 2020.
Real estate - work in progress
At December 31, real state work in progress comprises the following projects:
2017 2018
Los Parques de Comas 70,647 69,743
Los Parques del Callao 53,441 46,697
Villa El Salvador 2 2,141 —
Others 24,308 18,936
150,537 135,376
During 2018 the Group has capitalized financing costs of these construction projects (Note 2.20) amounting to S/7.9 million at annual interest
rates between 7.0% and 12.0% (S/5.9 million in 2017 at interest rates between 7.0% and 11.22%).
- 70 -

Finished properties
At December 31, the balance of finished properties consists of the following investment properties:
2017 2018
El Rancho 82,796 19,314
Panorama 18,481 —
Los Parques de San Martín de Porres 16,687 4,029
Los Parques de Callao 486 389
Rivera Navarrete 7,870 4,053
Los Parques de Carabayllo 2da etapa 3,134 942
Los Parques de Comas 16,058 18,785
Los Parques de Villa El Salvador II 9,313 4,277
Klimt 44,103 5,911
Real 2 3,877 556
Huancayo — 15,546
Others 404 2,225
203,209 76,027
Construction materials
At December 31, 2018, construction materials correspond mainly to different projects of the subsidiary GyM S.A. for S/27.8 million (Stracon
GyM S.A., Morelco S.A., and GyM S.A. for S/50 million at December 31, 2017).
16 INVESTMENTS IN ASSOCIATES AND JOINT VENTURES
At December 31 this account comprises:
2017 2018
Associates 250,053 250,282
Joint ventures 18,618 7,483
268,671 257,765
The amounts recognized in the income statement are as follows:
2017 2018
Associates (5,566) (5,308)
Joint ventures 6,039 1,599
473 (3,709)
- 71 -

a) Investment in associates
Set out in the table below are the associates of the Group at December 31, 2017, and 2018. The associates listed below have share capital solely
consisting of common shares, which are held directly by the Group. None of the associates are listed companies; therefore, there is no quoted
market price available for their shares.
Carrying amount
Class Interest in capital At December 31,
Entity of share 2017 2018 2017 2018
% %
Gasoducto Sur Peruano S.A. Common 21.49 21.49 218,276 218,276
Concesionaria Chavimochic S.A.C. Common 26.50 26.50 22,091 20,524
Betchel Vial y Vives Servicios Complementarios Ltda. Common 40.00 40.00 102 94
Others 9,584 11,388
250,053 250,282
The most significant associates are described as follows:
i) Gasoducto Sur Peruano S.A.
In November 2015, the group acquired a 20% interest in Gasoducto Sur Peruano (hereafter “GSP”) and obtained a 29% interest in Consorcio
Constructor Ductos del Sur (CCDS) through its subsidiary GyM S.A. GSP signed on July 22, 2014, a concession contract with the Peruvian
Government (Grantor) to build, operate and maintain the pipelines transportation system of natural gas to meet the demand of cities in the
Peruvian southern region. Additionally, GSP signed an engineering, procurement, and construction (EPC) contract with CCDS. The Group made
an investment of US$242.5 million (S/819 million) and was required to assume 20% of the performance guarantee established in the concession
contract for US$262.5 million (equivalent to S/887 million) and 21.49% of the guarantee for a bridge loan obtained by GSP of US$600 million
(equivalent to S/2,027 million).
Early termination of the Concession Agreement
On January 24, 2017 the Ministry of Energy and Mining (MEM) notified the early termination of the Concession Contract based on the provisions
of clause 6.7 of the concession agreement “Improvements to the country’s energy security and development of the South Peru Gas Pipeline”, as
GSP failed to certify the financial closing within the established contractual deadline and proceeded to the immediate execution of the
performance guarantee. This situation generated the execution of the collaterals offered by the Group for US$52.5 million (S/177.4 million
nominal value) and US$129 million (S/435.9 million nominal value) for the corporate guarantee of the bridge loan granted to GSP. Under the
concession agreement, guarantees were paid on behalf of GSP, therefore the Company recognized a right to collect of US$181.5 million (S/613.3
million nominal value) and it was recorded in 2016 as accounts receivable from related parties. (Note 13)
On October 11, 2017, the delivery of the assets of GSP was formalized by agreement with MEM. As stated in the agreement, in December 2017,
GSP substantially finalized the process of delivery of the concession’s assets to the administrator designated by the MEM for its custody and
conservation. The assets include all the works, equipment and facilities provided for the execution of the project, as well as the engineering studies
that were prepared by the concessionaire.
After the termination of the contract, the Peruvian Government had the obligation to apply Clause 20 of the contract, having to appoint a
recognized international audit firm to calculate the Net Book Value (“VCN” for its Spanish definition “Valor Contable Neto”) of the concession
assets and the subsequent call for up to three public auctions, being the base amount for the first of them 100% of the VCN, guaranteeing in any
case that after the third auction, in case the concession has not been awarded, the payment to GSP would be at least 72.25% of the VCN. Having
elapsed more than a year since the termination of the contract, the Peruvian Government has not taken any action to calculate the VCN or call for
auctions. In the opinion of the external and internal legal advisors, since the previous procedure had not been completed within the established
deadlines, the Peruvian Government would be obliged to pay GSP 100% of the VCN. Regarding the amount of the VCN, there is a previous
calculation commissioned by GSP and reviewed by an independent audit firm as of December 31, 2016, determining a VCN of US$2,602 million.
- 72 -

As of December 4, 2017, GSP entered into a bankruptcy proceeding that will be carried out by the National Institute for the Defense of
Competition and Intellectual Protection of Peru (hereinafter, INDECOPI). The Group registered a claim for accounts receivable for
US$0.4 million (S/1.4 million) and the fiduciary as administrator of the accounts receivable for US$169.3 million (S/572.1 million). The process
is in the debt recognition stage to determine the Creditors’ Meeting.
The fair value of the investment in GSP is based on the amount of the VCN, taking into consideration the payments anticipated in the insolvency
proceedings, the subordination contracts and the loan cession agreements between the Group and GSP partners. Based on management’s estimate
of such payments, an impairment of the investment was determined for US$175.5 million (S/593.0 million). In addition, according to the
conclusions of internal and external legal advisors, international arbitration will be required to receive the payment from the Government. The
estimated time frame for international arbitration is five years. Therefore, management has applied a discount in 2016 to the long-term account
receivable from GSP of US$22.8 million (S/77 million). These two effects amounted US$199.3 million (S/670 million) before taxes recorded in
the income statement for the year ended December 31, 2016.
In addition, on December 31, 2016, the Group evaluated the impairment of the assets of CCDS. As a result, a net loss before taxes of
S/15.2 million was determined (Note 5.1-f).
In the opinion of our internal and external legal advisors, the obligation of the Peruvian Government to GSP equivalent to the VCN of the
concession’s assets is not within the scope of the retention provided for in Law 30737 since this payment does not include a net profit margin, nor
does it correspond to the sale of assets.
On December 21, 2018, Graña y Montero S.A.A. submitted to the Peruvian Government a request for direct negotiations towards the payment of
the VCN in favor of GSP. This request is based on the right that any creditor has to initiate the actions that its debtor does not take in order to
collect a credit that would allow it to pay its debt, by virtue of article 1219 of the Peruvian Civil Code. After the term of six months since the
beginning of direct negotiations, Graña y Montero S.A.A. under the same title may demand the payment from the Peruvian Government through
arbitration to the CIADI (Centro Internacional de Arreglo de Diferencias Relativas a Inversiones).
ii) Concesionaria Chavimochic S.A.C.
The entity was awarded the implementation of the Chavimochic irrigation project, including a) design and construction of the work required for
the third-phase of the Chavimochic irrigation project in the province of La Libertad; b) operation and maintenance of works; and c) water supply
to the Project users. Construction activities started in 2015; the effective concession period is 25 years, and the total investment amounts
US$647 million.
The civil works of the third stage of the Chavimochic Irrigation Project were structured in two phases. To date, the works of the first phase (Palo
Redondo Dam) are 70% complete. However, at the beginning of 2017, the procedure for early termination of the Concession Contract was
initiated due to the breach of contract by the Grantor, and all activities were suspended in December 2017. Not having reached an agreement, the
arbitration process was initiated before the CNUDI, and the Arbitral Tribunal was installed.
Moreover, during 2018, the Grantor initiated the procedure of negotiation and commencement of the modification of the Concession Contract, in
order to determine a mechanism that would allow restarting the execution of the project, without satisfactory resolution to date.
- 73 -

The following table shows the financial information of the principal associates:
Summarized financial information for associates –
Gasoducto Sur
Peruano S.A.
Concesionaria
Chavimochic S.A.C.
At December, 31 At December, 31
Entity 2017 2017 2018
Liquidation Base
Current
Assets 6,813,938 73,004 66,052
Liabilities (5,028,381) (1,111) (2,183)
Non-current
Assets — 11,809 13,580
Liabilities — (342) —
Net assets 1,785,557 83,360 77,449
Entity
Gasoducto Sur
Peruano S.A.
Concesionaria
Chavimochic S.A.C.
2017 2017 2018
Revenues — —
Loss from continuing operations (43,340) (8,455)
Income tax — 3,185 2,543
Loss from continuing operations after income tax — (40,155) (5,912)
Other comprehensive loss — — —
Total comprehensive loss — (40,155) (5,912)
The movement of the investments in associates is as follows:
2016 2017 2018
Opening balance 490,702 286,403 250,053
Contributions received 390,506 2,116 5,616
Impairment of GSP (593,101) — —
Dividends received (10,149) (259) —
Equity interest in results 8,304 (5,566) (5,308)
Decrease in capital (166) (111) (30)
Disposal of Investment — (32,223) —
Conversion adjustment 311 42 (49)
Discontinued operations (4) (349) —
Final balance 286,403 250,053 250,282
In 2017, the sale of investments referred to the purchase-sale contract subscribed by the subsidiary VIVA GyM S.A. for the total of shares
(representing 22.5%) of the associate Promocion Inmobiliaria del Sur S.A. The sale price was agreed in US$25 million (equivalent to S/81
million), which was fully paid.
- 74 -

During 2016, cash contributions were mainly made to Gasoducto Sur Peruano S.A. and Concesionaria Chavimochic amounting to S/373.9 million
and S/15.7 million, respectively.
In 2016 the Group obtained dividends mainly from Bechtel Vial y Vives and Promocion Inmobiliaria del Sur S.A. amounting to S/6.3 million and
S/3.8 million, respectively.
In 2016, the Group included an impairment provision of GSP for S/593.1 million (US$176.49 million).
b) Investment in Joint Ventures
Set out below are the joint ventures of the Group as of December 31:
Carrying amount
Class Interest in capital At December 31,
Entity of share 2017 2018 2017 2018
% %
Sistemas SEC Common 49.00 — 10,112 —
Logistica Químicos del Sur S.A.C. Common 50.00 50.00 7,343 7,230
G.S.J.V. SCC Common 50.00 50.00 878 —
Constructora SK-VyV Ltda. Common 50.00 50.00 49 34
Others — — 236 219
18,618 7,483
i) Tecgas N.V.
This entity provides operation and maintenance services for hydrocarbon pipelines and related activities, it concentrates its activities substantially
in fulfilling the obligations arising from the operation and maintenance of the pipeline gas transport system related to the concession contract for
Gas Concession Peru S.A.A. (TGP, its main client). In April 2017, the Company entered into a purchase-sale contract for all of its shares
(representing 51%) in the investment in a joint venture with Compañia Operadora del Gas del Amazonas S.A.C. (COGA). The sale price was
agreed at US$21.5 million (equivalent to S/69.8), which is fully paid.
ii) Sistemas SEC
The company’s activities include the renovation and automation of the electrical system and signaling of railways and communications within the
Santiago - Chillan - Bulnes - Caravans and Conception areas. The contract was awarded in 2005 for a period of 16 years. In December 2018, the
SEC contract was transferred to Engie S.A. as part of the CAM Group investment sale (Note 37).
- 75 -
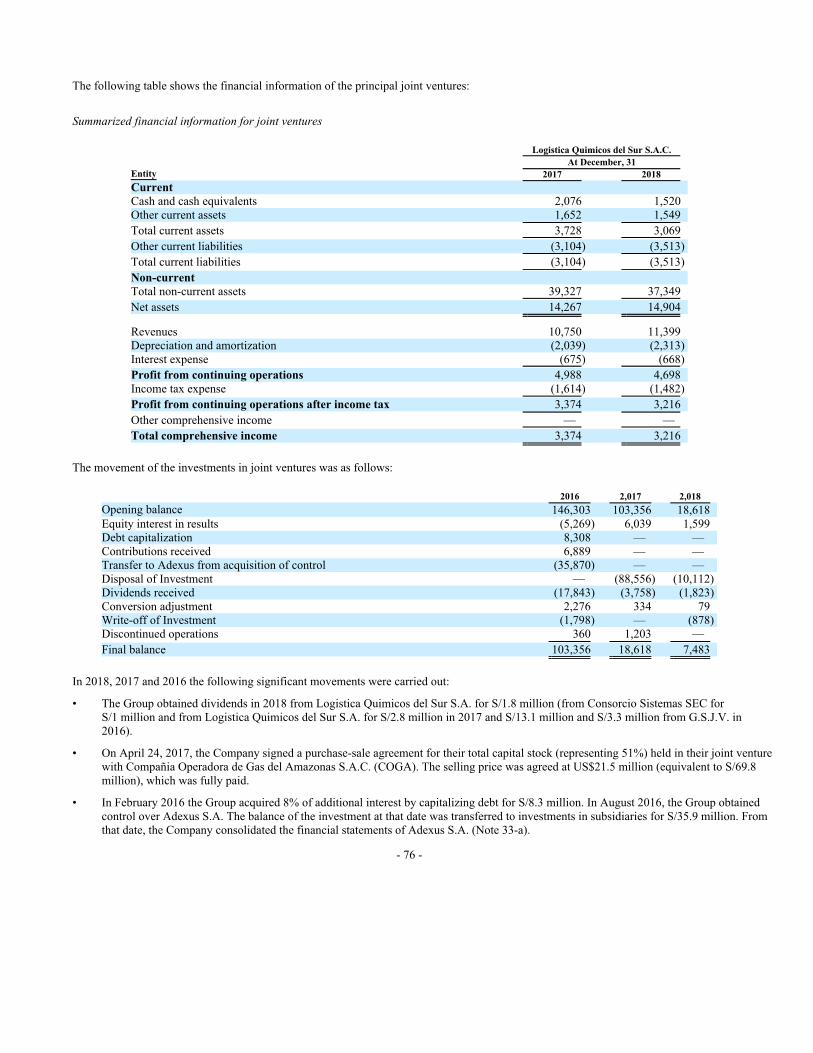
The following table shows the financial information of the principal joint ventures:
Summarized financial information for joint ventures
Logistica Quimicos del Sur S.A.C.
At December, 31
Entity 2017 2018
Current
Cash and cash equivalents 2,076 1,520
Other current assets 1,652 1,549
Total current assets 3,728 3,069
Other current liabilities (3,104) (3,513)
Total current liabilities (3,104) (3,513)
Non-current
Total non-current assets 39,327 37,349
Net assets 14,267 14,904
Revenues 10,750 11,399
Depreciation and amortization (2,039) (2,313)
Interest expense (675) (668)
Profit from continuing operations 4,988 4,698
Income tax expense (1,614) (1,482)
Profit from continuing operations after income tax 3,374 3,216
Other comprehensive income — —
Total comprehensive income 3,374 3,216
The movement of the investments in joint ventures was as follows:
2016 2,017 2,018
Opening balance 146,303 103,356 18,618
Equity interest in results (5,269) 6,039 1,599
Debt capitalization 8,308 — —
Contributions received 6,889 — —
Transfer to Adexus from acquisition of control (35,870) — —
Disposal of Investment — (88,556) (10,112)
Dividends received (17,843) (3,758) (1,823)
Conversion adjustment 2,276 334 79
Write-off of Investment (1,798) — (878)
Discontinued operations 360 1,203 —
Final balance 103,356 18,618 7,483
In 2018, 2017 and 2016 the following significant movements were carried out:
• The Group obtained dividends in 2018 from Logistica Quimicos del Sur S.A. for S/1.8 million (from Consorcio Sistemas SEC for
S/1 million and from Logistica Quimicos del Sur S.A. for S/2.8 million in 2017 and S/13.1 million and S/3.3 million from G.S.J.V. in
2016).
• On April 24, 2017, the Company signed a purchase-sale agreement for their total capital stock (representing 51%) held in their joint venture
with Compañia Operadora de Gas del Amazonas S.A.C. (COGA). The selling price was agreed at US$21.5 million (equivalent to S/69.8
million), which was fully paid.
• In February 2016 the Group acquired 8% of additional interest by capitalizing debt for S/8.3 million. In August 2016, the Group obtained
control over Adexus S.A. The balance of the investment at that date was transferred to investments in subsidiaries for S/35.9 million. From
that date, the Company consolidated the financial statements of Adexus S.A. (Note 33-a).
- 76 -

17 PROPERTY, PLANT AND EQUIPMENT, NET
The movement in property, plant and equipment accounts and its related accumulated depreciation for the year ended December 31, 2016, 2017
and 2018 is as follows:
Land Buildings Machinery Vehicles
Furniture
and
fixtures
Other
equipment
Replacement
units
In-transit
units
Work in
progress Total
At January 1, 2016
Cost 28,409 231,029 1,074,195 443,239 52,225 191,238 15,448 1,817 13,044 2,050,644
Accumulated depreciation and
impairment — (41,464) (509,510) (222,353) (31,048) (134,508) (4) — — (938,887)
Net carrying amount 28,409 189,565 564,685 220,886 21,177 56,730 15,444 1,817 13,044 1,111,757
Net initial carrying amount 28,409 189,565 564,685 220,886 21,177 56,730 15,444 1,817 13,044 1,111,757
Additions 6,238 12,126 81,378 50,574 4,423 24,870 553 19,312 13,594 213,068
Adquisition of subsidiaries -
Adexus (Note 33 a) — 13,913 — 420 1,525 26,130 — — — 41,988
Reclassifications — (281) 4,423 (1,639) 4,547 14,338 2,583 (17,349) (6,622) —
Transfers to inventories 2,941 — — — — — — — — 2,941
Transfers to intangibles
(Note 18) — — — — — — — — (1,257) (1,257)
Deduction for sale of assets (5,256) (14,333) (60,374) (48,521) (1,724) (5,766) — — — (135,974)
Disposals, net — (1,232) (15,149) (1,354) (1,579) (4,364) (661) (2) — (24,341)
Depreciation charge — (14,842) (104,638) (48,041) (7,548) (28,127) (5) — — (203,201)
Impairment loss — (73) (5,190) (317) (3,301) (382) — — — (9,263)
Depreciation for sale deductions — 8,113 48,266 29,536 1,026 1,907 — — — 88,848
Disposals - accumulated
depreciation — 2,010 14,165 1,353 1,449 2,809 — — — 21,786
Translations adjustments 282 130 5,987 922 176 (344) — — 94 7,247
Net final carrying amount 32,614 195,096 533,553 203,819 20,171 87,801 17,914 3,778 18,853 1,113,599
At December 31, 2016
Cost 32,614 241,352 1,090,460 443,641 59,593 246,102 17,923 3,778 18,853 2,154,316
Accumulated depreciation and
impairment — (46,256) (556,907) (239,822) (39,422) (158,301) (9) — — (1,040,717)
Net carrying amount 32,614 195,096 533,553 203,819 20,171 87,801 17,914 3,778 18,853 1,113,599
- 77 -

Land Buildings Machinery Vehicles
Furniture
and
fixtures
Other
equipment
Replacement
units
In-transit
units
Work in
progress Total
At January 1, 2017
Cost 32,614 241,352 1,090,460 443,641 59,593 246,102 17,923 3,778 18,853 2,154,316
Accumulated depreciation and
impairment — (46,256) (556,907) (239,822) (39,422) (158,301) (9) — — (1,040,717)
Net carrying amount 32,614 195,096 533,553 203,819 20,171 87,801 17,914 3,778 18,853 1,113,599
Net initial carrying amount 32,614 195,096 533,553 203,819 20,171 87,801 17,914 3,778 18,853 1,113,599
Additions 157 2,724 48,207 36,594 11,607 36,179 925 22,877 13,178 172,448
Deconsolidation, net (3,713) (26,109) — (1,527) (2,153) (46,032) — (3,903) (4) (83,441)
Reclassifications, net — 1,969 12,459 2,888 609 6,579 4,076 (21,600) (6,980) —
Transfers to intangibles
(Note 18) — — 2,119 724 — — — (964) (2,048) (169)
Deduction for sale of assets (5,616) (51,736) (149,202) (92,079) (4,200) (5,270) — — — (308,103)
Disposals, net — (245) (4,032) (7,507) (422) (9,413) — (230) (3,606) (25,455)
Depreciation charge — (12,469) (100,976) (45,457) (11,654) (26,928) — — — (197,484)
Impairment loss — — (14,328) — — — — — (352) (14,680)
Depreciation for sale deductions — 3,579 115,864 84,145 1,049 3,128 — — — 207,765
Translations adjustments 236 152 606 (350) (23) 980 — — (346) 1,255
Net final carrying amount 23,678 112,961 444,270 181,250 14,984 47,024 22,915 (42) 18,695 865,735
At December 31, 2017
Cost 23,678 157,949 998,207 380,724 62,435 180,409 22,924 (42) 19,047 1,845,331
Accumulated depreciation and
impairment — (44,988) (553,937) (199,474) (47,451) (133,385) (9) — (352) (979,596)
Net carrying amount 23,678 112,961 444,270 181,250 14,984 47,024 22,915 (42) 18,695 865,735
- 78 -

Land Buildings Machinery Vehicles
Furniture
and
fixtures
Other
equipment
Replacement
units
In-transit
units
Work in
progress Total
At January 1, 2018
Cost 23,678 157,949 998,207 380,724 62,435 180,409 22,924 (42) 19,047 1,845,331
Accumulated depreciation and
impairment — (44,988) (553,937) (199,474) (47,451) (133,385) (9) — (352) (979,596)
Net carrying amount 23,678 112,961 444,270 181,250 14,984 47,024 22,915 (42) 18,695 865,735
Net initial carrying amount 23,678 112,961 444,270 181,250 14,984 47,024 22,915 (42) 18,695 865,735
Additions — 13,216 11,318 9,377 2,145 14,122 — 5,577 27,431 83,186
Deconsolidation, net (3,183) (33,989) (108,993) (110,859) (1,539) (32,878) — — (715) (292,156)
Reclassifications — 17,129 16,626 (1,415) (1,430) 75 (5,257) (5,320) (20,408) —
Deduction for sale of assets — (3,527) (55,567) (32,399) (2,164) (2,200) (124) — — (95,981)
Disposals, net — (9,723) (2,607) (1,418) (292) (461) — — (118) (14,619)
Depreciation charge — (14,257) (67,430) (19,391) (3,954) (18,068) — — — (123,100)
Impairment loss — — (5,664) — — — — — — (5,664)
Depreciation for sale deductions — 1,189 37,452 14,868 1,813 1,702 — — — 57,024
Translations adjustments (286) 3,383 (3,310) (788) (134) (2,415) — — (321) (3,871)
Net final carrying amount 20,209 86,382 266,095 39,225 9,429 6,901 17,534 215 24,564 470,554
At December 31, 2018
Cost 20,209 112,548 694,284 83,345 57,222 106,068 17,543 215 24,916 1,116,350
Accumulated depreciation and
impairment — (26,166) (428,189) (44,120) (47,793) (99,167) (9) — (352) (645,796)
Net carrying amount 20,209 86,382 266,095 39,225 9,429 6,901 17,534 215 24,564 470,554
- 79 -
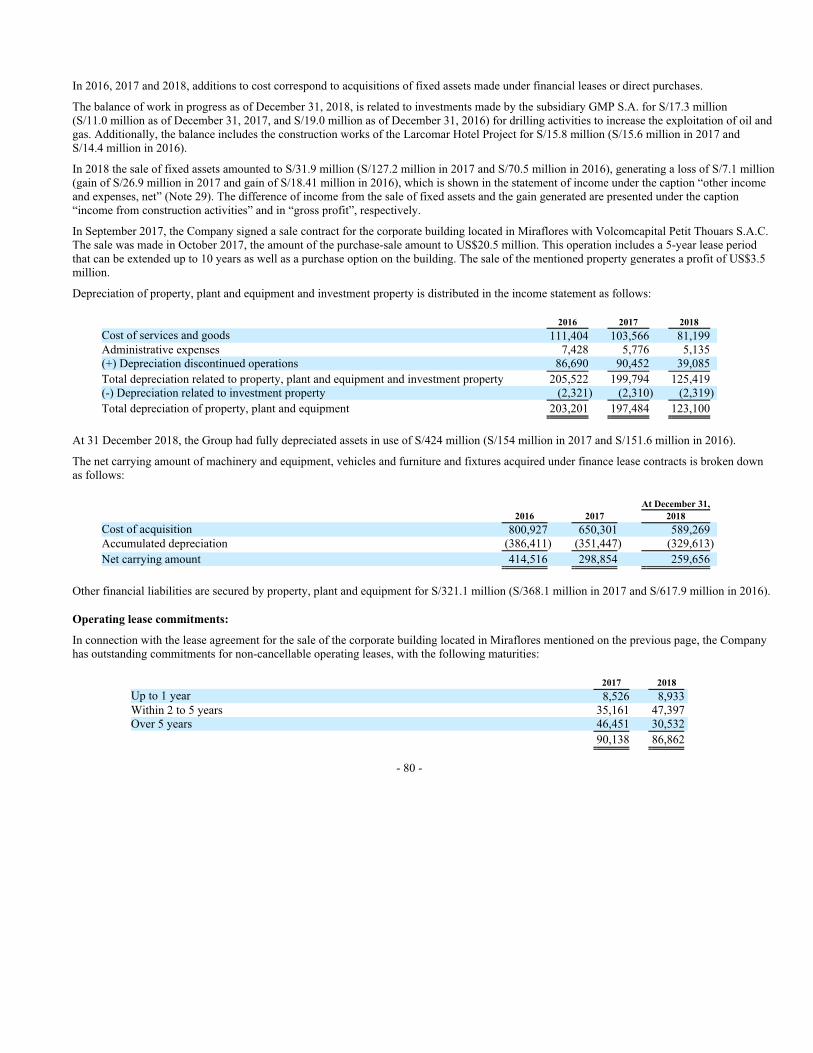
In 2016, 2017 and 2018, additions to cost correspond to acquisitions of fixed assets made under financial leases or direct purchases.
The balance of work in progress as of December 31, 2018, is related to investments made by the subsidiary GMP S.A. for S/17.3 million
(S/11.0 million as of December 31, 2017, and S/19.0 million as of December 31, 2016) for drilling activities to increase the exploitation of oil and
gas. Additionally, the balance includes the construction works of the Larcomar Hotel Project for S/15.8 million (S/15.6 million in 2017 and
S/14.4 million in 2016).
In 2018 the sale of fixed assets amounted to S/31.9 million (S/127.2 million in 2017 and S/70.5 million in 2016), generating a loss of S/7.1 million
(gain of S/26.9 million in 2017 and gain of S/18.41 million in 2016), which is shown in the statement of income under the caption “other income
and expenses, net” (Note 29). The difference of income from the sale of fixed assets and the gain generated are presented under the caption
“income from construction activities” and in “gross profit”, respectively.
In September 2017, the Company signed a sale contract for the corporate building located in Miraflores with Volcomcapital Petit Thouars S.A.C.
The sale was made in October 2017, the amount of the purchase-sale amount to US$20.5 million. This operation includes a 5-year lease period
that can be extended up to 10 years as well as a purchase option on the building. The sale of the mentioned property generates a profit of US$3.5
million.
Depreciation of property, plant and equipment and investment property is distributed in the income statement as follows:
2016 2017 2018
Cost of services and goods 111,404 103,566 81,199
Administrative expenses 7,428 5,776 5,135
(+) Depreciation discontinued operations 86,690 90,452 39,085
Total depreciation related to property, plant and equipment and investment property 205,522 199,794 125,419
(-) Depreciation related to investment property (2,321) (2,310) (2,319)
Total depreciation of property, plant and equipment 203,201 197,484 123,100
At 31 December 2018, the Group had fully depreciated assets in use of S/424 million (S/154 million in 2017 and S/151.6 million in 2016).
The net carrying amount of machinery and equipment, vehicles and furniture and fixtures acquired under finance lease contracts is broken down
as follows:
At December 31,
2016 2017 2018
Cost of acquisition 800,927 650,301 589,269
Accumulated depreciation (386,411) (351,447) (329,613)
Net carrying amount 414,516 298,854 259,656
Other financial liabilities are secured by property, plant and equipment for S/321.1 million (S/368.1 million in 2017 and S/617.9 million in 2016).
Operating lease commitments:
In connection with the lease agreement for the sale of the corporate building located in Miraflores mentioned on the previous page, the Company
has outstanding commitments for non-cancellable operating leases, with the following maturities:
2017 2018
Up to 1 year 8,526 8,933
Within 2 to 5 years 35,161 47,397
Over 5 years 46,451 30,532
90,138 86,862
- 80 -

18 INTANGIBLE ASSETS
The movement in intangible assets and the related accumulated amortization as of December 31, 2016, 2017 and 2018 is as follows:
Goodwill
Trade-
marks
Concession
rights
Contractual
relations
with clients
Software
and
development
costs
Costs of
development
of wells
Development
costs
Land
use
rights
Other
assets Total
At January 1, 2016
Cost 192,227 96,751 716,125 82,134 42,761 326,723 3,623 13,288 15,425 1,489,057
Accumulated amortization and
impairment (21,995) (217) (298,232) (57,940) (32,543) (192,460) (3,623) — (3,761) (610,771)
Net carrying amount 170,232 96,534 417,893 24,194 10,218 134,263 — 13,288 11,664 878,286
Net initial carrying amount 170,232 96,534 417,893 24,194 10,218 134,263 — 13,288 11,664 878,286
Additions — — 118,222 — 16,477 17,772 — — 19,255 171,726
Acquisition of subsidiary –
Adexus (Note 33 a) 930 9,088 6,090 12,822 — — — — 4,203 33,133
Transfers from assets under
construction (Note 17) — — — — — — — — 1,257 1,257
Reclasifications — — 5,258 — 345 — — — (5,603) —
Disposals – net cost — — (1,395) — — (2,395) — — — (3,790)
Amortization — — (28,206) (4,376) (8,043) (40,918) — — (1,200) (82,743)
Impairment loss (38,680) (15,628) — — — — — — — (54,308)
Translations adjustments 12,038 3,672 (102) 171 1,024 — — — (78) 16,725
Net final carrying amount 144,520 93,666 517,760 32,811 20,021 108,722 — 13,288 29,498 960,286
At December 31, 2016
Cost 205,195 109,511 844,213 95,127 60,607 342,100 3,623 13,288 34,294 1,707,958
Accumulated amortization and
impairment (60,675) (15,845) (326,453) (62,316) (40,586) (233,378) (3,623) — (4,796) (747,672)
Net carrying amount 144,520 93,666 517,760 32,811 20,021 108,722 — 13,288 29,498 960,286
- 81 -

Goodwill
Trade-
marks
Concession
rights
Contractual
relations
with clients
Software
and
development
costs
Costs of
development
of wells
Development
costs
Land
use
rights
Other
assets Total
At January 1, 2017
Cost 205,195 109,511 844,213 95,127 60,607 342,100 3,623 13,288 34,294 1,707,958
Accumulated amortization and
impairment (60,675) (15,845) (326,453) (62,316) (40,586) (233,378) (3,623) — (4,796) (747,672)
Net cost 144,520 93,666 517,760 32,811 20,021 108,722 — 13,288 29,498 960,286
Net initial cost 144,520 93,666 517,760 32,811 20,021 108,722 — 13,288 29,498 960,286
Additions — — 38,156 5,274 3,330 49,698 — — 20,832 117,290
Capitalization of interest — — 26,015 — — — — — — 26,015
Deconsolidation, net (3,524) — (17,354) — (21) — — — (2,767) (23,666)
Transfers from assets under
construction (Note 17) — — (11,217) — 2,761 5,008 — — 3,617 169
Derecognition - cost — — (537) — (1,572) — — — (355) (2,464)
Amortization — — (24,609) (4,189) (8,091) (46,695) — — (2,973) (86,557)
Impairment (20,068) (29,541) — — — — — — — (49,609)
Translations adjustments (4,124) 975 13 369 1,196 — — — 177 (1,394)
Net final cost 116,804 65,100 528,227 34,265 17,624 116,733 — 13,288 48,029 940,070
At December 31, 2017
Cost 197,547 110,486 841,229 98,607 59,913 396,806 3,623 13,288 55,701 1,777,200
Accumulated amortization and
impairment (80,743) (45,386) (313,002) (64,342) (42,289) (280,073) (3,623) — (7,672) (837,130)
Net cost 116,804 65,100 528,227 34,265 17,624 116,733 — 13,288 48,029 940,070
- 82 -

Goodwill
Trade-
marks
Concession
rights
Contractual
relations
with clients
Software
and
development
costs
Costs of
development
of wells
Development
costs
Land
use
rights
Other
assets Total
At January 1, 2018
Cost 197,547 110,486 841,229 98,607 59,913 396,806 3,623 13,288 55,701 1,777,200
Accumulated amortization and
impairment (80,743) (45,386) (313,002) (64,342) (42,289) (280,073) (3,623) — (7,672) (837,130)
Net cost 116,804 65,100 528,227 34,265 17,624 116,733 — 13,288 48,029 940,070
Net initial cost 116,804 65,100 528,227 34,265 17,624 116,733 — 13,288 48,029 940,070
Additions — — 23,803 — 3,267 68,544 — — 5,067 100,681
Capitalization of interest
expenses — — 3,361 — — — — — — 3,361
Desconsolidation, net (20,086) (8,358) (22,758) (8,909) (10,153) — — — (1,863) (72,127)
Transfers from assets under
construction (Note 17) — — — — 199 — — — (199) —
Derecognition - cost — — (16) — (1,941) (4,126) — — — (6,083)
Amortization — — (50,776) (7,996) (5,834) (41,930) — — (5,536) (112,072)
Translations adjustments (3,430) (4,301) 199 (303) 830 — — — 270 (6,735)
Net final cost 93,288 52,441 482,040 17,057 3,992 139,221 — 13,288 45,768 847,095
At December 31, 2018
Cost 174,031 97,097 836,254 85,482 16,177 461,224 3,623 13,288 54,644 1,741,820
Accumulated amortization and
impairment (80,743) (44,656) (354,214) (68,425) (12,185) (322,003) (3,623) — (8,876) (894,725)
Net cost 93,288 52,441 482,040 17,057 3,992 139,221 — 13,288 45,768 847,095
- 83 -

a) Goodwill
Management reviews the results of its businesses on the basis of the type of economic activity carried on. At December 31, the goodwill of the
cash-generating units (CGUs) is distributed as follows:
2016 2017 2018
Engineering and construction 98,587 75,051 71,621
Electromechanical 20,737 20,737 20,737
Mining and construction services 13,366 13,366 —
IT equipment and services 5,102 930 930
Telecommunications services 6,728 6,720 —
144,520 116,804 93,288
As a result of management’s annual impairment tests on goodwill, the recoverable amount of cash-generating units was determined on the basis of
the greater their value in use and fair value less disposal costs. The value in use was determined on the basis of expected future cash flows
generated by the evaluation of CGUs.
As a result of these assessments, an impairment was identified in 2016 and 2017 in two CGU’s, Vial y Vives-DSD, and Morelco S.A. and was
accounted for as of December 31st, 2016 and 2017, respectively. The impairment loss was generated due to the decrease in the expected cash
flows, as a result of the reduction of the contracts linked to the backlog. The amount of the impairment impacted the goodwill for S/20.1 million in
2017 (S/38.7 million in 2016). No impairment was identified during 2018.
The main assumptions used by the Group to determine fair value less disposal costs and value in use are as follows:
Engineering
and
construction
Electro-
mechanical
IT equipment
and
services
Telecommu-
nication
services
% % % %
2016
Gross margin 9.50% - 12.99% 11.10% 15.00% - 23.19% 11.75%
Terminal growth rate 3.00% - 4.00% 2.00% 2.00% - 3.00% 3.00%
Discount rate 9.66% - 12.72% 11.01% 21.74% 10.02%
2017
Gross margin 9.50% 8.00% 20.83% 4.26%
Terminal growth rate 3.00% 2.00% 2.90% 3.00%
Discount rate 11.18% 11.48% 10.17% 4.02%
2018
Gross margin 12.67% 7.63% 20.00% —
Terminal growth rate 3.00% 2.00% 2.90% —
Discount rate 12.55% 11.44% 15.39% —
- 84 -

These assumptions have been used for the analysis of each CGUs for a period of 5 years.
Management determines budgeted gross margins based on past results and market development expectations. Average growth rates are consistent
with those prevailing in the industry. The discount rates used are pre-tax or post-tax, as applicable, and reflect the specific risks associated with
the CGUs evaluated.
b) Trademarks
This item mainly includes the brands acquired in the business combination processes with Vial y Vives S.A.C. (S/75.4 million) in August 2013,
Morelco S.A.S. (S/33.33 million) in December 2014 and Adexus S.A. (S/9.1 million) in August 2016. Management determined that the brands
from Vial y Vives, Morelco and Adexus have indefinite useful lives; consequently, annual impairment tests are performed on these intangible
assets as explained in paragraph a) above.
As a result of these evaluations, as of December 31, 2017, and 2016, the Vial y Vives - DSD brand partially deteriorated, the amount of the
impairment was S/29.5 million and S/15.6 million respectively. It was not necessary to evaluate the impairment of goodwill in Stracon GyM S.A.
because in March 2018 the Company sold its interest (87.59%) for a total of US$76.8 million (equivalent to S/248.8 million), generating a profit
of S/41.9 million.
The main assumptions used by the Group to determine fair value less cost of sales are as follows:
Engineering and
construction
IT
Equipment
Services
Morelco
Vial yVives-
DSD Adexus
% % %
2016
Average revenue growth rate 14.39% 24.53% 12.60%
Terminal growth rate 3.00% 4.00% 3.00%
Discount rate 11.85% 9.87% 16.05%
2017
Average revenue growth rate 9.60% 25.00% 9.19%
Terminal growth rate 3.00% 4.00% 3.00%
Discount rate 11.18% 14.80% 16.63%
2018
Average revenue growth rate 12.25% 19.58% 17.93%
Terminal growth rate 3.00% 3.00% 2.90%
Discount rate 12.55% 14.00% 12.40%
c) Concessions
The intangibles of Norvial S.A. as of December 31, 2018, mainly comprise: i) the EPC Contract for S/70 million (S/78 million as of December 31,
2017), ii) the construction of the second section of the “Ancon-Huacho-Pativilca” highway and the cost of capitalized indebtedness at effective
interest rates between 7.14% and 8.72% for S/19 million and S/3 million, respectively (S/331 million and S/26 million, respectively as of
December 31, 2017 at interest rates between 7.14% and 8.72%), iii) road improvement for S/20 million (S/17 million as of December 31, 2017),
iv) Implementation for road safety for S/4 million (S/4 million as of December 31, 2017), v) capitalization of the work of the second roadway for
S/310 million (there was no movement as of December 31, 2017), (vi) disbursements for land adquisition for S/5 million (S/5 million as of
December 31, 2017), (vii) Other intangible assets contracted for the delivery process of the S/5 million Concession (S/4 million as of
December 31, 2017). During 2018 debt costs of S/3 million have been capitalized (S/26 million in 2017). See Note 2.20.
- 85 -

d) Cost of well’s development
Through one of its subsidiaries, GMP S.A., the Group operates and extracts oil from two fields (Lot I and Lot V) located in the province of Talara,
in northern Peru. Both fields are operated under long-term service contracts in which the Group provides hydrocarbon extraction services to
Perupetro.
On December 10, 2014, the Peruvian State granted the subsidiary GMP S.A. the right to exploit for 30 years the oil lots III and IV (owned by the
Peruvian State - Perupetro) located in the Talara basin, Piura, of 230 and 330 wells, respectively. The total expected investment in both lots
amounts to US$350 million; operations began in April 2015.
As part of the Group’s obligations under the service contracts, it is necessary to incur certain costs to prepare the wells located in Lots I, III, IV
and V. These costs are capitalized as part of the intangible assets with a value of S/68 million during 2018 (S/99 million in 2017 and S/80 million
in 2016), which includes the capitalization of the provision for dismantling wells for S/3 million (S/50 million during 2017).
The lots are amortized on the basis of the useful lives of the wells (determined as five years for lots I and V and units produced for lots III and IV),
which is less than the total service contract period with Perupetro.
e) Amortization of intangible assets
Amortization of intangibles is broken down in the income statement as follows:
2016 2017 2018
Cost of sales and services (Note 27) 59,682 67,381 98,318
Administrative expenses (Note 27) 4,890 3,002 4,856
(+) Amortization discontinued operations 18,171 16,174 8,898
82,743 86,557 112,072
19 BORROWINGS
As of December 31, this item includes:
Total Current Non-current
2017 2018 2017 2018 2017 2018
Bank overdrafts 120 119 120 119 — —
Bank loans 1,561,634 1,023,481 990,467 810,188 571,167 213,293
Finance leases 128,309 33,488 66,177 13,514 62,132 19,974
Other financial entities — 145,584 — 2,653 — 142,931
1,690,063 1,202,672 1,056,764 826,474 633,299 376,198
- 86 -

a) Bank Loans
As of December 31, 2017, and 2018 includes bank loans in local and foreign currency for working capital. These obligations bear fixed interest
rates ranging from 1.6% to 15.8% in 2018 and from 3.3% to 13.9% in 2017.
Current Non-current
Interest Date of At December, 31 At December, 31
rate maturity 2017 2018 2017 2018
GyM S.A. 1.63% /8.91% 2018 / 2019 551,413 227,770 (iii) 95,376 —
Graña y Montero S.A.A. Libor USD 3M
+ from 4.9%
to 5.5% 2018 / 2020 113,412 206,836 (ii) 363,564 125,547 (i)
GyM Ferrovías Libor USD 1M
+ to 2% 2019 — 209,463 — —
Viva GyM S.A. 7.00% / 12.00% 2018 / 2020 157,592 129,617 — 2,102
GMP S.A. 4.55% /6.04% 2018 / 2020 42,911 22,587 96,245 85,644
CONCAR S.A. 15.75% 2019 812 13,915 — —
Adexus S.A. 5.90% 2018 / 2019 46,552 — 3,175 —
CAM Holding S.A. 4.68% / 13.76% 2018 77,775 — 12,807 —
990,467 810,188 571,167 213,293
i) Credit Suisse Syndicated Loan
In December 2015, the Company entered into a US$200 million medium-term loan agreement with Credit Suisse AG, Cayman Islands Branch
and Credit Suisse Securities (USA) LLC. The loan term is five years with quarterly installments starting on the 18th month. The loan bears
interest at a rate of three months Libor plus 4.9% per year (3.8% in 2017). The funds were used to finance the equity participation in GSP. On
June 27, 2017, the Company renegotiated the terms of this loan to correct defaults related to the cancellation of the GSP concession.
As of December 31, 2018, the principal balance of the loan amounts to US$37.5 million (equivalent to S/126.7 million). The Company is in
compliance with its obligations to do and not to do under the credit agreement.
ii) GSP Bridge Loan
As of December 31, 2016, the balance of bank loans included US$129 million (S/433 million) of the corporate guarantee issued by the Company
to guarantee the bridge loan granted to GSP, which was due as of December 31, 2016. However, on June 27, 2017, the Company reached a
refinancing agreement with Natixis, BBVA, SMBC and MUFJ for US$78.7 million (S/256.3 million), this amount was used to repay the GSP
bridge loan. The new loan matures in June 2020, with prepayments coming from the sale of assets for 40% in the first year and an additional 30%
in the second year.
As of December 31, 2018, the principal balance of the loan was US$63.5 million (equivalent to S/214.5 million). Although as of December 31,
2018, the company had breached some of its obligations under the credit agreement, it has requested a waiver. Due to this default, the loan
balance was reclassified as current. This waiver was granted at the closing of this report.
iii) Financial Stability Framework Agreement
On July 31, 2017, we, and certain of our subsidiaries, GyM, Construyendo Pais S.A., Vial y Vives — DSD and Concesionaria Vía Expresa Sur
S.A., entered into a Financial Stability Framework Agreement (together with certain complementary contracts, the “Framework Agreement”) with
the following financial entities: Scotiabank Perú S.A., Banco Internacional del Perú S.A.A., BBVA Banco Continental, Banco de Crédito del
Perú, Citibank del Peru SA and Citibank N.A. The Framework Agreement aims to: (i) grant GyM a syndicated revolving line of credit for
working capital for up to US$1.6 million and S/143.9 million, which may be increased by an additional US$14 million subject to certain
conditions; (ii) grant GyM a line of credit of up to US$51.6 million and S/33.6 million; (iii) grant Graña y Montero S.A.A., GyM, Construyendo
Pais S.A., Vial y Vives – DSD and Concesionaria Vía Expresa Sur S.A. a non-revolving line of credit to finance reimbursement obligations under
performance bonds; (iv) grant a syndicated line of credit in favor of Graña y Montero S.A.A. and GyM for the issuance of performance bonds up
to an amount of US$100 million (which may be increased by an additional US$50 million subject to compliance with certain conditions); and (v)
to commit to maintain existing standby letters of credit issued at the request of GyM and Graña y Montero S.A.A., as well as the request of
Construyendo Pais S.A., Vial y Vives – DSD and Concesionaria Vía Expresa Sur S.A. In April of 2018, the Group repaid US$72.7 million
(equivalent to S/245.8 million) of the facility with the proceeds of the sale of Stracon GyM S.A., and in July of 2018, an additional of US$15.4
million (equivalent to S/52.1 million). As of December 31, 2018, and the date of this annual report, there was US$59.4 million (equivalent to
S/200.8 million) outstanding under this agreement.
- 87 -

As of December 31, 2018 and as of the date hereof, our construction subsidiary GyM is under a continuing default under the Financial Stability
Framework Agreement with respect to its failure to comply with certain ratios between Tranche A (client invoices (facturas)) and Tranche B
(project valuations (valorizaciones)). No event of default has been formally noticed to GyM by the lenders, and our subsidiary has requested a
waiver from the lenders, which is pending. If duly noticed to GyM by the lenders, the consequence of this default would be to transfer certain
amounts due under Tranche B to Tranche A, for which payment is not due until July 2019. As of December 31, 2018, there was US$43.7 million
(S/.147.8 million) outstanding under Tranche A and US$15.7 million (S/.53.0 million) outstanding under Tranche B of the facility, for a total of
US$59.4 million (S/200.8 million).
b) Financial Leases
Current Non-current
Interest Date of At December, 31 At December, 31
rate maturity 2017 2018 2017 2018
GyM S.A. 0.40% /9.27% 2018 / 2023 40,107 4,523 32,397 9,314
GMP S.A. 0.25% /4.50% 2018 / 2021 4,013 4,034 5,304 1,522
Viva GyM S.A. 7.79% /8.46% 2018 / 2022 4,439 3,488 12,010 8,582
CONCAR S.A. 3.65% /5.05% 2018 / 2020 1,777 1,469 1,945 556
Adexus S.A. 3.36% /12.31% 2018 / 2022 8,567 — 4,363 —
GMI S.A. 5.56% /6.90% 2018 347 — — —
CAM Holding S.A. 3.01% /14.76% 2018 6,240 — 5,692 —
CAM Servicios Perú S.A. 6.79% /7.75% 2018 687 — 421 —
66,177 13,514 62,132 19,974
The minimum payments to be made according to their maturity and the present value of the leasing obligations are as follows:
At December 31,
2017 2018
Up to 1 year 72,864 15,151
From 1 to 5 years 65,899 21,583
Over 5 years 638 —
139,401 36,734
Future financial charges on finance leases (11,092) (3,246)
Present value of the obligations for finance lease contracts 128,309 33,488
The present value of the finance lease agreements obligations are as follows:
At December 31,
2017 2018
Up to 1 year 66,177 13,514
From 1 year to 5 years 61,501 19,974
Over 5 years 631 —
128,309 33,488
c) Other financial entities
Monetization of Norvial dividends
On May 29, 2018, an investment agreement was signed between the Company and Inversiones Concesion Vial S.A.C. (“BCI Peru”) - with the
intervention of Fondo de Inversion BCI NV (“Fondo BCI”) and BCI Management Administradora General de Fondos S.A. (“BCI Asset
Management”) to monetize the future dividends on Norvial S.A. that our Company will receive for a period of seven years. The transaction
amount is US$42.3 million (equivalent to S/138 million) and was completed on June 11, 2018.
It has also been agreed that the Company will have call options on 48.8% of the economic rights of Norvial that BCI Peru will maintain through
its participation in Inversiones en Autopistas S.A. Such options will be subject to certain conditions such as the maturity of different terms,
recovery of the investment made with the funds of the BCI Fund (according to different economic estimates) and/or the occurrence of a change of
control.
- 88 -

d) Fair value of debt
The book value and fair value of financial liabilities are as follows:
Carrying amount Fair value
At December, 31 At December, 31
2017 2018 2017 2018
Bank overdrafts 120 119 120 119
Bank loans 1,561,634 1,023,481 1,627,000 1,152,885
Finance leases 128,309 33,488 141,040 38,399
Other financial entities — 145,584 — 145,584
1,690,063 1,202,672 1,768,160 1,336,987
In 2018, fair values are based on discounted cash flows using debt rates between 2.4% and 8.9% (between 2.4% and 13.8% in 2017) and are
within level 2 of the fair value hierarchy.
20 BONDS
As of December 31, this item includes:
Total Current Non-current
2017 2018 2017 2018 2017 2018
GyM Ferrovías 603,657 611,660 12,294 13,422 591,363 598,238
Norvial 343,910 325,382 24,361 25,745 319,549 299,637
947,567 937,042 36,655 39,167 910,912 897,875
a) GyM Ferrovias S.A.
In February 2015, the subsidiary GyM Ferrovias S.A. completed an international corporate bond issue under “Regulation S” of the United States
of America. The issue was made in soles VAC (adjusted by the Constant Update Value) for an amount of S/629 million. Issuance costs amounted
to S/22 million. The bonds mature in November 2039 and bear interest at a rate of 4.75% (plus the VAC adjustment), have a risk rating of AA+
(local scale) granted by Apoyo & Asociados Internacionales Clasificadora de Riesgo and a guarantee scheme that includes a mortgage on the
concession of which GyM Ferrovias S.A. is the concessionaire, collateral on the shares of GyM Ferrovias S.A., Assignment of the Collection
Rights of the Administration Trust, a Flows Trust and Reserve Accounts for the Debt Service, Operation, and Maintenance and the ongoing
Capex. At December 31, 2018, S/67.7 million have been amortized (S/57.5 million at December 31, 2017).
As of December 31, 2018, the balance includes accrued interest and VAC adjustments for S/72.0 million (S/60.5 million as of December 31,
2017).
- 89 -

As of December 31, 2017, and 2018, the movement in this account is as follows:
2017 2018
Balance at January, 1 604,031 603,657
Amortization (19,141) (10,178)
Accrued interest 49,132 48,130
Interest paid (30,365) (29,949)
Balance at December, 31 603,657 611,660
As part of the bond structuring process, GyM Ferrovias S.A. undertook to report and verify compliance with the following covenants, measured
by its individual financial statements:
• Debt service coverage ratio not less than 1.2 times;
• Maintain a minimum balance in the trust equal to one-quarter of operating and maintenance costs (including VAT);
• Maintain a constant balance in the minimum trust equal to the following two coupons according to the bond schedule.
On August 23, 2017, GyM Ferrovias S.A. and Line One CPAO Purchaser LLC signed the purchase-sale contract and assignment of collection
rights for the “Annual Payment for Complementary Investment (PAO Complementary)” derived from the Concession Contract for an amount
equivalent to US$316 million.
On August 23, 2017, GyM Ferrovias S.A. as Borrower, Mizuho Bank, Ltd., and Sumitomo Mitsui Banking Corporation as Lenders and Mizuho
Bank, Ltd. as Administrative Agent signed a Working Capital loan agreement for an amount equivalent to US$80 million to partially finance the
Lima Metro Line 1 Expansion Project. As of December 31, 2018, the balance payable amounts to US$62 million.
b) Norvial S.A.
Between 2015 and 2016, the subsidiary, Norvial S.A., issued the First Corporate Bond Program on the Lima Stock Exchange for S/365 million.
The rating companies Equilibrium Risk and Apoyo & Asociados Internacionales gave the rating of AA to this debt instrument.
The purpose of the awarded funds was to finance the construction works of the Second Stage of the Road Network No. 5 and the financing of the
VAT linked to the execution of the expenses of the Project.
- 90 -
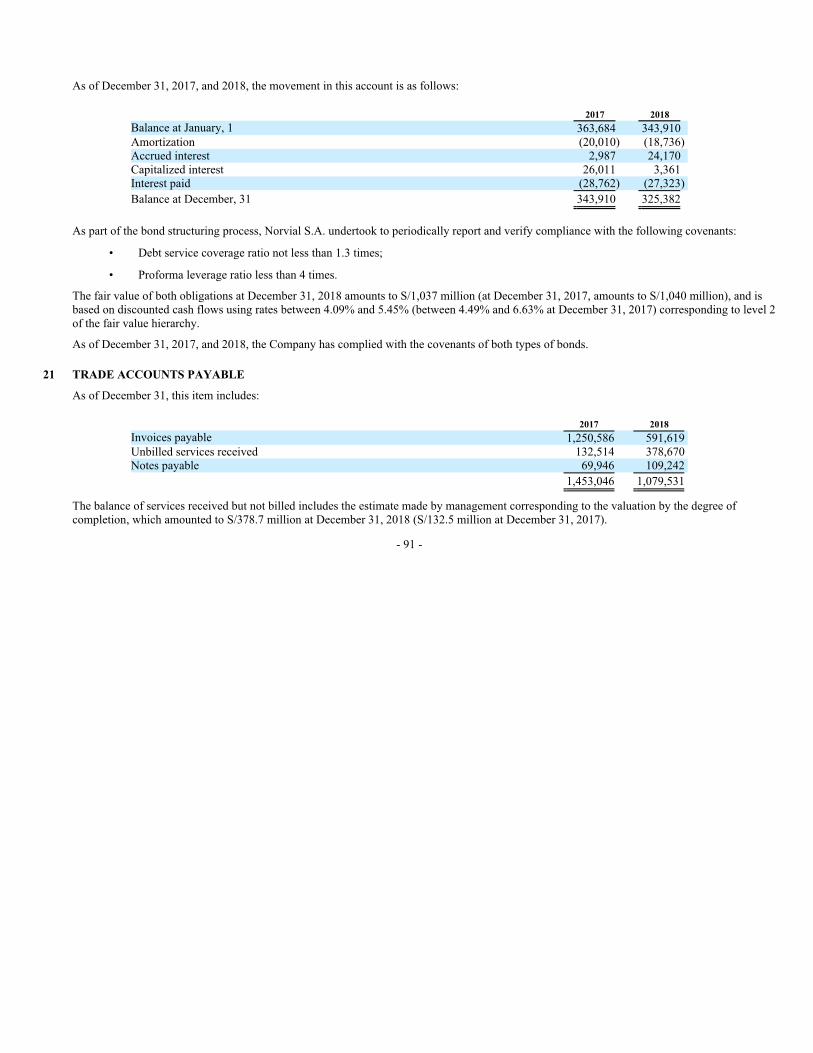
As of December 31, 2017, and 2018, the movement in this account is as follows:
2017 2018
Balance at January, 1 363,684 343,910
Amortization (20,010) (18,736)
Accrued interest 2,987 24,170
Capitalized interest 26,011 3,361
Interest paid (28,762) (27,323)
Balance at December, 31 343,910 325,382
As part of the bond structuring process, Norvial S.A. undertook to periodically report and verify compliance with the following covenants:
• Debt service coverage ratio not less than 1.3 times;
• Proforma leverage ratio less than 4 times.
The fair value of both obligations at December 31, 2018 amounts to S/1,037 million (at December 31, 2017, amounts to S/1,040 million), and is
based on discounted cash flows using rates between 4.09% and 5.45% (between 4.49% and 6.63% at December 31, 2017) corresponding to level 2
of the fair value hierarchy.
As of December 31, 2017, and 2018, the Company has complied with the covenants of both types of bonds.
21 TRADE ACCOUNTS PAYABLE
As of December 31, this item includes:
2017 2018
Invoices payable 1,250,586 591,619
Unbilled services received 132,514 378,670
Notes payable 69,946 109,242
1,453,046 1,079,531
The balance of services received but not billed includes the estimate made by management corresponding to the valuation by the degree of
completion, which amounted to S/378.7 million at December 31, 2018 (S/132.5 million at December 31, 2017).
- 91 -
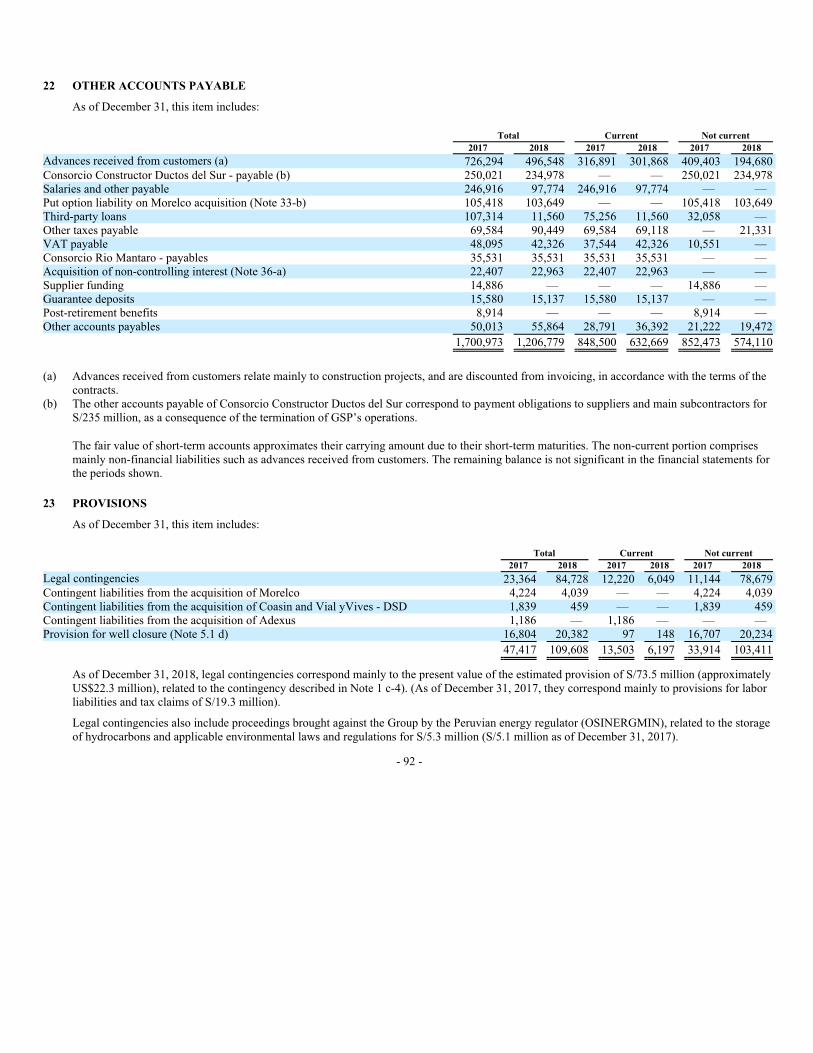
22 OTHER ACCOUNTS PAYABLE
As of December 31, this item includes:
Total Current Not current
2017 2018 2017 2018 2017 2018
Advances received from customers (a) 726,294 496,548 316,891 301,868 409,403 194,680
Consorcio Constructor Ductos del Sur - payable (b) 250,021 234,978 — — 250,021 234,978
Salaries and other payable 246,916 97,774 246,916 97,774 — —
Put option liability on Morelco acquisition (Note 33-b) 105,418 103,649 — — 105,418 103,649
Third-party loans 107,314 11,560 75,256 11,560 32,058 —
Other taxes payable 69,584 90,449 69,584 69,118 — 21,331
VAT payable 48,095 42,326 37,544 42,326 10,551 —
Consorcio Rio Mantaro - payables 35,531 35,531 35,531 35,531 — —
Acquisition of non-controlling interest (Note 36-a) 22,407 22,963 22,407 22,963 — —
Supplier funding 14,886 — — — 14,886 —
Guarantee deposits 15,580 15,137 15,580 15,137 — —
Post-retirement benefits 8,914 — — — 8,914 —
Other accounts payables 50,013 55,864 28,791 36,392 21,222 19,472
1,700,973 1,206,779 848,500 632,669 852,473 574,110
(a) Advances received from customers relate mainly to construction projects, and are discounted from invoicing, in accordance with the terms of the
contracts.
(b) The other accounts payable of Consorcio Constructor Ductos del Sur correspond to payment obligations to suppliers and main subcontractors for
S/235 million, as a consequence of the termination of GSP’s operations.
The fair value of short-term accounts approximates their carrying amount due to their short-term maturities. The non-current portion comprises
mainly non-financial liabilities such as advances received from customers. The remaining balance is not significant in the financial statements for
the periods shown.
23 PROVISIONS
As of December 31, this item includes:
Total Current Not current
2017 2018 2017 2018 2017 2018
Legal contingencies 23,364 84,728 12,220 6,049 11,144 78,679
Contingent liabilities from the acquisition of Morelco 4,224 4,039 — — 4,224 4,039
Contingent liabilities from the acquisition of Coasin and Vial yVives - DSD 1,839 459 — — 1,839 459
Contingent liabilities from the acquisition of Adexus 1,186 — 1,186 — — —
Provision for well closure (Note 5.1 d) 16,804 20,382 97 148 16,707 20,234
47,417 109,608 13,503 6,197 33,914 103,411
As of December 31, 2018, legal contingencies correspond mainly to the present value of the estimated provision of S/73.5 million (approximately
US$22.3 million), related to the contingency described in Note 1 c-4). (As of December 31, 2017, they correspond mainly to provisions for labor
liabilities and tax claims of S/19.3 million).
Legal contingencies also include proceedings brought against the Group by the Peruvian energy regulator (OSINERGMIN), related to the storage
of hydrocarbons and applicable environmental laws and regulations for S/5.3 million (S/5.1 million as of December 31, 2017).
- 92 -

The gross movement of other provisions is as follows:
Other provisions
Legal
contingencies
Contingent
liabilities
resulting
from
acquisitions
Provision
for well
closure Total
At January 1, 2017 15,732 8,125 17,216 41,073
Additions 9,510 — — 9,510
Reversals of provisions (235) (809) (412) (1,456)
Payments (1,680) — — (1,680)
Translation adjustments 37 (67) — (30)
At December 31, 2017 23,364 7,249 16,804 47,417
At January 1, 2018 23,364 7,249 16,804 47,417
Additions 75,369 — 3,578 78,947
Reversals of provisions (4,875) (1,343) — (6,218)
Deconsolidation of subsidiaries (2,340) — — (2,340)
Reclasification liabilities classified as held for sale — (1,093) — (1,093)
Payments (6,615) — — (6,615)
Translation adjustments (175) (315) — (490)
At December 31, 2018 84,728 4,498 20,382 109,608
24 EQUITY
a) Capital
The General Shareholders’ Meeting held on November 6, 2018, approved a capital increase of up to US$130 million (equivalent to S/434 million,
approximately), equivalent to 211,864,065 shares at a price of US$0.6136. As of December 31, 2018, during the first stage of the placement and
the conclusion of two preferred subscription rounds, a total of 69,380,402 shares were subscribed. Therefore, the Company’s capital is represented
by 729,434,192 shares with a par value of S/1.00 each, out of which 660,053,790 are registered in the Public Registry, and 69,380,402 are in the
process of registration. As of December 31, 2017, the issued, authorized, subscribed, and paid-in capital in accordance with the Company’s
bylaws and amendments thereto was represented by 660,053,790 common shares. The company will continue its efforts to place the balance or
part of the shares pending subscription.
As of December 31, 2017, a total of 259,302,745 shares were represented in ADS, equivalent to 51,860,549 ADSs at the rate of 5 shares per ADS;
and 207,931,660 shares were represented in ADSs equivalent to 41,586,332 ADS as of December 31, 2018.
- 93 -

As of December 31, 2018, the Company’s shareholding structure is as follows:
Percentage of individual interest in capital
Number of
shareholders
Total
percentage
of interest
Up to 1.00 1,926 16.37
From 1.01 to 5.00 12 26.54
From 5.01 to 10.00 2 12.47
Over 10 2 44.62
1,942 100.00
As of December 31, 2018, the Company’s shares had a year-end market price of S/1.99 per share and a trading frequency of 91.6% (S/1.87 per
share and a trading frequency of 100% as of December 31, 2017).
b) Legal reserve
In accordance with the Peruvian General Law of Corporations, the legal reserve of the Company is constituted with the transfer of 10% of the
annual profit until reaching an amount equivalent to 20% of the paid-in capital. In the absence of profits or unrestricted reserves, the legal reserve
must be applied to the compensation of losses and must be replenished with the profits of subsequent years. This reserve may be capitalized; and
its replacement is also mandatory. As of December 31, 2018, the balance of the legal reserve reached the aforementioned limit.
c) Voluntary reserve
As of December 31, 2017, and 2018, this S/29.97 million reserve is related to the excess of the legal reserve; this reserve is above the requirement
to constitute a reserve until it reaches the equivalent of 20% of the paid-in capital.
d) Share premium
This item includes the excess of total income obtained by shares issued in 2013 compared to their nominal value of S/1,055.5 million and by
shares issued in 2018 an amount of S/68.2 million.
In addition, this account recognizes the difference between the nominal value and the transaction value for acquisitions of shares in
non-controlling interests.
e) Retained earnings
Dividends distributed to shareholders other than domiciled legal entities are subject to the rates of 4.1% (earnings until 2014), 6.8% (2015 and
2016 earnings) and 5.00% (2017 and thereafter) for income tax charged to these shareholders; such tax is withheld and settled by the Company.
Dividends for fiscal years 2017 and 2018 were not distributed (Note 34).
- 94 -
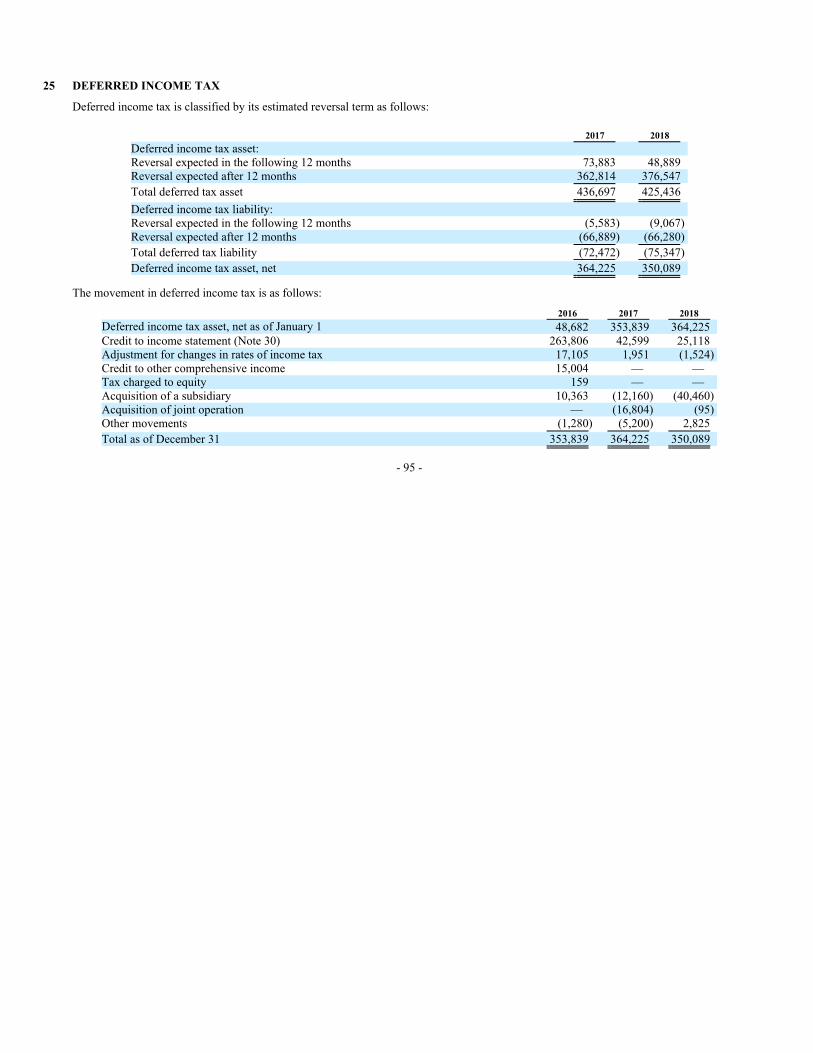
25 DEFERRED INCOME TAX
Deferred income tax is classified by its estimated reversal term as follows:
2017 2018
Deferred income tax asset:
Reversal expected in the following 12 months 73,883 48,889
Reversal expected after 12 months 362,814 376,547
Total deferred tax asset 436,697 425,436
Deferred income tax liability:
Reversal expected in the following 12 months (5,583) (9,067)
Reversal expected after 12 months (66,889) (66,280)
Total deferred tax liability (72,472) (75,347)
Deferred income tax asset, net 364,225 350,089
The movement in deferred income tax is as follows:
2016 2017 2018
Deferred income tax asset, net as of January 1 48,682 353,839 364,225
Credit to income statement (Note 30) 263,806 42,599 25,118
Adjustment for changes in rates of income tax 17,105 1,951 (1,524)
Credit to other comprehensive income 15,004 — —
Tax charged to equity 159 — —
Acquisition of a subsidiary 10,363 (12,160) (40,460)
Acquisition of joint operation — (16,804) (95)
Other movements (1,280) (5,200) 2,825
Total as of December 31 353,839 364,225 350,089
- 95 -

The movement in deferred tax assets and liabilities in the year, without considering the offsetting of balances, is as follows:
Deferred income tax liabilities
Difference in
depreciation
rates
Deferred
income
Fair value
gains
Work
in
Process
Tax
receivables
Borrowing
costs
capitalized
Purchase
price
allocation Others Total
At January 1, 2016 45,155 — 30,684 24,723 25,543 15,178 — 11,810 153,093
(Charge) credit to P&L 16,595 — 13,587 (16,481) 3,324 6,240 — 2,618 25,883
(Charge) credit to OCI — — (15,348) — — — — — (15,348)
Reclassification of previous years — — (28,923) — — — 30,187 (1,264) —
Acquisition of subsidiary — — — — — — (3,069) — (3,069)
At December 31, 2016 61,750 — — 8,242 28,867 21,418 27,118 13,164 160,559
(Charge) credit to P&L 104,101 — — (5,712) 3,322 (1,473) (11,780) (3,724) 84,734
Sale of subsidiary — — — — — — — (83) (83)
At December 31, 2017 165,851 — — 2,530 32,189 19,945 15,338 9,357 245,210
(Charge) credit to P&L (74,679) 13,574 — 2,926 689 (4,229) (11,699) 7,828 (65,590)
Sale of subsidiaries (16,189) — — — — — (5,201) (3,377) (24,767)
At December 31, 2018 74,983 13,574 — 5,456 32,878 15,716 (1,562) 13,808 154,853
Deferred income tax assets Provisions
Accelerated
tax
depreciation
Tax
losses
Work in
process
Accrual for
unpaid
vacations
Investments in
subsidiaries Impairment
Tax
Goodwill Others Total
At January 1, 2016 20,949 14,892 91,313 24,103 14,977 1,476 — 17,522 16,543 201,775
Charge (credit) to P&L 84,571 1,489 51,163 (6,489) (2,005) (312) 172,052 3,003 3,322 306,794
Charge (credit) to equity 159 — — — — — — — — 159
Charge (credit) to ORI — — — — — — — — (343) (343)
Adquisition of subsidiary (Adexus) — — 10,607 — — — — — (3,313) 7,294
Others — — — — — (556) — — (725) (1,281)
At December 31, 2016 105,679 16,381 153,083 17,614 12,972 608 172,052 20,525 15,484 514,398
Charge (credit) to P&L (12,614) 79,637 (8,555) 21,873 2,166 118 28,593 (112) 18,358 129,464
Charge (credit) to equity (8,882) — — — — — (7,493) — (347) (16,722)
Reclassification (30,901) — — — — (726) 31,627 — — —
Sale of subsidiary (GMD S.A.) (683) (9,367) (438) — (1,697) — — — (236) (12,421)
Others (160) — (1) — (1) — 1 — (5,123) (5,284)
At December 31, 2017 52,439 86,651 144,089 39,487 13,440 — 224,780 20,413 28,136 609,435
Charge (credit) to P&L 702 (83,561) 25,733 (5,482) 1,784 — 35,289 (2,365) (14,096) (41,996)
Charge (credit) to equity — — — — — — — — (95) (95)
Sale of subsidiary (14,775) (2,169) (33,512) — (6,215) — (6,462) — (944) (64,077)
Others — — — — — — — — 1,675 1,675
At December 31, 2018 38,366 921 136,310 34,005 9,009 — 253,607 18,048 14,676 504,942
- 96 -

As of December 31, 2018, the total tax loss amounts to S/468.8 million and is composed as follows:
Company
Tax loss apli-
cation method
Application Statute of
Limitations2019 2020 Forward
GyM S.A. 277,541 B 8,801 19,417 249,323
Vial y Vives - DSD 76,474 N/A 11,022 13,226 52,226
Graña y Montero S.A.A. 56,906 A 46,278 10,628 — 2022
GMP S.A. 17,225 A — 5,786 11,438 2020 / 2021
TGNCA 15,989 B — — 15,989
Viva GyM S.A. 12,497 B — — 12,497
Consorcio Italo Peruano 3,870 A 3,870 — — 2020
Consorcio Peruano de Conservación 3,791 A — 3,243 549 2020 / 2021
Consorcio Huacho-Pativilca 1,457 A 1,457 — — 2022
Others 3,055 1,195 142 1,718
468,806 72,624 52,442 343,739
According to Peruvian legislation, there are two ways to compensate for tax losses:
1. System A, it is allowed to offset the tax loss in future years up to the following four (4) years from the date the loss is incurred.
2. System B. The tax loss may be offset in future years up to 50% of the net rent of each year. This option does not consider a statute of
limitations.
The taxable goodwill relates to the tax credit generated in the reorganization of the Chilean subsidiaries in 2014, in accordance with such
legislation. In 2016, the arbitration related to the Collahuasi project was closed, and an additional payment to the sellers of the Chilean subsidiary
was determined, which originated the increase of this temporary item.
Deferred income corresponds to income that, according to Colombian tax regulations, is not recognized as such for tax purposes until certain
requirements are met.
26 WORKERS’ PROFIT SHARING
The distribution of the workers’ profit sharing included in Note 27-i) for the years ended December 31 is shown below:
2016 2017 2018
Cost of sales of goods and services 8,547 2,215 5,274
Administrative expenses 1,297 7,562 2,588
9,844 9,777 7,862
- 97 -

27 EXPENSES BY NATURE
For the years ended December 31, the detail of this item is as follows:
Cost of
goods and
services
Administrative
expenses
2016
Services provided by third-parties 1,417,412 89,328
Salaries, wages and fringe benefits 875,470 153,927
Purchase of goods 629,765 —
Impairment of accounts receivable (ii) 419,584 —
Other management charges 256,541 21,361
Depreciation 111,404 7,428
Amortization 59,682 4,890
Impairment of inventories 37,454 —
Taxes 6,982 1,369
Impairment of property, plant and equipment 6,926 —
Total report reclassified 3,821,220 278,303
2017
Services provided by third-parties 1,268,665 104,950
Salaries, wages and fringe benefits 919,409 134,695
Purchase of goods 856,745 140
Other management charges 235,102 48,057
Depreciation 103,566 5,776
Amortization 67,381 3,002
Impairment of inventories 40,592 —
Impairment of property, plant and equipment 11,928 20
Taxes 7,470 7,408
Impairment of accounts receivable (ii) 703 18,406
Total report reclassified 3,511,561 322,454
2018
Services provided by third-parties 1,064,687 98,060
Salaries, wages and fringe benefits (i) 817,392 105,505
Purchase of goods 755,209 —
Other management charges 375,308 43,533
Amortization 98,318 4,856
Depreciation 81,199 5,135
Impairment of accounts receivable (ii) 45,658 19,418
Taxes 8,727 1,926
Impairment of property, plant and equipment 5,468 —
Inventory recovery (26,993) —
Total report reclassified 3,224,973 278,433
(i) For the years ended on December 31, salaries, wages and fringe benefits comprise the following:
2,016 2,017 2,018
Salaries 773,630 747,195 629,641
Social contributions 87,460 106,797 80,697
Statutory gratification 57,974 76,330 73,297
Employee’s severance indemnities 40,411 43,399 50,852
Others 23,436 37,003 41,327
Vacations 36,642 33,603 39,221
Worker’s profit sharing (Note 26) 9,844 9,777 7,862
1,029,397 1,054,104 922,897
- 98 -

(ii) Detail of impairment of accounts receivable:
Year
Trade
accounts
receivables
Other
accounts
receivable
Work in
progress,
net
Accounts
receivable
from related
parties Total
2016 3,052 6,333 410,199 — 419,584
2017 724 — — 18,385 19,109
2018 3,065 44,252 — 17,759 65,076
Total 6,841 50,585 410,199 36,144 503,769
- 99 -

28 FINANCIAL INCOME AND EXPENSES
For the years ended on December 31, these items include the following:
2016 2017 2018
Financial income:
Interest on loans to third parties 6,142 577 27,060
Fair value of accounts receivables — — 9,786
Interest on short-term bank deposits 7,277 5,123 3,811
Commissions and collaterals — 12 1,448
Exchange rate gain, net — 5,603 —
Others 4,806 2,427 8,820
18,225 13,742 50,925
Financial expenses:
Interest expense:
- Bank loans 88,828 93,238 114,376
- Loans from third parties 264 6,784 31,296
- Commissions and collaterals 9,156 15,537 31,668
- Financial lease 5,943 4,722 2,908
- Bonds 25,352 28,804 3,361
Exchange difference loss, net 12,750 — 23,276
Derivative financial instruments 1,248 739 268
Loss by measurement of financial asset fair value (Note 13) 76,864 8,059 25,796
Other financial expenses 14,481 24,802 23,200
Less; capitalized interest (36,831) (31,908) (8,167)
198,055 150,777 247,982
- 100 -
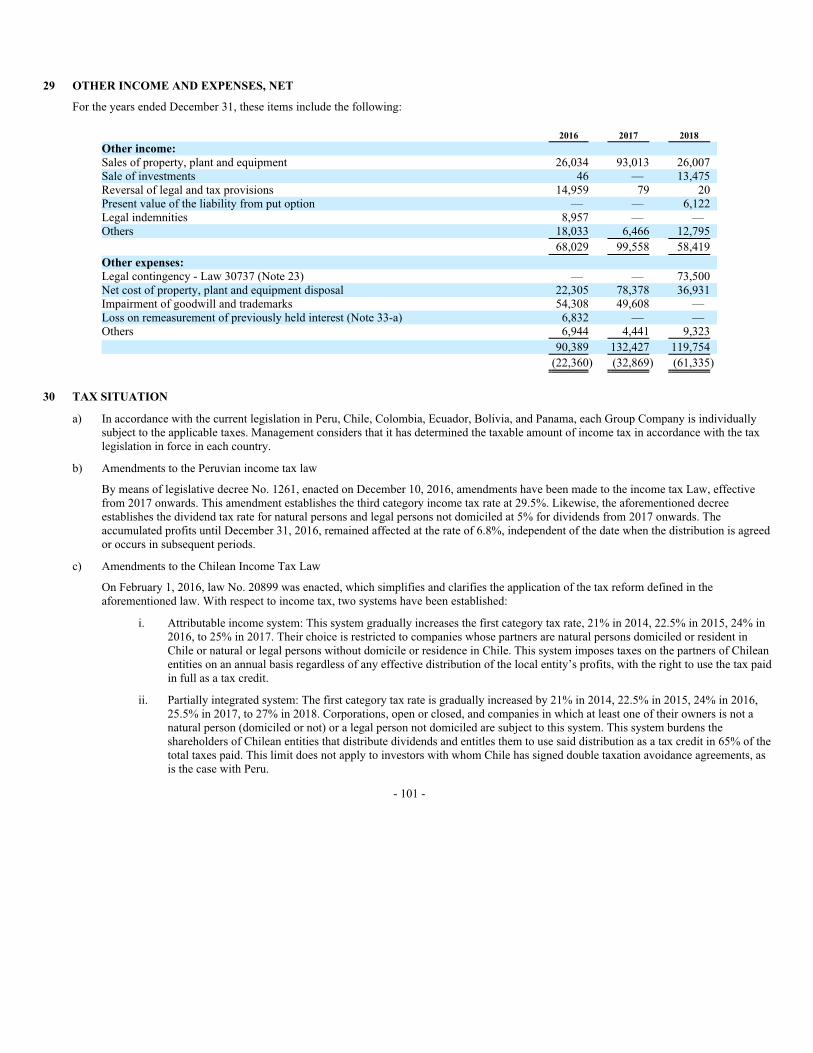
29 OTHER INCOME AND EXPENSES, NET
For the years ended December 31, these items include the following:
2016 2017 2018
Other income:
Sales of property, plant and equipment 26,034 93,013 26,007
Sale of investments 46 — 13,475
Reversal of legal and tax provisions 14,959 79 20
Present value of the liability from put option — — 6,122
Legal indemnities 8,957 — —
Others 18,033 6,466 12,795
68,029 99,558 58,419
Other expenses:
Legal contingency - Law 30737 (Note 23) — — 73,500
Net cost of property, plant and equipment disposal 22,305 78,378 36,931
Impairment of goodwill and trademarks 54,308 49,608 —
Loss on remeasurement of previously held interest (Note 33-a) 6,832 — —
Others 6,944 4,441 9,323
90,389 132,427 119,754
(22,360) (32,869) (61,335)
30 TAX SITUATION
a) In accordance with the current legislation in Peru, Chile, Colombia, Ecuador, Bolivia, and Panama, each Group Company is individually
subject to the applicable taxes. Management considers that it has determined the taxable amount of income tax in accordance with the tax
legislation in force in each country.
b) Amendments to the Peruvian income tax law
By means of legislative decree No. 1261, enacted on December 10, 2016, amendments have been made to the income tax Law, effective
from 2017 onwards. This amendment establishes the third category income tax rate at 29.5%. Likewise, the aforementioned decree
establishes the dividend tax rate for natural persons and legal persons not domiciled at 5% for dividends from 2017 onwards. The
accumulated profits until December 31, 2016, remained affected at the rate of 6.8%, independent of the date when the distribution is agreed
or occurs in subsequent periods.
c) Amendments to the Chilean Income Tax Law
On February 1, 2016, law No. 20899 was enacted, which simplifies and clarifies the application of the tax reform defined in the
aforementioned law. With respect to income tax, two systems have been established:
i. Attributable income system: This system gradually increases the first category tax rate, 21% in 2014, 22.5% in 2015, 24% in
2016, to 25% in 2017. Their choice is restricted to companies whose partners are natural persons domiciled or resident in
Chile or natural or legal persons without domicile or residence in Chile. This system imposes taxes on the partners of Chilean
entities on an annual basis regardless of any effective distribution of the local entity’s profits, with the right to use the tax paid
in full as a tax credit.
ii. Partially integrated system: The first category tax rate is gradually increased by 21% in 2014, 22.5% in 2015, 24% in 2016,
25.5% in 2017, to 27% in 2018. Corporations, open or closed, and companies in which at least one of their owners is not a
natural person (domiciled or not) or a legal person not domiciled are subject to this system. This system burdens the
shareholders of Chilean entities that distribute dividends and entitles them to use said distribution as a tax credit in 65% of the
total taxes paid. This limit does not apply to investors with whom Chile has signed double taxation avoidance agreements, as
is the case with Peru.
- 101 -

d) Amendments to the Colombian income tax legislation
In December 2016, law No. 1819 was published modifying the tax Code, effective from 2017. The main modifications are as follows:
• The income tax rates in force until 2016 (income tax + cree + surcharge) have been simplified to a single income tax rate of
34% and a temporary surcharge of 6% by 2017 and an income tax rate of 33% and a temporary surcharge of 4% by 2018 on a
taxable income greater than S/895 thousand (equivalent to COP800 million).
• The presumptive income, applicable when there are tax losses or when it is greater than ordinary income, will have as its
taxable base 3.5% of liquid equity (formerly 3%) and may be compensated with future taxable income.
• Tax losses may be offset in the following twelve (12) years from their generation.
• The special rate for dividends and participations received by foreign companies will be 5%.
• The VAT rate changes from 16% to 19%.
• As of tax year 2017, the term of the firmness of the declarations will be three (3) years. However, some terms may be longer,
as is the case of companies that are obliged to transfer prices whose firmness of the declarations will be six (6) years. For the
declarations that generate tax losses the term of firmness will be from twelve (12) to fifteen (15) years.
In December 2018, law No. 1943 was published modifying the tax statute, whose application or validity begins in 2019. The main
modifications are as follows:
• Presumptive rent rate reduced to 1.5% for taxable years 2019 and 2020, and to 0% beginning with the taxable year 2021
• The general income tax rate applicable to national companies shall be reduced as follows: 33% by 2019, 32% by 2020, 31%
by 2021 and 30% by 2022.
e) The income tax expense shown in the consolidated statement of income comprises
2016 2017 2018
(as restated)
Current income tax 169,428 168,143 150,020
Deferred income tax (Note 25) (280,911) (44,550) (23,594)
PPUA (7,789) 613 —
(119,272) 124,206 126,426
(-) Discontinued operations (32,910) (77,901) (13,108)
Income tax (152,182) 46,305 113,318
Under Chilean legislation, when a company has tax losses, it may request a refund of first category taxes paid in prior years, up to the
amount of tax calculable on the tax loss and provided that it has not distributed dividends on the income associated with the refund. The
amount returned by the Chilean tax administration in this respect is called the provisional payment on absorbed earnings (PPUA). The
company recognizes income tax income and an account receivable when requesting this refund.
- 102 -
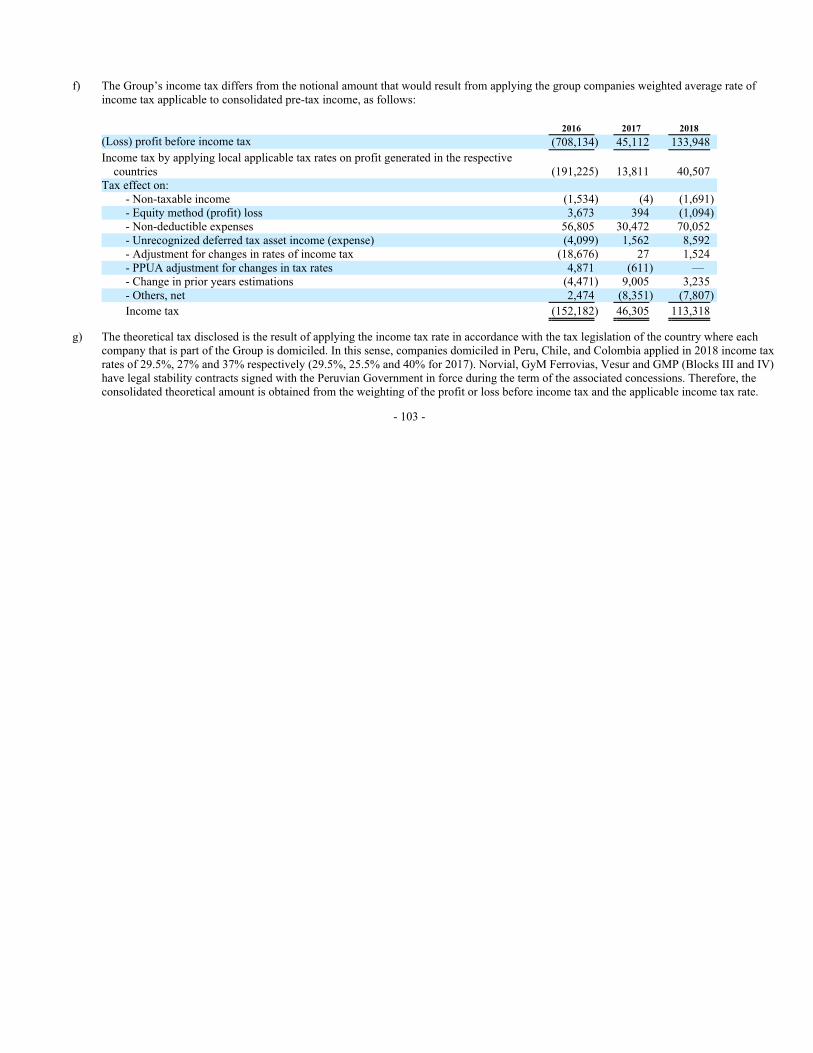
f) The Group’s income tax differs from the notional amount that would result from applying the group companies weighted average rate of
income tax applicable to consolidated pre-tax income, as follows:
2016 2017 2018
(Loss) profit before income tax (708,134) 45,112 133,948
Income tax by applying local applicable tax rates on profit generated in the respective
countries (191,225) 13,811 40,507
Tax effect on:
- Non-taxable income (1,534) (4) (1,691)
- Equity method (profit) loss 3,673 394 (1,094)
- Non-deductible expenses 56,805 30,472 70,052
- Unrecognized deferred tax asset income (expense) (4,099) 1,562 8,592
- Adjustment for changes in rates of income tax (18,676) 27 1,524
- PPUA adjustment for changes in tax rates 4,871 (611) —
- Change in prior years estimations (4,471) 9,005 3,235
- Others, net 2,474 (8,351) (7,807)
Income tax (152,182) 46,305 113,318
g) The theoretical tax disclosed is the result of applying the income tax rate in accordance with the tax legislation of the country where each
company that is part of the Group is domiciled. In this sense, companies domiciled in Peru, Chile, and Colombia applied in 2018 income tax
rates of 29.5%, 27% and 37% respectively (29.5%, 25.5% and 40% for 2017). Norvial, GyM Ferrovias, Vesur and GMP (Blocks III and IV)
have legal stability contracts signed with the Peruvian Government in force during the term of the associated concessions. Therefore, the
consolidated theoretical amount is obtained from the weighting of the profit or loss before income tax and the applicable income tax rate.
- 103 -
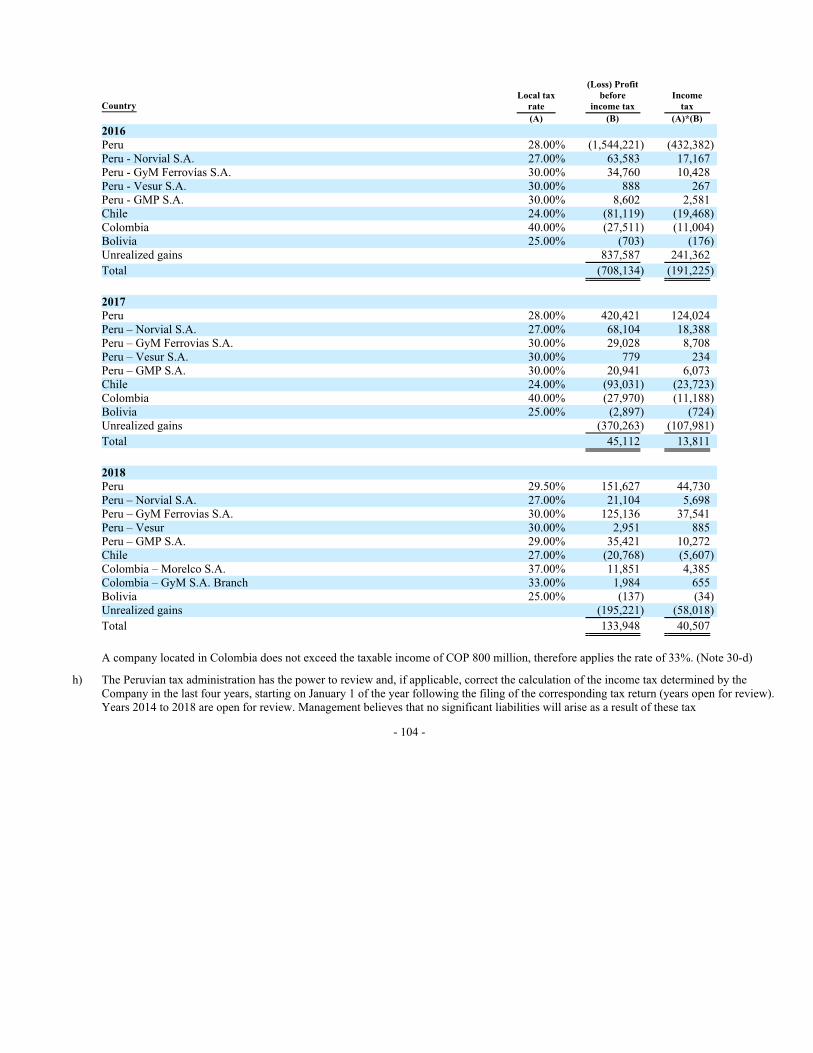
Country
Local tax
rate
(Loss) Profit
before
income tax
Income
tax
(A) (B) (A)*(B)
2016
Peru 28.00% (1,544,221) (432,382)
Peru - Norvial S.A. 27.00% 63,583 17,167
Peru - GyM Ferrovías S.A. 30.00% 34,760 10,428
Peru - Vesur S.A. 30.00% 888 267
Peru - GMP S.A. 30.00% 8,602 2,581
Chile 24.00% (81,119) (19,468)
Colombia 40.00% (27,511) (11,004)
Bolivia 25.00% (703) (176)
Unrealized gains 837,587 241,362
Total (708,134) (191,225)
2017
Peru 28.00% 420,421 124,024
Peru – Norvial S.A. 27.00% 68,104 18,388
Peru – GyM Ferrovias S.A. 30.00% 29,028 8,708
Peru – Vesur S.A. 30.00% 779 234
Peru – GMP S.A. 30.00% 20,941 6,073
Chile 24.00% (93,031) (23,723)
Colombia 40.00% (27,970) (11,188)
Bolivia 25.00% (2,897) (724)
Unrealized gains (370,263) (107,981)
Total 45,112 13,811
2018
Peru 29.50% 151,627 44,730
Peru – Norvial S.A. 27.00% 21,104 5,698
Peru – GyM Ferrovias S.A. 30.00% 125,136 37,541
Peru – Vesur 30.00% 2,951 885
Peru – GMP S.A. 29.00% 35,421 10,272
Chile 27.00% (20,768) (5,607)
Colombia – Morelco S.A. 37.00% 11,851 4,385
Colombia – GyM S.A. Branch 33.00% 1,984 655
Bolivia 25.00% (137) (34)
Unrealized gains (195,221) (58,018)
Total 133,948 40,507
A company located in Colombia does not exceed the taxable income of COP 800 million, therefore applies the rate of 33%. (Note 30-d)
h) The Peruvian tax administration has the power to review and, if applicable, correct the calculation of the income tax determined by the
Company in the last four years, starting on January 1 of the year following the filing of the corresponding tax return (years open for review).
Years 2014 to 2018 are open for review. Management believes that no significant liabilities will arise as a result of these tax
- 104 -

audits. In addition, the Chilean tax administration has not yet audited the income tax returns for 2016, 2017 and 2018, and the Chilean tax
administration has the authority to carry out such audits within three years from the filing date of the respective tax returns. Also, in
Colombia, years 2016, 2017 and 2018 are pending audit by the Colombian tax administration, which has the power to perform audits in the
two years following the filing of the tax return.
i) In accordance with current legislation, for the purposes of determining income tax and general sales tax, the transfer prices of transactions
with related companies and with companies’ resident in low or nil tax territories must be considered. For this purpose, documentation and
information must be available to support the valuation methods used and the criteria considered for their determination (transfer pricing
rules). The Tax Administration is empowered to request this information from the taxpayer. Based on the analysis of the Company’s
operations, management and its legal advisors estimate that transfer prices of transactions with related companies are based on market
conditions, similar to those agreed with third parties, as of December 31, 2018.
j) Temporary tax on net assets (ITAN)
Taxes third category income generators in Peru subject to the general Income Tax regime. Beginning in 2012, the tax rate is 0.4%
applicable to the amount of net assets exceeding S/1 million.
The amount effectively paid may be used as a tax credit against payments on account of income tax under the general regime, or against
payment of the provisional income tax for the corresponding year.
k) The unrecognized deferred income tax asset amounts to S/10.8 million for 2018 and is mainly related to the tax loss carryforwards
generated in Consorcio Ermitaño, Consorcio Conciviles and Consorcio Mantaro for which there is no expectation of recovery in the future.
l) The current income tax payable, after applying the corresponding tax credits and whose due date is up to the first week of April of the
following year, includes mainly:
– Proyectos Inmobiliarios Consultores S.A. S/22 million in 2017
– Viva GyM S.A. S/22 million in 2017
– Graña y Montero S.A.A. S/7 million in 2017
– GyM Ferrovias S.A. S/20 million in 2018
– Inversiones Almonte S.A. S/10 million in 2018
- 105 -

31 OTHER COMPREHENSIVE INCOME
The analysis of this account is reflected below:
Cash flow
hedge
Foreign
currency
translations
adjustment
Increase in
fair value of
available-for
sale assets
Exchange
difference
from net
investment
in a foreign
operation Total
At January 31, 2016 (926) (64,441) 51,142 (17,740) (31,965)
Credit (charge) for the year 1,190 9,885 (3,149) 10,965 18,891
Tax effects (351) — 929 (3,243) (2,665)
Transfer to profit or loss (Note 10) — — (41,461) 1,563 (39,898)
Other comprehensive income of the year 839 9,885 (43,681) 9,285 (23,672)
At December 31, 2016 (87) (54,556) 7,461 (8,455) (55,637)
Credit (charge) for the year 650 (9,166) — 9,222 706
Tax effects (192) — — (2,729) (2,921)
Other comprehensive income of the year 458 (9,166) — 6,493 (2,215)
At December 31, 2017 371 (63,722) 7,461 (1,962) (57,852)
Credit (charge) for the year 160 (7,875) — (10,800) (18,515)
Tax effects (47) — — 2,808 2,761
Transfer to profit or loss (*) — 14,805 — — 14,805
Other comprehensive income of the year 113 6,930 — (7,992) (949)
At December 31, 2018 484 (56,792) 7,461 (9,954) (58,801)
(*) The amount of S/14.8 million corresponds to the recognition of the translation adjustment from CAM Chile S.A., an indirect subsidiary sold in
December 2018.
The amounts in the above table only represent amounts attributable to the Company’s controlling interest, net of tax. The table below shows the
movement in other comprehensive income per year:
2016 2017 2018
Controlling interest (23,672) (2,215) (949)
Non-controlling interest 4,194 (3,117) (1,346)
Adjustment for actuarial gains and losses, net of tax (1,121) (2,948) 16,589
Total value in OCI (20,599) (8,280) 14,294
32 CONTINGENCIES, COMMITMENTS, AND WARRANTIES
In the opinion of management and its legal advisors, the provisions recorded primarily for labor and tax claims are sufficient to cover the results of
these probable contingencies. (Note 23)
a) Tax contingencies
• Since the fiscal year 2016, there has been an appeal process before the Tax Court and another contentious-administrative process
before the Judicial Branch regarding the results of VAT and Income Tax audits from 1999 to 2002. The maximum exposure amount
is S/6.9 million.
- 106 -

• In our subsidiary GyM S.A., as a result of the audit processes corresponding to 1999, 2001 and 2010, SUNAT has issued
determination and fine resolutions that together amount to approximately S/19.1 million.
• In the fiscal year 2017, the tax litigation related to the fiscal year 2001 was resolved, in which the Tax Court ordered SUNAT to
recalculate its observations, determining an amount lower than that initially claimed. Our subsidiary has decided to accept the
conclusions of this resolution and submitted requests for installment payment of the debt amounting S/14.1 million.
• Also, at the end of the fiscal year 2017, the contentious-administrative process related to the fiscal year 1999 was resolved through
which the Judicial Branch rejected our arguments and confirmed what SUNAT had stated. With respect to this process, there is
already a contingency provision of S/5 million accounted for.
• The administrative tax process related to the fiscal year 2010 is still ongoing; however, its resolution will not imply an economic
loss since it corresponds to a greater return of the balance in favor in 2011 already audited by the Tax Administration.
• On the other hand, the Consortiums in which the subsidiary GyM S.A. participates initiated claims before SUNAT for the results of
audits with a maximum exposure amount as of December 31, 2018, of S/2.6 million (as of December 31, 2017, S/3 million).
• In the fiscal year 2017, Viva GyM challenged the results of the audit process corresponding to the fiscal year 2009, whose
determination and fine resolutions as a whole generate a maximum exposure amount as of December 31, 2017, of S/1.5 million. In
April 2018, the tax administration declared unfounded the claim for which an appeal has been filed before the Tax Court.
Management estimates that all of the above processes will be favorable considering their characteristics and the evaluation of their legal advisors.
b) Other contingencies
i) Civil lawsuits, mainly related to damages, termination of contracts and claims for work accidents amounting to S/. 0.92
million (S/0.86 million correspond to GyM, and S/0.06 million correspond to Morelco).
ii) Contentious-administrative proceedings amounting to S/13.59 million (S/9.64 million correspond to Consorcio Terminales
and GMP; S/2.85 million correspond to GyM; S/1.08 million correspond to GyM Ferrovias, and the remaining S/0.02 million
correspond to Las Lomas - Inmobiliaria).
iii) Administrative processes amounting to S/14.96 million (S/9.88 million correspond to GyM S.A. mainly due to Consorcio
Constructor Ductos del Sur; S/1.25 million correspond to Graña y Montero S.A.A.; S/2.13 million correspond to GyM
Ferrovias; S/0.85 million correspond to Viva GyM; and, the remaining S/0.85 million correspond to GMP, Terminales del
Peru, Consorcio Toromocho, and Concesion Canchaque).
iv) Labor processes amounting to S/17.25 million (S/14.93 million correspond to GyM, its subsidiaries, and consortia; S/0.69
million correspond to GMP; S/0.33 million correspond to Vial and Vives - DSD; S/0.22 million correspond to Morelco;
S/0.50 million correspond to Consorcio Huacho-Pativilca); and, S/0.58 million correspond to Servisel.
v) Two securities class action lawsuits have been filed against the company and certain current and former officers in New York
(“Eastern District of New York”) during the first quarter of 2017. Both actions allege that false and misleading statements
were filed during the period. In particular, it is alleged that the defendant failed to disclose, among other things, that: a) the
Company knew that its partner Odebrecht was involved in illegal activities; and that, b) the Company profited from such
activities in violation of its own corporate governance rules. On March 6, 2018, the Court appointed Treasure Finance Holding
Corp. to represent the plaintiffs. The company filed an exception requesting that the Court dismiss the lawsuit because even
assuming that the facts alleged in the lawsuit were true, the plaintiffs would not be entitled to sue on the basis that: (a) the
failure by the plaintiffs to register alleged unlawful payments would not have a material impact on the company’s financial
statements even if they existed; (b) the evidence provided by the plaintiffs should be dismissed by the Court; and (c) the
plaintiffs have not alleged that the defendants acted with intent to deceive and to benefit. The court has not yet ruled on that
motion, but has granted plaintiffs leave to file a further amended complaint. The procedural issue is expected to be resolved
during 2019. After that, the Court may dismiss the lawsuit or admit it. Legal counsel cannot predict the outcome of this class
action or how it may impact the Company.
- 107 -

c) Letters of Credit and Guarantees
As of December 31, 2018, the Group has letters of credit and guarantees in force in various financial entities guaranteeing operations for
US$471.6 and US$13.9 million, respectively (US$959.7 and US$202.2 million, respectively, as of December 31, 2017), equivalent to S/1,593.5
million and S/46.9 million (S/3,114.2 million and S/656.1 million, respectively, as of December 31, 2017).
33 BUSINESS COMBINATIONS
a) Adexus S.A. acquisition
In June 2015, the Company acquired 44% of the shares of the Chilean entity Adexus S.A., whose principal economic activity is the provision of
information technology solutions. At December 31, 2015, the Company concluded that joint control existed and that the type of joint agreement
qualified as a joint venture; therefore, the investment was accounted for using the equity method in the Group’s consolidated financial statements
(Note 16-b).
In January 2016, the Group acquired an additional shareholding of 8%, reaching a 52% shareholding; the agreed consideration of S/8.3 million
was contributed through debt capitalization. The increase in participation did not change the classification of the investment as a joint venture.
Subsequently, in August 2016, the Group obtained an additional stake of 39.03%, reaching 91.03% of its capital and obtaining control. The agreed
consideration of S/14 million was initially disbursed as debt and then capitalized in the same period.
Losses arising from the re-measurement at fair value of the previously held interest amounted to S/6.8 million, which was recognized in the
statement of income within “Other income and expenses, net”, at the date of acquisition of that additional interest in 2016 (Note 29).
Upon obtaining control, the Company has applied the acquisition method set forth in IFRS 3 “Business Combinations” to determine the goodwill
acquired. In June 2018, the company acquired an additional 8.96% interest and obtained 99.99%. The consideration was S/14 million, which
arises from a debt capitalization.
b) Morelco S.A.S. acquisition
On December 23, 2014, the Company acquired control of Morelco S.A.S. (Morelco) through it’s subsidiary GyM S.A., with the purchase of 70%
of its shares representing the capital stock. Morelco is an entity domiciled in Colombia, whose principal economic activity is the provision of
construction and assembly services. This acquisition forms part of the Group’s expansion plans in markets with high growth potential such as
Colombia and in attractive industries such as mining and energy.
At December 31, 2014, the Company determined goodwill on this acquisition based on an estimated purchase price of US$93.7 million
(equivalent to S/277.1 million) which included cash payments made of US$78.5 million (S/237.5 million, approximately) and estimated payables
of US$15.1 million (equivalent to S/45.7 million), which according to what was agreed between the parties, would be defined after the review of
the balance sheet of the acquired entity mainly referring to working capital, cash and financial debt and the determination of the definitive value of
the contracted works pending to execute (backlog) of the acquired business. The estimated purchase price was distributed among the provisional
fair values of the assets acquired, and liabilities assumed.
- 108 -

As a result of this distribution, a goodwill of US$36.1 million (equivalent to S/105.8 million) was determined.
Non-controlling interest put and call options
In accordance with the shareholders’ agreement entered into for the purchase of Morelco, the subsidiary GyM entered into a put and call option
contract on 30% of the shares of Morelco held by the non-controlling shareholders. Through this contract, the non-controlling shareholders obtain
a right to sell their shares within the term and amount established in the contract (put options). The period for exercising the option begins on
completion of the second year of the purchase and expires in the tenth year. The exercise price is based on a multiple of EBITDA less net financial
debt and until the months 51 and 63 from the date of the agreement, a minimum value is set based on the price per share that GyM paid to acquire
70% of Morelco shares.
The subsidiary GyM obtains the right to purchase the same shares for a period of 10 years and at a determined price similar to that of the
aforementioned put options, except that the minimum value applies to the entire term of the option (call options).
Under IFRS, the put option represents an obligation for the Company to purchase shares of the non-controlling interest and, consequently, the
Group recognizes a liability measured by the fair value of that option. Because the Group concluded that as a result of this contract, did not
acquire the significant risks and rewards inherent to the stock option package, the initial recognition of this liability was charged to an equity
account of the controlling stockholders, under the heading of other reserves.
The value of the liability for the put option was estimated by the present value of the expected redemption amounts based on the weighted
estimates of Morelco’s financial results and the exercise dates of the option. The Company expects the put options to be exercised on the day
following the transfer date of the option. The expected redemption of the non-controlling interest is as follows: 66.67% in the second year,
33.33% in the fourth year and the remaining shares will be sold in the fifth year from the date of grant of the option. The discount rate used to
calculate the present value of the expected redemption amounts reflects the risk-free rate of market participants comparable to the Company and
reflects the fact that the Group expects to pay the minimum price of the agreement. As of December 31, 2018, the value of the liability amounts to
S/103.7 million applying a discount rate of 2.57% for the first year, 2.55% for the second year and 2.53% for the third year (as of December 31,
2017, the value was S/105.4 million applying a discount rate of 1.79% for the first year, 2.03% for the second year and 2.12% for the third year).
In 2018, changes in the fair value of the put option for S/1.77 million had been recognized in the income statement, included in “Other income and
expenses, net” and in “financial income and expenses”.
34 DIVIDENDS
In compliance with certain covenants, the company will not pay dividends for the years 2017 and 2018, except for transactions with
non-controlling interests described in Note 36-d).
- 109 -

35 EARNINGS (LOSS) PER SHARE
Basic earnings per common share have been calculated by dividing the profit for the year attributable to the Group’s common shareholders by the
weighted average number of common shares outstanding during the year. Diluted earnings per common share have not been calculated because
there are no common shares or potential dilutive investment shares (i.e., financial instruments or agreements giving the right to obtain common or
investment shares); therefore, it is the same as basic earnings per share. The basic gain (loss) per common share results as follows:
2016
2017
(as Restated) 2018
(Loss) earnings per share attributable to owners of the Company during the
year (509,699) 148,738 (83,188)
Weighted average number of shares in issue at S/1.00 each, at December 31, 660,053,790 660,053,790 729,434,192
Basic (loss) earnings per share (in S/) (*) (0.772) 0.225 (0.125)
2016
2017
(as Restated) 2018
(Loss) earnings per share from continuing operations attributable to owners
of the Company during the year (604,361) (66,577) (102,486)
Weighted average number of shares in issue at S/1.00 each, at December 31, 660,053,790 660,053,790 729,434,192
Basic (loss) earnings per share (in S/) (*) (0.916) (0.101) (0.154)
(*) The group does not have common shares with dilutive effects at December 31, 2016, 2017 and 2018.
36 TRANSACTIONS WITH NON-CONTROLLING INTERESTS
a) Acquisition of additional non-controlling interest
In May, November and December 2016, GyM Chile SPA acquired 5.43%, 6.77%, and 1.49%, respectively of additional shares in Vial y Vives -
DSD S.A. at a total purchase price of S/21.6 million, S/25.7 million and S/3.8 million, respectively. The carrying values of the non-controlling
interest at the acquisition dates were S/13.9 million, S/17.9 million and S/3.9 million. The Group ceased to recognize the corresponding
non-controlling interest, recording a decrease in equity attributable to the owners of the Company of S/15.4 million. At December 31, 2018, the
outstanding balance was S/23 million (S/22 million in 2017) (Note 22).
b) Contributions (returns) from non-controlling shareholders
Corresponds to the contributions and returns made by the partners of the subsidiary Viva GyM S.A. for the realization of real estate projects. As of
December 31, balances comprise:
2017 2018
Viva GyM S.A.
Contributions received 8,654 3,399
Returns of contributions (45,053) (87,856)
(36,399) (84,457)
Plus (less):
Contributions from other subsidiaries 3,202 15,120
Decrease in equity of non controlling parties (33,197) (69,337)
In 2018, the contributions correspond mainly to the project Los Parques de Callao for S/3.3 million. Returns correspond mainly to the Klimt
projects for S/25.3 million, Los parques de Comas for S/13.4 million, Los parques de San Martin for S/7.5 million, Los Parques de Villa El
Salvador for S/4.3 million, liquidation of Los Parques de Piura project for S/8.6 million, Los Parques del Mar for S/11 million, Los Parques de
Chiclayo for S/6.2 million and Los Parques de Carabayllo 3 for S/8.2 million (returns in 2017 mainly include “Los Parques de Comas” for
S/6.8 million, “Asociacion Parques de Mar” for S/27.8 million and “Klimt” for S/8 million).
c) Deconsolidation of non-controlling interest
Correspond to the deconsolidation of the non-controlling interest due to the sale of subsidiaries Stracon GyM S/29.4 million and Grupo Cam
S/18.2 million.
- 110 -

d) Dividends
As of December 31, 2016, 2017 and 2018, dividends of S/25.5 million, S/59.7 million and S/102.8 million, respectively, were distributed to the
non-controlling interest.
37 DISCONTINUED OPERATIONS AND NON-CURRENT ASSET CLASSIFIED AS HELD FOR SALE
As part of the non-strategic asset divestment process initiated by the Company in 2017 with the sale of GMD S.A., in 2018, CAM Servicios del
Peru S.A. and CAM Chile S.A., and Stracon GyM S.A. were sold (“completed”).
Additionally, information is presented on Adexus S.A., a subsidiary that has been reclassified as a non-current asset available for sale (“planned”)
as of December 31, 2018 (Note 38-b).
A. Discontinued operations
i) CAM Servicios del Peru S.A. and CAM Chile S.A.
On December 4, 2018, the Company entered into a purchase and sale agreement for all of its shares (representing 73.16%) of CAM Servicios del
Peru S.A. and CAM Chile S.A. The Group received for its participation in CAM Chile S.A. and CAM Servicios del Peru S.A. the sum of (i)
US$15.78 million (equivalent to S/51.7 million) for the shares of CAM Chile S.A. and (ii) US$3.0 million (equivalent to S/10.4 million) for the
shares of CAM Servicios del Peru S.A., respectively. The net gain on the sale of both subsidiaries amounted to S/31.7 million.
ii) STRACON GyM S.A.
On March 28, 2018, the Company entered into a purchase and sale agreement for all of its shares (representing 87.59%) in STRACON GyM S.A.
The sale price was agreed in US$76.8 million (equivalent to S/248.8 million), which is fully paid. The net gain on the sale amounted to S/41.9
million.
iii) GMD S.A.
On June 6, 2017, the Company entered into a sales contract for all of its shares (representing 89.19%) in GMD S.A. The sales price was agreed at
US$84.7 million (equivalent to S/269.9 million), which is fully paid. The net gain on the sale amounted to S/218.3 million (US$64.6 million
approximately).
B. Non-current asset classified as held for sale
At December 31, 2018, non-current assets and liabilities held for sale correspond to investments in the company Adexus S.A., whose main
activity is to provide information technology solutions mainly in Chile and Peru. Account balances are classified as assets held for sale taking into
account that the Group has a sales plan defined within the next 12 months.
At December 31, 2018
Adexus S.A.
(planned)
Assets
Cash and cash equivalents 6,074
Trade accounts receivables, net 157,351
Inventories, net 3,999
Other accounts receivable 80,374
Total assets 247,798
Liabilities
Other accounts payable 71,810
Accounts payable 148,817
Deferred income tax liabilities 5,201
Total liabilities 225,828
Total net assets 21,970
As of December 31, 2017, this item includes Red Eagle Mining Corporation investment representing 6.18% of shares. In January and March
2018, the Company sold the total of its shares. The sale price was agreed at US$3.99 million (equivalent to S/16.24 million), which were paid in
full.
- 111 -

C. Consolidated statement of income and consolidated cash flow
The Company reclassified financial results and present cash flow of discontinued operations, GMD S.A., Stracon GyM S.A., CAM Servicios del
Peru S.A., CAM Chile S.A. (completed) and Adexus S.A. (planned) for 2016 and 2017 as follows:
Reclassification
2016 discontinued operations 2016
Audited Completed Planned Reclassified
Revenues 6,190,317 (1,939,983) (113,025) 4,137,309
Operating costs (5,633,022) 1,714,498 97,304 (3,821,220)
Gross profit (loss) 557,295 (225,485) (15,721) 316,089
Administrative expenses (382,393) 87,855 16,235 (278,303)
Other (expenses) income, net (13,374) (9,162) 176 (22,360)
Gain from the sale of investments 46,336 — — 46,336
Operating profit (loss) 207,864 (146,792) 690 61,762
Financial expenses (221,664) 18,384 5,225 (198,055)
Financial income 20,645 (2,420) — 18,225
Share of the profit or loss in associates and joint ventures (589,710) (356) — (590,066)
(Loss) profit before income tax (582,865) (131,184) 5,915 (708,134)
Income tax 119,272 34,772 (1,862) 152,182
(Loss) profit from continuing operations (463,593) (96,412) 4,053 (555,952)
Profit (loss) from discontinued operations 11,995 96,412 (4,053) 104,354
Loss of the year (451,598) (451,598)
(Loss) earnings per share from continuing operations attributable to owners of
the company during the year (0.790) (0.916)
Discontinued operations
Completed Planned
Cash flows relating to the discontinued operations are as follows:
Operating cash flows 125,048 39,318
Investing cash flows (73,127) 17,639
Financing cash flows (111,303) 66,886
Net increase generated in subsidiary (59,382) 123,843
Reclassification
2017 discontinued operations 2017
Restated (i) Completed Planned Reclassified
Revenues 6,080,142 (1,782,105) (284,024) 4,014,013
Operating costs (5,407,355) 1,656,114 239,680 (3,511,561)
Gross profit (loss) 672,787 (125,991) (44,344) 502,452
Administrative expenses (429,181) 73,966 32,761 (322,454)
Other (expenses) income, net (20,545) (13,159) 835 (32,869)
Gain (loss) from the sale of investments 56,099 (21,554) — 34,545
Operating profit (loss) 279,160 (86,738) (10,748) 181,674
Financial expenses (185,445) 23,913 10,755 (150,777)
Financial income 15,407 (1,401) (264) 13,742
Share of the profit or loss in associates and joint ventures 1,327 (854) — 473
Profit (loss) before income tax 110,449 (65,080) (257) 45,112
Income tax (59,097) 12,939 (147) (46,305)
Profit (loss) from continuing operations 51,352 (52,141) (404) (1,193)
Profit from discontinued operations 157,886 52,141 404 210,431
Profit of the year 209,238 209,238
(Loss) earnings per share from continuing operations attributable to owners of
the company during the year (0.014) (0.101)
(i) See Nota 2.31
Discontinued operations
Completed Planned
Cash flows relating to the discontinued operations are as follows:
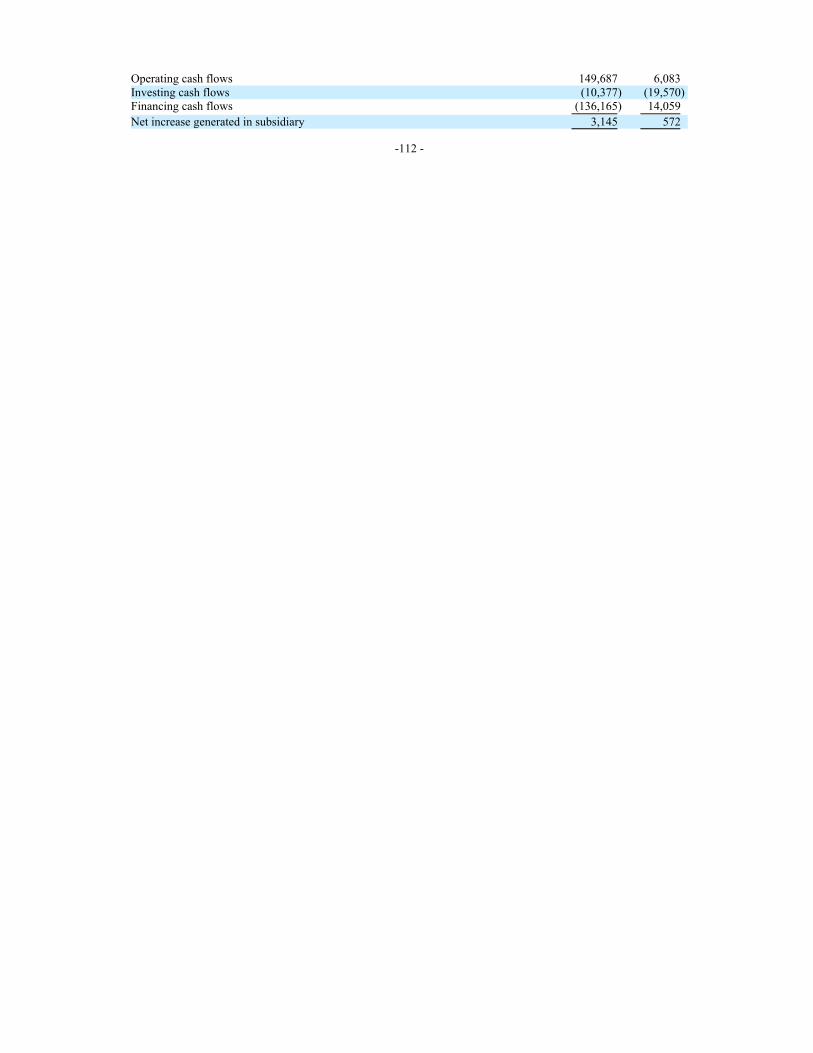
Operating cash flows 149,687 6,083
Investing cash flows (10,377) (19,570)
Financing cash flows (136,165) 14,059
Net increase generated in subsidiary 3,145 572
-112 -

Discontinued operations as at December 31, 2018 are as follows:
Discontinued operations
Grupo CAM and
Stracon GyM Adexus S.A.
(Completed) (Planned)
Revenues 1,010,739 302,936
Operating costs (968,375) (263,455)
Gross profit 42,364 39,481
Administrative expenses (56,950) (32,730)
Other (expenses) income, net 860 (4,519)
Operating (loss) profit (13,726) 2,232
Financial expenses (19,971) (12,786)
Financial income 6,253 611
Loss before income tax (27,444) (9,943)
Income tax 7,112 2,325
Loss from discontinued operations (20,332) (7,618)
Cash flows relating to the discontinued operations are as follows:
Operating cash flows 6,967 36,450
Investing cash flows (11,474) (18,141)
Financing cash flows 526 (21,422)
Net increase generated in subsidiary (3,981) (3,113)
38 EVENTS AFTER THE DATE OF THE STATEMENT OF FINANCIAL POSITION
a) On April 2, 2019, the Company concluded the capital increase process by completing the subscription of 142,483,663 new common shares.
In the private offer completed, 55,291,877 shares were paid in full, and 87,191,786 shares were paid by 50%, both at a price per share of
US$0.6136.
b) On March 15, 2019, the Company communicated that Adexus S.A., subsidiary of Graña y Montero S.A.A., is again available for sale to
potential parties interested in its acquisition. Negotiations with Advent International S.A.C., and the obligations assumed within the
framework of the potential transaction have been terminated by mutual agreement, without responsibility for the parties. The Company
ratifies its intention to continue with the sale plan of Adexus S.A., in order to find the best possible offer for the interests of the Company
and its investors.
c) On March 13, 2019, the Peruvian Tax Court delivered its decision to confirm SUNAT’s rejection to our appeal to SUNAT’s payment orders
regarding 2007 and 2008. SUNAT and the Peruvian Tax Court objected to the deduction of the loss of the investment because both consider
there is not enough evidence that OPQ S.A. is not an “on-going business”. The Company is currently working on the preparation of a
contentious administrative claim. However, according to Peruvian legal framework, SUNAT is entitle to start a coercive collection
processes. The Company and its legal counsel believe there are solid legal grounds to consider the contingency remote and obtain a
favorable ruling.
-113 -

Supplementary Data (Unaudited)
Oil and Gas Producing Activities
In accordance with Financial Accounting Standards Board (FASB) Accounting Standards Codification Topic 932, “Extractive Activities-Oil
and Gas,” and regulations of the U.S. Securities and Exchange Commission (SEC), our company has included certain supplemental disclosures about its
oil and gas exploration and production operations.
All information in the following supplemental disclosures related to Blocks I, III, IV and V. Information with respect to Blocks III and IV
has been included from April 5, 2015, when our company began operating these blocks.
A. Reserve Quantity Information
Graña y Montero Petrolera S.A. net proved reserves in the fields in which they operate and changes in those reserves for operations are
disclosed below. The net proved reserves represent our company’s best estimate of proved oil and natural gas reserves. For 2017 and 2018 reserve
estimates have been evaluated by its technical staff (reservoir engineers and geoscience professionals) and submitted to its Reserve Development
Committee. The estimates for all years presented conform to the definitions found in FASB ASC paragraph 932-10-65-1 and Rule 4-10(a) of Regulation
S-X.
Proved oil reserves are those quantities of oil, which, by analysis of geosciences and engineering data, can be estimated with reasonable
certainty to be economically producible, based on prices used to estimate reserves, from a given date forward from known reservoirs, and under existing
economic conditions, operating methods, and government regulation prior to the time at which contracts providing the right to operate expire, unless
evidence indicates that renewal is reasonably certain.
The term “reasonable certainty” implies a high degree of confidence that the quantities of oil actually recovered will equal or exceed the
estimate. To achieve reasonable certainty, our company’s engineers and independent petroleum consultants relied on technologies that have been
demonstrated to yield results with consistency and repeatability. The technologies and economic data used to estimate our company’s proved reserves
include, but are not limited to, well logs, geologic maps, seismic data, well test data, production data, historical price and cost information and property
ownership interests.
PROVED RESERVES (1)
Total Peru
Oil (MBBL) Gas (MMcf) Oil (MBBL) Gas (MMcf)
Proved developed and undeveloped reserves, December 31, 2016 25,191 10,521 25,191 10,521
Revisions of previous estimates 2,451 1,494 2,451 1,494
Enhanced oil recovery — — — —
Purchases — — — —
Production (a) (1,146) (2,661) (1,146) (2,661)
Sales in place — — — —
Proved developed and undeveloped reserves, December 31, 2017 26,496 9,354 26,496 9,354
Revisions of previous estimates(2) 2,332 26,481 2,332 26,481
Enhanced oil recovery 0 0 0 0
Purchases 0 0 0 0
Production (1,334) (2,229) (1,334) (2,229)
Sales in place 0 0 0 0
Proved developed and undeveloped reserves, December 31, 2018
(3)(4) 27,494 33,606 27,494 33,606
(1) Proved reserves estimated in oil and gas properties located in Blocks I, III, IV and V (Talara and Paita) under two service contracts and two
license contracts with Perupetro. The rights to produce hydrocarbons expire in December 2021 for Block I, April 2045 for Blocks III and IV, and
October 2023 for Block V. The proved reserves estimated in this report constitute all of the proved reserves under contracts by Graña y Montero
Petrolera S.A.
(2) Recategorized from resources to reserves due to the development of a project to transport gas from Block IV to our gas processing plant, which
remains ongoing. This includes 12,078 MMcf as proved developed and 13,767 MMcf as proved undeveloped reserves.
(3) The revisions in reserve estimates are based on new information obtained as a result of drilling activities and workovers. During 2017 and 2018,
proved developed reserves of crude oil increased due to drilling activities in Block IV and the impact of the higher price in reserve estimations.
(4) As of December 31, 2017, the associated gas reserves were 9,354 MMCF. As of December 31, 2018, the associated gas reserves were 33,606
MMCF.
S-1

RESERVE QUANTITY INFORMATION
FOR THE YEAR ENDED DECEMBER 31, 2016
Total Peru
Oil (MBBL) Gas (MMCF) Oil (MBBL) Gas (MMCF)
Proved developed reserves
Beginning of year 9,168 23,384 9,168 23,384
End of year 8,521 10,521 8,521 10,521
Proved undeveloped reserves
Beginning of year 14,562 26,719 14,562 26,719
End of year 16,670 — 16,670 —
RESERVE QUANTITY INFORMATION
FOR THE YEAR ENDED DECEMBER 31, 2017
Total Peru
Oil (MBBL) Gas (MMCF) Oil (MBBL) Gas (MMCF)
Proved developed reserves
Beginning of year 8,521 10,521 8,521 10,521
End of year 8,664 9,354 8,663 9,354
Proved undeveloped reserves
Beginning of year 16,670 — 16,670 —
End of year 17,833 — 17,833 —
RESERVE QUANTITY INFORMATION
FOR THE YEAR ENDED DECEMBER 31, 2018
Total Peru
Oil (MBBL) Gas (MMCF) Oil (MBBL) Gas (MMCF)
Proved developed reserves
Beginning of year 8,664 9,354 8,664 9,354
End of year 9,912 19,839 9,912 19,839
Proved undeveloped reserves
Beginning of year 17,833 — 17,833 —
End of year 17,582 13,767 17,582 13,767
B. Capitalized Costs Relating to Oil and Gas Producing Activities
The following table sets forth the capitalized costs relating to our company’s crude oil and natural gas producing activities for the years
indicated:
2014 2015 2016 2017 2018
(in US$ thousands)
Proved properties
Concessions
Mineral property, wells and related equipment 47,267 54,582 39,069 84,960 99,129
Drilling and Works in progress and Replacement Units 11,290 5,682 6,188 10,767 11,920
Total Proved Properties 58,557 60,264 45,257 95,727 111,049
Unproved properties 0 0 0 0
Total Property, Plant and Equipment 58,557 60,264 45,257 95,727 111,049
Accumulated depreciation, depletion, and amortization, and valuation allowances (13,735) (17,875) (17,774) (36,672) (45,426)
Net capitalized costs 44,822 42,389 27,482 59,054 65,624
S-2

C. Costs Incurred in Oil and Natural Gas Property Acquisition, Exploration and Development Activities
The following table sets forth costs incurred related to our company’s oil and natural gas activities for the years indicated:
2014 2015 2016 2017 2018
(in US$ thousands)
Acquisition costs of properties(1)
Proved — — — — —
Unproved — — — — —
Total acquisition costs
Exploration costs — — — — (1,121)
Development costs (13,126) (17,179) (19,161) (22,905) (25,192)
Total (13,126) (17,179) (19,161) (22,905) (26,313)
(1) Our company has not incurred in any cost related to Oil and Gas property acquisition for all years presented.
D. Results of Operations for Oil and Natural Gas Producing Activities
The results of operations for oil and natural gas producing activities, excluding overhead costs and interest expenses, are as follows for the
years indicated:
Total Peru
2014 2015 2016 2017 2018
(in US$ thousands)
Revenues
Additional Revenues of Gas Extraction Services 59,233 57,938 50,556 67,049 96,543
Total Revenues(1) 59,233 57,938 50,556 67,949 96,543
Production Costs (16,257) (25,976) (24,645) (28,097) (31,431)
Costs of Labor (1,602) (1,660) (1,767) (2,008) (2,099)
Repairs and Maintenance (958) (1,828) (1,563) (2,076) (2,421)
Materials, supplies and fuel consumed and supplies utilized (6,486) 10,775) (9,540) (20,253) (9,704)
External services, insurances, security and others (3,605) (6,938) (6,388) (6,634) (7,979)
Operation office and staff expenses (3,607) (4,776) (5,388) (7,126) (9,228)
Additional Natural Gas supply costs after price adjustment Royalties (7,982) (7,402) (15,016) (30,892)
DD&A Expenses (13,672) (16,931) (17,223) (19,851) (17,690)
Income (loss) before income taxes 29,304 7,048 1,286 4,984 16,530
Income tax expense(2) (8,791) (1,974) (373) (1,470) (4,876)
Results of operations from producing activities 20,513 5,075 913 3,514 11,654
(1) Income after deductions for Graña y Montero Petrolera S.A.’s share of government royalties according to contract obligations. There are no sales
or transfers to our company’s other operations.
(2) In 2014, the legal tax rate was 30%. In 2015, the legal tax rate was 28%, and during 2016, the legal tax rate was 27%. In 2017, the Peruvian
government increased the legal tax rate to 29.5%. In 2018, the Peruvian government retained the legal tax rate at 29.5%.
S-3

E. Standardized Measure of Discounted Future Net Cash Flows
The standardized measure of discounted future net cash flows, related to the proved reserves is based on estimates of net proved reserves
and the period during which they are expected to be produced. Future cash inflows are computed by applying the twelve month period unweighted
arithmetic average of the price as of the first day of each month within that twelve month period, unless prices are defined by contractual arrangements,
after royalty share of estimated annual future production from proved oil and gas reserves.
Future production and development costs to be incurred in producing and further developing the proved reserves are based on year end cost
indicators. Future income taxes are computed by applying year end statutory tax rates.
The following chart shows standardized measures of discounted future net cash flows for the periods indicated:
2014 2015 2016 2017 2018
(in US$ thousands)
Future Cash inflows 251,695 1,461,565 1,106,849 1,436101 2,041,128
Future production costs (72,857) (507,212) (285,608) (776,847) (1,446,949)
Future development costs (37,423) (368,873) (463,224) (221,557) (232,432)
Future production and development costs (110,280) (876,085) (748,832) (998,404) (1,679,381)
Future income tax expenses (37,264) (153,178) (105,615) (129,121) (106,715)
Future Net cash flows 104,151 432,301 252,402 308,577 255,031
10% annual discount for estimates timing of cash flows (29,483) (209,039) (115,028) (168,224) (115,518)
Standardized measure of discounted Future
Net Cash Flow s 74,668 223,262 137,374 140,353 139,514
(1) For oil volumes, per barrel prices after deductions of Graña y Montero Petrolera S.A.’s share government royalties used in determining future
cash inflows for the years ended December 31, 2014, 2015, 2016, 2017 and 2018 were US$77.33, US$45.59, US$38.54, US$49.82, and
US$64.72, respectively. For gas volumes, gas price is linked to the oil price according to the gas purchase contract.
(2) Production costs and developments costs relating to future production of proved reserves are based on the continuation of existing economic
conditions. Future estimated decommissioning costs are included.
(3) Taxation is computed using the appropriate year-end statutory corporate income tax rates.
(4) Future net cash flows from oil production are discounted at 10% regardless of assessment of the risk associated with its production activities.
F. Changes in Standardized Measure of Discounted Future Net Cash Flows
The following chart shows changes in standardized measures of discounted future net cash flows for the periods indicated:
2014 2015 2016 2017 2018
(in US$ thousands)
Standardized measure of discounted Future Net Cash Flows, beginning of the year. 97,474 74,668 223,262 137,374 140,353
Revenue less production and other costs (75,490) (103,058) (75,202) (96,045) (127,974)
Net changes in future development costs 11,497 (185,387) (53,464) 94,388 (6,204)
Changes in price, net of production costs (53,214) (284,832) 560 (109,168) (68,095)
Development cost incurred 13,126 17,179 19,161 22,905 29,218
Revisions of previous quantity estimates 23,273 674,418 (54,052) 27,456 72,852
Accretion of discount 16,836 67,666 55,438 70,152 99,822
Net change in income taxes 9,286 (53,715) 21,327 (85) 427
Timing difference and other 31,879 (16,330) (343) (6,623) (886)
Standardized measure of discounted Future Net Cash Flows, end of the year 74,668 223,262 137,374 140,353 139,514
S-4

EXHIBIT INDEX
Exhibit Number Description
1.01* By-Laws of the Registrant, as currently in effect
2.01** Registrant’s Form of American Depositary Receipt
2.02** Deposit Agreement, dated as of December 31, 2018, among the Registrant, The Bank of New York Mellon, as depositary,
and all owners and holders from time to time of American depositary shares issued thereunder
8.01 Subsidiaries of the Registrant
10.01*** Credit Agreement, dated as of December 10, 2015, by and among, inter alia, Graña y Montero, as borrower, and Credit
Suisse AG, Cayman Islands Branch, as administrative agent.
10.01.1*** Amendment No. 1, dated as of December 22, 2015, to the Credit Agreement, dated as of December 10, 2015, by and among,
inter alia, Graña y Montero, as borrower, and Credit Suisse AG, Cayman Islands Branch, as administrative agent.
10.01.2*** Amendment No. 2, dated as of February 1, 2016, to the Credit Agreement, dated as of December 10, 2015, by and among,
inter alia, Graña y Montero, as borrower, and Credit Suisse AG, Cayman Islands Branch, as administrative agent.
10.01.3*** Amendment No. 3, dated as of February 12, 2016, to the Credit Agreement, dated as of December 10, 2015, by and among,
inter alia, Graña y Montero, as borrower, and Credit Suisse AG, Cayman Islands Branch, as administrative agent.
10.01.4*** Amendment No. 4, dated as of February 29, 2016, to the Credit Agreement, dated as of December 10, 2015, by and among,
inter alia, Graña y Montero, as borrower, and Credit Suisse AG, Cayman Islands Branch, as administrative agent.
10.01.5*** Amendment No. 5, dated as of April 15, 2016, to the Credit Agreement, dated as of December 10, 2015, by and among,
inter alia, Graña y Montero, as borrower, and Credit Suisse AG, Cayman Islands Branch, as administrative agent.
10.01.6*** Waiver and Amendment No. 6, dated as of September 15, 2016, to the Credit Agreement, dated as of December 10, 2015,
by and among, inter alia, Graña y Montero, as borrower, and Credit Suisse AG, Cayman Islands Branch, as administrative
agent.
10.01.7*** Amendment No. 7, dated as of December 16, 2016, to the Credit Agreement, dated as of December 10, 2015, by and among,
inter alia, Graña y Montero, as borrower, and Credit Suisse AG, Cayman Islands Branch, as administrative agent.
10.01.8*** + Amendment No. 8, dated as of June 27, 2017, to the Credit Agreement, dated as of December 10, 2015, by and among, inter
alia, Graña y Montero, as borrower, and Credit Suisse AG, Cayman Islands Branch, as administrative agent.
10.01.9*** Amendment No. 9, dated as of October 12, 2017, to the Credit Agreement, dated as of December 10, 2015, by and among,
inter alia, Graña y Montero, as borrower, and Credit Suisse AG, Cayman Islands Branch, as administrative agent.
10.02*** Loan Agreement, dated as of June 27, 2017, by and among, inter alia, Graña y Montero, as borrower, and Natixis, New
York Branch, as administrative agent.
10.02.1*** Waiver and Amendment, dated as of March 26, 2018, to the Credit Agreement, dated as of June 27, 2017, by and among,
inter alia, Graña y Montero, as borrower, and Natixis, New York Branch, as administrative agent.

Exhibit Number Description
10.03*** English translation of Financial Stability Framework Agreement, dated as of July 31, 2017, by and among, inter alia, Graña y
Montero, as borrower, and Scotiabank Perú S.A.A., Banco Internacional del Perú S.A.A., BBVA Banco Continental, Banco de
Crédito del Perú, Citibank del Perú S.A. and Citibank, N.A., as lenders.
10.04*** English translation of Section 20 of Concession Agreement, dated as of July 22, 2014, by and among the Peruvian Ministry of
Energy and Mines, as contracting authority and the concessionaire party thereto.
10.05*** English translation of Memorandum of Understanding, dated as of September 26, 2017, by and among Graña y Montero,
Negocios de Gas S.A., Enagás S.A., Odebrecht S.A., and Inversiones en Infraestructura de Transporte por Ductos S.A.C.
10.05.1*** English translation of Rights Subordination Agreement, dated as of April 29, 2016, by and among Odebrecht Latinvest Peru
Ductos, S.A., Odebrecht S.A., Enagás, S.A., Graña y Montero, Negocios de Gas S.A., Inversiones en Infraestructura de
Transporte por Ductos S.A.C., and Gasoducto Sur Peruano S.A.
10.05.1.1*** English translation of Addendum No. 1, dated as of June 24, 2016, to the Rights Subordination Agreement, dated as of
April 29, 2016, by and among, inter alia, Odebrecht Latinvest Peru Ductos, S.A., Odebrecht S.A., Enagás, S.A., Graña y
Montero, GyM S.A., Negocios de Gas S.A., Inversiones en Infraestructura de Transporte por Ductos S.A.C., Gasoducto Sur
Peruano S.A., Odebrecht Perú Ingeniería y Construcción S.A.C., and Constructora Norberto Odebrecht S.A., Sucursal del
Perú.
10.05.1.2*** English translation of Addendum No. 2 and Assignment Agreement, dated as of August 11, 2016, to the Rights Subordination
Agreement, dated as of April 29, 2016, by and among, inter alia, Odebrecht Latinvest Peru Ductos, S.A., Odebrecht S.A.,
Enagás, S.A., Graña y Montero, GyM S.A., Negocios de Gas S.A., Inversiones en Infraestructura de Transporte por Ductos
S.A.C., Gasoducto Sur Peruano S.A., Odebrecht Perú Ingeniería y Construcción S.A.C., and Constructora Norberto Odebrecht
S.A., Sucursal del Perú.
10.05.1.3*** English translation of Modification to Addendum No. 2 and Assignment Agreement, dated as of October 25, 2016, to the
Rights Subordination Agreement, dated as of April 29, 2016, by and among, inter alia, Odebrecht Latinvest Peru Ductos, S.A.,
Odebrecht S.A., Enagás, S.A., Graña y Montero, GyM S.A., Negocios de Gas S.A., Inversiones en Infraestructura de
Transporte por Ductos S.A.C., Gasoducto Sur Peruano S.A., Odebrecht Perú Ingeniería y Construcción S.A.C., and
Constructora Norberto Odebrecht S.A., Sucursal del Perú.
12.01 Certification of the Chief Executive Officer pursuant to Section 302 of the Sarbanes-Oxley Act
12.02 Certification of the Chief Financial Officer pursuant to Section 302 of the Sarbanes-Oxley Act
13.01**** Certification of the Chief Executive Officer pursuant to 18 U.S.C. Section 1350, as adopted pursuant to Section 906 of the
Sarbanes-Oxley Act
13.02**** Certification of the Chief Financial Officer pursuant to 18 U.S.C. Section 1350, as adopted pursuant to Section 906 of the
Sarbanes-Oxley Act
16.01*** Letter dated May 15, 2018 by Gaveglio, Aparicio y Asociados S.C. de R.L., a member firm of PricewaterhouseCoopers, as
required by Item 16F of Form 20-F.
101. INS XBRL Instance Document
101. SCH XBRL Taxonomy Extension Schema Document
101. CAL XBRL Taxonomy Extension Calculation Linkbase Document
101. DEF XBRL Taxonomy Extension Definition Linkbase Document
101. LAB XBRL Taxonomy Extension Label Linkbase Document
101. PRE XBRL Taxonomy Extension Presentation Linkbase Document
* Incorporated herein by reference to exhibit 1.01 of the Registrant’s Form 20-F (File No. 333-172855) filed with the SEC on April 30, 2014.
** Incorporated herein by reference to exhibit 1 to the Registrant’s registration statement on Form F-6 (File No. 333-228727) filed with the SEC on
December 10, 2018.
*** Incorporated herein by reference to the Registrant’s Form 20-F (File No. 333-172855) filed with the SEC on May 15, 2018.
**** This certification will not be deemed “filed” for purposes of Section 18 of the Exchange Act (15 U.S.C. §78r), or otherwise subject to the liability
of that section. Such certification will not be deemed to be incorporated by reference into any filing under the Securities Act or the Exchange Act,
except to the extent that the Registrant specifically incorporates it by reference.
+ Confidential treatment requested.

Exhibit 8.01
Subsidiaries of the Registrant
Subsidiary
Jurisdiction
of
Incorporation
Name Under
Which the
Subsidiary Does
Business Ownership Interest
Viva GyM S.A. Peru Viva GyM Graña y Montero owns 63.4%; GyM owns 36.1%
GyM S.A. Peru GyM Graña y Montero owns 98.24%
Concesionaria La Chira S.A. Peru La Chira Graña y Montero owns 50.0%
Concesión Canchaque S.A. Peru Canchaque Graña y Montero owns 99.96%
Concar S.A. Peru Concar Graña y Montero owns 99.99%
GMP S.A. Peru GMP Graña y Montero owns 95.0%
GyM Ferrovías S.A. Peru GyM Ferrovías Graña y Montero owns 75.0%
Norvial S.A.* Peru Norvial Graña y Montero owns 67.0%
Survial S.A. Peru Survial Graña y Montero owns 99.99%
CAM Holding SPA Peru CAM Holding Graña y Montero owns 100%
CAM Chile S.A.** Chile Cam Graña y Montero owns 73.16%
Survial S.A. Peru Survial Graña y Montero owns 99.9%
GMI S.A. Ingenieros Consultores Peru GMI Graña y Montero owns 89.4%
ECOTEC S.A.C. Peru ECOTEC GMI owns 99.99%
Construyendo País Peru Construyendo
País
GyM owns 99.99%
STRACON GyM S.A.*** Peru Stracon GyM GyM owned 87.60%
Vial y Vives – DSD S.A. Chile Vial y Vives GyM owns 94.49%
Inmobiliaria Almonte S.A.C. Peru Almonte Viva GyM owns 50.45%
Inmobiliaria Pezet 417 S.A.C. Peru Pezet 417 Viva GyM owns 99.90%
Las Lomas S.A.C. Peru Las Lomas Viva GyM owns 99.99%

Subsidiary
Jurisdiction
of
Incorporation
Name Under
Which the
Subsidiary Does
Business Ownership Interest
Proyectos Inmobiliarios Consultores S.A. Perú PICSA Viva GyM owns 92.42%
Morelco S.A.S Colombia Morelco GyM owns 70.00%
Concesionaria Via Expresa Sur S.A. Peru VESUR Graña y Montero owns 99.98%; GyM owns the
remaining 0.02%
Agenera S.A.C. Perú Agenera Graña y Montero owns 99.00%; GyM owns the
remaining 1.00%.
GyM Colombia S.A.S. Colombia GyM Colombia Graña y Montero owns 66.20%, GyM owns the
remaining 33.80%
Negocios de Gas S.A. Peru Negocios de Gas Graña y Montero owns 99.99%; GyM owns the
remaining 0.01%.
Qualys S.A. (Previously Generadora Arabesco S.A.) Perú Qualys Graña y Montero owns 99.00%,
Adexus S.A. **** Chile Adexus Graña y Montero owns 100.00%,
Recaudo Lima S.A. Perú Recaudo Lima Graña y Montero owns 70.00%, GMD owns the
remaining 30.00%
CAM Servicios del Perú S.A. ** Perú CAM Servicios
del Perú
Graña y Montero owned 73.16%
Promotora Larco Mar S.A. Perú Promotora Larco
Mar
Graña y Montero owns 46.55%
TGNCA S.A. Perú TGNCA Graña y Montero owns 99.93%
Coasin Instalaciones Limitada ** Chile Coasin CAM Chile owns 99.89%, the remaining 0.11% is
owned by Inversiones y Construcción GyM
Limitada
Billetera Electrónica de Transporte Lima S.A.C. Perú BETL Graña y Montero owns 95.5%
GyM Chile SPA Chile GyM Chile SPA GyM owns 100%
Gestión de Soluciones Digitales S.A.C. Perú GSD Graña y Montero owns 100%
Larcomar S.A. Perú Larcomar Graña y Montero owns 79.66%

Subsidiary
Jurisdiction
of
Incorporation
Name Under
Which the
Subsidiary Does
Business Ownership Interest
Promotores Asociados de Inmobiliaria S.A. Perú Promotores
Asociados
de Inmobiliaria
Graña y Montero owns 99.99%
Oiltanking Andina Services S.A. Perú OTAS GMP owns 50.00%
* In June 2018, the company transferred economic rights over 48.8% of the share capital of Norvial to Inversiones en Autopistas S.A. by
transferring its Class B shares. Our company continues to possess 67% of voting rights of Norvial and an economic interest of 18.2% of
Norvial’s share capital. JJC Contratistas Generales S.A. owns the remaining 33.00%.
** In December 2018, Graña y Montero sold its position in CAM to GDF Suez Energie Services Chile Holding SpA and ENGIE Services Perú S.A.
*** In April 2018, Graña y Montero sold its position in Stracon GyM.
**** In June 2018, Graña y Montero consolidated 100% of Adexus S.A. Graña y Montero is in the process of marketing Adexus S.A. for sale.

Exhibit 12.01
CERTIFICATION PURSUANT TO
SECTION 302 OF THE SARBANES-OXLEY ACT OF 2002
I, Luis Francisco Díaz Olivero, certify that:
1. I have reviewed this annual report on Form 20-F of Graña y Montero S.A.A. (the “Company”);
2. Based on my knowledge, this report does not contain any untrue statement of a material fact or omit to state a material fact necessary to make
the statements made, in light of the circumstances under which such statements were made, not misleading with respect to the period covered by this
report;
3. Based on my knowledge, the financial statements, and other financial information included in this report, fairly present in all material respects
the financial condition, results of operations and cash flows of the Company as of, and for, the periods presented in this report;
4. The Company’s other certifying officer(s) and I are responsible for establishing and maintaining disclosure controls and procedures (as defined
in Exchange Act Rules 13a-15(e) and 15d-15(e)) and internal control over financial reporting (as defined in Exchange Act Rules 13a-15(f) and
15d-15(f)) for the Company and have:
(a) designed such disclosure controls and procedures, or caused such disclosure controls and procedures to be designed under our supervision,
to ensure that material information relating to the Company, including its consolidated subsidiaries, is made known to us by others within
those entities, particularly during the period in which this report is being prepared;
(b) designed such internal control over financial reporting, or caused such internal control over financial reporting to be designed under our
supervision, to provide reasonable assurance regarding the reliability of financial reporting and the preparation of financial statements for
external purposes in accordance with generally accepted accounting principles;
(c) evaluated the effectiveness of the Company’s disclosure controls and procedures and presented in this report our conclusions about the
effectiveness of the disclosure controls and procedures, as of the end of the period covered by this report based on such evaluation; and
(d) disclosed in this report any change in the Company’s internal control over financial reporting that occurred during the period covered by the
annual report that has materially affected, or is reasonably likely to materially affect the Company’s internal control over financial
reporting; and
5. The Company’s other certifying officer(s) and I have disclosed, based on our most recent evaluation of internal control over financial reporting,
to the Company’s auditors and the audit committee of the Company’s board of directors (or persons performing the equivalent functions):
(a) all significant deficiencies and material weaknesses in the design or operation of internal control over financial reporting which are
reasonably likely to adversely affect the Company’s ability to record, process, summarize and report financial information; and
(b) any fraud, whether or not material, that involves management or other employees who have a significant role in the Company’s internal
control over financial reporting.
Date: April 30, 2019
/s/ Luis Francisco Díaz Olivero
Luis Francisco Díaz Olivero
Chief Executive Officer

Exhibit 12.02
CERTIFICATION PURSUANT TO
SECTION 302 OF THE SARBANES-OXLEY ACT OF 2002
I, Mónica Miloslavich, certify that:
1. I have reviewed this annual report on Form 20-F of Graña y Montero S.A.A. (the “Company”);
2. Based on my knowledge, this report does not contain any untrue statement of a material fact or omit to state a material fact necessary to make
the statements made, in light of the circumstances under which such statements were made, not misleading with respect to the period covered by this
report;
3. Based on my knowledge, the financial statements, and other financial information included in this report, fairly present in all material respects
the financial condition, results of operations and cash flows of the Company as of, and for, the periods presented in this report;
4. The Company’s other certifying officer(s) and I are responsible for establishing and maintaining disclosure controls and procedures (as defined
in Exchange Act Rules 13a-15(e) and 15d-15(e)) and internal control over financial reporting (as defined in Exchange Act Rules 13a-15(f) and
15d-15(f)) for the Company and have:
(a) designed such disclosure controls and procedures, or caused such disclosure controls and procedures to be designed under our supervision,
to ensure that material information relating to the Company, including its consolidated subsidiaries, is made known to us by others within
those entities, particularly during the period in which this report is being prepared;
(b) designed such internal control over financial reporting, or caused such internal control over financial reporting to be designed under our
supervision, to provide reasonable assurance regarding the reliability of financial reporting and the preparation of financial statements for
external purposes in accordance with generally accepted accounting principles;
(c) evaluated the effectiveness of the Company’s disclosure controls and procedures and presented in this report our conclusions about the
effectiveness of the disclosure controls and procedures, as of the end of the period covered by this report based on such evaluation; and
(d) disclosed in this report any change in the Company’s internal control over financial reporting that occurred during the period covered by the
annual report that has materially affected, or is reasonably likely to materially affect the Company’s internal control over financial
reporting; and
5. The Company’s other certifying officer(s) and I have disclosed, based on our most recent evaluation of internal control over financial reporting,
to the Company’s auditors and the audit committee of the Company’s board of directors (or persons performing the equivalent functions):
(a) all significant deficiencies and material weaknesses in the design or operation of internal control over financial reporting which are
reasonably likely to adversely affect the Company’s ability to record, process, summarize and report financial information; and
(b) any fraud, whether or not material, that involves management or other employees who have a significant role in the Company’s internal
control over financial reporting.
Date: April 30, 2019
/s/ Mónica Miloslavich
Mónica Miloslavich
Chief Financial Officer

Exhibit 13.01
CERTIFICATION PURSUANT TO 18 U.S.C. SECTION 1350,
AS ADOPTED PURSUANT TO
SECTION 906 OF THE U.S. SARBANES-OXLEY ACT OF 2002
In connection with the annual report of Graña y Montero S.A.A. (the “Company”) on Form 20-F for the fiscal year ended December 31, 2018 as
filed with the U.S. Securities and Exchange Commission on the date hereof (the “Report”), I, Luis Francisco Díaz Olivero, Chief Executive Officer,
certify, pursuant to 18 U.S.C. section 1350, as adopted pursuant to section 906 of the U.S. Sarbanes-Oxley Act of 2002, that to the best of my
knowledge:
(i) the Report fully complies with the requirements of Section 13(a) or 15(d) of the U.S. Securities Exchange Act of 1934; and
(ii) the information contained in the Report fairly presents, in all material respects, the financial condition and results of operations of the
Company.
/s/ Luis Francisco Díaz Olivero
Name: Luis Francisco Díaz Olivero
Title: Chief Executive Officer
April 30, 2019
Exhibit 13.02
CERTIFICATION PURSUANT TO 18 U.S.C. SECTION 1350,
AS ADOPTED PURSUANT TO
SECTION 906 OF THE U.S. SARBANES-OXLEY ACT OF 2002
In connection with the annual report of Graña y Montero S.A.A. (the “Company”) on Form 20-F for the fiscal year ended December 31, 2018, as
filed with the U.S. Securities and Exchange Commission on the date hereof (the “Report”), I, Mónica Miloslavich, Chief Financial Officer, certify,
pursuant to 18 U.S.C. section 1350, as adopted pursuant to section 906 of the U.S. Sarbanes-Oxley-Act of 2002, that to the best of my knowledge:
(i) the Report fully complies with the requirements of Section 13(a) or 15(d) of the U.S. Securities Exchange Act of 1934; and
(ii) the information contained in the Report fairly presents, in all material respects, the financial condition and results of operations of the
Company.
/s/ Mónica Miloslavich
Name: Mónica Miloslavich
Title: Chief Financial Officer
April 30, 2019