form 10-kd18rn0p25nwr6d.cloudfront.net/cik-0001002910/9c8ebb39-5583-4208...securities registered...
TRANSCRIPT
Table of Contents
UNITED STATESSECURITIES AND EXCHANGE COMMISSION
Washington, D.C. 20549
FORM 10-K
(X) Annual report pursuant to Section 13 or 15(d) of the Securities Exchange Act of 1934for the fiscal year ended December 31, 2016.
OR ( ) Transition report pursuant to Section 13 or 15(d) of the Securities Exchange Act of 1934 for the transition period from to .
CommissionFile Number
Exact name of registrant as specified in its charter;State of Incorporation;Address and Telephone Number
IRS EmployerIdentification No.
1-14756 Ameren Corporation 43-1723446 (Missouri Corporation) 1901 Chouteau Avenue St. Louis, Missouri 63103 (314) 621-3222 1-2967 Union Electric Company 43-0559760 (Missouri Corporation) 1901 Chouteau Avenue St. Louis, Missouri 63103 (314) 621-3222 1-3672 Ameren Illinois Company 37-0211380 (Illinois Corporation) 6 Executive Drive Collinsville, Illinois 62234 (618) 343-8150
Securities Registered Pursuant to Section 12(b) of the Act:The following security is registered pursuant to Section 12(b) of the Securities Exchange Act of 1934 and is listed on the New York Stock Exchange:
Registrant Title of each classAmeren Corporation Common Stock, $0.01 par value per share
Securities Registered Pursuant to Section 12(g) of the Act:
Registrant Title of each classUnion Electric Company Preferred Stock, cumulative, no par value, stated value $100 per shareAmeren Illinois Company Preferred Stock, cumulative, $100 par value per share
Depositary Shares, each representing one-fourth of a share of 6.625% PreferredStock, cumulative, $100 par value per share
Indicate by checkmark if each registrant is a well-known seasoned issuer, as defined in Rule 405 of the Securities Act.
Ameren Corporation Yes (X) No ( )Union Electric Company Yes ( ) No (X)Ameren Illinois Company Yes (X) No ( )
Indicate by checkmark if each registrant is not required to file reports pursuant to Section 13 or Section 15(d) of the Act.
Ameren Corporation Yes ( ) No (X)Union Electric Company Yes ( ) No (X)

Ameren Illinois Company Yes ( ) No (X)
Indicate by checkmark whether the registrants: (1) have filed all reports required to be filed by Section 13 or 15(d) of the Securities Exchange Act of 1934during the preceding 12 months (or for such shorter period that the registrant was required to file such reports), and (2) have been subject to such filingrequirements for the past 90 days.
Ameren Corporation Yes (X) No ( )Union Electric Company Yes (X) No ( )Ameren Illinois Company Yes (X) No ( )
Indicate by checkmark whether each registrant has submitted electronically and posted on its corporate website, if any, every Interactive Data File required tobe submitted and posted pursuant to Rule 405 of Regulation S-T (§ 232.405 of this chapter) during the preceding 12 months (or for such shorter period that theregistrant was required to submit and post such files).
Ameren Corporation Yes (X) No ( )Union Electric Company Yes (X) No ( )Ameren Illinois Company Yes (X) No ( )
Indicate by checkmark if disclosure of delinquent filers pursuant to Item 405 of Regulation S-K (§ 229.405 of this chapter) is not contained herein, and will notbe contained, to the best of each registrant’s knowledge, in definitive proxy or information statements incorporated by reference in Part III of this Form 10-K orany amendment to this Form 10-K.
Ameren Corporation (X)Union Electric Company (X)Ameren Illinois Company (X)
Indicate by checkmark whether each registrant is a large accelerated filer, an accelerated filer, a non-accelerated filer or a smaller reporting company. Seedefinitions of “large accelerated filer,” “accelerated filer,” and “smaller reporting company” in Rule 12b-2 of the Exchange Act.
LargeAccelerated
Filer Accelerated
Filer Non-accelerated
Filer
SmallerReportingCompany
Ameren Corporation (X) ( ) ( ) ( )Union Electric Company ( ) ( ) (X) ( )Ameren Illinois Company ( ) ( ) (X) ( )
Indicate by checkmark whether each registrant is a shell company (as defined in Rule 12b-2 of the Act).
Ameren Corporation Yes ( ) No (X)Union Electric Company Yes ( ) No (X)Ameren Illinois Company Yes ( ) No (X)
As of June 30, 2016 , Ameren Corporation had 242,634,798 shares of its $0.01 par value common stock outstanding. The aggregate market value of theseshares of common stock (based upon the closing price of the common stock on the New York Stock Exchange on June 30, 2016 ) held by nonaffiliates was$13,000,372,477. The shares of common stock of the other registrants were held by Ameren Corporation as of June 30, 2016 .
The number of shares outstanding of each registrant’s classes of common stock as of January 31, 2017 , were as follows:
Ameren Corporation Common stock, $0.01 par value per share: 242,634,798 Union Electric Company Common stock, $5 par value per share, held by Ameren
Corporation (parent company of the registrant): 102,123,834 Ameren Illinois Company Common stock, no par value, held by Ameren
Corporation (parent company of the registrant): 25,452,373
DOCUMENTS INCORPORATED BY REFERENCEPortions of the definitive proxy statement of Ameren Corporation and portions of the definitive information statements of Union Electric Company and
Ameren Illinois Company for the 2017 annual meetings of shareholders are incorporated by reference into Part III of this Form 10-K.
This combined Form 10-K is separately filed by Ameren Corporation, Union Electric Company, and Ameren Illinois Company. Each registrant hereto is filing
on its own behalf all of the information contained in this annual report that relates to such registrant. Each registrant hereto is not filing any information that doesnot relate to such registrant, and therefore makes no representation as to any such information.
Table of Contents
TABLE OF CONTENTS
PageGLOSSARY OF TERMS AND ABBREVIATIONS 1Forward-looking Statements 4PART I Item 1. Business 5 General 5 Business Segments 5 Rates and Regulation 6 Transmission 10 Supply of Electric Power 10 Power Generation 11 Natural Gas Supply for Distribution 13 Industry Issues 13 Operating Statistics 15 Available Information 17Item 1A. Risk Factors 17Item 1B. Unresolved Staff Comments 24Item 2. Properties 25Item 3. Legal Proceedings 26Item 4. Mine Safety Disclosures 26Executive Officers of the Registrants (Item 401(b) of Regulation S-K) 26 PART II Item 5. Market for Registrants’ Common Equity, Related Stockholder Matters, and Issuer Purchase of Equity Securities 29Item 6. Selected Financial Data 31Item 7. Management’s Discussion and Analysis of Financial Condition and Results of Operations 32 Overview 32 Results of Operations 33 Liquidity and Capital Resources 49 Outlook 59 Regulatory Matters 62 Accounting Matters 63 Effects of Inflation and Changing Prices 65Item 7A. Quantitative and Qualitative Disclosures About Market Risk 66Item 8. Financial Statements and Supplementary Data 69 Ameren Corporation 71 Union Electric 76 Ameren Illinois 80 Note 1. Summary of Significant Accounting Policies 84 Note 2. Rate and Regulatory Matters 91 Note 3. Property, Plant, and Equipment, Net 96 Note 4. Short-term Debt and Liquidity 96 Note 5. Long-term Debt and Equity Financings 99 Note 6. Other Income and Expenses 104 Note 7. Derivative Financial Instruments 104 Note 8. Fair Value Measurements 107 Note 9. Nuclear Decommissioning Trust Fund Investments 112 Note 10. Callaway Energy Center 113 Note 11. Retirement Benefits 114 Note 12. Stock-based Compensation 121 Note 13. Income Taxes 122 Note 14. Related Party Transactions 126 Note 15. Commitments and Contingencies 127
Note 16. Segment Information 133 Selected Quarterly Information 136Item 9. Changes in and Disagreements with Accountants on Accounting and Financial Disclosure 136Item 9A. Controls and Procedures 136Item 9B. Other Information 137 PART III Item 10. Directors, Executive Officers, and Corporate Governance 137Item 11. Executive Compensation 138Item 12. Security Ownership of Certain Beneficial Owners and Management and Related Stockholder Matters 138Item 13. Certain Relationships and Related Transactions and Director Independence 139Item 14. Principal Accounting Fees and Services 139 PART IV Item 15. Exhibits and Financial Statement Schedules 139Item 16. Form 10-K Summary 145SIGNATURES 145EXHIBIT INDEX 149
This report contains “forward-looking” statements within the meaning of Section 21E of the Securities Exchange Act of 1934, as amended. Forward-lookingstatements should be read with the cautionary statements and important factors under the heading “Forward-looking Statements.” Forward-looking statements areall statements other than statements of historical fact, including those statements that are identified by the use of the words “anticipates,” “estimates,” “expects,”“intends,” “plans,” “predicts,” “projects,” and similar expressions.
Table of Contents
GLOSSARY OF TERMS AND ABBREVIATIONS
We use the words “our,” “we” or “us” with respect to certain information that relates to Ameren, Ameren Missouri, and Ameren Illinois, collectively. Whenappropriate, subsidiaries of Ameren Corporation are named specifically as their various business activities are discussed.
2006 Incentive Plan – The 2006 Omnibus Incentive Compensation Plan,which provided for compensatory stock-based awards to eligible employeesand directors and was replaced prospectively for new grants by the 2014Incentive Plan.2014 Incentive Plan – The 2014 Omnibus Incentive Compensation Plan,which provides for compensatory stock-based awards to eligible employeesand directors, effective in April 2014.AER – Ameren Energy Resources Company, LLC, a former AmerenCorporation subsidiary that consisted of non-rate-regulated operations. InDecember 2013, AER contributed substantially all of its assets and liabilities,including its ownership interests in Genco, AERG, and Marketing Company,to New AER.Ameren – Ameren Corporation and its subsidiaries on a consolidated basis. Inreferences to financing activities, acquisition activities, or liquidityarrangements, Ameren is defined as Ameren Corporation, the parent.Ameren Companies – Ameren Corporation, Ameren Missouri, and AmerenIllinois, collectively, which are individual registrants within the Amerenconsolidated group.Ameren Illinois Electric Distribution – An Ameren and Ameren Illinoisfinancial reporting segment consisting of the rate-regulated electricdistribution business of Ameren Illinois.Ameren Illinois Transmission – An Ameren Illinois financial reportingsegment consisting of the rate-regulated electric transmission business ofAmeren Illinois.Ameren Illinois Natural Gas – An Ameren and Ameren Illinois financialreporting segment consisting of the rate-regulated natural gas distributionbusiness of Ameren Illinois.Ameren Illinois – Ameren Illinois Company, an Ameren Corporationsubsidiary that operates rate-regulated electric and natural gas transmissionand distribution businesses in Illinois, doing business as Ameren Illinois.Ameren Missouri – Union Electric Company, an Ameren Corporationsubsidiary that operates a rate-regulated electric generation, transmission, anddistribution business and a rate-regulated natural gas transmission anddistribution business in Missouri, doing business as Ameren Missouri.Ameren Missouri is also defined as a financial reporting segment of Ameren.Ameren Services – Ameren Services Company, an Ameren Corporationsubsidiary that provides support services to Ameren and its subsidiaries.Ameren Transmission – An Ameren financial reporting segment primarilyconsisting of the aggregated electric transmission businesses of AmerenIllinois and ATXI.AMIL – The MISO balancing authority area operated by Ameren, whichincludes the load of Ameren Illinois and ATXI.AMMO – The MISO balancing authority area operated by Ameren, whichincludes the load and energy centers of Ameren Missouri.ARO – Asset retirement obligations.ATXI – Ameren Transmission Company of Illinois, an Ameren Corporationsubsidiary that is engaged in the construction and operation of electrictransmission assets.
Baseload – The minimum amount of electric power delivered or required overa given period of time at a steady rate.Btu – British thermal unit, a standard unit for measuring the quantity of heatenergy required to raise the temperature of one pound of water by one degreeFahrenheit.CCR – Coal combustion residuals, which include fly ash, bottom ash, boilerslag, and flue gas desulfurization materials generated from burning coal togenerate electricity.CILCO – Central Illinois Light Company, a former Ameren Corporationsubsidiary that was merged with CIPS and IP to form Ameren Illinois.CIPS – Central Illinois Public Service Company, a predecessor to AmerenIllinois.Clean Power Plan – “Carbon Pollution Emission Guidelines for ExistingStationary Sources: Electric Utility Generating Units,” an EPA rule thatestablishes emission guidelines for states to follow in developing plans toreduce CO 2 emissions from existing fossil-fuel-fired electric generating units.CO 2 – Carbon dioxide.COL – Nuclear energy center combined construction and operating license.Cooling degree-days – The summation of positive differences between theaverage daily temperature and a 65-degree Fahrenheit base. This statistic isuseful as an indicator of electricity demand by residential and commercialcustomers for summer cooling.Credit Agreements – The Illinois Credit Agreement and the Missouri CreditAgreement, collectively.CSAPR – Cross-State Air Pollution Rule, an EPA rule that requires states thatcontribute to air pollution in downwind states to limit air emissions fromfossil-fuel-fired electric generating units.CT – Combustion turbine used primarily for peaking electric generationcapacity.Dekatherm – A standard unit of energy equivalent to one million Btus.DOE – Department of Energy, a United States government agency.DRPlus – Ameren Corporation’s dividend reinvestment and direct stockpurchase plan.Dynegy – Dynegy Inc.EPA – Environmental Protection Agency, a United States governmentagency.ERISA – Employee Retirement Income Security Act of 1974, as amended.Exchange Act – Securities Exchange Act of 1934, as amended.FAC – Fuel adjustment clause, a fuel and purchased power cost recoverymechanism that allows Ameren Missouri to recover or refund throughcustomer rates 95% of changes in net energy costs greater or less than theamount set in base rates without a traditional rate proceeding, subject toMoPSC prudence reviews.FASB – Financial Accounting Standards Board, a rulemaking organizationthat establishes financial accounting and reporting standards in the UnitedStates.
1

Table of Contents
FEJA – Future Energy Jobs Act , a 2016 Illinois law affecting electricdistribution utilities. This law allows Ameren Illinois to earn a return on itselectric energy efficiency investments, decouples electric distributionrevenues from sales volumes, offers customer rebates for installing distributedgeneration, and includes extensions and modifications of certain IEIMAperformance-based framework provisions, among other things.FERC – Federal Energy Regulatory Commission, a United States governmentagency.FTRs – Financial transmission rights, financial instruments that specifywhether the holder shall pay or receive compensation for certain congestion-related transmission charges between two designated points.GAAP – Generally accepted accounting principles in the United States.Heating degree-days – The summation of negative differences between theaverage daily temperature and a 65-degree Fahrenheit base. This statistic isuseful as an indicator of demand for electricity and natural gas for winterheating by residential and commercial customers.IBEW – International Brotherhood of Electrical Workers, a labor union.ICC – Illinois Commerce Commission, a state agency that regulates Illinoisutility businesses, including Ameren Illinois and ATXI.IEIMA – Illinois Energy Infrastructure Modernization Act, an Illinois lawthat established a performance-based formula process for determining electricdistribution service rates. By its election to participate in this regulatoryframework, Ameren Illinois is required to make incremental capitalexpenditures to modernize its electric distribution system, to meetperformance standards, and to create jobs in Illinois, among otherrequirements.Illinois Credit Agreement – Ameren's and Ameren Illinois' $1.1 billion seniorunsecured credit agreement. The agreement was amended and restated inDecember 2016 and, unless extended, will expire in December 2021.IP – Illinois Power Company, a former Ameren Corporation subsidiary thatwas merged with CIPS and CILCO to form Ameren Illinois.IPA – Illinois Power Agency, a state government agency that has broadauthority to assist in the procurement of electric power for residential andsmall commercial customers.IPH – Illinois Power Holdings, LLC, an indirect wholly owned subsidiary ofDynegy.IRS – Internal Revenue Service, a United States government agency.ISRS – Infrastructure system replacement surcharge, a cost recoverymechanism that allows Ameren Missouri to recover natural gas infrastructurereplacement costs from customers without a traditional rate proceeding.IUOE – International Union of Operating Engineers, a labor union.Kilowatthour – A measure of electricity consumption equivalent to the use of1,000 watts of power over one hour.LIUNA – Laborers’ International Union of North America, a labor union.MATS – Mercury and Air Toxics Standards, an EPA rule that limitsemissions of mercury and other air toxics from coal- and oil-fired
electric generating units.Medina Valley – AmerenEnergy Medina Valley Cogen, LLC, an AmerenCorporation subsidiary.MEEIA – Missouri Energy Efficiency Investment Act, a Missouri law thatallows electric utilities to recover costs related to MoPSC-approved customerenergy efficiency programs.MEEIA 2013 – Ameren Missouri's portfolio of customer energy efficiencyprograms, net shared benefits, and performance incentive for 2013 through2015, pursuant to the MEEIA, as approved by the MoPSC in August 2012.MEEIA 2016 – Ameren Missouri's portfolio of customer energy efficiencyprograms, throughput disincentive, and performance incentive for March2016 through February 2019, pursuant to the MEEIA, as approved by theMoPSC in February 2016.Megawatthour or MWh – One thousand kilowatthours.MGP – Manufactured gas plant.MISO – Midcontinent Independent System Operator, Inc., an RTO.Missouri Credit Agreement – Ameren's and Ameren Missouri's $1 billionsenior unsecured credit agreement. The agreement was amended and restatedin December 2016 and, unless extended, will expire in December 2021.Missouri Environmental Authority – Environmental Improvement andEnergy Resources Authority of the state of Missouri, a governmental bodyauthorized to finance environmental projects by issuing tax-exempt bonds andnotes.Mmbtu – One million Btus.Money pool – Borrowing agreements among Ameren and its subsidiaries tocoordinate and provide for certain short-term cash and working capitalrequirements.Moody’s – Moody’s Investors Service Inc., a credit rating agency.MoOPC – Missouri Office of Public Counsel.MoPSC – Missouri Public Service Commission, a state agency that regulatesMissouri utility businesses, including Ameren Missouri.MTM – Mark-to-market.MW – Megawatt.Native load – End-use retail customers whom we are obligated to serve bystatute, franchise, contract, or other regulatory requirement.NAV - Net asset value per share.NEIL – Nuclear Electric Insurance Limited, which includes all of its affiliatedcompanies.NERC – North American Electric Reliability Corporation.Net energy costs – Net energy costs, as defined in the FAC, which includefuel and purchased power costs, including transportation, net of off-systemsales. Since May 30, 2015, transmission revenues and substantially alltransmission charges are excluded from net energy costs as a result of theApril 2015 MoPSC electric rate order.Net shared benefits – Ameren Missouri's share of the present value oflifetime energy savings, net of program costs, designed to offset sales volumereductions resulting from MEEIA 2013 customer energy efficiency programs.New AER – New Ameren Energy Resources Company, LLC, a limitedliability company formed as a direct wholly owned subsidiary of AER. NewAER, acquired by IPH in December 2013, included substantially all of theassets and liabilities of AER, except for certain assets and liabilities retainedby Ameren.
2
Table of Contents
New Madrid Smelter – Aluminum smelter located in southeast Missouri thatwas owned by Noranda and is now owned by ARG International AG.NO x – Nitrogen oxides.Noranda – Noranda Aluminum, Inc.NPNS – Normal purchases and normal sales.NRC – Nuclear Regulatory Commission, a United States government agency.NSPS – New Source Performance Standards, provisions under the Clean AirAct.NSR – New Source Review provisions of the Clean Air Act, which includeNonattainment New Source Review and Prevention of SignificantDeterioration regulations.NWPA – Nuclear Waste Policy Act of 1982, as amended.NYMEX – New York Mercantile Exchange.NYSE – New York Stock Exchange, Inc.OATT – Open Access Transmission Tariff.OCI – Other comprehensive income (loss) as defined by GAAP.Off-system sales revenues – Revenues from other than native load sales,including wholesale sales.OTC – Over-the-counter.PGA – Purchased Gas Adjustment tariffs, which permit prudently incurrednatural gas costs to be recovered directly from utility customers without atraditional rate proceeding.PUHCA 2005 – The Public Utility Holding Company Act of 2005.QIP – Qualifying infrastructure plant. Costs of qualifying infrastructurenatural gas plant are included in an Ameren Illinois recovery mechanism.Rate base – The basis on which a public utility is permitted to earn an allowedrate of return. This basis is the net investment in assets used to provide utilityservice, which generally consists of in-service property, plant, and equipment,net of accumulated depreciation and accumulated deferred income taxes,inventories, and, depending on jurisdiction, construction work in progress.Regulatory lag – The exposure to differences in costs incurred and actualsales volume levels as compared with the associated amounts included incustomer rates. Rate increase requests in traditional rate case proceedings cantake up to 11 months to be acted upon by the MoPSC and the ICC. As aresult, revenue increases authorized by regulators will lag behind changingcosts and sales volume levels when based on historical periods.
Revenue requirement – The cost of providing utility service to customers,which is calculated as the sum of a utility's recoverable operating andmaintenance expenses, depreciation and amortization expense, taxes, and anallowed return on rate base.RFP – Request for proposal.Rockland Capital – Rockland Capital, LLC, together with the special-purposeentity affiliated with and formed by Rockland Capital, LLC, that acquired theElgin, Gibson City, and Grand Tower natural-gas-fired energy centers inJanuary 2014.RTO – Regional transmission organization.S&P – Standard & Poor’s Ratings Services, a credit rating agency.SEC – Securities and Exchange Commission, a United States governmentagency.SERC – SERC Reliability Corporation, one of the regional electric reliabilitycouncils organized for coordinating the planning and operation of the nation’sbulk power supply.SO 2 – Sulfur dioxide.Test year – The selected period of time, typically a 12-month period, forwhich a utility's historical or forecasted operating results are used todetermine the appropriate revenue requirement.Throughput disincentive – Ameren Missouri's reduced margin caused by thecurrent period's lower sales volume resulting from MEEIA 2016 customerenergy efficiency programs. Recovery of this disincentive is designed to makeAmeren Missouri earnings neutral each period from the lost margins causedby its MEEIA 2016 customer energy efficiency programs.UA – United Association of Plumbers and Pipefitters, a labor union.VBA – A volume balancing adjustment for Ameren Illinois' natural gasoperations. As a result of this adjustment, revenues from residential and smallnonresidential customers will increase or decrease as billing determinantsdiffer from filed amounts. This adjustment ensures that changes in salesvolumes, including deviations from normal weather conditions, do not resultin an over- or under-collection of natural gas revenues for these rate classes.
3
Table of Contents
FORWARD-LOOKING STATEMENTS
Statements in this report not based on historical facts are considered“forward-looking” and, accordingly, involve risks and uncertainties that couldcause actual results to differ materially from those discussed. Although suchforward-looking statements have been made in good faith and are based onreasonable assumptions, there is no assurance that the expected results will beachieved. These statements include (without limitation) statements as tofuture expectations, beliefs, plans, strategies, objectives, events, conditions,and financial performance. In connection with the “safe harbor” provisions ofthe Private Securities Litigation Reform Act of 1995, we are providing thiscautionary statement to identify important factors that could cause actualresults to differ materially from those anticipated. The following factors, inaddition to those discussed within Risk Factors under Part I, Item 1A, of thisreport, and elsewhere in this report and in our other filings with the SEC,could cause actual results to differ materially from management expectationssuggested in such forward-looking statements:
• regulatory, judicial, or legislative actions, including any federal incometax reform and changes in regulatory policies and ratemakingdeterminations, such as those that may result from the complaint casefiled in February 2015 with the FERC seeking a reduction in the allowedbase return on common equity under the MISO tariff, the unanimousstipulation and agreement filed with the MoPSC in February 2017 thatsettles Ameren Missouri’s July 2016 electric rate case, and futureregulatory, judicial, or legislative actions that change regulatory recoverymechanisms;
• the effect of Ameren Illinois participating in a performance-basedformula ratemaking process under the IEIMA, including the directrelationship between Ameren Illinois' return on common equity and 30-year United States Treasury bond yields, and the related financialcommitments required by the IEIMA;
• our ability to align overall spending, both operating and capital, withframeworks established by our regulators in our attempt to earn ourallowed return on equity;
• the effects of changes in federal, state, or local laws and othergovernmental actions, including monetary, fiscal, and energy policies;
• the effects of changes in federal, state, or local tax laws, regulations,interpretations, or rates and any challenges to the tax positions taken bythe Ameren Companies;
• the effects on demand for our services resulting from technologicaladvances, including advances in customer energy efficiency and privategeneration sources, which generate electricity at the site of consumptionand are becoming more cost-competitive;
• the effectiveness of Ameren Missouri's customer energy efficiencyprograms and the related revenues and performance incentives earnedunder its MEEIA plans;
• the effect of the FEJA on Ameren Illinois, including on the allowedreturn earned on its customer energy efficiency investments and itsability to achieve the electric energy efficiency saving goals establishedby the FEJA;
• the timing of increasing capital expenditure and operating
expense requirements and our ability to recover these costs in a timelymanner;
• the cost and availability of fuel, such as ultra-low-sulfur coal, natural gas,and enriched uranium used to produce electricity; the cost andavailability of purchased power and natural gas for distribution; and thelevel and volatility of future market prices for such commodities,including our ability to recover the costs for such commodities and ourcustomers' tolerance for the related rate increases;
• disruptions in the delivery of fuel, failure of our fuel suppliers to provideadequate quantities or quality of fuel, or lack of adequate inventories offuel, including ultra-low-sulfur coal used for Ameren Missouri’scompliance with environmental regulations;
• the effectiveness of our risk management strategies and our use offinancial and derivative instruments;
• the ability to obtain sufficient insurance, including insurance for AmerenMissouri’s Callaway energy center, or in the absence of insurance theability to recover uninsured losses from our customers;
• business and economic conditions, including their impact on interestrates, collection of our receivable balances, and demand for our products;
• disruptions of the capital markets, deterioration in credit metrics of theAmeren Companies, or other events that may have an adverse effect onthe cost or availability of capital, including short-term credit andliquidity;
• the actions of credit rating agencies and the effects of such actions;• the impact of adopting new accounting guidance and the application of
appropriate accounting rules and guidance;• the impact of weather conditions and other natural phenomena on us and
our customers, including the impact of system outages;• the construction, installation, performance, and cost recovery of
generation, transmission, and distribution assets;• the effects of breakdowns or failures of equipment in the operation of
natural gas transmission and distribution systems and storage facilities,such as leaks, explosions, and mechanical problems, and compliance withnatural gas safety regulations;
• the effects of our increasing investment in electric transmission projects,our ability to obtain all of the necessary approvals to complete theprojects, and the uncertainty as to whether we will achieve our expectedreturns in a timely manner;
• operation of Ameren Missouri's Callaway energy center, includingplanned and unplanned outages, and decommissioning costs;
• the effects of strategic initiatives, including mergers, acquisitions, anddivestitures;
• the impact of current environmental regulations and new, more stringent,or changing requirements, including those related to CO 2 , otheremissions and discharges, cooling water intake structures, CCR, andenergy efficiency, that are enacted over time and that could limit orterminate the operation of certain of Ameren Missouri’s energy centers,increase our costs or investment requirements, result in an
4

Table of Contents
impairment of our assets, cause us to sell our assets, reduce ourcustomers' demand for electricity or natural gas, or otherwise have anegative financial effect;
• the impact of complying with renewable energy portfolio requirements inMissouri;
• labor disputes, work force reductions, future wage and employee benefitscosts, including changes in discount rates, mortality tables, and returns onbenefit plan assets;
• the inability of our counterparties to meet their obligations with respect tocontracts, credit agreements, and financial instruments;
• the cost and availability of transmission capacity for the
energy generated by Ameren Missouri's energy centers or required tosatisfy Ameren Missouri's energy sales;
• legal and administrative proceedings;• the impact of cyber attacks, which could result in the loss of operational
control of energy centers and electric and natural gas transmission anddistribution systems and/or the loss of data, such as customer data andaccount information; and
• acts of sabotage, war, terrorism, or other intentionally disruptive acts.
New factors emerge from time to time. Management cannot predict all such factors, nor can it assess the impact of each such factor on the business or theextent to which any such factor, or combination of factors, may cause actual results to differ materially from those contained or implied in any forward-lookingstatement. Given these uncertainties, undue reliance should not be placed on these forward-looking statements. Except to the extent required by the federalsecurities laws, we undertake no obligation to update or revise publicly any forward-looking statements to reflect new information or future events.
PART I
ITEM 1. BUSINESS
GENERAL
Ameren, headquartered in St. Louis, Missouri, is a public utility holdingcompany under PUHCA 2005. Ameren was formed in 1997. Ameren’sprimary assets are its equity interests in its subsidiaries, including AmerenMissouri, Ameren Illinois, and ATXI. Ameren’s subsidiaries are separate,independent legal entities with separate businesses, assets, and liabilities.Dividends on Ameren’s common stock and the payment of expenses byAmeren depend on distributions made to it by its subsidiaries.
Below is a summary description of Ameren's principal subsidiaries.Ameren also has various other subsidiaries that conduct other activities, suchas the provision of shared services. A more detailed description can be foundin Note 1 – Summary of Significant Accounting Policies under Part II, Item 8,of this report.
• Ameren Missouri operates a rate-regulated electric generation,transmission, and distribution business and a rate-regulated natural gasdistribution business in Missouri.
• Ameren Illinois operates rate-regulated electric distribution, electrictransmission and natural gas distribution businesses in Illinois.
• ATXI operates a FERC rate-regulated electric transmission business.ATXI is developing MISO-approved electric transmission projects,including the Illinois Rivers, Spoon River, and Mark Twain projects.ATXI is also evaluating competitive electric transmission investmentopportunities outside of MISO as they arise.
The following table presents our total employees at December 31, 2016 :
Ameren Missouri 3,707Ameren Illinois 3,429Ameren Services 1,493Ameren 8,629
At December 31, 2016, the IBEW, the IUOE, the LIUNA, and the UAlabor unions collectively represented about 53% of Ameren’s total employees.They represented 63% and 58% of the employees at Ameren Missouri andAmeren Illinois, respectively. The collective bargaining agreements haveterms ranging from two and one half years to six years; they expire between2017 and 2020.
For additional information about the development of our businesses, ourbusiness operations, and factors affecting our operations and financialposition, see Management’s Discussion and Analysis of Financial Conditionand Results of Operations under Part II, Item 7, of this report and Note 1 –Summary of Significant Accounting Policies under Part II, Item 8, of thisreport.
BUSINESS SEGMENTS
In the fourth quarter of 2016, Ameren determined it had four segments:Ameren Missouri, Ameren Illinois Electric Distribution, Ameren IllinoisNatural Gas, and Ameren Transmission. The Ameren Missouri segmentincludes all of the operations of Ameren Missouri. Ameren Illinois ElectricDistribution consists of the electric distribution business of Ameren Illinois.Ameren Illinois Natural Gas consists of the natural gas business of AmerenIllinois. Ameren Transmission is primarily composed of the aggregatedelectric transmission businesses of Ameren Illinois and ATXI .
Ameren Missouri has one segment. Ameren Illinois has
5
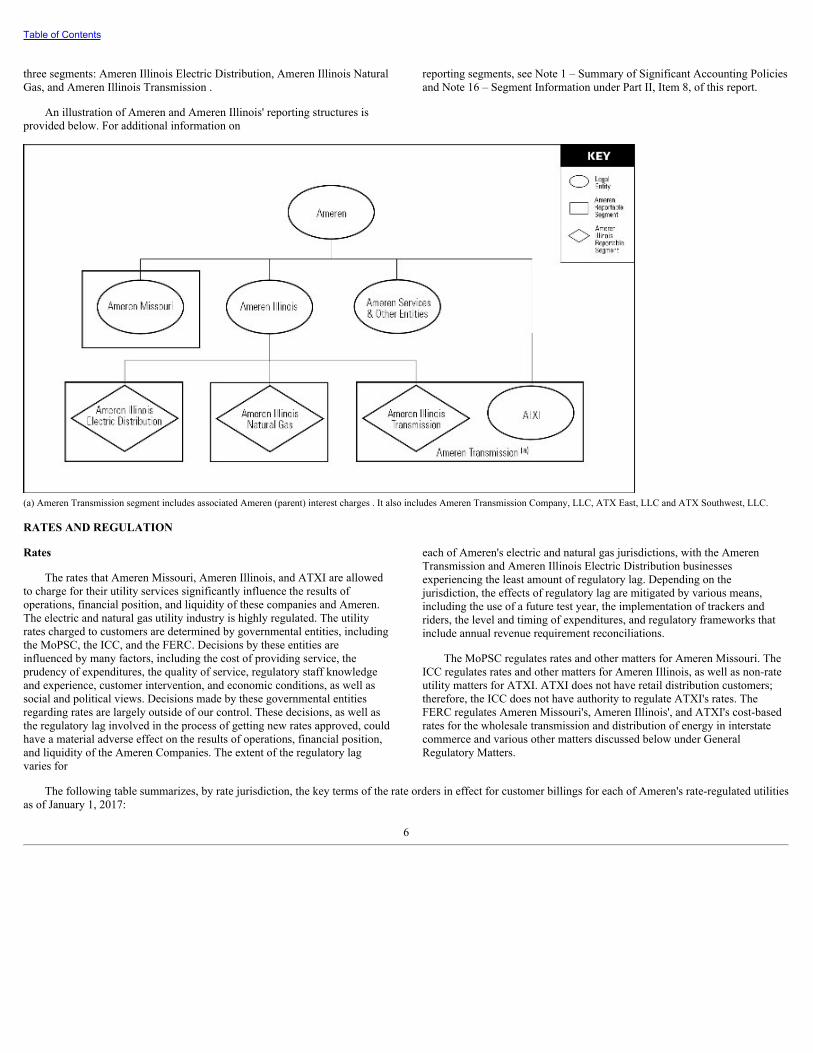
Table of Contents
three segments: Ameren Illinois Electric Distribution, Ameren Illinois NaturalGas, and Ameren Illinois Transmission .
An illustration of Ameren and Ameren Illinois' reporting structures isprovided below. For additional information on
reporting segments, see Note 1 – Summary of Significant Accounting Policiesand Note 16 – Segment Information under Part II, Item 8, of this report.
(a) Ameren Transmission segment includes associated Ameren (parent) interest charges . It also includes Ameren Transmission Company, LLC, ATX East, LLC and ATX Southwest, LLC.
RATES AND REGULATION
Rates
The rates that Ameren Missouri, Ameren Illinois, and ATXI are allowedto charge for their utility services significantly influence the results ofoperations, financial position, and liquidity of these companies and Ameren.The electric and natural gas utility industry is highly regulated. The utilityrates charged to customers are determined by governmental entities, includingthe MoPSC, the ICC, and the FERC. Decisions by these entities areinfluenced by many factors, including the cost of providing service, theprudency of expenditures, the quality of service, regulatory staff knowledgeand experience, customer intervention, and economic conditions, as well associal and political views. Decisions made by these governmental entitiesregarding rates are largely outside of our control. These decisions, as well asthe regulatory lag involved in the process of getting new rates approved, couldhave a material adverse effect on the results of operations, financial position,and liquidity of the Ameren Companies. The extent of the regulatory lagvaries for
each of Ameren's electric and natural gas jurisdictions, with the AmerenTransmission and Ameren Illinois Electric Distribution businessesexperiencing the least amount of regulatory lag. Depending on thejurisdiction, the effects of regulatory lag are mitigated by various means,including the use of a future test year, the implementation of trackers andriders, the level and timing of expenditures, and regulatory frameworks thatinclude annual revenue requirement reconciliations.
The MoPSC regulates rates and other matters for Ameren Missouri. TheICC regulates rates and other matters for Ameren Illinois, as well as non-rateutility matters for ATXI. ATXI does not have retail distribution customers;therefore, the ICC does not have authority to regulate ATXI's rates. TheFERC regulates Ameren Missouri's, Ameren Illinois', and ATXI's cost-basedrates for the wholesale transmission and distribution of energy in interstatecommerce and various other matters discussed below under GeneralRegulatory Matters.
The following table summarizes, by rate jurisdiction, the key terms of the rate orders in effect for customer billings for each of Ameren's rate-regulated utilitiesas of January 1, 2017:
6
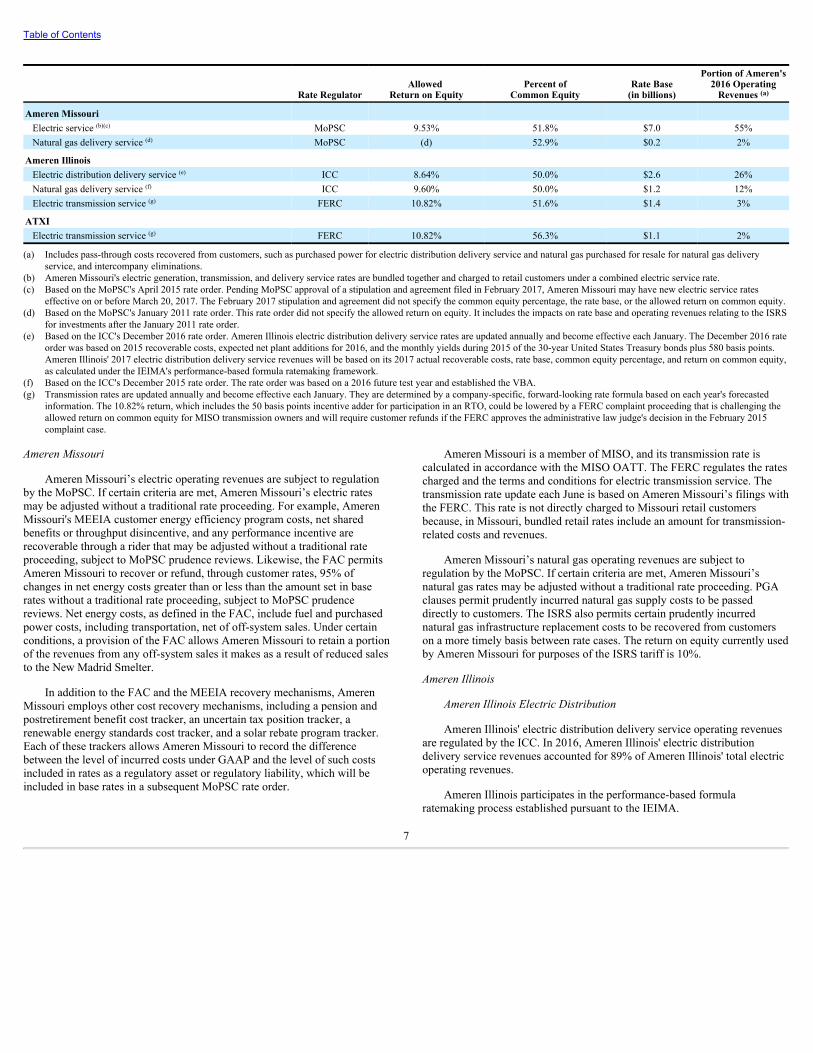
Table of Contents
Rate RegulatorAllowed
Return on EquityPercent of
Common EquityRate Base
(in billions)
Portion of Ameren's2016 Operating
Revenues (a)
Ameren Missouri Electric service (b)(c) MoPSC 9.53% 51.8% $7.0 55% Natural gas delivery service (d) MoPSC (d) 52.9% $0.2 2%
Ameren Illinois Electric distribution delivery service (e) ICC 8.64% 50.0% $2.6 26% Natural gas delivery service (f) ICC 9.60% 50.0% $1.2 12% Electric transmission service (g) FERC 10.82% 51.6% $1.4 3%
ATXI Electric transmission service (g) FERC 10.82% 56.3% $1.1 2%
(a) Includes pass-through costs recovered from customers, such as purchased power for electric distribution delivery service and natural gas purchased for resale for natural gas deliveryservice, and intercompany eliminations.
(b) Ameren Missouri's electric generation, transmission, and delivery service rates are bundled together and charged to retail customers under a combined electric service rate.(c) Based on the MoPSC's April 2015 rate order. Pending MoPSC approval of a stipulation and agreement filed in February 2017, Ameren Missouri may have new electric service rates
effective on or before March 20, 2017. The February 2017 stipulation and agreement did not specify the common equity percentage, the rate base, or the allowed return on common equity.(d) Based on the MoPSC's January 2011 rate order. This rate order did not specify the allowed return on equity. It includes the impacts on rate base and operating revenues relating to the ISRS
for investments after the January 2011 rate order.(e) Based on the ICC's December 2016 rate order. Ameren Illinois electric distribution delivery service rates are updated annually and become effective each January. The December 2016 rate
order was based on 2015 recoverable costs, expected net plant additions for 2016, and the monthly yields during 2015 of the 30-year United States Treasury bonds plus 580 basis points.Ameren Illinois' 2017 electric distribution delivery service revenues will be based on its 2017 actual recoverable costs, rate base, common equity percentage, and return on common equity,as calculated under the IEIMA's performance-based formula ratemaking framework.
(f) Based on the ICC's December 2015 rate order. The rate order was based on a 2016 future test year and established the VBA.(g) Transmission rates are updated annually and become effective each January. They are determined by a company-specific, forward-looking rate formula based on each year's forecasted
information. The 10.82% return, which includes the 50 basis points incentive adder for participation in an RTO, could be lowered by a FERC complaint proceeding that is challenging theallowed return on common equity for MISO transmission owners and will require customer refunds if the FERC approves the administrative law judge's decision in the February 2015complaint case.
Ameren Missouri
Ameren Missouri’s electric operating revenues are subject to regulationby the MoPSC. If certain criteria are met, Ameren Missouri’s electric ratesmay be adjusted without a traditional rate proceeding. For example, AmerenMissouri's MEEIA customer energy efficiency program costs, net sharedbenefits or throughput disincentive, and any performance incentive arerecoverable through a rider that may be adjusted without a traditional rateproceeding, subject to MoPSC prudence reviews. Likewise, the FAC permitsAmeren Missouri to recover or refund, through customer rates, 95% ofchanges in net energy costs greater than or less than the amount set in baserates without a traditional rate proceeding, subject to MoPSC prudencereviews. Net energy costs, as defined in the FAC, include fuel and purchasedpower costs, including transportation, net of off-system sales. Under certainconditions, a provision of the FAC allows Ameren Missouri to retain a portionof the revenues from any off-system sales it makes as a result of reduced salesto the New Madrid Smelter.
In addition to the FAC and the MEEIA recovery mechanisms, AmerenMissouri employs other cost recovery mechanisms, including a pension andpostretirement benefit cost tracker, an uncertain tax position tracker, arenewable energy standards cost tracker, and a solar rebate program tracker.Each of these trackers allows Ameren Missouri to record the differencebetween the level of incurred costs under GAAP and the level of such costsincluded in rates as a regulatory asset or regulatory liability, which will beincluded in base rates in a subsequent MoPSC rate order.
Ameren Missouri is a member of MISO, and its transmission rate is
calculated in accordance with the MISO OATT. The FERC regulates the ratescharged and the terms and conditions for electric transmission service. Thetransmission rate update each June is based on Ameren Missouri’s filings withthe FERC. This rate is not directly charged to Missouri retail customersbecause, in Missouri, bundled retail rates include an amount for transmission-related costs and revenues.
Ameren Missouri’s natural gas operating revenues are subject toregulation by the MoPSC. If certain criteria are met, Ameren Missouri’snatural gas rates may be adjusted without a traditional rate proceeding. PGAclauses permit prudently incurred natural gas supply costs to be passeddirectly to customers. The ISRS also permits certain prudently incurrednatural gas infrastructure replacement costs to be recovered from customerson a more timely basis between rate cases. The return on equity currently usedby Ameren Missouri for purposes of the ISRS tariff is 10%.
Ameren Illinois
Ameren Illinois Electric Distribution
Ameren Illinois' electric distribution delivery service operating revenuesare regulated by the ICC. In 2016, Ameren Illinois' electric distributiondelivery service revenues accounted for 89% of Ameren Illinois' total electricoperating revenues.
Ameren Illinois participates in the performance-based formularatemaking process established pursuant to the IEIMA.
7

Table of Contents
The IEIMA was designed to provide for the recovery of actual costs ofelectric delivery service that are prudently incurred and to reflect the utility'sactual regulated capital structure through a formula for calculating the returnon equity component of the cost of capital. The return on equity component ofthe formula rate is equal to the calendar year average of the monthly yields ofthe 30-year United States Treasury bonds plus 580 basis points. The IEIMAprovides for an annual reconciliation of the revenue requirement necessary toreflect the actual costs incurred in a given year with the revenue requirementincluded in customer rates for that year, including an allowed return onequity. This annual revenue requirement reconciliation adjustment will becollected from or refunded to customers within two years.
The FEJA revised certain portions of the IEIMA, including extending theIEIMA formula ratemaking process through 2022, and clarifying that acommon equity ratio of up to and including 50% is prudent. Also, beginningin 2017, the FEJA decouples electric distribution revenues established in arate proceeding from actual sales volumes by providing that any revenuechanges driven by actual electric distribution sales volumes differing fromsales volumes reflected in that year's rates will be collected from or refundedto customers within two years. This portion of the law extends beyond the endof the IEIMA in 2022. Through 2022, revenue differences will be included inthe annual IEIMA revenue requirement reconciliation. Additionally, this lawcreates a customer surcharge relating to certain nuclear energy centers locatedin Illinois that, like the cost of power purchased by Ameren Illinois on behalfof its customers, will be passed through to electric distribution customers withno effect on Ameren Illinois' earnings.
Ameren Illinois is also subject to performance standards under theIEIMA. Failure to achieve the standards would result in a reduction in thecompany's allowed return on equity calculated under the formula. Theperformance standards include improvements in service reliability to reduceboth the frequency and duration of outages, a reduction in the number ofestimated bills, a reduction of consumption on inactive meters, and areduction in uncollectible accounts expense. The IEIMA provides for returnon equity penalties totaling up to 34 basis points through 2018 and up to 38basis points in 2019 through 2022 if the performance standards are not met.
Under the IEIMA, Ameren Illinois is also subject to capital spendinglevels. Between 2012 and 2021, Ameren Illinois is required to invest a total of$625 million in capital projects to modernize its distribution systemincremental to its average annual electric distribution service capital projectsof $228 million for calendar years 2008 through 2010. Through 2016, AmerenIllinois has invested $383 million in IEIMA capital projects toward its $625million requirement.
Ameren Illinois employs cost recovery mechanisms for powerprocurement, customer energy efficiency program costs, certainenvironmental costs, and bad debt expense not recovered in base rates.Ameren Illinois also has a tariff rider to recover the costs of certain asbestos-related claims.
Ameren Illinois Natural Gas
Ameren Illinois’ natural gas operating revenues are regulated by the ICC.In December 2015, the ICC issued a rate order that approved an increase inrevenues for Ameren Illinois' natural gas delivery service based on a 2016future test year. The rate order also approved the VBA for residential andsmall nonresidential customers. If certain criteria are met, Ameren Illinois’natural gas rates may be adjusted without a traditional rate proceeding as PGAclauses permit prudently incurred natural gas costs to be passed directly tocustomers. Also, Ameren Illinois employs cost recovery mechanisms forcustomer energy efficiency program costs, certain environmental costs, andbad debt expenses not recovered in base rates.
Illinois has a law that encourages natural gas utilities to acceleratemodernization of the state's natural gas infrastructure through a QIP rider.Ameren Illinois' QIP rider allows a surcharge to be added to customers' billsto recover depreciation expenses and to earn a return on qualifying natural gasinvestments that were not previously included in base rates. Recovery beginstwo months after the natural gas investments are placed in service andcontinues until the investments are included in base rates in a future naturalgas rate order.
Ameren Illinois Transmission
Ameren Illinois' transmission operating revenues are regulated by theFERC. In 2016, Ameren Illinois' transmission service revenues accounted for11% of Ameren Illinois' electric operating revenues. See AmerenTransmission below for additional information regarding Ameren Illinois'transmission business.
Ameren Transmission
Ameren Transmission is primarily composed of the aggregated electrictransmission businesses of Ameren Illinois and ATXI. Both Ameren Illinoisand ATXI are members of MISO; their transmission rates are calculated inaccordance with the MISO OATT. The FERC-allowed return on commonequity for MISO transmission owners of 12.38% was challenged by customergroups in two complaint cases filed in November 2013 and in February 2015.In September 2016, the FERC issued a final order in the November 2013complaint case, which lowered the allowed base return on common equity to10.32%, or a 10.82% total return on common equity with the inclusion of the50 basis point adder for participation in an RTO. This September 2016 orderrequired the issuance of customer refunds, with interest, for the 15-monthperiod ended February 2015. The refunds are expected to be issued in the firsthalf of 2017. The new allowed return on common equity is reflected in ratesprospectively from the September 2016 effective date of the order. In June2016, an administrative law judge issued an initial decision in the February2015 complaint case, which if approved by FERC, would lower the allowedbase return on common equity to 9.70%, or a 10.20% total return on equitywith the inclusion of the 50 basis point incentive adder for participation in anRTO. It would also require the issuance of customer refunds, with interest, forthe 15-month period ended May 2016. The FERC is
8
Table of Contents
expected to issue a final order in the February 2015 complaint case in thesecond quarter of 2017. That final order will determine the allowed return oncommon equity for the 15-month period ended May 2016. That final orderwill also establish the allowed return on common equity that will applyprospectively from its expected second quarter 2017 effective date, replacingthe current 10.82% total return on common equity, which became effective inSeptember 2016.
Ameren Illinois and ATXI have received FERC approval to use acompany-specific, forward-looking rate formula framework in setting theirtransmission rates. These forward-looking rates are updated each January withforecasted information. A reconciliation during the year, which adjusts for theactual revenue requirement and actual sales volumes, is used to adjust billingrates in a subsequent year. Ameren Illinois Transmission earns revenue fromtransmission service provided to Ameren Illinois Electric Distribution. Thetransmission expense for Illinois customers who have elected to purchasetheir power from Ameren Illinois is recovered through a cost recoverymechanism with no net effect on Ameren Illinois Electric Distributionearnings, as costs are offset by corresponding revenues. Transmissionrevenues from these transactions are reflected at Ameren Transmission andAmeren Illinois Transmission.
The FERC has approved transmission rate incentives relating to the threeMISO-approved multi-value projects discussed below, which allowconstruction work in progress to be included in rate base, thereby improvingthe timeliness of cash recovery.
The three MISO-approved multi-value projects are primarily beingdeveloped by ATXI and are referred to as the Illinois Rivers, Spoon River,and Mark Twain projects. The Illinois Rivers project involves the constructionof a 345-kilovolt line from western Indiana across Illinois to eastern Missouri.ATXI has obtained a certificate of public convenience and necessity andproject approvals from the ICC and the MoPSC for each state's portion of theIllinois Rivers project. The last section of this project is expected to becompleted in 2019. The Spoon River project is located in northwest Illinois.The Mark Twain project is located in northeast Missouri. In 2015, ATXIobtained a certificate of public convenience and necessity and projectapproval from the ICC for the Spoon River project and construction activitiesare continuing on schedule. In April 2016, the MoPSC granted ATXI acertificate of convenience and necessity for the Mark Twain project. Beforestarting construction, ATXI must obtain assents for road crossings from thefive counties where the line will be constructed. None of the five countycommissions have approved ATXI’s requests for the assents. In October2016, ATXI filed suit in each of the five county circuit courts to obtain theassents. A decision in each of the five lawsuits is expected in 2017. ATXIplans to complete the Spoon River project in 2018 and the Mark Twainproject in 2019; however, further delays in obtaining the consents could delaythe completion date of the Mark Twain project. ATXI's total investment in thethree projects is expected to be more than $1.6 billion.
For additional information on Ameren Missouri, Ameren
Illinois, and ATXI rate matters, including the FERC complaint casechallenging the allowed return on common equity for MISO transmissionowners, see Results of Operations and Outlook in Management’s Discussionand Analysis of Financial Condition and Results of Operations under Part II,Item 7, Quantitative and Qualitative Disclosures About Market Risk underPart II, Item 7A, and Note 2 – Rate and Regulatory Matters under Part II,Item 8, of this report.
General Regulatory Matters
Ameren Missouri, Ameren Illinois, and ATXI must receive FERCapproval to enter into various transactions, such as issuing short-term debtsecurities and conducting certain acquisitions, mergers, and consolidationsinvolving electric utility holding companies. In addition, Ameren Missouri,Ameren Illinois, and ATXI must receive authorization from the applicablestate public utility regulatory agency to issue stock and long-term debtsecurities (with maturities of more than 12 months) and to conduct mergers,affiliate transactions, and various other activities.
Ameren Missouri, Ameren Illinois, and ATXI are also subject tomandatory reliability standards, including cybersecurity standards adopted bythe FERC, to ensure the reliability of the bulk power electric system. Thesestandards are developed and enforced by NERC pursuant to authoritydelegated to it by the FERC. If Ameren Missouri, Ameren Illinois, or ATXIare determined not to be in compliance with any of these mandatory reliabilitystandards, they could incur substantial monetary penalties and other sanctions.
Under PUHCA 2005, the FERC and any state public utility regulatoryagency may access books and records of Ameren and its subsidiaries that aredetermined to be relevant to costs incurred by Ameren’s rate-regulatedsubsidiaries that may affect jurisdictional rates. PUHCA 2005 also permits theMoPSC and the ICC to request that the FERC review cost allocations byAmeren Services to other Ameren companies.
Operation of Ameren Missouri’s Callaway energy center is subject toregulation by the NRC. The license for the Callaway energy center expires in2044. Ameren Missouri’s Osage hydroelectric energy center and Taum Saukpumped-storage hydroelectric energy center, as licensed projects under theFederal Power Act, are subject to FERC regulations affecting, among otheraspects, the general operation and maintenance of the projects. The license forthe Osage hydroelectric energy center expires in 2047. The license for theTaum Sauk pumped-storage hydroelectric energy center expires in 2044.Ameren Missouri’s Keokuk energy center and its dam in the MississippiRiver between Hamilton, Illinois, and Keokuk, Iowa, are operated underauthority granted by an Act of Congress in 1905.
For additional information on regulatory matters, see Note 2 – Rate andRegulatory Matters, Note 10 – Callaway Energy Center, and Note 15 –Commitments and Contingencies under Part II, Item 8, of this report.
Environmental Matters
9
Table of Contents
Certain of our operations are subject to federal, state, and localenvironmental statutes and regulations relating to the safety and health ofpersonnel, the public, and the environment. These environmental statutes andregulations include requirements relating to identification, generation, storage,handling, transportation, disposal, recordkeeping, labeling, reporting, andemergency response in connection with hazardous and toxic materials; safetyand health standards; and environmental protection requirements, includingstandards and limitations relating to the discharge of air and water pollutantsand the management of waste and byproduct materials. Failure to complywith these statutes or regulations could have material adverse effects on us.We could be subject to criminal or civil penalties by regulatory agencies, orwe could be ordered by the courts to pay private parties. Except as indicatedin this report, we believe that we are in material compliance with existingstatutes and regulations that currently apply to our operations.
The EPA has promulgated environmental regulations that have asignificant impact on the electric utility industry. Over time, compliance withthese regulations could be costly for Ameren Missouri, which operates coal-fired power plants. As of December 31, 2016, Ameren Missouri’s fossil-fueled energy centers represented 18% and 34% of Ameren’s and AmerenMissouri’s rate base, respectively. Regulations impacting the electric utilityindustry include the regulation of CO 2 emissions from existing power plantsthrough the Clean Power Plan and from new power plants through the revisedNSPS; the CSAPR, which requires further reductions of SO 2 emissions andNO x emissions from power plants; a regulation governing management andstorage of CCR; the MATS, which requires reduction of emissions ofmercury, toxic metals, and acid gases from power plants; revised NSPS forparticulate matter, SO 2 , and NO x emissions from new sources; effluentstandards applicable to wastewater discharges from power plants; andregulations under the Clean Water Act that could require significant capitalexpenditures, such as modifications to water intake structures at AmerenMissouri’s energy centers. The EPA also periodically reviews and revisesnational ambient air quality standards, including those standards associatedwith emissions from power plants, such as particulate matter, ozone, SO 2 andNO x . Certain of these regulations are being or are likely to be challengedthrough litigation, so their ultimate implementation, as well as the timing ofany such implementation, is uncertain. Although many details of futureregulations are unknown, the individual or combined effects of recentenvironmental regulations could result in significant capital expenditures andincreased operating costs for Ameren and Ameren Missouri. Compliance withthese environmental laws and regulations could be prohibitively expensive,result in the closure or alteration of the operation of some of AmerenMissouri’s energy centers, or require further capital investment. Ameren andAmeren Missouri expect that these costs would be recoverable through rates,subject to MoPSC prudence review, but the nature and timing of costs andtheir recovery could result in regulatory lag. These environmental regulationscould also affect the availability of, the cost of, and the demand for power andnatural gas that is acquired for Ameren Missouri's natural gas customers andAmeren Illinois' electric and natural gas customers.
For additional discussion of environmental matters, including NO x and
SO 2 emission reduction requirements, reductions to CO 2 emissions,wastewater discharge standards, remediation efforts, CCR managementregulations, and a discussion of the EPA’s allegations of violations of theClean Air Act and Missouri law in connection with projects at AmerenMissouri's Rush Island energy center, see Note 15 – Commitments andContingencies under Part II, Item 8, of this report.
TRANSMISSION
Ameren owns an integrated transmission system that is composed of thetransmission assets of Ameren Missouri, Ameren Illinois, and ATXI. Amerenalso operates two balancing authority areas: AMMO and AMIL. During 2016,the peak demand was 7,681 megawatts in AMMO and 8,868 megawatts inAMIL. The Ameren transmission system directly connects with 15 otherbalancing authority areas for the exchange of electric energy.
Ameren Missouri, Ameren Illinois, and ATXI are transmission-owningmembers of MISO. Ameren Missouri is authorized by the MoPSC toparticipate in MISO through May 2018. In 2017, Ameren Missouri expects tofile a study required by MoPSC, as it has done periodically since it joinedMISO, that evaluates the costs and benefits of Ameren Missouri's continuedparticipation in MISO beyond May 2018.
Ameren Missouri, Ameren Illinois, and ATXI are members of the SERC.The SERC is responsible for ensuring the reliable operation of the bulkelectric power system in all or portions of 16 central and southeastern states.Owners and operators, including the Ameren Companies, of the bulk electricpower system are subject to mandatory reliability standards promulgated bythe NERC and its regional entities, such as the SERC, which are all enforcedby the FERC.
SUPPLY OF ELECTRIC POWER
Ameren Missouri
Ameren Missouri’s electric supply is primarily generated from its energycenters. Factors that could cause Ameren Missouri to purchase power include,among other things, energy center outages, the fulfillment of renewableenergy portfolio requirements, the failure of suppliers to meet their powersupply obligations, extreme weather conditions, the availability of power at acost lower than its generation cost, and absence of sufficient ownedgeneration.
Ameren Missouri continues to evaluate its longer-term needs for newgenerating capacity. The potential need for new energy center construction isdependent on several key factors, including continuation of, and customerparticipation in, energy efficiency programs and distributed generation, loadgrowth, technological advancements, costs of generation alternatives,environmental regulation of coal-fired power plants, and state renewableportfolio standards, which could lead to the retirement of current baseloadassets or alterations in the manner in which those assets operate. Because ofthe significant time required to plan, acquire permits for, and build a baseloadenergy center,
10
Table of Contents
Ameren Missouri continues to study alternatives and to take steps to preserveoptions to meet future demand. Steps include evaluating the potential foradditional customer energy efficiency programs and options for renewableenergy generation, and maintaining options for natural-gas-fired generation tofurther diversify Ameren Missouri's generation portfolio.
Ameren Missouri files a nonbinding integrated resource plan with theMoPSC every three years and will file its next plan in 2017. AmerenMissouri's integrated resource plan filed with the MoPSC in October 2014,prior to the issuance of the Clean Power Plan, was a 20-year plan thatsupported a more diverse energy portfolio in Missouri, including coal, solar,wind, natural gas, hydro, and nuclear power. The plan involves expandingrenewable generation, retiring coal-fired generation as those energy centersreach the end of their useful lives, expanding customer energy efficiencyprograms, and adding natural-gas-fired combined cycle generation.
See also Outlook in Management’s Discussion and Analysis of FinancialCondition and Results of Operations under Part II, Item 7, Note 2 – Rate andRegulatory Matters, Note 10 – Callaway Energy Center, and Note 15 –Commitments and Contingencies under Part II, Item 8, of this report.
Ameren Illinois
In Illinois, electric transmission and distribution service rates areregulated, but power supply prices are not regulated. Although electriccustomers are allowed to purchase power from an alternative retail electricsupplier, Ameren Illinois is required to serve as the provider of last resort forits electric distribution customers. In 2016, Ameren Illinois supplied powerfor 23% of its kilowatthour sales. Power purchased by Ameren Illinois for itselectric distribution customers who do not elect to purchase their power froman alternative retail electric supplier comes either through procurementprocesses conducted by the IPA or through markets operated by MISO. TheIPA administers an RFP process through which Ameren Illinois procures itsexpected supply obligation. The power and related procurement costs incurredby Ameren Illinois are passed directly to its electric distribution customersthrough a cost recovery mechanism and are reflected in the Ameren IllinoisElectric Distribution's results of operations, but do not affect Ameren IllinoisElectric Distribution's earnings as any cost is offset by a correspondingrevenue. Ameren Illinois charges transmission and distribution service rates toelectric distribution customers who purchase electricity from alternative retailelectric suppliers, which does affect Ameren Illinois Electric Distribution'searnings.
See Note 14 – Related Party Transactions and Note 15 – Commitmentsand Contingencies under Part II, Item 8, of this report for additionalinformation on power procurement in Illinois.
POWER GENERATION
Ameren Missouri owns energy centers that rely on a diverse fuelportfolio, including coal (Ameren Missouri's primary fuel source), nuclear,and natural gas, as well as renewable sources of generation, which includehydroelectric, methane gas, and
solar. All of Ameren Missouri's coal-fired energy centers were constructedprior to 1978. The Callaway nuclear energy center began operation in 1984.As of December 31, 2016, Ameren Missouri's fossil-fueled energy centersrepresented 18% and 34% of Ameren's and Ameren Missouri's rate base,respectively. See Item 2 – Properties under Part I of this report forinformation regarding Ameren Missouri's electric generation energy centers.
Coal
Ameren Missouri has an ongoing need for coal as fuel for generation, soit pursues a price-hedging strategy consistent with this requirement. AmerenMissouri has agreements in place to purchase and transport coal to its energycenters. As of December 31, 2016 , Ameren Missouri had price-hedged itsexpected coal supply and coal transportation requirements for generation in2017. Ameren Missouri has additional coal supply under contract through2020. The coal transport agreements that Ameren Missouri has with UnionPacific Railroad and Burlington Northern Santa Fe Railway are currently setto expire at the end of 2019. Ameren Missouri burned 17 million tons of coalin 2016.
About 98% of Ameren Missouri’s coal is purchased from the PowderRiver Basin in Wyoming. The remaining coal is typically purchased from theIllinois Basin. Inventories may be adjusted because of generation levels oruncertainties of supply due to potential work stoppages, delays in coaldeliveries, equipment breakdowns, and other factors. Deliveries from thePowder River Basin have occasionally been restricted because of railcongestion and maintenance, derailments, and weather. As of December 31,2016 , coal inventories for Ameren Missouri were near targeted levels.Disruptions in coal deliveries could cause Ameren Missouri to pursue astrategy that could include reducing sales of power during low-marginperiods, buying higher-cost fuels to generate required electricity, andpurchasing power from other sources.
Nuclear
The production of nuclear fuel involves the mining and milling ofuranium ore to produce uranium concentrates, the conversion of uraniumconcentrates to uranium hexafluoride gas, the enrichment of that gas, theconversion of the enriched uranium hexafluoride gas into uranium dioxidefuel pellets, and the fabrication into fuel assemblies. Ameren Missouri hasentered into uranium, uranium conversion, uranium enrichment, andfabrication contracts to procure the fuel supply for its Callaway nuclearenergy center.
The Callaway energy center requires refueling at 18-month intervals. Thelast refueling was completed in May 2016. The next refueling will be in fall2017. As of December 31, 2016, Ameren Missouri has agreements orinventories to price-hedge 97% of Callaway's fall 2017 refuelingrequirements. Ameren Missouri has inventories and supply contractssufficient to meet all of its uranium (concentrate and hexafluoride),conversion, and enrichment requirements at least through the 2020 refueling.Ameren Missouri has f uel fabrication service contracts through at least 2022.
11
Table of Contents
Natural Gas Supply for Generation
To maintain deliveries to natural-gas-fired energy centers throughout theyear, especially during the summer peak demand, Ameren Missouri’sportfolio of natural gas supply resources includes firm transportation capacityand firm no-notice storage capacity leased from interstate pipelines. AmerenMissouri primarily uses the interstate pipeline systems of Panhandle EasternPipe Line Company, Trunkline Gas Company, Natural Gas Pipeline Companyof America, and Mississippi River Transmission Corporation to transportnatural gas to energy centers. In addition to physical transactions, AmerenMissouri uses financial instruments, including some in the NYMEX futuresmarket and some in the OTC financial markets, to hedge the price paid fornatural gas.
Ameren Missouri’s natural gas procurement strategy is designed toensure reliable and immediate delivery of natural gas to its energy centers.This strategy is accomplished by optimizing transportation and storageoptions and by minimizing cost and price risk through various supply andprice-hedging agreements that allow access to multiple natural gas pools,supply basins, and storage services. As of December 31, 2016 , AmerenMissouri had price-hedged about 21% of its expected natural gas supplyrequirements for generation in 2017.
Renewable Energy
The states of Illinois and Missouri have enacted laws requiring electricutilities to include renewable energy resources in their portfolios.
Illinois required renewable energy resources to equal or exceed 2% of thetotal electricity that Ameren Illinois supplied to its eligible retail customers asof June 1, 2008, with that percentage increasing to 13% by June 1, 2017. Forthe 2016 plan year, Ameren Illinois met its requirement that 11.5% of its totalelectricity for eligible retail customers be procured from renewable energyresources. Starting June 1, 2017, after a transition period, Ameren Illinois willbe required to procure renewable energy resources for all of its electricdistribution customers, regardless if Ameren Illinois or an alternative retailelectric supplier provides power to customers. This requirement will besatisfied through future IPA procurement events.
The FEJA requires Ameren Illinois to offer distributed generation rebatesfor all classes of customers, including customers who share common solarfacilities through a subscription arrangement. The cost of the rebates will berecorded as a regulatory asset, which will be included in rate base and earn areturn based on the utility’s weighted average cost of capital. Customers withdistributed generation will also be eligible for net metering provisions, subjectto certain customer participation levels. Beginning in 2017, the FEJAdecouples electric distribution revenues established in a rate proceeding fromactual sales volumes, which ensures that Ameren Illinois’ earnings will not beharmed by a reduction in sales volumes.
In Missouri, utilities are required to purchase or generate electricity equalto at least 2% of native load sales from
renewable sources beginning in 2011, with that percentage increasing to atleast 15% by 2021, subject to a 1% annual limit on customer rate impacts. Atleast 2% of each renewable energy portfolio requirement must be derivedfrom solar energy. In 2016, Ameren Missouri met its requirement to purchaseor generate at least 5% of its native load sales from renewable energyresources. Ameren Missouri expects to satisfy the nonsolar requirement into2018 with its Keokuk energy center, and its Maryland Heights energy centerand through a 102-megawatt power purchase agreement with a wind farmoperator. The Maryland Heights energy center generates electricity byburning methane gas collected from a landfill. Ameren Missouri is meetingthe solar energy requirement by purchasing solar-generated renewable energycredits from customer-installed systems and by generating its own solarenergy at the O'Fallon energy center and at its headquarters building.
Energy Efficiency
Ameren Missouri and Ameren Illinois have implemented energyefficiency programs to educate and help their customers become moreefficient users of energy. In Missouri, the MEEIA established a regulatoryframework that, among other things, allows electric utilities to recover costsrelated to MoPSC-approved customer energy efficiency programs. The lawrequires the MoPSC to ensure that a utility’s financial incentives are alignedto help customers use energy more efficiently, to provide timely costrecovery, and to provide earnings opportunities associated with cost-effectiveenergy efficiency programs. Missouri does not have a law mandating energyefficiency standards.
From 2013 through 2015, Ameren Missouri invested $134 million incustomer energy efficiency programs and realized $174 million of net sharedbenefits under the MEEIA 2013 performance plan approved in August 2012.
In February 2016, the MoPSC issued an order approving AmerenMissouri's MEEIA 2016 plan, which included a portfolio of customer energyefficiency programs along with a rider to collect the program costs, thethroughput disincentive, and any performance incentive earned fromcustomers. The throughput disincentive recovery will replace the net sharedbenefits that were collected under the MEEIA 2013 plan. The MEEIA riderwill allow Ameren Missouri to collect the throughput disincentive without atraditional rate proceeding, until lower volumes resulting from the MEEIAprograms are reflected in base rates. Customer rates, based upon bothforecasted program costs and throughput disincentive, will be reconciledannually to actual results. Ameren Missouri intends to invest $158 million inMEEIA 2016 customer energy efficiency programs. In addition, similar to theMEEIA 2013 plan that ended in December 2015, the MoPSC's orderapproved a performance incentive that would provide Ameren Missouri anopportunity to earn additional revenues by achieving certain MEEIA 2016customer energy efficiency goals, including $27 million if 100% of the goalsare achieved during the three-year period. Ameren Missouri can earn more ifits energy savings exceed those goals. Ameren Missouri must achieve at least25%
12
Table of Contents
of its energy efficiency goals before it earns a MEEIA 2016 performanceincentive.
State law requires Ameren Illinois to offer customer energy efficiencyprograms. The ICC has issued orders approving Ameren Illinois’ electric andnatural gas energy efficiency plans, as well as mechanisms by which programcosts can be recovered from customers. For the 12-month period ending May31, 2016, the ICC authorized electric and natural gas energy efficiencyprogram expenditures of $87 million and $16 million, respectively.Additionally, as part of its IEIMA capital project investments, Ameren Illinoisexpects to invest $438 million in smart-grid infrastructure from 2012 to 2021,including smart meters that enable customers to improve their energyefficiency.
Historically, Ameren Illinois has recovered the cost of its energyefficiency programs as they were incurred. Beginning as early as June 2017,the FEJA will allow Ameren Illinois to earn a return on its electric energyefficiency program investments. Ameren Illinois electric energy efficiencyinvestments will be deferred as a regulatory asset and will earn a return at thecompany’s weighted average cost of capital, with the equity return based onthe monthly average yield of the 30-year United States Treasury bonds plus580 basis points. The equity portion of Ameren Illinois’ return on electricenergy efficiency investments can also be increased or decreased by 200 basispoints based on the achievement of annual energy savings goals. The FEJAincreased the level of electric energy efficiency saving targets through 2030.Based on a formula provided in the act, Ameren Illinois estimates it canannually invest up to $100 million from 2018 through 2021, up to $107million annually from 2022 through 2025, and up to $114 million annuallyfrom 2026 through 2030. The ICC has the ability to lower the electric energyefficiency saving goals if there are insufficient cost effective measuresavailable. The electric energy efficiency program investments and the returnon those investments will be recovered through a rider, and will not beincluded in the IEIMA formula rate process.
NATURAL GAS SUPPLY FOR DISTRIBUTION
Ameren Missouri and Ameren Illinois are responsible for the purchaseand delivery of natural gas to their customers. Ameren Missouri and AmerenIllinois each develop and manage a portfolio of natural gas supply resources.These resources include firm natural gas supply under term agreements withproducers, interstate and intrastate firm transportation capacity, firm no-noticestorage capacity leased from interstate pipelines, and on-system storagefacilities to maintain natural gas deliveries to customers throughout the year,and especially during peak demand periods. Ameren Missouri and AmerenIllinois primarily use Panhandle Eastern Pipe Line Company, Trunkline GasCompany, Natural Gas Pipeline Company of America, Mississippi RiverTransmission Corporation, Northern Border Pipeline Company, and TexasEastern Transmission Corporation interstate pipeline systems to transportnatural gas to their systems. In addition to transactions requiring physicaldelivery, certain financial instruments, including those entered into in theNYMEX futures market and in the OTC financial markets, are
used to hedge the price paid for natural gas. Natural gas purchase costs arepassed on to customers of Ameren Missouri and Ameren Illinois under PGAclauses, subject to prudence reviews by the MoPSC and the ICC. As ofDecember 31, 2016 , Ameren Missouri and Ameren Illinois had price-hedged73% and 77%, respectively, of their expected 2017 natural gas supplyrequirements.
For additional information on our fuel and purchased power supply, seeResults of Operations and Liquidity and Capital Resources in Management’sDiscussion and Analysis of Financial Condition and Results of Operationsunder Part II, Item 7, of this report. Also see Note 1 – Summary of SignificantAccounting Policies, Note 7 – Derivative Financial Instruments, Note 14 –Related Party Transactions, and Note 15 – Commitments and Contingenciesunder Part II, Item 8 of this report.
INDUSTRY ISSUES
We are facing issues common to the electric and natural gas utilityindustry. These issues include:
• political, regulatory, and customer resistance to higher rates;• the potential for changes in laws, regulations, enforcement efforts, and
policies at the state and federal levels;• potential changes to corporate income tax law including any federal
income tax reform;• cybersecurity risks, including loss of operational control of energy
centers and electric and natural gas transmission and distribution systemsand/or loss of data, such as utility customer data and account information;
• the potential for more intense competition in generation, supply, anddistribution, including new technologies and their declining costs;
• net metering rules and other changes in existing regulatory frameworksand recovery mechanisms to address the allocation of costs to customerswho own generation resources that enable them both to sell power to usand to purchase power from us through the use of our transmission anddistribution assets;
• legislation or programs to encourage or mandate energy efficiency andrenewable sources of power, such as solar, and the lack of consensus asto who should pay for those programs;
• pressure on customer growth and usage in light of economic conditionsand energy efficiency initiatives;
• changes in the structure of the industry as a result of changes in federaland state laws, including the formation and growth of independenttransmission entities;
• a further expected reduction in the allowed return on common equity onFERC-regulated electric transmission assets;
• the availability of fuel and fluctuations in fuel prices;• the availability of a skilled workforce, including retaining the specialized
skills of those who are nearing retirement;• regulatory lag;• the influence of macroeconomic factors, such as yields on United States
Treasury securities and allowed rates of return
13

Table of Contents
on equity provided by regulators;• higher levels of infrastructure investments that are expected to result in
negative or decreased free cash flow, defined as cash flows fromoperating activities less cash flows from investing activities anddividends paid;
• public concerns about the siting of new facilities;• complex new and proposed environmental laws, regulations, and
requirements, including air and water quality standards, mercuryemissions standards, CCR management requirements, and CO 2limitations, which may reduce the frequency at which electric generatingunits are dispatched based upon their CO 2 emissions;
• public concerns about the potential environmental impacts from thecombustion of fossil fuels and some investors' concerns about investingin energy companies that have fossil-fueled generation assets;
• aging infrastructure and the need to construct new power
generation, transmission, and distribution facilities, which have long timeframes for completion, with limited long-term ability to predict powerand commodity prices and regulatory requirements;
• public concerns about nuclear generation, decommissioning and thedisposal of nuclear waste; and
• consolidation of electric and natural gas utility companies.
We are monitoring these issues. Except as otherwise noted in this report,we are unable to predict what impact, if any, these issues will have on ourresults of operations, financial position, or liquidity. For additionalinformation, see Risk Factors under Part I, Item 1A, Outlook inManagement’s Discussion and Analysis of Financial Condition and Results ofOperations under Part II, Item 7, Note 2 – Rate and Regulatory Matters, Note10 – Callaway Energy Center, and Note 15 – Commitments andContingencies under Part II, Item 8, of this report.
14
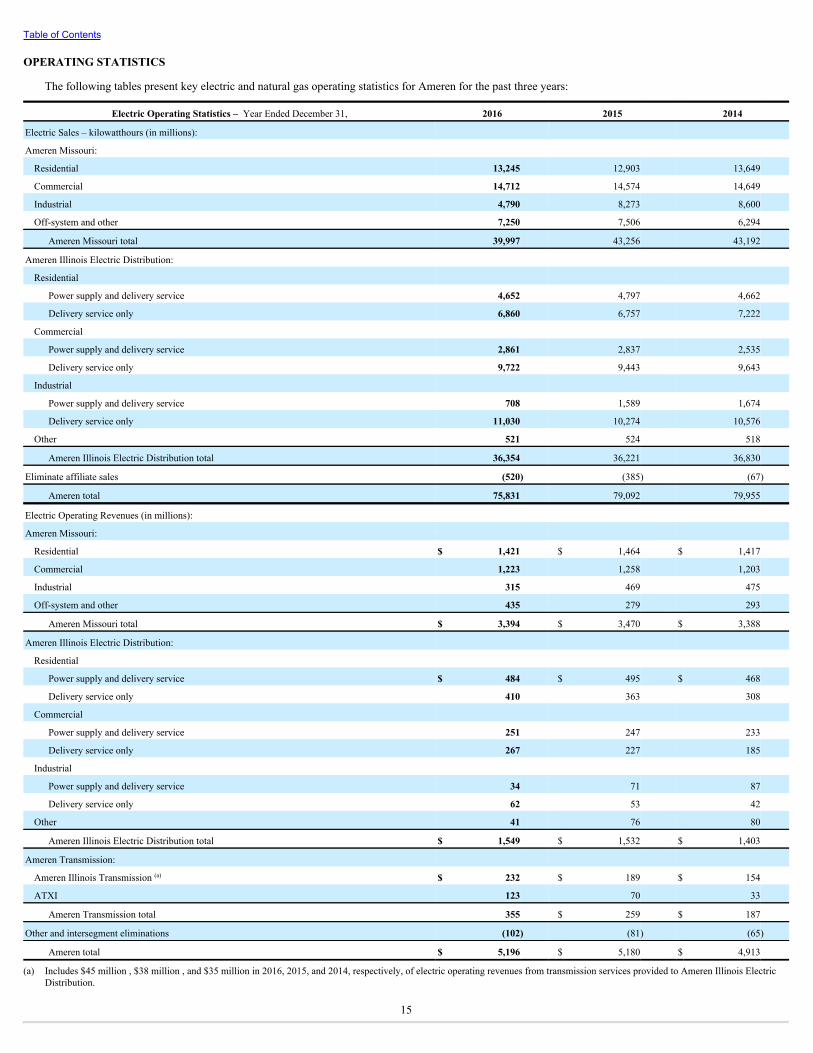
Table of Contents
OPERATING STATISTICS
The following tables present key electric and natural gas operating statistics for Ameren for the past three years:
Electric Operating Statistics – Year Ended December 31, 2016 2015 2014
Electric Sales – kilowatthours (in millions):
Ameren Missouri:
Residential 13,245 12,903 13,649
Commercial 14,712 14,574 14,649
Industrial 4,790 8,273 8,600
Off-system and other 7,250 7,506 6,294
Ameren Missouri total 39,997 43,256 43,192
Ameren Illinois Electric Distribution:
Residential
Power supply and delivery service 4,652 4,797 4,662
Delivery service only 6,860 6,757 7,222
Commercial
Power supply and delivery service 2,861 2,837 2,535
Delivery service only 9,722 9,443 9,643
Industrial
Power supply and delivery service 708 1,589 1,674
Delivery service only 11,030 10,274 10,576
Other 521 524 518
Ameren Illinois Electric Distribution total 36,354 36,221 36,830
Eliminate affiliate sales (520) (385) (67)
Ameren total 75,831 79,092 79,955
Electric Operating Revenues (in millions):
Ameren Missouri:
Residential $ 1,421 $ 1,464 $ 1,417
Commercial 1,223 1,258 1,203
Industrial 315 469 475
Off-system and other 435 279 293
Ameren Missouri total $ 3,394 $ 3,470 $ 3,388
Ameren Illinois Electric Distribution:
Residential
Power supply and delivery service $ 484 $ 495 $ 468
Delivery service only 410 363 308
Commercial
Power supply and delivery service 251 247 233
Delivery service only 267 227 185
Industrial
Power supply and delivery service 34 71 87
Delivery service only 62 53 42
Other 41 76 80
Ameren Illinois Electric Distribution total $ 1,549 $ 1,532 $ 1,403
Ameren Transmission:
Ameren Illinois Transmission (a) $ 232 $ 189 $ 154
ATXI 123 70 33
Ameren Transmission total 355 $ 259 $ 187
Other and intersegment eliminations (102) (81) (65)
Ameren total $ 5,196 $ 5,180 $ 4,913
(a) Includes $45 million , $38 million , and $35 million in 2016, 2015, and 2014, respectively, of electric operating revenues from transmission services provided to Ameren Illinois ElectricDistribution.
15
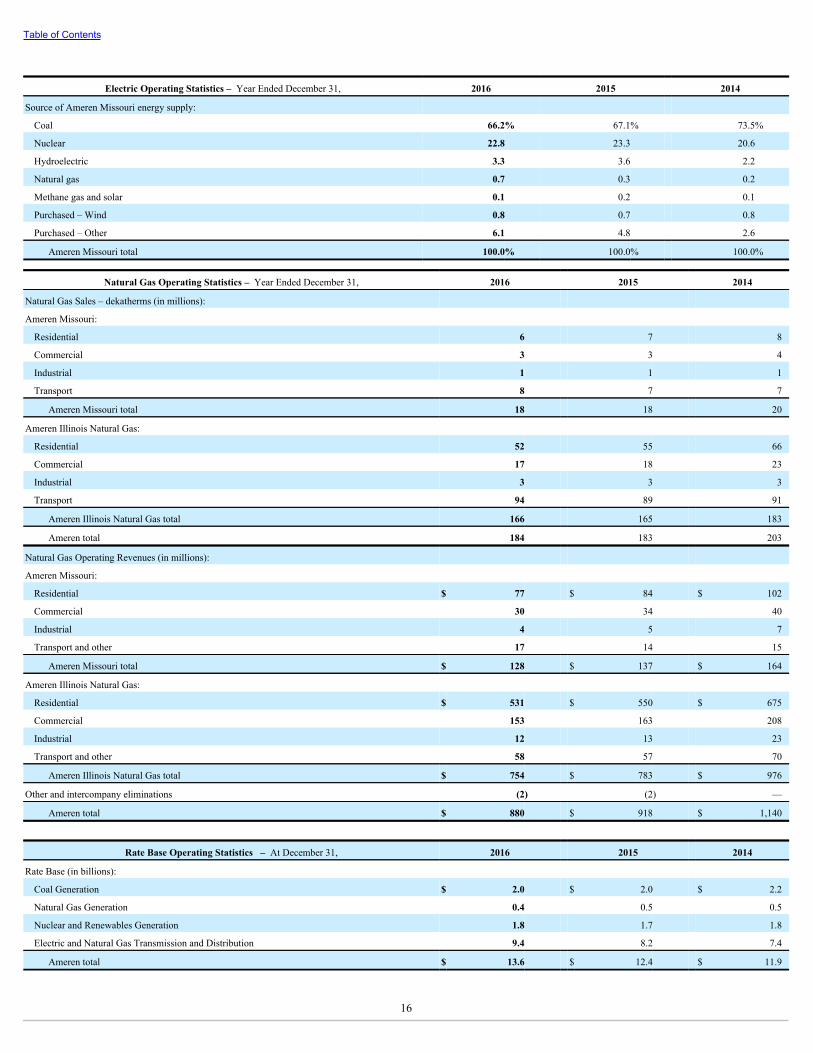
Table of Contents
Electric Operating Statistics – Year Ended December 31, 2016 2015 2014
Source of Ameren Missouri energy supply:
Coal 66.2% 67.1% 73.5%
Nuclear 22.8 23.3 20.6
Hydroelectric 3.3 3.6 2.2
Natural gas 0.7 0.3 0.2
Methane gas and solar 0.1 0.2 0.1
Purchased – Wind 0.8 0.7 0.8
Purchased – Other 6.1 4.8 2.6
Ameren Missouri total 100.0% 100.0% 100.0%
Natural Gas Operating Statistics – Year Ended December 31, 2016 2015 2014
Natural Gas Sales – dekatherms (in millions):
Ameren Missouri:
Residential 6 7 8
Commercial 3 3 4
Industrial 1 1 1
Transport 8 7 7
Ameren Missouri total 18 18 20
Ameren Illinois Natural Gas:
Residential 52 55 66
Commercial 17 18 23
Industrial 3 3 3
Transport 94 89 91
Ameren Illinois Natural Gas total 166 165 183
Ameren total 184 183 203
Natural Gas Operating Revenues (in millions):
Ameren Missouri:
Residential $ 77 $ 84 $ 102
Commercial 30 34 40
Industrial 4 5 7
Transport and other 17 14 15
Ameren Missouri total $ 128 $ 137 $ 164
Ameren Illinois Natural Gas:
Residential $ 531 $ 550 $ 675
Commercial 153 163 208
Industrial 12 13 23
Transport and other 58 57 70
Ameren Illinois Natural Gas total $ 754 $ 783 $ 976
Other and intercompany eliminations (2) (2) —
Ameren total $ 880 $ 918 $ 1,140
Rate Base Operating Statistics – At December 31, 2016 2015 2014
Rate Base (in billions):
Coal Generation $ 2.0 $ 2.0 $ 2.2
Natural Gas Generation 0.4 0.5 0.5
Nuclear and Renewables Generation 1.8 1.7 1.8
Electric and Natural Gas Transmission and Distribution 9.4 8.2 7.4
Ameren total $ 13.6 $ 12.4 $ 11.9
16

Table of Contents
AVAILABLE INFORMATION
The Ameren Companies make available free of charge through Ameren’swebsite (www.ameren.com) their annual reports on Form 10-K, quarterlyreports on Form 10-Q, current reports on Form 8-K, eXtensible BusinessReporting Language (XBRL) documents, and any amendments to thosereports filed with or furnished to pursuant to Sections 13(a) or 15(d) of theExchange Act as soon as reasonably possible after such reports areelectronically filed with, or furnished to, the SEC. These documents are alsoavailable through an Internet website maintained by the SEC (www.sec.gov).Ameren also uses its website as a channel of distribution for materialinformation about the Ameren Companies. Financial and other materialinformation regarding the Ameren Companies is routinely posted to, andaccessible at, Ameren’s website.
The Ameren Companies also make available free of charge throughAmeren’s website the charters of Ameren’s board of directors’ audit and riskcommittee, human resources committee, nominating and corporategovernance committee, finance committee, and nuclear and operationscommittee; the corporate governance guidelines; a policy regardingcommunications to the board of directors; a policy and procedures documentwith respect to related-person transactions; a code of ethics for principalexecutive and senior financial officers; a code of business conduct applicableto all directors, officers and employees; and a director nomination policy thatapplies to the Ameren Companies. The information on Ameren’s website, orany other website referenced in this report, is not incorporated by referenceinto this report.
ITEM 1A.RISK FACTORS
Investors should review carefully the following material risk factors andthe other information contained in this report. The risks that the AmerenCompanies face are not limited to those in this section. There may be furtherrisks and uncertainties that are not presently known or that are not currentlybelieved to be material that may adversely affect the results of operations,financial position, and liquidity of the Ameren Companies.
REGULATORY AND LEGISLATIVE RISKS
We are subject to extensive regulation of our businesses, which couldadversely affect our results of operations, financial position, andliquidity.
We are subject to federal, state, and local regulation. This extensiveregulatory framework, some of which is more specifically identified in thefollowing risk factors, regulates, among other matters, the electric and naturalgas utility industries; rate and cost structure of utilities; operation of nuclearenergy centers; construction and operation of generation, transmission, anddistribution facilities; acquisition, disposal, depreciation and amortization ofassets and facilities; electric transmission system reliability; and wholesaleand retail competition. In the planning and management of our operations, wemust address the effects of existing and proposed laws and regulations andpotential changes in the regulatory framework,
including initiatives by federal and state legislatures, RTOs, utility regulators,and taxing authorities. Significant changes in the nature of the regulation ofour businesses could require changes to our business planning andmanagement of our businesses and could adversely affect our results ofoperations, financial position, and liquidity. Failure to obtain adequate rates orregulatory approvals in a timely manner; failure to obtain necessary licensesor permits from regulatory authorities; the impact of new or modified laws,regulations, standards, interpretations, or other legal requirements; orincreased compliance costs could adversely affect our results of operations,financial position, and liquidity.
The electric and natural gas rates that we are allowed to charge aredetermined through regulatory proceedings, which are subject tointervention and appeal, and are also subject to legislative actions, whichare largely outside of our control. Any events that prevent us fromrecovering our costs in a timely manner or from earning adequatereturns on our investments could adversely affect our results ofoperations, financial position, and liquidity.
The rates that we are allowed to charge for our utility servicessignificantly influence our results of operations, financial position, andliquidity. The electric and natural gas utility industry is highly regulated. Theutility rates charged to customers are determined by governmental entities,including the MoPSC, the ICC, and the FERC. Decisions by these entities areinfluenced by many factors, including the cost of providing service, theprudency of expenditures, the quality of service, regulatory staff knowledgeand experience, customer intervention, and economic conditions, as well associal and political views. Decisions made by these governmental entitiesregarding rates are largely outside of our control. We are exposed toregulatory lag and cost disallowances to varying degrees by jurisdiction,which, if unmitigated, could adversely affect our results of operations,financial position, and liquidity. Rate orders are also subject to appeal, whichcreates additional uncertainty as to the rates that we will ultimately be allowedto charge for our services. From time to time, our regulators may approvetrackers, riders, or other mechanisms that allow electric or natural gas rates tobe adjusted without a traditional rate proceeding. These mechanisms are notpermanent and could be changed or terminated.
Ameren Missouri's electric and natural gas utility rates and AmerenIllinois' natural gas utility rates are typically established in regulatoryproceedings that take up to 11 months to complete. Ameren Missouri's ratesestablished in those proceedings are primarily based on historical costs andrevenues. Ameren Illinois' natural gas rates established in those proceedingsare based on estimated future costs and revenues. Thus the rates that we areallowed to charge for utility services may not match our actual costs at anygiven time.
Rates include an allowed rate of return on investments established by theregulator. Although rate regulation is premised on providing an opportunity toearn a reasonable rate of return on invested capital, there can be no assurancethat the regulator will determine that our costs were prudently incurred or thatthe
17

Table of Contents
regulatory process will result in rates that will produce full recovery of suchcosts or provide for an opportunity to earn a reasonable return on thoseinvestments.
In years when capital investments and operations costs rise or customerusage declines below those levels reflected in rates, we may not be able toearn the allowed return established by the regulator. This could result in thedeferral or cancellation of planned capital investments, which could reducethe rate base investments on which we earn a rate of return. Additionally,increasing rates could result in regulatory or legislative actions, as well ascompetitive or political pressures, all of which could adversely affect ourresults of operations, financial position, and liquidity.
As a result of its participation in the performance-based formularatemaking process established pursuant to the IEIMA, Ameren Illinois’return on equity for its electric distribution business is directly correlatedto yields on United States Treasury bonds. Additionally, Ameren Illinoisis required to achieve certain performance standards and capitalspending levels. Failure to meet these requirements could adversely affectAmeren's and Ameren Illinois' results of operations, financial position,and liquidity.
Ameren Illinois is participating in the performance-based formularatemaking process established pursuant to the IEIMA for its electricdistribution business. The ICC annually reviews Ameren Illinois’ rate filingsunder the IEIMA for reasonableness and prudency. If the ICC were toconclude that Ameren Illinois’ costs were not prudently incurred, the ICCwould disallow recovery of such costs.
The return on equity component of the formula rate is equal to thecalendar year average of the monthly yields of 30-year United States Treasurybonds plus 580 basis points. Therefore, Ameren Illinois’ annual return onequity under the formula ratemaking process for its electric distributionbusiness is directly correlated to the yields on such bonds, which are outsideof Ameren Illinois’ control. A 50 basis point change in the average monthlyyields of the 30-year United States Treasury bonds would result in anestimated $7 million change in Ameren's and Ameren Illinois' net incomebased on its 2017 projected rate base.
Ameren Illinois is also subject to performance standards. Failure toachieve the standards would result in a reduction in the company’s allowedreturn on equity calculated under the formula. The IEIMA provides for returnon equity penalties totaling 34 basis points in each of 2017 through 2018 and38 basis points in each year from 2019 through 2022 if the performancestandards are not met.
Between 2012 and 2021, Ameren Illinois is required to invest a total of$625 million in capital projects to modernize its distribution systemincremental to its average annual electric distribution service capital projectsof $228 million for calendar years 2008 through 2010. If Ameren Illinois doesnot meet its investment commitments under IEIMA, Ameren Illinois wouldno longer be eligible to annually update its performance-based
formula rates under IEIMA.
When the IEIMA performance-based formula ratemaking process expiresat the end of 2022 Ameren Illinois will be required to establish future ratesthrough a traditional rate proceeding with the ICC, which might not result inrates that produce a full or timely recovery of costs or provide for an adequatereturn on investments.
We are subject to various environmental laws and regulations.Significant capital expenditures are required to achieve and to maintaincompliance with these laws and regulations. Failure to comply with theselaws and regulations could result in the closing of facilities, alterations tothe manner in which these facilities operate, increased operating costs, orexposure to fines and liabilities, all of which could adversely affect ourresults of operations, financial position, and liquidity.
We are subject to various environmental laws and regulations enforcedby federal, state, and local authorities. The development and operation ofelectric generation, transmission, and distribution facilities and natural gasstorage, transmission, and distribution facilities, can trigger compliance withdiverse environmental laws and regulations. These laws and regulationsaddress emissions, discharges to water, water usage, impacts to air, land, andwater, and chemical and waste handling. Complex and lengthy processes arerequired to obtain and renew approvals, permits, and licenses for new,existing or modified facilities. Additionally, the use and handling of variouschemicals or hazardous materials require release prevention plans andemergency response procedures.
We are also subject to liability under environmental laws that address theremediation of environmental contamination of property currently or formerlyowned by us or by our predecessors, as well as property contaminated byhazardous substances that we generated. Such properties include MGP sitesand third-party sites, such as landfills. Additionally, private individuals mayseek to enforce environmental laws and regulations against us. They couldallege injury from exposure to hazardous materials, allege a failure to complywith environmental laws and regulations, seek to compel remediation ofenvironmental contamination, or seek to recover damages resulting from thatcontamination.
The EPA has promulgated environmental regulations that have asignificant impact on the electric utility industry. Over time, compliance withthese regulations could be costly for Ameren Missouri, which operates coal-fired power plants. As of December 31, 2016, Ameren Missouri’s fossil-fueled energy centers represented 18% and 34% of Ameren’s and AmerenMissouri’s rate base, respectively. Regulations impacting the electric utilityindustry include the regulation of CO 2 emissions from existing power plantsthrough the Clean Power Plan and from new power plants through the revisedNSPS; the CSAPR, which requires further reductions of SO 2 emissions andNO x emissions from power plants; a regulation governing management andstorage of CCR; the MATS, which requires reduction of emissions of
18
Table of Contents
mercury, toxic metals, and acid gases from power plants; revised NSPS forparticulate matter, SO 2 , and NO x emissions from new sources; effluentstandards applicable to wastewater discharges from power plants; andregulations under the Clean Water Act that could require significant capitalexpenditures, such as modifications to water intake structures at AmerenMissouri’s energy centers. The EPA also periodically reviews and revisesnational ambient air quality standards, including those standards associatedwith emissions from power plants, such as particulate matter, ozone, SO 2 andNO x . Certain of these regulations are being or are likely to be challengedthrough litigation, so their ultimate implementation, as well as the timing ofany such implementation, is uncertain. Although many details of futureregulations are unknown, the individual or combined effects of recentenvironmental regulations could result in significant capital expenditures andincreased operating costs for Ameren and Ameren Missouri.
Ameren is also subject to risks from changing or conflictinginterpretations of existing laws and regulations. The EPA is engaged in anenforcement initiative to determine whether coal-fired power plants failed tocomply with the requirements of the NSR and NSPS provisions under theClean Air Act when the power plants implemented modifications. In January2011, the Department of Justice, on behalf of the EPA, filed a complaintagainst Ameren Missouri in the United States District Court for the EasternDistrict of Missouri. The complaint, as amended in October 2013, alleged thatin performing projects at its Rush Island coal-fired energy center in 2007 and2010, Ameren Missouri violated provisions of the Clean Air Act and Missourilaw. The litigation has been divided into two phases: liability and remedy. InJanuary 2017, the district court issued a liability ruling that the projectsviolated provisions of the Clean Air Act and Missouri law. The case will nowproceed to the second phase to determine the actions required to remedy theviolations found in the liability phase of the litigation. The EPA previouslywithdrew all claims for penalties and fines.
The ultimate resolution of this matter could have a material adverse effecton the results of operations, financial position, and liquidity of Ameren andAmeren Missouri. Among other things and subject to economic andregulatory considerations, resolution of this matter could result in increasedcapital expenditures for the installation of pollution control equipment, as wellas increased operations and maintenance expenses.
The Clean Power Plan sets forth CO 2 emissions standards applicable toexisting power plants. The rule was stayed by the United States SupremeCourt in February 2016, pending the outcome of various legal challenges. Ifupheld and implemented, the Clean Power Plan would require Missouri andIllinois to reduce CO 2 emissions from power plants within their statessignificantly below 2005 levels by 2030. The rule contains interimcompliance periods commencing in 2022 that would require each state todemonstrate progress in achieving its CO 2 emissions reduction target.Ameren continues to evaluate the Clean Power Plan's potential impacts to itsoperations, including those related to electric system reliability, and to itslevel of investment in customer energy efficiency programs, renewableenergy, and
other forms of generation. Significant uncertainty exists regarding the impactof the Clean Power Plan as its implementation will depend upon plans to bedeveloped by the states. Numerous legal challenges are pending, which couldresult in the rule being declared invalid or the nature and timing of CO 2emissions reductions being revised. All implementation requirements aredeferred until such time as these legal challenges are concluded. Appeals arenot expected to conclude prior to 2018. We cannot predict the outcome ofsuch legal challenges or their impact on our results of operations, financialposition, or liquidity. If the rule is ultimately upheld and not rescinded oraltered significantly by the new federal administration, compliance measurescould result in the closure or alteration of the operation of some of AmerenMissouri’s coal and natural-gas-fired energy centers, which could in turnresult in increased operating costs and require Ameren Missouri to makeunplanned or accelerated capital expenditures.
Ameren and Ameren Missouri have incurred and expect to incursignificant costs related to environmental compliance and site remediation.New or revised environmental regulations, enforcement initiatives, orlegislation could result in a significant increase in capital expenditures andoperating costs, decreased revenues, increased financing requirements,penalties or fines, or reduced operations of some of Ameren Missouri's coal-fired energy centers, which, in turn, could lead to increased liquidity needsand higher financing costs. Actions required to ensure that our facilities andoperations are in compliance with environmental laws and regulations couldbe prohibitively expensive for Ameren Missouri if the costs are not fullyrecovered through rates. Environmental laws could require Ameren Missourito close or to alter significantly the operations of its energy centers. If AmerenMissouri requests recovery of capital expenditures and costs forenvironmental compliance through rates, the MoPSC could deny recovery ofall or a portion of these costs, prevent timely recovery, or make changes to theregulatory framework in an effort to minimize rate volatility and customerrate increases. Capital expenditures and costs to comply with futurelegislation or regulations that are not recoverable through rates might result inAmeren Missouri closing coal-fired energy centers earlier than planned,which would lead to an impairment of assets and reduced revenues. We areunable to predict the ultimate impact of these matters on our results ofoperations, financial positions, and liquidity.
Following recent changes in the leadership of the federalgovernment, there have been various legislative options proposed toreform the federal income tax code. Whether the federal income tax codewill be reformed is currently unknown, but any such changes mayadversely affect our results of operations, financial position, andliquidity.
Since the 2016 presidential and congressional elections, there have beenvarious legislative options proposed to reform the federal income tax code,including reducing the statutory federal corporate income tax rate; allowing acurrent tax deduction for all new capital investments; and eliminating theinterest deduction as well as other modifications that would change theamount of income subject to income tax. Any federal
19

Table of Contents
income tax reform would ultimately affect the rates we charge our customers.A reduction in the statutory federal income tax rate would result in a reductionof deferred tax assets and liabilities currently recorded. A lower federalstatutory income tax rate may result in a significant one-time charge to ourresults of operations as a result of the revaluation of our deferred tax assetsnot attributable to our rate-regulated businesses. Additionally, a lowerstatutory federal income tax rate may result in a significant reduction inrevenues and liquidity as a result of both the required return to customers ofexcess deferred tax liabilities previously funded by customers over some timeperiod yet to be determined and the reduced collection of taxes in customerrates, each without an immediate reduction in our cash tax obligations. Also,changes that would ultimately result in lower taxable income in the futurecould prevent us from using all of our tax carryforward benefits before theyexpire. A current tax deduction for all new capital investments could reducethe level of our rate base growth from current expectations. Although thespecific changes and the ultimate timing of federal income tax reform, ifimplemented at all, are currently unknown, federal income tax reform mayadversely affect our results of operations, financial position, and liquidity.
Customers’, legislators’, and regulators’ opinions of us are affectedby many factors, including system reliability, implementation of ourinvestment plans, protection of customer information, rates, and mediacoverage. To the extent that customers, legislators, or regulators have ordevelop a negative opinion of us, our results of operations, financialposition, and liquidity could be adversely affected.
Service interruptions due to failures of equipment as a result of severe ordestructive weather or other causes, and the ability of Ameren Missouri andAmeren Illinois to respond promptly to such failures, can affect customersatisfaction. In addition to system reliability issues, the success ofmodernization efforts, such as those being undertaken for Ameren Illinois’electric and natural gas delivery systems, our ability to safeguard sensitivecustomer information, and other actions can affect customer satisfaction. Thelevel of rates, the timing and magnitude of rate increases, and volatility ofrates can also affect customer satisfaction. Customers', legislators', andregulators' opinions of us can also be affected by media coverage, includingsocial media, which may include information, whether factual or not, thatdamages our brand and reputation.
If customers, legislators, or regulators have or develop a negative opinionof us and our utility services, this could result in increased regulatoryoversight and could affect the returns on common equity we are allowed toearn. Additionally, negative opinions about us could make it more difficult forour utilities to achieve favorable legislative or regulatory outcomes. Negativeopinions could also result in sales volume reductions or increased use ofdistributed generation by our customers. Any of these consequences couldadversely affect our results of operations, financial position, and liquidity.
We are subject to federal regulatory compliance and proceedings,which exposes us to the potential for
regulatory penalties and other sanctions.
The FERC can impose civil penalties of $1 million per violation per dayfor violation of its regulations, rules, and orders, including mandatory NERCreliability standards. As owners and operators of bulk power transmissionsystems and electric energy centers, we are subject to mandatory NERCreliability standards, including cybersecurity standards. Compliance withthese mandatory reliability standards may subject us to higher operating costsand may result in increased capital expenditures. If we were found not to be incompliance with these mandatory reliability standards, FERC regulations,rules, and orders, we could incur substantial monetary penalties and othersanctions, which could adversely affect our results of operations, financialposition, and liquidity. The FERC also conducts audits and reviews ofAmeren Missouri's, Ameren Illinois', and ATXI's accounting records to assessthe accuracy of its formula ratemaking process, and it can require refunds tocustomers for previously billed amounts, with interest.
OPERATIONAL RISKS
The construction of and capital improvements to our electric andnatural gas utility infrastructure involve substantial risks. These risksinclude escalating costs, unsatisfactory performance by the projects whencompleted, the inability to complete projects as scheduled, costdisallowances by regulators, and the inability to earn an adequate returnon invested capital, any of which could result in higher costs and facilityclosures.
We expect to incur significant capital expenditures to maintain andimprove our electric and natural gas utility infrastructure and to comply withexisting environmental regulations. We estimate that we will invest up to$11.2 billion (Ameren Missouri – up to $4.2 billion ; Ameren Illinois – up to$6.4 billion ; ATXI – up to $0.6 billion ) of capital expenditures from 2017through 2021 . These estimates include allowance for equity funds usedduring construction. Investments in Ameren’s rate-regulated operations areexpected to be recoverable from ratepayers, but they are subject to prudencereviews and are exposed to regulatory lag of varying degrees by jurisdiction.
Our ability to complete construction projects successfully withinprojected estimates is contingent upon many variables and subject tosubstantial risks. These variables include, but are not limited to, projectmanagement expertise and escalating costs for materials and labor. Delays inobtaining permits, shortages in materials and qualified labor, suppliers andcontractors who do not perform as required under their contracts, changes inthe scope and timing of projects, the inability to raise capital on reasonableterms, or other events beyond our control could affect the schedule, cost, andperformance of these projects. There is a risk that a power plant may not bepermitted to continue to operate if pollution control equipment is not installedby prescribed deadlines or does not perform as expected. Should any suchpollution control equipment not be installed on time or not perform asexpected, Ameren Missouri could be subject to additional costs and to the lossof its investment in the project or
20

Table of Contents
facility. All of these project and construction risks could adversely affect ourresults of operations, financial position, and liquidity.
Ameren and Ameren Illinois may not be able to execute their electrictransmission investment plans or to realize the expected return on thoseinvestments.
Ameren, through ATXI and Ameren Illinois, is investing significantcapital resources in electric transmission. These investments are based on theFERC's regulatory framework and a rate of return on common equity that iscurrently higher than that allowed by our state commissions. However, theFERC regulatory framework and rate of return are subject to changes,including changes as a result of third-party complaints and challenges at theFERC. The regulatory framework may be less favorable or the rate of returnmay be lower in the future. A pending complaint case was filed with theFERC in February 2015 that could reduce the allowed return on commonequity and could require customer refunds. A 50 basis point reduction in theFERC-allowed return on common equity would reduce Ameren's and AmerenIllinois' earnings by an estimated $7 million and $4 million , respectively,based on each company's 2017 projected rate base.
A significant portion of Ameren's electric transmission investmentsconsists of three separate projects to be constructed by ATXI, which havebeen approved by MISO as multi-value projects. ATXI's total investment inthe three projects is expected to be more than $1.6 billion. The last of theseprojects is expected to be completed in 2019; however, further delays inobtaining the assents for road crossings could delay the completion date of theMark Twain project. A failure by ATXI to complete these three projects ontime and within projected cost estimates could adversely affect Ameren'sresults of operations, financial position, and liquidity.
The FERC has issued orders, which are subject to ongoing litigation,eliminating the right of first refusal for an electric utility to construct withinits service territory certain new transmission projects for which there will beregional cost sharing. If these orders are upheld by the courts, Ameren wouldneed to compete to build certain future electric transmission projects in itssubsidiaries' service territories. Such competition could limit Ameren's futuretransmission investment. Conversely, if such FERC orders are not upheld bythe courts, the right of first refusal would be expected to be reinstated. In suchevent, Ameren may lose opportunities to construct electric transmission assetsoutside of its subsidiaries' service territories and outside of MISO.
Our electric generation, transmission, and distribution facilities aresubject to operational risks that could adversely affect our results ofoperations, financial position, and liquidity.
Our financial performance depends on the successful operation of electricgeneration, transmission, and distribution facilities. Operation of electricgeneration, transmission, and distribution facilities involves many risks,including:
• facility shutdowns due to operator error or a failure of
equipment or processes;
• longer-than-anticipated maintenance outages;• aging infrastructure that may require significant expenditures to operate
and maintain;• disruptions in the delivery of fuel, failure of our fuel suppliers to provide
adequate quantities or quality of fuel, or lack of adequate inventories offuel, including ultra-low-sulfur coal used for Ameren Missouri’scompliance with environmental regulations;
• lack of adequate water required for cooling plant operations;• labor disputes;• inability to comply with regulatory or permit requirements, including
those relating to environmental laws;• disruptions in the delivery of electricity to our customers;• handling, storage, and disposition of CCR;• unusual or adverse weather conditions or other natural disasters,
including severe storms, droughts, floods, tornadoes, earthquakes, solarflares, and electromagnetic pulses;
• accidents that might result in injury or loss of life, extensive propertydamage, or environmental damage;
• cybersecurity risks, including loss of operational control of AmerenMissouri's energy centers and our transmission and distribution systemsand loss of data, such as customer data and account information throughinsider or outsider actions;
• failure of other operators' facilities and the effect of that failure on ourelectric system and customers;
• the occurrence of catastrophic events such as fires, explosions, acts ofsabotage or terrorism, pandemic health events, or other similaroccurrences;
• limitations on amounts of insurance available to cover losses that mightarise in connection with operating our electric generation, transmission,and distribution facilities; and
• other unanticipated operations and maintenance expenses and liabilities.
Ameren Missouri’s ownership and operation of a nuclear energycenter creates business, financial, and waste disposal risks.
Ameren Missouri’s ownership of the Callaway energy center subjects itto the risks associated with nuclear generation, including:
• potential harmful effects on the environment and human health resultingfrom radiological releases associated with the operation of nuclearfacilities and the storage, handling, and disposal of radioactive materials;
• continued uncertainty regarding the federal government's plan topermanently store spent nuclear fuel and the risk of being required toprovide for long-term storage of spent nuclear fuel at the Callawayenergy center;
• limitations on the amounts and types of insurance available to coverlosses that might arise in connection with the Callaway energy center orother United States nuclear facilities;
• uncertainties with respect to contingencies and retrospective premiumassessments relating to claims at the Callaway
21
Table of Contents
energy center or any other United States nuclear facilities;• public and governmental concerns about the safety and adequacy of
security at nuclear facilities;• uncertainties with respect to the technological and financial aspects of
decommissioning nuclear facilities at the end of their licensed lives;• limited availability of fuel supply and our reliance on licensed fuel
assemblies that are fabricated by a single supplier;• costly and extended outages for scheduled or unscheduled maintenance
and refueling; and• potential adverse effects of a natural disaster, acts of sabotage or
terrorism, including cyber attack, or any accident leading to release ofnuclear contamination.
The NRC has broad authority under federal law to impose licensing andsafety requirements for nuclear facilities. In the event of noncompliance, theNRC has the authority to impose fines or to shut down a unit, or both,depending upon its assessment of the severity of the situation, untilcompliance is achieved. Revised safety requirements promulgated from timeto time by the NRC could necessitate substantial capital expenditures atnuclear facilities such as the Callaway energy center. In addition, if a seriousnuclear incident were to occur, it could adversely affect Ameren's andAmeren Missouri’s results of operations, financial condition, and liquidity. Amajor incident at a nuclear facility anywhere in the world could cause theNRC to limit or prohibit the operation of any domestic nuclear unit and couldalso cause the NRC to impose additional conditions or requirements on theindustry, which could increase costs and result in additional capitalexpenditures. NRC standards relating to seismic risk require Ameren Missourito further evaluate the impact of an earthquake on its Callaway energy centerdue its proximity to a fault line, which could require the installation ofadditional capital equipment.
Our natural gas distribution and storage activities involve numerousrisks that may result in accidents and other operating risks and costs thatcould adversely affect our results of operations, financial position, andliquidity.
Inherent in our natural gas distribution and storage activities are a varietyof hazards and operating risks, such as leaks, explosions, mechanicalproblems and cybersecurity risks, which could cause substantial financiallosses. In addition, these hazards could result in serious injury, loss of humanlife, significant damage to property, environmental impacts, and impairmentof our operations, which in turn could lead us to incur substantial losses. Thelocation of distribution mains and storage facilities near populated areas,including residential areas, business centers, industrial sites, and other publicgathering places, could increase the level of damages resulting from theserisks. A major domestic incident involving natural gas systems could lead toadditional capital expenditures and increased regulation of natural gasutilities. The occurrence of any of these events could adversely affect ourresults of operations, financial position, and liquidity.
Significant portions of our electric generation, transmission, anddistribution facilities and natural gas
transmission and distribution facilities are aging. This aginginfrastructure may require additional maintenance expenditures or mayrequire replacement, which could adversely affect our results ofoperations, financial position, and liquidity.
Our aging infrastructure may pose risks to system reliability and exposeus to expedited or unplanned capital expenditures and operating costs. All ofAmeren Missouri’s coal-fired energy centers were constructed prior to 1978,and the Callaway nuclear energy center began operating in 1984. The age ofthese energy centers increases the risks of unplanned outages, reducedgeneration output, and higher maintenance expense. If, at the end of its life, anenergy center's cost has not been fully recovered, Ameren Missouri may beadversely affected if such cost is not allowed in rates by the MoPSC. Agingtransmission and distribution facilities are more prone to failure than newfacilities, which results in higher maintenance expense and the need to replacethese facilities with new infrastructure. Even if the system is properlymaintained, its reliability may ultimately deteriorate and negatively affect ourability to serve our customers, which could result in additional oversight byour regulators. The frequency and duration of customer outages are amongIEIMA performance standards. Therefore, failure to achieve these standardswill result in a reduction in Ameren Illinois' allowed return on equity onelectric distribution assets. The higher maintenance costs associated withaging infrastructure and capital expenditures for new replacementinfrastructure could cause additional rate volatility for our customers,resistance by our regulators to allow customer rate increases, and/orregulatory lag in some of our jurisdictions, any of which could adverselyaffect our results of operations, financial position, and liquidity.
Energy conservation, energy efficiency, distributed generation,energy storage, and other factors that reduce energy demand couldadversely affect our results of operations, financial position, andliquidity.
Requirements and incentives to reduce energy consumption have beenproposed by regulatory agencies and introduced by legislatures. Conservationand energy efficiency programs are designed to reduce energy demand.Without a regulatory mechanism to ensure recovery, a decline in usage willresult in an under-recovery of our revenue requirement. Ameren Missouri isexposed to declining usage losses from energy efficiency efforts not related toits MEEIA programs, as well as from distributed generation sources such assolar panels. In Illinois, the FEJA includes a provision, beginning in 2018,that will reduce Ameren Illinois' allowed return only on electric energyefficiency investments if certain energy savings targets are not achieved.Additionally, macroeconomic factors resulting in low economic growth orcontraction within our service territories could reduce energy demand.
Technological advances could reduce or change customer electricityconsumption. Ameren Missouri generates power at utility-scale energycenters to achieve economies of scale and to produce power at a competitivecost. Some distributed
22

Table of Contents
generation technologies have become more cost-competitive, with decreasingcosts expected in the future. The costs of these distributed generationtechnologies may decline over time to a level that is competitive with that ofAmeren Missouri's energy centers. Additionally, technological advancesrelated to energy storage may be coupled with distributed generation to reducethe demand for our electric utility services. Increased adoption of thesetechnologies could decrease our revenues if customers cease to use ourgeneration, transmission, and distribution services at current levels. AmerenMissouri might incur stranded costs, which ultimately might not be recoveredthrough rates.
We are subject to employee work force factors that could adverselyaffect our operations.
Our businesses depend upon our ability to employ and retain key officersand other skilled professional and technical employees. A significant portionof our work force is nearing retirement, including many employees withspecialized skills, such as maintaining and servicing our electric and naturalgas infrastructure and operating our energy centers. We are also party tocollective bargaining agreements that collectively represent about 53% ofAmeren’s total employees. Any work stoppage experienced in connectionwith negotiations of collective bargaining agreements could adversely affectour operations.
Our operations are subject to acts of terrorism, cyber attacks, andother intentionally disruptive acts.
Like other electric and natural gas utilities, our energy centers, fuelstorage facilities, transmission and distribution facilities, and informationsystems may be affected by terrorist activities and other intentionallydisruptive acts, including cyber attacks, which could disrupt our ability toproduce or distribute our energy products. Within our industry, there havebeen attacks on energy infrastructure such as substations and related assets inthe past, and there may be more attacks in the future. Any such incident couldlimit our ability to generate, purchase, or transmit power or natural gas andcould have significant regional economic consequences. Any such disruptioncould result in a significant decrease in revenues, a significant increase incosts including those for repair, or adversely impact economic activity in ourservice territory which could adversely affect our results of operations,financial position, and liquidity.
Our industry has seen an increase in the number and sophistication ofcyber attacks. A security breach at our physical assets or in our informationsystems could affect the reliability of the transmission and distributionsystem, disrupt electric generation, and/or subject us to financial harmassociated with theft or inappropriate release of certain types of information,including sensitive customer and employee data. Many of our suppliers,vendors, contractors, and information technology providers have access to oursystems that support our operations and maintain customer and employeedata. A breach of these third-party systems could adversely affect ourbusiness as if it was a breach of our own system. If a significant breachoccurred, our reputation could be adversely affected, customer confidence
could be diminished, or we could be subject to legal claims, any of whichcould result in a significant decrease in revenues or significant costs forremedying the impacts of such a breach. Our generation, transmission, anddistribution systems are part of an interconnected system. Therefore, adisruption caused by a cyber incident at another utility, electric generator,RTO, or commodity supplier could also adversely affect our businesses. Inaddition, new regulations could require changes in our security measures andresult in increased costs. The occurrence of any of these events couldadversely affect our results of operations, financial position, and liquidity.
FINANCIAL, ECONOMIC, AND MARKET RISKS
Our businesses are dependent on our ability to access the capitalmarkets successfully. We might not have access to sufficient capital in theamounts and at the times needed.
We rely on short-term and long-term debt as significant sources ofliquidity and funding for capital requirements not satisfied by our operatingcash flow, as well as to refinance long-term debt. By the end of 2018, $803million and $707 million of senior secured notes are scheduled to mature atAmeren Missouri and Ameren Illinois, respectively. Ameren Missouri andAmeren Illinois expect to refinance these senior secured notes. In addition, theAmeren Companies may refinance a portion of their outstanding short-termdebt with long-term debt in 2017. The inability to raise debt or equity capitalon reasonable terms, or at all, could negatively affect our ability to maintainand to expand our businesses. Events beyond our control, such as a recessionor extreme volatility in the debt, equity, or credit markets, might createuncertainty that could increase our cost of capital or impair or eliminate ourability to access the debt, equity, or credit markets, including our ability todraw on bank credit facilities. Any adverse change in our credit ratings couldreduce access to capital and trigger collateral postings and prepayments. Suchchanges could also increase the cost of borrowing and the costs of fuel,power, and natural gas supply, among other things, which could adverselyaffect our results of operations, financial position, and liquidity. CertainAmeren subsidiaries, such as ATXI, rely on Ameren for access to capital.Circumstances that limit Ameren’s access to capital could impair its ability toprovide those subsidiaries with needed capital.
Ameren’s holding company structure could limit its ability to paycommon stock dividends and to service its debt obligations.
Ameren is a holding company; therefore, its primary assets are itsinvestments in the common stock of its subsidiaries, including AmerenMissouri, Ameren Illinois, and ATXI. As a result, Ameren’s ability to paydividends on its common stock depends on the earnings of its subsidiaries andthe ability of its subsidiaries to pay dividends or otherwise transfer funds toAmeren. Similarly, Ameren’s ability to service its debt obligations isdependent upon the earnings of its operating subsidiaries and the distributionof those earnings and other payments, including payments of principal andinterest under intercompany indebtedness. The payment of dividends toAmeren by its
23
Table of Contents
subsidiaries in turn depends on their results of operations and available cashand other items affecting retained earnings. Ameren’s subsidiaries areseparate and distinct legal entities and have no obligation, contingent orotherwise, to pay any dividends or make any other distributions (except forpayments required pursuant to the terms of intercompany borrowingarrangements and cash payments under the tax allocation agreement) toAmeren. Certain financing agreements, corporate organizational documents,and certain statutory and regulatory requirements may impose restrictions onthe ability of Ameren Missouri, Ameren Illinois, and ATXI to transfer fundsto Ameren in the form of cash dividends, loans, or advances.
Increasing costs associated with our defined benefit retirement andpostretirement plans, health care plans, and other employee benefitscould adversely affect our financial position and liquidity.
Ameren offers defined benefit pension and postretirement benefit planscovering substantially all of its union employees. Ameren offers definedbenefit pension plans covering substantially all of its non-union employeesand postretirement benefit plans covering non-union employees hired beforeOctober 2015. Assumptions related to future costs, returns on investments,interest rates, timing of employee retirements, and mortality, as well as otheractuarial matters, have a significant impact on our customers' rates and ourplan funding requirements. Ameren's total unfunded obligation under itspension and postretirement benefit plans was $774 million as of December31, 2016 . Ameren expects to fund its pension plans at a level equal to thegreater of the pension cost or the legally required minimum contribution.Considering Ameren’s assumptions at December 31, 2016 , its investmentperformance in 2016 , and its pension funding policy, Ameren expects tomake annual contributions of $50 million to $70 million in each of the nextfive years, with aggregate estimated contributions of $290 million . We expectAmeren Missouri’s and Ameren Illinois’ portions of the future fundingrequirements to be 35% and 55% , respectively. These amounts are estimates.They may change with actual investment performance, changes in interestrates, changes in our assumptions, changes in government regulations, andany voluntary contributions.
In addition to the costs of our retirement plans, the costs of providinghealth care benefits to our employees and retirees have increased in recentyears. We believe that our employee benefit costs, including costs of healthcare plans for our employees and former employees, will continue to rise. Theincreasing costs and funding requirements associated with our defined benefitretirement plans, health care plans, and other employee benefits couldincrease our financing needs and otherwise adversely affect our financialposition and liquidity.
ITEM 1B.UNRESOLVED STAFF COMMENTS
None.
24
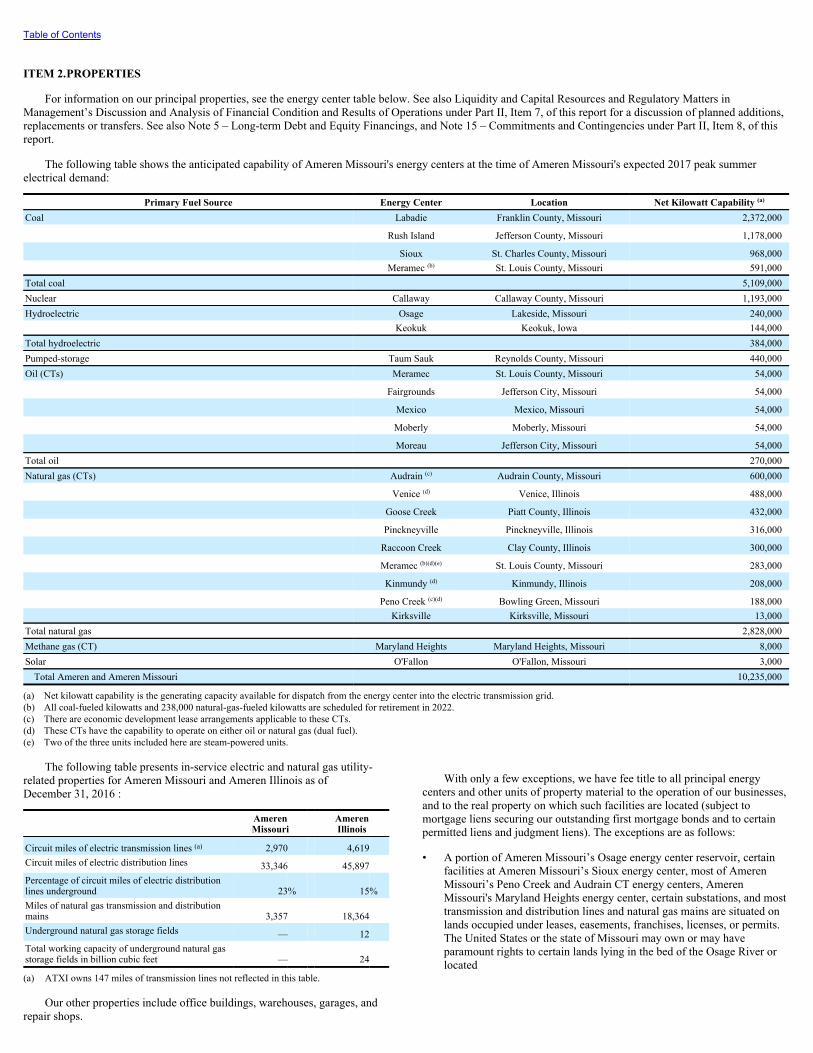
Table of Contents
ITEM 2.PROPERTIES
For information on our principal properties, see the energy center table below. See also Liquidity and Capital Resources and Regulatory Matters inManagement’s Discussion and Analysis of Financial Condition and Results of Operations under Part II, Item 7, of this report for a discussion of planned additions,replacements or transfers. See also Note 5 – Long-term Debt and Equity Financings, and Note 15 – Commitments and Contingencies under Part II, Item 8, of thisreport.
The following table shows the anticipated capability of Ameren Missouri's energy centers at the time of Ameren Missouri's expected 2017 peak summerelectrical demand:
Primary Fuel Source Energy Center Location Net Kilowatt Capability (a)
Coal Labadie Franklin County, Missouri 2,372,000 Rush Island Jefferson County, Missouri 1,178,000 Sioux St. Charles County, Missouri 968,000 Meramec (b) St. Louis County, Missouri 591,000Total coal 5,109,000Nuclear Callaway Callaway County, Missouri 1,193,000Hydroelectric Osage Lakeside, Missouri 240,000 Keokuk Keokuk, Iowa 144,000Total hydroelectric 384,000Pumped-storage Taum Sauk Reynolds County, Missouri 440,000Oil (CTs) Meramec St. Louis County, Missouri 54,000 Fairgrounds Jefferson City, Missouri 54,000 Mexico Mexico, Missouri 54,000 Moberly Moberly, Missouri 54,000 Moreau Jefferson City, Missouri 54,000Total oil 270,000Natural gas (CTs) Audrain (c) Audrain County, Missouri 600,000 Venice (d) Venice, Illinois 488,000 Goose Creek Piatt County, Illinois 432,000 Pinckneyville Pinckneyville, Illinois 316,000 Raccoon Creek Clay County, Illinois 300,000 Meramec (b)(d)(e) St. Louis County, Missouri 283,000 Kinmundy (d) Kinmundy, Illinois 208,000 Peno Creek (c)(d) Bowling Green, Missouri 188,000 Kirksville Kirksville, Missouri 13,000Total natural gas 2,828,000Methane gas (CT) Maryland Heights Maryland Heights, Missouri 8,000Solar O'Fallon O'Fallon, Missouri 3,000Total Ameren and Ameren Missouri 10,235,000
(a) Net kilowatt capability is the generating capacity available for dispatch from the energy center into the electric transmission grid.(b) All coal-fueled kilowatts and 238,000 natural-gas-fueled kilowatts are scheduled for retirement in 2022.(c) There are economic development lease arrangements applicable to these CTs.(d) These CTs have the capability to operate on either oil or natural gas (dual fuel).(e) Two of the three units included here are steam-powered units.
The following table presents in-service electric and natural gas utility-related properties for Ameren Missouri and Ameren Illinois as ofDecember 31, 2016 :
AmerenMissouri
AmerenIllinois
Circuit miles of electric transmission lines (a) 2,970 4,619Circuit miles of electric distribution lines 33,346 45,897Percentage of circuit miles of electric distributionlines underground 23% 15%Miles of natural gas transmission and distributionmains 3,357 18,364Underground natural gas storage fields — 12Total working capacity of underground natural gasstorage fields in billion cubic feet — 24
(a) ATXI owns 147 miles of transmission lines not reflected in this table.
Our other properties include office buildings, warehouses, garages, andrepair shops.
With only a few exceptions, we have fee title to all principal energy
centers and other units of property material to the operation of our businesses,and to the real property on which such facilities are located (subject tomortgage liens securing our outstanding first mortgage bonds and to certainpermitted liens and judgment liens). The exceptions are as follows:
• A portion of Ameren Missouri’s Osage energy center reservoir, certainfacilities at Ameren Missouri’s Sioux energy center, most of AmerenMissouri’s Peno Creek and Audrain CT energy centers, AmerenMissouri's Maryland Heights energy center, certain substations, and mosttransmission and distribution lines and natural gas mains are situated onlands occupied under leases, easements, franchises, licenses, or permits.The United States or the state of Missouri may own or may haveparamount rights to certain lands lying in the bed of the Osage River orlocated

25

Table of Contents
between the inner and outer harbor lines of the Mississippi River onwhich certain of Ameren Missouri’s energy centers and other propertiesare located.
• The United States, the state of Illinois, the state of Iowa, or the city ofKeokuk, Iowa, may own or may have paramount rights with respect tocertain lands lying in the bed of the Mississippi River on which a portionof Ameren Missouri’s Keokuk energy center is located.
Substantially all of the properties and plant of Ameren Missouri andAmeren Illinois are subject to the first liens of the indentures securing theirmortgage bonds.
Ameren Missouri has conveyed most of its Peno Creek CT energy centerto the city of Bowling Green, Missouri, and leased the energy center backfrom the city through 2022. Under the terms of this capital lease, AmerenMissouri is responsible for all operation and maintenance for the energycenter. Ownership of the energy center will transfer to Ameren Missouri at theexpiration of the lease, at which time the property, plant and equipment willbecome subject to the lien of any Ameren Missouri first mortgage bondindenture then in effect.
Ameren Missouri operates a CT energy center located in AudrainCounty, Missouri. Ameren Missouri has rights and obligations as lessee of theCT energy center under a long-term lease with Audrain County. The leasewill expire in December 2023. Under the terms of this capital lease, AmerenMissouri is responsible for all operation and maintenance for the energycenter. Ownership of the energy center will transfer to Ameren Missouri at theexpiration of the lease, at which time the property, plant and equipment willbecome subject to the lien of any Ameren Missouri first mortgage bondindenture then in effect.
ITEM 3.LEGAL PROCEEDINGS
We are involved in legal and administrative proceedings before variouscourts and agencies with respect to matters that
arise in the ordinary course of business, some of which involve substantialamounts of money. We believe that the final disposition of these proceedings,except as otherwise disclosed in this report, will not have a material adverseeffect on our results of operations, financial position, or liquidity. Risk of lossis mitigated, in some cases, by insurance or contractual or statutoryindemnification. We believe that we have established appropriate reserves forpotential losses. Material legal and administrative proceedings, which arediscussed in Note 2 – Rate and Regulatory Matters, Note 10 – CallawayEnergy Center and Note 15 – Commitments and Contingencies under Part II,Item 8, of this report and are incorporated herein by reference, include thefollowing:
• the unanimous stipulation and agreement between Ameren Missouri, theMoPSC staff, the MoOPC, and all intervenors, which is subject toMoPSC approval, that settles the July 2016 electric rate case;
• ATXI’s lawsuits filed in October 2016 in the circuit courts of each ofAdair, Knox, Marion, Schuyler, and Shelby counties in Missouri toobtain assents for road crossings in the counties where the Mark Twaintransmission project will be constructed;
• the February 2015 complaint case filed with the FERC seeking areduction in the allowed base return on common equity under the MISOtariff;
• litigation against Ameren Missouri related to the EPA Clean Air Act;• remediation matters associated with former MGP and waste disposal sites
of the Ameren Companies; and• the class action lawsuit against Ameren Missouri relating to municipal
taxes.
ITEM 4.MINE SAFETY DISCLOSURES
Not applicable.
EXECUTIVE OFFICERS OF THE REGISTRANTS (ITEM 401(b) OF REGULATION S-K):
The executive officers of the Ameren Companies, including major subsidiaries, are listed below, along with their ages as of December 31, 2016 , all positionsand offices held with the Ameren Companies as of February 15, 2017, tenure as officer, and business background for at least the last five years. Some executiveofficers hold multiple positions within the Ameren Companies; their titles are given in the description of their business experience.
26

Table of Contents
AMEREN CORPORATION:
Name Age Positions and Offices Held Warner L. Baxter 55 Chairman, President and Chief Executive Officer, and DirectorBaxter joined Ameren Missouri in 1995. Baxter was elected to the positions of executive vice president and chief financial officer of Ameren, Ameren Missouri,Ameren Illinois, and Ameren Services in 2003. He was elected chairman, president, chief executive officer, and chief financial officer of Ameren Services in2007. In 2009, Baxter was elected chairman, president and chief executive officer of Ameren Missouri. In February 2014, Baxter was elected president of Amerenand was appointed to the Ameren board. In April 2014, he relinquished his positions at Ameren Missouri and was elected chief executive officer of Ameren. InJuly 2014, Baxter was elected chairman of the Ameren board. Martin J. Lyons, Jr. 50 Executive Vice President and Chief Financial OfficerLyons joined Ameren Services in 2001. In 2008, Lyons was elected senior vice president and chief accounting officer of the Ameren Companies. In 2009, Lyonswas also elected chief financial officer of the Ameren Companies. In 2013, Lyons was elected executive vice president and chief financial officer of the AmerenCompanies, and relinquished his duties as chief accounting officer. In 2016, Lyons was elected chairman and president of Ameren Services. Gregory L. Nelson 59 Senior Vice President, General Counsel, and SecretaryNelson joined Ameren Missouri in 1995. Nelson was elected vice president and tax counsel of Ameren Services in 1999 and vice president of Ameren Missouriand Ameren Illinois in 2003. In 2010, Nelson was elected vice president, tax and deputy general counsel of Ameren Services. He remained vice president ofAmeren Missouri and Ameren Illinois. In 2011, Nelson was elected senior vice president, general counsel and secretary of the Ameren Companies. Bruce A. Steinke 55 Senior Vice President, Finance, and Chief Accounting OfficerSteinke joined Ameren Services in 2002. In 2008, he was elected vice president and controller of Ameren, Ameren Illinois, and Ameren Services. In 2009, Steinkerelinquished his positions at Ameren Illinois. In 2013, Steinke was elected senior vice president, finance, and chief accounting officer of the Ameren Companies.
27

Table of Contents
SUBSIDIARIES:
Name Age Positions and Offices HeldMark C. Birk 52 Senior Vice President, Customer Operations (Ameren Missouri)Birk joined Ameren Missouri in 1986. In 2005, Birk was elected vice president, power operations, of Ameren Missouri. In 2012, Birk was elected senior vicepresident, corporate planning, of Ameren Services. In 2014, he was also elected senior vice president, oversight, of Ameren Services, and in 2015, he was electedsenior vice president, corporate safety, planning and operations oversight. In 2017, Birk was elected senior vice president, customer operations, at AmerenMissouri and relinquished his positions at Ameren Services. Maureen A. Borkowski 59 Chairman and President (ATXI)Borkowski joined Ameren Missouri in 1981. She left the company in 2000 and rejoined Ameren in 2005 as vice president, transmission, of Ameren Services. In2011, Borkowski was elected chairman and president of ATXI. In 2011, she was also elected senior vice president, transmission, of Ameren Services. Fadi M. Diya 54 Senior Vice President and Chief Nuclear Officer (Ameren Missouri)Diya joined Ameren Missouri in 2005. In 2008, Diya was elected vice president, nuclear operations, of Ameren Missouri. In January 2014, Diya was electedsenior vice president and chief nuclear officer of Ameren Missouri. Mary P. Heger 60 Senior Vice President and Chief Information Officer (Ameren Services)Heger joined Ameren Missouri in 1976. In 2009, Heger was elected vice president, information technology, of Ameren Services, and in 2012, she was also electedchief information officer of Ameren Services. In 2015, Heger was elected senior vice president and chief information officer of Ameren Services. Mark C. Lindgren 49
Senior Vice President, Corporate Communications and Chief Human Resources Officer (AmerenServices)
Lindgren joined Ameren Services in 1998. In 2009, Lindgren was elected vice president, human resources, of Ameren Services, and in 2012, he was also electedchief human resources officer of Ameren Services. In 2015, Lindgren was elected senior vice president, corporate communications, and chief human resourcesofficer of Ameren Services. Richard J. Mark 61 Chairman and President (Ameren Illinois)Mark joined Ameren Services in 2002. He was elected senior vice president, customer operations, of Ameren Missouri in 2005. In 2012, Mark relinquished hisposition at Ameren Missouri and was elected chairman and president of Ameren Illinois. Michael L. Moehn 47 Chairman and President (Ameren Missouri)Moehn joined Ameren Services in 2000. In 2008, he was elected senior vice president, corporate planning and business risk management, of Ameren Services. In2012, Moehn was elected senior vice president, customer operations, of Ameren Missouri. In April 2014, Moehn was elected chairman and president of AmerenMissouri.
Officers are generally elected or appointed annually by the respective board of directors of each company, following the election of board members at theannual meetings of shareholders. No special arrangement or understanding exists between any of the above-named executive officers and the Ameren Companiesnor, to our knowledge, with any other person or persons pursuant to which any executive officer was selected as an officer. There are no family relationshipsamong the executive officers or between any executive officers and any directors of the Ameren Companies. All of the above-named executive officers have beenemployed by an Ameren company for more than five years in executive or management positions.
28
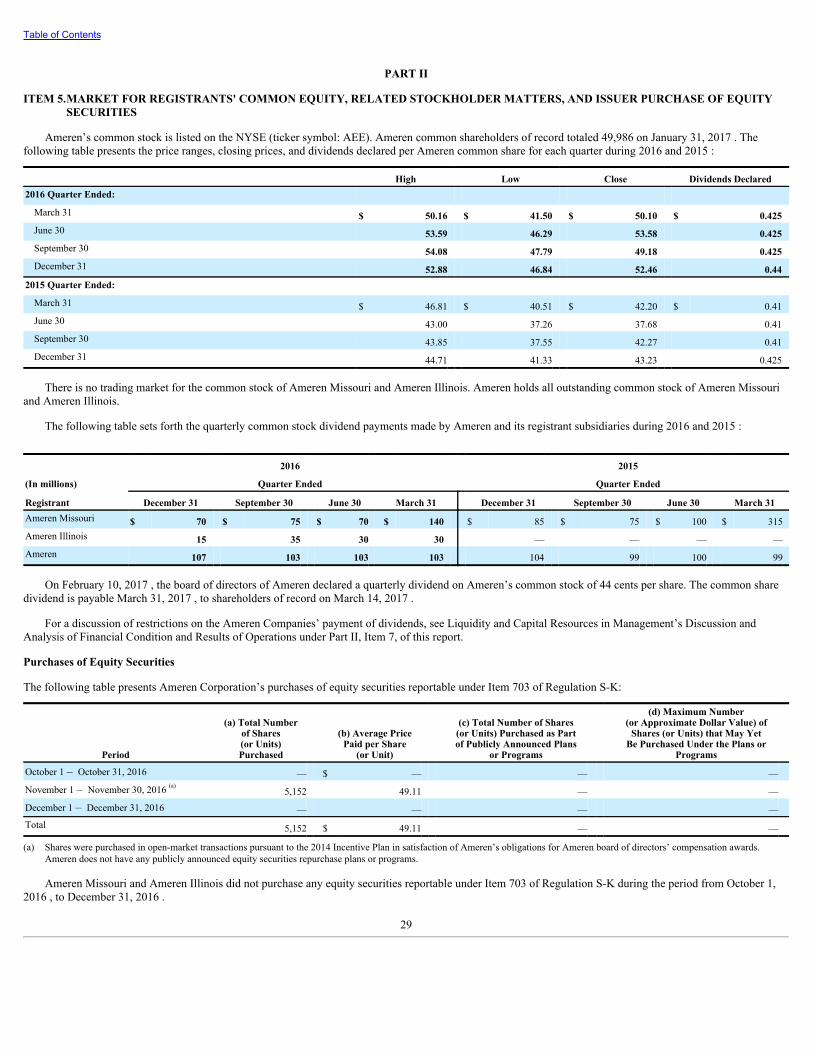
Table of Contents
PART II
ITEM 5.MARKET FOR REGISTRANTS' COMMON EQUITY, RELATED STOCKHOLDER MATTERS, AND ISSUER PURCHASE OF EQUITYSECURITIES
Ameren’s common stock is listed on the NYSE (ticker symbol: AEE). Ameren common shareholders of record totaled 49,986 on January 31, 2017 . Thefollowing table presents the price ranges, closing prices, and dividends declared per Ameren common share for each quarter during 2016 and 2015 :
High Low Close Dividends Declared2016 Quarter Ended: March 31 $ 50.16 $ 41.50 $ 50.10 $ 0.425June 30 53.59 46.29 53.58 0.425September 30 54.08 47.79 49.18 0.425December 31 52.88 46.84 52.46 0.44
2015 Quarter Ended: March 31 $ 46.81 $ 40.51 $ 42.20 $ 0.41June 30 43.00 37.26 37.68 0.41September 30 43.85 37.55 42.27 0.41December 31 44.71 41.33 43.23 0.425
There is no trading market for the common stock of Ameren Missouri and Ameren Illinois. Ameren holds all outstanding common stock of Ameren Missouriand Ameren Illinois.
The following table sets forth the quarterly common stock dividend payments made by Ameren and its registrant subsidiaries during 2016 and 2015 :
2016 2015
(In millions) Quarter Ended Quarter Ended
Registrant December 31 September 30 June 30 March 31 December 31 September 30 June 30 March 31Ameren Missouri $ 70 $ 75 $ 70 $ 140 $ 85 $ 75 $ 100 $ 315Ameren Illinois 15 35 30 30 — — — —Ameren 107 103 103 103 104 99 100 99
On February 10, 2017 , the board of directors of Ameren declared a quarterly dividend on Ameren’s common stock of 44 cents per share. The common sharedividend is payable March 31, 2017 , to shareholders of record on March 14, 2017 .
For a discussion of restrictions on the Ameren Companies’ payment of dividends, see Liquidity and Capital Resources in Management’s Discussion andAnalysis of Financial Condition and Results of Operations under Part II, Item 7, of this report.
Purchases of Equity Securities
The following table presents Ameren Corporation’s purchases of equity securities reportable under Item 703 of Regulation S-K:
Period
(a) Total Numberof Shares(or Units)Purchased
(b) Average PricePaid per Share
(or Unit)
(c) Total Number of Shares(or Units) Purchased as Partof Publicly Announced Plans
or Programs
(d) Maximum Number(or Approximate Dollar Value) of
Shares (or Units) that May YetBe Purchased Under the Plans or
Programs
October 1 – October 31, 2016 — $ — — —November 1 – November 30, 2016 (a) 5,152 49.11 — —December 1 – December 31, 2016 — — — —Total 5,152 $ 49.11 — —
(a) Shares were purchased in open-market transactions pursuant to the 2014 Incentive Plan in satisfaction of Ameren’s obligations for Ameren board of directors’ compensation awards.Ameren does not have any publicly announced equity securities repurchase plans or programs.
Ameren Missouri and Ameren Illinois did not purchase any equity securities reportable under Item 703 of Regulation S-K during the period from October 1,2016 , to December 31, 2016 .
29
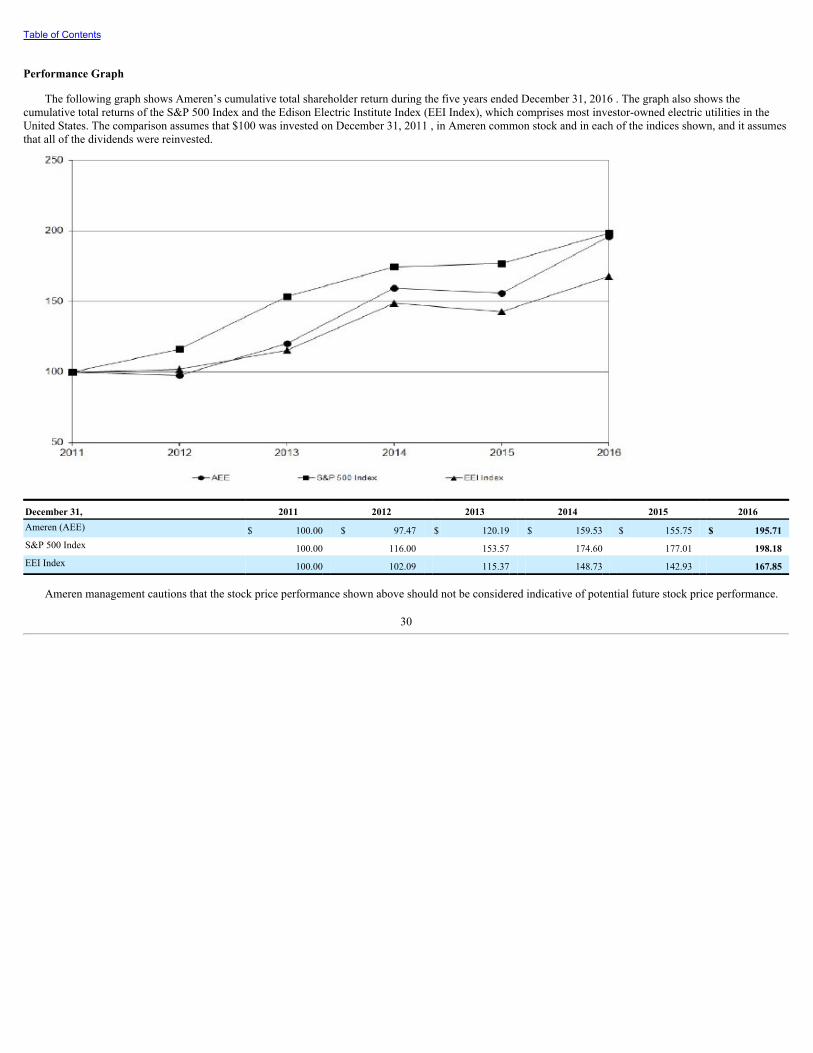
Table of Contents
Performance Graph
The following graph shows Ameren’s cumulative total shareholder return during the five years ended December 31, 2016 . The graph also shows thecumulative total returns of the S&P 500 Index and the Edison Electric Institute Index (EEI Index), which comprises most investor-owned electric utilities in theUnited States. The comparison assumes that $100 was invested on December 31, 2011 , in Ameren common stock and in each of the indices shown, and it assumesthat all of the dividends were reinvested.
December 31, 2011 2012 2013 2014 2015 2016Ameren (AEE) $ 100.00 $ 97.47 $ 120.19 $ 159.53 $ 155.75 $ 195.71S&P 500 Index 100.00 116.00 153.57 174.60 177.01 198.18EEI Index 100.00 102.09 115.37 148.73 142.93 167.85
Ameren management cautions that the stock price performance shown above should not be considered indicative of potential future stock price performance.
30

Table of Contents
ITEM 6.SELECTED FINANCIAL DATA
For the years ended December 31,(In millions, except per share amounts) 2016 2015 2014 2013 2012
Ameren (a) : Operating revenues $ 6,076 $ 6,098 $ 6,053 $ 5,838 $ 5,781
Operating income (b) 1,381 1,259 1,254 1,184 1,188Income from continuing operations 659 585 593 518 522Income (loss) from discontinued operations, net of taxes (c) — 51 (1) (223) (1,496)Net income (loss) attributable to Ameren commonshareholders 653 630 586 289 (974)Common stock dividends 416 402 390 388 382Continuing operations earnings per share – basic 2.69 2.39 2.42 2.11 2.13Continuing operations earnings per share – diluted 2.68 2.38 2.40 2.10 2.13Common stock dividends per share 1.715 1.655 1.61 1.60 1.60
As of December 31: Total assets (d) $ 24,699 $ 23,640 $ 22,289 $ 20,907 $ 22,022Long-term debt, excluding current maturities 6,595 6,880 6,085 5,475 5,765Total Ameren Corporation shareholders’ equity 7,103 6,946 6,713 6,544 6,616
Ameren Missouri: Operating revenues $ 3,523 $ 3,609 $ 3,553 $ 3,541 $ 3,272
Operating income (b) 745 742 785 803 845Net income available to common shareholder 357 352 390 395 416Dividends to parent 355 575 340 460 400
As of December 31: Total assets $ 14,035 $ 13,851 $ 13,474 $ 12,867 $ 12,998Long-term debt, excluding current maturities 3,563 3,844 3,861 3,631 3,782Total shareholders' equity 4,090 4,082 4,052 3,993 4,054
Ameren Illinois: Operating revenues $ 2,490 $ 2,466 $ 2,498 $ 2,311 $ 2,525Operating income 544 466 450 415 377Net income available to common shareholder 252 214 201 160 141Dividends to parent 110 — — 110 189
As of December 31:
Total assets $ 9,474 $ 8,903 $ 8,204 $ 7,397 $ 7,186Long-term debt, excluding current maturities 2,338 2,342 2,224 1,844 1,566Total shareholders' equity 3,034 2,897 2,661 2,448 2,401
(a) Includes amounts for Ameren registrant and nonregistrant subsidiaries and intercompany eliminations.(b) Includes a $69 million provision recorded in 2015 for all of the previously capitalized COL costs relating to the second nuclear unit at its existing Callaway energy center .(c) See Note 1 – Summary of Significant Accounting Policies under Part II, Item 8, of this report for additional information.(d) Includes total assets from discontinued operations of $15 million , $14 million , $15 million, $165 million, and $1,611 million at December 31, 2016, 2015, 2014, 2013, and 2012,
respectively.
31
Table of Contents
ITEM 7.MANAGEMENT'S DISCUSSION AND ANALYSIS OF FINANCIAL CONDITION AND RESULTS OF OPERATIONS
Ameren, headquartered in St. Louis, Missouri, is a public utility holdingcompany under PUHCA 2005. Ameren’s primary assets are its equityinterests in its subsidiaries, including Ameren Missouri, Ameren Illinois, andATXI. Ameren’s subsidiaries are separate, independent legal entities withseparate businesses, assets, and liabilities. Dividends on Ameren’s commonstock and the payment of expenses by Ameren depend on distributions madeto it by its subsidiaries.
Below is a summary description of Ameren's principal subsidiaries.Ameren also has various other subsidiaries that conduct other activities, suchas the provision of shared services. A more detailed description can be foundin Note 1 – Summary of Significant Accounting Policies under Part II, Item 8,of this report.
• Ameren Missouri operates a rate-regulated electric generation,transmission, and distribution business and a rate-regulated natural gasdistribution business in Missouri.
• Ameren Illinois operates rate-regulated electric distribution, electrictransmission and natural gas distribution businesses in Illinois.
• ATXI operates a FERC rate-regulated electric transmission business.ATXI is developing MISO-approved electric transmission projects,including the Illinois Rivers, Spoon River, and Mark Twain projects.ATXI is also evaluating competitive electric transmission investmentopportunities outside of MISO as they arise.
Unless otherwise stated, the following sections of Management'sDiscussion and Analysis of Financial Condition and Results of Operationsexclude discontinued operations for all periods presented. See Note 1 –Summary of Significant Accounting Policies under Part II, Item 8, of thisreport for additional information regarding that presentation.
Ameren's financial statements are prepared on a consolidated basis andtherefore include the accounts of its majority-owned subsidiaries. Allintercompany transactions have been eliminated. Ameren Missouri andAmeren Illinois have no subsidiaries. All tabular dollar amounts are inmillions, unless otherwise indicated.
In addition to presenting results of operations and earnings amounts intotal, we present certain information in cents per share. These amounts reflectfactors that directly affect Ameren’s earnings. We believe this per shareinformation helps readers to understand the impact of these factors onAmeren’s earnings per share. All references in this report to earnings pershare are based on average diluted common shares outstanding for therelevant period.
OVERVIEW
Ameren’s strategic plan includes investing in and operating its utilities ina manner consistent with existing regulatory frameworks, enhancing thoseframeworks and advocating for responsible energy and economic policies, aswell as creating and capitalizing on opportunities for investment for thebenefit of
its customers and shareholders. In 2016, Ameren successfully executed itsstrategy. Ameren continued to allocate significant amounts of capital to thosebusinesses that are supported by constructive regulatory frameworks. In 2016,Ameren invested $1.3 billion of capital expenditures in its FERC rate-regulated electric transmission and Illinois electric and natural gas distributionbusinesses.
In 2016, Ameren continued to work to enhance its regulatory frameworksand advocate for responsible energy and economic policies and to create andcapitalize on opportunities for investment for the benefit of its customers andshareholders. Ameren Illinois successfully advocated for the FEJA, whichimproved the constructive regulatory framework for Ameren Illinois' electricdistribution business. The FEJA revised certain portions of the IEIMA,including extending the IEIMA formula ratemaking process through 2022 .Also, beginning in 2017, the FEJA decouples electric distribution revenuesestablished in a rate proceeding from actual sales volumes by providing thatany revenue changes driven by actual electric distribution sales volumesdiffering from sales volumes reflected in that year's rates will be collectedfrom or refunded to customers within two years. This portion of the lawextends beyond the end of the IEIMA in 2022. Further, beginning as early asJune 2017, the FEJA will allow Ameren Illinois to capitalize as a regulatoryasset and earn a return on its electric energy efficiency investments.
In July 2016, Ameren Missouri filed a request with the MoPSC seekingapproval to increase its annual revenues for electric service. Relating to thatrequest, in February 2017, Ameren Missouri, the MoPSC staff, the MoOPC,and all intervenors filed a unanimous stipulation and agreement with theMoPSC. The stipulation and agreement, which is subject to MoPSC approval,would result in a $3.4 billion revenue requirement, which is a $92 millionincrease in Ameren Missouri’s annual revenue requirement for electric servicecompared to its prior revenue requirement established in the MoPSC's April2015 electric rate order. The stipulation and agreement did not specify thecommon equity percentage, the rate base, or the allowed return on commonequity. The new revenue requirement reflects the current actual sales volumesof the New Madrid Smelter, whose operations remain suspended, as well asother agreed upon sales volumes. Excluding cost reductions associated withreduced sales volumes, the base level of net energy costs under the stipulationand agreement would decrease by $54 million from the base level establishedin the MoPSC's April 2015 electric rate order. Changes in amortizations andthe base level of expenses for the other regulatory tracking mechanisms,including extending the amortization period of certain regulatory assets,would reduce expenses by $26 million from the base levels established in theMoPSC's April 2015 electric rate order. The stipulation and agreementcontemplates that new rates will become effective on or before March 20,2017.
Related to ATXI's and Ameren Illinois' FERC rate-regulated transmissionbusinesses, in September 2016, the FERC issued a final order in theNovember 2013 complaint case which lowered the total allowed return oncommon equity to 10.82%. The new
32

Table of Contents
allowed return on common equity has been reflected in rates prospectivelyfrom the September 2016 effective date of the order. The FERC is expected toissue a final order in the February 2015 complaint case in the second quarterof 2017. That final order will determine the allowed return on common equityfor the 15-month period ended May 2016. That final order will also establishthe allowed return on common equity that will apply prospectively from itsexpected second quarter 2017 effective date, replacing the current 10.82%total return on common equity, which became effective in September 2016.
In October 2016, Ameren’s board of directors increased the quarterlycommon stock dividend to 44 cents per share, resulting in an annualizedequivalent dividend rate of $1.76 per share.
Earnings
Net income attributable to Ameren common shareholders fromcontinuing operations was $653 million , or $2.68 per diluted share, for 2016 ,and $579 million , or $2.38 per diluted share, for 2015 . These earnings werefavorably affected in 2016, compared with 2015, by increased AmerenTransmission and Ameren Illinois Electric Distribution earnings, reflectingAmeren’s strategy to allocate incremental capital to those businesses,increased demand due to warmer summer temperatures, higher natural gasdistribution rates at Ameren Illinois pursuant to a December 2015 order, anddecreased other operations and maintenance expenses. Net income was alsofavorably affected in 2016, compared with 2015, by an income tax benefitrecorded in 2016 at Ameren (parent) pursuant to the adoption of newaccounting guidance related to share-based compensation, as well as theabsence of a provision recognized in 2015 as a result of Ameren Missouri’sdiscontinued efforts to license and build a second nuclear unit at its existingCallaway energy center site. Net income was unfavorably affected in 2016,compared with 2015, by the absence in 2016 of MEEIA 2013 net sharedbenefits, partially offset by the recognition of a MEEIA 2013 performanceincentive, decreased Ameren Missouri sales to the New Madrid Smelterresulting from a reduction in operations at that plant, and the cost of theCallaway energy center’s scheduled refueling and maintenance outage.Additionally, earnings were unfavorably affected in 2016, compared with2015, by increased depreciation and amortization expenses at AmerenMissouri, the absence in 2016 of a January 2015 ICC order regarding AmerenIllinois’ cumulative power usage cost and its purchased power ridermechanism, and decreased Ameren Missouri electric margins resulting fromincreased transmission charges, net of transmission revenues.
Liquidity
At December 31, 2016 , Ameren, on a consolidated basis, had availableliquidity in the form of amounts available under credit agreements of $1.5billion .
Capital Expenditures
In 2016 , Ameren continued to make significant investment in its utilitybusinesses by making capital expenditures of $0.7 billion , $0.5 billion , $0.2billion , and $0.7 billion in Ameren
Missouri, Ameren Illinois Electric Distribution, Ameren Illinois Natural Gas,and Ameren Transmission, respectively. For 2017 through 2021 , Ameren'scumulative capital expenditures are projected to range from $10.4 billion to$11.2 billion . The projected spending by segment includes up to $4.2 billion ,$2.6 billion , $1.5 billion , and $2.9 billion for Ameren Missouri, AmerenIllinois Electric Distribution, Ameren Illinois Natural Gas, and AmerenTransmission, respectively.
RESULTS OF OPERATIONS
Our results of operations and financial position are affected by manyfactors. Weather, economic conditions, energy efficiency investments by ourcustomers and us, and the actions of key customers can significantly affect thedemand for our services. Our results are also affected by seasonal fluctuationsin winter heating and summer cooling demands. Ameren and AmerenMissouri are also affected by nuclear refueling and other energy centermaintenance outages. Additionally, fluctuations in interest rates andconditions in the capital and credit markets affect our cost of borrowing andour pension and postretirement benefits costs. Almost all of Ameren’srevenues are subject to state or federal regulation. This regulation has amaterial impact on the prices we charge for our services. Our results ofoperations, financial position, and liquidity are affected by our ability to alignour overall spending, both operating and capital, with regulatory frameworksestablished by our regulators.
Ameren Missouri principally uses coal, nuclear fuel, and natural gas forfuel in its electric operations and purchases natural gas for its customers.Ameren Illinois purchases power and natural gas for its customers. The pricesfor these commodities can fluctuate significantly because of the globaleconomic and political environment, weather, supply, demand, and manyother factors. We have natural gas cost recovery mechanisms for our Illinoisand Missouri natural gas distribution service businesses, a purchased powercost recovery mechanism for Ameren Illinois' electric distribution servicebusiness, and a FAC for Ameren Missouri's electric utility business.
Ameren Illinois' electric distribution service utility business, pursuant tothe IEIMA, conducts an annual reconciliation of the revenue requirementnecessary to reflect the actual costs incurred in a given year with the revenuerequirement included in customer rates for that year. Recoveries from orrefunds to customers occur in a subsequent year. Included in Ameren Illinois'revenue requirement reconciliation is a formula for the return on equity,which is equal to the average of the monthly yields of 30-year United StatesTreasury bonds plus 580 basis points. Therefore, Ameren Illinois' annualreturn on equity is directly correlated to yields on United States Treasurybonds. Ameren Illinois and ATXI use a company-specific, forward-lookingrate formula framework in setting their transmission rates. These rates areupdated each January with forecasted information. A reconciliation during theyear, which adjusts for the actual revenue requirement and actual salesvolumes, is used to adjust billing rates in a subsequent year.
33

Table of Contents
Ameren Illinois’ and ATXI’s electric transmission service businesses andAmeren Illinois’ electric distribution service business operate under formularatemaking designed to provide for the recovery of actual costs of service thatare prudently incurred as well as a return on equity. Although rate-regulated,Ameren Illinois’ natural gas business and Ameren Missouri do not operateunder formula ratemaking. Ameren (parent) is not rate-regulated.
We employ various risk management strategies to reduce our exposure tocommodity risk and other risks inherent in our business. The reliability ofAmeren Missouri's energy centers and our transmission and distributionsystems and the level of purchased power costs, operations and maintenancecosts, and capital investment are key factors that we seek to manage in orderto optimize our results of operations, financial position, and liquidity.
During the fourth quarter of 2016, the Ameren Companies changed themanner in which performance is assessed and resources are allocated, drivenby increasing investment in FERC-regulated electric transmission andAmeren Illinois electric distribution and natural gas distribution businesses, aswell as the unique regulatory environment for each jurisdiction. Ameren nowhas four segments: Ameren Missouri, Ameren Illinois Electric Distribution,Ameren Illinois Natural Gas, and Ameren Transmission, which primarilyincludes Ameren Illinois Transmission and ATXI. Ameren Missouri has onesegment, which includes all of the operations of Ameren Missouri. AmerenIllinois has three segments: Ameren Illinois Electric Distribution, AmerenIllinois Natural Gas, and Ameren Illinois Transmission. Prior-periodpresentation has been adjusted for comparative purposes. See Note 16 –Segment Information under Part II, Item 8, of this report for further discussionof Ameren’s, Ameren Missouri's, and Ameren Illinois' segments.
Earnings Summary
The following table presents a summary of Ameren's earnings for theyears ended December 31, 2016 , 2015 , and 2014 :
2016 2015 2014Net income attributable to Amerencommon shareholders $ 653 $ 630 $ 586
Earnings per common share – diluted 2.68 2.59 2.40Net income attributable to Amerencommon shareholders – continuingoperations 653 579 587Earnings per common share – diluted –continuing operations 2.68 2.38 2.40
2016 versus 2015
Net income attributable to Ameren common shareholders fromcontinuing operations in 2016 increased $74 million , or $0.30 per dilutedshare, from 2015. The increase was due to net income increases of $34million , $22 million , $5 million , and $3 million at Ameren Transmission,Ameren Illinois Natural Gas, Ameren Missouri, and Ameren Illinois ElectricDistribution,
respectively. Additionally, the net loss from other businesses, primarilyAmeren (parent), and intersegment eliminations decreased $10 million .
In 2015, net income attributable to Ameren common shareholders fromdiscontinued operations was favorably affected by the recognition of a taxbenefit resulting from the removal of a reserve for unrecognized tax benefitsof $53 million recorded in 2013 related to the divestiture of New AER, basedon the completion of the IRS audit of Ameren’s 2013 tax year.
Compared with 2015, 2016 earnings per share from continuingoperations were favorably affected by:
• increased Ameren Transmission earnings under formula ratemaking,primarily due to additional rate base investment. Ameren Transmissionearnings also benefited from a temporarily higher allowed return oncommon equity, recognizing an allowed return on common equity of12.38% for nearly four months in 2016 as a result of the expiration of therefund period in the February 2015 complaint case (19 cents per share);
• the absence of a provision recognized in the second quarter of 2015 as aresult of Ameren Missouri’s discontinued efforts to license and build asecond nuclear unit at its existing Callaway energy center site (18 centsper share);
• increased demand due to warmer summer temperatures in 2016, partiallyoffset by milder winter temperatures (estimated at 15 cents per share);
• higher natural gas distribution rates at Ameren Illinois pursuant to aDecember 2015 order (11 cents per share);
• an income tax benefit recorded at Ameren (parent) pursuant to theadoption of new accounting guidance related to share-basedcompensation (9 cents per share);
• decreased other operations and maintenance expenses not subject toriders or regulatory tracking mechanisms at Ameren Missouri (7 centsper share). This was due, in part, to a reduction in energy centermaintenance costs, excluding the cost of the Callaway energy center'sscheduled refueling and maintenance outage (discussed below) andreduced electric distribution maintenance expenditures; and
• increased Ameren Illinois Electric Distribution earnings under formularatemaking, primarily due to additional rate base investment partiallyoffset by a lower return on equity resulting from a reduction in the 30-year United States Treasury bond yields (2 cents per share).
Compared with 2015, 2016 earnings per share from continuingoperations were unfavorably affected by:
• the absence in 2016 of MEEIA net shared benefits due to the expirationof MEEIA 2013, partially offset by the recognition of a MEEIA 2013performance incentive (15 cents per share);
• decreased Ameren Missouri sales to the New Madrid Smelter resultingfrom a reduction in operations at the smelter (15 cents per share);
• the cost of the Callaway energy center's scheduled refueling
34
Table of Contents
and maintenance outage in 2016. There was no Callaway refueling andmaintenance outage in 2015 (7 cents per share);
• increased depreciation and amortization expenses not subject to riders orregulatory tracking mechanisms at Ameren Missouri primarily because ofelectric system capital additions (4 cents per share);
• decreased Ameren Illinois Electric Distribution earnings resulting fromthe absence in 2016 of a January 2015 ICC order regarding AmerenIllinois’ cumulative power usage cost and its purchased power ridermechanism (4 cents per share);
• decreased Ameren Missouri electric margins resulting from increasedtransmission charges, net of transmission revenues (3 cents per share);and
• increased other operations and maintenance expenses not subject to ridersor regulatory tracking mechanisms at Ameren Illinois Natural Gas,primarily due to increased repairs and compliance expenditures (2 centsper share).
The cents per share information presented above is based on the dilutedaverage shares outstanding in 2015. Pretax amounts have been presented netof income taxes, using Ameren's 2015 statutory tax rate of 39%.
2015 versus 2014
Net income attributable to Ameren common shareholders fromcontinuing operations in 2015 decreased $8 million , or $0.02 per dilutedshare, from 2014. The decrease was due to a $38 million and a $13 milliondecrease in net income from Ameren Missouri and Ameren Illinois NaturalGas, respectively. The decrease was partially offset by a $32 million and a$10 million increase in net income from Ameren Transmission and AmerenIllinois Electric Distribution, respectively.
In 2015, net income attributable to Ameren common shareholders fromdiscontinued operations was favorably affected by the recognition of a taxbenefit resulting from the removal of a reserve for unrecognized tax benefitsof $53 million recorded in 2013 related to the divestiture of New AER, basedon the completion of the IRS audit of Ameren’s 2013 tax year.
Compared with 2014, 2015 earnings per share from continuingoperations were unfavorably affected by:
• a provision recognized in the second quarter of 2015 as a result ofAmeren Missouri’s discontinued efforts to license and build a secondnuclear unit at its existing Callaway energy center site (18 cents pershare);
• decreased electric and natural gas sales volumes, primarily due to warmerwinter temperatures in 2015 (estimated at 6 cents per share);
• increased net financing costs at Ameren Missouri, primarily due to areduction in allowance for funds used during construction as multiplesignificant electric capital projects were completed in 2014 (6 cents pershare);
• increased depreciation and amortization expenses at Ameren IllinoisNatural Gas, resulting from amortization of
capital additions, and at Ameren Missouri, primarily resulting fromelectric capital additions completed in 2014 which were not reflected incustomer rates until May 30, 2015 (5 cents per share); and
• the absence in 2015 of a recovery of certain previously disallowed debtpremium costs per the ICC's December 2014 order (3 cents per share).
Compared with 2014, 2015 earnings per share from continuingoperations were favorably affected by:
• increased Ameren Transmission earnings under formula ratemaking,primarily due to additional rate base investment (15 cents per share).These earnings were reduced by an estimate of the probable customerrefunds as a result of the FERC complaint cases regarding the allowedreturn on common equity (3 cents per share);
• increased Ameren Illinois Electric Distribution earnings under formularatemaking, primarily due to additional rate base investment as well asinterest earned on the revenue requirement reconciliation adjustmentregulatory assets (5 cents per share), partially offset by a lower return onequity due to a reduction in the 30-year United States Treasury bondyields (2 cents per share);
• the absence of a Callaway energy center scheduled refueling andmaintenance outage in 2015, partially offset by preparation costs incurredin 2015 for the 2016 scheduled refueling outage (7 cents per share);
• increased Ameren Illinois Electric Distribution earnings resulting from aJanuary 2015 ICC order regarding Ameren Illinois’ cumulative powerusage cost and its purchased power rider mechanism (4 cents per share);
• excluding the scheduled refueling and maintenance outage, MEEIAprogram costs, and expenses with corresponding increases in electricrevenues resulting from the April 2015 MoPSC electric rate order,decreased other operations and maintenance expenses at AmerenMissouri primarily because of decreased energy center costs and at otherbusinesses (4 cents per share); and
• decreased interest expense attributable to other businesses, primarily dueto Ameren's (parent) maturity of higher-cost debt in 2014 being replacedwith lower-cost debt in 2015 (4 cents per share).
The cents per share information presented above is based on the dilutedaverage shares outstanding in 2014. Pretax amounts have been presented netof income taxes, using Ameren's 2014 statutory tax rate of 39%.
For additional details regarding the Ameren Companies’ segment resultsof operations, including explanations of Margins, Other Operations andMaintenance Expenses, Provision for Callaway Construction and OperatingLicense, Depreciation and Amortization, Taxes Other Than Income Taxes,Other Income and Expenses, Interest Charges, Income Taxes, and Income(Loss) from Discontinued Operations, Net of Taxes, see the major headingsbelow.
35

Table of Contents
Below is Ameren's table of income statement components by segment for the years ended December 31, 2016 , 2015 , and 2014 :
2016 Ameren Missouri
AmerenIllinoisElectric
Distribution
AmerenIllinois
Natural Gas Ameren
Transmission
Other /IntersegmentEliminations Total
Electric margins $ 2,397 $ 1,105 $ — $ 355 $ (27) $ 3,830Natural gas margins 79 — 462 — (2) 539Other revenues 1 — — — (1) —Other operations and maintenance (893) (538) (215) (60) 30 (1,676)Depreciation and amortization (514) (226) (55) (43) (7) (845)Taxes other than income taxes (325) (72) (58) (4) (8) (467)Other income and (expenses) 42 8 (1) 2 (9) 42Interest charges (211) (72) (34) (58) (7) (382)Income taxes (216) (78) (39) (74) 25 (382)Income (loss) from continuing operations 360 127 60 118 (6) 659Income from discontinued operations, net oftaxes — — — — — —Net income (loss) 360 127 60 118 (6) 659Noncontrolling interests – preferred stockdividends (3) (1) (1) (1) — (6)Net income (loss) attributable to Amerencommon shareholders $ 357 $ 126 $ 59 $ 117 $ (6) $ 653
2015 Electric margins $ 2,481 $ 1,074 $ — $ 259 $ (26) $ 3,788Natural gas margins 80 — 425 — (2) 503Other revenues 2 — — — (2) —Other operations and maintenance (925) (532) (219) (56) 38 (1,694)Provision for Callaway construction andoperating license (69) — — — — (69)Depreciation and amortization (492) (212) (52) (33) (7) (796)Taxes other than income taxes (335) (72) (56) (2) (8) (473)Other income and (expenses) 41 8 (1) 2 (6) 44Interest charges (219) (71) (35) (35) 5 (355)Income taxes (209) (71) (24) (51) (8) (363)Income (loss) from continuing operations 355 124 38 84 (16) 585Income from discontinued operations, net oftaxes — — — — 51 51Net income 355 124 38 84 35 636Noncontrolling interests – preferred stockdividends (3) (1) (1) (1) — (6)Net income attributable to Ameren commonshareholders $ 352 $ 123 $ 37 $ 83 $ 35 $ 630
2014 Electric margins $ 2,436 $ 1,025 $ — $ 187 $ (22) $ 3,626Natural gas margins 82 — 443 — — 525Other revenues 1 — — — (1) —Other operations and maintenance (939) (507) (220) (49) 31 (1,684)Depreciation and amortization (473) (197) (41) (26) (8) (745)Taxes other than income taxes (322) (73) (63) (2) (8) (468)Other income and (expenses) 48 4 (1) 6 — 57Interest charges (211) (63) (28) (26) (13) (341)Income (taxes) benefit (229) (75) (39) (38) 4 (377)Income (loss) from continuing operations 393 114 51 52 (17) 593Loss from discontinued operations, net of taxes — — — — (1) (1)Net income (loss) 393 114 51 52 (18) 592Noncontrolling interests – preferred stockdividends (3) (1) (1) (1) — (6)Net income (loss) attributable to Amerencommon shareholders $ 390 $ 113 $ 50 $ 51 $ (18) $ 586

36

Table of Contents
Below is Ameren Illinois' table of income statement components by segment for the years ended December 31, 2016 , 2015 , and 2014 :
2016 Electric Distribution Natural Gas Transmission TotalElectric margins $ 1,105 $ — $ 232 $ 1,337Natural gas margins — 462 — 462Other operations and maintenance (538) (215) (51) (804)Depreciation and amortization (226) (55) (38) (319)Taxes other than income taxes (72) (58) (2) (132)Other income and (expenses) 8 (1) 2 9Interest charges (72) (34) (34) (140)Income taxes (78) (39) (41) (158)Net income 127 60 68 255Preferred stock dividends (1) (1) (1) (3)Net income attributable to common shareholder $ 126 $ 59 $ 67 $ 252
2015 Electric margins $ 1,074 $ — $ 189 $ 1,263Natural gas margins — 425 — 425Other operations and maintenance (532) (219) (46) (797)Depreciation and amortization (212) (52) (31) (295)Taxes other than income taxes (72) (56) (2) (130)Other income and (expenses) 8 (1) 2 9Interest charges (71) (35) (25) (131)Income taxes (71) (24) (32) (127)Net income 124 38 55 217Preferred stock dividends (1) (1) (1) (3)Net income attributable to common shareholder $ 123 $ 37 $ 54 $ 214
2014 Electric margins $ 1,025 $ — $ 154 $ 1,179Natural gas margins — 443 — 443Other operations and maintenance (507) (220) (44) (771)Depreciation and amortization (197) (41) (25) (263)Taxes other than income taxes (73) (63) (2) (138)Other income and (expenses) 4 (1) 6 9Interest charges (63) (28) (21) (112)Income taxes (75) (39) (29) (143)Net income 114 51 39 204Preferred stock dividends (1) (1) (1) (3)Net income attributable to common shareholder $ 113 $ 50 $ 38 $ 201
Margins
The following table presents the favorable (unfavorable) variations by segment for electric and natural gas margins in 2016 compared with 2015, as well as2015 compared with 2014. Electric margins are defined as electric revenues less fuel and purchased power costs. Natural gas margins are defined as natural gasrevenues less natural gas purchased for resale. We consider electric and natural gas margins useful measures to analyze the change in profitability of our electricand natural gas operations between periods. We have included the analysis below as a complement to the financial information we provide in accordance withGAAP. However, these margins may not be a presentation defined under GAAP, and they may not be comparable to other companies’ presentations or more usefulthan the GAAP information we provide elsewhere in this report.
37
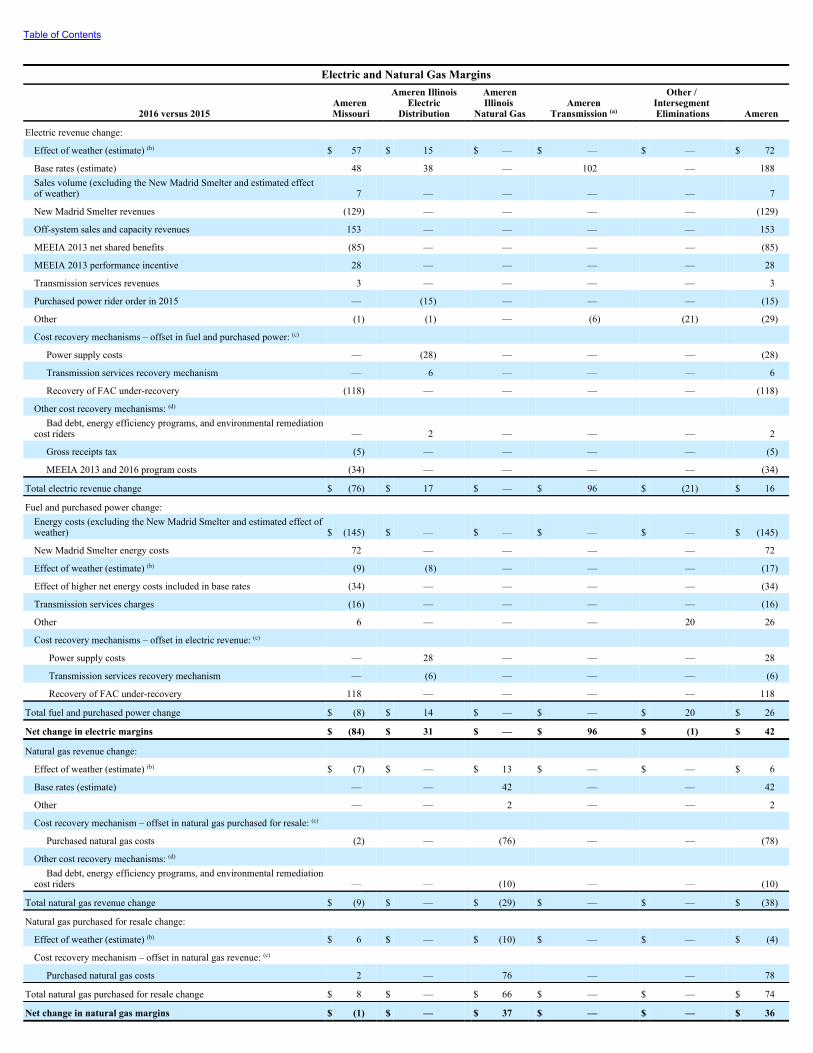
Table of Contents
Electric and Natural Gas Margins
2016 versus 2015Ameren Missouri
Ameren IllinoisElectric
Distribution
AmerenIllinois
Natural Gas Ameren
Transmission (a)
Other / Intersegment Eliminations Ameren
Electric revenue change:
Effect of weather (estimate) (b) $ 57 $ 15 $ — $ — $ — $ 72
Base rates (estimate) 48 38 — 102 — 188Sales volume (excluding the New Madrid Smelter and estimated effectof weather) 7 — — — — 7
New Madrid Smelter revenues (129) — — — — (129)
Off-system sales and capacity revenues 153 — — — — 153
MEEIA 2013 net shared benefits (85) — — — — (85)
MEEIA 2013 performance incentive 28 — — — — 28
Transmission services revenues 3 — — — — 3
Purchased power rider order in 2015 — (15) — — — (15)
Other (1) (1) — (6) (21) (29)
Cost recovery mechanisms – offset in fuel and purchased power: (c)
Power supply costs — (28) — — — (28)
Transmission services recovery mechanism — 6 — — — 6
Recovery of FAC under-recovery (118) — — — — (118)
Other cost recovery mechanisms: (d) Bad debt, energy efficiency programs, and environmental remediationcost riders — 2 — — — 2
Gross receipts tax (5) — — — — (5)
MEEIA 2013 and 2016 program costs (34) — — — — (34)
Total electric revenue change $ (76) $ 17 $ — $ 96 $ (21) $ 16
Fuel and purchased power change: Energy costs (excluding the New Madrid Smelter and estimated effect ofweather) $ (145) $ — $ — $ — $ — $ (145)
New Madrid Smelter energy costs 72 — — — — 72
Effect of weather (estimate) (b) (9) (8) — — — (17)
Effect of higher net energy costs included in base rates (34) — — — — (34)
Transmission services charges (16) — — — — (16)
Other 6 — — — 20 26
Cost recovery mechanisms – offset in electric revenue: (c)
Power supply costs — 28 — — — 28
Transmission services recovery mechanism — (6) — — — (6)
Recovery of FAC under-recovery 118 — — — — 118
Total fuel and purchased power change $ (8) $ 14 $ — $ — $ 20 $ 26
Net change in electric margins $ (84) $ 31 $ — $ 96 $ (1) $ 42
Natural gas revenue change:
Effect of weather (estimate) (b) $ (7) $ — $ 13 $ — $ — $ 6
Base rates (estimate) — — 42 — — 42
Other — — 2 — — 2
Cost recovery mechanism – offset in natural gas purchased for resale: (c)
Purchased natural gas costs (2) — (76) — — (78)
Other cost recovery mechanisms: (d) Bad debt, energy efficiency programs, and environmental remediationcost riders — — (10) — — (10)
Total natural gas revenue change $ (9) $ — $ (29) $ — $ — $ (38)
Natural gas purchased for resale change:
Effect of weather (estimate) (b) $ 6 $ — $ (10) $ — $ — $ (4)
Cost recovery mechanism – offset in natural gas revenue: (c)
Purchased natural gas costs 2 — 76 — — 78
Total natural gas purchased for resale change $ 8 $ — $ 66 $ — $ — $ 74
Net change in natural gas margins $ (1) $ — $ 37 $ — $ — $ 36

38
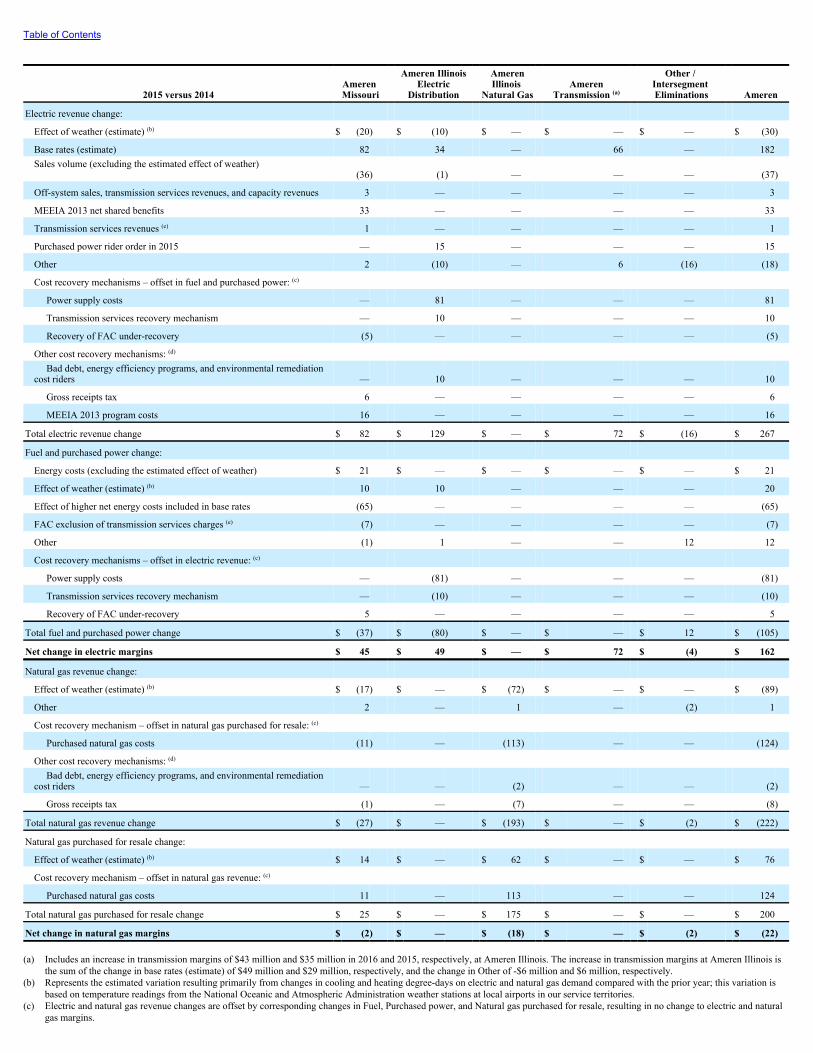
Table of Contents
2015 versus 2014Ameren Missouri
Ameren IllinoisElectric
Distribution
AmerenIllinois
Natural Gas Ameren
Transmission (a)
Other / Intersegment Eliminations Ameren
Electric revenue change:
Effect of weather (estimate) (b) $ (20) $ (10) $ — $ — $ — $ (30)
Base rates (estimate) 82 34 — 66 — 182Sales volume (excluding the estimated effect of weather)
(36) (1) — — — (37)
Off-system sales, transmission services revenues, and capacity revenues 3 — — — — 3
MEEIA 2013 net shared benefits 33 — — — — 33
Transmission services revenues (e) 1 — — — — 1
Purchased power rider order in 2015 — 15 — — — 15
Other 2 (10) — 6 (16) (18)
Cost recovery mechanisms – offset in fuel and purchased power: (c)
Power supply costs — 81 — — — 81
Transmission services recovery mechanism — 10 — — — 10
Recovery of FAC under-recovery (5) — — — — (5)
Other cost recovery mechanisms: (d) Bad debt, energy efficiency programs, and environmental remediationcost riders — 10 — — — 10
Gross receipts tax 6 — — — — 6
MEEIA 2013 program costs 16 — — — — 16
Total electric revenue change $ 82 $ 129 $ — $ 72 $ (16) $ 267
Fuel and purchased power change:
Energy costs (excluding the estimated effect of weather) $ 21 $ — $ — $ — $ — $ 21
Effect of weather (estimate) (b) 10 10 — — — 20
Effect of higher net energy costs included in base rates (65) — — — — (65)
FAC exclusion of transmission services charges (e) (7) — — — — (7)
Other (1) 1 — — 12 12
Cost recovery mechanisms – offset in electric revenue: (c)
Power supply costs — (81) — — — (81)
Transmission services recovery mechanism — (10) — — — (10)
Recovery of FAC under-recovery 5 — — — — 5
Total fuel and purchased power change $ (37) $ (80) $ — $ — $ 12 $ (105)
Net change in electric margins $ 45 $ 49 $ — $ 72 $ (4) $ 162
Natural gas revenue change:
Effect of weather (estimate) (b) $ (17) $ — $ (72) $ — $ — $ (89)
Other 2 — 1 — (2) 1
Cost recovery mechanism – offset in natural gas purchased for resale: (c)
Purchased natural gas costs (11) — (113) — — (124)
Other cost recovery mechanisms: (d) Bad debt, energy efficiency programs, and environmental remediationcost riders — — (2) — — (2)
Gross receipts tax (1) — (7) — — (8)
Total natural gas revenue change $ (27) $ — $ (193) $ — $ (2) $ (222)
Natural gas purchased for resale change:
Effect of weather (estimate) (b) $ 14 $ — $ 62 $ — $ — $ 76
Cost recovery mechanism – offset in natural gas revenue: (c)
Purchased natural gas costs 11 — 113 — — 124
Total natural gas purchased for resale change $ 25 $ — $ 175 $ — $ — $ 200
Net change in natural gas margins $ (2) $ — $ (18) $ — $ (2) $ (22)
(a) Includes an increase in transmission margins of $43 million and $35 million in 2016 and 2015, respectively, at Ameren Illinois. The increase in transmission margins at Ameren Illinois isthe sum of the change in base rates (estimate) of $49 million and $29 million, respectively, and the change in Other of -$6 million and $6 million, respectively.
(b) Represents the estimated variation resulting primarily from changes in cooling and heating degree-days on electric and natural gas demand compared with the prior year; this variation isbased on temperature readings from the National Oceanic and Atmospheric Administration weather stations at local airports in our service territories.
(c) Electric and natural gas revenue changes are offset by corresponding changes in Fuel, Purchased power, and Natural gas purchased for resale, resulting in no change to electric and naturalgas margins.

(d) See Other Operations and Maintenance Expenses or Taxes Other Than Income Taxes in this section for the related offsetting increase or decrease to expense. These items have no overallimpact on earnings.
(e) Ameren Missouri amounts are subsequent to May 30, 2015, due to the exclusion of transmission revenues and substantially all transmission charges from the FAC as a result of the April2015 MoPSC electric rate order.
39

Table of Contents
2016 versus 2015
Ameren
Ameren's electric margins increased $42 million , or 1% , in 2016compared with 2015 , primarily because of increased margins at AmerenTransmission and Ameren Illinois Electric Distribution, partially offset bydecreased margins at Ameren Missouri. Ameren's natural gas marginsincreased $36 million , or 7% , in 2016 compared with 2015 , primarilybecause of increased margins at Ameren Illinois Natural Gas.
Ameren Missouri
Ameren Missouri has a FAC cost recovery mechanism that allows it torecover or refund, through customer rates, 95% of changes in net energy costsgreater or less than the amount set in base rates without a traditional rateproceeding, subject to MoPSC prudence reviews, with the remaining 5% ofchanges retained by Ameren Missouri.
Net energy costs, as defined in the FAC, include fuel and purchasedpower costs, including transportation, net of off-system sales. Since May2015, when transmission revenues and substantially all transmission chargeswere excluded from net energy costs as a result of the April 2015 MoPSCelectric rate order, electric margins have been unfavorably affected, asdiscussed below. Ameren Missouri accrues net energy costs that exceed theamount set in base rates (FAC under-recovery) as a regulatory asset. Netrecovery of these costs through customer rates does not affect AmerenMissouri's electric margins, as any change in revenue is offset by acorresponding change in fuel expense to reduce the previously recognizedFAC regulatory asset.
Ameren Missouri's electric margins decreased $84 million , or 3% , in2016 compared with 2015 . The following items had an unfavorable effect onAmeren Missouri's electric margins:
• The suspension of the New Madrid Smelter operations in the first quarterof 2016, which decreased margins by $57 million. The change in marginsdue to lower sales to the New Madrid Smelter is the sum of New MadridSmelter revenues ( -$129 million ) and New Madrid Smelter energy costs( +$72 million ) in the Electric and Natural Gas Margins table above.New Madrid Smelter energy costs include the impact of a provision inthe FAC tariff that, under certain circumstances, allows Ameren Missourito retain a portion of the revenues from any off-system sales it makes as aresult of reduced sales to the New Madrid Smelter. See Note 2 - Rate andRegulatory Matters under Part II, Item 8, of this report for informationregarding the New Madrid Smelter.
• The expiration of MEEIA 2013, which decreased margins by $57million. The change in margins due to the expiration of MEEIA 2013 isthe sum of MEEIA 2013 net shared benefits ( -$85 million ) and MEEIA2013 performance incentive ( +$28 million ) in the Electric and NaturalGas Margins table above. Net shared benefits compensated AmerenMissouri for lower sales volumes from energy-efficiency-related volumereductions in current and future periods. See Note 2 - Rate andRegulatory Matters under Part II, Item 8, of this report for
information regarding the MEEIA 2013 performance incentive.• Increased transmission services charges resulting from additional MISO-
approved electric transmission investments made by other entities andshared by all MISO participants, which decreased margins by $16 million.
The following items had a favorable effect on Ameren Missouri's electricmargins in 2016 compared with 2015 :
• Temperatures in 2016 were warmer compared with 2015 , as coolingdegree-days increased 16%, while heating degree-days decreased 6%.The net effect of weather increased margins by an estimated $48 million .The change in margins due to weather is the sum of the effect of weather(estimate) on electric revenues ( +$57 million ) and the effect of weather(estimate) on fuel and purchased power ( -$9 million ) in the Electric andNatural Gas Margins table above.
• Higher electric base rates, effective May 30, 2015, as a result of the April2015 MoPSC electric rate order, which increased margins by anestimated $14 million . The change in electric base rates is the sum of thechange in base rates (estimate) ( +$48 million ) and the change in effectof higher net energy costs included in base rates ( -$34 million ) in theElectric and Natural Gas Margins table above.
• Lower net energy costs as a result of the 5% of changes retained byAmeren Missouri through the FAC, primarily due to higher MISOcapacity revenues, which increased margins by $8 million . The changein net energy costs is the sum of the change in off-system sales andcapacity revenues ( +$153 million ) and the change in energy costs(excluding the New Madrid Smelter and estimated effect of weather) ( -$145 million ) in the Electric and Natural Gas Margins table above.
• Excluding the effect of reduced sales to the New Madrid Smelter and theestimated effect of weather, total retail sales volumes increased by lessthan 1%, which increased revenues by $7 million , due to an additionalday as a result of the leap year and growth, partially offset by thecarryover effect of MEEIA 2013 on sales volumes and the effect ofMEEIA 2016 customer energy efficiency programs. MEEIA 2016customer energy efficiency programs reduced retail sales volumes but thethroughput disincentive recovery ensured that electric margins were notaffected.
Ameren Missouri's natural gas margins were comparable between years.Ameren Missouri has a cost recovery mechanism for natural gas purchased onbehalf of its customers. These pass-through purchased natural gas costs do notaffect Ameren Missouri's natural gas margins as any change in costs is offsetby a corresponding change in revenues.
Ameren Illinois
Ameren Illinois' electric margins increased by $74 million , or 6% , in2016 compared with 2015, driven by increases in Ameren Illinois ElectricDistribution ( $31 million ) and Ameren Illinois Transmission ($43 million)margins.
Ameren Illinois Electric Distribution
The IEIMA performance-based formula rate framework
40

Table of Contents
provides an annual reconciliation of the electric delivery service revenuerequirement necessary to reflect the actual costs incurred in a given year withthe revenue requirement in customer rates for that year, including an allowedreturn on equity. See Operations and Maintenance Expenses in this section foradditional information regarding the components of the revenue requirement.If the current year's revenue requirement is greater than the revenuerequirement reflected in that year's customer rates, an increase to electricoperating revenues with an offset to a regulatory asset is recorded to reflectthe expected recovery of those additional amounts from customers within twoyears. If the current year's revenue requirement is less than the revenuerequirement reflected in that year's customer rates, a reduction to electricoperating revenues with an offset to a regulatory liability is recorded to reflectthe expected refund to customers within two years. The increases orreductions to electric operating revenues are shown in base rates (estimate) inthe Electric and Natural Gas Margins table above. See Note 2 – Rate andRegulatory Matters under Part II, Item 8, of this report for informationregarding Ameren Illinois Electric Distribution's revenue requirementreconciliation pursuant to the IEIMA.
Ameren Illinois Electric Distribution has a cost recovery mechanism forpower purchased and transmission services incurred on behalf of itscustomers. These pass-through costs do not affect Ameren Illinois ElectricDistribution's margins, as any change in costs is offset by a correspondingchange in revenues.
Ameren Illinois Electric Distribution's margins increased $31 million , or3% , in 2016 compared with 2015 . The following items had a favorable effecton Ameren Illinois Electric Distribution's electric margins:
• Revenues increased by $38 million , primarily due to an increase in ratebase of 8% and higher recoverable costs in 2016 compared with 2015 ,under formula ratemaking pursuant to the IEIMA. These revenues werereduced by a lower return on equity due to a reduction in 30-year UnitedStates Treasury bond yields, which decreased 24 basis points in 2016compared with 2015 .
• Temperatures in 2016 were warmer compared with 2015 , as coolingdegree-days increased 13%, while heating degree-days decreased 5%.The net effect of weather increased margins by an estimated $7 million.The change in margins due to weather is the sum of the effect of weather(estimate) on electric revenues ( +$15 million ) and the effect of weather(estimate) on fuel and purchased power ( -$8 million ) in the Electric andNatural Gas Margins table above.
Ameren Illinois Electric Distribution's margins were unfavorably affectedby the absence in 2016 of a January 2015 ICC order regarding AmerenIllinois' cumulative power usage cost and its purchased power ridermechanism, which increased margins by $15 million in 2015.
Ameren Illinois Natural Gas
Ameren Illinois Natural Gas has a cost recovery mechanism for naturalgas purchased on behalf of its customers. These pass-through purchasednatural gas costs do not affect Ameren Illinois
Natural Gas' margins, as any change in costs is offset by a correspondingchange in revenues.
Ameren Illinois Natural Gas' margins increased $37 million , or 9%, in2016 compared with 2015 . The following items had a favorable effect onAmeren Illinois Natural Gas' margins:
• Higher natural gas base rates in 2016, which increased margins by anestimated $42 million .
• The absence of warmer-than-normal 2015 winter temperatures and theapplication of the VBA in 2016, which increased margins by $3 million .The VBA, which was approved by the ICC in December 2015,eliminated the impact of weather on natural gas margins for residentialand small nonresidential customers in 2016. The change in margins dueto weather is the sum of the effect of weather (estimate) on revenues (+$13 million ) and the effect of weather (estimate) on natural gaspurchased for resale ( -$10 million ) in the Electric and Natural GasMargins table above.
Ameren Illinois Transmission
Ameren Illinois Transmission's margins increased $43 million, or 23%,in 2016 compared with 2015 , as discussed in the Ameren Transmissionsection below.
Ameren Transmission
The provisions of FERC's electric transmission formula rate frameworkprovide for an annual reconciliation of the electric transmission servicerevenue requirement necessary to reflect the actual costs incurred in a givenyear with the revenue requirement in customer rates for that year, including anallowed return on equity. See Operations and Maintenance Expenses in thissection for additional information regarding the components of the revenuerequirement. If the current year's revenue requirement is greater than therevenue requirement reflected in that year's customer rates, an increase toelectric operating revenues with an offset to a regulatory asset is recorded toreflect the expected recovery of those additional amounts from customerswithin two years. If the current year's revenue requirement is less than therevenue requirement reflected in that year's customer rates, a reduction toelectric operating revenues with an offset to a regulatory liability is recordedto reflect the expected refund to customers within two years. The increases orreductions to electric operating revenues are shown in base rates (estimate) inthe Electric and Natural Gas Margins table above. See Note 2 – Rate andRegulatory Matters under Part II, Item 8, of this report for informationregarding Ameren Transmission's revenue requirement reconciliation.
Ameren Transmission's margins increased $96 million , or 37% , in 2016compared with 2015 , driven by Ameren Illinois Transmission and ATXIresults. The increase in margins for both Ameren Transmission and AmerenIllinois Transmission was primarily due to significant capital investment,which increased rate base by 42% and 27%, respectively, as well as higherrecoverable costs in 2016 compared with 2015 under forward-looking formularatemaking. See Cash Flows from Investing Activities in this section forinformation regarding capital expenditures, including those for the IllinoisRivers project. Ameren Transmission and Ameren Illinois
41

Table of Contents
Transmission margins also benefited from a temporarily higher allowed returnon common equity, recognizing an allowed return on common equity of12.38% for nearly four months in 2016, as a result of the expiration of therefund period in the February 2015 complaint case. See Note 2 – Rate andRegulatory Matters under Part II, Item 8, of this report for informationregarding the allowed return on common equity for FERC-regulatedtransmission rate base.
2015 versus 2014
Ameren
Ameren's electric margins increased $162 million , or 4%, in 2015compared with 2014, primarily because of increased margins at AmerenTransmission, Ameren Illinois Electric Distribution, and Ameren Missouri.Ameren's natural gas margins decreased $22 million , or 4%, in 2015compared with 2014, primarily because of decreased margins at AmerenIllinois Natural Gas.
Ameren Missouri
Ameren Missouri's electric margins increased $45 million , or 2%, in2015 compared with 2014. The following items had a favorable effect onAmeren Missouri's electric margins:
• Higher MEEIA 2013 net shared benefits caused by increased customerimplementation of longer-lived energy efficiency products and increasednonresidential customer participation, which increased revenues by $33million. Net shared benefits compensated Ameren Missouri for lowersales volumes from energy-efficiency-related volume reductions incurrent and future periods.
• Higher electric base rates, effective May 30, 2015, as a result of the April2015 MoPSC electric rate order, which increased margins by anestimated $17 million. The change in electric base rates is the sum of thechange in base rates (estimate) ( +$82 million ) and the change in effectof higher net energy costs included in base rates ( -$65 million ) in theElectric and Natural Gas Margins table above.
The following items had an unfavorable effect on Ameren Missouri'selectric margins in 2015 compared with 2014:
• Lower sales volumes, primarily caused by the MEEIA 2013 programsand other customer energy efficiency measures, and reduced sales to theNew Madrid Smelter. Excluding the estimated effect of weather andreduced sales to the New Madrid Smelter, total retail sales volumesdecreased by 1%, which decreased revenues by $25 million. Reducedsales to the New Madrid Smelter decreased revenues by $11 million. Thesales volumes to the New Madrid Smelter were lower than those reflectedin rates established in the April 2015 MoPSC electric rate order. Lowersales volumes led to a decrease in net energy costs of $24 million. Thechange in net energy costs is the sum of the change in off-system sales,transmission services revenues, and capacity revenues ( +$3 million ) andthe change in energy costs (excluding the estimated effect of weather) (+$21 million ) in the Electric and Natural Gas Margins table above.
• Winter temperatures in 2015 were warmer compared with 2014, asheating degree-days decreased 19%. The effect of weather decreasedmargins by an estimated $10 million. The change in margins due toweather is the sum of the effect of weather (estimate) on electric revenues( -$20 million ) and the effect of weather (estimate) on fuel andpurchased power ( +$10 million ) in the Electric and Natural GasMargins table above.
• The exclusion of transmission revenues and substantially all transmissioncharges from the FAC beginning May 30, 2015, which decreasedmargins by $6 million. The change in margins as a result of the changesto the FAC is the sum of FAC exclusion of transmission services charges( -$7 million ) and transmission services revenues ( +$1 million ) in theElectric and Natural Gas Margins table above.
Ameren Missouri's natural gas margins were comparable between years.
Ameren Illinois
Ameren Illinois' electric margins increased by $84 million, or 7%, in2015 compared with 2014 driven by increases in Ameren Illinois ElectricDistribution ( $49 million ) and Ameren Illinois Transmission ($35 million)margins.
Ameren Illinois Electric Distribution
Ameren Illinois Electric Distribution's revenues increased $129 million in2015 compared with 2014, primarily because of higher power supply costs asa result of increased MISO capacity prices. Ameren Illinois ElectricDistribution has a cost recovery mechanism for power purchased andtransmission services incurred on behalf of its electric distribution customers.These pass-through costs do not affect Ameren Illinois Electric Distribution'smargins, as any change in costs is offset by a corresponding change inrevenues.
Ameren Illinois Electric Distribution's margins increased $49 million , or5%, in 2015 compared with 2014. The following items had a favorable effecton Ameren Illinois Electric Distribution's electric margins:
• Revenues increased by $34 million , primarily due to an increase in ratebase of 8% and higher recoverable costs in 2015 compared with 2014under formula ratemaking pursuant to the IEIMA. These revenues werereduced by a lower return on equity due to a reduction in 30-year UnitedStates Treasury bond yields, which decreased 50 basis points in 2015compared with 2014.
• A January 2015 ICC order regarding Ameren Illinois' cumulative powerusage cost and its purchased power rider mechanism, which causedelectric revenues to increase by $15 million compared with 2014.
Ameren Illinois Natural Gas
Ameren Illinois Natural Gas' revenues decreased $193 million in 2015compared with 2014 because of lower natural gas commodity prices andlower sales volumes due to weather. Ameren Illinois Natural Gas has a costrecovery mechanism for natural gas
42

Table of Contents
purchased on behalf of its customers. These pass-through purchased naturalgas costs do not affect Ameren Illinois Natural Gas' margins, as any change incosts is offset by a corresponding change in revenues.
Ameren Illinois Natural Gas' margins decreased $18 million , or 4%, in2015 compared with 2014. Winter temperatures in 2015 were warmercompared with 2014, as heating degree-days decreased 18%, which decreasedmargins by an estimated $10 million . The change in margins due to weatheris the sum of the effect of weather (estimate) on revenues ( -$72 million ) andthe effect of weather (estimate) on natural gas purchased for resale ( +$62million ) in the Electric and Natural Gas Margins table above.
Ameren Illinois Transmission
Ameren Illinois Transmission's margins increased $35 million, or 23%,in 2015 compared with 2014, as discussed in the Ameren Transmissionsection below.
Ameren Transmission
Ameren Transmission's margins increased $72 million , or 39%, in 2015compared with 2014, driven by Ameren Illinois Transmission and ATXIresults. The increase in margins for both Ameren Transmission and AmerenIllinois Transmission was primarily due to significant capital investment,which increased rate base by 54% and 27%, respectively, as well as higherrecoverable costs in 2015 compared with 2014 under forward-looking formularatemaking. See Cash Flows from Investing Activities in this section forinformation regarding capital expenditures, including those for the IllinoisRivers project. Ameren Transmission and Ameren Illinois Transmissionmargins were reduced by an estimate of the probable customer refunds as aresult of the FERC complaint cases regarding the allowed base return oncommon equity. See Note 2 – Rate and Regulatory Matters under Part II, Item8, of this report for information regarding the FERC complaint cases.
Other Operations and Maintenance Expenses
2016 versus 2015
Ameren
Other operations and maintenance expenses decreased $ 18 million in2016 compared with 2015 , primarily because of decreased expenses atAmeren Missouri and Ameren Illinois Natural Gas, partially offset by anincrease in expenses at Ameren Illinois Electric Distribution, AmerenTransmission, and other businesses.
Ameren Missouri
Other operations and maintenance expenses were $ 32 million lower in2016 compared with 2015 . The following items decreased other operationsand maintenance expenses between years:
• MEEIA customer energy efficiency program costs decreased by $34million in 2016, primarily due to the expiration of MEEIA 2013,partially offset by costs incurred
for MEEIA 2016. Electric revenues decreased by a correspondingamount, with no overall effect on net income.
• Energy center maintenance costs, excluding refueling and maintenanceoutage costs at the Callaway energy center discussed below, decreasedby $18 million, primarily because of reduced staffing costs anddecreased routine maintenance costs, partially offset by higher coalhandling charges.
• Electric distribution maintenance expenditures decreased by $16 million,primarily related to reduced system repair and vegetation managementwork.
• Employee benefit costs decreased by $11 million, primarily due to a $6million reduction in the base level of pension and postretirementexpenses allowed in rates, as a result of the April 2015 MoPSC electricrate order, and lower medical benefit costs. Electric base rates billed tocustomers related to pension and postretirement expenses decreasedelectric revenues by a corresponding amount, with no overall effect onnet income.
• An unrealized MTM gain in 2016 compared with an unrealized MTMloss in 2015 decreased costs by $4 million, resulting from changes in themarket value of company-owned life insurance.
The following items increased other operations and maintenanceexpenses between years:
• Refueling and maintenance outage costs at the Callaway energy centerincreased by $26 million, primarily due to costs for the 2016 scheduledrefueling and maintenance outage. There was no Callaway refueling andmaintenance outage in 2015.
• Litigation costs increased by $11 million, primarily related to increasesin estimated obligations for pending legal claims.
• Amortization of previously deferred solar rebate costs increased by $9million, as a result of the April 2015 MoPSC electric rate order. Electricbase rates billed to customers increased electric revenues by acorresponding amount, with no overall effect on net income.
• Storm-related repair costs increased by $7 million.
Ameren Illinois
Other operations and maintenance expenses increased $ 7 million in 2016compared with 2015 , primarily because of increased expenses at AmerenIllinois Electric Distribution and Ameren Illinois Transmission, partiallyoffset by a reduction in expenses at Ameren Illinois Natural Gas.
Ameren Illinois Electric Distribution
Pursuant to the provisions of the IEIMA's formula rate framework,recoverable electric distribution costs that are not recovered through separatecost recovery mechanisms are included in a revenue requirementreconciliation, which results in a corresponding adjustment to electricrevenues, with no overall effect on net income. These recoverable electricdistribution costs include other operations and maintenance expenses,depreciation and amortization, taxes other than income taxes, interest charges,and income taxes.
43
Table of Contents
Other operations and maintenance expenses were $ 6 million higher in2016 compared with 2015 . The following items increased other operationsand maintenance expenses between years:
• Labor costs increased by $6 million, primarily because of staff additionsto meet enhanced standards and goals related to the IEIMA.
• Storm-related repair costs increased by $3 million.• Bad debt, customer energy efficiency, and environmental remediation
costs increased by $2 million. These expenses are included in cost ridersthat result in increased electric revenues, with no overall effect on netincome.
• Litigation costs increased by $2 million, primarily related to increases inestimated obligations for pending legal claims.
The following items decreased other operations and maintenanceexpenses between years:
• Employee benefit costs decreased by $6 million, primarily due to lowerpension and postretirement expenses caused by changes in actuarialassumptions and the performance of plan assets.
• Electric distribution operations and maintenance expenditures decreasedby $3 million, primarily related to reduced circuit maintenance work,partially offset by increased vegetation management work.
Ameren Illinois Natural Gas
Other operations and maintenance expenses were $ 4 million lower in2016 compared with 2015 . The following items decreased other operationsand maintenance expenses between years:
• Bad debt, customer energy efficiency, and environmental remediationcosts decreased by $10 million. These expenses are included in costriders that result in lower natural gas revenues, with no overall effect onnet income.
• Employee benefit costs decreased by $5 million, primarily due to lowerpension and postretirement expenses caused by changes in actuarialassumptions and the performance of plan assets.
The following items increased other operations and maintenanceexpenses between years:
• Repairs and compliance expenditures increased by $8 million, primarilyrelated to increased pipeline integrity and storage field maintenance.
• Litigation costs increased by $2 million, primarily related to increases inestimated obligations for pending legal claims.
Ameren Illinois Transmission
Other operations and maintenance expenses were $ 5 million higher in2016 compared with 2015 , primarily because of an increase in systemoperations and labor costs.
Ameren Transmission
Pursuant to the provisions of the FERC's formula rate framework,recoverable transmission costs that are not recovered through separate costrecovery mechanisms are included in Ameren Transmission's and AmerenIllinois Transmission's revenue requirement reconciliations, which result incorresponding adjustments to electric revenues, with no overall effect on netincome. These recoverable transmission costs are included in other operationsand maintenance expenses, depreciation and amortization, taxes other thanincome taxes, interest charges, and income taxes.
Other operations and maintenance expenses increased $ 4 million in 2016compared with 2015 , primarily because of an increase in system operationsand labor costs.
2015 versus 2014
Ameren
Other operations and maintenance expenses increased $ 10 million in2015 compared with 2014, primarily because of increased expenses atAmeren Illinois Electric Distribution and Ameren Transmission, partiallyoffset by a reduction in expenses at Ameren Missouri. Other operations andmaintenance expenses were comparable between years at Ameren IllinoisNatural Gas.
Ameren Missouri
Other operations and maintenance expenses were $ 14 million lower in2015 compared with 2014. The following items decreased other operationsand maintenance expenses between years:
• Refueling and maintenance outage costs at the Callaway energy centerdecreased by $27 million. There was no refueling outage scheduled in2015; however, $9 million in preparation costs were incurred in 2015 forthe 2016 scheduled outage.
• Employee benefit costs decreased by $9 million, primarily due to achange in pension and postretirement expenses allowed in rates as aresult of the April 2015 MoPSC electric rate order.
• Disposal costs for low-level radioactive nuclear waste decreased by $8million.
• Energy center maintenance costs, excluding refueling and maintenanceoutage costs at the Callaway energy center, decreased by $6 million,primarily because of fewer major outages.
• Bad debt expense decreased by $3 million, due to improved customercollections.
The following items increased other operations and maintenanceexpenses between years:
• Amortization of previously-deferred solar rebate costs increased by $17million as a result of the April 2015 MoPSC electric rate order.
44

Table of Contents
• MEEIA customer energy efficiency program costs increased by $16million in 2015, primarily due to program enhancements and increasedcustomer participation.
• An unrealized MTM loss in 2015 compared with an unrealized MTMgain in 2014 increased costs by $3 million, resulting from changes in themarket value of company-owned life insurance.
• Electric distribution maintenance expenditures increased by $2 million,primarily related to increased system repair work.
Ameren Illinois
Other operations and maintenance expenses increased $ 26 million in2015 compared with 2014, primarily because of increased expenses atAmeren Illinois Electric Distribution. Other operations and maintenanceexpenses were comparable between years at Ameren Illinois Natural Gas andAmeren Illinois Transmission.
Ameren Illinois Electric Distribution
Other operations and maintenance expenses were $ 25 million higher in2015 compared with 2014. The following items increased other operationsand maintenance expenses between years:
• Bad debt, customer energy efficiency, and environmental remediationcosts increased by $10 million.
• Circuit maintenance and system repair work increased by $7 million,primarily related to regulatory compliance requirements.
• Labor costs increased by $5 million, primarily because of staff additionsto meet enhanced standards and goals related to the IEIMA and higherwages.
• Storm-related repair costs increased by $3 million.• Employee benefit costs increased by $3 million, primarily due to higher
pension and postretirement expenses caused by changes in actuarialassumptions and the performance of plan assets.
Ameren Transmission
Other operations and maintenance expenses increased $ 7 million in 2015compared with 2014, primarily because of increased expenses at ATXI,resulting from an increase in support services, labor costs and consultingexpenditures.
Provision for Callaway Construction and Operating License
Primarily because of changes in vendor support for licensing efforts atthe NRC, Ameren Missouri’s assessment of long-term capacity needs,declining costs of alternative generation technologies, and the regulatoryframework in Missouri, Ameren Missouri discontinued its efforts to licenseand build a second nuclear unit at its existing Callaway energy center site in2015. As a result of this decision, in 2015, Ameren and Ameren Missourirecognized a $ 69 million noncash pretax provision for the previouslycapitalized COL costs.
Depreciation and Amortization
2016 versus 2015
Ameren
Depreciation and amortization expenses increased $ 49 million in 2016compared with 2015 , primarily because of increased expenses at AmerenMissouri, Ameren Illinois Electric Distribution, Ameren Illinois Natural Gas,and Ameren Transmission, as discussed below.
Ameren Missouri
Depreciation and amortization expenses increased $ 22 million ,primarily because of electric system capital additions and increaseddepreciation rates resulting from the April 2015 MoPSC electric rate order.
Ameren Illinois
Depreciation and amortization expenses increased $ 24 million ,primarily because of increased expenses at Ameren Illinois ElectricDistribution, Ameren Illinois Natural Gas, and Ameren Illinois Transmission,as discussed below.
Ameren Illinois Electric Distribution
Depreciation and amortization expenses increased $ 14 million ,primarily because of capital additions.
Ameren Illinois Natural Gas
Depreciation and amortization expenses increased $ 3 million , primarilybecause of capital additions.
Ameren Illinois Transmission
Depreciation and amortization expenses increased $ 7 million , primarilybecause of capital additions.
Ameren Transmission
Depreciation and amortization expenses increased $ 10 million ,primarily because of capital additions at Ameren Illinois Transmission.
2015 versus 2014
Ameren
Depreciation and amortization expenses increased $ 51 million in 2015compared with 2014, primarily because of increased expenses at AmerenMissouri, Ameren Illinois Electric Distribution, Ameren Illinois Natural Gas,and Ameren Transmission, as discussed below.
45
Table of Contents
Ameren Missouri
Depreciation and amortization expenses increased $ 19 million ,primarily because of multiple significant electric projects completed in 2014and increased depreciation rates resulting from the April 2015 MoPSCelectric rate order.
Ameren Illinois
Depreciation and amortization expenses increased $ 32 million ,primarily because of increased expenses at Ameren Illinois ElectricDistribution, Ameren Illinois Natural Gas, and Ameren Illinois Transmission,as discussed below.
Ameren Illinois Electric Distribution
Depreciation and amortization expenses increased $ 15 million ,primarily because of capital additions.
Ameren Illinois Natural Gas
Depreciation and amortization expenses increased $ 11 million ,primarily because of capital additions.
Ameren Illinois Transmission
Depreciation and amortization expenses increased $ 6 million , primarilybecause of capital additions.
Ameren Transmission
Depreciation and amortization expenses increased $ 7 million , primarilybecause of capital additions at Ameren Illinois Transmission.
Taxes Other Than Income Taxes
2016 versus 2015
Ameren
Taxes other than income taxes decreased $ 6 million in 2016 comparedwith 2015 , primarily because of decreased expenses at Ameren Missouri,partially offset by increased expenses at Ameren Illinois Natural Gas andAmeren Transmission, as discussed below. Taxes other than income taxeswere comparable between years at Ameren Illinois Electric Distribution. SeeExcise Taxes in Note 1 – Summary of Significant Accounting Policies underPart II, Item 8, of this report for additional information.
Ameren Missouri
Taxes other than income taxes decreased $ 10 million , primarily becauseof decreased gross receipts taxes resulting from lower residential andcommercial electric revenues and because of a decrease in property taxes.Electric revenues for gross receipts taxes decreased by an amountcorresponding to the reduction in gross receipts taxes, with no overall effecton net income.
Ameren Illinois
Taxes other than income taxes increased $ 2 million , primarily becauseof increased expenses at Ameren Illinois Natural Gas, as discussed below.Taxes other than income taxes were comparable between years at AmerenIllinois Electric Distribution and Ameren Illinois Transmission.
Ameren Illinois Natural Gas
Taxes other than income taxes increased $ 2 million , primarily becauseof an increase in Illinois state natural gas invested capital taxes.
Ameren Transmission
Taxes other than income taxes increased $ 2 million , primarily becauseof an increase in property taxes at ATXI.
2015 versus 2014
Ameren
Taxes other than income taxes increased $ 5 million in 2015 comparedwith 2014, primarily because of increased expenses at Ameren Missouri,partially offset by decreased expenses at Ameren Illinois Natural Gas, asdiscussed below. Taxes other than income taxes were comparable betweenyears at Ameren Illinois Electric Distribution and Ameren Transmission.
Ameren Missouri
Taxes other than income taxes increased $ 13 million , primarily becauseof increased property taxes resulting from both higher tax rates and assessedproperty tax values, and increased gross receipts taxes resulting from higherelectric service rates.
Ameren Illinois
Taxes other than income taxes decreased $ 8 million , primarily becauseof decreased expenses at Ameren Illinois Natural Gas, as discussed below.Taxes other than income taxes were comparable between years at AmerenIllinois Electric Distribution and Ameren Illinois Transmission.
Ameren Illinois Natural Gas
Taxes other than income taxes decreased $ 7 million , primarily becauseof decreased gross receipts taxes resulting from lower natural gas sales pricesand volumes.
Other Income and Expenses
2016 versus 2015
Ameren
Other income, net of expenses, was comparable between years atAmeren, Ameren Missouri, Ameren Illinois Electric Distribution, AmerenIllinois Natural Gas, and Ameren Transmission. See Note 6 – Other Incomeand Expenses under Part II, Item 8, of this report for additional information.
46
Table of Contents
Ameren Illinois
Other income, net of expenses, was comparable between years at AmerenIllinois, Ameren Illinois Electric Distribution, Ameren Illinois Natural Gas,and Ameren Illinois Transmission.
2015 versus 2014
Ameren
Other income, net of expenses, decreased $ 13 million in 2015 comparedwith 2014, primarily because of a $5 million increase in donations at Ameren(parent) due to the timing of charitable contributions and a decrease in otherincome, net of expenses, at Ameren Missouri and Ameren Transmission,partially offset by an increase in other income, net of expenses, at AmerenIllinois Electric Distribution, as discussed below. Other income, net ofexpenses, was comparable between years at Ameren Illinois Natural Gas.
Ameren Missouri
Other income, net of expenses, decreased $ 7 million , primarily becauseof a decrease in the allowance for equity funds used during construction, asmultiple significant electric capital projects were completed in 2014.
Ameren Illinois
Other income, net of expenses, was comparable between years. Otherincome, net of expenses, was lower at Ameren Illinois Transmission, partiallyoffset by an increase in other income, net of expenses, at Ameren IllinoisElectric Distribution, as discussed below. Other income, net of expenses, wascomparable between years at Ameren Illinois Natural Gas.
Ameren Illinois Electric Distribution
Other income, net of expenses, increased $ 4 million , primarily becauseof increased interest income on the IEIMA 2013, 2014, and 2015 revenuerequirement reconciliation regulatory assets.
Ameren Illinois Transmission
Other income, net of expenses, decreased $ 4 million , primarily becauseof decreased income from customer-requested construction.
Ameren Transmission
Other income, net of expenses, decreased $ 4 million , primarily becauseof decreased income from customer-requested construction at Ameren IllinoisTransmission.
Interest Charges
2016 versus 2015
Ameren
Interest charges increased $ 27 million in 2016 compared with 2015 ,because of an approximately $475 million increase in average outstandingdebt and an increase in the cost of debt at Ameren (parent). Ameren (parent)issued senior unsecured notes in November 2015 to repay lower-cost short-term debt incurred primarily in connection with the funding of increasingATXI investments. An increase in interest charges at Ameren Transmissionwas partially offset by a decrease in interest charges at Ameren Missouri, asdiscussed below. Interest charges were comparable between years at AmerenIllinois Electric Distribution and Ameren Illinois Natural Gas.
Ameren Missouri
Interest charges decreased $ 8 million , primarily because of a decrease inaverage outstanding debt.
Ameren Illinois
Interest charges increased $ 9 million , primarily because of an increasein interest charges at Ameren Illinois Transmission. Interest charges werecomparable between years at Ameren Illinois Electric Distribution andAmeren Illinois Natural Gas.
Ameren Illinois Transmission
Interest charges increased $ 9 million , primarily because of an increasein Ameren Illinois' average outstanding debt, interest charges on regulatoryliabilities, and a decrease in the allowance for funds used during constructionbecause of a reduction in construction work in progress as more projects wereplaced in service in 2016.
Ameren Transmission
Interest charges increased $ 23 million , primarily because of an increasein ATXI's and Ameren Illinois' average outstanding debt and an increase inthe cost of debt.
2015 versus 2014
Ameren
Interest charges increased $ 14 million in 2015 compared with 2014,primarily because of increases in interest charges at Ameren Missouri,Ameren Illinois Electric Distribution, Ameren Illinois Natural Gas, andAmeren Transmission, as discussed below. The increases were offset, in part,by a reduction in interest charges at Ameren (parent) of $15 million, primarilybecause of a decrease in average outstanding debt. Ameren (parent) repaidsenior unsecured notes in May 2014, with proceeds from commercial paperissuances. Ameren (parent) issued senior unsecured notes in November 2015,the proceeds of which were used to repay commercial paper borrowings.
47

Table of Contents
Ameren Missouri
Interest charges increased $ 8 million , primarily because of a decrease inthe allowance for funds used during construction, as multiple significantelectric projects were completed in 2014, and because of an increase inaverage outstanding debt.
Ameren Illinois
Interest charges increased $ 19 million , primarily because of an increasein average outstanding debt.
Ameren Illinois Electric Distribution
Interest charges increased $ 8 million , because of an increase in AmerenIllinois' average outstanding debt, and the absence in 2015 of a reduction froman ICC rate order received in December 2014, which partially reversed acharge recorded in 2013 that had disallowed the recovery from customers ofcertain debt premium costs.
Ameren Illinois Natural Gas
Interest charges increased $ 7 million , because of an increase in AmerenIllinois' average outstanding debt, and the absence in 2015 of a reduction froman ICC rate order received in December 2014, which partially reversed acharge recorded in 2013 that had disallowed the recovery from customers ofcertain debt premium costs.
Ameren Illinois Transmission
Interest charges increased $ 4 million , primarily because of an increasein Ameren Illinois' average outstanding debt.
Ameren Transmission
Interest charges increased $ 9 million , because of increased borrowingsat ATXI and an increase in average outstanding debt at Ameren IllinoisTransmission.
Income Taxes
The following table presents effective income tax rates for the yearsended December 31, 2016 , 2015 , and 2014 :
2016 2015 2014Ameren 37% 38% 39%Ameren Missouri 38% 37% 37%Ameren Illinois 38% 37% 41% Ameren Illinois Electric Distribution 38% 36% 40% Ameren Illinois Natural Gas 39% 40% 43% Ameren Illinois Transmission 38% 37% 42%Ameren Transmission 39% 38% 42%
See Note 13 – Income Taxes under Part II, Item 8, of this report forinformation regarding reconciliations of effective income tax rates forAmeren, Ameren Missouri, and Ameren Illinois.
2016 versus 2015
Ameren
The effective tax rate was comparable between years. The one percentagepoint reduction in the 2016 effective tax rate, as compared to the 2015effective tax rate, was primarily a result of the recognition of tax benefitsassociated with share-based compensation resulting from the differencebetween the deduction for tax purposes and the compensation cost recognizedfor financial reporting purposes. This reduction was partially offset by ahigher effective tax rate in 2016 as compared to 2015 at Ameren IllinoisElectric Distribution, as discussed below. The effective tax rate wascomparable between years at Ameren Missouri, Ameren Illinois Natural Gas,and Ameren Transmission.
Ameren Illinois
The effective tax rate was comparable between years. The effective taxrate was higher at Ameren Illinois Electric Distribution, primarily because ofitems detailed below. The effective tax rate was comparable between years atAmeren Illinois Natural Gas and Ameren Illinois Transmission.
Ameren Illinois Electric Distribution
The effective tax rate was higher, primarily because of lower tax benefitsfrom certain depreciation differences on property-related items.
2015 versus 2014
Ameren
The effective tax rate was comparable between years. The effective taxrate was lower in 2015 as compared to 2014 at Ameren Illinois ElectricDistribution, Ameren Illinois Natural Gas, and Ameren Transmission,primarily because of items detailed below. The effective tax rate wascomparable between years at Ameren Missouri.
Ameren Illinois
The effective tax rate was lower, primarily because of items discussed atAmeren Illinois Electric Distribution, Ameren Illinois Natural Gas, andAmeren Illinois Transmission below. The Illinois statutory income tax ratewas 9.5% in 2014 and decreased to 7.75% in 2015.
Ameren Illinois Electric Distribution
The effective tax rate was lower, primarily because of a reduced Illinoisstate statutory rate in 2015, as well as higher tax benefits from certaindepreciation differences on property-related items and fewer non-taxdeductible costs.
Ameren Illinois Natural Gas
48

Table of Contents
The effective tax rate was lower, primarily because of a reduced Illinoisstate statutory rate in 2015 and the 2014 impacts on accumulated deferredincome taxes of reducing the state statutory rate.
Ameren Illinois Transmission
The effective tax rate was lower, primarily because of a reduced Illinoisstate statutory rate in 2015, as well as higher tax benefits from certaindepreciation differences on property-related items and higher non-taxableincome.
Ameren Transmission
The effective tax rate was lower, primarily because of a reduced Illinoisstate statutory rate in 2015, as well as higher tax benefits from certaindepreciation differences on property-related items and higher non-taxableincome at Ameren Illinois Transmission.
Income (Loss) from Discontinued Operations, Net of Taxes
No material activity was recorded associated with discontinuedoperations in 2016. In 2015, based on completion of the IRS audit ofAmeren’s 2013 tax year, Ameren recognized a tax benefit of $53 million dueto the resolution of an uncertain tax position from discontinued operations. Nomaterial activity was recorded associated with discontinued operations in2014. See Note 1 – Summary of Significant Accounting Policies under Part II,Item 8, of this report for additional information.
LIQUIDITY AND CAPITAL RESOURCES
Our tariff-based gross margins are our principal source of cashprovided by operating activities. A diversified retail
customer mix, primarily consisting of rate-regulated residential,commercial, and industrial customers, provides us with a reasonablypredictable source of cash. In addition to using cash provided by operatingactivities, we use available cash, borrowings under the Credit Agreements,commercial paper issuances, money pool borrowings, or, in the case ofAmeren Missouri and Ameren Illinois, other short-term borrowings fromaffiliates to support normal operations and temporary capital requirements.We may reduce our short-term borrowings with cash provided byoperations or, at our discretion, with long-term borrowings, or, in the caseof Ameren Missouri and Ameren Illinois, with capital contributions fromAmeren (parent). We expect to make significant capital expenditures overthe next five years as we invest in our electric and natural gas utilityinfrastructure to support overall system reliability, environmentalcompliance, and other improvements. We intend to fund those capitalexpenditures primarily with cash provided by operating activities and short-term and long-term debt issuances so that we maintain an equity ratioaround 50%, assuming constructive regulatory environments.
The use of cash provided by operating activities and short-termborrowings to fund capital expenditures and other long-term investmentsmay periodically result in a working capital deficit, defined as currentliabilities exceeding current assets, as was the case at December 31, 2016 ,for the Ameren Companies. The working capital deficit as of December 31,2016, was primarily the result of current maturities of long-term debt andour decision to finance our businesses with lower-cost commercial paperissuances. With the credit capacity available under the Credit Agreements,the Ameren Companies had access to $1.5 billion of liquidity atDecember 31, 2016 .
The following table presents net cash provided by (used in) operating, investing and financing activities for the years ended December 31, 2016 , 2015 , and2014 :
Net Cash Provided by (Used in)
Operating Activities Net Cash Provided by (Used in)
Investing Activities Net Cash Provided by (Used in)
Financing Activities
2016 2015 2014 2016 2015 2014 2016 2015 2014Ameren (a) – continuingoperations $ 2,124 $ 2,035 $ 1,571 $ (2,141) $ (1,951) $ (1,856) $ (265) $ 232 $ 127Ameren (a) – discontinuedoperations (1) (4) (6) — (25) 139 — — —Ameren Missouri 1,169 1,247 950 (934) (724) (837) (434) (325) (113)Ameren Illinois 803 763 445 (918) (913) (828) 44 220 383
(a) Includes amounts for Ameren registrant and nonregistrant subsidiaries and intercompany eliminations.
Cash Flows from Operating Activities
49

Table of Contents
Our cash provided by operating activities is affected by fluctuations oftrade accounts receivable, inventories, and accounts and wages payable,among other things, as well as the unique regulatory environment for each ofour businesses. Substantially all expenditures related to fuel, purchasedpower, and natural gas purchased for resale are recovered from customersthrough rate adjustment mechanisms, which may be adjusted without atraditional rate proceeding. Similar regulatory mechanisms exist for certainoperating expenses that can also affect the timing of cash provided byoperating activities. Each of these types of regulatory mechanisms havedifferent recovery periods from when we pay a cost that is included in aregulatory mechanism until we receive cash from customers. Additionally, theseasonality of our electric and natural gas businesses, primarily caused bychanges in customer demand due to weather, significantly impact the amountand timing of our cash provided by operating activities. See Note 1 –Summary of Significant Accounting Policies and Note 2 – Rate andRegulatory Matters under Part II, Item 8, of this report for more informationabout our rate-adjustment mechanisms.
2016 versus 2015
Ameren
Ameren’s cash from operating activities associated with continuingoperations increased $89 million in 2016, compared with 2015. The followingitems contributed to the increase:
• A $126 million increase resulting from electric and natural gas margins,as discussed in Results of Operations, excluding certain noncash items.
• A $70 million decrease in pension and postretirement benefit plancontributions.
• A $42 million insurance receipt at Ameren Missouri related to the TaumSauk breach that occurred in 2005.
• A $40 million increase in cash associated with the recovery of AmerenIllinois' IEIMA revenue requirement reconciliation adjustments. The2014 revenue requirement reconciliation adjustment, which wasrecovered from customers in 2016, was greater than the 2013 revenuerequirement reconciliation adjustment, which was recovered fromcustomers in 2015.
• A $38 million decrease in payments for purchased power compared withamounts collected from Ameren Illinois customers through a ridermechanism.
• A $37 million decrease in coal inventory purchases at Ameren Missouri,as additional coal was purchased in 2015 to compensate for deliverydisruptions experienced in 2014.
• A $33 million decrease in expenditures for customer energy efficiencyprogram costs compared with amounts collected from customers.
• A $19 million increase in cash associated with the recovery of AmerenIllinois' transmission revenue requirement reconciliation adjustments.The 2014 transmission revenue requirement reconciliation adjustmentwas recovered from customers in 2016, while the 2013 revenuerequirement reconciliation adjustment was refunded to customers in2015.
The following items partially offset the increase in Ameren's cash from
operating activities associated with continuing operations between years:
• A $166 million decrease resulting from the change in customerreceivable balances.
• A $94 million decrease in net energy costs collected from AmerenMissouri customers under the FAC.
• A $23 million increase in interest payments, primarily due to an increasein the cost and amount of outstanding debt of Ameren (parent) and anincrease in the average outstanding debt at Ameren Illinois.
• A $20 million increase in payments for the refueling and maintenanceoutage at Ameren Missouri's Callaway energy center. There was norefueling and maintenance outage in 2015.
• A $9 million increase in labor costs at Ameren Illinois, primarily becauseof wage increases and staff additions to meet enhanced reliability andcustomer service goals related to the IEIMA.
• A $7 million increase in payments to contractors at Ameren Illinois foradditional reliability, maintenance, and IEIMA projects.
Ameren’s cash from operating activities associated with discontinuedoperations was immaterial in both 2016 and 2015.
Ameren Missouri
Ameren Missouri’s cash from operating activities decreased $78 millionin 2016, compared with 2015. The following items contributed to thedecrease:
• A $142 million decrease resulting from electric and natural gas margins,as discussed in Results of Operations, excluding certain noncash items, aswell as the change in customer receivable balances.
• A $94 million decrease in net energy costs collected from customersunder the FAC.
• A $20 million increase in payments for the refueling and maintenanceoutage at the Callaway energy center. There was no refueling andmaintenance outage in 2015.
The following items partially offset the decrease in Ameren Missouri’scash from operating activities between years:
• A $45 million decrease in income tax payments, pursuant to the taxallocation agreement with Ameren (parent), primarily related to higherdeductions related to increased capital expenditures in 2016.
• A $42 million insurance receipt related to the Taum Sauk breach thatoccurred in December 2005.
• A $37 million decrease in coal inventory purchases, as additional coalwas purchased in 2015 to compensate for delivery disruptionsexperienced in 2014.
• A $33 million decrease in pension and postretirement benefit plancontributions.
• A $11 million decrease in expenditures for customer energy efficiencyprogram costs compared with amounts collected from customers.
50

Table of Contents
Ameren Illinois
Ameren Illinois’ cash from operating activities increased $40 million in2016, compared with 2015. The following items contributed to the increase:
• A $58 million increase resulting from electric and natural gas margins, asdiscussed in Results of Operations, excluding certain noncash items,which was partially offset by the change in customer receivable balances.
• A $40 million increase in cash associated with the recovery of IEIMArevenue requirement reconciliation adjustments. The 2014 revenuerequirement reconciliation adjustment, which was recovered fromcustomers in 2016, was greater than the 2013 revenue requirementreconciliation adjustment, which was recovered from customers in 2015.
• A $38 million decrease in payments for purchased power, compared withamounts collected from customers through a rider mechanism.
• A $22 million decrease in pension and postretirement benefit plancontributions.
• A $22 million decrease in expenditures for customer energy efficiencyprogram costs compared with amounts collected from customers.
• A $19 million increase in cash associated with the recovery oftransmission revenue requirement reconciliation adjustments. The 2014transmission revenue requirement reconciliation adjustment wasrecovered from customers in 2016, while the 2013 revenue requirementreconciliation adjustment was refunded to customers in 2015.
The following items partially offset the increase in Ameren Illinois’ cashfrom operating activities between periods:
• Income tax payments of $8 million in 2016, compared with income taxrefunds of $113 million in 2015. During 2015, Ameren Illinois used netoperating loss carryforwards from prior years, resulting in a reduction inpayments. Ameren Illinois also had higher deductions for increasedcapital expenditures in 2015.
• A $9 million increase in labor costs primarily because of wage increasesand staff additions to meet enhanced reliability and customer servicegoals related to the IEIMA.
• A $7 million increase in payments to contractors for additional reliability,maintenance, and IEIMA projects.
• A $7 million increase in interest payments, primarily due to an increase inthe average outstanding debt, including senior secured notes issued inDecember 2015.
2015 versus 2014
Ameren
Ameren’s cash from operating activities associated with continuingoperations increased $464 million in 2015, compared with 2014. Thefollowing items contributed to the increase:
• A $192 million increase resulting from electric and natural gas margins,as discussed in Results of Operations,
excluding certain noncash items, as well as the change in customerreceivable balances.
• A $149 million increase in net energy costs collected from AmerenMissouri customers under the FAC.
• A $137 million increase in cash associated with the recovery of AmerenIllinois' IEIMA revenue requirement reconciliation adjustments, asAmeren Illinois collected $69 million from customers in 2015 andrefunded $68 million to customers in 2014.
• A $57 million decrease in Ameren Missouri rebate payments providedfor customer-installed solar generation, as the rebate program wassubstantially completed by the end of 2014.
• A $33 million increase in natural gas commodity costs collected fromcustomers under the PGAs, primarily related to Ameren Illinois.
• A $31 million decrease in the cost of natural gas held in storage causedprimarily by lower natural gas prices.
• A $19 million decrease in payments for nuclear refueling andmaintenance outages at the Ameren Missouri Callaway energy center.There was no refueling and maintenance outage in 2015; however, therewere cash expenditures related to the planned 2016 spring outage made in2015.
The following items partially offset the increase in Ameren's cash fromoperating activities associated with continuing operations during 2015,compared with 2014:
• A $49 million increase in coal inventory costs at Ameren Missouricaused by increased volumes resulting from the absence of weather-related railroad delivery delays that occurred in 2014.
• A net $29 million decrease in returns of collateral posted withcounterparties, primarily resulting from changes in the market prices ofpower and natural gas and in contracted commodity volumes, partiallyoffset by the effect of credit rating upgrades.
• A $24 million decrease in income tax refunds primarily due to theabsence in 2015 of tax settlements pertaining to 2007 through 2011 thatwere received in 2014. See Note 1 – Summary of Significant AccountingPolicies under Part II, Item 8, of this report for income tax refundinformation.
• A $24 million increase in pension and postretirement benefit plancontributions.
• A $7 million increase in property tax payments at Ameren Missouricaused by both higher assessed property tax values and tax rates.
• A $7 million increase in expenditures for customer energy efficiencyprograms compared with amounts collected from Ameren Illinoiscustomers.
Ameren’s cash from operating activities associated with discontinuedoperations was comparable between 2015 and 2014.
51

Table of Contents
Ameren Missouri
Ameren Missouri’s cash from operating activities increased $297 millionin 2015, compared with 2014. The following items contributed to theincrease:
• A $149 million increase in net energy costs collected from customersunder the FAC.
• A $143 million decrease in income taxes paid to Ameren (parent)pursuant to the tax allocation agreement, primarily related to a change inthe tax treatment for generation repairs adopted in 2013, which increasedpayments in 2014.
• A $57 million decrease in rebate payments provided for customer-installed solar generation, as the rebate program was substantiallycompleted by the end of 2014.
• A $37 million increase resulting from electric and natural gas margins, asdiscussed in Results of Operations, excluding certain noncash items, aswell as the change in customer receivable balances.
• A $19 million decrease in payments for scheduled nuclear refueling andmaintenance outages at the Callaway energy center. There was norefueling and maintenance outage in 2015; however, there were cashexpenditures related to the 2016 spring outage made in 2015.
The following items partially offset the increase in Ameren Missouri'scash from operating activities during 2015, compared with 2014:
• A $49 million increase in coal inventory costs caused by increasedvolumes resulting from the absence of weather-related railroad deliverydelays that occurred in 2014.
• A net $12 million decrease in returns of collateral posted withcounterparties, primarily resulting from changes in the market prices ofpower and natural gas and in contracted commodity volumes, partiallyoffset by the effect of credit rating upgrades.
• An $11 million increase in pension and postretirement benefit plancontributions.
• A $7 million increase in property tax payments caused by both higherassessed property tax values and tax rates.
Ameren Illinois
Ameren Illinois’ cash from operating activities increased $318 million in2015, compared with 2014. The following items contributed to the increase:
• A $137 million increase in cash associated with the recovery of IEIMArevenue requirement reconciliation adjustments, as $69 million wascollected from customers in 2015 and $68 million was refunded tocustomers in 2014.
• A $101 million increase resulting from electric and natural gas margins,as discussed in Results of Operations, excluding certain noncash items, aswell as the change in customer receivable balances.
• A $69 million increase in income taxes refunds, pursuant to the taxallocation agreement with Ameren (parent), primarily related todeductions for accelerated depreciation and increased capitalexpenditures.
• A $31 million increase in natural gas commodity costs collected fromcustomers under the PGA.
• A $26 million decrease in the cost of natural gas held in storage causedprimarily by lower natural gas prices.
The following items partially offset the increase in Ameren Illinois’ cashfrom operating activities during 2015, compared with 2014:
• A net $17 million decrease in returns of collateral posted withcounterparties, primarily resulting from changes in the market prices ofpower and natural gas and in contracted commodity volumes, partiallyoffset by the effect of credit rating upgrades.
• A $12 million increase in pension and postretirement benefit plancontributions.
• A $7 million increase in expenditures for customer energy efficiencyprograms compared with amounts collected from customers.
Pension Plans
Ameren’s pension plans are funded in compliance with income taxregulations, federal funding, and other regulatory requirements. As a result,Ameren expects to fund its pension plans at a level equal to the greater of thepension cost or the legally required minimum contribution. ConsideringAmeren’s assumptions at December 31, 2016 , its investment performance in2016 , and its pension funding policy, Ameren expects to make annualcontributions of $50 million to $70 million in each of the next five years, withaggregate estimated contributions of $290 million . We expect AmerenMissouri’s and Ameren Illinois’ portions of the future funding requirementsto be 35% and 55% , respectively. These amounts are estimates. They maychange based on actual investment performance, changes in interest rates,changes in our assumptions, changes in government regulations, and anyvoluntary contributions. In 2016 , Ameren contributed $57 million to itspension plans. See Note 11 – Retirement Benefits under Part II, Item 8, of thisreport for additional information.
Cash Flows from Investing Activities
2016 versus 2015
Ameren's cash used in investing activities associated with continuingoperations increased by $190 million during 2016, compared with 2015.Capital expenditures increased $159 million , primarily because of increasedtransmission expenditures, which included a $41 million increase at ATXIprimarily related to the Illinois Rivers project, and increased Ameren Missouriand Ameren Illinois capital expenditures.
During 2016, there was no cash used in investing activities associatedwith discontinued operations. During 2015, Ameren’s cash used in investingactivities associated with discontinued operations consisted of a $25 millionpayment for a liability associated with the New AER divestiture.
Ameren Missouri’s cash used in investing activities
52

Table of Contents
increased by $ 210 million during 2016 , compared with 2015 . Capitalexpenditures increased $ 116 million , primarily related to electric distributionsystem reliability and energy center projects. Additionally, there was anincrease in net advances to the money pool of $89 million .
Ameren Illinois’ cash used in investing activities increased by $ 5 millionduring 2016, compared with 2015, because of increased capital expenditures,primarily related to qualified investments in natural gas infrastructure underthe QIP rider, storm restoration costs, and reliability.
2015 versus 2014
Ameren's cash used in investing activities associated with continuingoperations increased by $95 million during 2015, compared with 2014.Capital expenditures increased $132 million, because of increasedtransmission expenditures, which included a $174 million increase at ATXI,primarily related to the Illinois Rivers project, and increased Ameren Illinoiscapital expenditures, partially offset by decreased expenditures at AmerenMissouri.
During 2015, Ameren’s cash used in investing activities associated withdiscontinued operations consisted of a $25 million payment for a liabilityassociated with the New AER divestiture. During 2014, cash provided byinvesting activities associated with Ameren’s discontinued operationsconsisted of $152 million received from Rockland Capital for the sale of theElgin, Gibson City, and Grand Tower natural-gas-fired energy centers inJanuary 2014, offset by payment of $13 million to IPH for the final workingcapital adjustment and certain liabilities associated with the New AERdivestiture.
Ameren Missouri’s cash used in investing activities decreased by $113million during 2015, compared with 2014. Capital expenditures decreased$125 million, primarily because several large projects were completed in2014. Nuclear fuel expenditures decreased by $22 million because of thetiming of purchases in 2015 compared with 2014. In addition, cash used ininvesting activities increased in 2015 because of net advances to the moneypool of $36 million; there were no advances in 2014.
Ameren Illinois’ cash used in investing activities increased by $85million during 2015, compared with 2014, because of increased capitalexpenditures, primarily for reliability and IEIMA projects.
Capital Expenditures
The following table presents the capital expenditures by the AmerenCompanies for the years ended December 31, 2016 , 2015 , and 2014 :
2016 2015 2014Ameren (a) $ 2,076 $ 1,917 $ 1,785
Ameren Missouri 738 622 747
Ameren Illinois (b) 924 918 835
(a) Includes amounts for Ameren registrant and nonregistrant subsidiaries and theelimination of intercompany transfers.
(b) See Note 16 – Segment Information under Part II, Item 8, of this report for additionalinformation on Ameren Illinois' capital expenditures by segment.
Ameren’s 2016 capital expenditures consisted of expenditures made byits subsidiaries, including ATXI, which spent $416 million primarily on theIllinois Rivers project. Ameren Illinois spent $273 million on transmissionprojects and $109 million on IEIMA projects. Other capital expenditures weremade principally to maintain, upgrade, and improve the reliability of thetransmission and distribution systems of Ameren Missouri and AmerenIllinois as well as to fund various Ameren Missouri energy center upgrades.
Ameren’s 2015 capital expenditures consisted of expenditures made byits subsidiaries, including ATXI, which spent $375 million primarily on theIllinois Rivers project. Ameren Illinois spent $294 million on transmissionprojects and $134 million on IEIMA projects. Other capital expenditures weremade principally to maintain, upgrade, and improve the reliability of thetransmission and distribution systems of Ameren Missouri and AmerenIllinois as well as to fund various Ameren Missouri energy center upgrades.
Ameren’s 2014 capital expenditures consisted of expenditures made byits subsidiaries including ATXI, which spent $201 million on the IllinoisRivers project. Ameren Missouri spent $101 million for electrostaticprecipitator upgrades at its Labadie energy center, $33 million for thereplacement of the nuclear reactor vessel head at its Callaway energy center,and $16 million for the construction of the O’Fallon energy center. AmerenIllinois spent $295 million on transmission projects and $89 million onIEIMA projects. Other capital expenditures were made principally tomaintain, upgrade, and improve the reliability of the transmission anddistribution systems of Ameren Missouri and Ameren Illinois, as well as tofund various Ameren Missouri energy center upgrades.
In December 2015, a federal tax law was enacted that authorized thecontinued use of bonus depreciation that allows for an acceleration ofdeductions for tax purposes. Bonus depreciation is expected to increase cashflow through at least 2020. Ameren expects to use this incremental cash flowto make capital investments in utility infrastructure for the benefit of itscustomers. Without these investments, the bonus depreciation would reducerate base, which would reduce our revenue requirements and future earningsgrowth. The impact of bonus depreciation on Ameren Missouri, AmerenIllinois, and ATXI will vary based on investment levels at each company.
The following table presents Ameren's estimate of capital expendituresthat will be incurred from 2017 through 2021, including constructionexpenditures, allowance for funds used during construction, and expendituresfor compliance with existing environmental regulations. Ameren expects tocontinue to allocate more of its capital expenditures to Ameren IllinoisElectric Distribution, Ameren Illinois Natural Gas, and Ameren Transmissionbased, in part, on the constructive regulatory frameworks within which theyoperate.
53

Table of Contents
2017 2018-2021 Total
Ameren Missouri $ 785 $ 3,070 - $ 3,395 $ 3,855 - $ 4,180Ameren IllinoisElectric Distribution 480 1,965 - 2,165 2,445 - 2,645Ameren IllinoisNatural Gas 255 1,110 - 1,225 1,365 - 1,480Ameren IllinoisTransmission 375 1,760 1,950 2,135 2,325ATXI 325 240 - 265 565 - 590
Other 5 10 - 15 15 - 20Ameren $ 2,225 $ 8,155 - $ 9,015 $ 10,380 - $ 11,240
Ameren Missouri’s estimated capital expenditures include transmission,distribution, and generation-related investments, as well as expenditures forcompliance with environmental regulations. Ameren Illinois’ estimatedcapital expenditures are primarily for electric and natural gas transmission anddistribution-related investments, capital expenditures to modernize itsdistribution system pursuant to the IEIMA, and capital expenditures forqualified investments in natural gas infrastructure under the QIP rider. ATXI'sestimated capital expenditures include expenditures for the three MISO-approved multi-value transmission projects. For additional informationregarding the IEIMA capital expenditure requirements, the QIP rider, andATXI's transmission projects, see Part I, Item 1, of this report.
Ameren Missouri continually reviews its generation portfolio andexpected power needs. As a result, Ameren Missouri could modify its plan forgeneration capacity, the type of generation asset technology that will beemployed, and whether capacity or power may be purchased, among otherchanges. Additionally, we continually review the reliability of ourtransmission and distribution systems, expected capacity needs, andopportunities for transmission investments. The timing and amount ofinvestments could vary because of changes in expected capacity, the conditionof transmission and distribution systems, and our ability and willingness topursue transmission investments, among other factors. Any changes in futuregeneration, transmission, or distribution needs could result in significantcapital expenditures or losses, which could be material. Compliance withenvironmental regulations could also have significant impacts on the level ofcapital expenditures.
Environmental Capital Expenditures
Ameren Missouri will continue to incur costs to comply with federal andstate regulations, including those requiring the reduction of SO 2 , NO x ,mercury, and CO 2 emissions from its coal-fired energy centers. See Note 15 –Commitments and Contingencies under Part II, Item 8, of this report for adiscussion of existing environmental laws and regulations that affect, or mayaffect, our facilities and capital expenditures to comply with such laws andregulations.
Cash Flows from Financing Activities
Cash provided by, or used in, financing activities is driven by ourfinancing needs, which depend on the level of cash provided
by operating activities, the level of cash used in investing activities, thedividends declared by Ameren's board of directors, and our long-term debtmaturities, among other things.
2016 versus 2015
Ameren's financing activities associated with continuing operations usednet cash of $265 million in 2016, compared with providing net cash of $232million in 2015. The timing of short-term and long-term debt issuances, net oftheir repayments, resulted in $413 million less cash provided by financingactivities in 2016, compared to 2015. No cash from financing activities wasused for discontinued operations during 2016.
Ameren Missouri’s cash used in financing activities increased by $109million in 2016, compared with 2015, primarily because of a $149 milliondecrease in cash provided by short-term and long-term debt activity. This waspartially offset by a $40 million decrease in cash paid to Ameren (parent), netof capital contributions received.
Ameren Illinois' cash provided by financing activities decreased by $176million in 2016, compared with 2015. Short-term and long-term debtissuances, net of their repayments, resulted in $39 million less cash providedby financing activities in 2016, compared with 2015. Additionally, there wasa $110 million increase in dividends paid to Ameren (parent).
2015 versus 2014
Ameren's cash provided by financing activities associated withcontinuing operations increased $105 million in 2015, compared with 2014.Short-term and long-term debt issuances, net of their repayments, resulted in$117 million more cash provided by financing activities in 2015, comparedwith 2014.
Ameren Missouri’s cash used in financing activities increased $212million in 2015, compared with 2014, primarily because of a $201 milliondecrease in cash provided by net short-term and long-term debt activity.Additionally, cash paid to Ameren (parent), net of capital contributionsreceived, increased $11 million .
Ameren Illinois' cash provided by financing activities decreased $163million in 2015, compared with 2014, primarily because of a $175 milliondecrease in cash provided by net short-term and long-term debt activity,partially offset by a $10 million increase in capital contributions receivedfrom Ameren (parent).
Credit Facility Borrowings and Liquidity
The liquidity needs of Ameren, Ameren Missouri, and Ameren Illinoisare typically supported through the use of available cash, or proceeds fromshort-term intercompany borrowings, drawings under the Credit Agreements,or commercial paper issuances. See Note 4 – Short-term Debt and Liquidityunder Part II, Item 8, of this report for additional information on creditagreements, short-term borrowing activity, commercial paper issuances,relevant interest rates, and
54
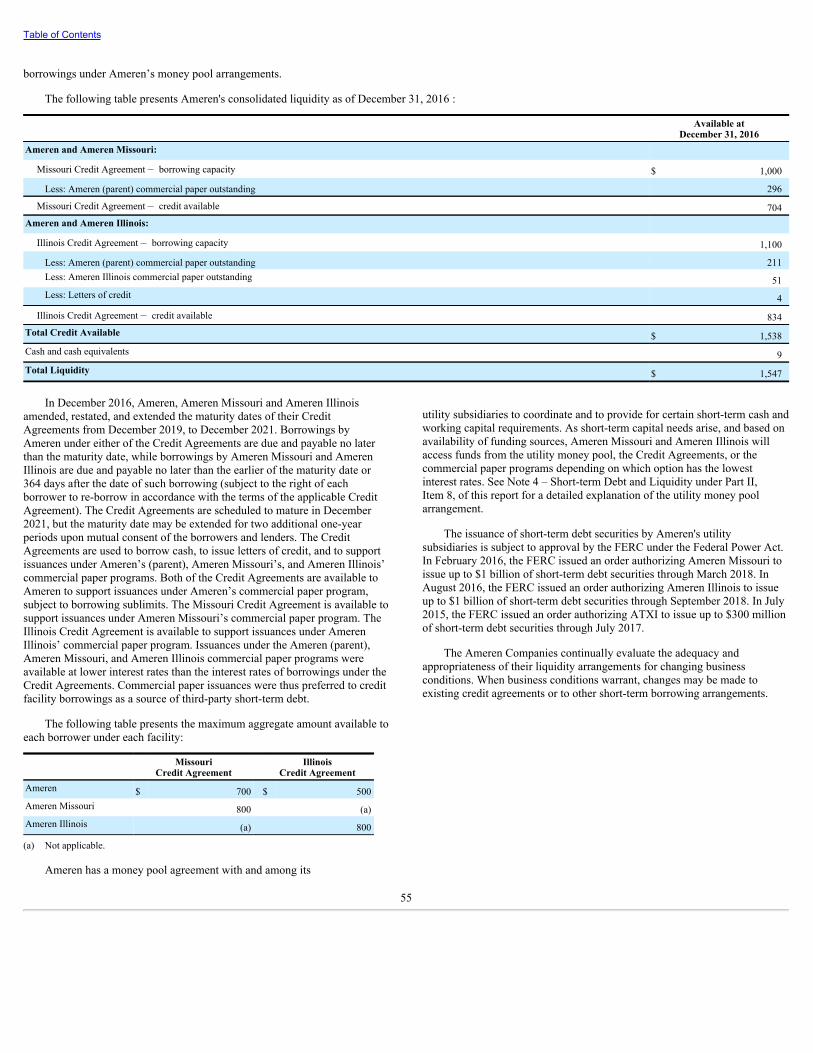
Table of Contents
borrowings under Ameren’s money pool arrangements.
The following table presents Ameren's consolidated liquidity as of December 31, 2016 :
Available at
December 31, 2016Ameren and Ameren Missouri:
Missouri Credit Agreement – borrowing capacity $ 1,000
Less: Ameren (parent) commercial paper outstanding 296
Missouri Credit Agreement – credit available 704Ameren and Ameren Illinois:
Illinois Credit Agreement – borrowing capacity 1,100
Less: Ameren (parent) commercial paper outstanding 211Less: Ameren Illinois commercial paper outstanding 51Less: Letters of credit 4
Illinois Credit Agreement – credit available 834Total Credit Available $ 1,538Cash and cash equivalents 9Total Liquidity $ 1,547
In December 2016, Ameren, Ameren Missouri and Ameren Illinoisamended, restated, and extended the maturity dates of their CreditAgreements from December 2019, to December 2021. Borrowings byAmeren under either of the Credit Agreements are due and payable no laterthan the maturity date, while borrowings by Ameren Missouri and AmerenIllinois are due and payable no later than the earlier of the maturity date or364 days after the date of such borrowing (subject to the right of eachborrower to re-borrow in accordance with the terms of the applicable CreditAgreement). The Credit Agreements are scheduled to mature in December2021, but the maturity date may be extended for two additional one-yearperiods upon mutual consent of the borrowers and lenders. The CreditAgreements are used to borrow cash, to issue letters of credit, and to supportissuances under Ameren’s (parent), Ameren Missouri’s, and Ameren Illinois’commercial paper programs. Both of the Credit Agreements are available toAmeren to support issuances under Ameren’s commercial paper program,subject to borrowing sublimits. The Missouri Credit Agreement is available tosupport issuances under Ameren Missouri’s commercial paper program. TheIllinois Credit Agreement is available to support issuances under AmerenIllinois’ commercial paper program. Issuances under the Ameren (parent),Ameren Missouri, and Ameren Illinois commercial paper programs wereavailable at lower interest rates than the interest rates of borrowings under theCredit Agreements. Commercial paper issuances were thus preferred to creditfacility borrowings as a source of third-party short-term debt.
The following table presents the maximum aggregate amount available toeach borrower under each facility:
Missouri
Credit Agreement Illinois
Credit AgreementAmeren $ 700 $ 500Ameren Missouri 800 (a)Ameren Illinois (a) 800
(a) Not applicable.
Ameren has a money pool agreement with and among its
utility subsidiaries to coordinate and to provide for certain short-term cash andworking capital requirements. As short-term capital needs arise, and based onavailability of funding sources, Ameren Missouri and Ameren Illinois willaccess funds from the utility money pool, the Credit Agreements, or thecommercial paper programs depending on which option has the lowestinterest rates. See Note 4 – Short-term Debt and Liquidity under Part II,Item 8, of this report for a detailed explanation of the utility money poolarrangement.
The issuance of short-term debt securities by Ameren's utilitysubsidiaries is subject to approval by the FERC under the Federal Power Act.In February 2016, the FERC issued an order authorizing Ameren Missouri toissue up to $1 billion of short-term debt securities through March 2018. InAugust 2016, the FERC issued an order authorizing Ameren Illinois to issueup to $1 billion of short-term debt securities through September 2018. In July2015, the FERC issued an order authorizing ATXI to issue up to $300 millionof short-term debt securities through July 2017.
The Ameren Companies continually evaluate the adequacy andappropriateness of their liquidity arrangements for changing businessconditions. When business conditions warrant, changes may be made toexisting credit agreements or to other short-term borrowing arrangements.
55
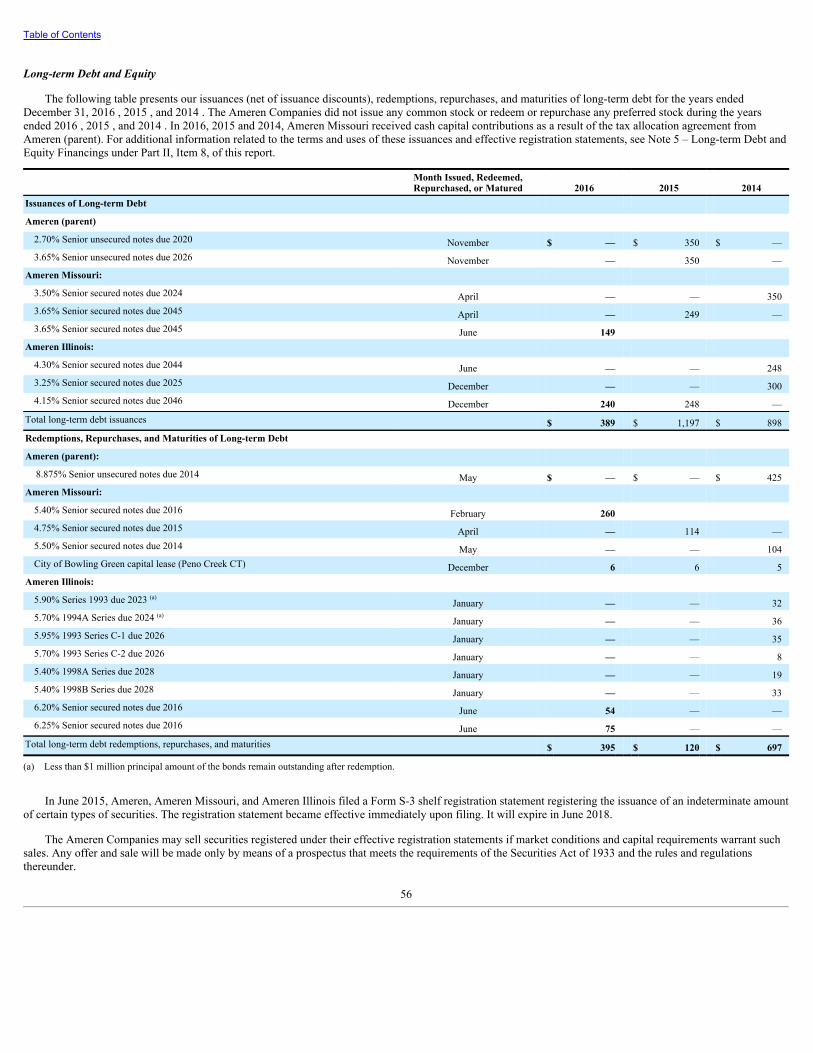
Table of Contents
Long-term Debt and Equity
The following table presents our issuances (net of issuance discounts), redemptions, repurchases, and maturities of long-term debt for the years endedDecember 31, 2016 , 2015 , and 2014 . The Ameren Companies did not issue any common stock or redeem or repurchase any preferred stock during the yearsended 2016 , 2015 , and 2014 . In 2016, 2015 and 2014, Ameren Missouri received cash capital contributions as a result of the tax allocation agreement fromAmeren (parent). For additional information related to the terms and uses of these issuances and effective registration statements, see Note 5 – Long-term Debt andEquity Financings under Part II, Item 8, of this report.
Month Issued, Redeemed,Repurchased, or Matured 2016 2015 2014
Issuances of Long-term Debt Ameren (parent) 2.70% Senior unsecured notes due 2020 November $ — $ 350 $ —3.65% Senior unsecured notes due 2026 November — 350 —
Ameren Missouri: 3.50% Senior secured notes due 2024 April — — 3503.65% Senior secured notes due 2045 April — 249 —3.65% Senior secured notes due 2045 June 149
Ameren Illinois: 4.30% Senior secured notes due 2044 June — — 2483.25% Senior secured notes due 2025 December — — 3004.15% Senior secured notes due 2046 December 240 248 —
Total long-term debt issuances $ 389 $ 1,197 $ 898Redemptions, Repurchases, and Maturities of Long-term Debt Ameren (parent): 8.875% Senior unsecured notes due 2014 May $ — $ — $ 425
Ameren Missouri: 5.40% Senior secured notes due 2016 February 260 4.75% Senior secured notes due 2015 April — 114 —5.50% Senior secured notes due 2014 May — — 104City of Bowling Green capital lease (Peno Creek CT) December 6 6 5
Ameren Illinois: 5.90% Series 1993 due 2023 (a) January — — 325.70% 1994A Series due 2024 (a) January — — 365.95% 1993 Series C-1 due 2026 January — — 355.70% 1993 Series C-2 due 2026 January — — 85.40% 1998A Series due 2028 January — — 195.40% 1998B Series due 2028 January — — 336.20% Senior secured notes due 2016 June 54 — —6.25% Senior secured notes due 2016 June 75 — —
Total long-term debt redemptions, repurchases, and maturities $ 395 $ 120 $ 697
(a) Less than $1 million principal amount of the bonds remain outstanding after redemption.
In June 2015, Ameren, Ameren Missouri, and Ameren Illinois filed a Form S-3 shelf registration statement registering the issuance of an indeterminate amountof certain types of securities. The registration statement became effective immediately upon filing. It will expire in June 2018.
The Ameren Companies may sell securities registered under their effective registration statements if market conditions and capital requirements warrant suchsales. Any offer and sale will be made only by means of a prospectus that meets the requirements of the Securities Act of 1933 and the rules and regulationsthereunder.
56
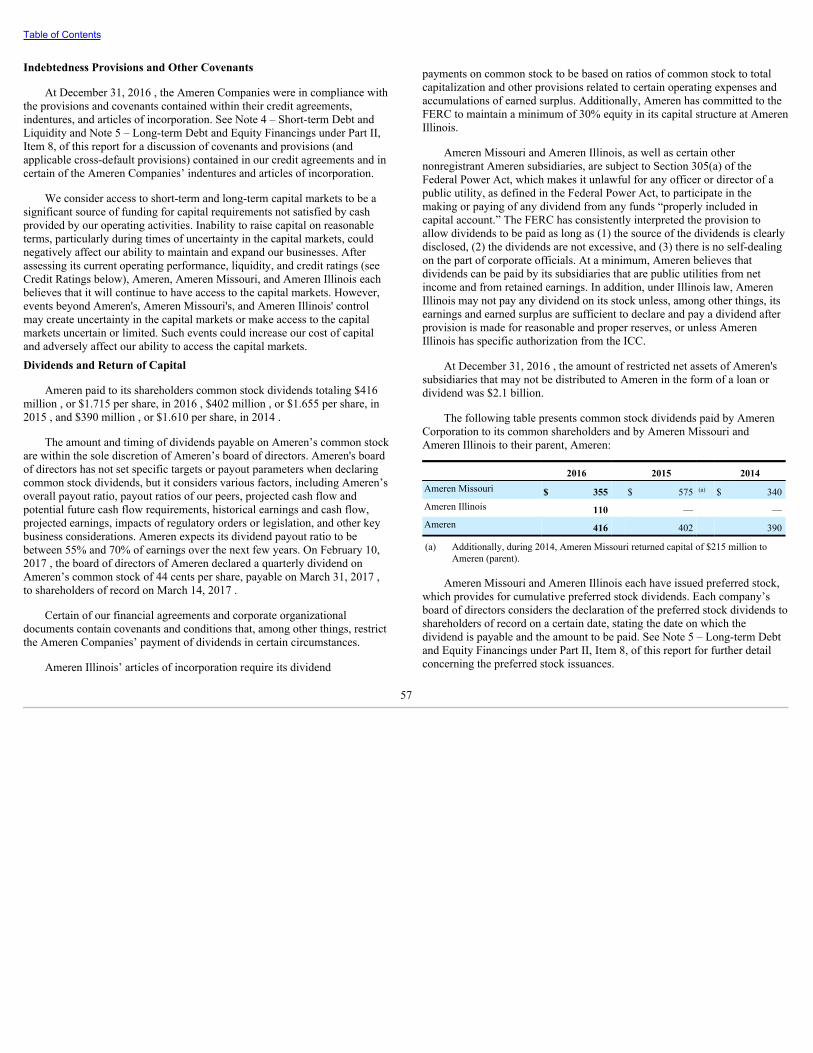
Table of Contents
Indebtedness Provisions and Other Covenants
At December 31, 2016 , the Ameren Companies were in compliance withthe provisions and covenants contained within their credit agreements,indentures, and articles of incorporation. See Note 4 – Short-term Debt andLiquidity and Note 5 – Long-term Debt and Equity Financings under Part II,Item 8, of this report for a discussion of covenants and provisions (andapplicable cross-default provisions) contained in our credit agreements and incertain of the Ameren Companies’ indentures and articles of incorporation.
We consider access to short-term and long-term capital markets to be asignificant source of funding for capital requirements not satisfied by cashprovided by our operating activities. Inability to raise capital on reasonableterms, particularly during times of uncertainty in the capital markets, couldnegatively affect our ability to maintain and expand our businesses. Afterassessing its current operating performance, liquidity, and credit ratings (seeCredit Ratings below), Ameren, Ameren Missouri, and Ameren Illinois eachbelieves that it will continue to have access to the capital markets. However,events beyond Ameren's, Ameren Missouri's, and Ameren Illinois' controlmay create uncertainty in the capital markets or make access to the capitalmarkets uncertain or limited. Such events could increase our cost of capitaland adversely affect our ability to access the capital markets.Dividends and Return of Capital
Ameren paid to its shareholders common stock dividends totaling $416million , or $1.715 per share, in 2016 , $402 million , or $1.655 per share, in2015 , and $390 million , or $1.610 per share, in 2014 .
The amount and timing of dividends payable on Ameren’s common stockare within the sole discretion of Ameren’s board of directors. Ameren's boardof directors has not set specific targets or payout parameters when declaringcommon stock dividends, but it considers various factors, including Ameren’soverall payout ratio, payout ratios of our peers, projected cash flow andpotential future cash flow requirements, historical earnings and cash flow,projected earnings, impacts of regulatory orders or legislation, and other keybusiness considerations. Ameren expects its dividend payout ratio to bebetween 55% and 70% of earnings over the next few years. On February 10,2017 , the board of directors of Ameren declared a quarterly dividend onAmeren’s common stock of 44 cents per share, payable on March 31, 2017 ,to shareholders of record on March 14, 2017 .
Certain of our financial agreements and corporate organizationaldocuments contain covenants and conditions that, among other things, restrictthe Ameren Companies’ payment of dividends in certain circumstances.
Ameren Illinois’ articles of incorporation require its dividend
payments on common stock to be based on ratios of common stock to totalcapitalization and other provisions related to certain operating expenses andaccumulations of earned surplus. Additionally, Ameren has committed to theFERC to maintain a minimum of 30% equity in its capital structure at AmerenIllinois.
Ameren Missouri and Ameren Illinois, as well as certain othernonregistrant Ameren subsidiaries, are subject to Section 305(a) of theFederal Power Act, which makes it unlawful for any officer or director of apublic utility, as defined in the Federal Power Act, to participate in themaking or paying of any dividend from any funds “properly included incapital account.” The FERC has consistently interpreted the provision toallow dividends to be paid as long as (1) the source of the dividends is clearlydisclosed, (2) the dividends are not excessive, and (3) there is no self-dealingon the part of corporate officials. At a minimum, Ameren believes thatdividends can be paid by its subsidiaries that are public utilities from netincome and from retained earnings. In addition, under Illinois law, AmerenIllinois may not pay any dividend on its stock unless, among other things, itsearnings and earned surplus are sufficient to declare and pay a dividend afterprovision is made for reasonable and proper reserves, or unless AmerenIllinois has specific authorization from the ICC.
At December 31, 2016 , the amount of restricted net assets of Ameren'ssubsidiaries that may not be distributed to Ameren in the form of a loan ordividend was $2.1 billion.
The following table presents common stock dividends paid by AmerenCorporation to its common shareholders and by Ameren Missouri andAmeren Illinois to their parent, Ameren:
2016 2015 2014Ameren Missouri $ 355 $ 575 (a) $ 340Ameren Illinois 110 — —Ameren 416 402 390
(a) Additionally, during 2014, Ameren Missouri returned capital of $215 million toAmeren (parent).
Ameren Missouri and Ameren Illinois each have issued preferred stock,which provides for cumulative preferred stock dividends. Each company’sboard of directors considers the declaration of the preferred stock dividends toshareholders of record on a certain date, stating the date on which thedividend is payable and the amount to be paid. See Note 5 – Long-term Debtand Equity Financings under Part II, Item 8, of this report for further detailconcerning the preferred stock issuances.
57
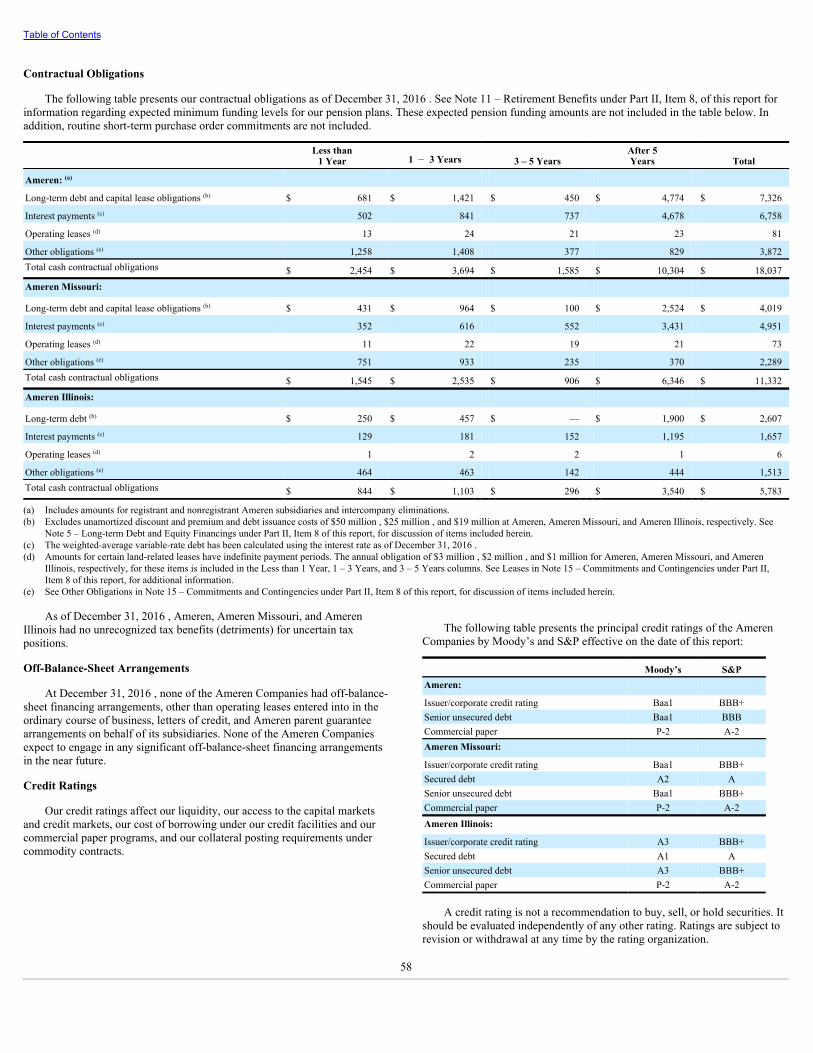
Table of Contents
Contractual Obligations
The following table presents our contractual obligations as of December 31, 2016 . See Note 11 – Retirement Benefits under Part II, Item 8, of this report forinformation regarding expected minimum funding levels for our pension plans. These expected pension funding amounts are not included in the table below. Inaddition, routine short-term purchase order commitments are not included.
Less than
1 Year 1 – 3 Years 3 – 5 Years After 5Years Total
Ameren: (a)
Long-term debt and capital lease obligations (b) $ 681 $ 1,421 $ 450 $ 4,774 $ 7,326
Interest payments (c) 502 841 737 4,678 6,758
Operating leases (d) 13 24 21 23 81
Other obligations (e) 1,258 1,408 377 829 3,872Total cash contractual obligations $ 2,454 $ 3,694 $ 1,585 $ 10,304 $ 18,037Ameren Missouri:
Long-term debt and capital lease obligations (b) $ 431 $ 964 $ 100 $ 2,524 $ 4,019
Interest payments (c) 352 616 552 3,431 4,951
Operating leases (d) 11 22 19 21 73
Other obligations (e) 751 933 235 370 2,289Total cash contractual obligations $ 1,545 $ 2,535 $ 906 $ 6,346 $ 11,332Ameren Illinois:
Long-term debt (b) $ 250 $ 457 $ — $ 1,900 $ 2,607
Interest payments (c) 129 181 152 1,195 1,657
Operating leases (d) 1 2 2 1 6
Other obligations (e) 464 463 142 444 1,513Total cash contractual obligations $ 844 $ 1,103 $ 296 $ 3,540 $ 5,783
(a) Includes amounts for registrant and nonregistrant Ameren subsidiaries and intercompany eliminations.(b) Excludes unamortized discount and premium and debt issuance costs of $50 million , $25 million , and $19 million at Ameren, Ameren Missouri, and Ameren Illinois, respectively. See
Note 5 – Long-term Debt and Equity Financings under Part II, Item 8 of this report, for discussion of items included herein.(c) The weighted-average variable-rate debt has been calculated using the interest rate as of December 31, 2016 .(d) Amounts for certain land-related leases have indefinite payment periods. The annual obligation of $3 million , $2 million , and $1 million for Ameren, Ameren Missouri, and Ameren
Illinois, respectively, for these items is included in the Less than 1 Year, 1 – 3 Years, and 3 – 5 Years columns. See Leases in Note 15 – Commitments and Contingencies under Part II,Item 8 of this report, for additional information.
(e) See Other Obligations in Note 15 – Commitments and Contingencies under Part II, Item 8 of this report, for discussion of items included herein.
As of December 31, 2016 , Ameren, Ameren Missouri, and AmerenIllinois had no unrecognized tax benefits (detriments) for uncertain taxpositions.
Off-Balance-Sheet Arrangements
At December 31, 2016 , none of the Ameren Companies had off-balance-sheet financing arrangements, other than operating leases entered into in theordinary course of business, letters of credit, and Ameren parent guaranteearrangements on behalf of its subsidiaries. None of the Ameren Companiesexpect to engage in any significant off-balance-sheet financing arrangementsin the near future.
Credit Ratings
Our credit ratings affect our liquidity, our access to the capital marketsand credit markets, our cost of borrowing under our credit facilities and ourcommercial paper programs, and our collateral posting requirements undercommodity contracts.
The following table presents the principal credit ratings of the Ameren
Companies by Moody’s and S&P effective on the date of this report:
Moody’s S&PAmeren: Issuer/corporate credit rating Baa1 BBB+Senior unsecured debt Baa1 BBBCommercial paper P-2 A-2Ameren Missouri: Issuer/corporate credit rating Baa1 BBB+Secured debt A2 ASenior unsecured debt Baa1 BBB+Commercial paper P-2 A-2Ameren Illinois: Issuer/corporate credit rating A3 BBB+Secured debt A1 ASenior unsecured debt A3 BBB+Commercial paper P-2 A-2
A credit rating is not a recommendation to buy, sell, or hold securities. Itshould be evaluated independently of any other rating. Ratings are subject torevision or withdrawal at any time by the rating organization.
58
Table of Contents
Collateral Postings
Any weakening of our credit ratings may reduce access to capital andtrigger additional collateral postings and prepayments. Such changes may alsoincrease the cost of borrowing, resulting in an adverse effect on earnings.Cash collateral postings and prepayments made with external parties,including postings related to exchange-traded contracts was $12 million atAmeren and Ameren Missouri at December 31, 2016 . Cash collateral postedby external parties with Ameren, Ameren Missouri, and Ameren Illinois wereimmaterial at December 31, 2016 . A sub-investment-grade issuer or seniorunsecured debt rating (whether below “BBB-” from S&P or below “Baa3”from Moody's) at December 31, 2016 , could have resulted in Ameren,Ameren Missouri, or Ameren Illinois being required to post additionalcollateral or other assurances for certain trade obligations amounting to $80million, $54 million, and $26 million, respectively.
Changes in commodity prices could trigger additional collateral postingsand prepayments. Based on credit ratings at December 31, 2016 , if marketprices were 15% higher or lower than December 31, 2016 levels in the next12 months and 20% higher or lower thereafter through the end of the term ofthe commodity contracts, then Ameren, Ameren Missouri, or Ameren Illinoiscould be required to post an immaterial amount, compared to each company'sliquidity, of collateral or provide other assurances for certain tradeobligations.
OUTLOOK
We seek to earn competitive returns on investments in our businesses.We are seeking to improve our regulatory frameworks and cost recoverymechanisms and simultaneously pursuing constructive regulatory outcomeswithin existing frameworks, while also advocating for responsible energypolicies. We are seeking to align our overall spending, both operating andcapital, with economic conditions and with regulatory frameworks establishedby our regulators and to create and capitalize on investment opportunities forthe benefit of our customers and shareholders. We are focused on minimizingthe gap between allowed and earned returns on equity and intend to allocatecapital resources to our business opportunities that we expect to offer the mostattractive risk-adjusted return potential.
As a part of Ameren's strategic plan, we are pursuing projects to meet ourcustomer energy needs and to improve electric and natural gas systemreliability, safety, and security within our service territories, as well asevaluating competitive electric transmission investment opportunities outsideof these territories, including investments outside of MISO as they arise.Additionally, Ameren Missouri will make investments over time that willenable it to transition to a more diverse energy portfolio.
Below are some key trends, events, and uncertainties that are reasonablylikely to affect our results of operations, financial condition, or liquidity, aswell as our ability to achieve strategic and financial objectives, for 2017 andbeyond.
Operations
• Ameren continues to invest in FERC-regulated electric transmission.MISO has approved three electric transmission projects to be developedby ATXI. The Illinois Rivers project involves the construction of atransmission line from western Indiana across the state of Illinois toeastern Missouri. The last section of this project is expected to becompleted by 2019. The Spoon River project, located in northwestIllinois, and the Mark Twain project, located in northeast Missouri, arethe other two MISO-approved projects to be constructed by ATXI.Construction activities for the Spoon River project are continuing onschedule and the project is expected to be completed in 2018. The IllinoisRivers and the Spoon River projects have received all of the necessaryapprovals to authorize their construction. In April 2016, the MoPSCgranted ATXI a certificate of convenience and necessity for the MarkTwain project. Before starting construction, ATXI must obtain assents forroad crossings from the five counties where the line will be constructed.None of the five county commissions have approved ATXI’s requests forthe assents. ATXI is planning to complete the project in 2019; however,further delays in obtaining the assents could delay the completion date.The total investment in all three projects is expected to be more than$575 million from 2017 through 2019. Ameren Illinois expects to invest$2.2 billion in electric transmission assets from 2017 through 2021 toreplace aging infrastructure and improve reliability.
• Both Ameren Illinois and ATXI use a forward-looking rate calculationwith an annual revenue requirement reconciliation for each company’selectric transmission business. Based on the rates that became effectiveon January 1, 2017, and the currently allowed 10.82% return on commonequity, the 2017 revenue requirement for Ameren Illinois’ electrictransmission business would be $258 million. The 2017 revenuerequirement represents a $33 million increase over the revised 2016revenue requirement, which became effective in September 2016, andwas based on a 10.82% return on common equity. These January 2017rates reflect a capital structure comprised of 51.6% common equity and aprojected average rate base of $1.4 billion. Based on the rates thatbecame effective on January 1, 2017, and the currently allowed 10.82%return on equity, the 2017 revenue requirement for ATXI’s electrictransmission business would be $171 million. The 2017 revenuerequirement represents a $44 million increase over the revised 2016revenue requirement, which became effective in September 2016, andwas based on a 10.82% return on common equity. These January 2017rates reflect a capital structure comprised of 56.3% common equity and aprojected average rate base of $1.1 billion, reflecting additionalinvestment in the Illinois Rivers project.
• The return on common equity was the subject of two FERC complaintproceedings, the November 2013 complaint case and the February 2015complaint case, that each challenged the allowed base return on commonequity for MISO transmission owners, including Ameren Illinois andATXI. In September 2016, the FERC issued a final order in
59
Table of Contents
the November 2013 complaint case which lowered the allowed basereturn on common equity to 10.32%, or a 10.82% total return on commonequity with the inclusion of the 50 basis point incentive adder forparticipation in an RTO. The order was consistent with the initialdecision an administrative law judge issued in December 2015, andrequires customer refunds, with interest, to be issued for the 15-monthperiod ended February 2015. In addition, the new allowed return oncommon equity is reflected in rates prospectively from the September2016 effective date of the order. Refunds for the November 2013complaint case are expected to be issued in the first half of 2017. In June2016, an administrative law judge issued an initial decision in theFebruary 2015 complaint case, which if approved by FERC, would lowerthe allowed base return on common equity to 9.70%, or a 10.20% totalreturn on equity with the inclusion of the 50 basis point incentive adderfor participation in an RTO. It would also require the issuance ofcustomer refunds, with interest, for the 15-month period ended May2016. The FERC is expected to issue a final order in the February 2015complaint case in the second quarter of 2017. That final order willdetermine the allowed return on common equity for the 15-month periodended May 2016. That final order will also establish the allowed returnon common equity that will apply prospectively from its expected secondquarter 2017 effective date, replacing the current 10.82% total return oncommon equity, which became effective in September 2016. A 50 basispoint reduction in the FERC-allowed base return on common equitywould reduce Ameren's and Ameren Illinois' annual earnings by anestimated $7 million and $4 million , respectively, based on eachcompany’s 2017 projected rate base. Ameren and Ameren Illinoisrecorded current regulatory liabilities on their respective December 31,2016 balance sheets, representing their estimate of the expected refunds.
• In July 2016, Ameren Missouri filed a request with the MoPSC seekingapproval to increase its annual revenues for electric service. Relating tothat request, in February 2017, Ameren Missouri, the MoPSC staff, theMoOPC, and all intervenors filed a unanimous stipulation and agreementwith the MoPSC. The stipulation and agreement, which is subject toMoPSC approval, would result in a $3.4 billion revenue requirement,which is a $92 million increase in Ameren Missouri’s annual revenuerequirement for electric service compared to its prior revenuerequirement established in the MoPSC's April 2015 electric rate order.The stipulation and agreement did not specify the common equitypercentage, the rate base, or the allowed return on common equity. Thenew revenue requirement reflects the current actual sales volumes of theNew Madrid Smelter, whose operations remain suspended, as well asother agreed upon sales volumes. Excluding cost reductions associatedwith reduced sales volumes, the base level of net energy costs under thestipulation and agreement would decrease by $54 million from the baselevel established in the MoPSC's April 2015 electric rate order. Changesin amortizations and the base level of expenses for the other regulatorytracking mechanisms, including extending the
amortization period of certain regulatory assets, would reduce expensesby $26 million from the base levels established in the MoPSC's April2015 electric rate order. The stipulation and agreement contemplates thatnew rates will become effective on or before March 20, 2017.
• In the first quarter of 2016, Noranda, which was historically AmerenMissouri's largest customer, suspended operations at the New MadridSmelter and filed voluntary petitions for a court-supervised restructuringprocess under Chapter 11 of the United States Bankruptcy Code. InOctober 2016, Noranda sold the New Madrid Smelter to ARGInternational AG. Operations at the New Madrid Smelter remainsuspended, and Ameren Missouri is uncertain of future sales to thesmelter. As a result, Ameren Missouri will not fully recover its revenuerequirement until rates are adjusted prospectively by the MoPSC toaccurately reflect the actual sales volumes to the New Madrid Smelter.Based on the unanimous stipulation and agreement filed with the MoPSCin February 2017, electric rates are expected to be adjusted in March2017 to accurately reflect the smelter’s actual sales volumes.
• The IEIMA provides for an annual reconciliation of the revenuerequirement necessary to reflect the actual costs incurred in a given yearwith the revenue requirement that was reflected in customer rates for thatyear. Consequently, Ameren Illinois' 2017 electric distribution servicerevenues will be based on its 2017 actual recoverable costs, rate base, andreturn on common equity as calculated under the IEIMA's performance-based formula ratemaking framework. The 2017 revenue requirement isexpected to be higher than the 2016 revenue requirement because of anexpected increase in recoverable costs, expected rate base growth of5.25%, and an expected increase in the monthly average of United Statestreasury bonds. A 50 basis point change in the average monthly yields ofthe 30-year United States Treasury bonds would result in an estimated $7million change in Ameren's and Ameren Illinois' net income, based on its2017 projected rate base.
• In December 2016, the ICC issued an order with respect to AmerenIllinois’ annual update filing. The ICC approved a $14 million decreasein Ameren Illinois’ electric distribution service revenue requirement thatbegan in January 2017. These rates have affected, and will continue toaffect, Ameren Illinois' cash receipts during 2017, but will not affect itselectric distribution service operating revenues, which will instead bedetermined by Ameren Illinois' recoverable costs, rate base, commonequity percentage, and the monthly average of the United States treasurybonds in 2017. The 2017 revenue requirement reconciliation, asdiscussed above, is expected to result in a regulatory asset that will becollected from customers in 2019.
• Beginning as early as June 2017, the FEJA will allow Ameren Illinois toearn a return on its electric energy efficiency program investments.Ameren Illinois electric energy efficiency investments will be deferred asa regulatory asset and will earn a return at the company’s weightedaverage cost of capital, with the equity return based on the monthlyaverage yield of the 30-year United States Treasury bonds plus 580 basispoints. The equity
60
Table of Contents
portion of Ameren Illinois’ return on electric energy efficiencyinvestments can also be increased or decreased by 200 basis points basedon the achievement of annual energy savings goals. The FEJA increasedthe level of electric energy efficiency saving targets through 2030. Basedon a formula provided in the act, Ameren Illinois estimates it canannually invest up to $100 million from 2018 through 2021, up to $107million annually from 2022 through 2025, and up to $114 millionannually from 2026 through 2030. The ICC has the ability to lower theelectric energy efficiency saving goals if there are insufficient costeffective measures available. The electric energy efficiency programinvestments and the return on those investments will be recoveredthrough a rider, and will not be included in the IEIMA formula rateprocess.
• Beginning in 2017, the FEJA decouples electric distribution revenuesestablished in a rate proceeding from actual sales volumes by providingthat any revenue changes driven by actual electric distribution salesvolumes differing from sales volumes reflected in that year's rates will becollected from or refunded to customers within two years.
• Ameren Missouri's next scheduled refueling and maintenance outage atits Callaway energy center will be in fall 2017 and Ameren Missouriexpects to incur $32 million of maintenance expenses, whichapproximates the cost of the spring 2016 outage. During a scheduledoutage, which occurs every 18 months, maintenance expenses increaserelative to non-outage years. Additionally, depending on the availabilityof its other generation sources and the market prices for power, AmerenMissouri's purchased power costs may increase and the amount of excesspower available for sale may decrease versus non-outage years. Changesin purchased power costs and excess power available for sale areincluded in the FAC, which results in limited impacts to earnings.
• As we continue to experience cost increases and to make infrastructureinvestments, Ameren Missouri and Ameren Illinois expect to seek regularelectric and natural gas rate increases and timely cost recovery andtracking mechanisms from their regulators. Ameren Missouri andAmeren Illinois will also seek legislative solutions, as necessary, toaddress regulatory lag and to support investment in their utilityinfrastructure for the benefit of their customers. Ameren Missouri andAmeren Illinois continue to face cost recovery pressures, includinglimited economic growth in their service territories, customerconservation efforts, the impacts of additional customer energy efficiencyprograms, increased customer use of innovative and increasingly cost-effective technological advances including private generation andstorage, increased investments and expected future investments forenvironmental compliance, system reliability improvements, and newgeneration capacity, including renewable energy requirements. Increasedinvestments also result in higher depreciation and financing costs.Increased costs are also expected from rising employee benefit costs andhigher property taxes, among other costs.
For additional information regarding recent rate orders,
lawsuits, and related appeals and pending requests filed with state and federalregulatory commissions, including the February 2017 unanimous stipulationand agreement filed with the MoPSC that settles Ameren Missouri's July 2016electric rate case, see Note 2 – Rate and Regulatory Matters and Note 10 –Callaway Energy Center under Part II, Item 8, of this report.
Liquidity and Capital Resources
• Through 2021, we expect to make significant capital expenditures toimprove our electric and natural gas utility infrastructure with a majorportion directed to our transmission and distribution systems. Weestimate that we will invest in total up to $11.2 billion (Ameren Missouri– up to $4.2 billion ; Ameren Illinois – up to $6.4 billion ; ATXI – up to$0.6 billion ) of capital expenditures during the period from 2017 through2021 .
• Environmental regulations, including those related to CO 2 emissions, orother actions taken by the EPA could result in significant increases incapital expenditures and operating costs. These costs could beprohibitive, which could result in the closure of some of AmerenMissouri's coal-fired energy centers. Ameren Missouri's capitalexpenditures are subject to MoPSC prudence reviews, which could resultin cost disallowances as well as regulatory lag. The cost of AmerenIllinois’ purchased power and natural gas purchased for resale couldincrease. However, Ameren Illinois expects these costs would berecovered from customers with no material adverse effect on its results ofoperations, financial position, or liquidity. Ameren's and AmerenMissouri's earnings could benefit from increased investment to complywith environmental regulations if those investments are reflected andrecovered on a timely basis in rates charged to customers.
• In February 2016, the United States Supreme Court stayed the CleanPower Plan and all implementation requirements until the legal appealsare concluded. If the rule is ultimately upheld and not rescinded oraltered significantly by the new federal administration, Ameren Missouriexpects to incur increased net fuel and operating costs, and make new oraccelerated capital expenditures, in addition to the costs of makingmodifications to existing operations in order to achieve compliance.Compliance measures could result in the closure or alteration of theoperation of some of Ameren Missouri’s coal and natural-gas-firedenergy centers, which could result in increased operating costs.
• Ameren Missouri files a nonbinding integrated resource plan with theMoPSC every three years and will file its next plan in 2017. AmerenMissouri’s integrated resource plan filed with the MoPSC in October2014, prior to the issuance of the Clean Power Plan, was a 20-year planthat supported a more diverse energy portfolio in Missouri, includingcoal, solar, wind, natural gas, hydro and nuclear power. The planinvolves expanding renewable generation, retiring coal-fired generationas those energy centers reach the end of their useful lives, expandingcustomer energy efficiency programs, and adding natural gas-firedcombined cycle generation.
• The Ameren Companies have multiyear credit agreements
61
Table of Contents
that cumulatively provide $2.1 billion of credit through December 2021,subject to a 364-day repayment term in the case of Ameren Missouri andAmeren Illinois. See Note 4 – Short-term Debt and Liquidity under PartII, Item 8, of this report for additional information regarding the CreditAgreements. By the end of 2018, $803 million and $707 million of seniorsecured notes are scheduled to mature at Ameren Missouri and AmerenIllinois, respectively. Ameren Missouri and Ameren Illinois expect torefinance these senior secured notes. In addition, the Ameren Companiesmay refinance a portion of their outstanding short-term debt with long-term debt in 2017. Ameren, Ameren Missouri, and Ameren Illinoisbelieve that their liquidity is adequate given their expected operating cashflows, capital expenditures, and related financing plans. However, therecan be no assurance that significant changes in economic conditions,disruptions in the capital and credit markets, or other unforeseen eventswill not materially affect their ability to execute their expected operating,capital, or financing plans.
• In December 2015, a federal tax law was enacted that authorized thecontinued use of bonus depreciation which allows for an acceleration ofdeductions for tax purposes at a rate of 50% through 2017. The rate willbe reduced to 40% in 2018 and then to 30% in 2019. Bonus depreciationwill be phased out in 2020 unless a new law is enacted. Based on existingtax laws, bonus depreciation is expected to reduce or eliminate federalincome tax payments through at least 2020. Ameren expects to use thisincremental cash flow to make capital investments in utilityinfrastructure for the benefit of its customers. Without these investments,bonus depreciation would reduce rate base, which reduces our revenuerequirements and future earnings growth. The impact of bonusdepreciation on the Ameren Companies will vary based on investmentlevels at each company.
• As of December 31, 2016 , Ameren had $539 million in tax benefits fromfederal and state net operating loss carryforwards (Ameren Missouri –$37 million and Ameren Illinois – $137 million) and $130 million infederal and state income tax credit carryforwards (Ameren Missouri –$29 million and Ameren Illinois – $1 million). In addition, Ameren has$35 million of expected state income tax refunds and state overpayments.Consistent with the tax allocation agreement between Ameren and itssubsidiaries, these carryforwards are expected to partially offset incometax liabilities for Ameren Missouri through 2017 and Ameren Illinoisuntil 2021. Based on existing tax laws, Ameren does not expect to makematerial federal income tax payments until 2021. These tax benefits,primarily at the Ameren (parent) level, when realized, would be availableto support funding Ameren Transmission investments.
• Ameren expects its cash used for capital expenditures and dividends toexceed cash provided by operating activities over the next several years.Ameren expects to use debt to fund such cash shortfalls; it does notcurrently expect to issue equity over the next several years.
The above items could have a material impact on our results ofoperations, financial position, or liquidity. Additionally, in the ordinary courseof business, we evaluate strategies to enhance
our results of operations, financial position, or liquidity. These strategies mayinclude acquisitions, divestitures, and opportunities to reduce costs or increaserevenues, and other strategic initiatives to increase Ameren's shareholdervalue. We are unable to predict which, if any, of these initiatives will beexecuted. The execution of these initiatives may have a material impact onour future results of operations, financial position, or liquidity.
REGULATORY MATTERS
See Note 2 – Rate and Regulatory Matters under Part II, Item 8, of thisreport.
62
Table of Contents
ACCOUNTING MATTERS
Critical Accounting Estimates
Preparation of the financial statements and related disclosures in compliance with GAAP requires the application of appropriate technical accounting rules andguidance, as well as the use of estimates. These estimates involve judgments regarding many factors that in and of themselves could materially affect the financialstatements and disclosures. We have outlined below the critical accounting estimates that we believe are the most difficult, subjective, or complex. Any change inthe assumptions or judgments applied in determining the following matters, among others, could have a material impact on future financial results.
Accounting Estimate Uncertainties Affecting Application
Regulatory Mechanisms and Cost RecoveryWe defer costs and recognize revenues that we intend to collect in futurerates.
• Regulatory environment and external regulatory decisions andrequirements
• Anticipated future regulatory decisions and our assessment of theirimpact
• The impact of prudence reviews, complaint cases, and opposition duringthe ratemaking process that may limit our ability to timely recover costsand earn a fair return on our investments
• Ameren Illinois’ assessment of and ability to estimate the current year’selectric delivery service costs to be reflected in revenues and recoveredfrom customers in a subsequent year under the IEIMA performance-based formula ratemaking process
• Ameren Illinois’ and ATXI's assessment of and ability to estimate thecurrent year’s electric transmission service costs to be reflected inrevenues and recovered from customers in a subsequent year under theFERC ratemaking process
• Ameren Missouri's estimate of revenue recovery under the MEEIA plans
Basis for JudgmentThe application of accounting guidance for rate-regulated businesses results in recording regulatory assets and liabilities. Regulatory assets represent the deferralof incurred costs that are probable of future recovery in customer rates. Regulatory assets are amortized as the incurred costs are recovered through customerrates. In some cases, we record regulatory assets before approval for recovery has been received from the applicable regulatory commission. We must usejudgment to conclude that costs deferred as regulatory assets are probable of future recovery. We base our conclusion on certain factors, including, but notlimited to, orders issued by our regulatory commissions, legislation, or historical experience, as well as discussions with legal counsel. Regulatory liabilitiesrepresent revenues received from customers to fund expected costs that have not yet been incurred or probable future refunds to customers. If facts andcircumstances lead us to conclude that a recorded regulatory asset is no longer probable of recovery or that plant assets are probable of disallowance, we record acharge to earnings, which could be material. We also recognize revenues for alternative revenue programs authorized by our regulators that allow for anautomatic rate adjustment, are probable of recovery, and are collected within 24 months following the end of the annual period in which they are recognized.Ameren Illinois estimates its annual revenue requirement pursuant to the IEIMA for interim periods by using internal forecasted information, such as projectedoperations and maintenance expenses, depreciation expense, taxes other than income taxes, and rate base, as well as published forecasted data regarding thatyear's monthly average yields of the 30-year United States Treasury bonds. Ameren Illinois estimates its annual revenue requirement as of December 31 of eachyear using that year's actual operating results and assesses the probability of recovery from or refund to customers that the ICC will order at the end of thefollowing year. Variations in costs incurred, investments made, or orders by the ICC or courts can result in a subsequent change in Ameren Illinois' estimate.Ameren Illinois and ATXI follow a similar process for their FERC rate-regulated electric transmission businesses. Ameren Missouri estimates lost revenuesresulting from its MEEIA customer energy efficiency programs. Ameren Missouri uses a MEEIA rider to collect from or refund to customers any annualdifference in the actual amounts incurred and the amounts collected from customers. See Note 2 – Rate and Regulatory Matters under Part II, Item 8, of thisreport for quantification of these assets or liabilities for each of the Ameren Companies. See Note 1 – Summary of Significant Accounting Policies under Part II,Item 8, of this report for a listing of regulatory mechanisms used by Ameren Missouri and Ameren Illinois.
63
Table of Contents
Benefit Plan AccountingBased on actuarial calculations, we accrue costs of providing futureemployee benefits for the benefit plans we offer our employees. See Note11 – Retirement Benefits under Part II, Item 8, of this report.
• Future rate of return on pension and other plan assets• Valuation inputs and assumptions used in the fair value measurements of
plan assets, excluding those inputs that are readily observable• Discount rate• Future compensation increase assumption• Health care cost trend rates• Timing of employee retirements and mortality assumptions• Ability to recover certain benefit plan costs from our customers• Changing market conditions that may affect investment and interest rate
environments
Basis for JudgmentAmeren has defined benefit pension and postretirement benefit plans covering substantially all of its union employees. Ameren has defined benefit pension planscovering substantially all of its non-union employees and postretirement benefit plans covering non-union employees hired before October 2015. Our ultimateselection of the discount rate, health care trend rate, and expected rate of return on pension and other postretirement benefit plan assets is based on our consistentapplication of assumption-setting methodologies and our review of available historical, current, and projected rates, as applicable. We also make mortalityassumptions to estimate our pension and other postretirement benefit obligations. See Note 11 – Retirement Benefits under Part II, Item 8, of this report for theseassumptions and the sensitivity of Ameren’s benefit plans to potential changes in these assumptions.
Accounting for ContingenciesWe make judgments and estimates in the recording and the disclosing ofliabilities for claims, litigation, environmental remediation, the actions ofvarious regulatory agencies, or other matters that occur in the normal courseof business. We record a loss contingency when it is probable that a liabilityhas been incurred and that the amount of the loss can be reasonablyestimated.
• Estimating financial impact of events• Estimating likelihood of various potential outcomes• Regulatory and political environments and requirements• Outcome of legal proceedings, settlements, or other factors• Changes in regulation, expected scope of work, technology or timing of
environmental remediation
Basis for JudgmentThe determination of a loss contingency requires significant judgment as to the expected outcome of the contingency in future periods. In making thedetermination as to the amount of potential loss and the probability of loss, we consider the nature of the litigation, the claim or assessment, opinions or views oflegal counsel, and the expected outcome of potential litigation, among other things. If no estimate is better than another within our range of estimates, we recordas our best estimate of a loss the minimum value of our estimated range of outcomes. As additional information becomes available, we reassess the potentialliability related to the contingency and revise our estimates. The amount recorded for any contingency may differ from actual costs incurred when thecontingency is resolved. Contingencies are normally resolved over long periods of time. In our evaluation of legal matters, management consults with legalcounsel and relies on analysis of relevant case law and legal precedents. See Note 2 – Rate and Regulatory Matters, Note 10 – Callaway Energy Center and Note15 – Commitments and Contingencies under Part II, Item 8, of this report for information on the Ameren Companies’ contingencies.
Accounting for Income TaxesWe record a provision for income taxes, deferred tax assets and liabilities,and a valuation allowance against net deferred tax assets, if any. See Note13 – Income Taxes under Part II, Item 8, of this report.
• Changes in business, industry, laws, technology, or economic and marketconditions affecting forecasted financial condition and/or results ofoperations
• Estimates of the amount and character of future taxable income• Enacted tax rates applicable to taxable income in years in which
temporary differences are recovered or settled• Effectiveness of implementing tax planning strategies• Changes in income tax laws, including amounts subject to income tax,
and the regulatory treatment of any tax reform changes• Results of audits and examinations by taxing authorities
64

Table of Contents
Basis for JudgmentThe reporting of tax-related assets and liabilities requires the use of estimates and significant management judgment. Deferred tax assets and liabilities arerecorded to represent future effects on income taxes for temporary differences between the basis of assets for financial reporting and tax purposes. Althoughmanagement believes that current estimates for deferred tax assets and liabilities are reasonable, actual results could differ from these estimates for a variety ofreasons, including a change in forecasted financial condition and/or results of operations, change in income tax laws, enacted tax rates or amounts subject toincome tax, the form, structure, and timing of asset or stock sales or dispositions, changes in the regulatory treatment of any tax reform benefits, and results ofaudits and examinations by taxing authorities. Valuation allowances against deferred tax assets are recorded when management concludes it is more likely thannot such asset will not be realized in future periods. Accounting for income taxes also requires that only tax benefits for positions taken or expected to be takenon tax returns that meet the more-likely-than-not recognition threshold can be recognized or continue to be recognized. Management evaluates each positionsolely on the technical merits and facts and circumstances of the position, assuming that the position will be examined by a taxing authority that has fullknowledge of all relevant information. Significant judgment is required to determine recognition thresholds and the related amount of tax benefits to berecognized. At each period end, and as new developments occur, management reevaluates its tax positions. See Note 13 – Income Taxes under Part II, Item 8, ofthis report for the amount of deferred tax assets and uncertain tax positions recorded at December 31, 2016 .
Unbilled RevenueAt the end of each period, Ameren, Ameren Missouri, and Ameren Illinoisestimate the usage that has been provided to customers but not yet billed.This usage amount, along with a per unit price, is used to estimate anunbilled balance.
• Estimating customer energy usage• Estimating impacts of weather and other usage-affecting factors for the
unbilled period• Estimating loss of energy during transmission and delivery
Basis for JudgmentWe base our estimate of unbilled revenue each period on the volume of energy delivered, as valued by a model of billing cycles and historical usage rates andgrowth or contraction by customer class for our service area. This figure is then adjusted for the modeled impact of seasonal and weather variations based onhistorical results. See the balance sheet for each of the Ameren Companies under Part II, Item 8, of this report for unbilled revenue amounts.
Impact of New Accounting Pronouncements
See Note 1 – Summary of Significant Accounting Policies under Part II, Item 8, of this report.
EFFECTS OF INFLATION AND CHANGING PRICES
Ameren’s rates for retail electric and natural gas utility service areregulated by the MoPSC and the ICC. Nonretail electric rates are regulated bythe FERC. Rate regulation is generally based on the recovery of historical orprojected costs. As a result, revenue increases could lag behind changingprices. Ameren Illinois participates in the performance-based formularatemaking process pursuant to the IEIMA for its electric distributionbusiness. Ameren Illinois is required to purchase all of its power throughprocurement processes administered by the IPA. The cost of procured powercan be affected by inflation. Within the IEIMA formula, the monthly averageyields of 30-year United States Treasury bonds are the basis for AmerenIllinois’ return on equity. Therefore, there is a direct correlation between theyield of United States Treasury bonds, which are affected by inflation, and theearnings of Ameren Illinois’ electric distribution business. Ameren Illinoisand ATXI use a company-specific, forward-looking rate formula frameworkin setting their transmission rates. These forward-looking rates are updatedeach January with forecasted information. A reconciliation during the year,which adjusts for the actual revenue requirement and actual sales volumes, isused to adjust billing rates in a subsequent year.
The current replacement cost of our utility plant substantially exceedsour recorded historical cost. Under existing regulatory practice, only thehistorical cost of plant is recoverable
from customers. As a result, customer rates designed to provide recovery ofhistorical costs through depreciation might not be adequate to replace plant infuture years.
Ameren Missouri recovers the cost of fuel for electric generation and thecost of purchased power by adjusting rates as allowed through the FAC. TheApril 2015 MoPSC electric rate order approved Ameren Missouri’s requestfor continued use of the FAC; however, it changed the FAC to exclude alltransmission revenues and substantially all transmission charges. AmerenMissouri is therefore exposed to transmission charges to the extent theyexceed transmission revenues. Ameren Illinois recovers power supply costsfrom electric customers by adjusting rates through a rider mechanism toaccommodate changes in power prices.
In our Missouri and Illinois retail natural gas utility jurisdictions, changesin natural gas costs are generally reflected in billings to natural gas customersthrough PGA clauses.
See Part I, Item 1, and Note 2 – Rate and Regulatory Matters underPart II, Item 8, of this report for additional information on our cost recoverymechanisms.
65
Table of Contents
ITEM7A.
QUANTITATIVE AND QUALITATIVE DISCLOSURESABOUT MARKET RISK
Market risk is the risk of changes in value of a physical asset or afinancial instrument, derivative or nonderivative, caused by fluctuations inmarket variables such as interest rates, commodity prices, and equity securityprices. A derivative is a contract whose value is dependent on, or derivedfrom, the value of some underlying asset or index. The following discussionof our risk management activities includes forward-looking statements thatinvolve risks and uncertainties. Actual results could differ materially fromthose projected in the forward-looking statements. We handle market risks inaccordance with established policies, which may include entering into variousderivative transactions. In the normal course of business, we also face risksthat are either nonfinancial or nonquantifiable. Such risks, principallybusiness, legal, and operational risks, are not part of the following discussion.
Our risk management objectives are to optimize our physical generatingassets and to pursue market opportunities within prudent risk parameters. Ourrisk management policies are set by a risk management steering committee,which is composed of senior-level Ameren officers, with Ameren board ofdirectors oversight.
Interest Rate Risk
We are exposed to market risk through changes in interest ratesassociated with:
• long-term and short-term variable-rate debt;• fixed-rate debt;• United States Treasury bonds; and• defined pension and postretirement benefit plans.
We manage our interest rate exposure by controlling the amount of debtinstruments within our total capitalization portfolio and by monitoring theeffects of market changes on interest rates. For defined pension andpostretirement benefit plans, we control the duration and the portfolio mix ofour plan assets.
The following table presents the estimated increase in our annual interestexpense and decrease in net income if interest rates were to increase by onehundred basis points on variable-rate debt outstanding at December 31, 2016 :
InterestExpense Net Income (a)
Ameren $ 8 $ (5)Ameren Missouri 2 (1)Ameren Illinois 1 (b)
(a) Calculations are based on an estimated tax rate of 37%, 38%, and 38% for Ameren,Ameren Missouri, and Ameren Illinois, respectively.
(b) Less than $1 million.
Ameren Illinois’ annual return on equity under the formula ratemakingprocess for its electric distribution business is directly correlated to theaverage monthly yields of 30-year United States Treasury bonds plus 580basis points for a calendar year. The yields on such bonds are outside ofAmeren Illinois’ control. A 50
basis point change in the average monthly yields of the 30-year United StatesTreasury bonds would result in an estimated $7 million change in Ameren'sand Ameren Illinois' net income, based on its 2017 projected rate base.
Credit Risk
Credit risk represents the loss that would be recognized if counterpartiesshould fail to perform as contracted. Exchange-traded contracts are supportedby the financial and credit quality of the clearing members of the respectiveexchanges and carry only a nominal credit risk. In all other transactions, weare exposed to credit risk in the event of nonperformance by thecounterparties to the transaction. See Note 7 – Derivative FinancialInstruments under Part II, Item 8, of this report for information on thepotential loss on counterparty exposure as of December 31, 2016 .
Our revenues are primarily derived from sales or delivery of electricityand natural gas to customers in Missouri and Illinois. Our physical andfinancial instruments are subject to credit risk consisting of trade accountsreceivables and executory contracts with market risk exposures. The riskassociated with trade receivables is mitigated by the large number ofcustomers in a broad range of industry groups who make up our customerbase. At December 31, 2016 , no nonaffiliated customer represented morethan 10% of our accounts receivable. Additionally, Ameren Illinois faces risksassociated with the purchase of receivables. The Illinois Public Utilities Actrequires Ameren Illinois to establish electric utility consolidated billing andpurchase of receivables services. At the option of an alternative retail electricsupplier, Ameren Illinois may be required to purchase the supplier'sreceivables relating to Ameren Illinois' distribution customers who elected toreceive power supply from the alternative retail electric supplier. When thatoption is selected, Ameren Illinois produces consolidated bills for theapplicable retail customers reflecting charges for electric distribution andpurchased receivables. As of December 31, 2016 , Ameren Illinois' balance ofpurchased accounts receivable associated with the utility consolidated billingand purchase of receivables services was $31 million . The risk associatedwith Ameren Illinois' electric and natural gas trade receivables is alsomitigated by a rate adjustment mechanism that allows Ameren Illinois torecover the difference between its actual net bad debt write-offs under GAAPand the amount of net bad debt write-offs included in its base rates. AmerenMissouri and Ameren Illinois continue to monitor the impact of increasingrates on customer collections. Ameren Missouri and Ameren Illinois makeadjustments to their respective allowance for doubtful accounts as deemednecessary to ensure that such allowances are adequate to cover estimateduncollectible customer account balances.
Equity Price Risk
Our costs for providing defined benefit retirement and postretirementbenefit plans are dependent upon a number of factors, including the rate ofreturn on plan assets. Ameren manages plan assets in accordance with the“prudent investor” guidelines contained in ERISA. Ameren’s goal is to ensurethat
66
Table of Contents
sufficient funds are available to provide benefits at the time they are payable,while also maximizing total return on plan assets and minimizing expensevolatility consistent with its tolerance for risk. Ameren delegates investmentmanagement to specialists. Where appropriate, Ameren provides theinvestment manager with guidelines that specify allowable and prohibitedinvestment types. Ameren regularly monitors manager performance andcompliance with investment guidelines.
The expected return on plan assets assumption is based on historical andprojected rates of return for current and planned asset classes in theinvestment portfolio. Projected rates of return for each asset class areestimated after an analysis of historical experience, future expectations, andthe volatility of the various asset classes. After considering the target assetallocation for each asset class, we adjust the overall expected rate of return forthe portfolio for historical and expected experience of active portfoliomanagement results compared with benchmark returns, and for the effect ofexpenses paid from plan assets. Contributions to the plans and future costscould increase materially if we do not achieve pension and postretirementasset portfolio investment returns equal to or in excess of our 2017 assumedreturn on plan assets of 7.00% .
Ameren Missouri also maintains a trust fund, as required by the NRC andMissouri law, to fund certain costs of nuclear plant decommissioning. As ofDecember 31, 2016 , this fund was invested in domestic equity securities(67%) and debt securities (32%) . By maintaining a portfolio that includeslong-term equity investments, Ameren Missouri seeks to maximize the returnsto be used to fund nuclear decommissioning costs within acceptableparameters of risk. However, the equity securities included in the portfolio areexposed to price fluctuations in equity markets. The debt securities areexposed to changes in interest rates. Ameren Missouri actively monitors theportfolio by benchmarking the performance of its investments against certainindices and by maintaining and periodically reviewing established targetallocation percentages of the trust assets to various investment options.Ameren Missouri’s exposure to equity price market risk is in large partmitigated because Ameren Missouri is currently allowed to recover itsdecommissioning costs, which would include unfavorable investment results,through electric rates.
Additionally, Ameren has company-owned life insurance contracts.These life insurance contracts include equity and debt investments that areexposed to price fluctuations in equity markets and to changes in interestrates.
Commodity Price Risk
With regard to Ameren Missouri’s and Ameren Illinois’ electric andnatural gas distribution businesses, exposure to changing market prices is inlarge part mitigated by the fact that there are cost recovery mechanisms inplace. These cost recovery mechanisms allow Ameren Missouri and AmerenIllinois to pass on to retail customers prudently incurred costs for fuel,purchased power, and natural gas supply.
Ameren Missouri’s and Ameren Illinois’ strategy is designed to reducethe effect of market fluctuations for their customers.
The effects of price volatility cannot be eliminated. However, procurementand sales strategies involve risk management techniques and instruments, aswell as the management of physical assets.
Ameren Missouri has a FAC, a fuel and purchased power cost recoverymechanism that allows it to recover or refund through customer rates 95% ofchanges in net energy costs greater or less than the amount set in base rateswithout a traditional rate proceeding, subject to MoPSC prudence reviews.Ameren Missouri remains exposed to the remaining 5% of such changes.
Ameren Illinois has a cost recovery mechanism for power purchased onbehalf of its customers. Ameren Illinois is required to serve as the provider oflast resort for electric customers in its service territory who have not chosenan alternative retail electric supplier. Ameren Illinois does not generateearnings based on the resale of power but rather on the delivery of energy.Ameren Illinois purchases power primarily through MISO, with additionalprocurement events administered by the IPA. The IPA has proposed and theICC has approved multiple procurement events covering portions of yearsthrough 2019. In 2016, acting in its role as provider of last resort, AmerenIllinois supplied power for 23% of its kilowatthour sales to its electriccustomers. Ameren Illinois expects full recovery of its purchased power costs.
Ameren Missouri and Ameren Illinois have PGA clauses that permitcosts incurred for natural gas to be recovered directly from utility customerswithout a traditional rate proceeding, subject to prudence review.
With regard to our exposure for commodity price risk for constructionand maintenance activities, Ameren is exposed to changes in market prices formetal commodities and to labor availability.
See Transmission and Supply of Electric Power under Part I, Item 1, ofthis report for the percentages of our historical needs satisfied by coal,nuclear, natural gas, oil, and renewables. Also see Note 15 – Commitmentsand Contingencies under Part II, Item 8, of this report for additionalinformation.
Commodity Supplier Risk
The use of ultra-low-sulfur coal is part of Ameren Missouri'senvironmental compliance strategy. Ameren Missouri has agreements topurchase ultra-low-sulfur coal through 2020 to comply with environmentalregulations. The coal contracts are with a single supplier through 2017, andwith multiple suppliers beyond 2017. Disruptions to the deliveries of ultra-low-sulfur coal from a supplier could compromise Ameren Missouri's abilityto operate in compliance with emission standards. The suppliers of ultra-low-sulfur coal are limited, and the construction of pollution control equipmentrequires significant lead time. If Ameren Missouri were to experience atemporary disruption of ultra-low-sulfur coal deliveries that caused it toexhaust its existing inventory, and if other sources of ultra-low-sulfur coalwere not available, Ameren Missouri would use its existing emissionallowances, purchase emission allowances to achieve
67

Table of Contents
compliance with environmental regulations, or purchase power necessary tomeet demand.
The Callaway energy center uses nuclear fuel assemblies of a designfabricated by only a single supplier. That supplier is currently the only NRC-licensed supplier able to provide fuel assemblies to the Callaway energycenter. If Ameren Missouri
should decide to change fuel suppliers or to change the type of fuel assemblydesign that is currently licensed for use at the Callaway energy center, up tothree years of analysis and licensing effort would be required to fullyimplement such a change.
Fair Value of Contracts
We use derivatives principally to manage the risk of changes in market prices for natural gas, power, and uranium, as well as the risk of changes in railtransportation surcharges through fuel oil hedges. The following table presents the favorable (unfavorable) changes in the fair value of all derivative contractsmarked-to-market during the year ended December 31, 2016 . We use various methods to determine the fair value of our contracts. In accordance with authoritativeaccounting guidance for fair value hierarchy levels, the sources we used to determine the fair value of these contracts were active quotes (Level 1), inputscorroborated by market data (Level 2), and other modeling and valuation methods that are not corroborated by market data (Level 3). See Note 8 – Fair ValueMeasurements under Part II, Item 8, of this report for additional information regarding the methods used to determine the fair value of these contracts.
AmerenMissouri
AmerenIllinois Ameren
Fair value of contracts at beginning of year, net $ (27) $ (219) $ (246)Contracts realized or otherwise settled during the period 13 44 57Fair value of new contracts entered into during the period 9 4 13Other changes in fair value 1 (9) (8)Fair value of contracts outstanding at end of year, net $ (4) $ (180) $ (184)
The following table presents maturities of derivative contracts as of December 31, 2016 , based on the hierarchy levels used to determine the fair value of thecontracts:
Sources of Fair Value
MaturityLess Than
1 Year Maturity
1 – 3 Years Maturity
3 – 5 Years
Maturity inExcess of5 Years
TotalFair Value
Ameren Missouri: Level 1 $ (4) $ 1 $ — $ — $ (3)
Level 2 (a) (1) (5) — — (6)
Level 3 (b) 8 (3) — — 5Total $ 3 $ (7) $ — $ — $ (4)Ameren Illinois: Level 1 $ 2 $ — $ — $ — $ 2
Level 2 (a) 7 (3) — — 4
Level 3 (b) (13) (26) (28) (119) (186)Total $ (4) $ (29) $ (28) $ (119) $ (180)Ameren: Level 1 $ (2) $ 1 $ — $ — $ (1)
Level 2 (a) 6 (8) — — (2)
Level 3 (b) (5) (29) (28) (119) (181)Total $ (1) $ (36) $ (28) $ (119) $ (184)
(a) Principally fixed-price vs. floating over-the-counter power swaps, power forwards, and fixed-price vs. floating over-the-counter natural gas swaps.(b) Principally power forward contract values based on information from external sources, historical results, and our estimates. Level 3 also includes option contract values based on an option
valuation model.
68
Table of Contents
ITEM 8.FINANCIAL STATEMENTS AND SUPPLEMENTARY DATAReport of Independent Registered Public Accounting Firm
To the Board of Directors and Shareholdersof Ameren Corporation:
In our opinion, the consolidated financial statements listed in the index appearing under Item 15(a)(1) present fairly, in all material respects, the financial positionof Ameren Corporation and its subsidiaries (the "Company") at December 31, 2016 and 2015, and the results of their operations and their cash flows for each of thethree years in the period ended December 31, 2016, in conformity with accounting principles generally accepted in the United States of America. In addition, in ouropinion, the financial statement schedules listed in the index appearing under Item 15(a)(2) present fairly, in all material respects, the information set forth thereinwhen read in conjunction with the related consolidated financial statements. Also, in our opinion, the Company maintained, in all material respects, effectiveinternal control over financial reporting as of December 31, 2016, based on criteria established in Internal Control – Integrated Framework (2013) issued by theCommittee of Sponsoring Organizations of the Treadway Commission (COSO). The Company’s management is responsible for these financial statements andfinancial statement schedules, for maintaining effective internal control over financial reporting and for its assessment of the effectiveness of internal control overfinancial reporting, included in Management’s Report on Internal Control over Financial Reporting appearing under Item 9A. Our responsibility is to expressopinions on these financial statements, on the financial statement schedules, and on the Company’s internal control over financial reporting based on our integratedaudits. We conducted our audits in accordance with the standards of the Public Company Accounting Oversight Board (United States). Those standards require thatwe plan and perform the audits to obtain reasonable assurance about whether the financial statements are free of material misstatement and whether effectiveinternal control over financial reporting was maintained in all material respects. Our audits of the financial statements included examining, on a test basis, evidencesupporting the amounts and disclosures in the financial statements, assessing the accounting principles used and significant estimates made by management, andevaluating the overall financial statement presentation. Our audit of internal control over financial reporting included obtaining an understanding of internal controlover financial reporting, assessing the risk that a material weakness exists, and testing and evaluating the design and operating effectiveness of internal controlbased on the assessed risk. Our audits also included performing such other procedures as we considered necessary in the circumstances. We believe that our auditsprovide a reasonable basis for our opinions.
A company’s internal control over financial reporting is a process designed to provide reasonable assurance regarding the reliability of financial reporting and thepreparation of financial statements for external purposes in accordance with generally accepted accounting principles. A company’s internal control over financialreporting includes those policies and procedures that (i) pertain to the maintenance of records that, in reasonable detail, accurately and fairly reflect the transactionsand dispositions of the assets of the company; (ii) provide reasonable assurance that transactions are recorded as necessary to permit preparation of financialstatements in accordance with generally accepted accounting principles, and that receipts and expenditures of the company are being made only in accordance withauthorizations of management and directors of the company; and (iii) provide reasonable assurance regarding prevention or timely detection of unauthorizedacquisition, use, or disposition of the company’s assets that could have a material effect on the financial statements.
Because of its inherent limitations, internal control over financial reporting may not prevent or detect misstatements. Also, projections of any evaluation ofeffectiveness to future periods are subject to the risk that controls may become inadequate because of changes in conditions, or that the degree of compliance withthe policies or procedures may deteriorate.
/s/PricewaterhouseCoopers LLP
PricewaterhouseCoopers LLPSt. Louis, MissouriFebruary 28, 2017
Report of Independent Registered Public Accounting Firm
To the Board of Directors and Shareholdersof Union Electric Company:
In our opinion, the financial statements listed in the index appearing under Item 15(a)(1) present fairly, in all material respects, the financial position of UnionElectric Company (the "Company") at December 31, 2016 and 2015, and the results of its operations and its cash flows for each of the three years in the periodended December 31, 2016, in conformity with accounting principles generally accepted in the United States of America. In addition, in our opinion, the financialstatement schedule listed in the index appearing under Item 15(a)(2) presents fairly, in all material respects, the information set forth therein when read inconjunction with the related financial statements. These financial statements and financial statement schedule are the responsibility of the Company’s management.Our responsibility is to express an opinion on these financial statements and financial statement schedule based on our audits. We conducted our audits of thesestatements in accordance with the standards of the Public Company Accounting Oversight Board (United States). Those standards require that we plan
69
Table of Contents
and perform the audit to obtain reasonable assurance about whether the financial statements are free of material misstatement. An audit includes examining, on atest basis, evidence supporting the amounts and disclosures in the financial statements, assessing the accounting principles used and significant estimates made bymanagement, and evaluating the overall financial statement presentation. We believe that our audits provide a reasonable basis for our opinion.
/s/PricewaterhouseCoopers LLP
PricewaterhouseCoopers LLPSt. Louis, MissouriFebruary 28, 2017
Report of Independent Registered Public Accounting Firm
To the Board of Directors and Shareholdersof Ameren Illinois Company:
In our opinion, the financial statements listed in the index appearing under Item 15(a)(1) present fairly, in all material respects, the financial position of AmerenIllinois Company (the "Company") at December 31, 2016 and 2015, and the results of its operations and its cash flows for each of the three years in the periodended December 31, 2016, in conformity with accounting principles generally accepted in the United States of America. In addition, in our opinion, the financialstatement schedule listed in the index appearing under Item 15(a)(2) presents fairly, in all material respects, the information set forth therein when read inconjunction with the related financial statements. These financial statements and financial statement schedule are the responsibility of the Company’s management.Our responsibility is to express an opinion on these financial statements and financial statement schedule based on our audits. We conducted our audits of thesestatements in accordance with the standards of the Public Company Accounting Oversight Board (United States). Those standards require that we plan and performthe audit to obtain reasonable assurance about whether the financial statements are free of material misstatement. An audit includes examining, on a test basis,evidence supporting the amounts and disclosures in the financial statements, assessing the accounting principles used and significant estimates made bymanagement, and evaluating the overall financial statement presentation. We believe that our audits provide a reasonable basis for our opinion.
/s/PricewaterhouseCoopers LLP
PricewaterhouseCoopers LLPSt. Louis, MissouriFebruary 28, 2017
70
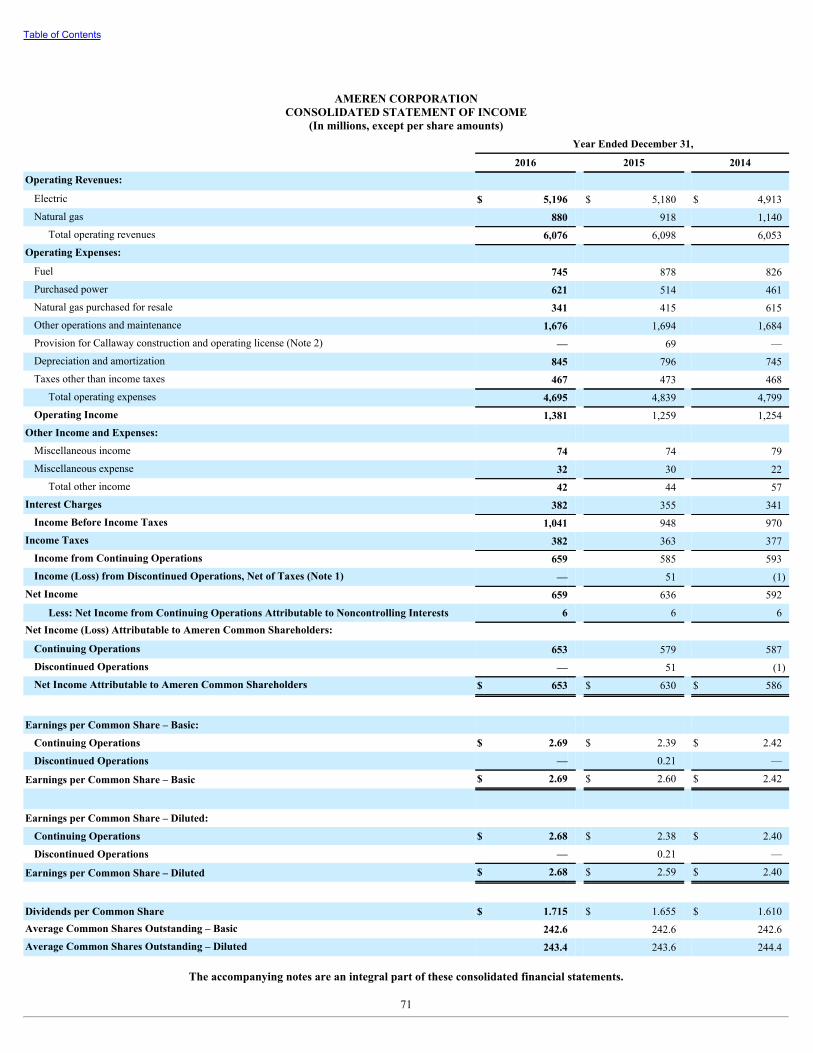
Table of Contents
AMEREN CORPORATIONCONSOLIDATED STATEMENT OF INCOME
(In millions, except per share amounts) Year Ended December 31,
2016 2015 2014Operating Revenues: Electric $ 5,196 $ 5,180 $ 4,913Natural gas 880 918 1,140
Total operating revenues 6,076 6,098 6,053Operating Expenses: Fuel 745 878 826Purchased power 621 514 461Natural gas purchased for resale 341 415 615Other operations and maintenance 1,676 1,694 1,684Provision for Callaway construction and operating license (Note 2) — 69 —Depreciation and amortization 845 796 745Taxes other than income taxes 467 473 468
Total operating expenses 4,695 4,839 4,799Operating Income 1,381 1,259 1,254
Other Income and Expenses: Miscellaneous income 74 74 79Miscellaneous expense 32 30 22
Total other income 42 44 57Interest Charges 382 355 341
Income Before Income Taxes 1,041 948 970Income Taxes 382 363 377
Income from Continuing Operations 659 585 593Income (Loss) from Discontinued Operations, Net of Taxes (Note 1) — 51 (1)
Net Income 659 636 592
Less: Net Income from Continuing Operations Attributable to Noncontrolling Interests 6 6 6Net Income (Loss) Attributable to Ameren Common Shareholders:
Continuing Operations 653 579 587Discontinued Operations — 51 (1)Net Income Attributable to Ameren Common Shareholders $ 653 $ 630 $ 586
Earnings per Common Share – Basic:
Continuing Operations $ 2.69 $ 2.39 $ 2.42
Discontinued Operations — 0.21 —
Earnings per Common Share – Basic $ 2.69 $ 2.60 $ 2.42
Earnings per Common Share – Diluted:
Continuing Operations $ 2.68 $ 2.38 $ 2.40
Discontinued Operations — 0.21 —
Earnings per Common Share – Diluted $ 2.68 $ 2.59 $ 2.40
Dividends per Common Share $ 1.715 $ 1.655 $ 1.610Average Common Shares Outstanding – Basic 242.6 242.6 242.6Average Common Shares Outstanding – Diluted 243.4 243.6 244.4
The accompanying notes are an integral part of these consolidated financial statements.
71

Table of Contents
AMEREN CORPORATIONCONSOLIDATED STATEMENT OF COMPREHENSIVE INCOME
(In millions) Year Ended December 31, 2016 2015 2014
Income from Continuing Operations $ 659 $ 585 $ 593Other Comprehensive Income from Continuing Operations, Net of Taxes Pension and other postretirement benefit plan activity, net of income taxes (benefit) of$(7), $3, and $(7), respectively (20) 6 (12)
Comprehensive Income from Continuing Operations 639 591 581Less: Comprehensive Income from Continuing Operations Attributable to
Noncontrolling Interests 6 6 6Comprehensive Income from Continuing Operations Attributable to Ameren CommonShareholders 633 585 575
Comprehensive Income (Loss) from Discontinued Operations Attributable to AmerenCommon Shareholders — 51 (1)
Comprehensive Income Attributable to Ameren Common Shareholders $ 633 $ 636 $ 574
The accompanying notes are an integral part of these consolidated financial statements.
72

Table of Contents
AMEREN CORPORATIONCONSOLIDATED BALANCE SHEET(In millions, except per share amounts)
December 31, 2016 2015
ASSETS Current Assets: Cash and cash equivalents $ 9 $ 292Accounts receivable – trade (less allowance for doubtful accounts of $19 and $19, respectively) 437 388Unbilled revenue 295 239Miscellaneous accounts and notes receivable 63 98Inventories 527 538Current regulatory assets 149 260Other current assets 98 88Assets of discontinued operations (Note 1) 15 14
Total current assets 1,593 1,917Property, Plant, and Equipment, Net 20,113 18,799Investments and Other Assets: Nuclear decommissioning trust fund 607 556Goodwill 411 411Regulatory assets 1,437 1,382Other assets 538 575
Total investments and other assets 2,993 2,924TOTAL ASSETS $ 24,699 $ 23,640
LIABILITIES AND EQUITY Current Liabilities: Current maturities of long-term debt $ 681 $ 395Short-term debt 558 301Accounts and wages payable 805 777Taxes accrued 46 43Interest accrued 93 89Customer deposits 107 100Current regulatory liabilities 110 80Other current liabilities 248 279Liabilities of discontinued operations (Note 1) 26 29
Total current liabilities 2,674 2,093Long-term Debt, Net 6,595 6,880Deferred Credits and Other Liabilities: Accumulated deferred income taxes, net 4,264 3,885Accumulated deferred investment tax credits 55 60Regulatory liabilities 1,985 1,905Asset retirement obligations 635 618Pension and other postretirement benefits 769 580Other deferred credits and liabilities 477 531
Total deferred credits and other liabilities 8,185 7,579Commitments and Contingencies (Notes 2, 10, and 15) Ameren Corporation Shareholders’ Equity: Common stock, $.01 par value, 400.0 shares authorized – shares outstanding of 242.6 2 2Other paid-in capital, principally premium on common stock 5,556 5,616Retained earnings 1,568 1,331Accumulated other comprehensive loss (23) (3)
Total Ameren Corporation shareholders’ equity 7,103 6,946Noncontrolling Interests 142 142

Total equity 7,245 7,088TOTAL LIABILITIES AND EQUITY $ 24,699 $ 23,640
The accompanying notes are an integral part of these consolidated financial statements.
73

Table of Contents
AMEREN CORPORATIONCONSOLIDATED STATEMENT OF CASH FLOWS
(In millions) Year Ended December 31,
2016 2015 2014
Cash Flows From Operating Activities: Net income $ 659 $ 636 $ 592Loss (Income) from discontinued operations, net of tax — (51) 1Adjustments to reconcile net income (loss) to net cash provided by operating activities:
Provision for Callaway construction and operating license — 69 —Depreciation and amortization 835 777 710Amortization of nuclear fuel 88 97 81Amortization of debt issuance costs and premium/discounts 22 22 22Deferred income taxes and investment tax credits, net 386 369 451Allowance for equity funds used during construction (27) (30) (34)Share-based compensation costs 17 24 25Other 4 (10) (24)Changes in assets and liabilities:
Receivables (71) 83 31Inventories 11 (14) 3Accounts and wages payable 19 (2) 10Taxes accrued 13 (22) (44)Regulatory assets and liabilities 215 94 (281)Assets, other (24) 53 30Liabilities, other (10) (44) (14)Pension and other postretirement benefits (16) (9) (10)Counterparty collateral, net 3 (7) 22
Net cash provided by operating activities – continuing operations 2,124 2,035 1,571Net cash used in operating activities – discontinued operations (1) (4) (6)Net cash provided by operating activities 2,123 2,031 1,565
Cash Flows From Investing Activities: Capital expenditures (2,076) (1,917) (1,785)Nuclear fuel expenditures (55) (52) (74)Purchases of securities – nuclear decommissioning trust fund (392) (363) (405)Sales and maturities of securities – nuclear decommissioning trust fund 377 349 391Proceeds from note receivable – Marketing Company — 20 95Contributions to note receivable – Marketing Company — (8) (89)Other 5 20 11
Net cash used in investing activities – continuing operations (2,141) (1,951) (1,856)Net cash provided by (used in) investing activities – discontinued operations — (25) 139Net cash used in investing activities (2,141) (1,976) (1,717)
Cash Flows From Financing Activities: Dividends on common stock (416) (402) (390)Dividends paid to noncontrolling interest holders (6) (6) (6)Short-term debt, net 257 (413) 346Redemptions, repurchases, and maturities of long-term debt (395) (120) (697)Issuances of long-term debt 389 1,197 898Capital issuance costs (9) (12) (11)Share-based payments (83) (12) (14)Other (2) — 1
Net cash provided by (used in) financing activities – continuing operations (265) 232 127Net change in cash and cash equivalents (283) 287 (25)Cash and cash equivalents at beginning of year 292 5 30Cash and cash equivalents at end of year $ 9 $ 292 $ 5

Cash Paid (Refunded) During the Year: Interest (net of $15, $17, and $18 capitalized, respectively) $ 358 $ 335 $ 333Income taxes, net (12) (15) (27)
The accompanying notes are an integral part of these consolidated financial statements.
74
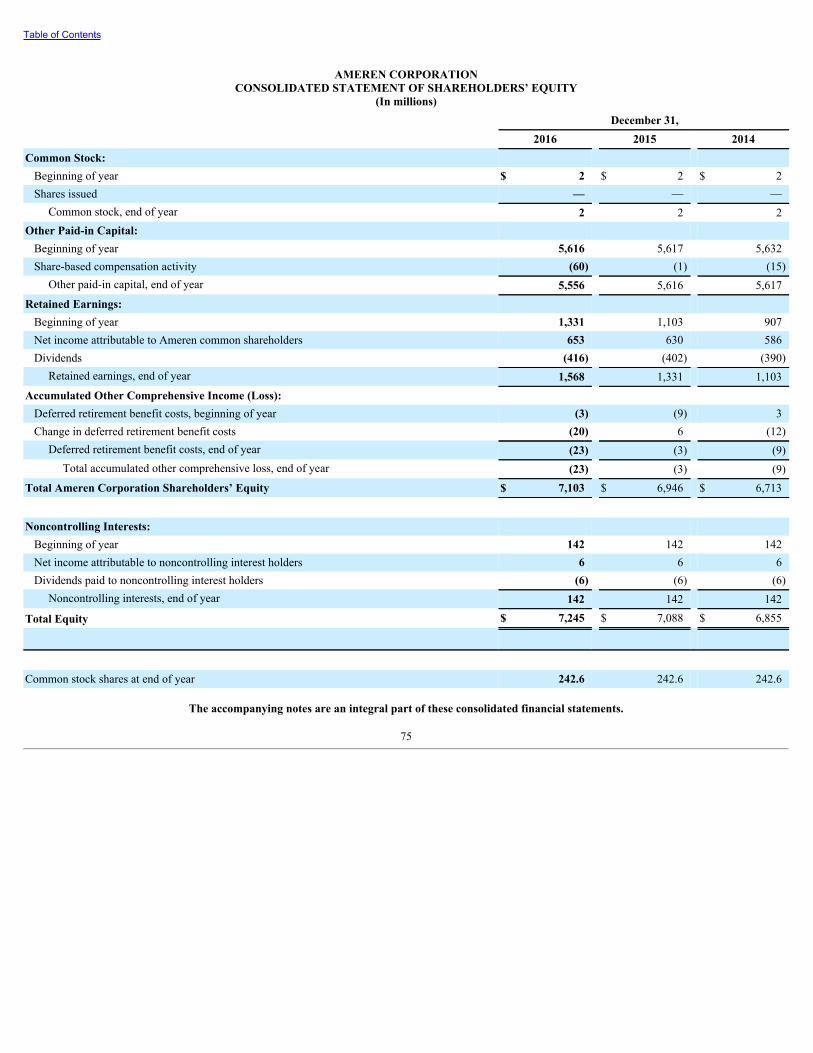
Table of Contents
AMEREN CORPORATIONCONSOLIDATED STATEMENT OF SHAREHOLDERS’ EQUITY
(In millions)
December 31,
2016 2015 2014Common Stock: Beginning of year $ 2 $ 2 $ 2Shares issued — — —
Common stock, end of year 2 2 2Other Paid-in Capital: Beginning of year 5,616 5,617 5,632Share-based compensation activity (60) (1) (15)
Other paid-in capital, end of year 5,556 5,616 5,617Retained Earnings: Beginning of year 1,331 1,103 907Net income attributable to Ameren common shareholders 653 630 586Dividends (416) (402) (390)
Retained earnings, end of year 1,568 1,331 1,103Accumulated Other Comprehensive Income (Loss): Deferred retirement benefit costs, beginning of year (3) (9) 3Change in deferred retirement benefit costs (20) 6 (12)
Deferred retirement benefit costs, end of year (23) (3) (9)Total accumulated other comprehensive loss, end of year (23) (3) (9)
Total Ameren Corporation Shareholders’ Equity $ 7,103 $ 6,946 $ 6,713
Noncontrolling Interests: Beginning of year 142 142 142Net income attributable to noncontrolling interest holders 6 6 6Dividends paid to noncontrolling interest holders (6) (6) (6)
Noncontrolling interests, end of year 142 142 142
Total Equity $ 7,245 $ 7,088 $ 6,855
Common stock shares at end of year 242.6 242.6 242.6
The accompanying notes are an integral part of these consolidated financial statements.
75

Table of Contents
UNION ELECTRIC COMPANY (d/b/a AMEREN MISSOURI)STATEMENT OF INCOME AND COMPREHENSIVE INCOME
(In millions)
Year Ended December 31,
2016 2015 2014Operating Revenues: Electric $ 3,394 $ 3,470 $ 3,388Natural gas 128 137 164Other 1 2 1
Total operating revenues 3,523 3,609 3,553Operating Expenses: Fuel 745 878 826Purchased power 252 111 126Natural gas purchased for resale 49 57 82Other operations and maintenance 893 925 939Provision for Callaway construction and operating license (Note 2) — 69 —Depreciation and amortization 514 492 473Taxes other than income taxes 325 335 322
Total operating expenses 2,778 2,867 2,768Operating Income 745 742 785
Other Income and Expenses: Miscellaneous income 52 52 60Miscellaneous expense 10 11 12
Total other income 42 41 48Interest Charges 211 219 211
Income Before Income Taxes 576 564 622Income Taxes 216 209 229
Net Income 360 355 393Other Comprehensive Income — — —
Comprehensive Income $ 360 $ 355 $ 393
Net Income $ 360 $ 355 $ 393Preferred Stock Dividends 3 3 3
Net Income Available to Common Shareholder $ 357 $ 352 $ 390
The accompanying notes as they relate to Ameren Missouri are an integral part of these financial statements.
76
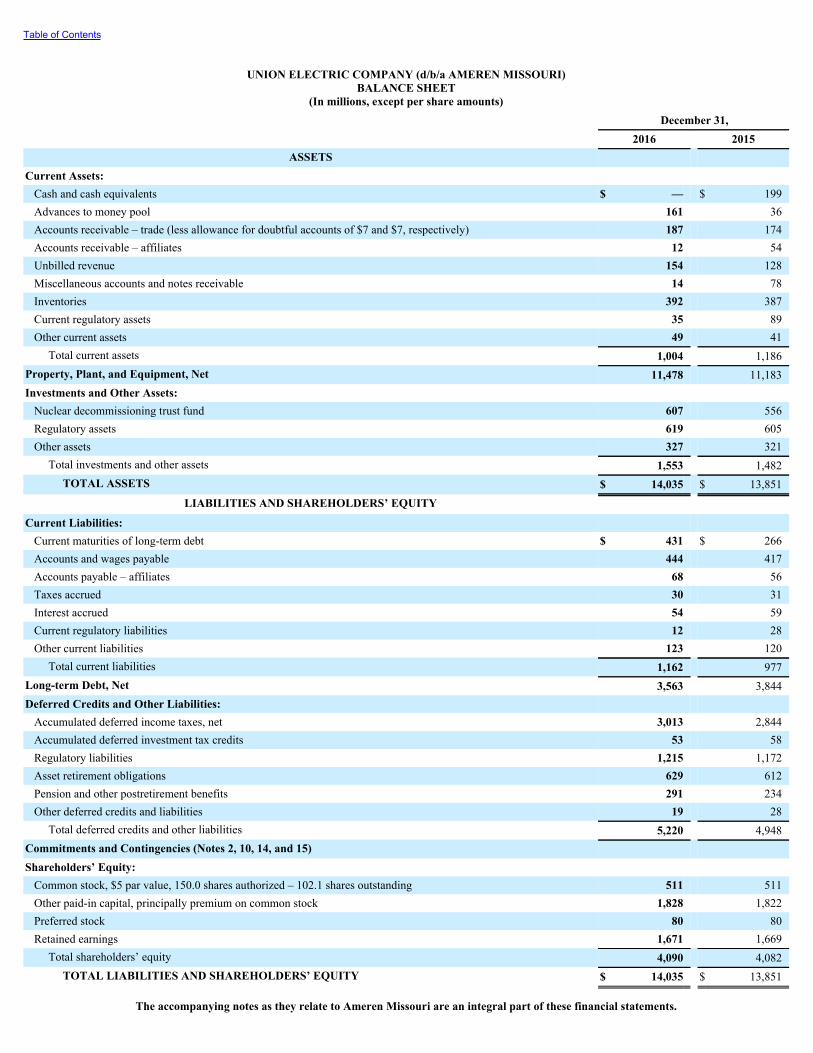
Table of Contents
UNION ELECTRIC COMPANY (d/b/a AMEREN MISSOURI)BALANCE SHEET
(In millions, except per share amounts)
December 31,
2016 2015ASSETS
Current Assets: Cash and cash equivalents $ — $ 199Advances to money pool 161 36Accounts receivable – trade (less allowance for doubtful accounts of $7 and $7, respectively) 187 174Accounts receivable – affiliates 12 54Unbilled revenue 154 128Miscellaneous accounts and notes receivable 14 78Inventories 392 387Current regulatory assets 35 89Other current assets 49 41
Total current assets 1,004 1,186Property, Plant, and Equipment, Net 11,478 11,183Investments and Other Assets: Nuclear decommissioning trust fund 607 556Regulatory assets 619 605Other assets 327 321
Total investments and other assets 1,553 1,482TOTAL ASSETS $ 14,035 $ 13,851
LIABILITIES AND SHAREHOLDERS’ EQUITY Current Liabilities: Current maturities of long-term debt $ 431 $ 266Accounts and wages payable 444 417Accounts payable – affiliates 68 56Taxes accrued 30 31Interest accrued 54 59Current regulatory liabilities 12 28Other current liabilities 123 120
Total current liabilities 1,162 977Long-term Debt, Net 3,563 3,844Deferred Credits and Other Liabilities: Accumulated deferred income taxes, net 3,013 2,844Accumulated deferred investment tax credits 53 58Regulatory liabilities 1,215 1,172Asset retirement obligations 629 612Pension and other postretirement benefits 291 234Other deferred credits and liabilities 19 28
Total deferred credits and other liabilities 5,220 4,948Commitments and Contingencies (Notes 2, 10, 14, and 15) Shareholders’ Equity: Common stock, $5 par value, 150.0 shares authorized – 102.1 shares outstanding 511 511Other paid-in capital, principally premium on common stock 1,828 1,822Preferred stock 80 80Retained earnings 1,671 1,669
Total shareholders’ equity 4,090 4,082TOTAL LIABILITIES AND SHAREHOLDERS’ EQUITY $ 14,035 $ 13,851
The accompanying notes as they relate to Ameren Missouri are an integral part of these financial statements.

77

Table of Contents
UNION ELECTRIC COMPANY (d/b/a AMEREN MISSOURI)STATEMENT OF CASH FLOWS
(In millions)
Year Ended December 31,
2016 2015 2014Cash Flows From Operating Activities: Net income $ 360 $ 355 $ 393Adjustments to reconcile net income to net cash provided by operating activities:
Provision for Callaway construction and operating license — 69 —Depreciation and amortization 506 476 442Amortization of nuclear fuel 88 97 81Amortization of debt issuance costs and premium/discounts 6 6 7Deferred income taxes and investment tax credits, net 179 82 245Allowance for equity funds used during construction (23) (22) (32)Other 5 2 3Changes in assets and liabilities:
Receivables 5 72 (10)Inventories (4) (39) 8Accounts and wages payable (18) 3 25Taxes accrued 11 1 (197)Regulatory assets and liabilities 84 117 (68)Assets, other (25) 26 52Liabilities, other (1) 4 —Pension and other postretirement benefits (4) (2) 1
Net cash provided by operating activities 1,169 1,247 950Cash Flows From Investing Activities: Capital expenditures (738) (622) (747)Nuclear fuel expenditures (55) (52) (74)Purchases of securities – nuclear decommissioning trust fund (392) (363) (405)Sales and maturities of securities – nuclear decommissioning trust fund 377 349 391Money pool advances, net (125) (36) —Other (1) — (2)
Net cash used in investing activities (934) (724) (837)Cash Flows From Financing Activities: Dividends on common stock (355) (575) (340)Return of capital to parent — — (215)Dividends on preferred stock (3) (3) (3)Short-term debt, net — (97) 97Money pool borrowings, net — — (105)Redemptions, repurchases, and maturities of long-term debt (266) (120) (109)Issuances of long-term debt 149 249 350Capital issuance costs (3) (3) (3)Capital contribution from parent 44 224 215
Net cash used in financing activities (434) (325) (113)Net change in cash and cash equivalents (199) 198 —Cash and cash equivalents at beginning of year 199 1 1
Cash and cash equivalents at end of year $ — $ 199 $ 1
Noncash financing activity – capital contribution from parent $ — $ 38 $ 9 Cash Paid During the Year: Interest (net of $12, $12, and $16 capitalized, respectively) $ 209 $ 212 $ 203Income taxes, net 27 72 215

The accompanying notes as they relate to Ameren Missouri are an integral part of these financial statements.
78
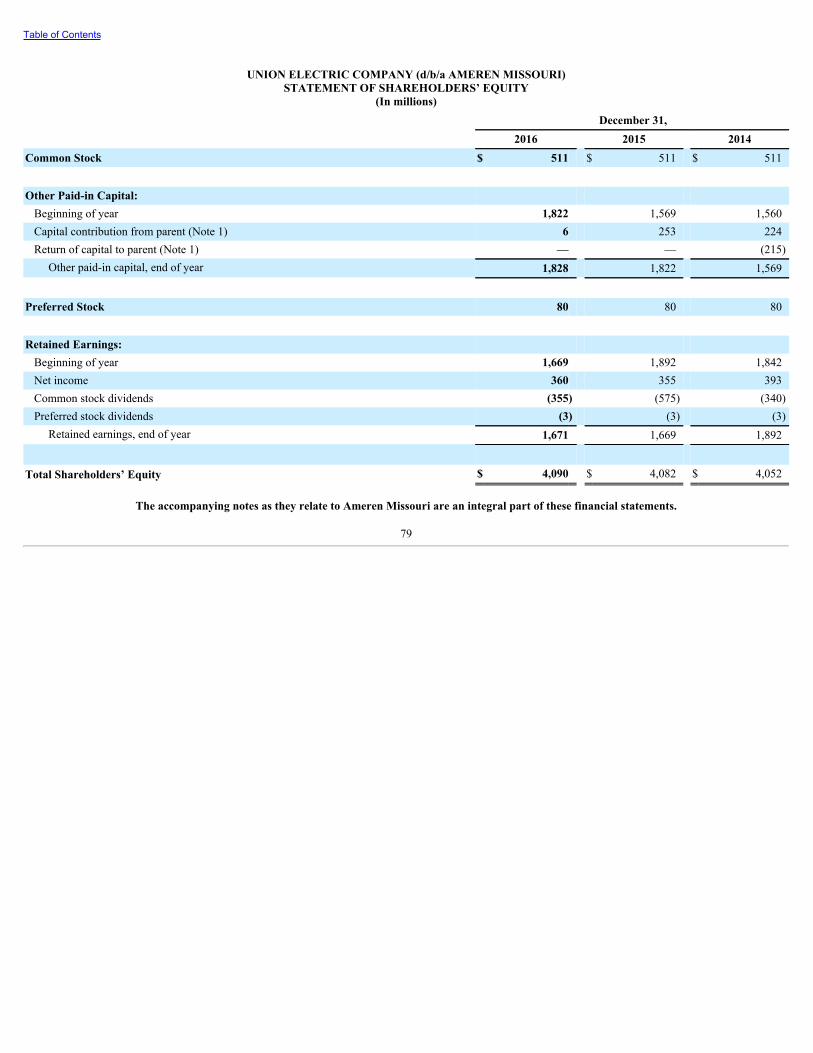
Table of Contents
UNION ELECTRIC COMPANY (d/b/a AMEREN MISSOURI)STATEMENT OF SHAREHOLDERS’ EQUITY
(In millions)
December 31,
2016 2015 2014Common Stock $ 511 $ 511 $ 511
Other Paid-in Capital: Beginning of year 1,822 1,569 1,560Capital contribution from parent (Note 1) 6 253 224Return of capital to parent (Note 1) — — (215)
Other paid-in capital, end of year 1,828 1,822 1,569
Preferred Stock 80 80 80
Retained Earnings: Beginning of year 1,669 1,892 1,842Net income 360 355 393Common stock dividends (355) (575) (340)Preferred stock dividends (3) (3) (3)
Retained earnings, end of year 1,671 1,669 1,892
Total Shareholders’ Equity $ 4,090 $ 4,082 $ 4,052
The accompanying notes as they relate to Ameren Missouri are an integral part of these financial statements.
79
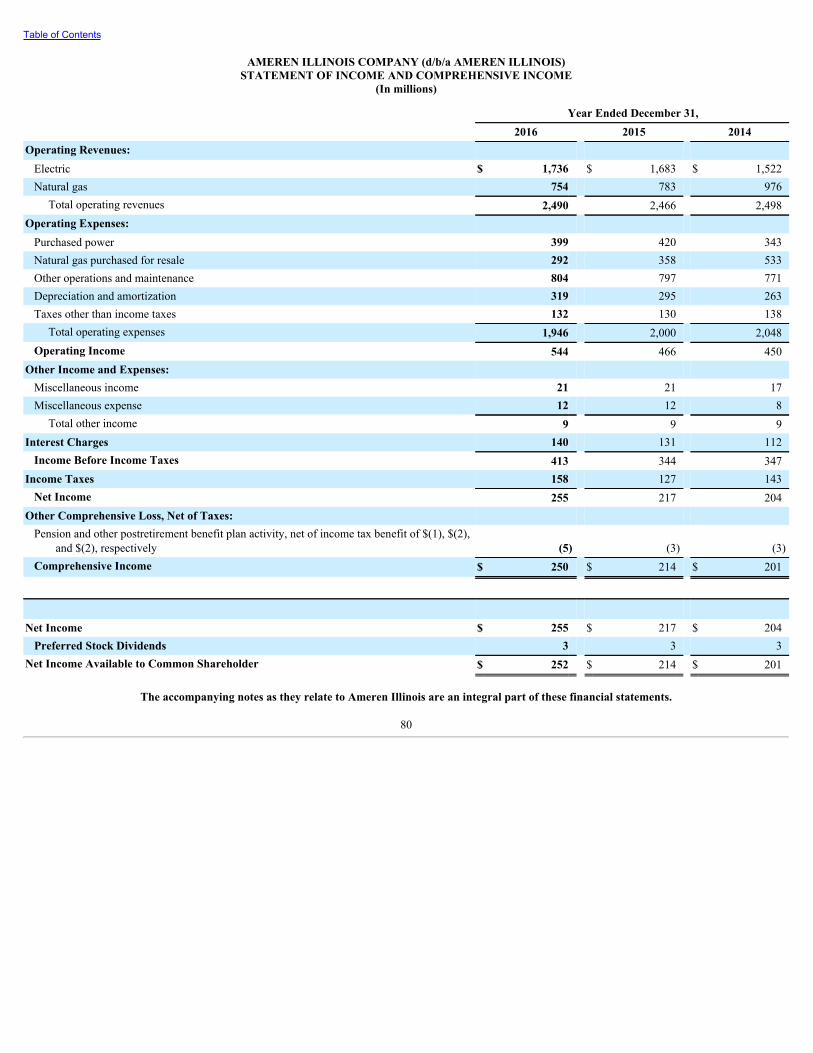
Table of Contents
AMEREN ILLINOIS COMPANY (d/b/a AMEREN ILLINOIS)STATEMENT OF INCOME AND COMPREHENSIVE INCOME
(In millions)
Year Ended December 31,
2016 2015 2014Operating Revenues: Electric $ 1,736 $ 1,683 $ 1,522Natural gas 754 783 976
Total operating revenues 2,490 2,466 2,498Operating Expenses: Purchased power 399 420 343Natural gas purchased for resale 292 358 533Other operations and maintenance 804 797 771Depreciation and amortization 319 295 263Taxes other than income taxes 132 130 138
Total operating expenses 1,946 2,000 2,048Operating Income 544 466 450
Other Income and Expenses: Miscellaneous income 21 21 17Miscellaneous expense 12 12 8
Total other income 9 9 9Interest Charges 140 131 112
Income Before Income Taxes 413 344 347Income Taxes 158 127 143
Net Income 255 217 204Other Comprehensive Loss, Net of Taxes: Pension and other postretirement benefit plan activity, net of income tax benefit of $(1), $(2),
and $(2), respectively (5) (3) (3)Comprehensive Income $ 250 $ 214 $ 201
Net Income $ 255 $ 217 $ 204Preferred Stock Dividends 3 3 3
Net Income Available to Common Shareholder $ 252 $ 214 $ 201
The accompanying notes as they relate to Ameren Illinois are an integral part of these financial statements.
80
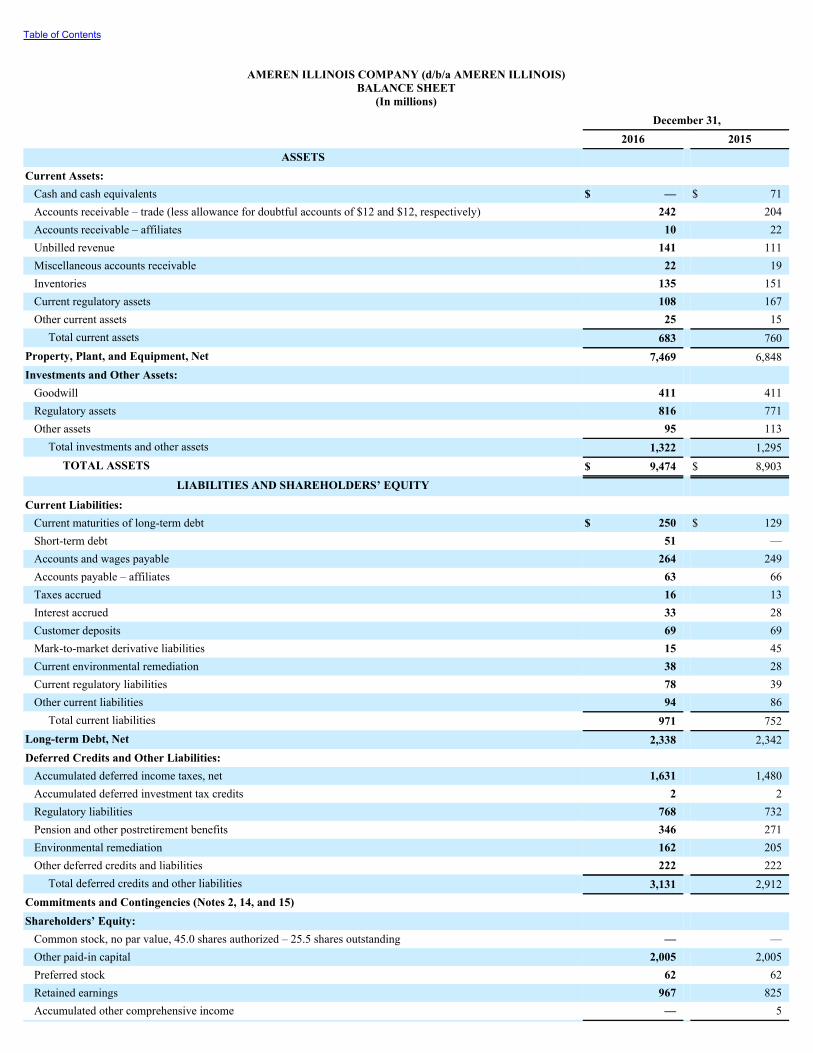
Table of Contents
AMEREN ILLINOIS COMPANY (d/b/a AMEREN ILLINOIS)BALANCE SHEET
(In millions)
December 31,
2016 2015ASSETS
Current Assets: Cash and cash equivalents $ — $ 71Accounts receivable – trade (less allowance for doubtful accounts of $12 and $12, respectively) 242 204Accounts receivable – affiliates 10 22Unbilled revenue 141 111Miscellaneous accounts receivable 22 19Inventories 135 151Current regulatory assets 108 167Other current assets 25 15
Total current assets 683 760Property, Plant, and Equipment, Net 7,469 6,848Investments and Other Assets: Goodwill 411 411Regulatory assets 816 771Other assets 95 113
Total investments and other assets 1,322 1,295TOTAL ASSETS $ 9,474 $ 8,903
LIABILITIES AND SHAREHOLDERS’ EQUITY Current Liabilities: Current maturities of long-term debt $ 250 $ 129Short-term debt 51 —Accounts and wages payable 264 249Accounts payable – affiliates 63 66Taxes accrued 16 13Interest accrued 33 28Customer deposits 69 69Mark-to-market derivative liabilities 15 45Current environmental remediation 38 28Current regulatory liabilities 78 39Other current liabilities 94 86
Total current liabilities 971 752Long-term Debt, Net 2,338 2,342Deferred Credits and Other Liabilities: Accumulated deferred income taxes, net 1,631 1,480Accumulated deferred investment tax credits 2 2Regulatory liabilities 768 732Pension and other postretirement benefits 346 271Environmental remediation 162 205Other deferred credits and liabilities 222 222
Total deferred credits and other liabilities 3,131 2,912Commitments and Contingencies (Notes 2, 14, and 15) Shareholders’ Equity: Common stock, no par value, 45.0 shares authorized – 25.5 shares outstanding — —Other paid-in capital 2,005 2,005Preferred stock 62 62Retained earnings 967 825Accumulated other comprehensive income — 5
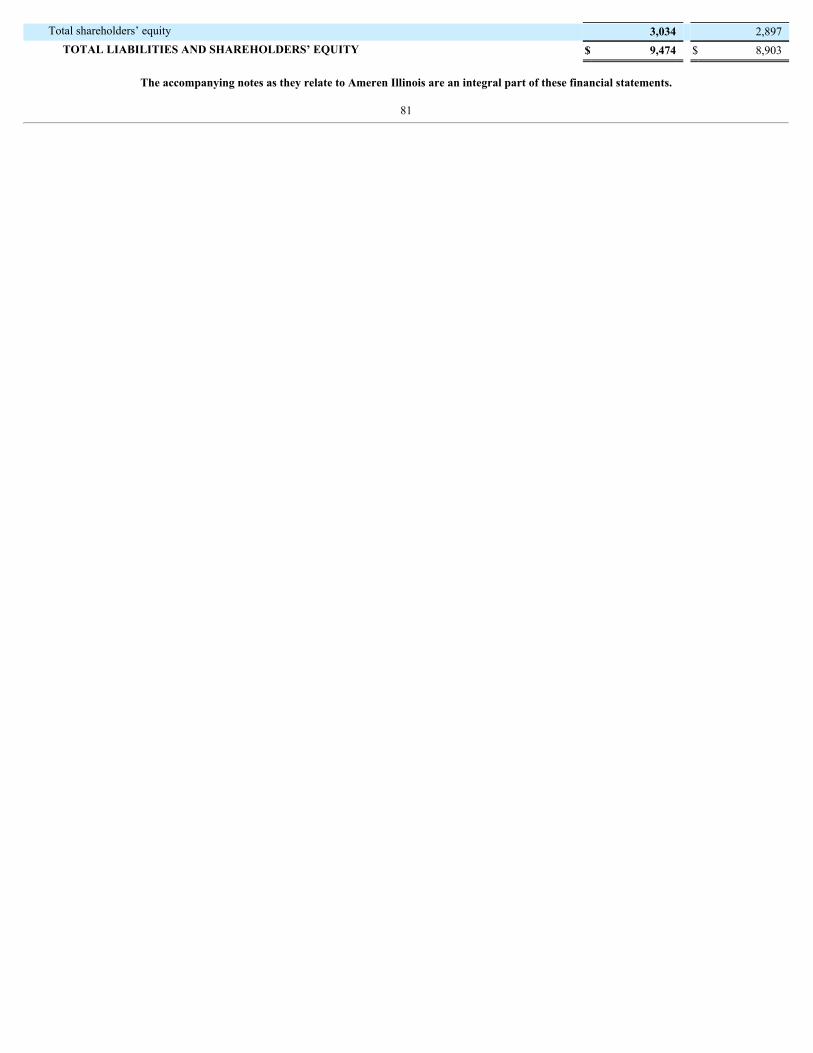
Total shareholders’ equity 3,034 2,897TOTAL LIABILITIES AND SHAREHOLDERS’ EQUITY $ 9,474 $ 8,903
The accompanying notes as they relate to Ameren Illinois are an integral part of these financial statements.
81

Table of Contents
AMEREN ILLINOIS COMPANY (d/b/a AMEREN ILLINOIS)STATEMENT OF CASH FLOWS
(In millions)
Year Ended December 31,
2016 2015 2014Cash Flows From Operating Activities: Net income $ 255 $ 217 $ 204Adjustments to reconcile net income to net cash provided by operating activities:
Depreciation and amortization 318 292 259Amortization of debt issuance costs and premium/discounts 14 14 13Deferred income taxes and investment tax credits, net 154 221 196Other (1) (14) (19)Changes in assets and liabilities:
Receivables (72) 16 (13)Inventories 15 25 (4)Accounts and wages payable 12 37 7Taxes accrued 1 (2) (7)Regulatory assets and liabilities 120 (26) (215)Assets, other (3) 17 15Liabilities, other (5) (27) 1Pension and other postretirement benefits (8) (4) (6)Counterparty collateral, net 3 (3) 14
Net cash provided by operating activities 803 763 445Cash Flows From Investing Activities: Capital expenditures (924) (918) (835)Other 6 5 7
Net cash used in investing activities (918) (913) (828)Cash Flows From Financing Activities: Dividends on common stock (110) — —Dividends on preferred stock (3) (3) (3)Short-term debt, net 51 (32) 32
Money pool borrowings, net — (15) (41)Redemptions, repurchases, and maturities of long-term debt (129) — (163)Issuances of long-term debt 240 248 548Capital issuance costs (4) (3) (6)Capital contribution from parent — 25 15Other (1) — 1
Net cash provided by financing activities 44 220 383Net change in cash and cash equivalents (71) 70 —Cash and cash equivalents at beginning of year 71 1 1Cash and cash equivalents at end of year $ — $ 71 $ 1
Cash Paid (Refunded) During the Year: Interest (net of $3, $5, and $2 capitalized, respectively) $ 127 $ 120 $ 110Income taxes, net 8 (113) (44)
The accompanying notes as they relate to Ameren Illinois are an integral part of these financial statements.
82

Table of Contents
AMEREN ILLINOIS COMPANY (d/b/a AMEREN ILLINOIS)STATEMENT OF SHAREHOLDERS’ EQUITY
(In millions)
December 31,
2016 2015 2014Common Stock $ — $ — $ —
Other Paid-in Capital Beginning of year 2,005 1,980 1,965Capital contribution from parent (Note 1) — 25 15Other paid-in capital, end of year 2,005 2,005 1,980
Preferred Stock 62 62 62
Retained Earnings: Beginning of year 825 611 410Net income 255 217 204Common stock dividends (110) — —Preferred stock dividends (3) (3) (3)Retained earnings, end of year 967 825 611
Accumulated Other Comprehensive Income: Deferred retirement benefit costs, beginning of year 5 8 11Change in deferred retirement benefit costs (5) (3) (3)Deferred retirement benefit costs, end of year — 5 8Total accumulated other comprehensive income, end of year — 5 8
Total Shareholders’ Equity $ 3,034 $ 2,897 $ 2,661
The accompanying notes as they relate to Ameren Illinois are an integral part of these financial statements.
83
Table of Contents
AMEREN CORPORATION (Consolidated)UNION ELECTRIC COMPANY (d/b/a Ameren Missouri)AMEREN ILLINOIS COMPANY (d/b/a Ameren Illinois)
COMBINED NOTES TO FINANCIAL STATEMENTS December 31,2016
NOTE 1 – SUMMARY OF SIGNIFICANT ACCOUNTING POLICIES
General
Ameren, headquartered in St. Louis, Missouri, is a public utility holdingcompany under PUHCA 2005. Ameren’s primary assets are its equityinterests in its subsidiaries, including Ameren Missouri, Ameren Illinois, andATXI. Ameren’s subsidiaries are separate, independent legal entities withseparate businesses, assets, and liabilities. Dividends on Ameren’s commonstock and the payment of expenses by Ameren depend on distributions madeto it by its subsidiaries. Ameren’s principal subsidiaries are listed below.Ameren also has various other subsidiaries that conduct other activities, suchas the provision of shared services.
• Union Electric Company, doing business as Ameren Missouri, operates arate-regulated electric generation, transmission, and distribution businessand a rate-regulated natural gas distribution business in Missouri.Ameren Missouri was incorporated in Missouri in 1922 and is successorto a number of companies, the oldest of which was organized in 1881. Itis the largest electric utility in the state of Missouri. It supplies electricand natural gas service to a 24,000 -square-mile area in central andeastern Missouri. This area has an estimated population of 2.8 millionand includes the Greater St. Louis area. Ameren Missouri supplieselectric service to 1.2 million customers and natural gas service to 0.1million customers.
• Ameren Illinois Company, doing business as Ameren Illinois, operatesrate-regulated electric transmission, electric distribution, and natural gasdistribution businesses in Illinois. Ameren Illinois was incorporated inIllinois in 1923 and is the successor to a number of companies, the oldestof which was organized in 1902. Ameren Illinois supplies electric andnatural gas utility service to portions of central and southern Illinois withan estimated population of 3.1 million in an area of 40,000 square miles.Ameren Illinois supplies electric service to 1.2 million customers andnatural gas service to 0.8 million customers.
• ATXI operates a FERC rate-regulated electric transmission business.ATXI is developing MISO-approved electric transmission projects,including the Illinois Rivers, Spoon River, and Mark Twain projects.ATXI is also evaluating competitive electric transmission investmentopportunities outside of MISO as they arise.
Ameren's financial statements are prepared on a consolidated basis andtherefore include the accounts of its majority-owned subsidiaries. Allintercompany transactions have been eliminated. Ameren Missouri andAmeren Illinois have no subsidiaries. All tabular dollar amounts are inmillions, unless otherwise indicated. Unless otherwise stated, these notes tothe
financial statements exclude discontinued operations for all periods presented.
Our accounting policies conform to GAAP. Our financial statementsreflect all adjustments (which include normal, recurring adjustments) that arenecessary, in our opinion, for a fair presentation of our results. Thepreparation of financial statements in conformity with GAAP requiresmanagement to make certain estimates and assumptions. Such estimates andassumptions affect reported amounts of assets and liabilities, the disclosure ofcontingent assets and liabilities at the dates of financial statements, and thereported amounts of revenues and expenses during the reported periods.Actual results could differ from those estimates.
Regulation
We are regulated by the MoPSC, the ICC, and the FERC. We defercertain costs as assets pursuant to actions of rate regulators or because ofexpectations that we will be able to recover such costs in future rates chargedto customers. We also defer certain amounts as liabilities pursuant to actionsof rate regulators or based on the expectation that such amounts will bereturned to customers in future rates. Regulatory assets and liabilities areamortized consistent with the period of expected regulatory treatment. Inaddition to the cost recovery mechanisms discussed in the Purchased Gas,Power, and Fuel Rate-adjustment Mechanisms section below, AmerenMissouri and Ameren Illinois have approvals from rate regulators to use othercost recovery mechanisms. Ameren Missouri has a pension andpostretirement benefit cost tracker, an uncertain tax positions tracker, arenewable energy standards cost tracker, a solar rebate program tracker, andthe MEEIA energy efficiency rider. Ameren Illinois' and ATXI's electrictransmission rates are determined pursuant to formula ratemaking.Additionally, Ameren Illinois' electric distribution business participates in theperformance-based formula ratemaking process established pursuant to theIEIMA. Ameren Illinois also has environmental cost riders, an asbestos-related litigation rider, an energy efficiency rider, a QIP rider, a VBA rider,and a bad debt rider. See Note 2 – Rate and Regulatory Matters for additionalinformation on regulatory assets and liabilities.
The Ameren Illinois asbestos-related litigation rider includes a trust fundthat was established when Ameren acquired IP. At December 31, 2016 and2015, the trust fund balance of $22 million was reflected in "Other assets" onAmeren's and Ameren Illinois' balance sheet. This balance is restricted onlyfor the use of funding certain asbestos-related claims. The rider is subject tothe following terms: 90% of the cash expenditures in excess of the amountincluded in base electric rates is to be recovered from the trust fund. If cashexpenditures are less than the amount in base rates, Ameren Illinois willcontribute 90% of the difference to the trust fund.
Cash and Cash Equivalents
Cash and cash equivalents include cash on hand and temporaryinvestments purchased with an original maturity of
84
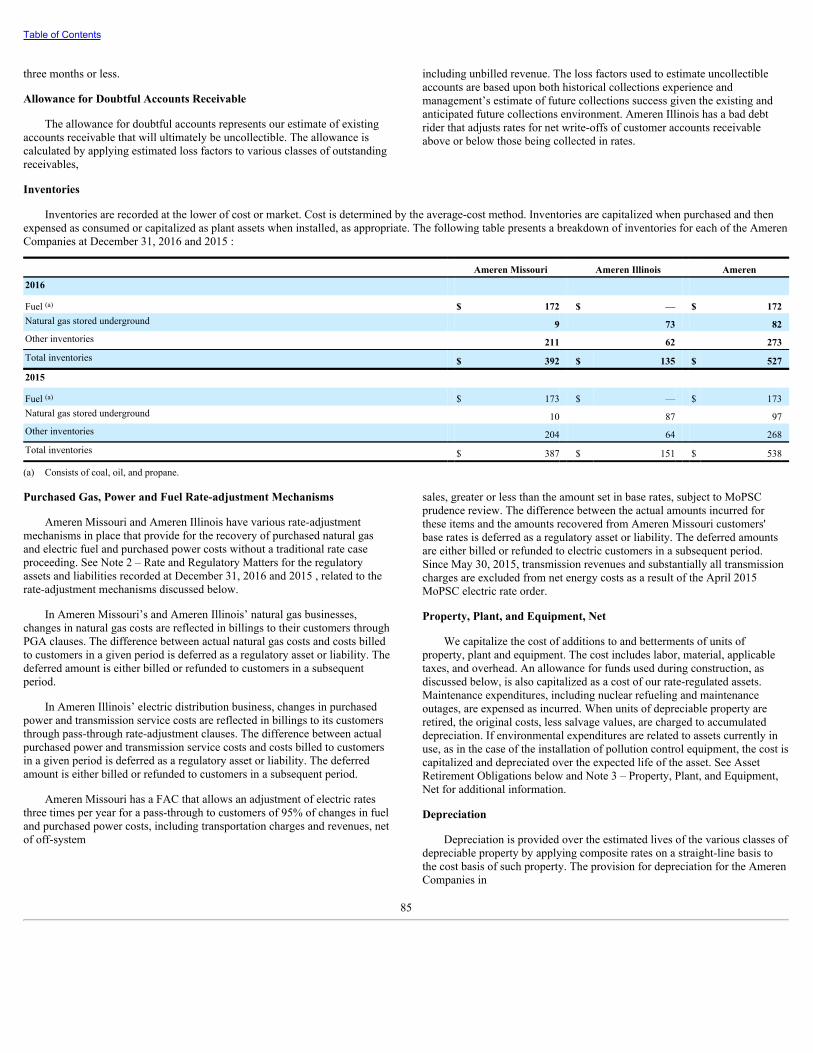
Table of Contents
three months or less.
Allowance for Doubtful Accounts Receivable
The allowance for doubtful accounts represents our estimate of existingaccounts receivable that will ultimately be uncollectible. The allowance iscalculated by applying estimated loss factors to various classes of outstandingreceivables,
including unbilled revenue. The loss factors used to estimate uncollectibleaccounts are based upon both historical collections experience andmanagement’s estimate of future collections success given the existing andanticipated future collections environment. Ameren Illinois has a bad debtrider that adjusts rates for net write-offs of customer accounts receivableabove or below those being collected in rates.
Inventories
Inventories are recorded at the lower of cost or market. Cost is determined by the average-cost method. Inventories are capitalized when purchased and thenexpensed as consumed or capitalized as plant assets when installed, as appropriate. The following table presents a breakdown of inventories for each of the AmerenCompanies at December 31, 2016 and 2015 :
Ameren Missouri Ameren Illinois Ameren2016
Fuel (a) $ 172 $ — $ 172Natural gas stored underground 9 73 82Other inventories 211 62 273Total inventories $ 392 $ 135 $ 5272015
Fuel (a) $ 173 $ — $ 173Natural gas stored underground 10 87 97Other inventories 204 64 268Total inventories $ 387 $ 151 $ 538
(a) Consists of coal, oil, and propane.
Purchased Gas, Power and Fuel Rate-adjustment Mechanisms
Ameren Missouri and Ameren Illinois have various rate-adjustmentmechanisms in place that provide for the recovery of purchased natural gasand electric fuel and purchased power costs without a traditional rate caseproceeding. See Note 2 – Rate and Regulatory Matters for the regulatoryassets and liabilities recorded at December 31, 2016 and 2015 , related to therate-adjustment mechanisms discussed below.
In Ameren Missouri’s and Ameren Illinois’ natural gas businesses,changes in natural gas costs are reflected in billings to their customers throughPGA clauses. The difference between actual natural gas costs and costs billedto customers in a given period is deferred as a regulatory asset or liability. Thedeferred amount is either billed or refunded to customers in a subsequentperiod.
In Ameren Illinois’ electric distribution business, changes in purchasedpower and transmission service costs are reflected in billings to its customersthrough pass-through rate-adjustment clauses. The difference between actualpurchased power and transmission service costs and costs billed to customersin a given period is deferred as a regulatory asset or liability. The deferredamount is either billed or refunded to customers in a subsequent period.
Ameren Missouri has a FAC that allows an adjustment of electric ratesthree times per year for a pass-through to customers of 95% of changes in fueland purchased power costs, including transportation charges and revenues, netof off-system
sales, greater or less than the amount set in base rates, subject to MoPSCprudence review. The difference between the actual amounts incurred forthese items and the amounts recovered from Ameren Missouri customers'base rates is deferred as a regulatory asset or liability. The deferred amountsare either billed or refunded to electric customers in a subsequent period.Since May 30, 2015, transmission revenues and substantially all transmissioncharges are excluded from net energy costs as a result of the April 2015MoPSC electric rate order.
Property, Plant, and Equipment, Net
We capitalize the cost of additions to and betterments of units ofproperty, plant and equipment. The cost includes labor, material, applicabletaxes, and overhead. An allowance for funds used during construction, asdiscussed below, is also capitalized as a cost of our rate-regulated assets.Maintenance expenditures, including nuclear refueling and maintenanceoutages, are expensed as incurred. When units of depreciable property areretired, the original costs, less salvage values, are charged to accumulateddepreciation. If environmental expenditures are related to assets currently inuse, as in the case of the installation of pollution control equipment, the cost iscapitalized and depreciated over the expected life of the asset. See AssetRetirement Obligations below and Note 3 – Property, Plant, and Equipment,Net for additional information.
Depreciation
Depreciation is provided over the estimated lives of the various classes ofdepreciable property by applying composite rates on a straight-line basis tothe cost basis of such property. The provision for depreciation for the AmerenCompanies in
85
Table of Contents
2016 , 2015 , and 2014 ranged from 3% to 4% of the average depreciable cost.
Allowance for Funds Used During Construction
We capitalize allowance for funds used during construction, or the cost ofborrowed funds and the cost of equity funds (preferred and commonshareholders’ equity) applicable to rate-regulated construction expenditures,in accordance with the utility industry's accounting practice. Allowance forfunds used during construction does not represent a current source of cashfunds. This accounting practice offsets the effect on earnings of the cost offinancing during construction, and it treats such financing costs in the samemanner as construction charges for labor and materials.
Under accepted ratemaking practice, cash recovery of allowance forfunds used during construction and other construction costs occurs whencompleted projects are placed in service and reflected in customer rates. Thefollowing table presents the annual allowance for funds used duringconstruction debt and equity blended rates that were applied to constructionprojects in 2016 , 2015 , and 2014 :
2016 2015 2014Ameren Missouri 7% 7% 7%Ameren Illinois 5% 6% 2%
Goodwill
Goodwill represents the excess of the purchase price of an acquisitionover the fair value of the net assets acquired. Ameren and Ameren Illinoisevaluate goodwill for impairment in each of their reporting units as ofOctober 31 each year, or more frequently if events and circumstances changethat would more likely than not reduce the fair value of their reporting unitsbelow their carrying amounts. Ameren and Ameren Illinois had goodwill of$411 million at October 31, 2016 and October 31, 2015. To determinewhether the fair value of a reporting unit is more likely than not greater thanits carrying amount, Ameren and Ameren Illinois elect to perform either aqualitative assessment or to bypass the qualitative assessment and perform atwo-step quantitative test, on an annual basis. On October 31, 2015, Amerenand Ameren Illinois performed a quantitative test and determined that theestimated fair value of the Ameren Illinois reporting unit significantlyexceeded its carrying value as of that date. Based on these results, Amerenand Ameren Illinois elected to perform a qualitative assessment for theirannual goodwill impairment test conducted as of October 31, 2016.
The results of Ameren’s and Ameren Illinois’ qualitative assessmentindicated that it was more likely than not that the fair value of the AmerenIllinois reporting unit exceeded its carrying value as of October 31, 2016,resulting in no impairment of Ameren’s or Ameren Illinois’ goodwill. Thefollowing factors, among others, were considered by Ameren and AmerenIllinois when assessing whether it was more likely than not that the fair valueof the Ameren Illinois reporting unit exceeded its carrying value for theOctober 31, 2016, test:
• macroeconomic conditions, including those conditions within Ameren
Illinois’ service territory;• pending rate case outcomes and projections of future rate case outcomes;• changes in laws and potential law changes;• observable industry market multiples;• achievement of IEIMA performance metrics and the yield of 30-year
United States Treasury bonds;• an unexpected further reduction in the FERC-allowed return on equity
related to transmission services; and• projected operating results and cash flows.
As of December 31, 2016, the Ameren Companies changed the manner inwhich they assess performance and allocate resources, driven by increasinginvestment in FERC rate-regulated electric transmission and Ameren Illinoiselectric distribution and natural gas distribution businesses as well as theunique regulatory environment for each jurisdiction. Ameren now has fourreporting units: Ameren Missouri, Ameren Illinois Electric Distribution,Ameren Illinois Natural Gas, and Ameren Transmission. Ameren Illinois nowhas three reporting units: Ameren Illinois Electric Distribution, AmerenIllinois Natural Gas, and Ameren Illinois Transmission. See Note 16 –Segment Information for additional information related to the change inAmeren’s and Ameren Illinois' segments.
As of the date of the segment change, December 31, 2016, Ameren andAmeren Illinois reassigned goodwill to the new reporting units using arelative fair value allocation approach. The Level 3 fair value hierarchyvaluation approach used to reassign goodwill was based on a marketparticipant view and used a weighted combination of a discounted cash flowanalysis and a market multiples analysis. Key assumptions used in estimatingthe fair value of the reporting units included discount and growth rates, utilitysector market performance and transactions, and projected operating resultsand cash flows. As a result of the goodwill reassignment, Ameren IllinoisElectric Distribution, Ameren Illinois Natural Gas, and Ameren IllinoisTransmission had goodwill of $238 million , $80 million , and $93 million ,respectively, at December 31, 2016. The Ameren Transmission reporting unitwas reassigned the same $93 million of goodwill as the Ameren IllinoisTransmission reporting unit.
In conjunction with the goodwill reassignment, Ameren and AmerenIllinois completed the first step of the quantitative test to determine whetherthe fair values of the new reporting units exceeded their carrying values as ofDecember 31, 2016. Ameren and Ameren Illinois determined that theestimated fair values of the Ameren Illinois Electric Distribution, AmerenIllinois Natural Gas, Ameren Illinois Transmission, and Ameren Transmissionreporting units each exceeded their respective carrying values by at least 40%, indicating no impairment of Ameren’s or Ameren Illinois’ goodwill. TheAmeren and Ameren Illinois goodwill that was reassigned to the newreporting units on December 31, 2016, had no accumulated goodwillimpairment losses.
Impairment of Long-lived Assets
86

Table of Contents
We evaluate long-lived assets classified as held and used for impairmentwhen events or changes in circumstances indicate that the carrying value ofsuch assets may not be recoverable. Whether an impairment has occurred isdetermined by comparing the estimated undiscounted cash flows attributableto the assets to the carrying value of the assets. If the carrying value exceedsthe undiscounted cash flows, we recognize an impairment charge equal to theamount by which the carrying value exceeds the estimated fair value of theassets. In the period in which we determine an asset meets held for salecriteria, we record an impairment charge to the extent the book value exceedsits estimated fair value less cost to sell. We did not identify any events orchanges in circumstances that indicated that the carrying value of long-livedassets may not be recoverable in 2016 and 2015 .
Environmental Costs
Liabilities for environmental costs are recorded on an undiscounted basiswhen it is probable that a liability has been incurred and the amount of theliability can be reasonably estimated. Costs are expensed or deferred as aregulatory asset when it is expected that the costs will be recovered fromcustomers in future rates.
Asset Retirement Obligations
We record the estimated fair value of legal obligations associated with the retirement of tangible long-lived assets in the period in which the liabilities areincurred and capitalize a corresponding amount as part of the book value of the related long-lived asset. In subsequent periods, we adjust AROs based on changesin the estimated fair values of the obligations with a corresponding increase or decrease in the asset book value. Asset book values, reflected within "Property,Plant, and Equipment, Net" on the balance sheet, are depreciated over the remaining useful life of the related asset. Due to regulatory recovery, that depreciation isrecorded within a regulatory asset or liability balance related to AROs. Ameren and Ameren Missouri have a nuclear decommissioning trust fund for thedecommissioning of the Callaway energy center. Net realized and unrealized gains and losses within the nuclear decommissioning trust fund are deferred and arecurrently recorded as a regulatory liability, along with the depreciation of the asset book values, discussed above, and the accretion of the AROs. The depreciationof the asset book values at Ameren Missouri was $31 million , $13 million , and $1 million for the years ended December 31, 2016, 2015, and 2014, respectively,which was recorded as a reduction to the regulatory liability. The depreciation recorded to the regulatory asset at Ameren Illinois was immaterial in each respectiveperiod. Uncertainties as to the probability, timing, or amount of cash expenditures associated with AROs affect our estimates of fair value. Ameren and AmerenMissouri have recorded AROs for retirement costs associated with Ameren Missouri’s Callaway energy center decommissioning, CCR facilities, and riverstructures. Also, Ameren, Ameren Missouri, and Ameren Illinois have recorded AROs for retirement costs associated with asbestos removal and the disposal ofcertain transformers. Asset removal costs that do not constitute legal obligations are classified as regulatory liabilities. See Note 2 – Rate and Regulatory Matters.
The following table provides a reconciliation of the beginning and ending carrying amount of AROs for the years ended December 31, 2016 and 2015 :
AmerenMissouri
AmerenIllinois Ameren
Balance at December 31, 2014 $ 389 $ 7 $ 396 Liabilities incurred 3 — 3 Liabilities settled (1) (1) (2)
Accretion in 2015 (a) 23 (b) 23
Change in estimates (c) 203 (b) 203 Balance at December 31, 2015 $ 617 (e) $ 6 (d) $ 623 (e) Liabilities incurred 3 — 3 Liabilities settled (2) (b) (2)
Accretion in 2016 (a) 25 (b) 25
Change in estimates 1 — 1 Balance at December 31, 2016 $ 644 (e) $ 6 (d) $ 650 (e)
(a) Accretion expense was recorded as a decrease to regulatory liabilities.(b) Less than $1 million.(c) The ARO increase resulted in a corresponding increase recorded to "Property, Plant, and Equipment, Net." Ameren and Ameren Missouri increased their AROs related to the
decommissioning of the Callaway energy center by $99 million to reflect the 2015 cost study and funding analysis filed with the MoPSC, the extension of the estimated operating life until2044, and a reduction in the discount rate assumption. See Note 10 – Callaway Energy Center for additional information. In addition, as a result of new federal regulations, Ameren andAmeren Missouri recorded an increase of $100 million to their AROs associated with CCR storage facilities. See Note 15 – Commitments and Contingencies for additional information.Ameren and Ameren Missouri also increased their AROs by $4 million due to a change in the estimated retirement dates of the Meramec and Rush Island energy centers as a result of theMoPSC's April 2015 electric rate order.
(d) Included in “Other deferred credits and liabilities” on the balance sheet.(e) Balance included $5 million and $15 million in "Other current liabilities" on the balance sheet as of December 31, 2015 and 2016, respectively.
87
Table of Contents
See the Divestiture Transactions and Discontinued Operations section below for additional information on the AROs related to the abandoned Meredosia andHutsonville energy centers, which are presented as discontinued operations and therefore not included in the table above.
Noncontrolling Interests
As of December 31, 2016 and 2015 , Ameren’s noncontrolling interestsincluded the preferred stock of Ameren Missouri and Ameren Illinois.
Operating Revenue
The Ameren Companies record operating revenue for electric or naturalgas service when it is delivered to customers. We accrue an estimate ofelectric and natural gas revenues for service rendered but unbilled at the endof each accounting period.
Ameren Illinois participates in the performance-based formularatemaking framework pursuant to the IEIMA. In addition, Ameren Illinois'and ATXI's electric transmission service operating revenues are regulated bythe FERC. The provisions of the IEIMA and the FERC's electric transmissionformula rate framework provide for annual reconciliations of the electricdistribution and electric transmission service revenue requirements necessaryto reflect the actual recoverable costs incurred in a given year with therevenue requirements in customer rates for that year, including an allowedreturn on equity. In each of those electric jurisdictions, if the current year'srevenue requirement is greater than the revenue requirement reflected in thatyear's customer rates, an increase to electric operating revenues with an offsetto a regulatory asset is recorded to reflect the expected recovery of thoseadditional amounts from customers within two years. In each jurisdiction, ifthe current year's revenue requirement is less than the revenue requirementreflected in that year's customer rates, a reduction to electric operatingrevenues with an offset to a regulatory liability is recorded to reflect theexpected refund to customers within two years. See Note 2 – Rate andRegulatory Matters for information regarding Ameren Illinois' revenuerequirement reconciliation pursuant to the IEIMA.
Accounting for MISO Transactions
MISO-related purchase and sale transactions are recorded by Ameren,Ameren Missouri, and Ameren Illinois using settlement information providedby MISO. Ameren Missouri records these purchase and sale transactions on anet hourly position. Ameren Missouri records net purchases in a single hour in“Operating Expenses – Purchased power” and net sales in a single hour in“Operating Revenues – Electric” in its statement of income. Ameren Illinoisrecords net purchases in “Operating Expenses – Purchased power” in itsstatement of income to reflect all of its MISO transactions relating to theprocurement of power for its customers. On occasion, Ameren Missouri's andAmeren Illinois' prior-period transactions will be resettled outside the routinesettlement process because of a change in MISO’s tariff or a materialinterpretation thereof. In these cases, Ameren Missouri and Ameren Illinoisrecognize expenses associated with resettlements once the resettlement isprobable and the
resettlement amount can be estimated. Revenues are recognized once theresettlement amount is received. There were no material MISO resettlementsin 2016, 2015, or 2014.
Nuclear Fuel
Ameren Missouri’s cost of nuclear fuel is capitalized and then amortizedto fuel expense on a unit-of-production basis. The cost is charged to"Operating Expenses – Fuel" in the statement of income.
Stock-based Compensation
Stock-based compensation cost is measured at the grant date based on thefair value of the award, net of an assumed forfeiture rate. Ameren recognizesas compensation expense the estimated fair value of stock-basedcompensation on a straight-line basis over the requisite service period. SeeNote 12 – Stock-based Compensation for additional information.
Excise Taxes
Ameren Missouri and Ameren Illinois collect from their customerscertain excise taxes that are levied on the sale or distribution of natural gasand electricity. Excise taxes are levied on Ameren Missouri's electric andnatural gas businesses and on Ameren Illinois' natural gas business. They arerecorded gross in “Operating Revenues – Electric,” “Operating Revenues –Natural gas,” and “Operating Expenses – Taxes other than income taxes” onthe statement of income or the statement of income and comprehensiveincome. Excise taxes for electric service in Illinois are levied on customersand are therefore not included in Ameren Illinois' revenues and expenses. Thefollowing table presents the excise taxes recorded in “Operating Revenues –Electric,” “Operating Revenues – Natural gas,” and “Operating Expenses –Taxes other than income taxes” for the years ended December 31, 2016 , 2015, and 2014 :
2016 2015 2014Ameren Missouri $ 151 $ 156 $ 151Ameren Illinois 57 57 64Ameren $ 208 $ 213 $ 215
Unamortized Debt Discounts, Premiums, and Issuance Costs
Long-term debt discounts, premiums, and issuance costs are amortizedover the lives of the related issuances. Credit agreement fees are amortizedover the term of that agreement.
Income Taxes
Ameren uses an asset and liability approach for its financial accountingand reporting of income taxes. Deferred tax assets and liabilities arerecognized for transactions that are treated differently for financial reportingand income tax return purposes. These deferred tax assets and liabilities arebased on statutory tax rates.
88
Table of Contents
We recognize that regulators will probably reduce future revenues fordeferred tax liabilities that were initially recorded at rates in excess of thecurrent statutory rate. Therefore, reductions in deferred tax liabilities thatwere recorded because of decreases in the statutory rate have been credited toa regulatory liability. A regulatory asset has been established to recognize theprobable recovery through future customer rates of tax benefits related to theequity component of allowance for funds used during construction, as well asthe effects of tax rate increases.
Investment tax credits used on tax returns for prior years have beendeferred as a noncurrent liability. The credits are being amortized over theuseful lives of the related investment. Deferred income taxes were recordedon the temporary difference represented by the deferred investment tax creditsand a corresponding regulatory liability. This recognizes the expectedreduction in rates for future lower income taxes associated with theamortization of the investment tax credits. See Note 13 – Income Taxes.
Ameren Missouri, Ameren Illinois, and all the other Ameren subsidiarycompanies are parties to a tax allocation agreement with Ameren (parent) thatprovides for the allocation of consolidated tax liabilities. The tax allocationagreement specifies that each party be allocated an amount of tax using astand-alone calculation, which is similar to that which would be owed orrefunded had the party been separately subject to tax considering the impactof consolidation. Any net benefit attributable to the parent is reallocated to theother parties. This reallocation is treated as a capital contribution to the partyreceiving the benefit.
Earnings per Share
Basic earnings per share is computed by dividing “Net IncomeAttributable to Ameren Common Shareholders” by the weighted-averagenumber of common shares outstanding during the period. Earnings per dilutedshare is computed by dividing “Net Income Attributable to Ameren CommonShareholders” by the weighted-average number of diluted common sharesoutstanding during the period. Earnings per diluted share reflects the potentialdilution that would occur if certain stock-based performance share units weresettled. The number of performance share units assumed to be settled was 0.8million , 1.0 million , and 1.8 million for the years ended December 31, 2016 ,2015 , and 2014 , respectively. There were no potentially dilutive securitiesexcluded from the diluted earnings per share calculations for the years endedDecember 31, 2016 , 2015 , and 2014 .
Capital Contributions and Return of Capital
In 2016, Ameren Missouri received cash capital contributions of $44million from Ameren (parent) as a result of the tax allocation agreement,which included the accrued capital contribution from 2015.
In 2015, Ameren Missouri received cash capital contributions of $224million from Ameren (parent) as a result of the tax allocation agreement,which included the Ameren Missouri accrued capital contribution from 2014.Additionally, as
of December 31, 2015, Ameren Missouri accrued a $38 million capitalcontribution related to the same agreement. In 2015, Ameren Illinois receivedcash capital contributions of $25 million from Ameren (parent).
In 2014, Ameren Missouri and Ameren Illinois received cash capitalcontributions of $215 million and $15 million , respectively, from Ameren(parent) as a result of the tax allocation agreement. Additionally, as ofDecember 31, 2014, Ameren Missouri accrued a $9 million capitalcontribution related to the same agreement. Also in 2014, Ameren Missourireturned capital of $215 million to Ameren (parent).
Divestiture Transactions and Discontinued Operations
In December 2013, Ameren completed the divestiture of New AER toIPH. The transaction agreement with IPH provided that if the Elgin, GibsonCity, and Grand Tower natural-gas-fired energy centers were subsequentlysold by Medina Valley and Medina Valley received additional proceeds fromsuch sale, Medina Valley would pay Genco any proceeds from such sale, netof taxes and other expenses, in excess of the $137.5 million previously paid toGenco. In January 2014, Medina Valley completed the sale of the Elgin,Gibson City, and Grand Tower natural-gas-fired energy centers to RocklandCapital for a total purchase price of $168 million . The agreement withRockland Capital required a portion of the purchase price to be held in escrowuntil January 31, 2016, to fund certain indemnity obligations, if any, ofMedina Valley. The Rockland Capital escrow balance of $14 million and thecorresponding payable due to Genco was reflected on Ameren's December 31,2015, consolidated balance sheet in "Other current assets" and in "Othercurrent liabilities," respectively. In 2016, Medina Valley received the amountheld in escrow from Rockland Capital and paid Genco its portion of theescrow.
All matters related to the final tax basis of New AER and the related taxbenefit resulting from its divestiture were resolved with the completion of theIRS audit of 2013. During 2015, based on the completion of the IRS audit of2013, Ameren removed a reserve for unrecognized tax benefits of $53 millionrecorded in 2013 and recognized a tax benefit from discontinued operations.
The components of the assets and liabilities of Ameren's discontinuedoperations at December 31, 2016 and 2015, consist primarily of AROs and therelated deferred income tax assets associated with the abandoned Meredosiaand Hutsonville energy centers.
Accounting Changes and Other Matters
The following is a summary of recently adopted authoritative accountingguidance, as well as guidance issued but not yet adopted, that could affect theAmeren Companies.
Revenue from Contracts with Customers
In May 2014, the FASB issued authoritative guidance that changes thecriteria for recognizing revenue from a contract with a customer. Theunderlying principle of the guidance is that an
89

Table of Contents
entity will recognize revenue for the transfer of promised goods or services tocustomers at an amount that the entity expects to be entitled to in exchangefor those goods or services. The guidance also requires additional disclosuresto enable users of financial statements to understand the nature, amount,timing, and uncertainty of revenue and cash flows arising from contracts withcustomers. Entities can apply the guidance retrospectively to each reportingperiod presented, the full retrospective method, or retrospectively byrecording a cumulative effect adjustment to retained earnings in the period ofinitial adoption, the modified retrospective method. The utility industrycontinues to assess the impacts on accounting for contributions in aid ofconstruction and similar arrangements, and collectibility, among other issues.The outcome of these assessments could have a significant impact on ourresults of operations and financial position. We plan to complete ourassessment of the impacts of this guidance on our results of operations,financial position, presentation and disclosures, and transition method, in thenext several months prior to our adoption in the first quarter of 2018.
Amendments to the Consolidation Analysis
In February 2015, the FASB issued authoritative guidance that amendsthe consolidation analysis for variable interest entities and voting interestentities. The new guidance affects (1) limited partnerships, similar legalentities, and certain investment funds, (2) the evaluation of fees paid to adecision maker or service provider as a variable interest, (3) how feearrangements impact the primary beneficiary determination, and (4) theevaluation of related party relationships on the primary beneficiarydetermination. The adoption of this guidance in 2016 did not impact theAmeren Companies' results of operations, financial position, cash flows, ordisclosures.
Disclosures for Investments in Certain Entities That Calculate Net AssetValue per Share
In May 2015, to address diversity in practice, the FASB issuedauthoritative guidance that removes the requirement to categorize within thefair value hierarchy all investments for which fair value is measured using theNAV practical expedient. The Ameren Companies have investmentsmeasured using the NAV practical expedient within the pension plan andpostretirement benefit plan assets. We adopted this guidance on January 1,2016 and retrospectively updated the presentation of these assets in the fairvalue hierarchy tables included in Note 11 - Retirement Benefits. Theadoption of this guidance did not impact our results of operations, financialposition or cash flows.
Financial Instruments - Recognition and Measurement, and Credit Losses
In January 2016, the FASB issued authoritative guidance that addressedcertain aspects of recognition, measurement, presentation and disclosure offinancial instruments. This guidance requires an entity to measure equityinvestments, other than those accounted for under the equity method ofaccounting, at fair value with changes in fair value recognized in net income.The recognition and measurement guidance will be effective for the AmerenCompanies in the first quarter of 2018, and requires
changes to be applied retrospectively with a cumulative effect adjustment toretained earnings as of the adoption date. Also, in June 2016, the FASB issuedauthoritative guidance that requires an entity to recognize an allowance forfinancial instruments that reflects its current estimate of credit losses expectedto be incurred over the life of the financial instruments. The guidance requiresan entity to measure expected credit losses based on relevant informationabout past events, current conditions, and reasonable and supportableforecasts that affect the collectibility of the reported amount. The credit lossguidance will be effective for the Ameren Companies in the first quarter of2020, and requires changes to be applied retrospectively with a cumulativeeffect adjustment to retained earnings as of the adoption date. We arecurrently assessing the impacts of the new financial instruments guidance onour results of operations, financial position, and disclosures.
Leases
In February 2016, the FASB issued authoritative guidance that requiresan entity to recognize assets and liabilities arising from all leases with a termgreater than one year. Consistent with current GAAP, the recognition,measurement, and presentation of expenses and cash flows arising from alease will depend on its classification as a finance or operating lease. Theguidance also requires additional disclosures to enable users of financialstatements to understand the amount, timing, and uncertainty of cash flowsarising from leases. This guidance will affect the Ameren Companies'financial position by increasing the assets and liabilities recorded relating totheir operating leases, which will be recognized and measured at thebeginning of the earliest period presented. We are currently assessing theimpacts of this guidance for other effects on our results of operations, cashflows and disclosures. We expect to adopt this guidance in the first quarter of2019. See Note 15 – Commitments and Contingencies for additionalinformation on our leases.
Improvements to Employee Share-Based Payment Accounting
In March 2016, the FASB issued authoritative guidance that simplifiesthe accounting for share-based payment transactions, including the income taxconsequences, the calculation of diluted earnings per share, the treatment offorfeitures, the classification of awards as either equity or liabilities, and theclassification on the statement of cash flows. Ameren determines for eachperformance share unit award whether the difference between the deductionfor tax purposes and the compensation cost recognized for financial reportingpurposes results in either an excess tax benefit or an excess tax deficit.Previously, excess tax benefits were recognized in "Other paid-in capital" onAmeren’s consolidated balance sheet, and in certain cases, excess tax deficitswere recognized in “Income taxes” on Ameren’s consolidated incomestatement. The new guidance increases income statement volatility byrequiring all excess tax benefits and deficits to be recognized in “Incometaxes,” and treated as discrete items in the period in which they occur.Ameren adopted this guidance in 2016 and prospectively applied theamendment in this guidance requiring recognition of excess tax benefits anddeficits in the income statement, which resulted in recognition of
90

Table of Contents
a $21 million income tax benefit and a corresponding $21 million increase inincome from continuing operations and net income ( 9 cents per diluted share)during the period. Also as a result of the adoption of this guidance, Amerenmade an accounting policy election to continue to estimate the number offorfeitures expected to occur. The amendments in the guidance that requireapplication using a modified retrospective transition method did not impactAmeren. Therefore, there was no cumulative-effect adjustment to retainedearnings recognized as of January 1, 2016. Ameren applied the amendmentsin this guidance relating to classification on the statement of cash flowsretrospectively. For the year ended December 31, 2015, Ameren reclassified$2 million of excess tax benefits on the statement of cash flows fromfinancing to operating activity. Also, for the years ended December 31, 2015and December 31, 2014, Ameren reclassified $12 million and $14 million ,respectively, of employee payroll taxes related to share-based payments fromoperating to financing activity.
Restricted Cash
In November 2016, the FASB issued authoritative guidance that requiresrestricted cash and restricted cash equivalents to be included with cash andcash equivalents when reconciling the beginning-of-period and end-of-periodtotal amounts shown on the statement of cash flows. We are currentlyassessing the impacts of this guidance on our statements of cash flows anddisclosures. The guidance will be effective for the Ameren Companies in thefirst quarter of 2018, and requires changes to be applied retrospectively toeach period presented.
NOTE 2 – RATE AND REGULATORY MATTERS
Below is a summary of significant regulatory proceedings and relatedlawsuits. We are unable to predict the ultimate outcome of these matters, thetiming of final decisions of the various agencies and courts, or the effect onour results of operations, financial position, or liquidity.
Missouri
February 2017 Unanimous Stipulation and Agreement
In July 2016, Ameren Missouri filed a request with the MoPSC seekingapproval to increase its annual revenues for electric service. Relating to thatrequest, in February 2017, Ameren Missouri, the MoPSC staff, the MoOPC,and all intervenors filed a unanimous stipulation and agreement with theMoPSC. The stipulation and agreement, which is subject to MoPSC approval,would result in a $3.4 billion revenue requirement, which is a $92 millionincrease in Ameren Missouri’s annual revenue requirement for electric servicecompared to its prior revenue requirement established in the MoPSC's April2015 electric rate order. The stipulation and agreement did not specify thecommon equity percentage, the rate base, or the allowed return on commonequity. The new revenue requirement reflects the current actual sales volumesof the New Madrid Smelter, whose operations remain suspended, as well asother agreed upon sales volumes.
The stipulation and agreement includes the continued use of the FAC and
the regulatory tracking mechanisms for pension and postretirement benefits,uncertain income tax positions, and renewable energy standards that theMoPSC previously authorized in earlier electric rate orders. These regulatorytracking mechanisms provide for a base level of expense to be reflected inAmeren Missouri’s base electric rates with differences in the actual expensesincurred recorded as a regulatory asset or liability. Excluding cost reductionsassociated with reduced sales volumes, the base level of net energy costsunder the stipulation and agreement would decrease by $54 million from thebase level established in the MoPSC's April 2015 electric rate order. Changesin amortizations and the base level of expenses for the other regulatorytracking mechanisms, including extending the amortization period of certainregulatory assets, would reduce expenses by $26 million from the base levelsestablished in the MoPSC's April 2015 electric rate order.
The stipulation and agreement contemplates that new rates will becomeeffective on or before March 20, 2017. Ameren Missouri cannot predictwhether the MoPSC will approve the stipulation and agreement or, ifapproved, whether any application for rehearing or appeal will be filed or theoutcome if so filed.
Noranda and New Madrid Smelter
In the first quarter of 2016, Noranda, which was historically AmerenMissouri's largest customer, suspended operations at the New Madrid Smelterand filed voluntary petitions for a court-supervised restructuring processunder Chapter 11 of the United States Bankruptcy Code. In October 2016,Noranda sold the New Madrid Smelter to ARG International AG. Operationsat the New Madrid Smelter remain suspended and Ameren Missouri isuncertain of future sales to the smelter. As a result, Ameren Missouri will notfully recover its revenue requirement until rates are adjusted prospectively bythe MoPSC to accurately reflect the actual sales volumes to the New MadridSmelter. As of December 31, 2016, Ameren Missouri has been paid in full forall previous electric service amounts, and expects to continue to be paid in fullfor the minimal amount of electric service it is currently providing to the NewMadrid Smelter.
MEEIA
In November 2016, the MoPSC approved a $28 million MEEIA 2013performance incentive based on a stipulation and agreement between AmerenMissouri, the MoPSC staff, and the MoOPC. Ameren Missouri will collectthe performance incentive over a two-year period that began in February2017.
In November 2015, the MoPSC issued an order regarding thedetermination of an input used to calculate the performance incentive.Ameren Missouri filed an appeal of the order with the Missouri Court ofAppeals, Western District. In December 2016, the Missouri Court of Appeals,Western District, upheld the November 2015 MoPSC order. Ameren Missourihas appealed the decision to uphold the MoPSC order to the MissouriSupreme Court.
91
Table of Contents
ATXI’s Mark Twain Project
The Mark Twain project is a MISO-approved 95 -mile transmission lineto be located in northeast Missouri. In April 2016, the MoPSC granted ATXIa certificate of convenience and necessity for the Mark Twain project. Beforestarting construction, ATXI must obtain assents for road crossings from thefive counties where the line will be constructed. None of the five countycommissions have approved ATXI’s requests for the assents. In October2016, ATXI filed suit in each of the five county circuit courts to obtain theassents. A decision in each of the five lawsuits is expected in 2017. ATXIplans to complete the project in 2019; however, further delays in obtaining theassents could delay the completion date.
Illinois
IEIMA
Under the provisions of the IEIMA's performance-based formula rate-making framework, which currently extends through 2022, Ameren Illinois’electric distribution service rates are subject to an annual revenue requirementreconciliation to its actual recoverable costs. Each year, Ameren Illinoisrecords a regulatory asset or a regulatory liability and a correspondingincrease or decrease to operating revenues for any differences between therevenue requirement reflected in customer rates for that year and its estimateof the probable increase or decrease in the revenue requirement expected toultimately be approved by the ICC based on that year's actual recoverablecosts incurred. As of December 31, 2016 , Ameren Illinois had recordedregulatory assets of $23 million and $68 million , including interest, to reflectits expected 2016 and the 2015 approved revenue requirement reconciliationadjustments, respectively. As of December 31, 2015 , Ameren Illinois hadrecorded a $103 million regulatory asset to reflect its approved 2014 revenuerequirement reconciliation adjustment, which was collected, with interest,from customers during 2016.
In December 2016, the ICC issued an order in Ameren Illinois’ annualupdate filing approving a $14 million decrease in Ameren Illinois’ electricdelivery service revenue requirement beginning in January 2017. This updatereflects an increase to the annual formula rate based on 2015 actualrecoverable costs and expected net plant additions for 2016, an increase toinclude the 2015 revenue requirement reconciliation adjustment, which wasinitially recorded as a regulatory asset in 2015, and a decrease for theconclusion of the 2014 revenue requirement reconciliation adjustment, whichwas fully collected from customers in 2016.
FEJA
The FEJA revised certain portions of the IEIMA, including extending theIEIMA formula ratemaking process through 2022 and clarifying that acommon equity ratio of up to and including 50% is prudent. Also, beginningin 2017, the FEJA decouples electric distribution revenues established in arate proceeding from actual sales volumes by providing that any revenuechanges driven by actual electric distribution sales volumes differing from
sales volumes reflected in that year's rates will be collected from or refundedto customers within two years. This portion of the law extends beyond the endof the IEIMA in 2022. Through 2022, revenue differences will be included inthe annual IEIMA revenue requirement reconciliation. Additionally, this lawcreates a customer surcharge relating to certain nuclear energy centers locatedin Illinois that, like the cost of power purchased by Ameren Illinois on behalfof its customers, will be passed through to electric distribution customers withno effect on Ameren Illinois' earnings.
Beginning as early as June 2017, the FEJA will allow Ameren Illinois toearn a return on its electric energy efficiency program investments. AmerenIllinois electric energy efficiency investments will be deferred as a regulatoryasset and will earn a return at the company’s weighted average cost of capital,with the equity return based on the monthly average yield of the 30-yearUnited States Treasury bonds plus 580 basis points. The equity portion ofAmeren Illinois’ return on electric energy efficiency investments can also beincreased or decreased by 200 basis points based on the achievement ofannual energy savings goals. The FEJA increased the level of electric energyefficiency saving targets through 2030. Based on a formula provided in theact, Ameren Illinois estimates it can annually invest up to $100 million from2018 through 2021, up to $107 million annually from 2022 through 2025, andup to $114 million annually from 2026 through 2030. The ICC has the abilityto lower the electric energy efficiency saving goals if there are insufficientcost effective measures available. The electric energy efficiency programinvestments and the return on those investments will be recovered through arider, and will not be included in the IEIMA formula rate process.
Federal
FERC Complaint Cases
In November 2013, a customer group filed a complaint case with theFERC seeking a reduction in the allowed base return on common equity forFERC-regulated transmission rate base under the MISO tariff from 12.38% to9.15% . In September 2016, the FERC issued a final order in the November2013 complaint case which lowered the allowed base return on commonequity to 10.32%, or a 10.82% total return on common equity with theinclusion of the 50 basis point incentive adder for participation in an RTO.The order was consistent with the initial decision an administrative law judgeissued in December 2015, and requires customer refunds, with interest, to beissued for the 15-month period ended February 2015. In addition, the newallowed return on common equity is reflected in rates prospectively from theSeptember 2016 effective date of the order. Refunds for the November 2013complaint case are expected to be issued in the first half of 2017.
As the maximum FERC-allowed refund period for the November 2013complaint case ended in February 2015, another customer complaint case wasfiled in February 2015. The February 2015 complaint case seeks a reductionin the allowed base return on common equity for the FERC-regulated
92

Table of Contents
transmission rate base under the MISO tariff to 8.67% . In June 2016, anadministrative law judge issued an initial decision in the February 2015complaint case, which if approved by FERC, would lower the allowed basereturn on common equity to 9.70%, or a 10.20% total return on equity withthe inclusion of the 50 basis point incentive adder for participation in an RTO.It would also require the issuance of customer refunds, with interest, for the15-month period ended May 2016. The FERC is expected to issue a finalorder in the February 2015 complaint case in the second quarter of 2017. Thatfinal order will determine the allowed return on common equity for the 15-month period ended May 2016. That final order will also establish the allowedreturn on common equity that will apply prospectively from its expectedsecond quarter 2017 effective date, replacing the current 10.82% total returnon common equity, which became effective in September 2016. The 12.38%allowed return on common equity was effective for the period that began atthe conclusion of the 15-month period for the February 2015 complaint casein May 2016 through the September 2016 effective date of the final order inthe November 2013 complaint case.
Beginning with the January 2015 effective date, the RTO participationincentive adder reduces any refund to customers relating to a reduction of theallowed base return on common equity from the complaint cases discussedabove and has been applied prospectively from the effective date of theSeptember 2016 FERC order, resulting in a current allowed return oncommon equity of 10.82% .
As of December 31, 2016 , Ameren and Ameren Illinois
recorded current regulatory liabilities of $62 million and $42 million ,respectively, to reflect the expected refunds, including interest, associatedwith the reduced allowed returns on common equity in the September 2016FERC order and the initial decision in the February 2015 complaint case.Ameren Missouri does not expect that a reduction in the FERC-allowed basereturn on common equity would be material to its results of operations,financial position, or liquidity.
Combined Construction and Operating License
In 2008, Ameren Missouri filed an application with the NRC for a COLfor a second nuclear unit at Ameren Missouri's existing Callaway County,Missouri, energy center site. In 2009, Ameren Missouri suspended its effortsto build a second nuclear unit at its existing Callaway site, and the NRCsuspended review of the COL application. Prior to suspending its efforts,Ameren Missouri had capitalized $69 million related to the project. Primarilybecause of changes in vendor support for licensing efforts at the NRC,Ameren Missouri’s assessment of long-term capacity needs, declining costs ofalternative generation technologies, and the regulatory framework inMissouri, Ameren Missouri discontinued its efforts to license and build asecond nuclear unit at its existing Callaway site. As a result of this decision,in 2015, Ameren and Ameren Missouri recognized a $69 million noncashpretax provision for all of the previously capitalized COL costs. AmerenMissouri has withdrawn its COL application with the NRC.
Regulatory Assets and Liabilities
In accordance with authoritative accounting guidance regarding accounting for the effects of certain types of regulation, we defer certain costs as regulatoryassets pursuant to actions of regulators or because we expect to recover such costs in rates charged to customers. We may also defer certain amounts as regulatoryliabilities because of actions of regulators or because we expect that such amounts will be returned to customers in future rates. The following table presents ourregulatory assets and regulatory liabilities at December 31, 2016 and 2015 :
93

Table of Contents
2016 2015
AmerenMissouri
AmerenIllinois Ameren
AmerenMissouri
AmerenIllinois Ameren
Current regulatory assets:
Under-recovered FAC (a)(b) $ 21 $ — $ 21 $ 37 $ — $ 37
Under-recovered Illinois electric power costs (c) — 3 3 — 3 3
Under-recovered PGA (c) — 4 4 — 8 8
MTM derivative losses (d) 9 15 24 29 45 74
Energy efficiency riders (e) 5 — 5 23 — 23
IEIMA revenue requirement reconciliation adjustment (a)(f) — 68 68 — 103 103
FERC revenue requirement reconciliation adjustment (a)(g) — 7 13 — 8 12VBA rider (a)(h) — 11 11 — — —
Total current regulatory assets $ 35 $ 108 $ 149 $ 89 $ 167 $ 260Noncurrent regulatory assets:
Pension and postretirement benefit costs (i) $ 175 $ 319 $ 494 $ 95 $ 202 $ 297
Income taxes (j) 229 1 230 247 4 251
Uncertain tax positions tracker (a)(k) 7 — 7 7 — 7
ARO (l) — 3 3 — 4 4
Callaway costs (a)(m) 29 — 29 32 — 32
Unamortized loss on reacquired debt (a)(n) 65 59 124 69 69 138
Environmental cost riders (o) — 196 196 — 230 230
MTM derivative losses (d) 9 178 187 15 175 190
Storm costs (a)(p) — 15 15 — 9 9
Demand-side costs before the MEEIA implementation (a)(q) 18 — 18 31 — 31
Workers’ compensation claims (r) 6 7 13 6 7 13
Credit facilities fees (s) 4 — 4 4 — 4
Construction accounting for pollution control equipment (a)(t) 19 — 19 20 — 20
Solar rebate program (a)(u) 49 — 49 74 — 74
IEIMA revenue requirement reconciliation adjustment (a)(f) — 23 23 — 62 62
FERC revenue requirement reconciliation adjustment (a)(g) — 8 10 — 5 11
Other 9 7 16 5 4 9Total noncurrent regulatory assets $ 619 $ 816 $ 1,437 $ 605 $ 771 $ 1,382Current regulatory liabilities:
Over-recovered FAC (b) $ — $ — $ — $ 9 $ — $ 9
Over-recovered Illinois electric power costs (c) — 25 25 — 6 6
Over-recovered PGA (c) — — — 3 — 3
MTM derivative gains (d) 12 11 23 16 1 17
Estimated refund for FERC complaint cases (v) — 42 62 — 32 45Total current regulatory liabilities $ 12 $ 78 $ 110 $ 28 $ 39 $ 80Noncurrent regulatory liabilities:
Income taxes (w) $ 33 $ 4 $ 37 $ 36 $ 6 $ 42
Uncertain tax positions tracker (k) 3 — 3 6 — 6
Asset removal costs (x) 970 697 1,669 933 671 1,605
ARO (l) 162 — 162 167 — 167
Bad debt rider (y) — 3 3 — 6 6
Pension and postretirement benefit costs tracker (z) 35 — 35 19 — 19
Energy efficiency riders (e) — 45 45 — 36 36
Renewable energy credits (aa) — 15 15 — 12 12
Storm tracker (ab) 7 — 7 9 — 9
Other 5 4 9 2 1 3Total noncurrent regulatory liabilities $ 1,215 $ 768 $ 1,985 $ 1,172 $ 732 $ 1,905
(a) These assets earn a return.(b) Under-recovered or over-recovered fuel costs to be recovered or refunded through the FAC. Specific accumulation periods aggregate the under-recovered or over-recovered costs over
four months, any related adjustments that occur over the following four months, and the recovery from or refund to customers that occurs over the next eight months.

94
Table of Contents
(c) Under-recovered or over-recovered costs from utility customers. Amounts will be recovered from or refunded to customers within one year of the deferral.(d) Deferral of commodity-related derivative MTM losses or gains. See Note 7 – Derivative Financial Instruments for additional information.(e) The Ameren Missouri balance relates to the MEEIA. The MEEIA rider allows Ameren Missouri to collect from or refund to customers any annual difference in the actual amounts
incurred and the amounts collected from customers for the MEEIA program costs, net shared benefits, and the throughput disincentive. Under the MEEIA rider, collections from orrefunds to customers occur one year after the program costs, net shared benefits, and the throughput disincentive are incurred. The Ameren Illinois balance relates to a regulatory trackingmechanism to recover its electric and natural gas costs associated with developing, implementing, and evaluating customer energy efficiency and demand response programs. Any under-recovery or over-recovery will be collected from or refunded to customers over the year following the plan year.
(f) The difference between Ameren Illinois' annual revenue requirement calculated under the IEIMA's performance-based formula ratemaking framework and the revenue requirementincluded in customer rates for that year. The under-recovery will be recovered from or refunded to customers with interest within two years.
(g) Ameren Illinois' and ATXI's annual revenue requirement reconciliation calculated pursuant to the FERC's electric transmission formula ratemaking framework. The under-recovery orover-recovery will be recovered from or refunded to customers within two years.
(h) Under-recovered natural gas sales volumes, including deviations from normal weather conditions. Each year's amount will be recovered from or refunded to customers from Aprilthrough December of the following year.
(i) These costs are being amortized in proportion to the recognition of prior service costs (credits) and actuarial losses (gains) attributable to Ameren’s pension plan and postretirementbenefit plans. See Note 11 – Retirement Benefits for additional information.
(j) Tax benefits related to the equity component of allowance for funds used during construction, as well as the effects of tax rate changes. This amount will be recovered over the expectedlife of the related assets.
(k) The tracker is amortized over three years, beginning from the date the amounts are included in rates. See Note 13 – Income Taxes for additional information.(l) Recoverable or refundable removal costs for AROs, including net realized and unrealized gains and losses related to the nuclear decommissioning trust fund investments. See Note 1 –
Summary of Significant Accounting Policies – Asset Retirement Obligations.(m) Ameren Missouri’s Callaway energy center operations and maintenance expenses, property taxes, and carrying costs incurred between the plant in-service date and the date the plant was
reflected in rates. These costs are being amortized over the remaining life of the energy center's original operating license through 2024.(n) Losses related to reacquired debt. These amounts are being amortized over the lives of the related new debt issuances or the original lives of the old debt issuances if no new debt was
issued.(o) The recoverable portion of accrued environmental site liabilities that will be collected from electric and natural gas customers through ICC-approved cost recovery riders. The period of
recovery will depend on the timing of remediation expenditures. See Note 15 – Commitments and Contingencies for additional information.(p) Storm costs from 2013, 2015, and 2016 deferred in accordance with the IEIMA. These costs are being amortized over five-year periods beginning in the year the storm occurred.(q) Demand-side costs incurred prior to implementation of the MEEIA in 2013, including the costs of developing, implementing, and evaluating customer energy efficiency and demand
response programs. Costs incurred from May 2008 through September 2008 are being amortized over a 10-year period that began in March 2009. Costs incurred from October 2008through December 2009 are being amortized until May 2017. Costs incurred from January 2010 through February 2011 are being amortized over a six-year period that began in August2011. Costs incurred from March 2011 through July 2012 are being amortized over a six-year period that began in January 2013. Costs incurred from August 2012 through December2012 are being amortized over a six-year period that began in June 2015. The February 2017 stipulation and agreement, if approved, would modify these amortization periods.
(r) The period of recovery will depend on the timing of actual expenditures.(s) Ameren Missouri’s costs incurred to enter into and maintain the Missouri Credit Agreement. These costs are being amortized over the life of the credit facility to construction work in
progress, which will be depreciated when assets are placed into service. Additional costs were incurred in December 2016 to amend and restate the Missouri Credit Agreement.(t) The MoPSC’s May 2010 electric rate order allowed Ameren Missouri to record an allowance for funds used during construction for pollution control equipment at its Sioux energy center
until the cost of that equipment was included in customer rates beginning in 2011. These costs are being amortized over the expected life of the Sioux energy center, currently through2033.
(u) Costs associated with Ameren Missouri's solar rebate program to fulfill its renewable energy portfolio requirement. These costs are being amortized over a three-year period that began inJune 2015. The February 2017 stipulation and agreement, if approved, would modify this amortization period.
(v) Estimated refunds to transmission customers related to FERC orders. See FERC Complaint Cases above.(w) Unamortized portion of investment tax credits and reductions to deferred tax liabilities recorded at rates in excess of current statutory rates. The unamortized portion of investment tax
credits and the reduction to deferred tax liabilities are being amortized over the expected life of the underlying assets.(x) Estimated funds collected for the eventual dismantling and removal of plant retired from service, net of salvage value.(y) A regulatory tracking mechanism for the difference between the level of bad debt incurred by Ameren Illinois under GAAP and the level of such costs included in electric and natural gas
rates. The over-recovery relating to 2014 was refunded to customers from June 2015 through May 2016. The over-recovery relating to 2015 is being refunded to customers from June2016 through May 2017. The over-recovery relating to 2016 will be refunded to customers from June 2017 through May 2018.
(z) A regulatory tracking mechanism for the difference between the level of pension and postretirement benefit costs incurred by Ameren Missouri under GAAP and the level of such costsincluded in rates. For periods prior to December 2014, the MoPSC's April 2015 electric rate order directed the amortization to occur over three to five years, beginning in June 2015. Forperiods after December 2014, the amortization period will be determined in the July 2016 electric rate case. The February 2017 stipulation and agreement, if approved, would modifythese amortization periods.
(aa) Funds collected from customers for the purchase of renewable energy credits through IPA procurements for distributed generation. The balance will be amortized as renewable energycredits are purchased.
(ab) A regulatory tracking mechanism at Ameren Missouri for the difference between the level of storm costs incurred in a particular year and the level of such costs included in rates. Forperiods prior to December 2014, the MoPSC's April 2015 electric rate order directed the amortization to occur over a five-year period that began in June 2015. For periods afterDecember 2014, the amortization period will be determined in the July 2016 electric rate case. The April 2015 MoPSC order did not approve the continued use of the storm costregulatory tracking mechanism. The February 2017 stipulation and agreement, if approved, would modify these amortization periods.
Ameren, Ameren Missouri, and Ameren Illinois continually assess the recoverability of their regulatory assets. Regulatory assets are charged to earnings whenit is no longer probable that such amounts will be recovered through future revenues. To the extent that payments of regulatory liabilities are no longer probable,the amounts are credited to earnings.
95
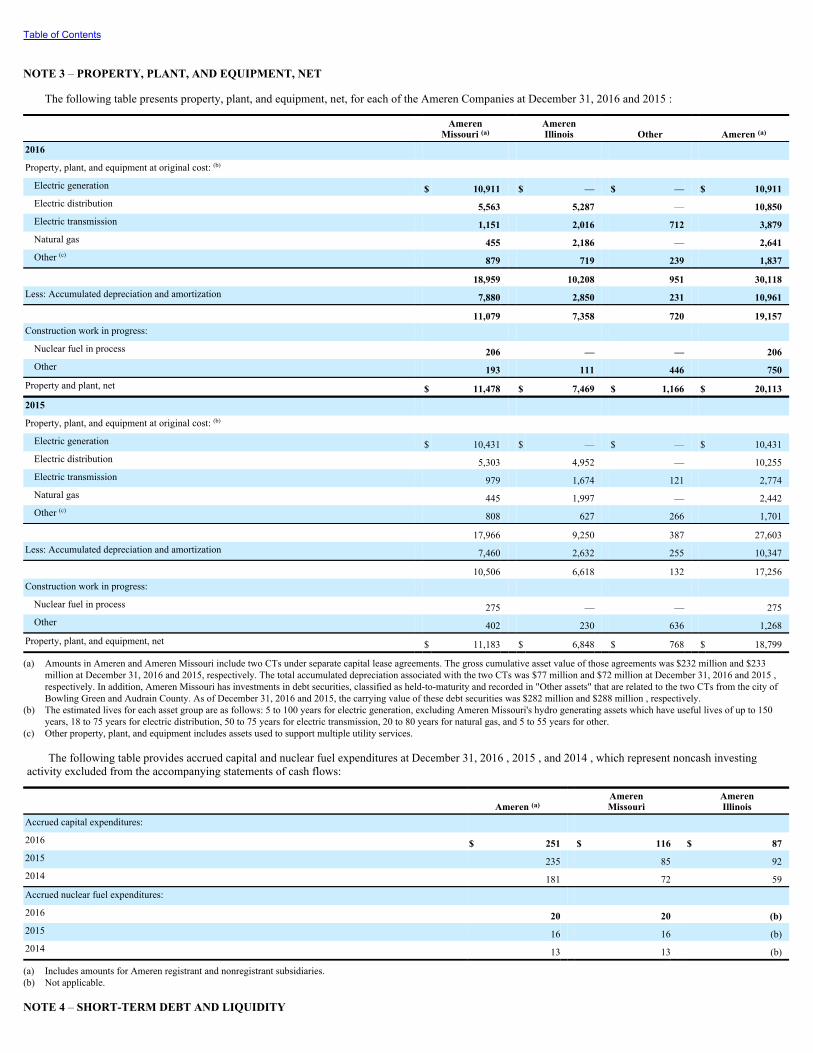
Table of Contents
NOTE 3 – PROPERTY, PLANT, AND EQUIPMENT, NET
The following table presents property, plant, and equipment, net, for each of the Ameren Companies at December 31, 2016 and 2015 :
Ameren
Missouri (a) AmerenIllinois Other Ameren (a)
2016 Property, plant, and equipment at original cost: (b) Electric generation $ 10,911 $ — $ — $ 10,911Electric distribution 5,563 5,287 — 10,850Electric transmission 1,151 2,016 712 3,879Natural gas 455 2,186 — 2,641Other (c) 879 719 239 1,837
18,959 10,208 951 30,118Less: Accumulated depreciation and amortization 7,880 2,850 231 10,961
11,079 7,358 720 19,157Construction work in progress: Nuclear fuel in process 206 — — 206Other 193 111 446 750
Property and plant, net $ 11,478 $ 7,469 $ 1,166 $ 20,1132015 Property, plant, and equipment at original cost: (b) Electric generation $ 10,431 $ — $ — $ 10,431Electric distribution 5,303 4,952 — 10,255Electric transmission 979 1,674 121 2,774Natural gas 445 1,997 — 2,442Other (c) 808 627 266 1,701
17,966 9,250 387 27,603Less: Accumulated depreciation and amortization 7,460 2,632 255 10,347
10,506 6,618 132 17,256Construction work in progress: Nuclear fuel in process 275 — — 275Other 402 230 636 1,268
Property, plant, and equipment, net $ 11,183 $ 6,848 $ 768 $ 18,799
(a) Amounts in Ameren and Ameren Missouri include two CTs under separate capital lease agreements. The gross cumulative asset value of those agreements was $232 million and $233million at December 31, 2016 and 2015, respectively. The total accumulated depreciation associated with the two CTs was $77 million and $72 million at December 31, 2016 and 2015 ,respectively. In addition, Ameren Missouri has investments in debt securities, classified as held-to-maturity and recorded in "Other assets" that are related to the two CTs from the city ofBowling Green and Audrain County. As of December 31, 2016 and 2015, the carrying value of these debt securities was $282 million and $288 million , respectively.
(b) The estimated lives for each asset group are as follows: 5 to 100 years for electric generation, excluding Ameren Missouri's hydro generating assets which have useful lives of up to 150years, 18 to 75 years for electric distribution, 50 to 75 years for electric transmission, 20 to 80 years for natural gas, and 5 to 55 years for other.
(c) Other property, plant, and equipment includes assets used to support multiple utility services.
The following table provides accrued capital and nuclear fuel expenditures at December 31, 2016 , 2015 , and 2014 , which represent noncash investingactivity excluded from the accompanying statements of cash flows:
Ameren (a) AmerenMissouri
AmerenIllinois
Accrued capital expenditures: 2016 $ 251 $ 116 $ 872015 235 85 922014 181 72 59Accrued nuclear fuel expenditures: 2016 20 20 (b)2015 16 16 (b)2014 13 13 (b)
(a) Includes amounts for Ameren registrant and nonregistrant subsidiaries.(b) Not applicable.
NOTE 4 – SHORT-TERM DEBT AND LIQUIDITY

96

Table of Contents
The liquidity needs of the Ameren Companies are typically supportedthrough the use of available cash, drawings under committed creditagreements, commercial paper issuances, or in the case of Ameren Missouriand Ameren Illinois, short-term intercompany borrowings.
Credit Agreements
In December 2016, the Credit Agreements were amended and restated.The amended and restated agreements, among other things, extended thematurity dates of the Credit Agreements and provide $2.1 billion of creditthrough the extended maturity date. The Credit Agreements, which werepreviously scheduled to mature in December 2019, are now scheduled tomature in December 2021. The maturity date may be extended for twoadditional one-year periods upon mutual consent of the borrowers andlenders. Credit available under the agreements is provided by 22 international,national, and regional lenders, with no single lender providing more than $118million of credit in aggregate.
The obligations of each borrower under the respective Credit Agreementsto which it is a party are several and not joint. Except under limitedcircumstances relating to expenses and indemnities, the obligations ofAmeren Missouri and Ameren Illinois under the respective Credit Agreementsare not guaranteed by Ameren or any other subsidiary of Ameren. Thefollowing table presents the maximum aggregate amount available to eachborrower under each facility (the amount being each borrower's "BorrowingSublimit"):
Missouri Credit
AgreementIllinois
Credit Agreement
Ameren $ 700 $ 500
Ameren Missouri 800 (a)
Ameren Illinois (a) 800
(a) Not applicable.
The borrowers have the option to seek additional commitments fromexisting or new lenders to increase the total facility size of the CreditAgreements to a maximum of $1.2 billion for the Missouri Credit Agreementand $1.3 billion for the Illinois Credit Agreement. Ameren borrowings are dueand payable no
later than the maturity date of the Credit Agreement. Ameren Missouri andAmeren Illinois borrowings under the applicable Credit Agreement are dueand payable no later than the earlier of the maturity date or 364 days after theoriginating date of the borrowing.
The obligations of the borrowers under the Credit Agreements areunsecured. Loans are available on a revolving basis under each of the CreditAgreements. Funds borrowed may be repaid and, subject to satisfaction of theconditions to borrowing, reborrowed from time to time. At the election ofeach borrower, the interest rates on such loans will be the alternate base rateplus the margin applicable to the particular borrower and/or the eurodollarrate plus the margin applicable to the particular borrower. The applicablemargins will be determined by the borrower's long-term unsecured creditratings or, if no such ratings are in effect, the borrower's corporate/issuerratings then in effect. The borrowers have received commitments from thelenders to issue letters of credit up to $ 100 million under each of the CreditAgreements. In addition, the issuance of letters of credit is subject to the $2.1billion overall combined facility borrowing limitations of the CreditAgreements.
The borrowers will use the proceeds from any borrowings under theCredit Agreements for general corporate purposes, including working capital,commercial paper liquidity support, issuance of letters of credit, loan fundingunder the Ameren money pool arrangements, and other short-termintercompany loan arrangements. Both of the Credit Agreements are availableto Ameren to support issuances under Ameren's commercial paper program,subject to borrowing sublimits. The Missouri Credit Agreement and theIllinois Credit Agreement are available to support issuances under Ameren(parent)'s, Ameren Missouri's and Ameren Illinois' commercial paperprograms, respectively. As of December 31, 2016 , based on commercialpaper outstanding and letters of credit issued under the Credit Agreements,the aggregate amount of credit capacity available to Ameren (parent), AmerenMissouri, and Ameren Illinois, collectively, was $1.5 billion .
Ameren, Ameren Missouri, and Ameren Illinois did not borrow under theCredit Agreements for the years ended December 31, 2016 and 2015 .
Commercial Paper
The following table summarizes the borrowing activity and relevant interest rates under Ameren (parent)'s, Ameren Missouri's and Ameren Illinois'commercial paper programs for the years ended December 31, 2016 and 2015 :
97
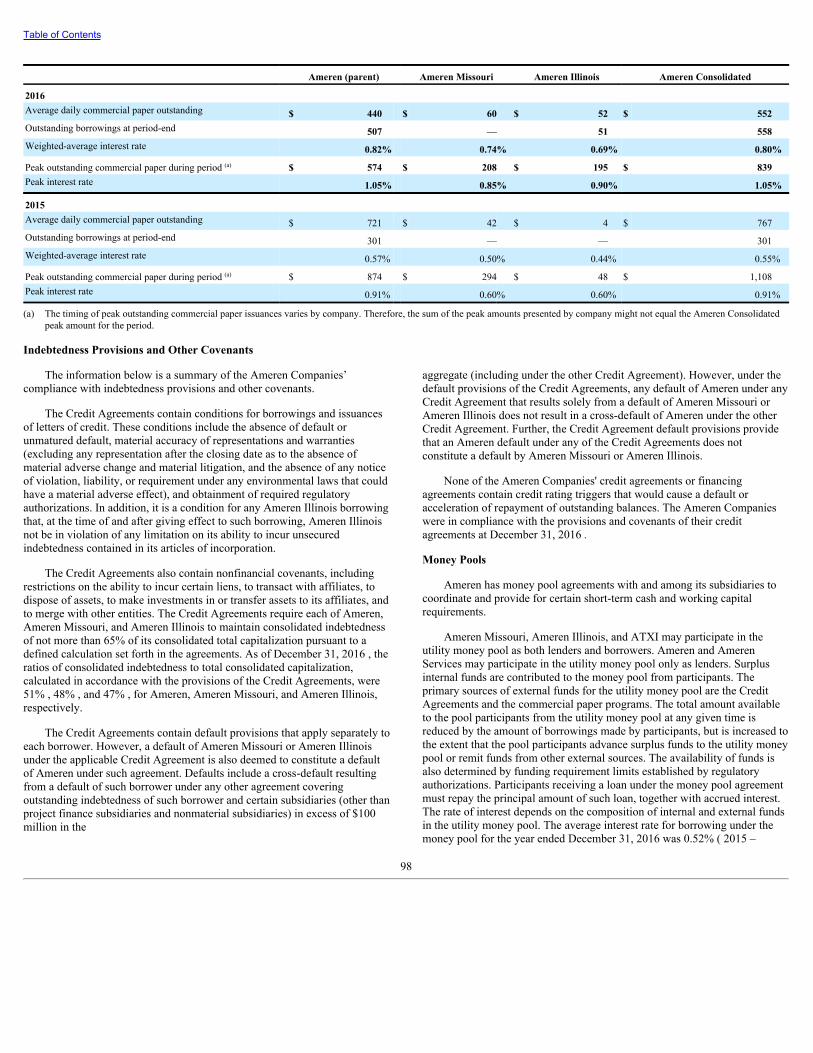
Table of Contents
Ameren (parent) Ameren Missouri Ameren Illinois Ameren Consolidated
2016 Average daily commercial paper outstanding $ 440 $ 60 $ 52 $ 552Outstanding borrowings at period-end 507 — 51 558Weighted-average interest rate 0.82% 0.74% 0.69% 0.80%
Peak outstanding commercial paper during period (a) $ 574 $ 208 $ 195 $ 839Peak interest rate 1.05% 0.85% 0.90% 1.05%
2015 Average daily commercial paper outstanding $ 721 $ 42 $ 4 $ 767Outstanding borrowings at period-end 301 — — 301Weighted-average interest rate 0.57% 0.50% 0.44% 0.55%
Peak outstanding commercial paper during period (a) $ 874 $ 294 $ 48 $ 1,108Peak interest rate 0.91% 0.60% 0.60% 0.91%
(a) The timing of peak outstanding commercial paper issuances varies by company. Therefore, the sum of the peak amounts presented by company might not equal the Ameren Consolidatedpeak amount for the period.
Indebtedness Provisions and Other Covenants
The information below is a summary of the Ameren Companies’compliance with indebtedness provisions and other covenants.
The Credit Agreements contain conditions for borrowings and issuancesof letters of credit. These conditions include the absence of default orunmatured default, material accuracy of representations and warranties(excluding any representation after the closing date as to the absence ofmaterial adverse change and material litigation, and the absence of any noticeof violation, liability, or requirement under any environmental laws that couldhave a material adverse effect), and obtainment of required regulatoryauthorizations. In addition, it is a condition for any Ameren Illinois borrowingthat, at the time of and after giving effect to such borrowing, Ameren Illinoisnot be in violation of any limitation on its ability to incur unsecuredindebtedness contained in its articles of incorporation.
The Credit Agreements also contain nonfinancial covenants, includingrestrictions on the ability to incur certain liens, to transact with affiliates, todispose of assets, to make investments in or transfer assets to its affiliates, andto merge with other entities. The Credit Agreements require each of Ameren,Ameren Missouri, and Ameren Illinois to maintain consolidated indebtednessof not more than 65% of its consolidated total capitalization pursuant to adefined calculation set forth in the agreements. As of December 31, 2016 , theratios of consolidated indebtedness to total consolidated capitalization,calculated in accordance with the provisions of the Credit Agreements, were51% , 48% , and 47% , for Ameren, Ameren Missouri, and Ameren Illinois,respectively.
The Credit Agreements contain default provisions that apply separately toeach borrower. However, a default of Ameren Missouri or Ameren Illinoisunder the applicable Credit Agreement is also deemed to constitute a defaultof Ameren under such agreement. Defaults include a cross-default resultingfrom a default of such borrower under any other agreement coveringoutstanding indebtedness of such borrower and certain subsidiaries (other thanproject finance subsidiaries and nonmaterial subsidiaries) in excess of $100million in the
aggregate (including under the other Credit Agreement). However, under thedefault provisions of the Credit Agreements, any default of Ameren under anyCredit Agreement that results solely from a default of Ameren Missouri orAmeren Illinois does not result in a cross-default of Ameren under the otherCredit Agreement. Further, the Credit Agreement default provisions providethat an Ameren default under any of the Credit Agreements does notconstitute a default by Ameren Missouri or Ameren Illinois.
None of the Ameren Companies' credit agreements or financingagreements contain credit rating triggers that would cause a default oracceleration of repayment of outstanding balances. The Ameren Companieswere in compliance with the provisions and covenants of their creditagreements at December 31, 2016 .
Money Pools
Ameren has money pool agreements with and among its subsidiaries tocoordinate and provide for certain short-term cash and working capitalrequirements.
Ameren Missouri, Ameren Illinois, and ATXI may participate in theutility money pool as both lenders and borrowers. Ameren and AmerenServices may participate in the utility money pool only as lenders. Surplusinternal funds are contributed to the money pool from participants. Theprimary sources of external funds for the utility money pool are the CreditAgreements and the commercial paper programs. The total amount availableto the pool participants from the utility money pool at any given time isreduced by the amount of borrowings made by participants, but is increased tothe extent that the pool participants advance surplus funds to the utility moneypool or remit funds from other external sources. The availability of funds isalso determined by funding requirement limits established by regulatoryauthorizations. Participants receiving a loan under the money pool agreementmust repay the principal amount of such loan, together with accrued interest.The rate of interest depends on the composition of internal and external fundsin the utility money pool. The average interest rate for borrowing under themoney pool for the year ended December 31, 2016 was 0.52% ( 2015 –
98

Table of Contents
0.11% ).
See Note 14 – Related Party Transactions for the amount of interestincome and expense from the money pool arrangements recorded by theAmeren Companies for the years ended
December 31, 2016 , 2015 , and 2014 .
NOTE 5 – LONG-TERM DEBT AND EQUITY FINANCINGS
The following table presents long-term debt outstanding, including maturities due within one year, for the Ameren Companies as of December 31, 2016 and2015 :
2016 2015Ameren (Parent): 2.70% Senior unsecured notes due 2020 $ 350 $ 3503.65% Senior unsecured notes due 2026 350 350
Total long-term debt, gross 700 700Less: Unamortized debt issuance costs (6) (6)
Long-term debt, net $ 694 $ 694Ameren Missouri:
Senior secured notes: (a) 5.40% Senior secured notes due 2016 — 2606.40% Senior secured notes due 2017 425 425
6.00% Senior secured notes due 2018 (b) 179 1795.10% Senior secured notes due 2018 199 199
6.70% Senior secured notes due 2019 (b) 329 3295.10% Senior secured notes due 2019 244 2445.00% Senior secured notes due 2020 85 853.50% Senior secured notes due 2024 350 3505.50% Senior secured notes due 2034 184 1845.30% Senior secured notes due 2037 300 3008.45% Senior secured notes due 2039 (b) 350 3503.90% Senior secured notes due 2042 (b) 485 4853.65% Senior secured notes due 2045 400 250
Environmental improvement and pollution control revenue bonds:
1992 Series due 2022 (c)(d) 47 47
1993 5.45% Series due 2028 (e) (e) (e)
1998 Series A due 2033 (c)(d) 60 60
1998 Series B due 2033 (c)(d) 50 50
1998 Series C due 2033 (c)(d) 50 50Capital lease obligations: City of Bowling Green capital lease (Peno Creek CT) due 2022 42 48Audrain County capital lease (Audrain County CT) due 2023 240 240
Total long-term debt, gross 4,019 4,135Less: Unamortized discount and premium (6) (6)Less: Unamortized debt issuance costs (19) (19)Less: Maturities due within one year (431) (266)
Long-term debt, net $ 3,563 $ 3,844
99

Table of Contents
2016 2015Ameren Illinois: Senior secured notes:
6.20% Senior secured notes due 2016 $ — $ 54
6.25% Senior secured notes due 2016 — 75
6.125% Senior secured notes due 2017 (g)(h) 250 250
6.25% Senior secured notes due 2018 (g)(h) 144 144
9.75% Senior secured notes due 2018 (g)(h) 313 313
2.70% Senior secured notes due 2022 (g)(h) 400 400
3.25% Senior secured notes due 2025 (g) 300 300
6.125% Senior secured notes due 2028 (g) 60 60
6.70% Senior secured notes due 2036 (g) 61 61
6.70% Senior secured notes due 2036 (f) 42 424.80% Senior secured notes due 2043 (g) 280 2804.30% Senior secured notes due 2044 (g) 250 2504.15% Senior secured notes due 2046 (g) 490 250
Environmental improvement and pollution control revenue bonds:
5.90% Series 1993 due 2023 (i) (i) (i)
5.70% 1994A Series due 2024 (j) (j) (j)
1993 Series B-1 due 2028 (d)(k) 17 17Total long-term debt, gross 2,607 2,496Less: Unamortized discount and premium — (7)Less: Unamortized debt issuance costs (19) (18)Less: Maturities due within one year (250) (129)
Long-term debt, net $ 2,338 $ 2,342Ameren consolidated long-term debt, net $ 6,595 $ 6,880
(a) These notes are collaterally secured by first mortgage bonds issued by Ameren Missouri under the Ameren Missouri mortgage indenture. The notes have a fall-away lien provision and willremain secured only as long as any first mortgage bonds issued under the Ameren Missouri mortgage indenture remain outstanding. Redemption, purchase, or maturity of all first mortgagebonds, including first mortgage bonds currently outstanding and any that may be issued in the future, would result in a release of the first mortgage bonds currently securing these notes, atwhich time these notes would become unsecured obligations. Considering the Ameren Missouri senior secured notes currently outstanding, we do not expect the first mortgage bond lienprotection associated with these notes to fall away before 2042.
(b) Ameren Missouri has agreed that so long as any of the 3.90% senior secured notes due 2042 are outstanding, Ameren Missouri will not permit a release date to occur, and so long as any ofthe 6.70% senior secured notes due 2019, 6.00% senior secured notes due 2018, and 8.45% senior secured notes due 2039 are outstanding, Ameren Missouri will not optionally redeem,purchase, or otherwise retire in full the outstanding first mortgage bonds not subject to release provisions.
(c) These bonds are collaterally secured by first mortgage bonds issued by Ameren Missouri under the Ameren Missouri mortgage indenture and have a fall-away lien provision similar to thatof Ameren Missouri's senior secured notes. The bonds are also backed by an insurance guarantee policy.
(d) The interest rates and the periods during which such rates apply vary depending on our selection of defined rate modes. Maximum interest rates could reach 18% , depending on the seriesof bonds. The bonds are callable at 100% of par value. The average interest rates for 2016 and 2015 were as follows:
2016 2015Ameren Missouri 1992 Series due 2022 0.66% 0.06%
Ameren Missouri 1998 Series A due 2033 0.91% 0.24%
Ameren Missouri 1998 Series B due 2033 0.92% 0.24%
Ameren Missouri 1998 Series C due 2033 0.97% 0.24%
Ameren Illinois 1993 Series B-1 due 2028 0.70% 0.49%
(e) These bonds are first mortgage bonds issued by Ameren Missouri under the Ameren Missouri mortgage bond indenture and are secured by substantially all Ameren Missouri property andfranchises. The bonds are callable at 100% of par value. Less than $1 million principal amount of the bonds remain outstanding.
(f) These notes are collaterally secured by first mortgage bonds issued by Ameren Illinois under its 1933 mortgage indenture. The notes have a fall-away lien provision, and Ameren Illinoiscould cause these notes to become unsecured at any time by redeeming the pollution control bonds 5.90% Series 1993 due 2023 (of which less than $1 million remains outstanding).
(g) These notes are collaterally secured by mortgage bonds issued by Ameren Illinois under its 1992 mortgage indenture. They are secured by substantially all property of the former IP andCIPS. The notes have a fall-away lien provision and will remain secured only as long as any series of first mortgage bonds issued under its 1992 mortgage indenture remain outstanding.Redemption, purchase, or maturity of all mortgage bonds, including first mortgage bonds currently outstanding and any that may be issued in the future, would result in a release of themortgage bonds currently securing these notes, at which time these notes would become unsecured obligations. Considering the Ameren Illinois senior secured notes currently outstanding,we do not expect the mortgage bond lien protection associated with these notes to fall away before 2022.
(h) Ameren Illinois has agreed that so long as any of the 2.70% senior secured notes due 2022 are outstanding, Ameren Illinois will not permit a release date to occur, and so long as any of the9.75% senior secured notes due 2018, 6.25% senior secured notes due 2018, and 6.125% senior secured notes due 2017 are outstanding, Ameren Illinois will not optionally redeem,purchase or otherwise retire in full the outstanding first mortgage bonds not subject to release provisions; therefore, a release date will not occur so long as any of these notes remainoutstanding.
(i) These bonds are first mortgage bonds issued by Ameren Illinois under its 1933 mortgage indenture. They are secured by substantially all property of the former CILCO. The bonds arecallable at 100% of par value. Less than $1 million principal amount of the bonds remain outstanding.
(j) These bonds are mortgage bonds issued by Ameren Illinois under its 1992 mortgage indenture. They are secured by substantially all property of the former IP and CIPS. The bonds arecallable at 100% of par value. The bonds are also backed by an insurance guarantee policy. Less than $1 million principal amount of the bonds remains outstanding.

100
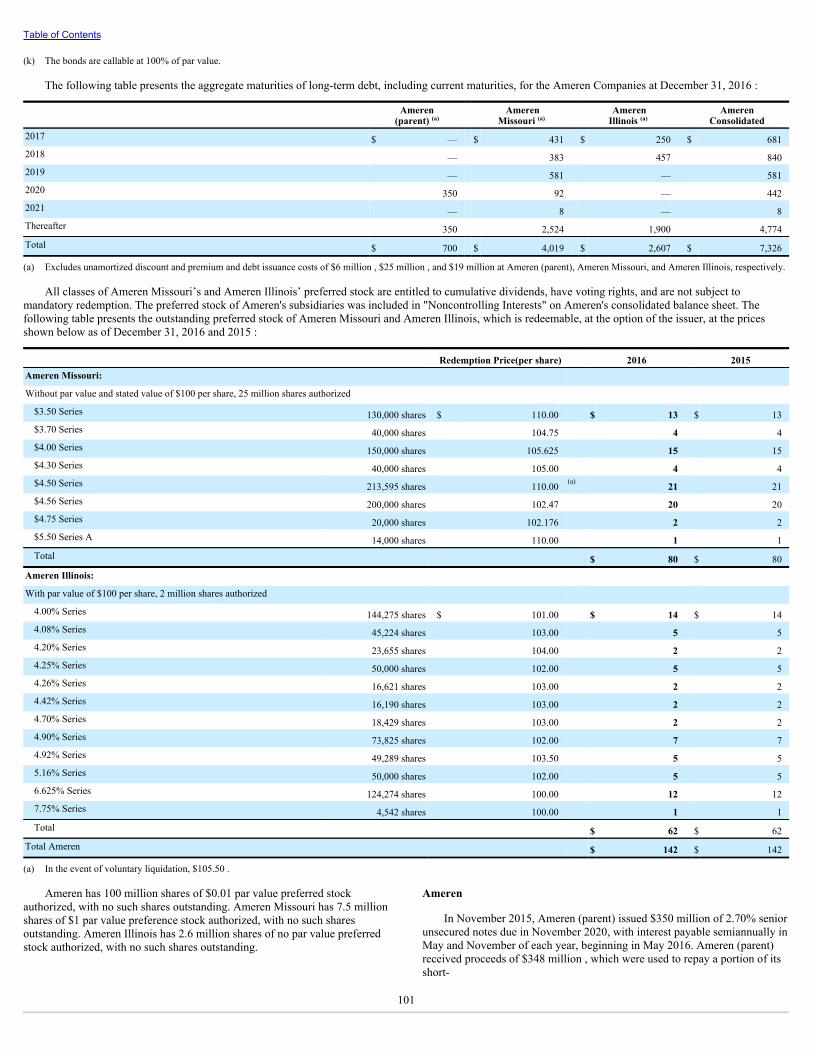
Table of Contents
(k) The bonds are callable at 100% of par value.
The following table presents the aggregate maturities of long-term debt, including current maturities, for the Ameren Companies at December 31, 2016 :
Ameren
(parent) (a) Ameren
Missouri (a) AmerenIllinois (a)
AmerenConsolidated
2017 $ — $ 431 $ 250 $ 6812018 — 383 457 8402019 — 581 — 5812020 350 92 — 4422021 — 8 — 8Thereafter 350 2,524 1,900 4,774Total $ 700 $ 4,019 $ 2,607 $ 7,326
(a) Excludes unamortized discount and premium and debt issuance costs of $6 million , $25 million , and $19 million at Ameren (parent), Ameren Missouri, and Ameren Illinois, respectively.
All classes of Ameren Missouri’s and Ameren Illinois’ preferred stock are entitled to cumulative dividends, have voting rights, and are not subject tomandatory redemption. The preferred stock of Ameren's subsidiaries was included in "Noncontrolling Interests" on Ameren's consolidated balance sheet. Thefollowing table presents the outstanding preferred stock of Ameren Missouri and Ameren Illinois, which is redeemable, at the option of the issuer, at the pricesshown below as of December 31, 2016 and 2015 :
Redemption Price(per share) 2016 2015Ameren Missouri: Without par value and stated value of $100 per share, 25 million shares authorized $3.50 Series 130,000 shares $ 110.00 $ 13 $ 13$3.70 Series 40,000 shares 104.75 4 4$4.00 Series 150,000 shares 105.625 15 15$4.30 Series 40,000 shares 105.00 4 4$4.50 Series 213,595 shares 110.00 (a) 21 21$4.56 Series 200,000 shares 102.47 20 20$4.75 Series 20,000 shares 102.176 2 2$5.50 Series A 14,000 shares 110.00 1 1Total $ 80 $ 80
Ameren Illinois: With par value of $100 per share, 2 million shares authorized 4.00% Series 144,275 shares $ 101.00 $ 14 $ 144.08% Series 45,224 shares 103.00 5 54.20% Series 23,655 shares 104.00 2 24.25% Series 50,000 shares 102.00 5 54.26% Series 16,621 shares 103.00 2 24.42% Series 16,190 shares 103.00 2 24.70% Series 18,429 shares 103.00 2 24.90% Series 73,825 shares 102.00 7 74.92% Series 49,289 shares 103.50 5 55.16% Series 50,000 shares 102.00 5 56.625% Series 124,274 shares 100.00 12 127.75% Series 4,542 shares 100.00 1 1Total $ 62 $ 62
Total Ameren $ 142 $ 142
(a) In the event of voluntary liquidation, $105.50 .
Ameren has 100 million shares of $0.01 par value preferred stockauthorized, with no such shares outstanding. Ameren Missouri has 7.5 millionshares of $1 par value preference stock authorized, with no such sharesoutstanding. Ameren Illinois has 2.6 million shares of no par value preferredstock authorized, with no such shares outstanding.
Ameren
In November 2015, Ameren (parent) issued $350 million of 2.70% seniorunsecured notes due in November 2020, with interest payable semiannually inMay and November of each year, beginning in May 2016. Ameren (parent)received proceeds of $348 million , which were used to repay a portion of itsshort-
101

Table of Contents
term debt.
In November 2015, Ameren (parent) issued $350 million of 3.65% seniorunsecured notes due in February 2026, with interest payable semiannually inFebruary and August of each year, beginning in February 2016. Ameren(parent) received proceeds of $347 million , which were used to repay aportion of its short-term debt.
In 2015, Ameren, Ameren Missouri, and Ameren Illinois filed a Form S-3 shelf registration statement registering the issuance of an indeterminateamount of certain types of securities. The registration statement becameeffective immediately upon filing and will expire in June 2018.
Ameren filed a Form S-3 registration statement with the SEC in 2014,authorizing the offering of 8.6 million additional shares of its common stockunder DRPlus, which expires in May 2017. Shares of common stock soldunder DRPlus are, at Ameren’s option, newly issued shares, treasury shares,or shares purchased in the open market or in privately negotiated transactions.As of December 31, 2016 and 2015, DRPlus participant funds of $8 millionwere reflected on Ameren's consolidated balance sheets in "Other currentassets."
In 2013, Ameren filed a Form S-8 registration statement with the SEC,authorizing the offering of 4 million additional shares of its common stockunder its 401(k) plan. Shares of common stock sold under the 401(k) plan are,at Ameren’s option, newly issued shares, treasury shares, or shares purchasedin the open market or in privately negotiated transactions.
From 2014 through 2016, Ameren shares for its DRPlus and its 401(k)plans were purchased in the open market.
Ameren Missouri
In February 2016, $260 million principal amount of Ameren
Missouri's 5.40% senior secured notes matured and were repaid with cash onhand and commercial paper borrowings.
In June 2016 and April 2015, Ameren Missouri issued $150 million and$250 million , respectively, of 3.65% senior secured notes due in April 2045,with interest payable semiannually in April and October of each year,beginning in October 2016 and 2015, respectively. Ameren Missouri receivedproceeds of $148 million from the June 2016 issuance and $247 million fromthe April 2015 issuance, which were both used to repay outstanding short-term debt, including short-term debt that Ameren Missouri incurred inconnection with the repayment of $114 million of its 4.75% senior securednotes that matured in April 2015.
For information on Ameren Missouri's capital contributions and return ofcapital, refer to Capital Contributions and Return of Capital in Note 1 –Summary of Significant Accounting Policies.
Ameren Illinois
In June 2016, Ameren Illinois’ $54 million principal amount of 6.20%senior secured notes and $75 million principal amount of 6.25% seniorsecured notes matured and were repaid with commercial paper borrowings.
In December 2016 and 2015, Ameren Illinois issued $240 million and$250 million , respectively, of 4.15% senior secured notes due in March 2046,with interest payable semiannually in March and September, beginning inMarch 2017 and 2016, respectively. Ameren Illinois received proceeds of$245 million from each issuance, which were both used to repay a portion ofits short-term debt.
For information on Ameren Illinois' capital contributions, refer toCapital Contributions and Return of Capital in Note 1 – Summary ofSignificant Accounting Policies.
Indenture Provisions and Other Covenants
Ameren Missouri’s and Ameren Illinois’ indentures and articles of incorporation include covenants and provisions related to issuances of first mortgage bondsand preferred stock. Ameren Missouri and Ameren Illinois are required to meet certain ratios to issue additional first mortgage bonds and preferred stock. A failureto achieve these ratios would not result in a default under these covenants and provisions but would restrict the companies’ ability to issue bonds or preferred stock.The following table summarizes the required and actual interest coverage ratios for interest charges, dividend coverage ratios, and bonds and preferred stockissuable as of December 31, 2016 , at an assumed interest rate of 5% and dividend rate of 6% .
Required InterestCoverage Ratio (a)
Actual InterestCoverage Ratio Bonds Issuable (b)
Required DividendCoverage Ratio (c)
Actual DividendCoverage Ratio
Preferred StockIssuable
Ameren Missouri > 2.0 4.6 $ 4,077 > 2.5 105.3 $ 2,344 Ameren Illinois > 2.0 6.9 3,819 (d) > 1.5 2.8 203 (e)
(a) Coverage required on the annual interest charges on first mortgage bonds outstanding and to be issued. Coverage is not required in certain cases when additional first mortgage bonds areissued on the basis of retired bonds.
(b) Amount of bonds issuable based either on required coverage ratios or unfunded property additions, whichever is more restrictive. The amounts shown also include bonds issuable based onretired bond capacity of $1,206 million and $279 million at Ameren Missouri and Ameren Illinois, respectively.
(c) Coverage required on the annual dividend on preferred stock outstanding and to be issued, as required in the respective company’s articles of incorporation.(d) Amount of bonds issuable by Ameren Illinois based on unfunded property additions and retired bonds solely under its 1992 mortgage indenture.(e) Preferred stock issuable is restricted by the amount of preferred stock that is currently authorized by Ameren Illinois' articles of incorporation.
Ameren's indenture does not require Ameren to comply with anyquantitative financial covenants. The indenture does,
however, include certain cross-default provisions. Specifically, either (1) thefailure by Ameren to pay when due and upon
102

Table of Contents
expiration of any applicable grace period any portion of any Amerenindebtedness in excess of $25 million , or (2) the acceleration upon default ofthe maturity of any Ameren indebtedness in excess of $25 million under anyindebtedness agreement, including borrowings under the Credit Agreementsor the Ameren commercial paper program, constitutes a default under theindenture, unless such past due or accelerated debt is discharged or theacceleration is rescinded or annulled within a specified period.
Ameren Missouri and Ameren Illinois and certain other nonregistrantAmeren subsidiaries are subject to Section 305(a) of the Federal Power Act,which makes it unlawful for any officer or director of a public utility, asdefined in the Federal Power Act, to participate in the making or paying ofany dividend from any funds “properly included in capital account.” TheFERC has consistently interpreted the provision to allow dividends to be paidas long as (1) the source of the dividends is clearly disclosed, (2) thedividends are not excessive, and (3) there is no self-dealing on the part ofcorporate officials. At a minimum, Ameren believes that dividends can bepaid by its subsidiaries that are public utilities from net income and retainedearnings. In addition, under Illinois law, Ameren Illinois may not pay anydividend on its stock unless, among other things, its earnings and earnedsurplus are sufficient to declare and pay a dividend after provision is made forreasonable and proper reserves, or unless Ameren Illinois has specificauthorization from the ICC.
Ameren Illinois’ articles of incorporation require dividend payments onits common stock to be based on ratios of common stock to total capitalizationand other provisions related to certain operating expenses and accumulationsof earned surplus. Ameren Illinois has made a commitment to the FERC tomaintain a minimum 30% ratio of common stock equity to total capitalization.As of December 31, 2016 , using the FERC-agreed upon calculation method,Ameren Illinois’ ratio of common stock equity to total capitalization was 51%.
In order for the Ameren Companies to issue securities in the future, theywill have to comply with all applicable requirements in effect at the time ofany such issuances.
Off-Balance-Sheet Arrangements
At December 31, 2016 , none of the Ameren Companies had off-balance-sheet financing arrangements, other than operating leases entered into in theordinary course of business, letters of credit, and Ameren parent guaranteearrangements on behalf of its subsidiaries. None of the Ameren Companiesexpect to engage in any significant off-balance-sheet financing arrangementsin the near future.
103
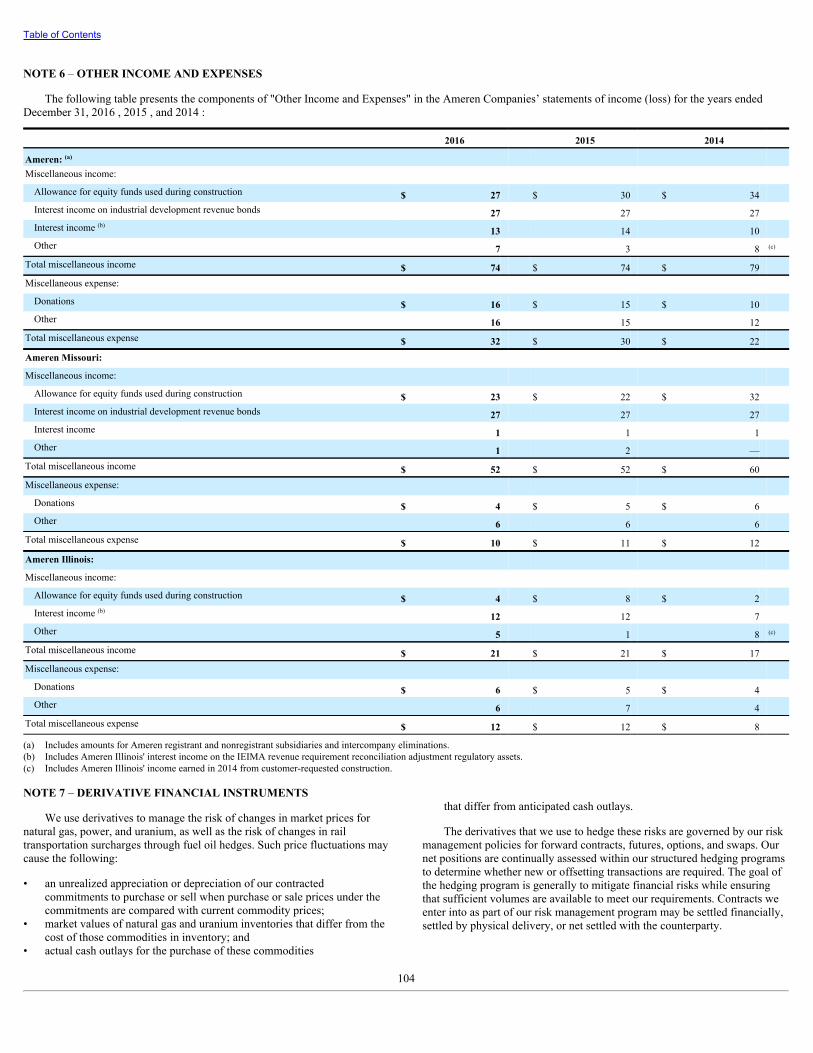
Table of Contents
NOTE 6 – OTHER INCOME AND EXPENSES
The following table presents the components of "Other Income and Expenses" in the Ameren Companies’ statements of income (loss) for the years endedDecember 31, 2016 , 2015 , and 2014 :
2016 2015 2014
Ameren: (a) Miscellaneous income: Allowance for equity funds used during construction $ 27 $ 30 $ 34 Interest income on industrial development revenue bonds 27 27 27 Interest income (b) 13 14 10 Other 7 3 8 (c)
Total miscellaneous income $ 74 $ 74 $ 79 Miscellaneous expense: Donations $ 16 $ 15 $ 10 Other 16 15 12
Total miscellaneous expense $ 32 $ 30 $ 22 Ameren Missouri: Miscellaneous income: Allowance for equity funds used during construction $ 23 $ 22 $ 32 Interest income on industrial development revenue bonds 27 27 27 Interest income 1 1 1 Other 1 2 —
Total miscellaneous income $ 52 $ 52 $ 60 Miscellaneous expense: Donations $ 4 $ 5 $ 6 Other 6 6 6
Total miscellaneous expense $ 10 $ 11 $ 12 Ameren Illinois: Miscellaneous income: Allowance for equity funds used during construction $ 4 $ 8 $ 2 Interest income (b) 12 12 7 Other 5 1 8 (c)
Total miscellaneous income $ 21 $ 21 $ 17 Miscellaneous expense: Donations $ 6 $ 5 $ 4 Other 6 7 4
Total miscellaneous expense $ 12 $ 12 $ 8
(a) Includes amounts for Ameren registrant and nonregistrant subsidiaries and intercompany eliminations.(b) Includes Ameren Illinois' interest income on the IEIMA revenue requirement reconciliation adjustment regulatory assets.(c) Includes Ameren Illinois' income earned in 2014 from customer-requested construction.
NOTE 7 – DERIVATIVE FINANCIAL INSTRUMENTS
We use derivatives to manage the risk of changes in market prices fornatural gas, power, and uranium, as well as the risk of changes in railtransportation surcharges through fuel oil hedges. Such price fluctuations maycause the following:
• an unrealized appreciation or depreciation of our contractedcommitments to purchase or sell when purchase or sale prices under thecommitments are compared with current commodity prices;
• market values of natural gas and uranium inventories that differ from thecost of those commodities in inventory; and
• actual cash outlays for the purchase of these commodities
that differ from anticipated cash outlays.
The derivatives that we use to hedge these risks are governed by our riskmanagement policies for forward contracts, futures, options, and swaps. Ournet positions are continually assessed within our structured hedging programsto determine whether new or offsetting transactions are required. The goal ofthe hedging program is generally to mitigate financial risks while ensuringthat sufficient volumes are available to meet our requirements. Contracts weenter into as part of our risk management program may be settled financially,settled by physical delivery, or net settled with the counterparty.
104

Table of Contents
The following table presents open gross commodity contract volumes by commodity type for derivative assets and liabilities as of December 31, 2016 and2015 . As of December 31, 2016 , these contracts extended through October 2019, March 2021, May 2032, and February 2020 for fuel oils, natural gas, power, anduranium, respectively.
Quantity (in millions, except as indicated) 2016 2015
CommodityAmerenMissouri Ameren Illinois Ameren
AmerenMissouri Ameren Illinois Ameren
Fuel oils (in gallons) (a) 30 (b) 30 35 (b) 35Natural gas (in mmbtu) 25 129 154 30 151 181Power (in megawatthours) 1 9 10 1 10 11Uranium (pounds in thousands) 345 (b) 345 494 (b) 494
(a) Consists of ultra-low-sulfur diesel products.(b) Not applicable.
All contracts considered to be derivative instruments are required to berecorded on the balance sheet at their fair values, unless the NPNS exceptionapplies. See Note 8 – Fair Value Measurements for discussion of our methodsof assessing the fair value of derivative instruments. Many of our physicalcontracts, such as our purchased power contracts, qualify for the NPNSexception to derivative accounting rules. The revenue or expense on NPNScontracts is recognized at the contract price upon physical delivery.
If we determine that a contract meets the definition of a derivative and isnot eligible for the NPNS exception, we review the contract to determinewhether the resulting gains or losses qualify for regulatory deferral.Derivative contracts that qualify for
regulatory deferral are recorded at fair value, with changes in fair valuerecorded as regulatory assets or liabilities in the period in which the changeoccurs. We believe derivative losses and gains deferred as regulatory assetsand liabilities are probable of recovery, or refund, through future ratescharged to customers. Regulatory assets and liabilities are amortized tooperating income as related losses and gains are reflected in rates charged tocustomers. Therefore, gains and losses on these derivatives have no effect onoperating income. As of December 31, 2016 and 2015 , all contracts that metthe definition of a derivative and were not eligible for the NPNS exceptionreceived regulatory deferral.
105
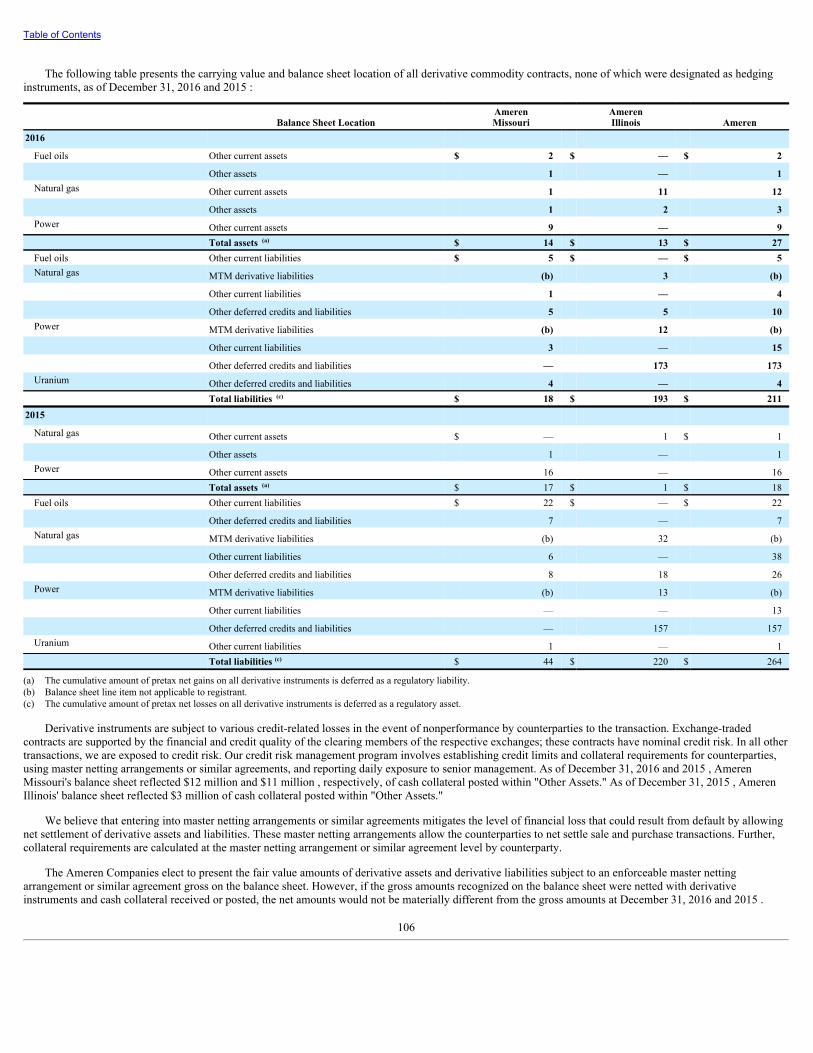
Table of Contents
The following table presents the carrying value and balance sheet location of all derivative commodity contracts, none of which were designated as hedginginstruments, as of December 31, 2016 and 2015 :
Balance Sheet Location AmerenMissouri
AmerenIllinois Ameren
2016 Fuel oils Other current assets $ 2 $ — $ 2
Other assets 1 — 1Natural gas Other current assets 1 11 12
Other assets 1 2 3Power Other current assets 9 — 9
Total assets (a) $ 14 $ 13 $ 27Fuel oils Other current liabilities $ 5 $ — $ 5Natural gas MTM derivative liabilities (b) 3 (b)
Other current liabilities 1 — 4 Other deferred credits and liabilities 5 5 10Power MTM derivative liabilities (b) 12 (b)
Other current liabilities 3 — 15 Other deferred credits and liabilities — 173 173Uranium Other deferred credits and liabilities 4 — 4
Total liabilities (c) $ 18 $ 193 $ 2112015 Natural gas Other current assets $ — 1 $ 1
Other assets 1 — 1Power Other current assets 16 — 16
Total assets (a) $ 17 $ 1 $ 18Fuel oils Other current liabilities $ 22 $ — $ 22
Other deferred credits and liabilities 7 — 7Natural gas MTM derivative liabilities (b) 32 (b)
Other current liabilities 6 — 38 Other deferred credits and liabilities 8 18 26Power MTM derivative liabilities (b) 13 (b)
Other current liabilities — — 13 Other deferred credits and liabilities — 157 157Uranium Other current liabilities 1 — 1
Total liabilities (c) $ 44 $ 220 $ 264
(a) The cumulative amount of pretax net gains on all derivative instruments is deferred as a regulatory liability.(b) Balance sheet line item not applicable to registrant.(c) The cumulative amount of pretax net losses on all derivative instruments is deferred as a regulatory asset.
Derivative instruments are subject to various credit-related losses in the event of nonperformance by counterparties to the transaction. Exchange-tradedcontracts are supported by the financial and credit quality of the clearing members of the respective exchanges; these contracts have nominal credit risk. In all othertransactions, we are exposed to credit risk. Our credit risk management program involves establishing credit limits and collateral requirements for counterparties,using master netting arrangements or similar agreements, and reporting daily exposure to senior management. As of December 31, 2016 and 2015 , AmerenMissouri's balance sheet reflected $12 million and $11 million , respectively, of cash collateral posted within "Other Assets." As of December 31, 2015 , AmerenIllinois' balance sheet reflected $3 million of cash collateral posted within "Other Assets."
We believe that entering into master netting arrangements or similar agreements mitigates the level of financial loss that could result from default by allowingnet settlement of derivative assets and liabilities. These master netting arrangements allow the counterparties to net settle sale and purchase transactions. Further,collateral requirements are calculated at the master netting arrangement or similar agreement level by counterparty.
The Ameren Companies elect to present the fair value amounts of derivative assets and derivative liabilities subject to an enforceable master nettingarrangement or similar agreement gross on the balance sheet. However, if the gross amounts recognized on the balance sheet were netted with derivativeinstruments and cash collateral received or posted, the net amounts would not be materially different from the gross amounts at December 31, 2016 and 2015 .
106

Table of Contents
Concentrations of Credit Risk
In determining our concentrations of credit risk related to derivative instruments, we review our individual counterparties and categorize each counterpartyinto groupings according to the primary business in which each engages. We calculate maximum exposures based on the gross fair value of financial instruments,including NPNS and other accrual contracts. These exposures are presented on a gross basis, which include affiliate exposure not eliminated at the consolidatedAmeren level. As of December 31, 2016 , if counterparty groups were to fail completely to perform on contracts, the Ameren Companies' maximum exposurewould have been immaterial with or without consideration of the application of master netting arrangements or similar agreements and collateral held.
Derivative Instruments with Credit Risk-Related Contingent Features
Our commodity contracts contain collateral provisions tied to the Ameren Companies’ credit ratings. If our credit ratings were downgraded, or if acounterparty with reasonable grounds for uncertainty regarding our ability to satisfy an obligation requested adequate assurance of performance, additionalcollateral postings might be required. The following table presents, as of December 31, 2016 , the aggregate fair value of all derivative instruments with credit risk-related contingent features in a gross liability position, the cash collateral posted, and the aggregate amount of additional collateral that counterparties couldrequire. The additional collateral required is the net liability position allowed under the master netting arrangements or similar agreements, assuming (1) the creditrisk-related contingent features underlying these arrangements were triggered on December 31, 2016 , and (2) those counterparties with rights to do so requestedcollateral.
Aggregate Fair Value ofDerivative Liabilities (a)
CashCollateral Posted
Potential Aggregate Amount ofAdditional Collateral Required (b)
2016 Ameren Missouri $ 64 $ 3 $ 54Ameren Illinois 33 — 26Ameren $ 97 $ 3 $ 80
(a) Before consideration of master netting arrangements or similar agreements and including NPNS and other accrual contract exposures.(b) As collateral requirements with certain counterparties are based on master netting arrangements or similar agreements, the aggregate amount of additional collateral required to be posted is
determined after consideration of the effects of such arrangements.
NOTE 8 – FAIR VALUE MEASUREMENTS
Fair value is defined as the price that would be received for an asset orpaid to transfer a liability (an exit price) in the principal or most advantageousmarket for the asset or liability in an orderly transaction between marketparticipants on the measurement date. We use various methods to determinefair value, including market, income, and cost approaches. With theseapproaches, we adopt certain assumptions that market participants would usein pricing the asset or liability, including assumptions about market risk or therisks inherent in the inputs to the valuation. Inputs to valuation can be readilyobservable, market-corroborated, or unobservable. We use valuationtechniques that maximize the use of observable inputs and minimize the useof unobservable inputs. Authoritative accounting guidance established a fairvalue hierarchy that prioritizes the inputs used to measure fair value. Allfinancial assets and liabilities carried at fair value are classified and disclosedin one of the following three hierarchy levels:
Level 1: Inputs based on quoted prices in active markets for identicalassets or liabilities. Level 1 assets and liabilities are primarily exchange-traded derivatives and assets, including cash and cash equivalents and listedequity securities, such as those held in Ameren Missouri’s nucleardecommissioning trust fund.
The market approach is used to measure the fair value of equity securitiesheld in Ameren Missouri's nuclear decommissioning trust fund. Equitysecurities in this fund are representative of the S&P 500 index, excludingsecurities of
Ameren Corporation, owners and/or operators of nuclear power plants, andthe trustee and investment managers. The S&P 500 index comprises stocks oflarge-capitalization companies.
Level 2 : Market-based inputs corroborated by third-party brokers orexchanges based on transacted market data. Level 2 assets and liabilitiesinclude certain assets held in Ameren Missouri’s nuclear decommissioningtrust fund, including corporate bonds and other fixed-income securities,United States Treasury and agency securities, and certain over-the-counterderivative instruments, including natural gas and financial power transactions.
Fixed income securities are valued by using prices from independentindustry-recognized data vendors who provide values that are eitherexchange-based or matrix-based. The fair value measurements of fixed-income securities classified as Level 2 are based on inputs other than quotedprices that are observable for the asset or liability. Examples are matrixpricing, market corroborated pricing, and inputs such as yield curves andindices. Level 2 fixed income securities in the nuclear decommissioning trustfund are primarily corporate bonds, asset-backed securities, and United Statesagency bonds.
Derivative instruments classified as Level 2 are valued by corroboratedobservable inputs, such as pricing services or prices from similar instrumentsthat trade in liquid markets. Our development and corroboration processentails obtaining multiple quotes or prices from outside sources. To derive ourforward view
107
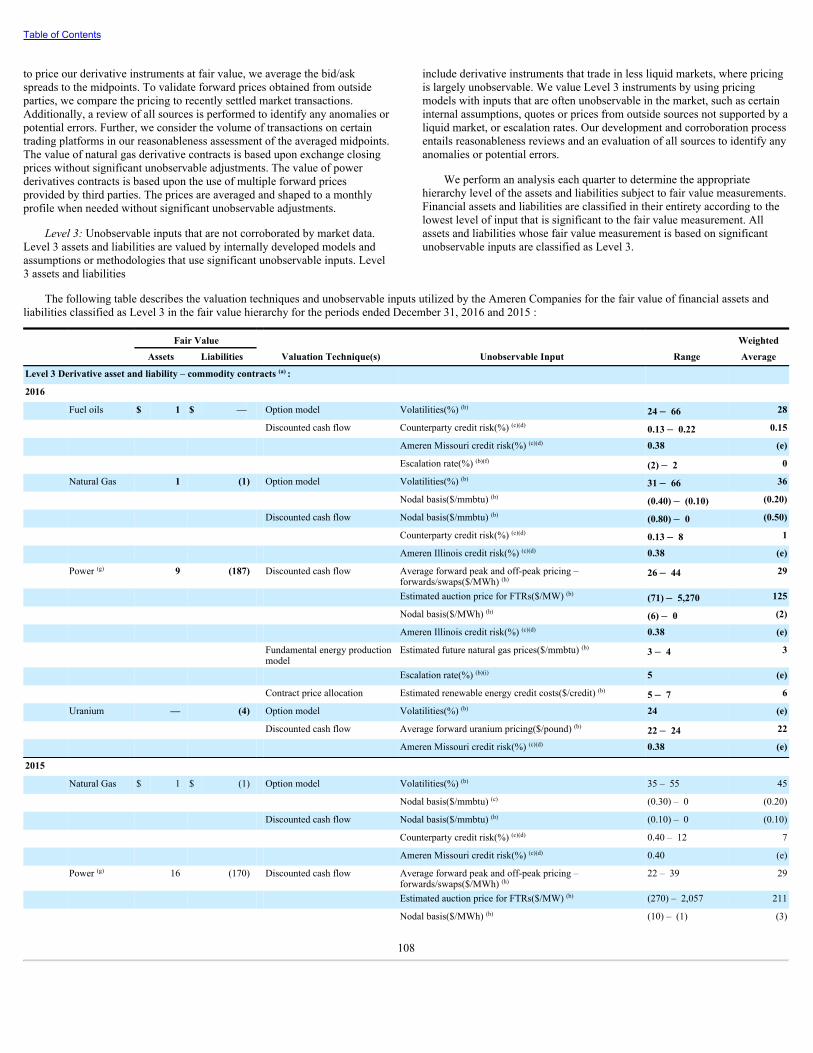
Table of Contents
to price our derivative instruments at fair value, we average the bid/askspreads to the midpoints. To validate forward prices obtained from outsideparties, we compare the pricing to recently settled market transactions.Additionally, a review of all sources is performed to identify any anomalies orpotential errors. Further, we consider the volume of transactions on certaintrading platforms in our reasonableness assessment of the averaged midpoints.The value of natural gas derivative contracts is based upon exchange closingprices without significant unobservable adjustments. The value of powerderivatives contracts is based upon the use of multiple forward pricesprovided by third parties. The prices are averaged and shaped to a monthlyprofile when needed without significant unobservable adjustments.
Level 3: Unobservable inputs that are not corroborated by market data.Level 3 assets and liabilities are valued by internally developed models andassumptions or methodologies that use significant unobservable inputs. Level3 assets and liabilities
include derivative instruments that trade in less liquid markets, where pricingis largely unobservable. We value Level 3 instruments by using pricingmodels with inputs that are often unobservable in the market, such as certaininternal assumptions, quotes or prices from outside sources not supported by aliquid market, or escalation rates. Our development and corroboration processentails reasonableness reviews and an evaluation of all sources to identify anyanomalies or potential errors.
We perform an analysis each quarter to determine the appropriatehierarchy level of the assets and liabilities subject to fair value measurements.Financial assets and liabilities are classified in their entirety according to thelowest level of input that is significant to the fair value measurement. Allassets and liabilities whose fair value measurement is based on significantunobservable inputs are classified as Level 3.
The following table describes the valuation techniques and unobservable inputs utilized by the Ameren Companies for the fair value of financial assets andliabilities classified as Level 3 in the fair value hierarchy for the periods ended December 31, 2016 and 2015 :
Fair Value Weighted Assets Liabilities Valuation Technique(s) Unobservable Input Range Average
Level 3 Derivative asset and liability – commodity contracts (a) : 2016 Fuel oils $ 1 $ — Option model Volatilities(%) (b) 24 – 66 28
Discounted cash flow Counterparty credit risk(%) (c)(d) 0.13 – 0.22 0.15
Ameren Missouri credit risk(%) (c)(d) 0.38 (e)
Escalation rate(%) (b)(f) (2) – 2 0
Natural Gas 1 (1) Option model Volatilities(%) (b) 31 – 66 36
Nodal basis($/mmbtu) (b) (0.40) – (0.10) (0.20)
Discounted cash flow Nodal basis($/mmbtu) (b) (0.80) – 0 (0.50)
Counterparty credit risk(%) (c)(d) 0.13 – 8 1
Ameren Illinois credit risk(%) (c)(d) 0.38 (e)
Power (g) 9 (187)
Discounted cash flow Average forward peak and off-peak pricing –
forwards/swaps($/MWh) (h)26 – 44 29
Estimated auction price for FTRs($/MW) (b) (71) – 5,270 125
Nodal basis($/MWh) (h) (6) – 0 (2)
Ameren Illinois credit risk(%) (c)(d) 0.38 (e)
Fundamental energy productionmodel
Estimated future natural gas prices($/mmbtu) (b) 3 – 4 3
Escalation rate(%) (b)(i) 5 (e)
Contract price allocation Estimated renewable energy credit costs($/credit) (b) 5 – 7 6
Uranium — (4) Option model Volatilities(%) (b) 24 (e)
Discounted cash flow Average forward uranium pricing($/pound) (b) 22 – 24 22
Ameren Missouri credit risk(%) (c)(d) 0.38 (e)
2015 Natural Gas $ 1 $ (1) Option model Volatilities(%) (b) 35 – 55 45
Nodal basis($/mmbtu) (c) (0.30) – 0 (0.20)
Discounted cash flow Nodal basis($/mmbtu) (b) (0.10) – 0 (0.10)
Counterparty credit risk(%) (c)(d) 0.40 – 12 7
Ameren Missouri credit risk(%) (c)(d) 0.40 (e)
Power (g) 16 (170)
Discounted cash flow Average forward peak and off-peak pricing –
forwards/swaps($/MWh) (h)22 – 39 29
Estimated auction price for FTRs($/MW) (b) (270) – 2,057 211
Nodal basis($/MWh) (h) (10) – (1) (3)
108

Table of Contents
Fair Value Weighted Assets Liabilities Valuation Technique(s) Unobservable Input Range Average
Counterparty credit risk(%) (c)(d) 0.86 (e)
Ameren Illinois credit risk(%) (c)(d) 0.40 (e)
Fundamental energy productionmodel
Estimated future natural gas prices($/mmbtu) (b) 3 – 4 4
Escalation rate(%) (b)(i) 3 (e)
Contract price allocation Estimated renewable energy credit costs($/credit) (b) 5 – 7 6
Uranium — (1) Option model Volatilities(%) (b) 20 (e)
Discounted cash flow Average forward uranium pricing($/pound) (b) 35 – 42 37
Ameren Missouri credit risk(%) (c)(d) 0.40 (e)
(a) The derivative asset and liability balances are presented net of counterparty credit considerations.(b) Generally, significant increases (decreases) in this input in isolation would result in a significantly higher (lower) fair value measurement.(c) Generally, significant increases (decreases) in this input in isolation would result in a significantly lower (higher) fair value measurement.(d) Counterparty credit risk is applied only to counterparties with derivative asset balances. Ameren Missouri and Ameren Illinois credit risk is applied only to counterparties with derivative
liability balances.(e) Not applicable.(f) Escalation rate applies to fuel oil prices 2019 and beyond.(g) Power valuations use visible third-party pricing evaluated by month for peak and off-peak demand through 2020. Valuations beyond 2020 use fundamentally modeled pricing by month for
peak and off-peak demand.(h) The balance at Ameren is comprised of Ameren Missouri and Ameren Illinois power contracts, which respond differently to unobservable input changes because of their opposing
positions.(i) Escalation rate applies to power prices in 2031 and beyond for December 31, 2016, and to power prices in 2026 and beyond for December 31, 2015.
We consider nonperformance risk in our valuation of derivativeinstruments by analyzing the credit standing of our counterparties andconsidering any counterparty credit enhancements (e.g., collateral). Theguidance also requires that the fair value measurement of liabilities reflect thenonperformance risk of the reporting entity, as applicable. Therefore, we havefactored the impact of our credit standing, as well as any potential creditenhancements, into the fair value measurement of both derivative assets andderivative liabilities. Included in our valuation, and based on current market
conditions, is a valuation adjustment for counterparty default derived frommarket data such as the price of credit default swaps, bond yields, and creditratings. No gains or losses related to valuation adjustments for counterpartydefault risk were recorded at Ameren, Ameren Missouri, or Ameren Illinois in2016, 2015 or 2014. At December 31, 2016 and 2015 , the counterpartydefault risk valuation adjustment related to derivative contracts wasimmaterial for Ameren, Ameren Missouri, and Ameren Illinois.
The following table sets forth, by level within the fair value hierarchy, our assets and liabilities measured at fair value on a recurring basis as of December 31,2016 :
Quoted Prices inActive Markets for
Identical Assetsor Liabilities
(Level 1)
Significant OtherObservable
Inputs(Level 2)
Significant OtherUnobservable
Inputs(Level 3) Total
Assets:
Ameren Derivative assets – commodity contracts (a) : Fuel oils $ 2 $ — $ 1 $ 3 Natural gas 2 12 1 15 Power — — 9 9 Total derivative assets – commodity contracts $ 4 $ 12 $ 11 $ 27 Nuclear decommissioning trust fund: Cash and cash equivalents $ 1 $ — $ — $ 1 Equity securities: U.S. large capitalization 408 — — 408 Debt securities: U.S. Treasury and agency securities — 112 — 112 Corporate bonds — 67 — 67 Other — 17 — 17
Total nuclear decommissioning trustfund $ 409 $ 196 $ — $ 605 (b)
Total Ameren $ 413 $ 208 $ 11 $ 632 AmerenMissouri Derivative assets – commodity contracts (a) :
109
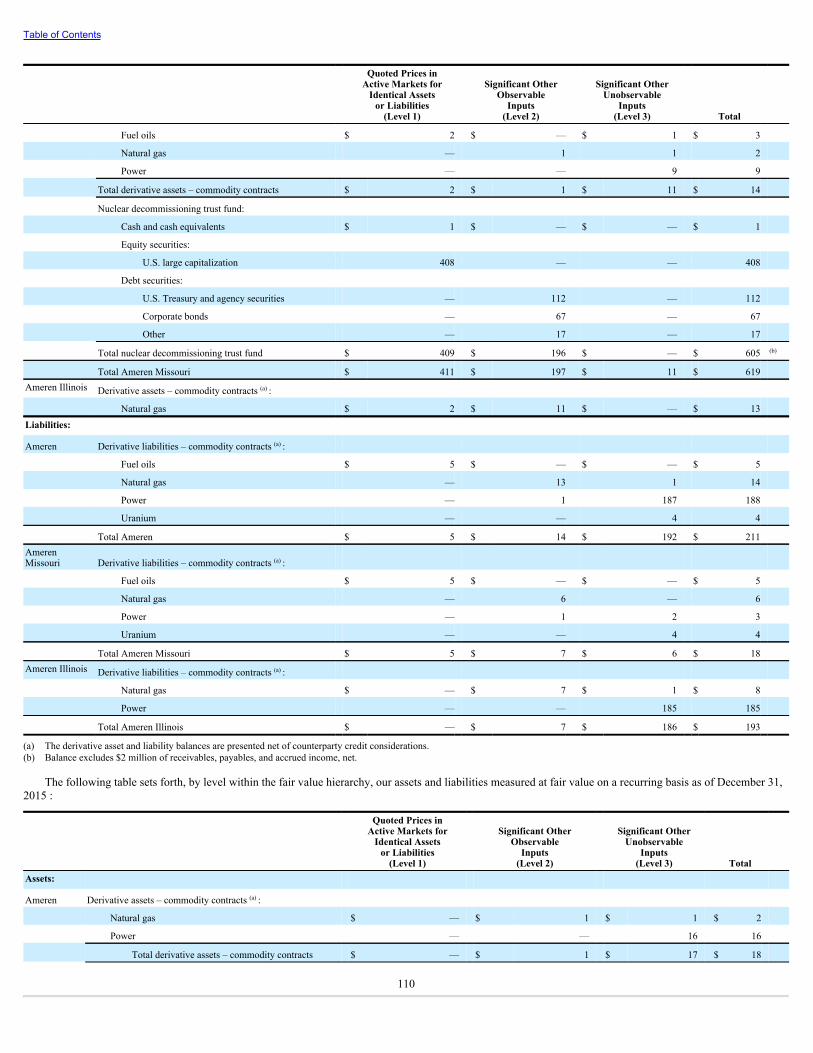
Table of Contents
Quoted Prices inActive Markets for
Identical Assetsor Liabilities
(Level 1)
Significant OtherObservable
Inputs(Level 2)
Significant OtherUnobservable
Inputs(Level 3) Total
Fuel oils $ 2 $ — $ 1 $ 3 Natural gas — 1 1 2 Power — — 9 9 Total derivative assets – commodity contracts $ 2 $ 1 $ 11 $ 14 Nuclear decommissioning trust fund: Cash and cash equivalents $ 1 $ — $ — $ 1 Equity securities: U.S. large capitalization 408 — — 408 Debt securities: U.S. Treasury and agency securities — 112 — 112 Corporate bonds — 67 — 67 Other — 17 — 17 Total nuclear decommissioning trust fund $ 409 $ 196 $ — $ 605 (b)
Total Ameren Missouri $ 411 $ 197 $ 11 $ 619 Ameren Illinois Derivative assets – commodity contracts (a) : Natural gas $ 2 $ 11 $ — $ 13 Liabilities:
Ameren Derivative liabilities – commodity contracts (a) : Fuel oils $ 5 $ — $ — $ 5 Natural gas — 13 1 14 Power — 1 187 188 Uranium — — 4 4 Total Ameren $ 5 $ 14 $ 192 $ 211 AmerenMissouri Derivative liabilities – commodity contracts (a) : Fuel oils $ 5 $ — $ — $ 5 Natural gas — 6 — 6 Power — 1 2 3 Uranium — — 4 4 Total Ameren Missouri $ 5 $ 7 $ 6 $ 18 Ameren Illinois Derivative liabilities – commodity contracts (a) : Natural gas $ — $ 7 $ 1 $ 8 Power — — 185 185 Total Ameren Illinois $ — $ 7 $ 186 $ 193
(a) The derivative asset and liability balances are presented net of counterparty credit considerations.(b) Balance excludes $2 million of receivables, payables, and accrued income, net.
The following table sets forth, by level within the fair value hierarchy, our assets and liabilities measured at fair value on a recurring basis as of December 31,2015 :
Quoted Prices inActive Markets for
Identical Assetsor Liabilities
(Level 1)
Significant OtherObservable
Inputs(Level 2)
Significant OtherUnobservable
Inputs(Level 3) Total
Assets:
Ameren Derivative assets – commodity contracts (a) : Natural gas $ — $ 1 $ 1 $ 2 Power — — 16 16 Total derivative assets – commodity contracts $ — $ 1 $ 17 $ 18
110

Table of Contents
Quoted Prices inActive Markets for
Identical Assetsor Liabilities
(Level 1)
Significant OtherObservable
Inputs(Level 2)
Significant OtherUnobservable
Inputs(Level 3) Total
Nuclear decommissioning trust fund: Cash and cash equivalents $ 4 $ — $ — $ 4 Equity securities: U.S. large capitalization 364 — — 364 Debt securities: U.S. Treasury and agency securities — 109 — 109 Corporate bonds — 58 — 58 Other — 22 — 22 Total nuclear decommissioning trust fund $ 368 $ 189 $ — $ 557 (b)
Total Ameren $ 368 $ 190 $ 17 $ 575 AmerenMissouri Derivative assets – commodity contracts (a) : Natural gas $ — $ — $ 1 $ 1 Power — — 16 16 Total derivative assets – commodity contracts $ — $ — $ 17 $ 17 Nuclear decommissioning trust fund: Cash and cash equivalents $ 4 $ — $ — $ 4 Equity securities: U.S. large capitalization 364 — — 364 Debt securities: U.S. Treasury and agency securities — 109 — 109 Corporate bonds — 58 — 58 Other — 22 — 22 Total nuclear decommissioning trust fund $ 368 $ 189 $ — $ 557 (b)
Total Ameren Missouri $ 368 $ 189 $ 17 $ 574 AmerenIllinois Derivative assets – commodity contracts (a) : Natural gas $ — $ 1 $ — $ 1 Liabilities:
Ameren Derivative liabilities – commodity contracts (a) : Fuel oils $ 29 $ — $ — $ 29 Natural gas 1 62 1 64 Power — — 170 170 Uranium — — 1 1 Total Ameren $ 30 $ 62 $ 172 $ 264 AmerenMissouri Derivative liabilities – commodity contracts (a) : Fuel oils $ 29 $ — $ — $ 29 Natural gas — 13 1 14 Uranium — — 1 1 Total Ameren Missouri $ 29 $ 13 $ 2 $ 44 AmerenIllinois Derivative liabilities – commodity contracts (a) : Natural gas $ 1 $ 49 $ — $ 50 Power — — 170 170 Total Ameren Illinois $ 1 $ 49 $ 170 $ 220
(a) The derivative asset and liability balances are presented net of counterparty credit considerations.(b) Balance excludes $(1) million of receivables, payables, and accrued income, net.
All costs related to financial assets and liabilities, including those classified as Level 3 in the fair value hierarchy are expected to be recoverable throughcustomer rates; therefore, there is no impact to net income resulting from changes in the fair value of these instruments. For the years ended December 31, 2016and 2015 , the balances and changes in the fair value of Level 3 financial assets and liabilities associated with fuel oils, natural gas, and uranium were immaterial.

111
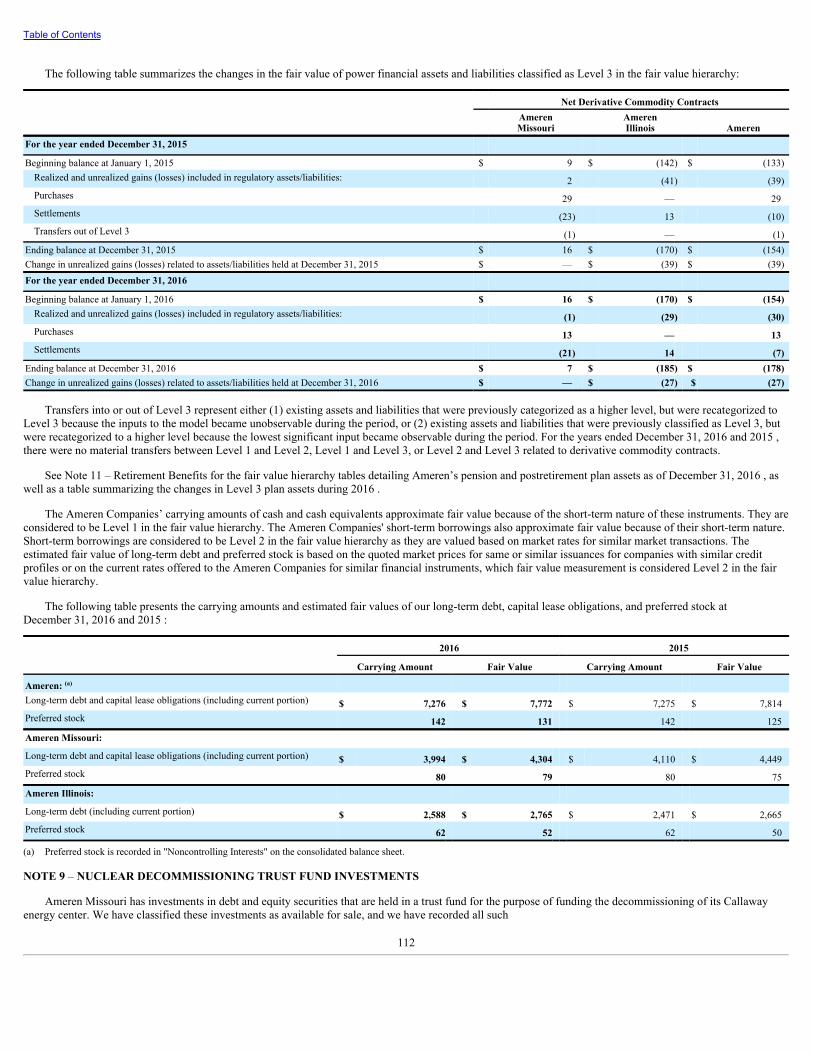
Table of Contents
The following table summarizes the changes in the fair value of power financial assets and liabilities classified as Level 3 in the fair value hierarchy:
Net Derivative Commodity Contracts
AmerenMissouri
AmerenIllinois Ameren
For the year ended December 31, 2015 Beginning balance at January 1, 2015 $ 9 $ (142) $ (133)Realized and unrealized gains (losses) included in regulatory assets/liabilities: 2 (41) (39)Purchases 29 — 29Settlements (23) 13 (10)Transfers out of Level 3 (1) — (1)
Ending balance at December 31, 2015 $ 16 $ (170) $ (154)Change in unrealized gains (losses) related to assets/liabilities held at December 31, 2015 $ — $ (39) $ (39)For the year ended December 31, 2016 Beginning balance at January 1, 2016 $ 16 $ (170) $ (154)Realized and unrealized gains (losses) included in regulatory assets/liabilities: (1) (29) (30)Purchases 13 — 13Settlements (21) 14 (7)
Ending balance at December 31, 2016 $ 7 $ (185) $ (178)Change in unrealized gains (losses) related to assets/liabilities held at December 31, 2016 $ — $ (27) $ (27)
Transfers into or out of Level 3 represent either (1) existing assets and liabilities that were previously categorized as a higher level, but were recategorized toLevel 3 because the inputs to the model became unobservable during the period, or (2) existing assets and liabilities that were previously classified as Level 3, butwere recategorized to a higher level because the lowest significant input became observable during the period. For the years ended December 31, 2016 and 2015 ,there were no material transfers between Level 1 and Level 2, Level 1 and Level 3, or Level 2 and Level 3 related to derivative commodity contracts.
See Note 11 – Retirement Benefits for the fair value hierarchy tables detailing Ameren’s pension and postretirement plan assets as of December 31, 2016 , aswell as a table summarizing the changes in Level 3 plan assets during 2016 .
The Ameren Companies’ carrying amounts of cash and cash equivalents approximate fair value because of the short-term nature of these instruments. They areconsidered to be Level 1 in the fair value hierarchy. The Ameren Companies' short-term borrowings also approximate fair value because of their short-term nature.Short-term borrowings are considered to be Level 2 in the fair value hierarchy as they are valued based on market rates for similar market transactions. Theestimated fair value of long-term debt and preferred stock is based on the quoted market prices for same or similar issuances for companies with similar creditprofiles or on the current rates offered to the Ameren Companies for similar financial instruments, which fair value measurement is considered Level 2 in the fairvalue hierarchy.
The following table presents the carrying amounts and estimated fair values of our long-term debt, capital lease obligations, and preferred stock atDecember 31, 2016 and 2015 :
2016 2015
Carrying Amount Fair Value Carrying Amount Fair Value
Ameren: (a) Long-term debt and capital lease obligations (including current portion) $ 7,276 $ 7,772 $ 7,275 $ 7,814Preferred stock 142 131 142 125Ameren Missouri: Long-term debt and capital lease obligations (including current portion) $ 3,994 $ 4,304 $ 4,110 $ 4,449Preferred stock 80 79 80 75Ameren Illinois: Long-term debt (including current portion) $ 2,588 $ 2,765 $ 2,471 $ 2,665Preferred stock 62 52 62 50
(a) Preferred stock is recorded in "Noncontrolling Interests" on the consolidated balance sheet.
NOTE 9 – NUCLEAR DECOMMISSIONING TRUST FUND INVESTMENTS
Ameren Missouri has investments in debt and equity securities that are held in a trust fund for the purpose of funding the decommissioning of its Callawayenergy center. We have classified these investments as available for sale, and we have recorded all such
112

Table of Contents
investments at their fair market value at December 31, 2016 , and 2015 . See Note 10 – Callaway Energy Center for additional information.
Investments in the nuclear decommissioning trust fund have a target allocation of 60 % to 70 % in equity securities, with the balance invested in debtsecurities.
The following table presents proceeds from the sale and maturities of investments in Ameren Missouri’s nuclear decommissioning trust fund and the grossrealized gains and losses resulting from those sales for the years ended December 31, 2016 , 2015 , and 2014 :
2016 2015 2014Proceeds from sales and maturities $ 377 $ 349 $ 391Gross realized gains 7 8 7Gross realized losses 4 2 2
Net realized and unrealized gains and losses are deferred and are currently recorded as a regulatory liability related to AROs on Ameren’s and AmerenMissouri’s balance sheets. This reporting is consistent with the method used to account for the decommissioning costs recovered in rates. Gains or losses associatedwith assets in the trust fund could result in lower or higher funding requirements for decommissioning costs, which are expected to be reflected in electric ratespaid by Ameren Missouri’s customers. See Note 2 – Rate and Regulatory Matters.
The following table presents the costs and fair values of investments in debt and equity securities in Ameren's and Ameren Missouri’s nucleardecommissioning trust fund at December 31, 2016 and 2015 :
Security Type Cost Gross Unrealized Gain Gross Unrealized Loss Fair Value2016 Debt securities $ 197 $ 3 $ 4 $ 196Equity securities 161 253 6 408Cash 1 — — 1
Other (a) 2 — — 2Total $ 361 $ 256 $ 10 $ 6072015 Debt securities $ 191 $ 2 $ 4 $ 189Equity securities 147 224 7 364Cash 4 — — 4
Other (a) (1) — — (1)Total $ 341 $ 226 $ 11 $ 556
(a) Represents net receivables and payables relating to pending security sales, interest, and security purchases.
The following table presents the costs and fair values of investments in debt securities in Ameren's and Ameren Missouri’s nuclear decommissioning trustfund according to their contractual maturities at December 31, 2016 :
Cost Fair ValueLess than 5 years $ 105 $ 1045 years to 10 years 47 47Due after 10 years 45 45Total $ 197 $ 196
We have unrealized losses relating to certain available-for-sale investments included in our nuclear decommissioning trust fund, recorded as a regulatory assetas discussed above. Decommissioning will not occur until our nuclear energy center is retired. The Callaway energy center’s current operating license expires in2044.
NOTE 10 – CALLAWAY ENERGY CENTER
Under the NWPA, the DOE is responsible for disposing of spent nuclearfuel from the Callaway energy center and other commercial nuclear energycenters. Under the NWPA, Ameren and other utilities that own and operatethose energy centers are responsible for paying the disposal costs. The NWPAestablished the fee that these utilities pay the federal government for disposingof the spent nuclear fuel at one mill, or one-tenth of one cent, for eachkilowatthour generated and sold by those plants.
The NWPA also requires the DOE to review the nuclear waste fee annuallyagainst the cost of the nuclear waste disposal program and to propose to theUnited States Congress any fee adjustment necessary to offset the costs of theprogram. As required by the NWPA, Ameren Missouri and other utilities haveentered into standard contracts with the DOE. Consistent with the NWPA andits standard contract, which stated that the DOE would begin to dispose ofspent nuclear fuel by 1998, Ameren Missouri had historically collected onemill from its electric
113

Table of Contents
customers for each kilowatthour of electricity that it generated and sold fromits Callaway energy center. Because the federal government is not meeting itsdisposal obligation, the collection of this fee was suspended in May 2014. TheDOE's delay in carrying out its obligation to dispose of spent nuclear fuelfrom the Callaway energy center is not expected to adversely affect thecontinued operations of the energy center.
As a result of the DOE's failure to fulfill its contractual obligations,Ameren Missouri and other nuclear energy center owners sued the DOE torecover costs incurred for ongoing storage of their spent fuel. The lawsuitresulted in a settlement agreement that provides for annual reimbursement ofadditional spent fuel storage and related costs. Ameren Missouri receivedreimbursements from the DOE of $24 million , $14 million , and $15 millionin 2016, 2015, and 2014, respectively. Ameren Missouri will continue toapply for reimbursement from the DOE for allowable costs associated withthe ongoing storage of spent fuel.
Electric utility rates charged to customers provide for the recovery of theCallaway energy center's decommissioning costs, which includedecontamination, dismantling, and site restoration costs, over the expected lifeof the nuclear energy center. Amounts collected from customers are depositedinto the external nuclear decommissioning trust fund to provide for theCallaway energy center’s decommissioning. It is assumed that the Callawayenergy center site will be decommissioned through the immediatedismantlement method and removed from service. Ameren and AmerenMissouri have recorded an ARO for the Callaway energy centerdecommissioning costs at fair value, which represents the present value ofestimated future cash outflows. Annual decommissioning costs of $7 millionare included in the costs used to establish electric rates for Ameren Missouri'scustomers. Every three years, the MoPSC requires Ameren Missouri to file anupdated cost study and funding analysis for decommissioning its Callawayenergy center. In April 2016, the MoPSC approved no change in electricservice rates for decommissioning costs.
The fair value of the trust fund for Ameren Missouri's Callaway energycenter is reported as "Nuclear decommissioning trust fund" in Ameren's andAmeren Missouri's balance sheets. This amount is legally restricted and maybe used only to fund the costs of nuclear decommissioning. Changes in thefair value of the trust fund are recorded as an increase or decrease to thenuclear decommissioning trust fund, with an offsetting adjustment to therelated regulatory liability. If the assumed return on trust assets is not earned,Ameren Missouri believes that it is probable that any such earnings deficiencywill be recovered in rates.
See Note 2 – Rate and Regulatory Matters and Note 9 – NuclearDecommissioning Trust Fund Investments for additional
information related to the Callaway energy center.
NOTE 11 – RETIREMENT BENEFITS
The primary objective of the Ameren pension and postretirement benefitplans is to provide eligible employees with pension and postretirement healthcare and life insurance benefits. Ameren has defined benefit pension andpostretirement benefit plans covering substantially all of its union employees.Ameren has defined benefit pension plans covering substantially all of itsnon-union employees and postretirement benefit plans covering non-unionemployees hired before October 2015. Ameren uses a measurement date ofDecember 31 for its pension and postretirement benefit plans. AmerenMissouri and Ameren Illinois each participate in Ameren’s single-employerpension and other postretirement plans. Ameren’s qualified pension plan isthe Ameren Retirement Plan. Ameren also has an unfunded nonqualifiedpension plan, the Ameren Supplemental Retirement Plan, which is availableto provide certain management employees and retirees with a supplementalbenefit when their qualified pension plan benefits are capped in compliancewith Internal Revenue Code limitations. Ameren’s other postretirement planis the Ameren Retiree Welfare Benefit Plan. Effective December 31, 2016,the applicable assets and liabilities of the Ameren Group Life Insurance Planwere merged with the Ameren Retiree Welfare Benefit Plan. Only Amerensubsidiaries participate in the plans listed above.
Ameren’s unfunded obligation under its pension and other postretirementbenefit plans was $774 million and $567 million as of December 31, 2016 ,and December 31, 2015 , respectively. These net liabilities are recorded in"Other current liabilities," "Pension and other postretirement benefits," and"Other assets" on Ameren's consolidated balance sheet. The primary factorcontributing to the increase in the unfunded obligation during 2016 was a 50basis point decrease in the pension and other postretirement benefit plandiscount rates used to determine the present value of the obligation. Theincrease in the unfunded obligation also resulted in an increase to "Regulatoryassets" on Ameren's, Ameren Missouri's, and Ameren Illinois' consolidatedbalance sheet.
The following table presents the net benefit liability recorded on thebalance sheets of each of the Ameren Companies as of December 31, 2016and 2015 :
2016 2015Ameren (a) $ 774 $ 567Ameren Missouri 293 236Ameren Illinois 315 219
(a) Includes amounts for Ameren registrant and nonregistrant subsidiaries.
114
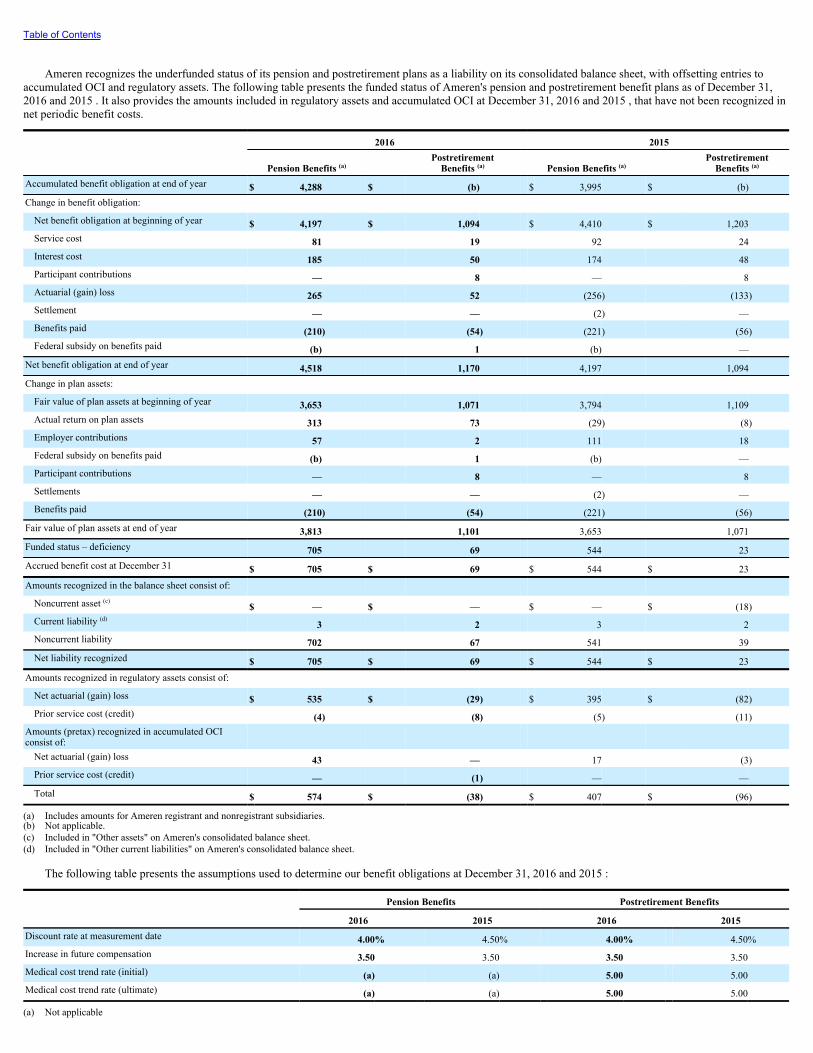
Table of Contents
Ameren recognizes the underfunded status of its pension and postretirement plans as a liability on its consolidated balance sheet, with offsetting entries toaccumulated OCI and regulatory assets. The following table presents the funded status of Ameren's pension and postretirement benefit plans as of December 31,2016 and 2015 . It also provides the amounts included in regulatory assets and accumulated OCI at December 31, 2016 and 2015 , that have not been recognized innet periodic benefit costs.
2016 2015
Pension Benefits (a) Postretirement
Benefits (a) Pension Benefits (a) Postretirement
Benefits (a)
Accumulated benefit obligation at end of year $ 4,288 $ (b) $ 3,995 $ (b)Change in benefit obligation: Net benefit obligation at beginning of year $ 4,197 $ 1,094 $ 4,410 $ 1,203Service cost 81 19 92 24Interest cost 185 50 174 48Participant contributions — 8 — 8Actuarial (gain) loss 265 52 (256) (133)Settlement — — (2) —Benefits paid (210) (54) (221) (56)Federal subsidy on benefits paid (b) 1 (b) —
Net benefit obligation at end of year 4,518 1,170 4,197 1,094Change in plan assets: Fair value of plan assets at beginning of year 3,653 1,071 3,794 1,109Actual return on plan assets 313 73 (29) (8)Employer contributions 57 2 111 18Federal subsidy on benefits paid (b) 1 (b) —Participant contributions — 8 — 8Settlements — — (2) —Benefits paid (210) (54) (221) (56)
Fair value of plan assets at end of year 3,813 1,101 3,653 1,071Funded status – deficiency 705 69 544 23Accrued benefit cost at December 31 $ 705 $ 69 $ 544 $ 23Amounts recognized in the balance sheet consist of: Noncurrent asset (c) $ — $ — $ — $ (18)Current liability (d) 3 2 3 2Noncurrent liability 702 67 541 39Net liability recognized $ 705 $ 69 $ 544 $ 23
Amounts recognized in regulatory assets consist of: Net actuarial (gain) loss $ 535 $ (29) $ 395 $ (82)Prior service cost (credit) (4) (8) (5) (11)
Amounts (pretax) recognized in accumulated OCIconsist of: Net actuarial (gain) loss 43 — 17 (3)Prior service cost (credit) — (1) — —Total $ 574 $ (38) $ 407 $ (96)
(a) Includes amounts for Ameren registrant and nonregistrant subsidiaries.(b) Not applicable.(c) Included in "Other assets" on Ameren's consolidated balance sheet.(d) Included in "Other current liabilities" on Ameren's consolidated balance sheet.
The following table presents the assumptions used to determine our benefit obligations at December 31, 2016 and 2015 :
Pension Benefits Postretirement Benefits
2016 2015 2016 2015Discount rate at measurement date 4.00% 4.50% 4.00% 4.50%Increase in future compensation 3.50 3.50 3.50 3.50Medical cost trend rate (initial) (a) (a) 5.00 5.00Medical cost trend rate (ultimate) (a) (a) 5.00 5.00
(a) Not applicable

115
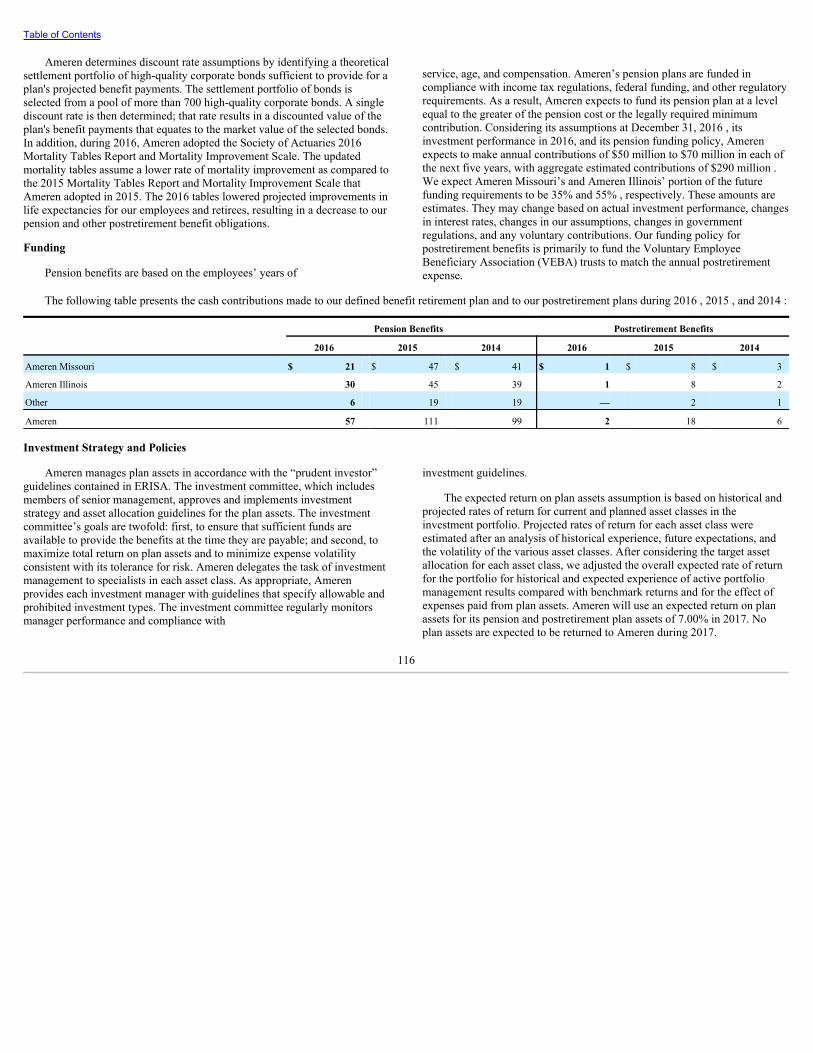
Table of Contents
Ameren determines discount rate assumptions by identifying a theoreticalsettlement portfolio of high-quality corporate bonds sufficient to provide for aplan's projected benefit payments. The settlement portfolio of bonds isselected from a pool of more than 700 high-quality corporate bonds. A singlediscount rate is then determined; that rate results in a discounted value of theplan's benefit payments that equates to the market value of the selected bonds.In addition, during 2016, Ameren adopted the Society of Actuaries 2016Mortality Tables Report and Mortality Improvement Scale. The updatedmortality tables assume a lower rate of mortality improvement as compared tothe 2015 Mortality Tables Report and Mortality Improvement Scale thatAmeren adopted in 2015. The 2016 tables lowered projected improvements inlife expectancies for our employees and retirees, resulting in a decrease to ourpension and other postretirement benefit obligations.
Funding
Pension benefits are based on the employees’ years of
service, age, and compensation. Ameren’s pension plans are funded incompliance with income tax regulations, federal funding, and other regulatoryrequirements. As a result, Ameren expects to fund its pension plan at a levelequal to the greater of the pension cost or the legally required minimumcontribution. Considering its assumptions at December 31, 2016 , itsinvestment performance in 2016, and its pension funding policy, Amerenexpects to make annual contributions of $50 million to $70 million in each ofthe next five years, with aggregate estimated contributions of $290 million .We expect Ameren Missouri’s and Ameren Illinois’ portion of the futurefunding requirements to be 35% and 55% , respectively. These amounts areestimates. They may change based on actual investment performance, changesin interest rates, changes in our assumptions, changes in governmentregulations, and any voluntary contributions. Our funding policy forpostretirement benefits is primarily to fund the Voluntary EmployeeBeneficiary Association (VEBA) trusts to match the annual postretirementexpense.
The following table presents the cash contributions made to our defined benefit retirement plan and to our postretirement plans during 2016 , 2015 , and 2014 :
Pension Benefits Postretirement Benefits
2016 2015 2014 2016 2015 2014
Ameren Missouri $ 21 $ 47 $ 41 $ 1 $ 8 $ 3
Ameren Illinois 30 45 39 1 8 2
Other 6 19 19 — 2 1
Ameren 57 111 99 2 18 6
Investment Strategy and Policies
Ameren manages plan assets in accordance with the “prudent investor”guidelines contained in ERISA. The investment committee, which includesmembers of senior management, approves and implements investmentstrategy and asset allocation guidelines for the plan assets. The investmentcommittee’s goals are twofold: first, to ensure that sufficient funds areavailable to provide the benefits at the time they are payable; and second, tomaximize total return on plan assets and to minimize expense volatilityconsistent with its tolerance for risk. Ameren delegates the task of investmentmanagement to specialists in each asset class. As appropriate, Amerenprovides each investment manager with guidelines that specify allowable andprohibited investment types. The investment committee regularly monitorsmanager performance and compliance with
investment guidelines.
The expected return on plan assets assumption is based on historical andprojected rates of return for current and planned asset classes in theinvestment portfolio. Projected rates of return for each asset class wereestimated after an analysis of historical experience, future expectations, andthe volatility of the various asset classes. After considering the target assetallocation for each asset class, we adjusted the overall expected rate of returnfor the portfolio for historical and expected experience of active portfoliomanagement results compared with benchmark returns and for the effect ofexpenses paid from plan assets. Ameren will use an expected return on planassets for its pension and postretirement plan assets of 7.00% in 2017. Noplan assets are expected to be returned to Ameren during 2017.
116
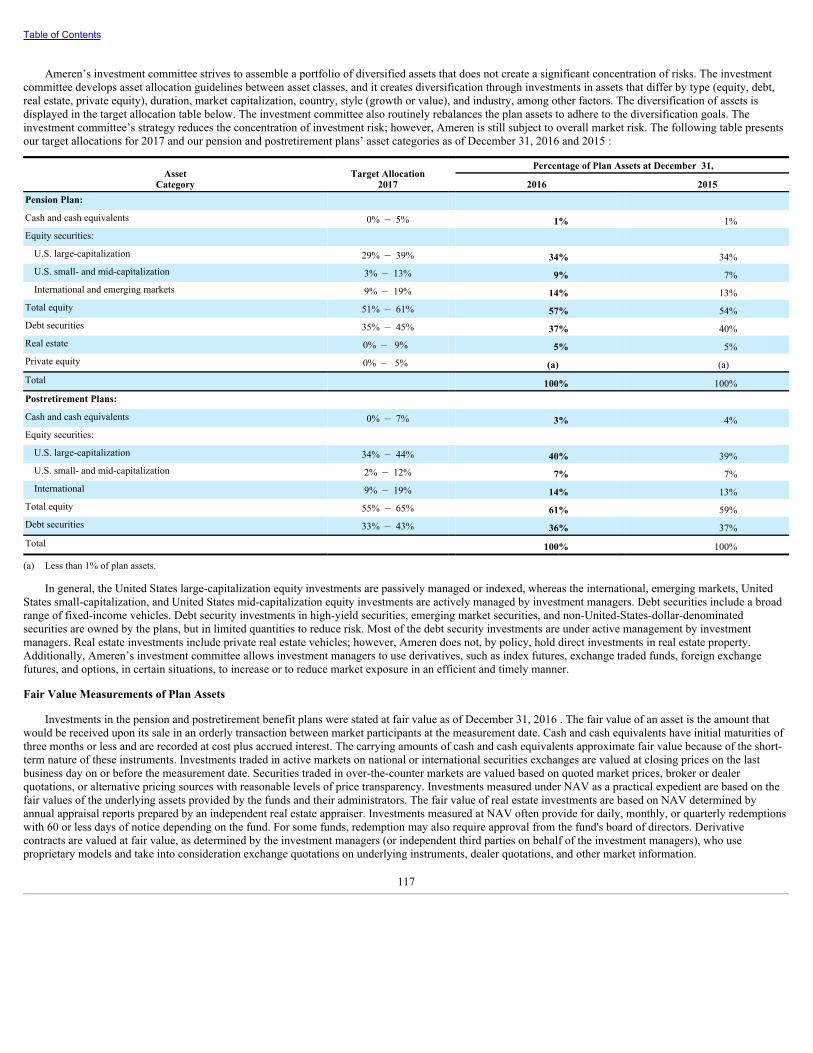
Table of Contents
Ameren’s investment committee strives to assemble a portfolio of diversified assets that does not create a significant concentration of risks. The investmentcommittee develops asset allocation guidelines between asset classes, and it creates diversification through investments in assets that differ by type (equity, debt,real estate, private equity), duration, market capitalization, country, style (growth or value), and industry, among other factors. The diversification of assets isdisplayed in the target allocation table below. The investment committee also routinely rebalances the plan assets to adhere to the diversification goals. Theinvestment committee’s strategy reduces the concentration of investment risk; however, Ameren is still subject to overall market risk. The following table presentsour target allocations for 2017 and our pension and postretirement plans’ asset categories as of December 31, 2016 and 2015 :
AssetCategory
Target Allocation2017
Percentage of Plan Assets at December 31,
2016 2015Pension Plan: Cash and cash equivalents 0% – 5% 1% 1%Equity securities: U.S. large-capitalization 29% – 39% 34% 34%U.S. small- and mid-capitalization 3% – 13% 9% 7%International and emerging markets 9% – 19% 14% 13%
Total equity 51% – 61% 57% 54%Debt securities 35% – 45% 37% 40%Real estate 0% – 9% 5% 5%Private equity 0% – 5% (a) (a)Total 100% 100%Postretirement Plans: Cash and cash equivalents 0% – 7% 3% 4%Equity securities: U.S. large-capitalization 34% – 44% 40% 39%U.S. small- and mid-capitalization 2% – 12% 7% 7%International 9% – 19% 14% 13%
Total equity 55% – 65% 61% 59%Debt securities 33% – 43% 36% 37%Total 100% 100%
(a) Less than 1% of plan assets.
In general, the United States large-capitalization equity investments are passively managed or indexed, whereas the international, emerging markets, UnitedStates small-capitalization, and United States mid-capitalization equity investments are actively managed by investment managers. Debt securities include a broadrange of fixed-income vehicles. Debt security investments in high-yield securities, emerging market securities, and non-United-States-dollar-denominatedsecurities are owned by the plans, but in limited quantities to reduce risk. Most of the debt security investments are under active management by investmentmanagers. Real estate investments include private real estate vehicles; however, Ameren does not, by policy, hold direct investments in real estate property.Additionally, Ameren’s investment committee allows investment managers to use derivatives, such as index futures, exchange traded funds, foreign exchangefutures, and options, in certain situations, to increase or to reduce market exposure in an efficient and timely manner.
Fair Value Measurements of Plan Assets
Investments in the pension and postretirement benefit plans were stated at fair value as of December 31, 2016 . The fair value of an asset is the amount thatwould be received upon its sale in an orderly transaction between market participants at the measurement date. Cash and cash equivalents have initial maturities ofthree months or less and are recorded at cost plus accrued interest. The carrying amounts of cash and cash equivalents approximate fair value because of the short-term nature of these instruments. Investments traded in active markets on national or international securities exchanges are valued at closing prices on the lastbusiness day on or before the measurement date. Securities traded in over-the-counter markets are valued based on quoted market prices, broker or dealerquotations, or alternative pricing sources with reasonable levels of price transparency. Investments measured under NAV as a practical expedient are based on thefair values of the underlying assets provided by the funds and their administrators. The fair value of real estate investments are based on NAV determined byannual appraisal reports prepared by an independent real estate appraiser. Investments measured at NAV often provide for daily, monthly, or quarterly redemptionswith 60 or less days of notice depending on the fund. For some funds, redemption may also require approval from the fund's board of directors. Derivativecontracts are valued at fair value, as determined by the investment managers (or independent third parties on behalf of the investment managers), who useproprietary models and take into consideration exchange quotations on underlying instruments, dealer quotations, and other market information.
117

Table of Contents
The following table sets forth, by level within the fair value hierarchy discussed in Note 8 – Fair Value Measurements, the pension plan assets measured at fairvalue as of December 31, 2016 :
Quoted Prices inActive Markets for
Identified Assets(Level 1)
Significant OtherObservable
Inputs(Level 2)
Significant OtherUnobservable
Inputs(Level 3) Measured at NAV (a) Total
Cash and cash equivalents $ — $ — $ — $ 33 $ 33Equity securities: U.S. large-capitalization — — — 1,352 1,352U.S. small- and mid-capitalization 361 — — — 361International and emerging markets 133 — — 389 522
Debt securities: Corporate bonds — 617 — 13 630Municipal bonds — 95 — — 95U.S. Treasury and agency securities — 701 — — 701Other — 21 — — 21
Real estate — — — 202 202Private equity — — — 6 6Total $ 494 $ 1,434 $ — $ 1,995 $ 3,923
Less: Medical benefit assets at December 31 (b) (132)
Plus: Net receivables at December 31 (c) 22Fair value of pension plans assets at year end $ 3,813
(a) Reflects the adoption of the new authoritative accounting guidance related to investments measured at the NAV practical expedient. See Note 1 - Summary of Significant AccountingPolicies for additional information.
(b) Medical benefit (health and welfare) component for accounts maintained in accordance with Section 401(h) of the Internal Revenue Code to fund a portion of the postretirement obligation.(c) Receivables related to pending security sales, offset by payables related to pending security purchases.
The following table sets forth, by level within the fair value hierarchy discussed in Note 8 – Fair Value Measurements, the pension plan assets measured at fairvalue as of December 31, 2015 :
Quoted Prices inActive Markets forIdentified Assets or
Liabilities(Level 1)
Significant OtherObservable
Inputs(Level 2)
Significant OtherUnobservable
Inputs(Level 3) Measured at NAV (a) Total
Cash and cash equivalents $ — $ — $ — $ 20 $ 20Equity securities: U.S. large-capitalization — — — 1,296 1,296U.S. small- and mid-capitalization 268 — — — 268International and emerging markets 122 126 — 243 491
Debt securities: Corporate bonds — 617 — 14 631Municipal bonds — 104 — — 104U.S. Treasury and agency securities 6 751 — — 757Other — 5 — — 5
Real estate — — — 168 168Private equity — — — 8 8Total $ 396 $ 1,603 $ — $ 1,749 $ 3,748
Less: Medical benefit assets at December 31 (b) (123)
Plus: Net receivables at December 31 (c) 28Fair value of pension plans assets at year end $ 3,653
(a) Reflects the adoption of the new authoritative accounting guidance related to investments measured at the NAV practical expedient. See Note 1 - Summary of Significant AccountingPolicies for additional information.
(b) Medical benefit (health and welfare) component for accounts maintained in accordance with Section 401(h) of the Internal Revenue Code to fund a portion of the postretirement obligation.(c) Receivables related to pending security sales, offset by payables related to pending security purchases.
The following table sets forth, by level within the fair value hierarchy discussed in Note 8 – Fair Value Measurements, the postretirement benefit plans assetsmeasured at fair value as of December 31, 2016 :
118
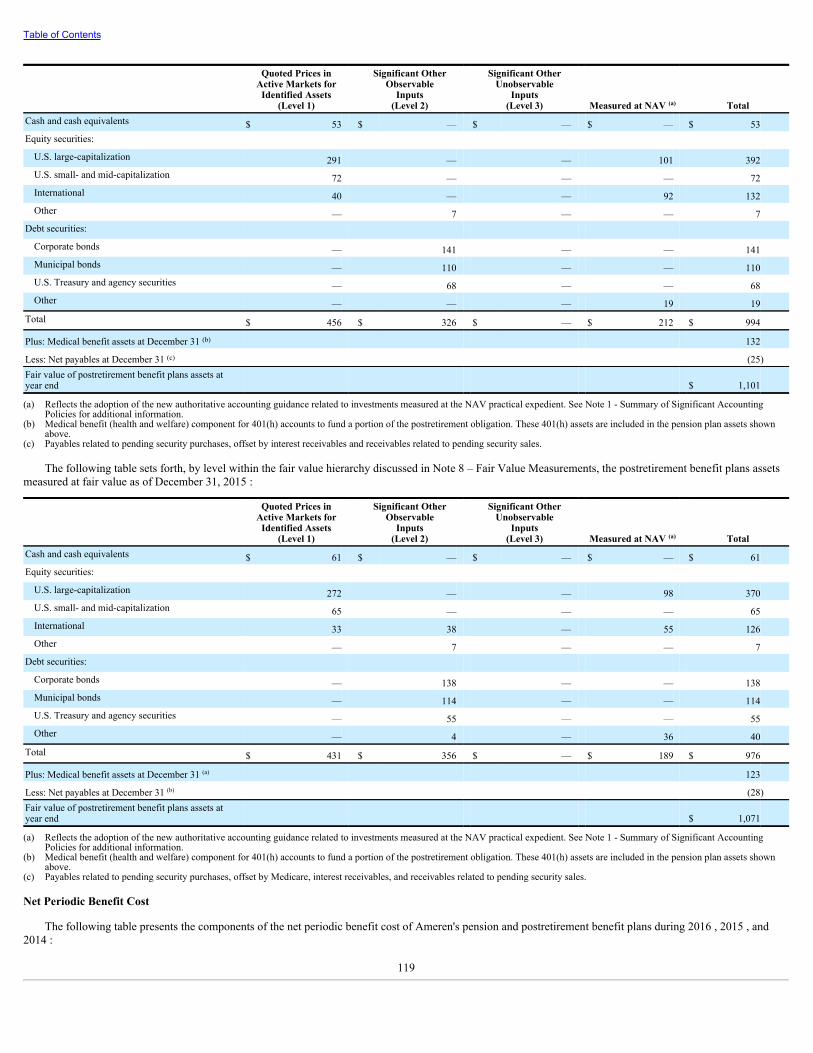
Table of Contents
Quoted Prices inActive Markets for
Identified Assets(Level 1)
Significant OtherObservable
Inputs(Level 2)
Significant OtherUnobservable
Inputs(Level 3) Measured at NAV (a) Total
Cash and cash equivalents $ 53 $ — $ — $ — $ 53Equity securities: U.S. large-capitalization 291 — — 101 392U.S. small- and mid-capitalization 72 — — — 72International 40 — — 92 132Other — 7 — — 7
Debt securities: Corporate bonds — 141 — — 141Municipal bonds — 110 — — 110U.S. Treasury and agency securities — 68 — — 68Other — — — 19 19
Total $ 456 $ 326 $ — $ 212 $ 994
Plus: Medical benefit assets at December 31 (b) 132
Less: Net payables at December 31 (c) (25)Fair value of postretirement benefit plans assets atyear end $ 1,101
(a) Reflects the adoption of the new authoritative accounting guidance related to investments measured at the NAV practical expedient. See Note 1 - Summary of Significant AccountingPolicies for additional information.
(b) Medical benefit (health and welfare) component for 401(h) accounts to fund a portion of the postretirement obligation. These 401(h) assets are included in the pension plan assets shownabove.
(c) Payables related to pending security purchases, offset by interest receivables and receivables related to pending security sales.
The following table sets forth, by level within the fair value hierarchy discussed in Note 8 – Fair Value Measurements, the postretirement benefit plans assetsmeasured at fair value as of December 31, 2015 :
Quoted Prices inActive Markets for
Identified Assets(Level 1)
Significant OtherObservable
Inputs(Level 2)
Significant OtherUnobservable
Inputs(Level 3) Measured at NAV (a) Total
Cash and cash equivalents $ 61 $ — $ — $ — $ 61Equity securities: U.S. large-capitalization 272 — — 98 370U.S. small- and mid-capitalization 65 — — — 65International 33 38 — 55 126Other — 7 — — 7
Debt securities: Corporate bonds — 138 — — 138Municipal bonds — 114 — — 114U.S. Treasury and agency securities — 55 — — 55Other — 4 — 36 40
Total $ 431 $ 356 $ — $ 189 $ 976
Plus: Medical benefit assets at December 31 (a) 123
Less: Net payables at December 31 (b) (28)Fair value of postretirement benefit plans assets atyear end $ 1,071
(a) Reflects the adoption of the new authoritative accounting guidance related to investments measured at the NAV practical expedient. See Note 1 - Summary of Significant AccountingPolicies for additional information.
(b) Medical benefit (health and welfare) component for 401(h) accounts to fund a portion of the postretirement obligation. These 401(h) assets are included in the pension plan assets shownabove.
(c) Payables related to pending security purchases, offset by Medicare, interest receivables, and receivables related to pending security sales.
Net Periodic Benefit Cost
The following table presents the components of the net periodic benefit cost of Ameren's pension and postretirement benefit plans during 2016 , 2015 , and2014 :
119
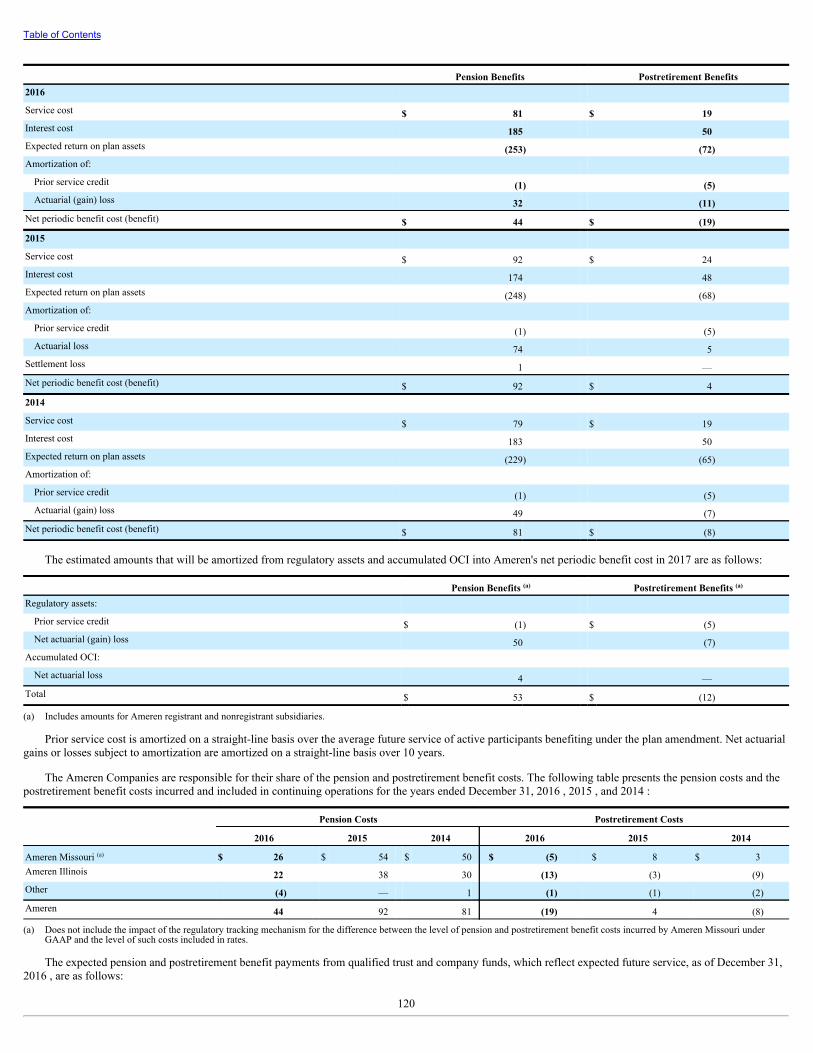
Table of Contents
Pension Benefits Postretirement Benefits2016 Service cost $ 81 $ 19Interest cost 185 50Expected return on plan assets (253) (72)Amortization of: Prior service credit (1) (5)Actuarial (gain) loss 32 (11)
Net periodic benefit cost (benefit) $ 44 $ (19)2015 Service cost $ 92 $ 24Interest cost 174 48Expected return on plan assets (248) (68)Amortization of: Prior service credit (1) (5)Actuarial loss 74 5
Settlement loss 1 —Net periodic benefit cost (benefit) $ 92 $ 42014 Service cost $ 79 $ 19Interest cost 183 50Expected return on plan assets (229) (65)Amortization of: Prior service credit (1) (5)Actuarial (gain) loss 49 (7)
Net periodic benefit cost (benefit) $ 81 $ (8)
The estimated amounts that will be amortized from regulatory assets and accumulated OCI into Ameren's net periodic benefit cost in 2017 are as follows:
Pension Benefits (a) Postretirement Benefits (a)
Regulatory assets: Prior service credit $ (1) $ (5)Net actuarial (gain) loss 50 (7)
Accumulated OCI: Net actuarial loss 4 —
Total $ 53 $ (12)
(a) Includes amounts for Ameren registrant and nonregistrant subsidiaries.
Prior service cost is amortized on a straight-line basis over the average future service of active participants benefiting under the plan amendment. Net actuarialgains or losses subject to amortization are amortized on a straight-line basis over 10 years.
The Ameren Companies are responsible for their share of the pension and postretirement benefit costs. The following table presents the pension costs and thepostretirement benefit costs incurred and included in continuing operations for the years ended December 31, 2016 , 2015 , and 2014 :
Pension Costs Postretirement Costs
2016 2015 2014 2016 2015 2014
Ameren Missouri (a) $ 26 $ 54 $ 50 $ (5) $ 8 $ 3Ameren Illinois 22 38 30 (13) (3) (9)Other (4) — 1 (1) (1) (2)Ameren 44 92 81 (19) 4 (8)
(a) Does not include the impact of the regulatory tracking mechanism for the difference between the level of pension and postretirement benefit costs incurred by Ameren Missouri underGAAP and the level of such costs included in rates.
The expected pension and postretirement benefit payments from qualified trust and company funds, which reflect expected future service, as of December 31,2016 , are as follows:
120

Table of Contents
Pension Benefits Postretirement Benefits
Paid fromQualified
Trust Funds
Paid from Company
Funds
Paid from Qualified
Trust Funds
Paid from Company
Funds2017 $ 248 $ 3 $ 54 $ 22018 254 3 57 22019 261 3 59 22020 265 3 61 22021 273 3 63 22022 – 2026 1,405 13 331 12
The following table presents the assumptions used to determine net periodic benefit cost for our pension and postretirement benefit plans for the years endedDecember 31, 2016 , 2015 , and 2014 :
Pension Benefits Postretirement Benefits
2016 2015 2014 2016 2015 2014Discount rate at measurement date 4.50% 4.00% 4.75% 4.50% 4.00% 4.75%Expected return on plan assets 7.00 7.25 7.25 7.00 7.00 7.00Increase in future compensation 3.50 3.50 3.50 3.50 3.50 3.50Medical cost trend rate (initial) (a) (a) (a) 5.00 5.00 5.00Medical cost trend rate (ultimate) (a) (a) (a) 5.00 5.00 5.00
(a) Not applicable
The table below reflects the sensitivity of Ameren’s plans to potential changes in key assumptions:
Pension Benefits Postretirement Benefits
Service Costand Interest
Cost
Projected Benefit
Obligation
Service Cost and Interest
Cost
Postretirement Benefit
Obligation
0.25% decrease in discount rate $ (1) $ 142 $ — $ 380.25% increase in salary scale 2 16 — —1.00% increase in annual medical trend — — 3 541.00% decrease in annual medical trend — — (3) (54)
Other
Ameren sponsors a 401(k) plan for eligible employees. The Ameren 401(k) plan covered all eligible employees at December 31, 2016 . The plan allowsemployees to contribute a portion of their compensation in accordance with specific guidelines. Ameren matches a percentage of the employee contributions up tocertain limits. The following table presents the portion of the matching contribution to the Ameren 401(k) plan attributable to the continuing operations for each ofthe Ameren Companies for the years ended December 31, 2016 , 2015 , and 2014 :
2016 2015 2014
Ameren Missouri $ 16 $ 16 $ 16Ameren Illinois 12 12 11Other 1 1 1Ameren 29 29 28
NOTE 12 – STOCK-BASED COMPENSATION
The 2014 Incentive Plan is Ameren’s long-term stock compensation plan for eligible employees and directors. The 2006 Incentive Plan was replacedprospectively for new grants beginning in April 2014. The 2014 Incentive Plan provides for a maximum of 8 million common shares to be available for grant toeligible employees and directors. At December 31, 2016, there were 5.8 million common shares remaining for grant under the 2014 Incentive Plan. The 2014Incentive Plan awards may be stock options, stock appreciation rights, restricted stock, restricted stock units, performance shares, performance share units, cash-based awards, and other stock-based awards.
Performance Share Units
121
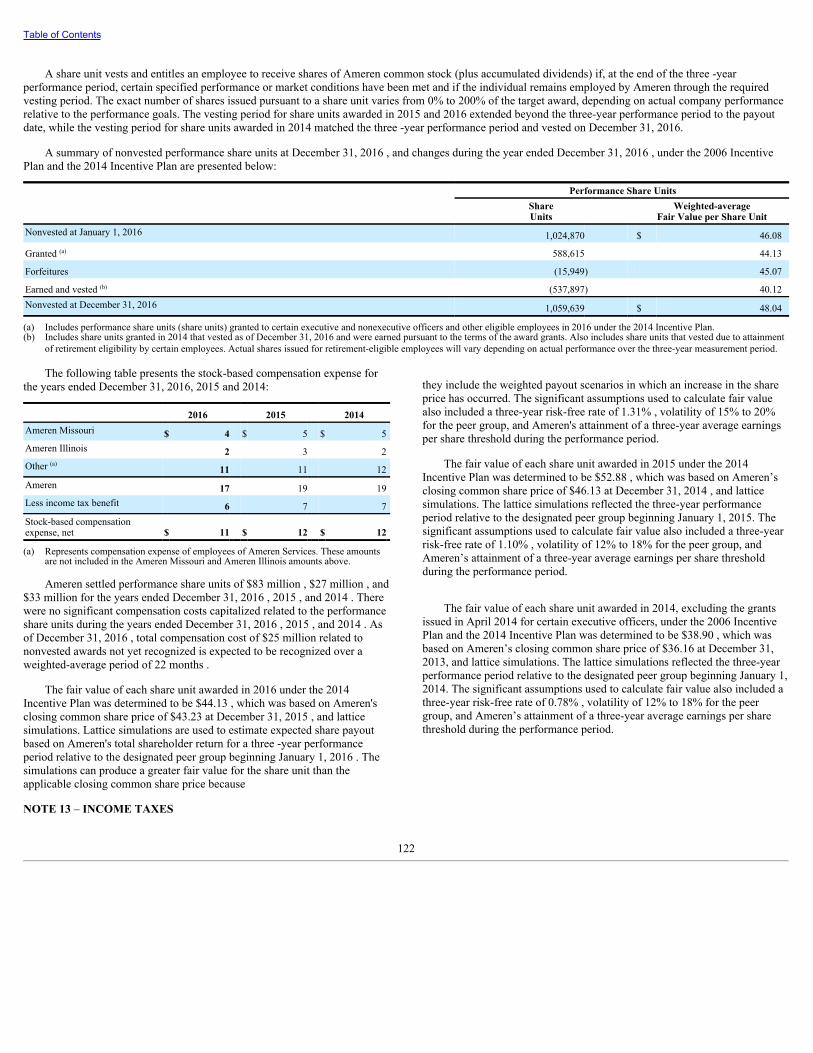
Table of Contents
A share unit vests and entitles an employee to receive shares of Ameren common stock (plus accumulated dividends) if, at the end of the three -yearperformance period, certain specified performance or market conditions have been met and if the individual remains employed by Ameren through the requiredvesting period. The exact number of shares issued pursuant to a share unit varies from 0% to 200% of the target award, depending on actual company performancerelative to the performance goals. The vesting period for share units awarded in 2015 and 2016 extended beyond the three-year performance period to the payoutdate, while the vesting period for share units awarded in 2014 matched the three -year performance period and vested on December 31, 2016.
A summary of nonvested performance share units at December 31, 2016 , and changes during the year ended December 31, 2016 , under the 2006 IncentivePlan and the 2014 Incentive Plan are presented below:
Performance Share Units
ShareUnits
Weighted-averageFair Value per Share Unit
Nonvested at January 1, 2016 1,024,870 $ 46.08
Granted (a) 588,615 44.13
Forfeitures (15,949) 45.07
Earned and vested (b) (537,897) 40.12Nonvested at December 31, 2016 1,059,639 $ 48.04
(a) Includes performance share units (share units) granted to certain executive and nonexecutive officers and other eligible employees in 2016 under the 2014 Incentive Plan.(b) Includes share units granted in 2014 that vested as of December 31, 2016 and were earned pursuant to the terms of the award grants. Also includes share units that vested due to attainment
of retirement eligibility by certain employees. Actual shares issued for retirement-eligible employees will vary depending on actual performance over the three-year measurement period.
The following table presents the stock-based compensation expense forthe years ended December 31, 2016, 2015 and 2014:
2016 2015 2014Ameren Missouri $ 4 $ 5 $ 5Ameren Illinois 2 3 2Other (a) 11 11 12Ameren 17 19 19Less income tax benefit 6 7 7Stock-based compensationexpense, net $ 11 $ 12 $ 12
(a) Represents compensation expense of employees of Ameren Services. These amountsare not included in the Ameren Missouri and Ameren Illinois amounts above.
Ameren settled performance share units of $83 million , $27 million , and$33 million for the years ended December 31, 2016 , 2015 , and 2014 . Therewere no significant compensation costs capitalized related to the performanceshare units during the years ended December 31, 2016 , 2015 , and 2014 . Asof December 31, 2016 , total compensation cost of $25 million related tononvested awards not yet recognized is expected to be recognized over aweighted-average period of 22 months .
The fair value of each share unit awarded in 2016 under the 2014Incentive Plan was determined to be $44.13 , which was based on Ameren'sclosing common share price of $43.23 at December 31, 2015 , and latticesimulations. Lattice simulations are used to estimate expected share payoutbased on Ameren's total shareholder return for a three -year performanceperiod relative to the designated peer group beginning January 1, 2016 . Thesimulations can produce a greater fair value for the share unit than theapplicable closing common share price because
they include the weighted payout scenarios in which an increase in the shareprice has occurred. The significant assumptions used to calculate fair valuealso included a three-year risk-free rate of 1.31% , volatility of 15% to 20%for the peer group, and Ameren's attainment of a three-year average earningsper share threshold during the performance period.
The fair value of each share unit awarded in 2015 under the 2014Incentive Plan was determined to be $52.88 , which was based on Ameren’sclosing common share price of $46.13 at December 31, 2014 , and latticesimulations. The lattice simulations reflected the three-year performanceperiod relative to the designated peer group beginning January 1, 2015. Thesignificant assumptions used to calculate fair value also included a three-yearrisk-free rate of 1.10% , volatility of 12% to 18% for the peer group, andAmeren’s attainment of a three-year average earnings per share thresholdduring the performance period.
The fair value of each share unit awarded in 2014, excluding the grantsissued in April 2014 for certain executive officers, under the 2006 IncentivePlan and the 2014 Incentive Plan was determined to be $38.90 , which wasbased on Ameren’s closing common share price of $36.16 at December 31,2013, and lattice simulations. The lattice simulations reflected the three-yearperformance period relative to the designated peer group beginning January 1,2014. The significant assumptions used to calculate fair value also included athree-year risk-free rate of 0.78% , volatility of 12% to 18% for the peergroup, and Ameren’s attainment of a three-year average earnings per sharethreshold during the performance period.
NOTE 13 – INCOME TAXES
122
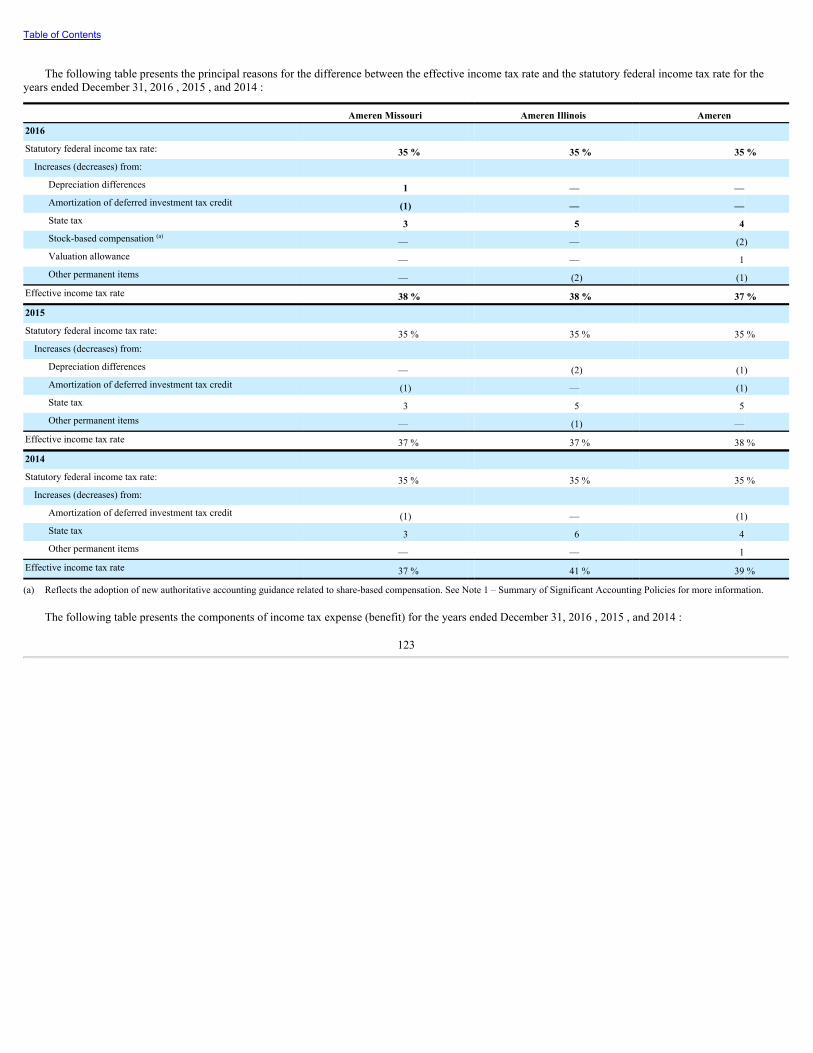
Table of Contents
The following table presents the principal reasons for the difference between the effective income tax rate and the statutory federal income tax rate for theyears ended December 31, 2016 , 2015 , and 2014 :
Ameren Missouri Ameren Illinois Ameren2016 Statutory federal income tax rate: 35 % 35 % 35 %Increases (decreases) from:
Depreciation differences 1 — —Amortization of deferred investment tax credit (1) — —State tax 3 5 4Stock-based compensation (a) — — (2)Valuation allowance — — 1Other permanent items — (2) (1)
Effective income tax rate 38 % 38 % 37 %2015 Statutory federal income tax rate: 35 % 35 % 35 %Increases (decreases) from:
Depreciation differences — (2) (1)Amortization of deferred investment tax credit (1) — (1)State tax 3 5 5Other permanent items — (1) —
Effective income tax rate 37 % 37 % 38 %2014 Statutory federal income tax rate: 35 % 35 % 35 %Increases (decreases) from:
Amortization of deferred investment tax credit (1) — (1)State tax 3 6 4Other permanent items — — 1
Effective income tax rate 37 % 41 % 39 %
(a) Reflects the adoption of new authoritative accounting guidance related to share-based compensation. See Note 1 – Summary of Significant Accounting Policies for more information.
The following table presents the components of income tax expense (benefit) for the years ended December 31, 2016 , 2015 , and 2014 :
123
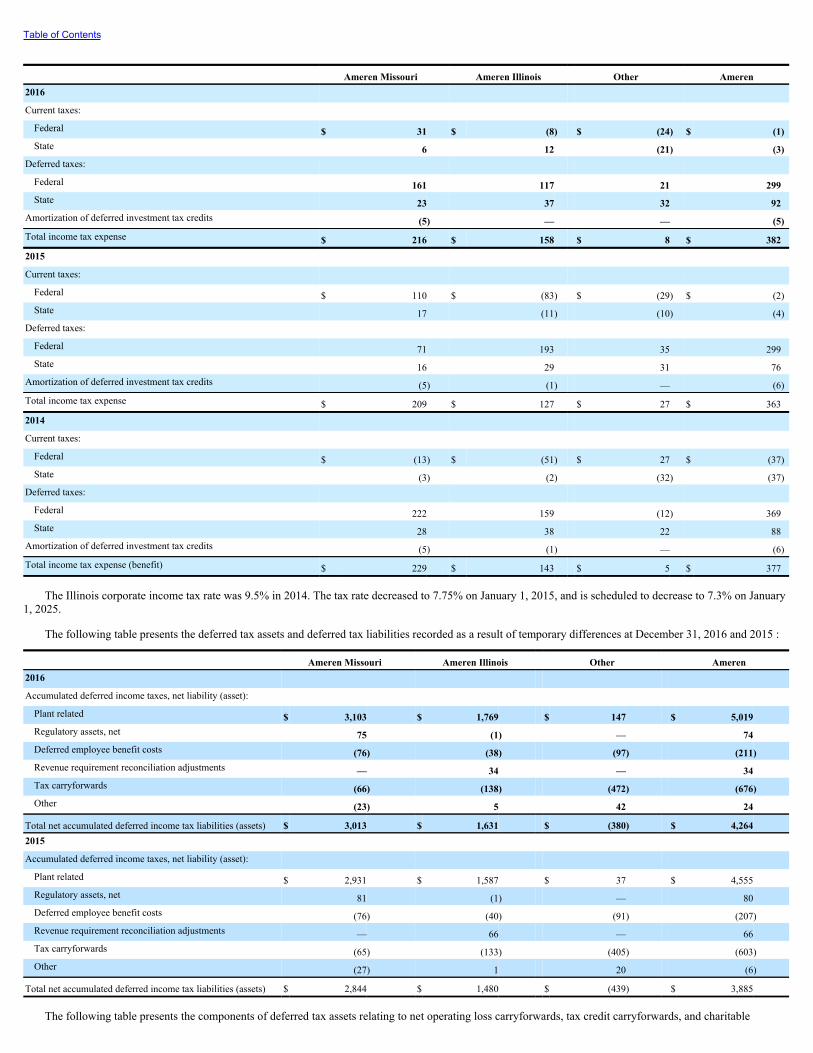
Table of Contents
Ameren Missouri Ameren Illinois Other Ameren2016 Current taxes: Federal $ 31 $ (8) $ (24) $ (1)State 6 12 (21) (3)
Deferred taxes: Federal 161 117 21 299State 23 37 32 92
Amortization of deferred investment tax credits (5) — — (5)Total income tax expense $ 216 $ 158 $ 8 $ 3822015 Current taxes: Federal $ 110 $ (83) $ (29) $ (2)State 17 (11) (10) (4)
Deferred taxes: Federal 71 193 35 299State 16 29 31 76
Amortization of deferred investment tax credits (5) (1) — (6)Total income tax expense $ 209 $ 127 $ 27 $ 3632014 Current taxes: Federal $ (13) $ (51) $ 27 $ (37)State (3) (2) (32) (37)
Deferred taxes: Federal 222 159 (12) 369State 28 38 22 88
Amortization of deferred investment tax credits (5) (1) — (6)Total income tax expense (benefit) $ 229 $ 143 $ 5 $ 377
The Illinois corporate income tax rate was 9.5% in 2014. The tax rate decreased to 7.75% on January 1, 2015, and is scheduled to decrease to 7.3% on January1, 2025.
The following table presents the deferred tax assets and deferred tax liabilities recorded as a result of temporary differences at December 31, 2016 and 2015 :
Ameren Missouri Ameren Illinois Other Ameren2016 Accumulated deferred income taxes, net liability (asset): Plant related $ 3,103 $ 1,769 $ 147 $ 5,019Regulatory assets, net 75 (1) — 74Deferred employee benefit costs (76) (38) (97) (211)Revenue requirement reconciliation adjustments — 34 — 34Tax carryforwards (66) (138) (472) (676)Other (23) 5 42 24
Total net accumulated deferred income tax liabilities (assets) $ 3,013 $ 1,631 $ (380) $ 4,2642015 Accumulated deferred income taxes, net liability (asset): Plant related $ 2,931 $ 1,587 $ 37 $ 4,555Regulatory assets, net 81 (1) — 80Deferred employee benefit costs (76) (40) (91) (207)Revenue requirement reconciliation adjustments — 66 — 66Tax carryforwards (65) (133) (405) (603)Other (27) 1 20 (6)
Total net accumulated deferred income tax liabilities (assets) $ 2,844 $ 1,480 $ (439) $ 3,885
The following table presents the components of deferred tax assets relating to net operating loss carryforwards, tax credit carryforwards, and charitable

contribution carryforwards at December 31, 2016 and 2015 :
124

Table of Contents
Ameren Missouri Ameren Illinois Other Ameren2016 Net operating loss carryforwards:
Federal (a) $ 33 $ 137 $ 324 $ 494
State (a) 4 — 41 45Total net operating loss carryforwards $ 37 $ 137 $ 365 $ 539Tax credit carryforwards:
Federal (a) $ 29 $ 1 $ 79 $ 109
State (b) — — 21 21Total tax credit carryforwards $ 29 $ 1 $ 100 $ 130Charitable contribution carryforwards (b) $ — $ — $ 18 $ 18Valuation allowance (c) — — (11) (11)
Total charitable contribution carryforwards $ — $ — $ 7 $ 72015 Net operating loss carryforwards:
Federal $ 35 $ 127 $ 245 $ 407
State 4 4 38 46Total net operating loss carryforwards $ 39 $ 131 $ 283 $ 453Tax credit carryforwards:
Federal $ 26 $ 1 $ 78 $ 105
State — 1 40 41
State valuation allowance — — (2) (2)Total tax credit carryforwards $ 26 $ 2 $ 116 $ 144Charitable contribution carryforwards $ — $ — $ 10 $ 10Valuation allowance — — (4) (4)
Total charitable contribution carryforwards $ — $ — $ 6 $ 6
(a) Will expire between 2029 and 2036 .(b) Will expire between 2017 and 2021 .(c) See Schedule II under Part IV, Item 15, in this report for information on changes in the valuation allowance.
Uncertain Tax Positions
As of December 31, 2016 and 2015, the Ameren Companies did not record any uncertain tax positions. The settlements discussed below resolved previouslyrecorded uncertain tax positions.
In 2015, final settlements for tax years 2012 and 2013 were reached with the IRS. The 2015 settlement of the 2013 tax year impacted discontinued operations.See Note 1 – Summary of Significant Accounting Policies for additional information.
In 2014, final settlements for tax years 2007 through 2011 were reached with the IRS. These settlements, which resolved the uncertain tax positions associatedwith the timing of research tax deductions for these years, resulted in a decrease in Ameren’s and Ameren Missouri’s unrecognized tax benefits of $20 million , and$13 million , respectively. In addition, the settlement for tax years 2007 through 2011 provided certainty for the previously uncertain tax positions associated withthe timing of research tax deductions for the remaining open tax years of 2012, 2013, and 2014. The certainty provided from the settlement resulted in an $18million decrease in both Ameren’s and Ameren Missouri’s unrecognized tax benefits. The settlement also resulted in a $2 million increase to Ameren’s stateunrecognized tax benefits. The net reduction in unrecognized tax benefits in 2014 did not materially affect income tax expense for the Ameren Companies.
State income tax returns are generally subject to examination for a period of three years after filing. The state impact of any federal changes remains subject toexamination by various states for up to one year after formal notification to the states. The Ameren Companies currently do not have material state income taxissues under examination, administrative appeals, or litigation.
Ameren Missouri has an uncertain tax position tracker. Under Missouri's regulatory framework, uncertain tax positions do not reduce Ameren Missouri'selectric rate base. When an uncertain income tax position liability is resolved, the MoPSC requires, through the uncertain tax position tracker, the creation of aregulatory asset or regulatory liability to reflect the time value, using the weighted-average cost of capital included in each of the electric rate orders in effectbefore the tax position was resolved, of the difference between the uncertain tax position liability that was excluded from rate base and the final tax liability. Theresulting regulatory asset or liability will affect earnings in the year it is created and then will be amortized over three years, beginning on the effective date of newrates established in the next electric rate case.
125
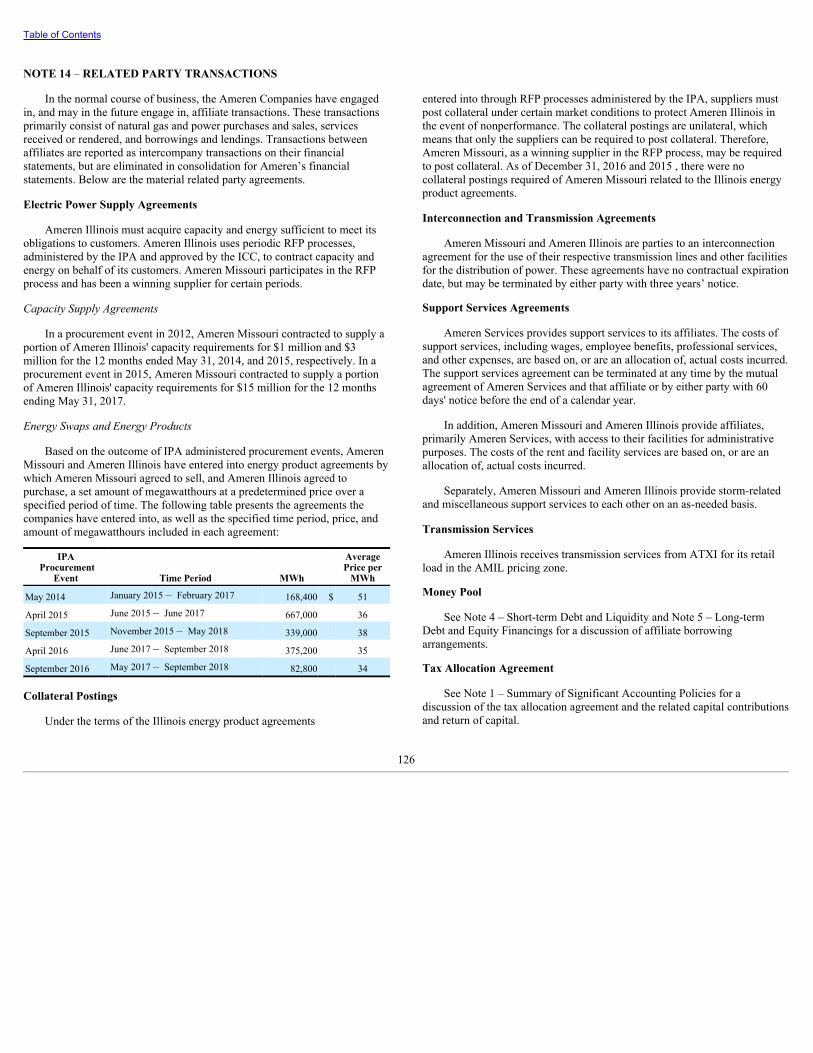
Table of Contents
NOTE 14 – RELATED PARTY TRANSACTIONS
In the normal course of business, the Ameren Companies have engagedin, and may in the future engage in, affiliate transactions. These transactionsprimarily consist of natural gas and power purchases and sales, servicesreceived or rendered, and borrowings and lendings. Transactions betweenaffiliates are reported as intercompany transactions on their financialstatements, but are eliminated in consolidation for Ameren’s financialstatements. Below are the material related party agreements.
Electric Power Supply Agreements
Ameren Illinois must acquire capacity and energy sufficient to meet itsobligations to customers. Ameren Illinois uses periodic RFP processes,administered by the IPA and approved by the ICC, to contract capacity andenergy on behalf of its customers. Ameren Missouri participates in the RFPprocess and has been a winning supplier for certain periods.
Capacity Supply Agreements
In a procurement event in 2012, Ameren Missouri contracted to supply aportion of Ameren Illinois' capacity requirements for $1 million and $3million for the 12 months ended May 31, 2014, and 2015, respectively. In aprocurement event in 2015, Ameren Missouri contracted to supply a portionof Ameren Illinois' capacity requirements for $15 million for the 12 monthsending May 31, 2017.
Energy Swaps and Energy Products
Based on the outcome of IPA administered procurement events, AmerenMissouri and Ameren Illinois have entered into energy product agreements bywhich Ameren Missouri agreed to sell, and Ameren Illinois agreed topurchase, a set amount of megawatthours at a predetermined price over aspecified period of time. The following table presents the agreements thecompanies have entered into, as well as the specified time period, price, andamount of megawatthours included in each agreement:
IPA Procurement
Event Time Period MWh
AveragePrice per
MWh
May 2014 January 2015 – February 2017 168,400 $ 51
April 2015 June 2015 – June 2017 667,000 36
September 2015 November 2015 – May 2018 339,000 38
April 2016 June 2017 – September 2018 375,200 35
September 2016 May 2017 – September 2018 82,800 34
Collateral Postings
Under the terms of the Illinois energy product agreements
entered into through RFP processes administered by the IPA, suppliers mustpost collateral under certain market conditions to protect Ameren Illinois inthe event of nonperformance. The collateral postings are unilateral, whichmeans that only the suppliers can be required to post collateral. Therefore,Ameren Missouri, as a winning supplier in the RFP process, may be requiredto post collateral. As of December 31, 2016 and 2015 , there were nocollateral postings required of Ameren Missouri related to the Illinois energyproduct agreements.
Interconnection and Transmission Agreements
Ameren Missouri and Ameren Illinois are parties to an interconnectionagreement for the use of their respective transmission lines and other facilitiesfor the distribution of power. These agreements have no contractual expirationdate, but may be terminated by either party with three years’ notice.
Support Services Agreements
Ameren Services provides support services to its affiliates. The costs ofsupport services, including wages, employee benefits, professional services,and other expenses, are based on, or are an allocation of, actual costs incurred.The support services agreement can be terminated at any time by the mutualagreement of Ameren Services and that affiliate or by either party with 60days' notice before the end of a calendar year.
In addition, Ameren Missouri and Ameren Illinois provide affiliates,primarily Ameren Services, with access to their facilities for administrativepurposes. The costs of the rent and facility services are based on, or are anallocation of, actual costs incurred.
Separately, Ameren Missouri and Ameren Illinois provide storm-relatedand miscellaneous support services to each other on an as-needed basis.
Transmission Services
Ameren Illinois receives transmission services from ATXI for its retailload in the AMIL pricing zone.
Money Pool
See Note 4 – Short-term Debt and Liquidity and Note 5 – Long-termDebt and Equity Financings for a discussion of affiliate borrowingarrangements.
Tax Allocation Agreement
See Note 1 – Summary of Significant Accounting Policies for adiscussion of the tax allocation agreement and the related capital contributionsand return of capital.
126
Table of Contents
The following table presents the impact on Ameren Missouri and Ameren Illinois of related party transactions for the years ended December 31, 2016 , 2015 ,and 2014 . It is based primarily on the agreements discussed above and the money pool arrangements discussed in Note 4 – Short-term Debt and Liquidity.
AgreementIncome Statement LineItem
AmerenMissouri
AmerenIllinois
Ameren Missouri power supply agreements Operating Revenues 2016 $ 28 $ (a)with Ameren Illinois 2015 15 (a) 2014 5 (a)Ameren Missouri and Ameren Illinois Operating Revenues 2016 25 5rent and facility services 2015 25 4 2014 21 2Ameren Missouri and Ameren Illinois Operating Revenues 2016 1 (b)miscellaneous support services 2015 2 (b) 2014 1 (b)
Total Operating Revenues 2016 $ 54 $ 5 2015 42 4 2014 27 2Ameren Illinois power supply Purchased Power 2016 $ (a) $ 28agreements with Ameren Missouri 2015 (a) 15 2014 (a) 5Ameren Illinois transmission Purchased Power 2016 (a) 2services from ATXI 2015 (a) 2 2014 (a) 2
Total Purchased Power 2016 $ (a) $ 30 2015 (a) 17 2014 (a) 7Ameren Services support services Other Operations and 2016 $ 129 $ 123agreement Maintenance 2015 131 119 2014 124 109Money pool borrowings (advances) Interest (Charges) 2016 $ (b) $ (b) Income 2015 (b) (b) 2014 (b) (b)
(a) Not applicable.(b) Amount less than $1 million.
NOTE 15 – COMMITMENTS AND CONTINGENCIES
We are involved in legal, tax, and regulatory proceedings before various courts, regulatory commissions, authorities, and governmental agencies with respectto matters that arise in the ordinary course of business, some of which involve substantial amounts of money. We believe that the final disposition of theseproceedings, except as otherwise disclosed in these notes to our financial statements, will not have a material adverse effect on our results of operations, financialposition, or liquidity.
See also Note 1 – Summary of Significant Accounting Policies, Note 2 – Rate and Regulatory Matters, Note 10 – Callaway Energy Center, and Note 14 –Related Party Transactions in this report.
127

Table of Contents
Callaway Energy Center
The following table presents insurance coverage at Ameren Missouri’s Callaway energy center at December 31, 2016 . The property coverage and the nuclearliability coverage renewal dates are April 1 and January 1, respectively, of each year.
Type and Source of Coverage Maximum Coverages Maximum Assessments Public liability and nuclear worker liability: American Nuclear Insurers $ 375 (a) $ — Pool participation 12,986 (b) 127 (c)
$ 13,361 (d) $ 127 Property damage: Nuclear Electric Insurance Limited $ 2,710 (e) $ 30 (f) European Mutual Association for Nuclear Insurance 450 (g) —
$ 3,160 $ 30 Replacement power: Nuclear Electric Insurance Limited $ 490 (h) $ 7 (f)
(a) Effective January 1, 2017, limit was increased to $450 million.(b) Provided through mandatory participation in an industrywide retrospective premium assessment program.(c) Retrospective premium under the Price-Anderson Act. This is subject to retrospective assessment with respect to a covered loss in excess of $375 million in the event of an incident at any
licensed United States commercial reactor, payable at $19 million per year.(d) Limit of liability for each incident under the Price-Anderson liability provisions of the Atomic Energy Act of 1954, as amended. A company could be assessed up to $127 million per
incident for each licensed reactor it operates, with a maximum of $19 million per incident to be paid in a calendar year for each reactor. This limit is subject to change to account for theeffects of inflation and changes in the number of licensed reactors.
(e) NEIL provides $2.71 billion in property damage, decontamination, and premature decommissioning insurance for radiation events. NEIL provides $2.3 billion in property damage fornonradiation events.
(f) All NEIL-insured plants could be subject to assessments should losses exceed the accumulated funds from NEIL.(g) European Mutual Association for Nuclear Insurance provides $450 million in excess of the $2.71 billion and $2.3 billion property coverage for radiation and nonradiation events,
respectively, provided by NEIL.(h) Provides replacement power cost insurance in the event of a prolonged accidental outage. Weekly indemnity is up to $4.5 million for 52 weeks, which commences after the first 12 weeks
of an outage, plus up to $3.6 million per week for a minimum of 71 weeks thereafter, for a total not exceeding the policy limit of $490 million . Nonradiation events are sub-limited to $328million .
The Price-Anderson Act is a federal law that limits the liability for claims from an incident involving any licensed United States commercial nuclear energycenter. The limit is based on the number of licensed reactors. The limit of liability and the maximum potential annual payments are adjusted at least every fiveyears for inflation to reflect changes in the Consumer Price Index. The most recent five-year inflationary adjustment became effective in September 2013. Ownersof a nuclear reactor cover this exposure through a combination of private insurance and mandatory participation in a financial protection pool, as established by thePrice-Anderson Act.
Losses resulting from terrorist attacks on nuclear facilities are covered under NEIL’s insurance policies, subject to an industrywide aggregate policy coveragelimit of $3.24 billion within a 12-month period, or $ 1.83 billion for events not involving radiation contamination.
If losses from a nuclear incident at the Callaway energy center exceed the limits of or are not covered by insurance, or if insurance coverage is unavailable,Ameren Missouri is at risk for any uninsured losses. If a serious nuclear incident were to occur, it could have a material adverse effect on Ameren’s and AmerenMissouri’s results of operations, financial position, and liquidity.
128

Table of Contents
Leases
We lease various facilities, office equipment, plant equipment, and rail cars under capital and operating leases. The following table presents our leaseobligations at December 31, 2016 :
2017 2018 2019 2020 2021 After 5 Years Total
Ameren: (a)
Minimum capital lease payments (b) $ 33 $ 32 $ 32 $ 32 $ 32 $ 297 $ 458Less amount representing interest 27 26 25 25 25 48 176Present value of minimum capital lease payments $ 6 $ 6 $ 7 $ 7 $ 7 $ 249 $ 282
Operating leases (c) 13 12 12 11 10 23 81Total lease obligations $ 19 $ 18 $ 19 $ 18 $ 17 $ 272 $ 363Ameren Missouri:
Minimum capital lease payments (b) $ 33 $ 32 $ 32 $ 32 $ 32 $ 297 $ 458Less amount representing interest 27 26 25 25 25 48 176Present value of minimum capital lease payments $ 6 $ 6 $ 7 $ 7 $ 7 $ 249 $ 282
Operating leases (c) 11 11 11 10 9 21 73Total lease obligations $ 17 $ 17 $ 18 $ 17 $ 16 $ 270 $ 355Ameren Illinois:
Operating leases (c) $ 1 $ 1 $ 1 $ 1 $ 1 $ 1 $ 6
(a) Includes amounts for Ameren registrant and nonregistrant subsidiaries and intercompany eliminations.(b) See Properties under Part I, Item 2, and Note 3 – Property, Plant, and Equipment, Net, of this report for additional information.(c) Amounts related to certain land-related leases have indefinite payment periods. The annual obligations of $3 million , $2 million , and $1 million for Ameren, Ameren Missouri, and
Ameren Illinois for these items are included in the 2017 through 2021 columns, respectively.
The following table presents total rental expense included in operating expenses for the years ended December 31, 2016 , 2015 , and 2014 :
2016 2015 2014
Ameren (a) $ 38 $ 36 $ 37Ameren Missouri 34 34 32Ameren Illinois 30 28 25
(a) Includes amounts for Ameren registrant and nonregistrant subsidiaries and intercompany eliminations.
129
Table of Contents
Other Obligations
To supply a portion of the fuel requirements of our energy centers, we have entered into various long-term commitments for the procurement of coal, naturalgas, nuclear fuel, and methane gas. We also have entered into various long-term commitments for purchased power and natural gas for distribution. The tablebelow presents our estimated fuel, purchased power, and other commitments for fuel at December 31, 2016 . Ameren’s and Ameren Missouri’s purchased powercommitments include a 102-megawatt power purchase agreement with a wind farm operator, which expires in 2024. Ameren’s and Ameren Illinois’ purchasedpower commitments include the Ameren Illinois power purchase agreements entered into as part of the IPA-administered power procurement process. Included inthe Other column are minimum purchase commitments under contracts for equipment, design and construction, and meter reading services at December 31, 2016 .
Coal NaturalGas (a)
NuclearFuel
PurchasedPower (b)
MethaneGas Other Total
Ameren: (c) 2017 $ 599 $ 238 $ 45 $ 255 $ 3 $ 118 $ 1,2582018 371 167 70 156 4 60 8282019 311 99 27 79 4 60 5802020 27 45 38 58 5 56 2292021 — 12 44 58 5 29 148Thereafter — 43 45 478 65 198 829Total $ 1,308 $ 604 $ 269 $ 1,084 $ 86 $ 521 $ 3,872Ameren Missouri: 2017 $ 599 $ 43 $ 45 $ 22 $ 3 $ 39 $ 7512018 371 29 70 22 4 29 5252019 311 15 27 22 4 29 4082020 27 10 38 22 5 29 1312021 — 5 44 22 5 28 104Thereafter — 18 45 59 65 183 370Total $ 1,308 $ 120 $ 269 $ 169 $ 86 $ 337 $ 2,289Ameren Illinois: 2017 $ — $ 195 $ — $ 233 $ — $ 36 $ 4642018 — 138 — 134 — 24 2962019 — 83 — 57 — 27 1672020 — 35 — 36 — 27 982021 — 8 — 36 — — 44Thereafter — 25 — 419 — — 444Total $ — $ 484 $ — $ 915 $ — $ 114 $ 1,513
(a) Includes amounts for generation and for distribution.(b) The purchased power amounts for Ameren and Ameren Illinois include agreements through 2032 for renewable energy credits with various renewable energy suppliers. The agreements
contain a provision that allows Ameren Illinois to reduce the quantity purchased in the event that Ameren Illinois would not be able to recover the costs associated with the renewableenergy credits.
(c) Includes amounts for Ameren registrant and nonregistrant subsidiaries.
Environmental Matters
We are subject to various environmental laws and regulations enforcedby federal, state, and local authorities. The development and operation ofelectric generation, transmission, and distribution facilities and natural gasstorage, transmission, and distribution facilities, can trigger compliance withdiverse environmental laws and regulations. These laws and regulationsaddress emissions, discharges to water, water usage, impacts to air, land, andwater, and chemical and waste handling. Complex and lengthy processes arerequired to obtain and renew approvals, permits, and licenses for new,existing or modified facilities. Additionally, the use and handling of variouschemicals or hazardous materials require release prevention plans andemergency response procedures.
The EPA has promulgated environmental regulations that have asignificant impact on the electric utility industry. Over time,
compliance with these regulations could be costly for Ameren Missouri,which operates coal-fired power plants. As of December 31, 2016, AmerenMissouri’s fossil-fueled energy centers represented 18% and 34% ofAmeren’s and Ameren Missouri’s rate base, respectively. Regulationsimpacting the electric utility industry include the regulation of CO 2 emissionsfrom existing power plants through the Clean Power Plan and from newpower plants through the revised NSPS; the CSAPR, which requires furtherreductions of SO 2 emissions and NO x emissions from power plants; aregulation governing management and storage of CCR; the MATS, whichrequires reduction of emissions of mercury, toxic metals, and acid gases frompower plants; revised NSPS for particulate matter, SO 2 , and NO x emissionsfrom new sources; effluent standards applicable to wastewater dischargesfrom power plants; and regulations under the Clean Water Act that couldrequire significant capital expenditures, such as modifications to water intakestructures at Ameren Missouri’s
130
Table of Contents
energy centers. The EPA also periodically reviews and revises nationalambient air quality standards, including those standards associated withemissions from power plants, such as particulate matter, ozone, SO 2 and NO x. Certain of these regulations are being or are likely to be challenged throughlitigation, so their ultimate implementation, as well as the timing of any suchimplementation, is uncertain. Although many details of future regulations areunknown, the individual or combined effects of recent environmentalregulations could result in significant capital expenditures and increasedoperating costs for Ameren and Ameren Missouri. Compliance with theseenvironmental laws and regulations could be prohibitively expensive, result inthe closure or alteration of the operation of some of Ameren Missouri’senergy centers, or require further capital investment. Ameren and AmerenMissouri expect that these costs would be recoverable through rates, subjectto MoPSC prudence review, but the nature and timing of costs and theirrecovery could result in regulatory lag.
Ameren Missouri's current plan for compliance with existingenvironmental regulations for air emissions includes burning ultra-low-sulfurcoal and installing new or optimizing existing pollution control equipment.Ameren and Ameren Missouri estimate that they will need to make capitalexpenditures of $425 million to $525 million in the aggregate from 2017through 2021 in order to comply with existing environmental regulations.Ameren Missouri may be required to install additional air emissions controlsbeyond 2021. This estimate of capital expenditures includes expendituresrequired for the CCR regulations, the Clean Water Act rule applicable tocooling water intake structures at existing power plants, and the Clean WaterAct effluent limitation guidelines applicable to steam electric generating units,all of which are discussed below. This estimate does not include the potentialimpacts of the Clean Power Plan discussed below. The actual amount ofcapital expenditures required to comply with existing environmentalregulations may vary substantially from the above estimate because ofuncertainty as to the precise compliance strategies that will be used and theirultimate cost, among other things.
The following sections describe the more significant recentenvironmental laws and rules and environmental enforcement andremediation matters that affect or could affect our operations.
Clean Air Act
Federal and state laws require significant reductions in SO 2 and NO xthrough either emission source reductions or the use and retirement ofemission allowances. The first phase of the CSAPR emission reductionrequirements became effective in 2015. The second phase of emissionreduction requirements, which were revised by the EPA in 2016, will becomeeffective in 2017; additional emission reduction requirements may apply insubsequent years. To achieve compliance with the CSAPR, Ameren Missouriburns ultra-low-sulfur coal, operates two scrubbers at its Sioux energy center,and optimizes other existing pollution control equipment. Ameren Missouridoes not expect to make additional capital investments to comply with the2017 CSAPR requirements. However, Ameren Missouri expects to
incur additional costs to lower its emissions at one or more of its energycenters to comply with the CSAPR in future years. These higher costs areexpected to be recovered from customers through the FAC or higher baserates.
CO 2 Emissions Standards
In 2015, the EPA issued final regulations that set CO 2 emissionsstandards for new power plants. These new standards establish separateemissions limits for new natural-gas-fired combined cycle plants and newcoal-fired plants. The Clean Power Plan sets forth CO 2 emissions standardsapplicable to existing power plants. The rule was stayed by the United StatesSupreme Court in February 2016, pending the outcome of various legalchallenges.
If upheld and implemented, the Clean Power Plan would require Missouriand Illinois to reduce CO 2 emissions from power plants within their statessignificantly below 2005 levels by 2030. The rule contains interimcompliance periods commencing in 2022 that would require each state todemonstrate progress in achieving its CO 2 emissions reduction target.Ameren continues to evaluate the Clean Power Plan's potential impacts to itsoperations, including those related to electric system reliability, and to itslevel of investment in customer energy efficiency programs, renewableenergy, and other forms of generation. Significant uncertainty exists regardingthe impact of the Clean Power Plan as its implementation will depend uponplans to be developed by the states. Numerous legal challenges are pending,which could result in the rule being declared invalid or the nature and timingof CO 2 emissions reductions being revised. All implementation requirementsare deferred until such time as these legal challenges are concluded. Adecision by the District of Columbia Circuit Court of Appeals is expected tobe issued in 2017, and subsequent appeals to the United States Supreme Courtare likely. We cannot predict the outcome of such legal challenges or theirimpact on our results of operations, financial position, or liquidity. If the ruleis ultimately upheld and not rescinded or altered significantly by the newfederal administration, compliance measures could result in the closure oralteration of the operation of some of Ameren Missouri’s coal and natural-gas-fired energy centers, which could in turn result in increased operatingcosts and require Ameren Missouri to make unplanned or accelerated capitalexpenditures. Ameren Missouri expects substantially all of these increasedcosts to be recoverable, subject to MoPSC prudence review, through higherrates to customers, which could be significant.
Federal and state legislation or regulations that mandate limits on theemission of CO 2 may result in significant increases in capital expendituresand operating costs, which could lead to increased liquidity needs and higherfinancing costs. Mandatory limits on the emission of CO 2 could increase costsfor Ameren Missouri’s customers or have a material adverse effect onAmeren's and Ameren Missouri's results of operations, financial position, andliquidity if regulators delay or deny recovery in rates of these compliancecosts. The cost of Ameren Illinois’ purchased power and natural gaspurchased for resale could increase. However, Ameren Illinois expects thesecosts would be recovered
131
Table of Contents
from customers with no material adverse effect on its results of operations,financial position, or liquidity. Ameren's and Ameren Missouri's earningsmight benefit from increased investment to comply with CO 2 emissionlimitations to the extent that the investments are reflected and recovered on atimely basis in rates charged to customers.
NSR and Clean Air Litigation
In January 2011, the Department of Justice, on behalf of the EPA, filed acomplaint against Ameren Missouri in the United States District Court for theEastern District of Missouri. The complaint, as amended in October 2013,alleged that in performing projects at its Rush Island coal-fired energy centerin 2007 and 2010, Ameren Missouri violated provisions of the Clean Air Actand Missouri law. The litigation has been divided into two phases: liabilityand remedy. In January 2017, the district court issued a liability ruling that theprojects violated provisions of the Clean Air Act and Missouri law. The casewill now proceed to the second phase to determine the actions required toremedy the violations found in the liability phase of the litigation. The EPApreviously withdrew all claims for penalties and fines. At the conclusion ofboth phases of the litigation, Ameren Missouri intends to appeal the liabilityruling to the United States Circuit Court of Appeals for the Eighth Circuit. Adecision by the district court regarding the remedy phase of the litigationcould occur in 2018.
The ultimate resolution of this matter could have a material adverse effecton the results of operations, financial position, and liquidity of Ameren andAmeren Missouri. Among other things and subject to economic andregulatory considerations, resolution of this matter could result in increasedcapital expenditures for the installation of pollution control equipment, as wellas increased operations and maintenance expenses. We are unable to predictthe ultimate resolution of this matter or the costs that might be incurred.
Clean Water Act
In 2014, the EPA issued its final rule applicable to cooling water intakestructures at existing power plants. The rule requires a case-by-caseevaluation and plan for reducing aquatic organisms impinged on the facility’sintake screens or entrained through the plant's cooling water system.Additionally, in 2015, the EPA issued its final rule to revise the effluentlimitation guidelines applicable to steam electric generating units. Effluentlimitation guidelines are national standards for water discharges that are basedon the effectiveness of available control technology. The EPA's 2015 ruleprohibits effluent discharges of certain waste streams and imposes morestringent limitations on certain components in water discharges from powerplants. All of Ameren Missouri’s coal-fired and nuclear energy centers aresubject to the cooling water intake structures rule. All of Ameren Missouri’scoal-fired energy centers are subject to the effluent limitations rule.Implementation of both rules will occur during the renewal process of eachenergy center’s water discharge permit, which will occur between 2018 and2023. The rules could have an adverse effect on Ameren’s and AmerenMissouri’s results of
operations, financial position, and liquidity if their implementation requiresextensive modifications to the cooling water systems and water dischargesystems at Ameren Missouri’s energy centers and if those investments are notrecovered on a timely basis in electric rates charged to Ameren Missouri’scustomers.
Ash Management
In 2015, the EPA issued regulations regarding the management anddisposal of CCR from coal fired energy centers. These regulations affect CCRdisposal and handling costs at Ameren Missouri's energy centers. Theyrequire closure of impoundments if performance criteria relating togroundwater impacts and location restrictions are not achieved. During 2015,Ameren and Ameren Missouri recorded an increase to their AROs associatedwith CCR storage facilities and accelerated the closure of certain CCR storagefacilities at its energy centers as a result of the new regulations. Ameren plansto close these CCR storage facilities between 2018 and 2023. See Note 1 –Summary of Significant Accounting Policies in this report for additionalinformation.
Ameren Missouri's capital expenditure plan includes the cost ofconstructing landfills as part of its environmental compliance plan.
Remediation
The Ameren Companies are involved in a number of remediation actionsto clean up sites affected by the use or disposal of materials containinghazardous substances. Federal and state laws can require responsible parties tofund remediation actions regardless of their degree of fault, the legality oforiginal disposal, or the ownership of a disposal site. Ameren Missouri andAmeren Illinois have each been identified by federal or state governments as apotentially responsible party at several contaminated sites.
As of December 31, 2016 , Ameren Illinois owned or was otherwiseresponsible for 44 former MGP sites in Illinois, which are in various stages ofinvestigation, evaluation, remediation, and closure. Ameren Illinois estimatesit could substantially conclude remediation efforts by 2023. The ICC allowsAmeren Illinois to recover remediation and litigation costs associated with itsformer MGP sites from its electric and natural gas utility customers throughenvironmental cost riders. Costs are subject to annual prudence review by theICC. As of December 31, 2016 , Ameren Illinois estimated the obligationrelated to these former MGP sites at $200 million to $268 million . Amerenand Ameren Illinois recorded a liability of $200 million to represent theestimated minimum obligation for these sites, as no other amount within therange was a better estimate.
The scope of the remediation activities at these former MGP sites mayincrease as remediation efforts continue. Considerable uncertainty remains inthese estimates because many site-specific factors can influence the ultimateactual costs, including unanticipated underground structures, the degree towhich groundwater is encountered, regulatory changes, local ordinances, andsite accessibility. The actual costs may vary
132
Table of Contents
substantially from these estimates.
Ameren Missouri participated in the investigation of various sites knownas Sauget Area 2 located in Sauget, Illinois. In 2000, the EPA notifiedAmeren Missouri and numerous other companies that former landfills andlagoons at those sites may contain soil and groundwater contamination. Fromabout 1926 until 1976, Ameren Missouri operated an energy center adjacentto Sauget Area 2. Ameren Missouri currently owns a parcel of property atSauget Area 2 that was once used by others as a landfill.
In December 2013, the EPA issued its record of decision for Sauget Area2 approving the investigation and the remediation actions recommended bythe potentially responsible parties. Further negotiation among the potentiallyresponsible parties will determine how to fund the implementation of theEPA-approved cleanup remedies. As of December 31, 2016 , and December31, 2015, Ameren Missouri estimated its obligation related to Sauget Area 2at $1 million to $2.5 million . Ameren Missouri recorded a liability of $1million to represent its estimated minimum obligation, as no other amountwithin the range was a better estimate.
Our operations or those of our predecessor companies involve the use of,disposal of, and in appropriate circumstances,
the cleanup of substances regulated under environmental laws. We are unableto determine whether such practices will result in future environmentalcommitments or will affect our results of operations, financial position, orliquidity.
Ameren Missouri Municipal Taxes
The cities of Creve Coeur and Winchester, Missouri, on behalf ofthemselves and other municipalities in Ameren Missouri’s service area, filed aclass action lawsuit in November 2011 against Ameren Missouri in the CircuitCourt of St. Louis County, Missouri. The lawsuit alleges that AmerenMissouri failed to collect and pay gross receipts taxes or license fees oncertain revenues, including revenues from wholesale power and interchangesales. Ameren and Ameren Missouri recorded immaterial liabilities on theirrespective balance sheets as of December 31, 2016 , and December 31, 2015,representing their estimate of the probable loss due as a result of this lawsuit.Ameren and Ameren Missouri believe there is a remote possibility that aliability relating to this lawsuit could be material to Ameren's and AmerenMissouri’s results of operations, financial position, and liquidity. AmerenMissouri believes its defenses are meritorious and is defending itselfvigorously. However, there can be no assurances that Ameren Missouri willbe successful in its efforts.
NOTE 16 – SEGMENT INFORMATION
During the fourth quarter of 2016, the Ameren Companies changed the manner in which performance is assessed and resources are allocated, driven byincreasing investment in FERC-regulated electric transmission and Ameren Illinois electric distribution and natural gas distribution businesses, as well as theunique regulatory environment for each jurisdiction. Ameren now has four segments: Ameren Missouri, Ameren Illinois Electric Distribution, Ameren IllinoisNatural Gas, and Ameren Transmission. The Ameren Missouri segment includes all of the operations of Ameren Missouri. Ameren Illinois Electric Distributionconsists of the electric distribution business of Ameren Illinois. Ameren Illinois Natural Gas consists of the natural gas business of Ameren Illinois. AmerenTransmission is primarily composed of the aggregated electric transmission businesses of Ameren Illinois and ATXI and associated Ameren (parent) interestcharges . The category called Other primarily includes Ameren parent company activities and Ameren Services.
Ameren Missouri has one segment. Ameren Illinois has three segments: Ameren Illinois Electric Distribution, Ameren Illinois Natural Gas, and AmerenIllinois Transmission . See Note 1 – Summary of Significant Accounting Policies for additional information regarding the operations of Ameren Missouri andAmeren Illinois.
Segment operating revenue and a majority of operating expenses are directly assigned by Ameren Illinois to each Ameren Illinois segment. Common operatingexpenses, miscellaneous income and expense, interest charges, and income tax expense are allocated by Ameren Illinois to each Ameren Illinois segment based oncertain factors, which primarily relate to the nature of the cost. Additionally, Ameren Illinois Transmission earns revenue from transmission service provided toAmeren Illinois Electric Distribution. The transmission expense for Illinois customers who have elected to purchase their power from Ameren Illinois is recoveredthrough a cost recovery mechanism with no net effect on Ameren Illinois Electric Distribution earnings, as costs are offset by corresponding revenues.Transmission revenues from these transactions are reflected at Ameren Transmission and Ameren Illinois Transmission. An intersegment elimination at Amerenand Ameren Illinois occurs to eliminate these transmission revenues and expenses.
Prior to the fourth quarter of 2016, Ameren had two segments: Ameren Missouri and Ameren Illinois, which comprised the operations of the respectivesubsidiaries. The category called Other primarily included Ameren parent company activities, Ameren Services, and ATXI. Prior-period presentation has beenadjusted for comparative purposes to reflect the 2016 change in segments.
133

Table of Contents
The following tables present information about the reported revenues and specified items reflected in net income attributable to common shareholders fromcontinuing operations and capital expenditures at Ameren and Ameren Illinois for the years ended December 31, 2016 , 2015 , and 2014 . Ameren, AmerenMissouri, and Ameren Illinois management review segment capital expenditure information rather than any individual or total asset amount.
Ameren
AmerenMissouri
Ameren IllinoisElectric
Distribution
AmerenIllinois Natural
Gas Ameren
Transmission Other IntersegmentEliminations Consolidated
2016 External revenues $ 3,469 $ 1,545 $ 753 $ 309 $ — $ — $ 6,076Intersegment revenues 54 4 1 46 (a) — (105) —Depreciation and amortization 514 226 55 43 7 — 845Interest income 28 11 — 1 11 (11) 40Interest charges 211 72 34 58 18 (11) 382Income taxes 216 78 39 74 (25) — 382Net income (loss) attributable toAmeren common shareholders fromcontinuing operations 357 126 59 117 (6) — 653Capital expenditures
738 470 181 689 4(b)
(6) 2,0762015 External revenues $ 3,566 $ 1,529 $ 782 $ 219 $ 2 $ — $ 6,098Intersegment revenues 43 3 1 40 (a) — (87) —Depreciation and amortization 492 212 52 33 7 — 796Interest income 28 12 — — 7 (6) 41Interest charges 219 71 35 35 1 (6) 355Income taxes 209 71 24 51 8 — 363Net income (loss) attributable toAmeren common shareholders fromcontinuing operations 352 123 37 83 (16) — 579Capital expenditures
622 491 133 669 2(b)
— 1,9172014 External revenues $ 3,526 $ 1,401 $ 976 $ 150 $ — $ — $ 6,053Intersegment revenues 27 2 — 37 (a) — (66) —Depreciation and amortization 473 197 41 26 8 — 745Interest income 28 7 — — 5 (3) 37Interest charges 211 63 28 26 16 (3) 341Income taxes 229 75 39 38 (4) — 377Net income (loss) attributable toAmeren common shareholders fromcontinuing operations 390 113 50 51 (17) — 587Capital expenditures
747 403 137 491 7(b)
— 1,785
(a) Ameren Illinois Transmission earns revenue from transmission service provided to Ameren Illinois Electric Distribution. See discussion of transactions above.(b) Includes the elimination of intercompany transfers.
134
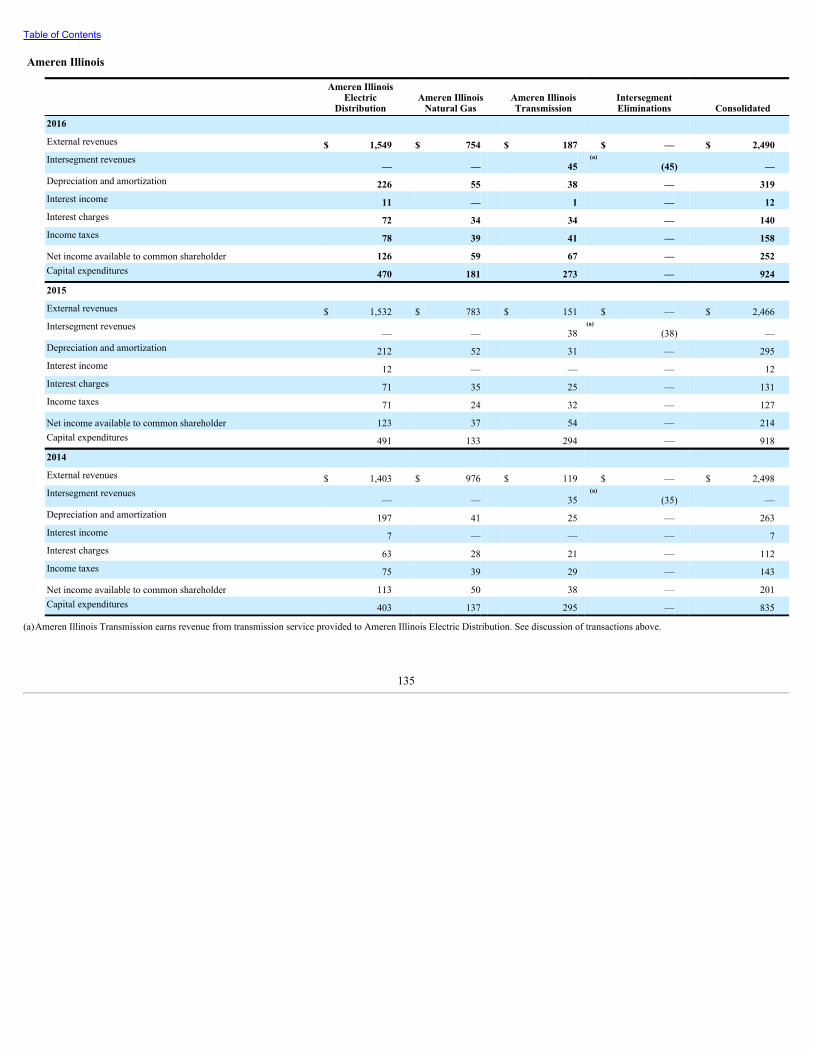
Table of Contents
Ameren Illinois
Ameren IllinoisElectric
Distribution Ameren Illinois
Natural Gas Ameren IllinoisTransmission
IntersegmentEliminations Consolidated
2016 External revenues $ 1,549 $ 754 $ 187 $ — $ 2,490 Intersegment revenues
— — 45(a)
(45) — Depreciation and amortization 226 55 38 — 319 Interest income 11 — 1 — 12 Interest charges 72 34 34 — 140 Income taxes 78 39 41 — 158
Net income available to common shareholder 126 59 67 — 252 Capital expenditures 470 181 273 — 924 2015 External revenues $ 1,532 $ 783 $ 151 $ — $ 2,466 Intersegment revenues
— — 38(a)
(38) — Depreciation and amortization 212 52 31 — 295 Interest income 12 — — — 12 Interest charges 71 35 25 — 131 Income taxes 71 24 32 — 127
Net income available to common shareholder 123 37 54 — 214 Capital expenditures 491 133 294 — 918 2014 External revenues $ 1,403 $ 976 $ 119 $ — $ 2,498 Intersegment revenues
— — 35(a)
(35) — Depreciation and amortization 197 41 25 — 263 Interest income 7 — — — 7 Interest charges 63 28 21 — 112 Income taxes 75 39 29 — 143
Net income available to common shareholder 113 50 38 — 201 Capital expenditures 403 137 295 — 835
(a)Ameren Illinois Transmission earns revenue from transmission service provided to Ameren Illinois Electric Distribution. See discussion of transactions above.
135

Table of Contents
SELECTED QUARTERLY INFORMATION (Unaudited) (In millions, except per share amounts)
Ameren 2016 2015Quarter ended March 31 June 30 September 30 December 31 March 31 June 30 September 30 December 31
Operating revenues $ 1,434 $ 1,427 $ 1,859 $ 1,356 $ 1,556 $ 1,401 $ 1,833 $ 1,308
Operating income 220 325 691 145 256 237 626 140
Net income 107 148 371 33 110 151 345 30Net income attributable to Amerencommon shareholders – continuingoperations $ 105 $ 147 $ 369 $ 32 $ 108 $ 98 $ 343 $ 30Net income (loss) attributable toAmeren common shareholders –discontinued operations — — — — — 52 — (1)Net income attributable to Amerencommon shareholders $ 105 $ 147 $ 369 $ 32 $ 108 $ 150 $ 343 $ 29Earnings per common share – basic –continuing operations $ 0.43 $ 0.61 $ 1.52 $ 0.13 $ 0.45 $ 0.40 $ 1.42 $ 0.12Earnings per common share – basic –discontinued operations — — — — — 0.21 — —
Earnings per common share – basic $ 0.43 $ 0.61 $ 1.52 $ 0.13 $ 0.45 $ 0.61 $ 1.42 $ 0.12Earnings per common share – diluted –continuing operations (a) $ 0.43 $ 0.61 $ 1.52 $ 0.13 $ 0.45 $ 0.40 $ 1.41 $ 0.12Earnings per common share – diluted –discontinued operations — — — — — 0.21 — —Earnings per common share – diluted(a) $ 0.43 $ 0.61 $ 1.52 $ 0.13 $ 0.45 $ 0.61 $ 1.41 $ 0.12
(a) The sum of quarterly amounts, including per share amounts, may not equal amounts reported for year-to-date periods. This is because of the effects of rounding and the changes in thenumber of weighted-average diluted shares outstanding each period.
Ameren Missouri Quarter ended OperatingRevenues
OperatingIncome Net Income
Net IncomeAvailable
to CommonShareholder
March 31, 2016 $ 741 $ 63 $ 15 $ 14March 31, 2015 800 115 42 41June 30, 2016 867 197 93 92June 30, 2015 884 146 62 61September 30, 2016 1,165 431 242 241September 30, 2015 1,171 423 240 239December 31, 2016 750 54 10 10December 31, 2015 754 58 11 11
Ameren Illinois Quarter ended OperatingRevenues
OperatingIncome Net Income
Net IncomeAvailable
to CommonShareholder
March 31, 2016 $ 677 $ 133 $ 60 $ 59March 31, 2015 745 120 54 53June 30, 2016 542 107 46 45June 30, 2015 513 83 32 31September 30, 2016 676 230 119 119September 30, 2015 655 189 98 98December 31, 2016 595 74 30 29December 31, 2015 553 74 33 32
ITEM 9.CHANGES IN AND DISAGREEMENTS WITH ACCOUNTANTS ON ACCOUNTING AND FINANCIAL DISCLOSURE
None.
ITEM 9A.CONTROLS AND PROCEDURES
(a) Evaluation of Disclosure Controls and Procedures
136
Table of Contents
As of December 31, 2016, evaluations were performed under the supervision and with the participation of management, including the principal executiveofficer and the principal financial officer of each of the Ameren Companies, of the effectiveness of the design and operation of such registrant’s disclosure controlsand procedures (as defined in Rules 13a-15(e) and 15d-15(e) of the Exchange Act). Based on those evaluations, as of December 31, 2016, the principal executiveofficer and the principal financial officer of each of the Ameren Companies concluded that such disclosure controls and procedures are effective to provideassurance that information required to be disclosed in such registrant’s reports filed or submitted under the Exchange Act is recorded, processed, summarized, andreported within the time periods specified in the SEC’s rules and forms, and that such information is accumulated and communicated to its management, includingits principal executive and principal financial officers, to allow timely decisions regarding required disclosure.
(b) Management’s Report on Internal Control over Financial Reporting
Management is responsible for establishing and maintaining adequate internal control over financial reporting, as such term is defined in Exchange ActRules 13a-15(f) and 15d-15(f). Under the supervision of and with the participation of management, including the principal executive officer and the principalfinancial officer, an evaluation was conducted of the effectiveness of each of the Ameren Companies’ internal control over financial reporting based on theframework in Internal Control – Integrated Framework (2013) issued by the Committee of Sponsoring Organizations of the Treadway Commission (COSO).After making that evaluation , management concluded that each of the Ameren Companies’ internal control over financial reporting was effective as ofDecember 31, 2016. The effectiveness of Ameren’s internal control over financial reporting as of December 31, 2016, has been audited by PricewaterhouseCoopersLLP, an independent registered public accounting firm, as stated in its report herein under Part II, Item 8. This annual report does not include an attestation reportof Ameren Missouri’s or Ameren Illinois’ (the Subsidiary Registrants) independent registered public accounting firm regarding internal control over financialreporting. Management’s report for each of the Subsidiary Registrants is not subject to attestation by an independent registered public accounting firm.
Because of its inherent limitations, internal control over financial reporting may not prevent or detect misstatements. Also, projections of any evaluation ofeffectiveness into future periods are subject to the risk that internal controls might become inadequate because of changes in conditions, and to the risk that thedegree of compliance with the policies or procedures might deteriorate.
(c) Change in Internal Control
There has been no change in the Ameren Companies’ internal control over financial reporting during their most recent fiscal quarter that has materiallyaffected, or is reasonably likely to materially affect, their internal control over financial reporting.
ITEM 9B.OTHER INFORMATION
The Ameren Companies have no information reportable under this item that was required to be disclosed in a report on SEC Form 8-K during the fourthquarter of 2016 that has not previously been reported on an SEC Form 8-K.
PART III
ITEM10.
DIRECTORS, EXECUTIVE OFFICERS, AND CORPORATEGOVERNANCE
Information required by Items 401, 405, 406 and 407(c)(3),(d)(4) and (d)(5) of SEC Regulation S-K for Ameren will be included in its definitive proxystatement for its 2017 annual meeting of shareholders filed pursuant to SECRegulation 14A; it is incorporated herein by reference. Information requiredby these SEC Regulation S-K items for Ameren Missouri and Ameren Illinoiswill be included in each company’s definitive information statement for its2017 annual meeting of shareholders filed pursuant to SEC Regulation 14C; itis incorporated herein by reference. Specifically, reference is made to thefollowing sections of Ameren’s definitive proxy statement and to each ofAmeren Missouri’s and Ameren Illinois’ definitive information statements:“Information Concerning Nominees to the Board of Directors,” “Section16(a) Beneficial Ownership Reporting Compliance,” “Corporate Governance”and “Board Structure.”
Information concerning executive officers of the Ameren Companiesrequired by Item 401 of SEC Regulation S-K is reported under a separatecaption entitled “Executive Officers of
the Registrants” in Part I of this report.
Ameren Missouri and Ameren Illinois do not have separately designatedstanding audit committees, but instead use Ameren’s audit and risk committeeto perform such committee functions for their boards of directors. Thesecompanies do not have securities listed on the NYSE and therefore are notsubject to the NYSE listing standards. Walter J. Galvin serves as chairman ofAmeren’s audit and risk committee and Catherine S. Brune, J. EdwardColeman, and Ellen M. Fitzsimmons serve as members. The board ofdirectors of Ameren has determined that Walter J. Galvin and J. EdwardColeman each qualify as an audit committee financial expert and that each is“independent” as that term is used in SEC Regulation 14A.
Also, on the same basis as reported above, the boards of directors ofAmeren Missouri and Ameren Illinois use the nominating and corporategovernance committee of Ameren’s board of directors to perform suchcommittee functions. This committee is responsible for the nomination ofdirectors and for corporate governance practices. Ameren’s nominating andcorporate governance committee will consider director
137
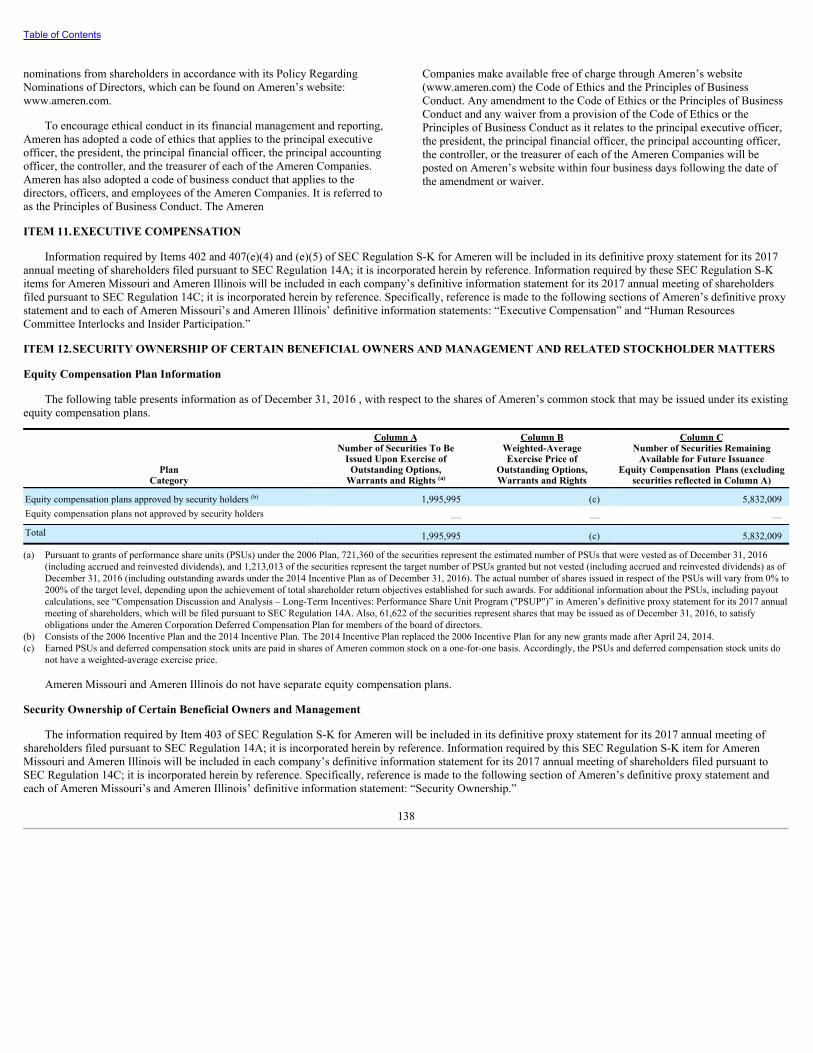
Table of Contents
nominations from shareholders in accordance with its Policy RegardingNominations of Directors, which can be found on Ameren’s website:www.ameren.com.
To encourage ethical conduct in its financial management and reporting,Ameren has adopted a code of ethics that applies to the principal executiveofficer, the president, the principal financial officer, the principal accountingofficer, the controller, and the treasurer of each of the Ameren Companies.Ameren has also adopted a code of business conduct that applies to thedirectors, officers, and employees of the Ameren Companies. It is referred toas the Principles of Business Conduct. The Ameren
Companies make available free of charge through Ameren’s website(www.ameren.com) the Code of Ethics and the Principles of BusinessConduct. Any amendment to the Code of Ethics or the Principles of BusinessConduct and any waiver from a provision of the Code of Ethics or thePrinciples of Business Conduct as it relates to the principal executive officer,the president, the principal financial officer, the principal accounting officer,the controller, or the treasurer of each of the Ameren Companies will beposted on Ameren’s website within four business days following the date ofthe amendment or waiver.
ITEM 11.EXECUTIVE COMPENSATION
Information required by Items 402 and 407(e)(4) and (e)(5) of SEC Regulation S-K for Ameren will be included in its definitive proxy statement for its 2017annual meeting of shareholders filed pursuant to SEC Regulation 14A; it is incorporated herein by reference. Information required by these SEC Regulation S-Kitems for Ameren Missouri and Ameren Illinois will be included in each company’s definitive information statement for its 2017 annual meeting of shareholdersfiled pursuant to SEC Regulation 14C; it is incorporated herein by reference. Specifically, reference is made to the following sections of Ameren’s definitive proxystatement and to each of Ameren Missouri’s and Ameren Illinois’ definitive information statements: “Executive Compensation” and “Human ResourcesCommittee Interlocks and Insider Participation.”
ITEM 12.SECURITY OWNERSHIP OF CERTAIN BENEFICIAL OWNERS AND MANAGEMENT AND RELATED STOCKHOLDER MATTERS
Equity Compensation Plan Information
The following table presents information as of December 31, 2016 , with respect to the shares of Ameren’s common stock that may be issued under its existingequity compensation plans.
PlanCategory
Column ANumber of Securities To Be
Issued Upon Exercise ofOutstanding Options,
Warrants and Rights (a)
Column BWeighted-AverageExercise Price of
Outstanding Options,Warrants and Rights
Column CNumber of Securities Remaining
Available for Future IssuanceEquity Compensation Plans (excluding
securities reflected in Column A)
Equity compensation plans approved by security holders (b) 1,995,995 (c) 5,832,009Equity compensation plans not approved by security holders — — —Total 1,995,995 (c) 5,832,009
(a) Pursuant to grants of performance share units (PSUs) under the 2006 Plan, 721,360 of the securities represent the estimated number of PSUs that were vested as of December 31, 2016(including accrued and reinvested dividends), and 1,213,013 of the securities represent the target number of PSUs granted but not vested (including accrued and reinvested dividends) as ofDecember 31, 2016 (including outstanding awards under the 2014 Incentive Plan as of December 31, 2016). The actual number of shares issued in respect of the PSUs will vary from 0% to200% of the target level, depending upon the achievement of total shareholder return objectives established for such awards. For additional information about the PSUs, including payoutcalculations, see “Compensation Discussion and Analysis – Long-Term Incentives: Performance Share Unit Program ("PSUP")” in Ameren’s definitive proxy statement for its 2017 annualmeeting of shareholders, which will be filed pursuant to SEC Regulation 14A. Also, 61,622 of the securities represent shares that may be issued as of December 31, 2016, to satisfyobligations under the Ameren Corporation Deferred Compensation Plan for members of the board of directors.
(b) Consists of the 2006 Incentive Plan and the 2014 Incentive Plan. The 2014 Incentive Plan replaced the 2006 Incentive Plan for any new grants made after April 24, 2014.(c) Earned PSUs and deferred compensation stock units are paid in shares of Ameren common stock on a one-for-one basis. Accordingly, the PSUs and deferred compensation stock units do
not have a weighted-average exercise price.
Ameren Missouri and Ameren Illinois do not have separate equity compensation plans.
Security Ownership of Certain Beneficial Owners and Management
The information required by Item 403 of SEC Regulation S-K for Ameren will be included in its definitive proxy statement for its 2017 annual meeting ofshareholders filed pursuant to SEC Regulation 14A; it is incorporated herein by reference. Information required by this SEC Regulation S-K item for AmerenMissouri and Ameren Illinois will be included in each company’s definitive information statement for its 2017 annual meeting of shareholders filed pursuant toSEC Regulation 14C; it is incorporated herein by reference. Specifically, reference is made to the following section of Ameren’s definitive proxy statement andeach of Ameren Missouri’s and Ameren Illinois’ definitive information statement: “Security Ownership.”
138
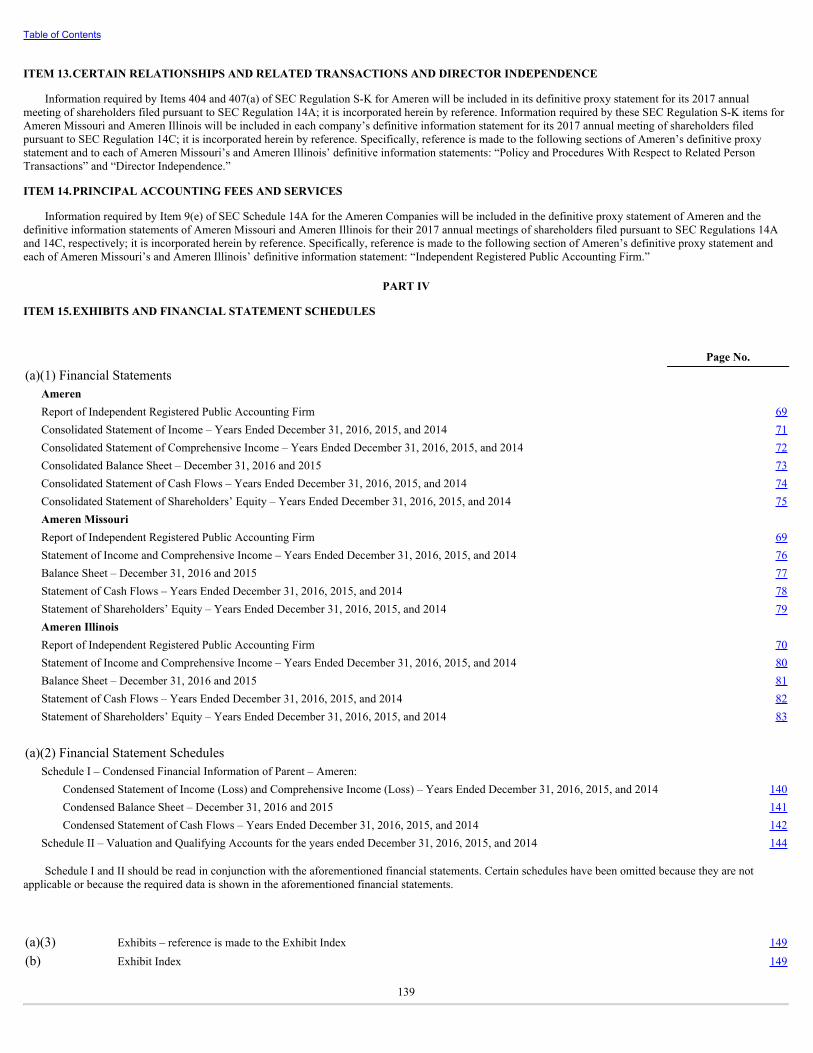
Table of Contents
ITEM 13.CERTAIN RELATIONSHIPS AND RELATED TRANSACTIONS AND DIRECTOR INDEPENDENCE
Information required by Items 404 and 407(a) of SEC Regulation S-K for Ameren will be included in its definitive proxy statement for its 2017 annualmeeting of shareholders filed pursuant to SEC Regulation 14A; it is incorporated herein by reference. Information required by these SEC Regulation S-K items forAmeren Missouri and Ameren Illinois will be included in each company’s definitive information statement for its 2017 annual meeting of shareholders filedpursuant to SEC Regulation 14C; it is incorporated herein by reference. Specifically, reference is made to the following sections of Ameren’s definitive proxystatement and to each of Ameren Missouri’s and Ameren Illinois’ definitive information statements: “Policy and Procedures With Respect to Related PersonTransactions” and “Director Independence.”
ITEM 14.PRINCIPAL ACCOUNTING FEES AND SERVICES
Information required by Item 9(e) of SEC Schedule 14A for the Ameren Companies will be included in the definitive proxy statement of Ameren and thedefinitive information statements of Ameren Missouri and Ameren Illinois for their 2017 annual meetings of shareholders filed pursuant to SEC Regulations 14Aand 14C, respectively; it is incorporated herein by reference. Specifically, reference is made to the following section of Ameren’s definitive proxy statement andeach of Ameren Missouri’s and Ameren Illinois’ definitive information statement: “Independent Registered Public Accounting Firm.”
PART IV
ITEM 15.EXHIBITS AND FINANCIAL STATEMENT SCHEDULES
Page No.(a)(1) Financial Statements
Ameren Report of Independent Registered Public Accounting Firm 69Consolidated Statement of Income – Years Ended December 31, 2016, 2015, and 2014 71Consolidated Statement of Comprehensive Income – Years Ended December 31, 2016, 2015, and 2014 72Consolidated Balance Sheet – December 31, 2016 and 2015 73Consolidated Statement of Cash Flows – Years Ended December 31, 2016, 2015, and 2014 74Consolidated Statement of Shareholders’ Equity – Years Ended December 31, 2016, 2015, and 2014 75Ameren Missouri Report of Independent Registered Public Accounting Firm 69Statement of Income and Comprehensive Income – Years Ended December 31, 2016, 2015, and 2014 76Balance Sheet – December 31, 2016 and 2015 77Statement of Cash Flows – Years Ended December 31, 2016, 2015, and 2014 78Statement of Shareholders’ Equity – Years Ended December 31, 2016, 2015, and 2014 79Ameren Illinois Report of Independent Registered Public Accounting Firm 70Statement of Income and Comprehensive Income – Years Ended December 31, 2016, 2015, and 2014 80Balance Sheet – December 31, 2016 and 2015 81Statement of Cash Flows – Years Ended December 31, 2016, 2015, and 2014 82Statement of Shareholders’ Equity – Years Ended December 31, 2016, 2015, and 2014 83
(a)(2) Financial Statement Schedules
Schedule I – Condensed Financial Information of Parent – Ameren: Condensed Statement of Income (Loss) and Comprehensive Income (Loss) – Years Ended December 31, 2016, 2015, and 2014 140Condensed Balance Sheet – December 31, 2016 and 2015 141Condensed Statement of Cash Flows – Years Ended December 31, 2016, 2015, and 2014 142
Schedule II – Valuation and Qualifying Accounts for the years ended December 31, 2016, 2015, and 2014 144
Schedule I and II should be read in conjunction with the aforementioned financial statements. Certain schedules have been omitted because they are notapplicable or because the required data is shown in the aforementioned financial statements.
(a)(3) Exhibits – reference is made to the Exhibit Index 149(b) Exhibit Index 149
139
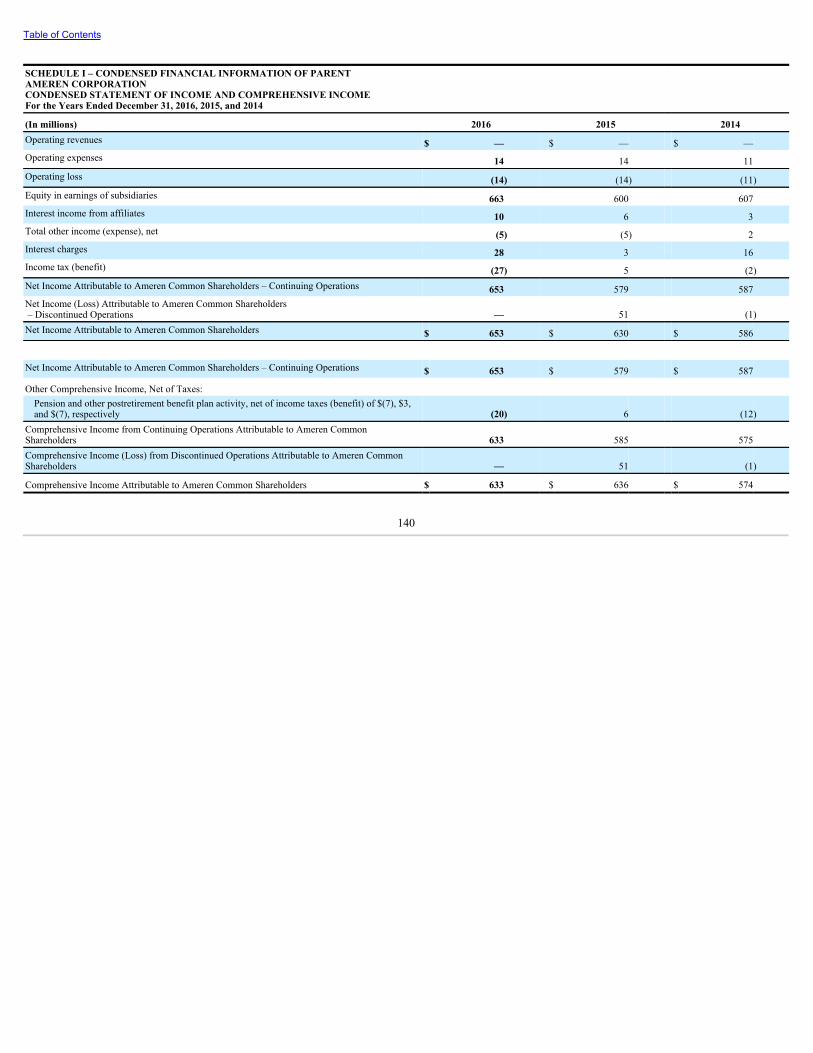
Table of Contents
SCHEDULE I – CONDENSED FINANCIAL INFORMATION OF PARENT AMEREN CORPORATION CONDENSED STATEMENT OF INCOME AND COMPREHENSIVE INCOME For the Years Ended December 31, 2016, 2015, and 2014
(In millions) 2016 2015 2014Operating revenues $ — $ — $ —Operating expenses 14 14 11Operating loss (14) (14) (11)Equity in earnings of subsidiaries 663 600 607Interest income from affiliates 10 6 3Total other income (expense), net (5) (5) 2Interest charges 28 3 16Income tax (benefit) (27) 5 (2)Net Income Attributable to Ameren Common Shareholders – Continuing Operations 653 579 587Net Income (Loss) Attributable to Ameren Common Shareholders – Discontinued Operations — 51 (1)Net Income Attributable to Ameren Common Shareholders $ 653 $ 630 $ 586
Net Income Attributable to Ameren Common Shareholders – Continuing Operations $ 653 $ 579 $ 587
Other Comprehensive Income, Net of Taxes: Pension and other postretirement benefit plan activity, net of income taxes (benefit) of $(7), $3,and $(7), respectively (20) 6 (12)
Comprehensive Income from Continuing Operations Attributable to Ameren CommonShareholders 633 585 575Comprehensive Income (Loss) from Discontinued Operations Attributable to Ameren CommonShareholders — 51 (1)
Comprehensive Income Attributable to Ameren Common Shareholders $ 633 $ 636 $ 574
140

Table of Contents
SCHEDULE I – CONDENSED FINANCIAL INFORMATION OF PARENT AMEREN CORPORATION CONDENSED BALANCE SHEET
(In millions) December 31, 2016 December 31, 2015Assets: Cash and cash equivalents $ 1 $ —Advances to money pool 27 —Accounts receivable – affiliates 31 53Miscellaneous accounts and notes receivable 26 3Other current assets 8 9
Total current assets 93 65Investments in subsidiaries 7,498 7,227Note receivable – ATXI 350 290Accumulated deferred income taxes, net 419 426Other assets 135 158
Total assets $ 8,495 $ 8,166Liabilities and Shareholders’ Equity: Short-term debt 507 301Borrowings from money pool 33 14Accounts payable – affiliates 13 75Other current liabilities 17 22
Total current liabilities 570 412Long-term debt 694 694Pension and other postretirement benefits 45 33Other deferred credits and liabilities 83 81
Total liabilities 1,392 1,220Commitments and Contingencies (Notes 4 and 5) Shareholders’ Equity: Common stock, $.01 par value, 400.0 shares authorized – shares outstanding of 242.6 2 2Other paid-in capital, principally premium on common stock 5,556 5,616Retained earnings 1,568 1,331Accumulated other comprehensive loss (23) (3)
Total shareholders’ equity 7,103 6,946Total liabilities and shareholders’ equity $ 8,495 $ 8,166
141
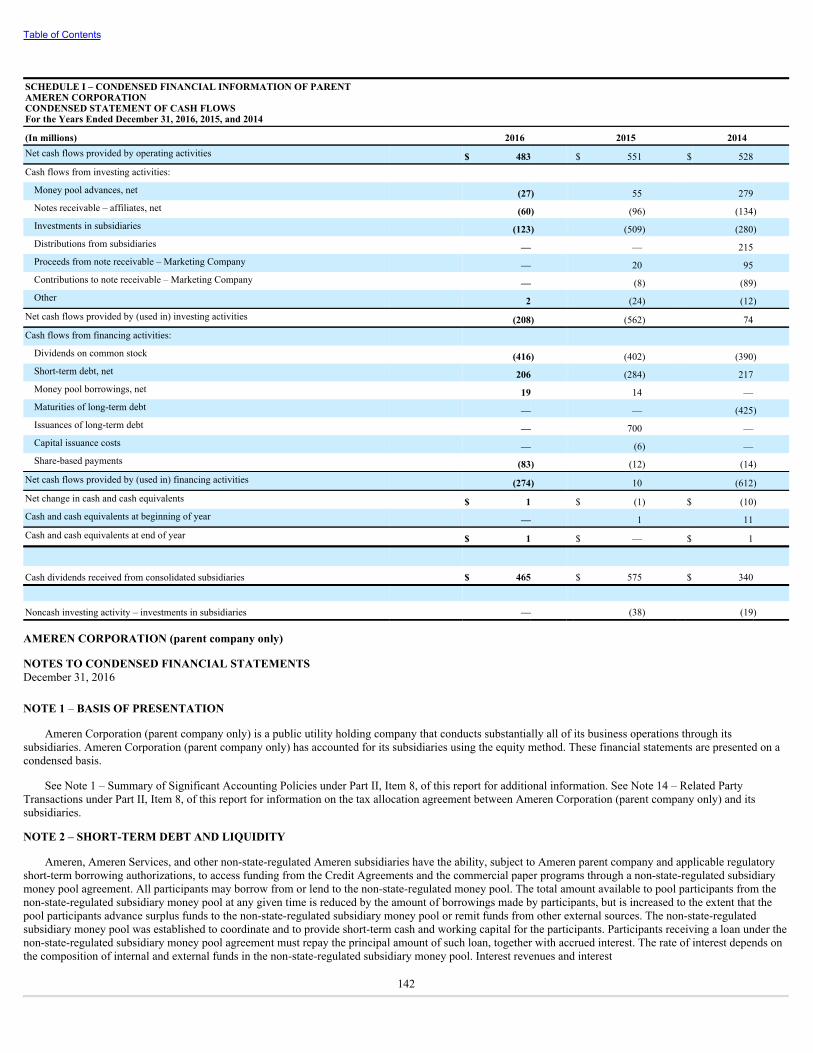
Table of Contents
SCHEDULE I – CONDENSED FINANCIAL INFORMATION OF PARENT AMEREN CORPORATION CONDENSED STATEMENT OF CASH FLOWS For the Years Ended December 31, 2016, 2015, and 2014
(In millions) 2016 2015 2014Net cash flows provided by operating activities $ 483 $ 551 $ 528Cash flows from investing activities: Money pool advances, net (27) 55 279Notes receivable – affiliates, net (60) (96) (134)Investments in subsidiaries (123) (509) (280)Distributions from subsidiaries — — 215Proceeds from note receivable – Marketing Company — 20 95Contributions to note receivable – Marketing Company — (8) (89)Other 2 (24) (12)
Net cash flows provided by (used in) investing activities (208) (562) 74Cash flows from financing activities: Dividends on common stock (416) (402) (390)Short-term debt, net 206 (284) 217Money pool borrowings, net 19 14 —Maturities of long-term debt — — (425)Issuances of long-term debt — 700 —Capital issuance costs — (6) —Share-based payments (83) (12) (14)
Net cash flows provided by (used in) financing activities (274) 10 (612)Net change in cash and cash equivalents $ 1 $ (1) $ (10)Cash and cash equivalents at beginning of year — 1 11Cash and cash equivalents at end of year $ 1 $ — $ 1
Cash dividends received from consolidated subsidiaries $ 465 $ 575 $ 340
Noncash investing activity – investments in subsidiaries — (38) (19)
AMEREN CORPORATION (parent company only)
NOTES TO CONDENSED FINANCIAL STATEMENTSDecember 31, 2016
NOTE 1 – BASIS OF PRESENTATION
Ameren Corporation (parent company only) is a public utility holding company that conducts substantially all of its business operations through itssubsidiaries. Ameren Corporation (parent company only) has accounted for its subsidiaries using the equity method. These financial statements are presented on acondensed basis.
See Note 1 – Summary of Significant Accounting Policies under Part II, Item 8, of this report for additional information. See Note 14 – Related PartyTransactions under Part II, Item 8, of this report for information on the tax allocation agreement between Ameren Corporation (parent company only) and itssubsidiaries.
NOTE 2 – SHORT-TERM DEBT AND LIQUIDITY
Ameren, Ameren Services, and other non-state-regulated Ameren subsidiaries have the ability, subject to Ameren parent company and applicable regulatoryshort-term borrowing authorizations, to access funding from the Credit Agreements and the commercial paper programs through a non-state-regulated subsidiarymoney pool agreement. All participants may borrow from or lend to the non-state-regulated money pool. The total amount available to pool participants from thenon-state-regulated subsidiary money pool at any given time is reduced by the amount of borrowings made by participants, but is increased to the extent that thepool participants advance surplus funds to the non-state-regulated subsidiary money pool or remit funds from other external sources. The non-state-regulatedsubsidiary money pool was established to coordinate and to provide short-term cash and working capital for the participants. Participants receiving a loan under thenon-state-regulated subsidiary money pool agreement must repay the principal amount of such loan, together with accrued interest. The rate of interest depends onthe composition of internal and external funds in the non-state-regulated subsidiary money pool. Interest revenues and interest
142

Table of Contents
charges related to non-state-regulated money pool advances and borrowings were immaterial in 2014, 2015 and 2016.
Ameren Corporation (parent company only) had a total of $51 million in guarantees outstanding, primarily for ATXI, that were not recorded on its December31, 2016 balance sheet. The ATXI guarantees were issued to local governments as assurance for potential remediation of damage caused by ATXI construction.
See Note 4 – Short-term Debt and Liquidity under Part II, Item 8, of this report for a description and details of short-term debt and liquidity needs of AmerenCorporation (parent company only).
NOTE 3 – LONG-TERM OBLIGATIONS
See Note 5 – Long-term Debt and Equity Financings under Part II, Item 8, of this report for additional information on Ameren Corporation's (parent companyonly) long-term debt, indenture provisions, and restricted cash balance.
NOTE 4 – COMMITMENTS AND CONTINGENCIES
See Note 15 – Commitments and Contingencies under Part II, Item 8, of this report for a description of all material contingencies of Ameren Corporation(parent company only).
NOTE 5 – DIVESTITURE TRANSACTIONS AND DISCONTINUED OPERATIONS
See Note 1 – Summary of Significant Accounting Policies under Part II, Item 8, of this report for information regarding the divestiture transactions anddiscontinued operations.
143

Table of Contents
SCHEDULE II – VALUATION AND QUALIFYING ACCOUNTS FOR THE YEARS ENDED DECEMBER 31, 2016, 2015, AND 2014
(in millions) Column A Column B Column C Column D Column E
Description
Balance atBeginningof Period
(1)Charged to Costs
and Expenses
(2)Charged to Other
Accounts (a) Deductions (b) Balance at End
of PeriodAmeren: Deducted from assets – allowance fordoubtful accounts:
2016 $ 19 $ 32 $ 3 $ 35 $ 192015 21 33 5 40 192014 18 36 4 37 21
Deferred tax valuation allowance: 2016 $ 6 $ 7 $ (2) $ — $ 112015 10 4 (8) — 62014 7 3 — — 10
Ameren Missouri: Deducted from assets – allowance fordoubtful accounts:
2016 $ 7 $ 10 $ — $ 10 $ 72015 8 13 — 14 72014 5 16 — 13 8
Deferred tax valuation allowance: 2016 $ — $ — $ — $ — $ —2015 1 — (1) — —2014 1 — — — 1
Ameren Illinois: Deducted from assets – allowance fordoubtful accounts:
2016 $ 12 $ 22 $ 3 $ 25 $ 122015 13 20 5 26 122014 13 20 4 24 13
Deferred tax valuation allowance: 2016 $ — $ — $ — $ — $ —2015 1 — (1) — —2014 1 — — — 1
(a) Amounts associated with the allowance for doubtful accounts relate to the uncollectible account reserve associated with receivables purchased by Ameren Illinois from alternative retailelectric suppliers, as required by the Illinois Public Utilities Act. The amounts relating to the deferred tax valuation allowance are for items that have expired and were removed from boththe underlying accumulated deferred income tax account as well as the offsetting valuation account.
(b) Uncollectible accounts charged off, less recoveries.
144
Table of Contents
ITEM 16.FORM 10-K SUMMARY
The Ameren Companies elected not to provide a summary of the Form 10-K.SIGNATURES
Pursuant to the requirements of Section 13 or 15(d) of the Securities Exchange Act of 1934, each registrant has duly caused this report to be signed on itsbehalf by the undersigned, thereunto duly authorized. The signatures for each undersigned company shall be deemed to relate only to matters having reference tosuch company or its subsidiaries.
AMEREN CORPORATION (registrant) Date: February 28, 2017 By /s/ Warner L. Baxter
Warner L. BaxterChairman, President and Chief Executive Officer
Pursuant to the requirements of the Securities Exchange Act of 1934, this report has been signed below by the following persons on behalf of the registrant andin the capacities and on the date indicated.
/s/ Warner L. Baxter Chairman, President and Chief Executive Officer, and Director (PrincipalExecutive Officer) February 28, 2017
Warner L. Baxter
/s/ Martin J. Lyons, Jr. Executive Vice President and Chief Financial Officer (Principal FinancialOfficer) February 28, 2017
Martin J. Lyons, Jr.
/s/ Bruce A. Steinke Senior Vice President, Finance, and Chief Accounting Officer (PrincipalAccounting Officer) February 28, 2017
Bruce A. Steinke
* Director February 28, 2017Catherine S. Brune
* Director February 28, 2017
J. Edward Coleman
* Director February 28, 2017Ellen M. Fitzsimmons
* Director February 28, 2017
Rafael Flores
* Director February 28, 2017Walter J. Galvin
* Director February 28, 2017
Richard J. Harshman
* Director February 28, 2017Gayle P. W. Jackson
* Director February 28, 2017
James C. Johnson
* Director February 28, 2017Steven H. Lipstein
* Director February 28, 2017
Stephen R. Wilson *By /s/ Martin J. Lyons, Jr. February 28, 2017
145

Table of Contents
Martin J. Lyons, Jr. Attorney-in-Fact
146

Table of Contents
UNION ELECTRIC COMPANY (registrant) Date: February 28, 2017 By /s/ Michael L. Moehn
Michael L. MoehnChairman and President
Pursuant to the requirements of the Securities Exchange Act of 1934, this report has been signed below by the following persons on behalf of the registrant andin the capacities and on the date indicated.
/s/ Michael L. Moehn Chairman and President, and Director (Principal ExecutiveOfficer) February 28, 2017
Michael L. Moehn
/s/ Martin J. Lyons, Jr. Executive Vice President and Chief Financial Officer, andDirector (Principal Financial Officer) February 28, 2017
Martin J. Lyons, Jr.
/s/ Bruce A. Steinke Senior Vice President, Finance and Chief Accounting Officer(Principal Accounting Officer) February 28, 2017
Bruce A. Steinke
* Director February 28, 2017Mark C. Birk
* Director February 28, 2017
Fadi M. Diya
* Director February 28, 2017Gregory L. Nelson
* Director February 28, 2017
David N. Wakeman *By /s/ Martin J. Lyons, Jr. February 28, 2017
Martin J. Lyons, Jr. Attorney-in-Fact
147
Table of Contents
AMEREN ILLINOIS COMPANY (registrant) Date: February 28, 2017 By /s/ Richard J. Mark
Richard J. MarkChairman and President
Pursuant to the requirements of the Securities Exchange Act of 1934, this report has been signed below by the following persons on behalf of the registrant andin the capacities and on the date indicated.
/s/ Richard J. Mark Chairman and President, and Director (Principal ExecutiveOfficer) February 28, 2017
Richard J. Mark
/s/ Martin J. Lyons, Jr. Executive Vice President and Chief Financial Officer, andDirector (Principal Financial Officer) February 28, 2017
Martin J. Lyons, Jr.
/s/ Bruce A. Steinke Senior Vice President, Finance and Chief Accounting Officer(Principal Accounting Officer) February 28, 2017
Bruce A. Steinke
* Director February 28, 2017Craig D. Nelson
* Director February 28, 2017
Gregory L. Nelson
* Director February 28, 2017David N. Wakeman
*By /s/ Martin J. Lyons, Jr. February 28, 2017
Martin J. Lyons, Jr. Attorney-in-Fact
148
Table of Contents
EXHIBIT INDEXThe documents listed below are being filed or have previously been filed on behalf of the Ameren Companies and are incorporated herein by reference from
the documents indicated and made a part hereof. Exhibits not identified as previously filed are filed herewith:
Exhibit Designation Registrant(s) Nature of Exhibit Previously Filed as Exhibit to:Plan of Acquisition, Reorganization, Arrangement, Liquidation or Succession
2.1 AmerenTransaction Agreement, dated as of March 14, 2013, betweenAmeren Corporation and Illinois Power Holdings, LLC March 19, 2013 Form 8-K, Exhibit 2.1, File No. 1-14756
2.2 Ameren
Letter Agreement, dated December 2, 2013, between AmerenCorporation and Illinois Power Holdings, LLC, amending theTransaction Agreement, dated as of March 14, 2013 December 4, 2013 Form 8-K, Exhibit 2.2, File No. 1-14756
Articles of Incorporation/ By-Laws
3.1(i) Ameren Restated Articles of Incorporation of AmerenAnnex F to Part I of the Registration Statement on Form S-4, File No. 33-64165
3.2(i) AmerenCertificate of Amendment to Ameren's Restated Articles ofIncorporation filed December 14, 1998
1998 Form 10-K, Exhibit 3(i),File No. 1-14756
3.3(i) AmerenCertificate of Amendment to Ameren's Restated Articles ofIncorporation filed April 21, 2011
April 21, 2011 Form 8-K, Exhibit 3(i),File No. 1-14756
3.4(i) AmerenCertificate of Amendment to Ameren's Restated Articles ofIncorporation filed December 18, 2012
December 18, 2012 Form 8-K, Exhibit 3.1(i),File No. 1-14756
3.5(i) Ameren Missouri Restated Articles of Incorporation of Ameren Missouri1993 Form 10-K, Exhibit 3(i),File No. 1-2967
3.6(i) Ameren Illinois Restated Articles of Incorporation of Ameren Illinois2010 Form 10-K, Exhibit 3.4(i),File No. 1-3672
3.7(ii) Ameren By-Laws of Ameren, as amended February 10, 2017February 14, 2017 Form 8-K, Exhibit 3,File No. 1-14756
3.8(ii) Ameren Missouri Bylaws of Ameren Missouri, as amended December 12, 2014December 18, 2014 Form 8-K,Exhibit 3.1, File No. 1-2967
3.9(ii) Ameren Illinois Bylaws of Ameren Illinois, as amended December 12, 2014December 18, 2014 Form 8-K,Exhibit 3.2, File No. 1-3672
Instruments Defining Rights of Security Holders, Including Indentures
4.1 Ameren
Indenture, dated as of December 1, 2001 from Ameren to TheBank of New York Mellon Trust Company, N.A., as successortrustee, relating to senior debt securities (Ameren Indenture) Exhibit 4.5, File No. 333-81774
4.2 AmerenFirst Supplemental Indenture to Ameren Senior Indenture dated asof May 19, 2008
June 30, 2008 Form 10-Q, Exhibit 4.1,File No. 1-14756
4.3 Ameren
Ameren Indenture Company Order, dated November 24, 2015,establishing the 2.70% Senior Notes due 2020 and the 3.65%Senior Notes due 2026 (including the global notes)
November 24, 2015 Form 8-K, Exhibits 4.3, 4.4 and 4.5,File No. 1-14756
4.4AmerenAmeren Missouri
Indenture of Mortgage and Deed of Trust, dated June 15, 1937(Ameren Missouri Mortgage), from Ameren Missouri to TheBank of New York Mellon, as successor trustee, as amended May1, 1941, and Second Supplemental Indenture dated May 1, 1941 Exhibit B-1, File No. 2-4940
4.5AmerenAmeren Missouri
Supplemental Indenture to the Ameren Missouri Mortgage datedas of July 1, 1956 August 2, 1956 Form 8-K, Exhibit 2, File No. 1-2967
4.6AmerenAmeren Missouri
Supplemental Indenture to the Ameren Missouri Mortgage datedas of April 1, 1971
April 1971 Form 8-K, Exhibit 6,File No. 1-2967
4.7AmerenAmeren Missouri
Supplemental Indenture to the Ameren Missouri Mortgage datedas of February 1, 1974
February 1974 Form 8-K, Exhibit 3,File No. 1-2967
4.8AmerenAmeren Missouri
Supplemental Indenture to the Ameren Missouri Mortgage datedas of July 7, 1980 Exhibit 4.6, File No. 2-69821
4.9AmerenAmeren Missouri
Supplemental Indenture to the Ameren Missouri Mortgage datedas of October 1, 1993, relative to Series 2028
1993 Form 10-K, Exhibit 4.8,File No. 1-2967
4.10AmerenAmeren Missouri
Supplemental Indenture to the Ameren Missouri Mortgage datedas of February 1, 2000
2000 Form 10-K, Exhibit 4.1,File No. 1-2967
4.11AmerenAmeren Missouri
Supplemental Indenture to the Ameren Missouri Mortgage datedAugust 15, 2002
August 23, 2002 Form 8-K, Exhibit 4.3,File No. 1-2967
149
Table of Contents
4.12AmerenAmeren Missouri
Supplemental Indenture to the Ameren Missouri Mortgage datedMarch 5, 2003, relative to Series BB
March 11, 2003 Form 8-K, Exhibit 4.4,File No. 1-2967
4.13AmerenAmeren Missouri
Supplemental Indenture to the Ameren Missouri Mortgage datedJuly 15, 2003, relative to Series DD
August 4, 2003 Form 8-K, Exhibit 4.4,File No. 1-2967
4.14AmerenAmeren Missouri
Supplemental Indenture to the Ameren Missouri Mortgage datedOctober 1, 2003, relative to Series EE
October 8, 2003 Form 8-K, Exhibit 4.4,File No. 1-2967
4.15AmerenAmeren Missouri
Supplemental Indenture to the Ameren Missouri Mortgage datedFebruary 1, 2004, relative to Series 2004A (1998A)
March 31, 2004 Form 10-Q, Exhibit 4.1,File No. 1-2967
4.16AmerenAmeren Missouri
Supplemental Indenture to the Ameren Missouri Mortgage datedFebruary 1, 2004, relative to Series 2004B (1998B)
March 31, 2004 Form 10-Q, Exhibit 4.2,File No. 1-2967
4.17AmerenAmeren Missouri
Supplemental Indenture to the Ameren Missouri Mortgage datedFebruary 1, 2004, relative to Series 2004C (1998C)
March 31, 2004 Form 10-Q, Exhibit 4.3,File No. 1-2967
4.18AmerenAmeren Missouri
Supplemental Indenture to the Ameren Missouri Mortgage datedFebruary 1, 2004, relative to Series 2004H (1992)
March 31, 2004 Form 10-Q, Exhibit 4.8,File No. 1-2967
4.19AmerenAmeren Missouri
Supplemental Indenture to the Ameren Missouri Mortgage datedMay 1, 2004 relative to Series FF
May 18, 2004 Form 8-K, Exhibit 4.4,File No. 1-2967
4.20AmerenAmeren Missouri
Supplemental Indenture to the Ameren Missouri Mortgage datedSeptember 1, 2004 relative to Series GG
September 23, 2004 Form 8-K, Exhibit 4.4,File No. 1-2967
4.21AmerenAmeren Missouri
Supplemental Indenture to the Ameren Missouri Mortgage datedJanuary 1, 2005 relative to Series HH
January 27, 2005 Form 8-K, Exhibit 4.4,File No. 1-2967
4.22AmerenAmeren Missouri
Supplemental Indenture to the Ameren Missouri Mortgage datedJuly 1, 2005 relative to Series II
July 21, 2005 Form 8-K, Exhibit 4.4,File No. 1-2967
4.23AmerenAmeren Missouri
Supplemental Indenture to the Ameren Missouri Mortgage datedJune 1, 2007 relative to Series KK
June 15, 2007 Form 8-K, Exhibit 4.5,File No. 1-2967
4.24AmerenAmeren Missouri
Supplemental Indenture to the Ameren Missouri Mortgage datedApril 1, 2008 relative to Series LL
April 8, 2008 Form 8-K, Exhibit 4.7,File No. 1-2967
4.25AmerenAmeren Missouri
Supplemental Indenture to the Ameren Missouri Mortgage datedJune 1, 2008 relative to Series MM
June 19, 2008 Form 8-K, Exhibit 4.5,File No. 1-2967
4.26AmerenAmeren Missouri
Supplemental Indenture to the Ameren Missouri Mortgage datedMarch 1, 2009 relative to Series NN
March 23, 2009 Form 8-K, Exhibit 4.5,File No. 1-2967
4.27AmerenAmeren Missouri
Supplemental Indenture to the Ameren Missouri Mortgage datedMay 15, 2012 Exhibit 4.45, File No. 333-182258
4.28AmerenAmeren Missouri
Supplemental Indenture to the Ameren Missouri Mortgage datedSeptember 1, 2012 relative to Series OO
September 11, 2012 Form 8-K, Exhibit 4.4,File No. 1-2967
4.29AmerenAmeren Missouri
Supplemental Indenture to the Ameren Missouri Mortgage datedApril 1, 2014 relative to Series PP
April 4, 2014 Form 8-K, Exhibit 4.5,File No. 1-2967
4.30AmerenAmeren Missouri
Supplemental Indenture to the Ameren Missouri Mortgage datedMarch 15, 2015 relative to Series QQ April 6, 2015 Form 8-K, Exhibit 4.5, File No. 1-2967
4.31AmerenAmeren Missouri
Loan Agreement, dated as of December 1, 1992, between theMissouri Environmental Authority and Ameren Missouri, togetherwith Indenture of Trust dated as of December 1, 1992, betweenthe Missouri Environmental Authority and UMB Bank, N.A. assuccessor trustee to Mercantile Bank of St. Louis, N.A.
1992 Form 10-K, Exhibit 4.38,File No. 1-2967
4.32AmerenAmeren Missouri
First Amendment, dated as of February 1, 2004, to LoanAgreement dated as of December 1, 1992, between the MissouriEnvironmental Authority and Ameren Missouri
March 31, 2004 Form 10-Q, Exhibit 4.10,File No. 1-2967
4.33AmerenAmeren Missouri
Series 1998A Loan Agreement, dated as of September 1, 1998,between the Missouri Environmental Authority and AmerenMissouri
September 30, 1998 Form 10-Q,Exhibit 4.28, File No. 1-2967
4.34AmerenAmeren Missouri
First Amendment, dated as of February 1, 2004, to Series 1998ALoan Agreement dated as of September 1, 1998, between theMissouri Environmental Authority and Ameren Missouri
March 31, 2004 Form 10-Q, Exhibit 4.11,File No. 1-2967
4.35AmerenAmeren Missouri
Series 1998B Loan Agreement, dated as of September 1, 1998,between the Missouri Environmental Authority and AmerenMissouri
September 30, 1998 Form 10-Q,Exhibit 4.29, File No. 1-2967
4.36AmerenAmeren Missouri
First Amendment, dated as of February 1, 2004, to Series 1998BLoan Agreement dated as of September 1, 1998, between theMissouri Environmental Authority and Ameren Missouri
March 31, 2004 Form 10-Q, Exhibit 4.12,File No. 1-2967
150

Table of Contents
4.37AmerenAmeren Missouri
Series 1998C Loan Agreement, dated as of September 1, 1998,between the Missouri Environmental Authority and AmerenMissouri
September 30, 1998 Form 10-Q,Exhibit 4.30, File No. 1-2967
4.38AmerenAmeren Missouri
First Amendment, dated as of February 1, 2004, to Series 1998CLoan Agreement dated as of September 1, 1998, between theMissouri Environmental Authority and Ameren Missouri
March 31, 2004 Form 10-Q, Exhibit 4.13,File No. 1-2967
4.39AmerenAmeren Missouri
Indenture, dated as of August 15, 2002, from Ameren Missouri toThe Bank of New York Mellon, as successor trustee (relating tosenior secured debt securities) (Ameren Missouri Indenture)
August 23, 2002 Form 8-K, Exhibit 4.1,File No. 1-2967
4.40AmerenAmeren Missouri
First Supplemental Indenture to the Ameren Missouri Indenture,dated as of May 15, 2012 Exhibit 4.48, File No. 333-182258
4.41AmerenAmeren Missouri
Ameren Missouri Indenture Company Order, dated March 10,2003, establishing the 5.50% Senior Secured Notes due 2034(including the global note)
March 11, 2003 Form 8-K, Exhibits 4.2 and 4.3, File No. 1-2967
4.42AmerenAmeren Missouri
Ameren Missouri Indenture Company Order, dated July 28, 2003,establishing the 5.10% Senior Secured Notes due 2018 (includingthe global note)
August 4, 2003 Form 8-K, Exhibits 4.2 and 4.3, File No. 1-2967
4.43AmerenAmeren Missouri
Ameren Missouri Indenture Company Order, dated September 1,2004, establishing the 5.10% Senior Secured Notes due 2019(including the global note)
September 23, 2004 Form 8-K, Exhibits 4.2 and 4.3, FileNo. 1-2967
4.44AmerenAmeren Missouri
Ameren Missouri Indenture Company Order, dated January 27,2005, establishing the 5.00% Senior Secured Notes due 2020(including the global note)
January 27, 2005 Form 8-K, Exhibits 4.2 and 4.3, FileNo. 1-2967
4.45AmerenAmeren Missouri
Ameren Missouri Indenture Company Order, dated July 21, 2005,establishing the 5.30% Senior Secured Notes due 2037 (includingthe global note)
July 21, 2005 Form 8-K, Exhibits 4.2 and 4.3, File No. 1-2967
4.46AmerenAmeren Missouri
Ameren Missouri Indenture Company Order, dated June 15, 2007,establishing the 6.40% Senior Secured Notes due 2017 (includingthe global note)
June 15, 2007 Form 8-K, Exhibits 4.2 and 4.3, File No. 1-2967
4.47AmerenAmeren Missouri
Ameren Missouri Indenture Company Order, dated April 8, 2008,establishing the 6.00% Senior Secured Notes due 2018 (includingthe global note)
April 8, 2008 Form 8-K, Exhibits 4.3 and 4.5, File No. 1-2967
4.48AmerenAmeren Missouri
Ameren Missouri Indenture Company Order, dated June 19, 2008,establishing the 6.70% Senior Secured Notes due 2019 (includingthe global note)
June 19, 2008 Form 8-K, Exhibits 4.2 and 4.3, File No. 1-2967
4.49AmerenAmeren Missouri
Ameren Missouri Indenture Company Order, dated March 20,2009, establishing the 8.45% Senior Secured Notes due 2039(including the global note)
March 23, 2009 Form 8-K, Exhibits 4.2 and 4.3, File No. 1-2967
4.50AmerenAmeren Missouri
Ameren Missouri Indenture Company Order, dated September 11,2012, establishing the 3.90% Senior Secured Notes due 2042(including the global note)
September 30, 2012 Form 10-Q, Exhibit 4.1 and September11, 2012 Form 8-K, Exhibit 4.2, File No. 1-2967
4.51AmerenAmeren Missouri
Ameren Missouri Indenture Company Order, dated April 4, 2014,establishing the 3.50% Senior Secured Notes due 2024 (includingthe global note)
April 4, 2014 Form 8-K, Exhibits 4.2 and 4.3, File No. 1-2967
4.52AmerenAmeren Missouri
Ameren Missouri Indenture Company Order, dated April 6, 2015,establishing the 3.65% Senior Secured Notes due 2045 (includingthe global note)
April 6, 2015 Form 8-K, Exhibits 4.2 and 4.3, File No. 1-2967
4.53AmerenAmeren Missouri
Ameren Missouri Indenture Company Order, dated June 23, 2016,requesting authentication of an additional $150,000,000 aggregateprincipal amount of 3.65% Senior Secured Notes due 2045(including the global note) June 30, 2016 Form 10-Q, Exhibit 4.1, File No. 1-2967
4.54AmerenAmeren Illinois
Indenture, dated as of December 1, 1998, from Ameren Illinois(formerly Central Illinois Public Service Company) to The Bankof New York Mellon Trust Company, N.A., as successor trustee(CIPS Indenture) Exhibit 4.4, File No. 333-59438
4.55AmerenAmeren Illinois
First Supplemental Indenture to the CIPS Indenture, dated as ofJune 14, 2006 June 19, 2006 Form 8-K, Exhibit 4.2, File No. 1-3672
4.56AmerenAmeren Illinois
Second Supplemental Indenture to the CIPS Indenture, dated as ofMarch 1, 2010 Exhibit 4.17, File No. 333-166095
4.57AmerenAmeren Illinois
Third Supplemental Indenture to the CIPS Indenture, dated as ofOctober 1, 2010 2010 Form 10-K, Exhibit 4.59, File No. 1-3672
4.58AmerenAmeren Illinois
Ameren Illinois Global Note, dated October 1, 2010, representingCIPS Indenture Senior Notes, 6.125% due 2028 2010 Form 10-K, Exhibit 4.60, File No. 1-3672
4.59AmerenAmeren Illinois
Ameren Illinois Global Note, dated October 1, 2010, representingCIPS Indenture Senior Notes, 6.70% Series Secured Notes due2036 2010 Form 10-K, Exhibit 4.62, File No. 1-3672
151
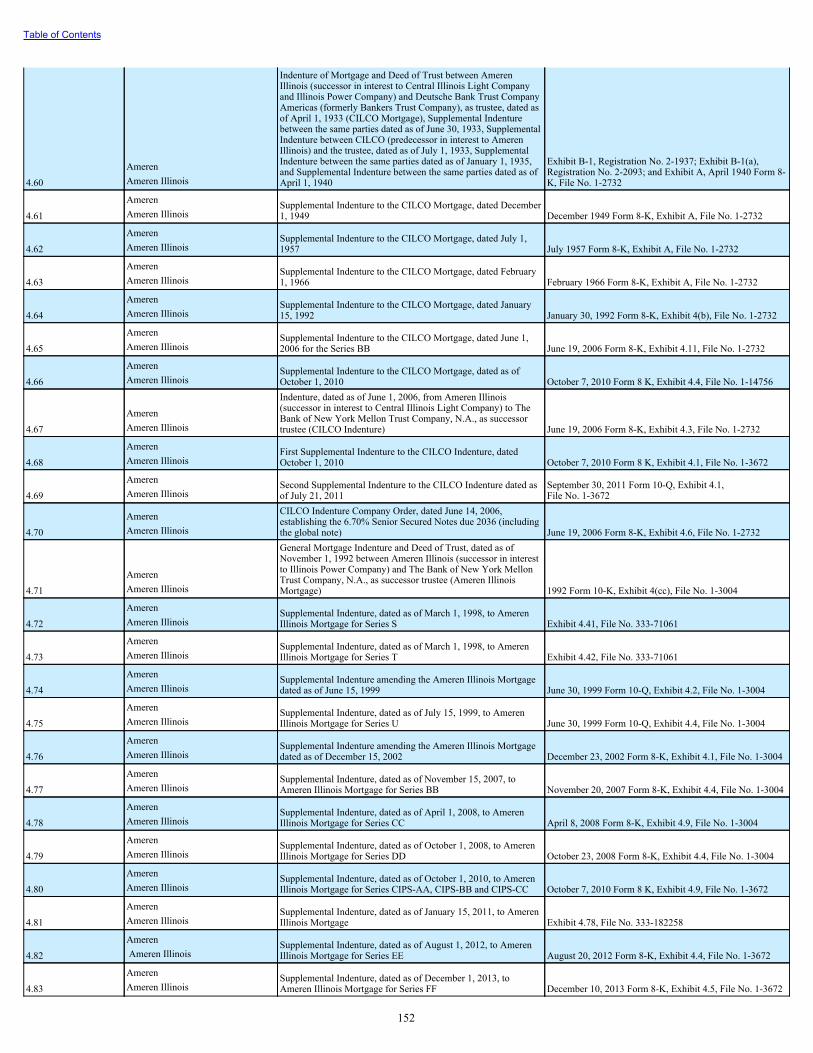
Table of Contents
4.60AmerenAmeren Illinois
Indenture of Mortgage and Deed of Trust between AmerenIllinois (successor in interest to Central Illinois Light Companyand Illinois Power Company) and Deutsche Bank Trust CompanyAmericas (formerly Bankers Trust Company), as trustee, dated asof April 1, 1933 (CILCO Mortgage), Supplemental Indenturebetween the same parties dated as of June 30, 1933, SupplementalIndenture between CILCO (predecessor in interest to AmerenIllinois) and the trustee, dated as of July 1, 1933, SupplementalIndenture between the same parties dated as of January 1, 1935,and Supplemental Indenture between the same parties dated as ofApril 1, 1940
Exhibit B-1, Registration No. 2-1937; Exhibit B-1(a),Registration No. 2-2093; and Exhibit A, April 1940 Form 8-K, File No. 1-2732
4.61AmerenAmeren Illinois
Supplemental Indenture to the CILCO Mortgage, dated December1, 1949 December 1949 Form 8-K, Exhibit A, File No. 1-2732
4.62AmerenAmeren Illinois
Supplemental Indenture to the CILCO Mortgage, dated July 1,1957 July 1957 Form 8-K, Exhibit A, File No. 1-2732
4.63AmerenAmeren Illinois
Supplemental Indenture to the CILCO Mortgage, dated February1, 1966 February 1966 Form 8-K, Exhibit A, File No. 1-2732
4.64AmerenAmeren Illinois
Supplemental Indenture to the CILCO Mortgage, dated January15, 1992 January 30, 1992 Form 8-K, Exhibit 4(b), File No. 1-2732
4.65AmerenAmeren Illinois
Supplemental Indenture to the CILCO Mortgage, dated June 1,2006 for the Series BB June 19, 2006 Form 8-K, Exhibit 4.11, File No. 1-2732
4.66AmerenAmeren Illinois
Supplemental Indenture to the CILCO Mortgage, dated as ofOctober 1, 2010 October 7, 2010 Form 8 K, Exhibit 4.4, File No. 1-14756
4.67AmerenAmeren Illinois
Indenture, dated as of June 1, 2006, from Ameren Illinois(successor in interest to Central Illinois Light Company) to TheBank of New York Mellon Trust Company, N.A., as successortrustee (CILCO Indenture) June 19, 2006 Form 8-K, Exhibit 4.3, File No. 1-2732
4.68AmerenAmeren Illinois
First Supplemental Indenture to the CILCO Indenture, datedOctober 1, 2010 October 7, 2010 Form 8 K, Exhibit 4.1, File No. 1-3672
4.69AmerenAmeren Illinois
Second Supplemental Indenture to the CILCO Indenture dated asof July 21, 2011
September 30, 2011 Form 10-Q, Exhibit 4.1,File No. 1-3672
4.70AmerenAmeren Illinois
CILCO Indenture Company Order, dated June 14, 2006,establishing the 6.70% Senior Secured Notes due 2036 (includingthe global note) June 19, 2006 Form 8-K, Exhibit 4.6, File No. 1-2732
4.71AmerenAmeren Illinois
General Mortgage Indenture and Deed of Trust, dated as ofNovember 1, 1992 between Ameren Illinois (successor in interestto Illinois Power Company) and The Bank of New York MellonTrust Company, N.A., as successor trustee (Ameren IllinoisMortgage) 1992 Form 10-K, Exhibit 4(cc), File No. 1-3004
4.72AmerenAmeren Illinois
Supplemental Indenture, dated as of March 1, 1998, to AmerenIllinois Mortgage for Series S Exhibit 4.41, File No. 333-71061
4.73AmerenAmeren Illinois
Supplemental Indenture, dated as of March 1, 1998, to AmerenIllinois Mortgage for Series T Exhibit 4.42, File No. 333-71061
4.74AmerenAmeren Illinois
Supplemental Indenture amending the Ameren Illinois Mortgagedated as of June 15, 1999 June 30, 1999 Form 10-Q, Exhibit 4.2, File No. 1-3004
4.75AmerenAmeren Illinois
Supplemental Indenture, dated as of July 15, 1999, to AmerenIllinois Mortgage for Series U June 30, 1999 Form 10-Q, Exhibit 4.4, File No. 1-3004
4.76AmerenAmeren Illinois
Supplemental Indenture amending the Ameren Illinois Mortgagedated as of December 15, 2002 December 23, 2002 Form 8-K, Exhibit 4.1, File No. 1-3004
4.77AmerenAmeren Illinois
Supplemental Indenture, dated as of November 15, 2007, toAmeren Illinois Mortgage for Series BB November 20, 2007 Form 8-K, Exhibit 4.4, File No. 1-3004
4.78AmerenAmeren Illinois
Supplemental Indenture, dated as of April 1, 2008, to AmerenIllinois Mortgage for Series CC April 8, 2008 Form 8-K, Exhibit 4.9, File No. 1-3004
4.79AmerenAmeren Illinois
Supplemental Indenture, dated as of October 1, 2008, to AmerenIllinois Mortgage for Series DD October 23, 2008 Form 8-K, Exhibit 4.4, File No. 1-3004
4.80AmerenAmeren Illinois
Supplemental Indenture, dated as of October 1, 2010, to AmerenIllinois Mortgage for Series CIPS-AA, CIPS-BB and CIPS-CC October 7, 2010 Form 8 K, Exhibit 4.9, File No. 1-3672
4.81AmerenAmeren Illinois
Supplemental Indenture, dated as of January 15, 2011, to AmerenIllinois Mortgage Exhibit 4.78, File No. 333-182258
4.82Ameren Ameren Illinois
Supplemental Indenture, dated as of August 1, 2012, to AmerenIllinois Mortgage for Series EE August 20, 2012 Form 8-K, Exhibit 4.4, File No. 1-3672
4.83AmerenAmeren Illinois
Supplemental Indenture, dated as of December 1, 2013, toAmeren Illinois Mortgage for Series FF December 10, 2013 Form 8-K, Exhibit 4.5, File No. 1-3672
152

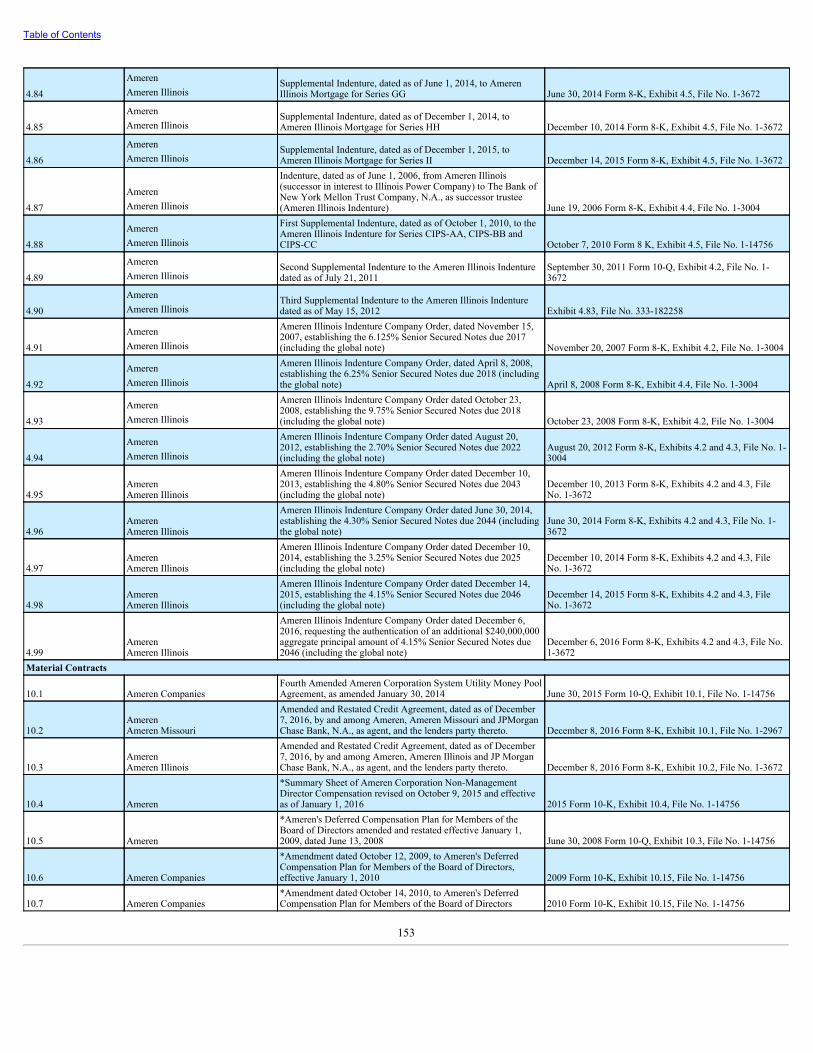
Table of Contents
4.84AmerenAmeren Illinois
Supplemental Indenture, dated as of June 1, 2014, to AmerenIllinois Mortgage for Series GG June 30, 2014 Form 8-K, Exhibit 4.5, File No. 1-3672
4.85AmerenAmeren Illinois
Supplemental Indenture, dated as of December 1, 2014, toAmeren Illinois Mortgage for Series HH December 10, 2014 Form 8-K, Exhibit 4.5, File No. 1-3672
4.86AmerenAmeren Illinois
Supplemental Indenture, dated as of December 1, 2015, toAmeren Illinois Mortgage for Series II December 14, 2015 Form 8-K, Exhibit 4.5, File No. 1-3672
4.87AmerenAmeren Illinois
Indenture, dated as of June 1, 2006, from Ameren Illinois(successor in interest to Illinois Power Company) to The Bank ofNew York Mellon Trust Company, N.A., as successor trustee(Ameren Illinois Indenture) June 19, 2006 Form 8-K, Exhibit 4.4, File No. 1-3004
4.88AmerenAmeren Illinois
First Supplemental Indenture, dated as of October 1, 2010, to theAmeren Illinois Indenture for Series CIPS-AA, CIPS-BB andCIPS-CC October 7, 2010 Form 8 K, Exhibit 4.5, File No. 1-14756
4.89AmerenAmeren Illinois
Second Supplemental Indenture to the Ameren Illinois Indenturedated as of July 21, 2011
September 30, 2011 Form 10-Q, Exhibit 4.2, File No. 1-3672
4.90AmerenAmeren Illinois
Third Supplemental Indenture to the Ameren Illinois Indenturedated as of May 15, 2012 Exhibit 4.83, File No. 333-182258
4.91AmerenAmeren Illinois
Ameren Illinois Indenture Company Order, dated November 15,2007, establishing the 6.125% Senior Secured Notes due 2017(including the global note) November 20, 2007 Form 8-K, Exhibit 4.2, File No. 1-3004
4.92AmerenAmeren Illinois
Ameren Illinois Indenture Company Order, dated April 8, 2008,establishing the 6.25% Senior Secured Notes due 2018 (includingthe global note) April 8, 2008 Form 8-K, Exhibit 4.4, File No. 1-3004
4.93AmerenAmeren Illinois
Ameren Illinois Indenture Company Order dated October 23,2008, establishing the 9.75% Senior Secured Notes due 2018(including the global note) October 23, 2008 Form 8-K, Exhibit 4.2, File No. 1-3004
4.94AmerenAmeren Illinois
Ameren Illinois Indenture Company Order dated August 20,2012, establishing the 2.70% Senior Secured Notes due 2022(including the global note)
August 20, 2012 Form 8-K, Exhibits 4.2 and 4.3, File No. 1-3004
4.95AmerenAmeren Illinois
Ameren Illinois Indenture Company Order dated December 10,2013, establishing the 4.80% Senior Secured Notes due 2043(including the global note)
December 10, 2013 Form 8-K, Exhibits 4.2 and 4.3, FileNo. 1-3672
4.96AmerenAmeren Illinois
Ameren Illinois Indenture Company Order dated June 30, 2014,establishing the 4.30% Senior Secured Notes due 2044 (includingthe global note)
June 30, 2014 Form 8-K, Exhibits 4.2 and 4.3, File No. 1-3672
4.97AmerenAmeren Illinois
Ameren Illinois Indenture Company Order dated December 10,2014, establishing the 3.25% Senior Secured Notes due 2025(including the global note)
December 10, 2014 Form 8-K, Exhibits 4.2 and 4.3, FileNo. 1-3672
4.98AmerenAmeren Illinois
Ameren Illinois Indenture Company Order dated December 14,2015, establishing the 4.15% Senior Secured Notes due 2046(including the global note)
December 14, 2015 Form 8-K, Exhibits 4.2 and 4.3, FileNo. 1-3672
4.99AmerenAmeren Illinois
Ameren Illinois Indenture Company Order dated December 6,2016, requesting the authentication of an additional $240,000,000aggregate principal amount of 4.15% Senior Secured Notes due2046 (including the global note)
December 6, 2016 Form 8-K, Exhibits 4.2 and 4.3, File No.1-3672
Material Contracts
10.1 Ameren CompaniesFourth Amended Ameren Corporation System Utility Money PoolAgreement, as amended January 30, 2014 June 30, 2015 Form 10-Q, Exhibit 10.1, File No. 1-14756
10.2AmerenAmeren Missouri
Amended and Restated Credit Agreement, dated as of December7, 2016, by and among Ameren, Ameren Missouri and JPMorganChase Bank, N.A., as agent, and the lenders party thereto. December 8, 2016 Form 8-K, Exhibit 10.1, File No. 1-2967
10.3AmerenAmeren Illinois
Amended and Restated Credit Agreement, dated as of December7, 2016, by and among Ameren, Ameren Illinois and JP MorganChase Bank, N.A., as agent, and the lenders party thereto. December 8, 2016 Form 8-K, Exhibit 10.2, File No. 1-3672
10.4 Ameren
*Summary Sheet of Ameren Corporation Non-ManagementDirector Compensation revised on October 9, 2015 and effectiveas of January 1, 2016 2015 Form 10-K, Exhibit 10.4, File No. 1-14756
10.5 Ameren
*Ameren's Deferred Compensation Plan for Members of theBoard of Directors amended and restated effective January 1,2009, dated June 13, 2008 June 30, 2008 Form 10-Q, Exhibit 10.3, File No. 1-14756
10.6 Ameren Companies
*Amendment dated October 12, 2009, to Ameren's DeferredCompensation Plan for Members of the Board of Directors,effective January 1, 2010 2009 Form 10-K, Exhibit 10.15, File No. 1-14756
10.7 Ameren Companies*Amendment dated October 14, 2010, to Ameren's DeferredCompensation Plan for Members of the Board of Directors 2010 Form 10-K, Exhibit 10.15, File No. 1-14756
153
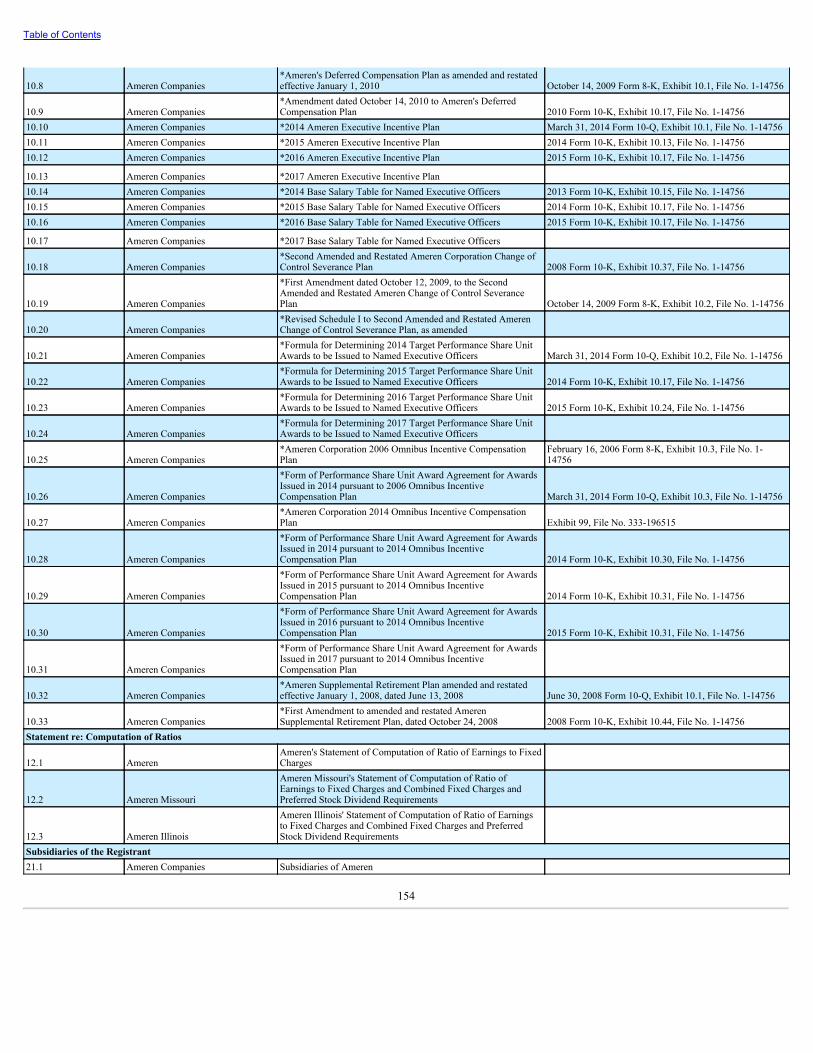
Table of Contents
10.8 Ameren Companies*Ameren's Deferred Compensation Plan as amended and restatedeffective January 1, 2010 October 14, 2009 Form 8-K, Exhibit 10.1, File No. 1-14756
10.9 Ameren Companies*Amendment dated October 14, 2010 to Ameren's DeferredCompensation Plan 2010 Form 10-K, Exhibit 10.17, File No. 1-14756
10.10 Ameren Companies *2014 Ameren Executive Incentive Plan March 31, 2014 Form 10-Q, Exhibit 10.1, File No. 1-1475610.11 Ameren Companies *2015 Ameren Executive Incentive Plan 2014 Form 10-K, Exhibit 10.13, File No. 1-1475610.12 Ameren Companies *2016 Ameren Executive Incentive Plan 2015 Form 10-K, Exhibit 10.17, File No. 1-14756
10.13 Ameren Companies *2017 Ameren Executive Incentive Plan 10.14 Ameren Companies *2014 Base Salary Table for Named Executive Officers 2013 Form 10-K, Exhibit 10.15, File No. 1-1475610.15 Ameren Companies *2015 Base Salary Table for Named Executive Officers 2014 Form 10-K, Exhibit 10.17, File No. 1-1475610.16 Ameren Companies *2016 Base Salary Table for Named Executive Officers 2015 Form 10-K, Exhibit 10.17, File No. 1-14756
10.17 Ameren Companies *2017 Base Salary Table for Named Executive Officers
10.18 Ameren Companies*Second Amended and Restated Ameren Corporation Change ofControl Severance Plan 2008 Form 10-K, Exhibit 10.37, File No. 1-14756
10.19 Ameren Companies
*First Amendment dated October 12, 2009, to the SecondAmended and Restated Ameren Change of Control SeverancePlan October 14, 2009 Form 8-K, Exhibit 10.2, File No. 1-14756
10.20 Ameren Companies*Revised Schedule I to Second Amended and Restated AmerenChange of Control Severance Plan, as amended
10.21 Ameren Companies*Formula for Determining 2014 Target Performance Share UnitAwards to be Issued to Named Executive Officers March 31, 2014 Form 10-Q, Exhibit 10.2, File No. 1-14756
10.22 Ameren Companies*Formula for Determining 2015 Target Performance Share UnitAwards to be Issued to Named Executive Officers 2014 Form 10-K, Exhibit 10.17, File No. 1-14756
10.23 Ameren Companies*Formula for Determining 2016 Target Performance Share UnitAwards to be Issued to Named Executive Officers 2015 Form 10-K, Exhibit 10.24, File No. 1-14756
10.24 Ameren Companies*Formula for Determining 2017 Target Performance Share UnitAwards to be Issued to Named Executive Officers
10.25 Ameren Companies*Ameren Corporation 2006 Omnibus Incentive CompensationPlan
February 16, 2006 Form 8-K, Exhibit 10.3, File No. 1-14756
10.26 Ameren Companies
*Form of Performance Share Unit Award Agreement for AwardsIssued in 2014 pursuant to 2006 Omnibus IncentiveCompensation Plan March 31, 2014 Form 10-Q, Exhibit 10.3, File No. 1-14756
10.27 Ameren Companies*Ameren Corporation 2014 Omnibus Incentive CompensationPlan Exhibit 99, File No. 333-196515
10.28 Ameren Companies
*Form of Performance Share Unit Award Agreement for AwardsIssued in 2014 pursuant to 2014 Omnibus IncentiveCompensation Plan 2014 Form 10-K, Exhibit 10.30, File No. 1-14756
10.29 Ameren Companies
*Form of Performance Share Unit Award Agreement for AwardsIssued in 2015 pursuant to 2014 Omnibus IncentiveCompensation Plan 2014 Form 10-K, Exhibit 10.31, File No. 1-14756
10.30 Ameren Companies
*Form of Performance Share Unit Award Agreement for AwardsIssued in 2016 pursuant to 2014 Omnibus IncentiveCompensation Plan 2015 Form 10-K, Exhibit 10.31, File No. 1-14756
10.31 Ameren Companies
*Form of Performance Share Unit Award Agreement for AwardsIssued in 2017 pursuant to 2014 Omnibus IncentiveCompensation Plan
10.32 Ameren Companies*Ameren Supplemental Retirement Plan amended and restatedeffective January 1, 2008, dated June 13, 2008 June 30, 2008 Form 10-Q, Exhibit 10.1, File No. 1-14756
10.33 Ameren Companies*First Amendment to amended and restated AmerenSupplemental Retirement Plan, dated October 24, 2008 2008 Form 10-K, Exhibit 10.44, File No. 1-14756
Statement re: Computation of Ratios
12.1 AmerenAmeren's Statement of Computation of Ratio of Earnings to FixedCharges
12.2 Ameren Missouri
Ameren Missouri's Statement of Computation of Ratio ofEarnings to Fixed Charges and Combined Fixed Charges andPreferred Stock Dividend Requirements
12.3 Ameren Illinois
Ameren Illinois' Statement of Computation of Ratio of Earningsto Fixed Charges and Combined Fixed Charges and PreferredStock Dividend Requirements
Subsidiaries of the Registrant21.1 Ameren Companies Subsidiaries of Ameren
154
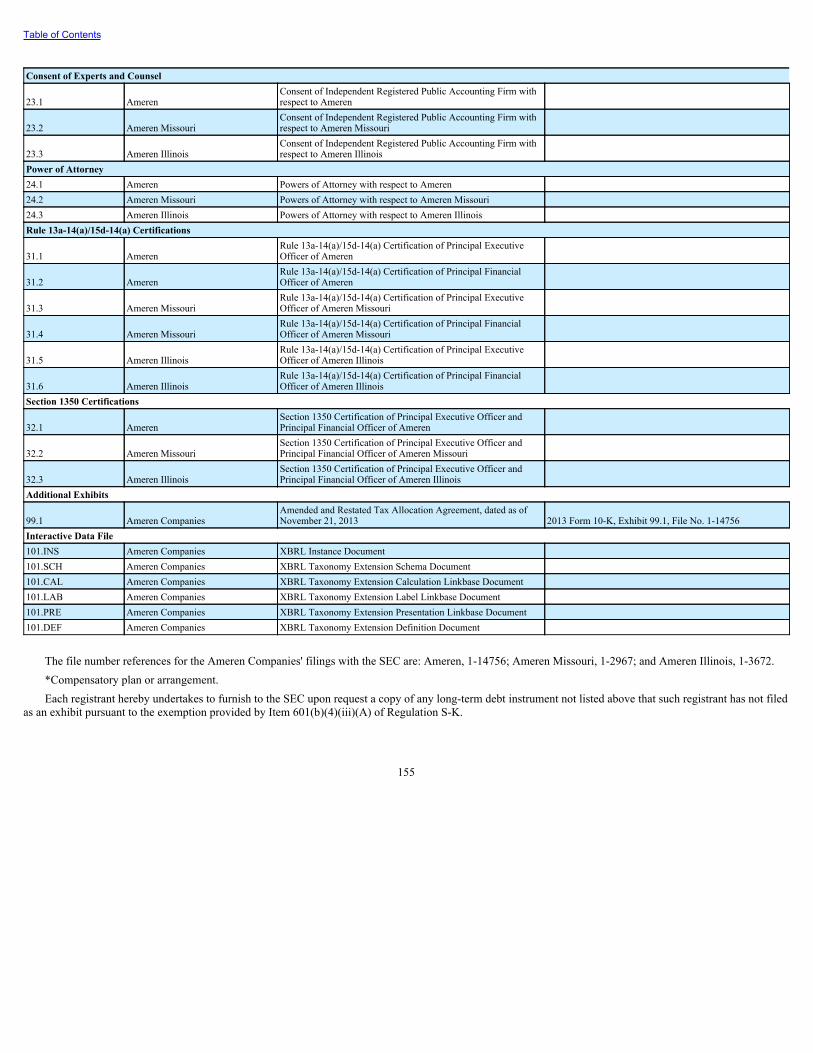
Table of Contents
Consent of Experts and Counsel
23.1 AmerenConsent of Independent Registered Public Accounting Firm withrespect to Ameren
23.2 Ameren MissouriConsent of Independent Registered Public Accounting Firm withrespect to Ameren Missouri
23.3 Ameren IllinoisConsent of Independent Registered Public Accounting Firm withrespect to Ameren Illinois
Power of Attorney24.1 Ameren Powers of Attorney with respect to Ameren 24.2 Ameren Missouri Powers of Attorney with respect to Ameren Missouri 24.3 Ameren Illinois Powers of Attorney with respect to Ameren Illinois Rule 13a-14(a)/15d-14(a) Certifications
31.1 AmerenRule 13a-14(a)/15d-14(a) Certification of Principal ExecutiveOfficer of Ameren
31.2 AmerenRule 13a-14(a)/15d-14(a) Certification of Principal FinancialOfficer of Ameren
31.3 Ameren MissouriRule 13a-14(a)/15d-14(a) Certification of Principal ExecutiveOfficer of Ameren Missouri
31.4 Ameren MissouriRule 13a-14(a)/15d-14(a) Certification of Principal FinancialOfficer of Ameren Missouri
31.5 Ameren IllinoisRule 13a-14(a)/15d-14(a) Certification of Principal ExecutiveOfficer of Ameren Illinois
31.6 Ameren IllinoisRule 13a-14(a)/15d-14(a) Certification of Principal FinancialOfficer of Ameren Illinois
Section 1350 Certifications
32.1 AmerenSection 1350 Certification of Principal Executive Officer andPrincipal Financial Officer of Ameren
32.2 Ameren MissouriSection 1350 Certification of Principal Executive Officer andPrincipal Financial Officer of Ameren Missouri
32.3 Ameren IllinoisSection 1350 Certification of Principal Executive Officer andPrincipal Financial Officer of Ameren Illinois
Additional Exhibits
99.1 Ameren CompaniesAmended and Restated Tax Allocation Agreement, dated as ofNovember 21, 2013 2013 Form 10-K, Exhibit 99.1, File No. 1-14756
Interactive Data File101.INS Ameren Companies XBRL Instance Document 101.SCH Ameren Companies XBRL Taxonomy Extension Schema Document 101.CAL Ameren Companies XBRL Taxonomy Extension Calculation Linkbase Document 101.LAB Ameren Companies XBRL Taxonomy Extension Label Linkbase Document 101.PRE Ameren Companies XBRL Taxonomy Extension Presentation Linkbase Document 101.DEF Ameren Companies XBRL Taxonomy Extension Definition Document
The file number references for the Ameren Companies' filings with the SEC are: Ameren, 1-14756; Ameren Missouri, 1-2967; and Ameren Illinois, 1-3672.*Compensatory plan or arrangement.Each registrant hereby undertakes to furnish to the SEC upon request a copy of any long-term debt instrument not listed above that such registrant has not filed
as an exhibit pursuant to the exemption provided by Item 601(b)(4)(iii)(A) of Regulation S-K.
155
Exhibit 10.13
2017 AMEREN EXECUTIVE INCENTIVE PLAN FOR OFFICERS
SUMMARY
The Ameren Executive Incentive Plan (“EIP”) is intended to reward eligible Officers for their contributions to Ameren’s success. The EIP rewardsOfficers for Ameren’s earnings per share (“EPS”) results, safety, operational performance results and individual performance during a plan year(January 1 - December 31). The EIP is approved by the Human Resources Committee of Ameren’s Board of Directors (“Committee”). Amerenreserves the right at its sole discretion to revise, modify, suspend, continue or discontinue the EIP effective for a future plan year.
EIP ELIGIBILITY
All Officers who are actively employed on the date the award is paid and who comply with the Confidentiality and Non-Solicitation obligationsdescribed below are eligible to participate in the EIP pursuant to the terms described herein and except as provided under “ ImpactofEvents”(below).
AWARD OPPORTUNITIES
Award opportunity percentages are set by the Human Resources Committee of the Board of Directors. Annually, you will receive an individualcommunication regarding your short-term incentive target opportunity, expressed as a percentage of your base salary. Base salary is defined,generally, as the salary at the end of the plan year or at the time of eligible termination of employment, if earlier. However, if your salary changesduring the plan year, proration will apply as specified in “Job changes during plan year" under “ ImpactofEvents.”
PLAN STRUCTURE
The EIP has four primary components: (1) annual performance metrics; (2) a base award; (3) an individual performance modifier; and (4) anindividual short-term incentive payout. These components are described in more detail below.
Annual Performance Metrics (EPS, Safety & Operational)
The performance metrics in the plan are weighted as follows: 80% based on EPS, 10% based on safety, and 10% based on operational measures.
A co-worker to co-worker (c2c) interaction is a leading indicator for safety performance and will be used as the safety metric in 2017. A c2cinteraction is a formal process for co-worker interactions with the goal of reinforcing safe behaviors, providing constructive feedback for risky and/orunsafe behaviors and conditions, identifying and discussing corrective actions and gathering behavior data for trending and sharing across Ameren.
_______________________
*Effective January 1, 2017, the role of Assistant Vice President is considered to be an Officer of the company and therefore, eligible for theExecutive Incentive Plan for Officers.
35663733v.2

The operational measures consist of the following metrics, each weighted 3 1/3%:
– Equivalent Availability (EA) – EA measures the percentage of the year Ameren Missouri's base load coal-fired generation fleet is availablefor operating at full capacity.
– System Average Interruption Frequency (SAIFI) – SAIFI is a standard customer reliability measure that assesses how often the averagecustomer experiences a sustained interruption over a one-year period.
– Callaway Performance Index (CPI) – CPI measures Callaway energy Center's overall plant performance through an index of safety andreliability measures, consistent with the Institute of Nuclear Plant Operations (INPO) Index.
Three levels of performance achievement are established for each performance metric – Threshold, Target and Maximum. The three levels aredefined as follows:
Base Award
Following the conclusion of the plan year, Ameren’s actual EPS, safety & operational performance will be measured. Using these performanceresults, a formulaic Base Award will be determined for each Officer. Achievement between the established levels (threshold, target, and maximum)will be interpolated. As described below, this formulaic Base Award will then be subject to modification based on your individual performance.
Note: EPS achievement levels may be adjusted to include or exclude specified items of an unusual nature or non-recurring or significant events notanticipated in the business plan when EPS achievement levels were established. Any such adjustment will be determined by the Committee at itssole discretion and only as permitted by the Ameren Corporation 2014 Omnibus Incentive Compensation Plan (“Plan”).
Individual Performance Modifier
Your Base Award may be adjusted up or down by as much as 25%, based on your individual contributions and performance during the plan year.Demonstrated leadership and the achievement of key operational goals (besides those specifically measured under the Plan) are considered whenfurther modifying the Base Award for each Officer. In the case of poor or non-performance, an award may be adjusted down to zero.
In the event that maximum results are achieved under the EPS, safety and operational measures and therefore, the Base Award is equal to 200% ofthe short-term target incentive opportunity, the individual performance modifier may only apply as a reduction to the Base Award.
35663733v.2
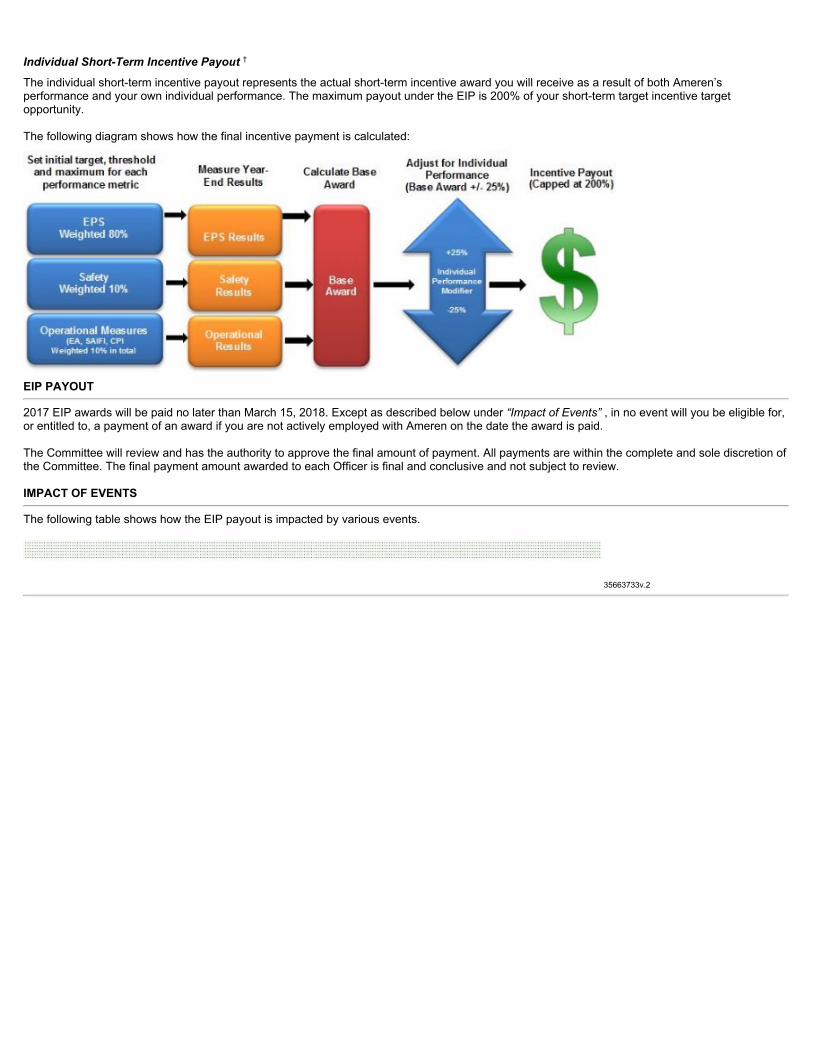
Individual Short-Term Incentive Payout †
The individual short-term incentive payout represents the actual short-term incentive award you will receive as a result of both Ameren’sperformance and your own individual performance. The maximum payout under the EIP is 200% of your short-term target incentive targetopportunity.
The following diagram shows how the final incentive payment is calculated:
EIP PAYOUT
2017 EIP awards will be paid no later than March 15, 2018. Except as described below under “ImpactofEvents”, in no event will you be eligible for,or entitled to, a payment of an award if you are not actively employed with Ameren on the date the award is paid.
The Committee will review and has the authority to approve the final amount of payment. All payments are within the complete and sole discretion ofthe Committee. The final payment amount awarded to each Officer is final and conclusive and not subject to review.
IMPACT OF EVENTS
The following table shows how the EIP payout is impacted by various events.
35663733v.2
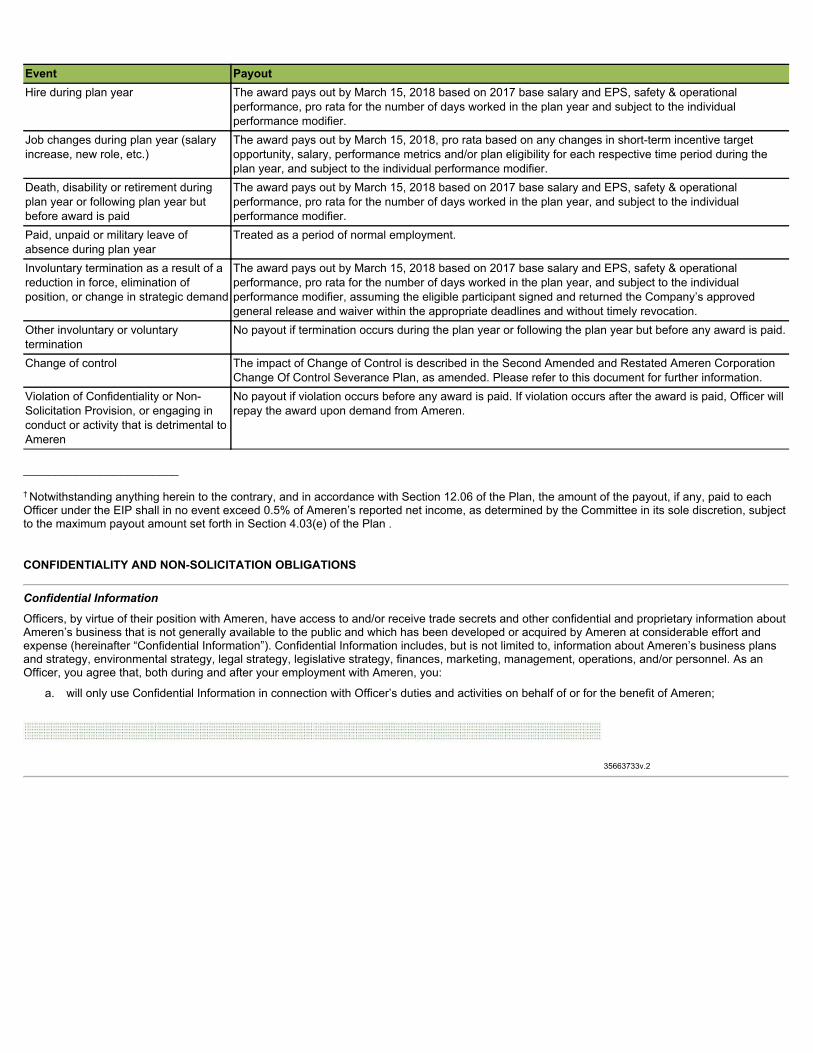
Event PayoutHire during plan year The award pays out by March 15, 2018 based on 2017 base salary and EPS, safety & operational
performance, pro rata for the number of days worked in the plan year and subject to the individualperformance modifier.
Job changes during plan year (salaryincrease, new role, etc.)
The award pays out by March 15, 2018, pro rata based on any changes in short-term incentive targetopportunity, salary, performance metrics and/or plan eligibility for each respective time period during theplan year, and subject to the individual performance modifier.
Death, disability or retirement duringplan year or following plan year butbefore award is paid
The award pays out by March 15, 2018 based on 2017 base salary and EPS, safety & operationalperformance, pro rata for the number of days worked in the plan year, and subject to the individualperformance modifier.
Paid, unpaid or military leave ofabsence during plan year
Treated as a period of normal employment.
Involuntary termination as a result of areduction in force, elimination ofposition, or change in strategic demand
The award pays out by March 15, 2018 based on 2017 base salary and EPS, safety & operationalperformance, pro rata for the number of days worked in the plan year, and subject to the individualperformance modifier, assuming the eligible participant signed and returned the Company’s approvedgeneral release and waiver within the appropriate deadlines and without timely revocation.
Other involuntary or voluntarytermination
No payout if termination occurs during the plan year or following the plan year but before any award is paid.
Change of control The impact of Change of Control is described in the Second Amended and Restated Ameren CorporationChange Of Control Severance Plan, as amended. Please refer to this document for further information.
Violation of Confidentiality or Non-Solicitation Provision, or engaging inconduct or activity that is detrimental toAmeren
No payout if violation occurs before any award is paid. If violation occurs after the award is paid, Officer willrepay the award upon demand from Ameren.
________________________
† Notwithstanding anything herein to the contrary, and in accordance with Section 12.06 of the Plan, the amount of the payout, if any, paid to eachOfficer under the EIP shall in no event exceed 0.5% of Ameren’s reported net income, as determined by the Committee in its sole discretion, subjectto the maximum payout amount set forth in Section 4.03(e) of the Plan .
CONFIDENTIALITY AND NON-SOLICITATION OBLIGATIONS
Confidential Information
Officers, by virtue of their position with Ameren, have access to and/or receive trade secrets and other confidential and proprietary information aboutAmeren’s business that is not generally available to the public and which has been developed or acquired by Ameren at considerable effort andexpense (hereinafter “Confidential Information”). Confidential Information includes, but is not limited to, information about Ameren’s business plansand strategy, environmental strategy, legal strategy, legislative strategy, finances, marketing, management, operations, and/or personnel. As anOfficer, you agree that, both during and after your employment with Ameren, you:
a. will only use Confidential Information in connection with Officer’s duties and activities on behalf of or for the benefit of Ameren;
35663733v.2
b. will not use Confidential Information in any way that is detrimental to Ameren;
c. will hold the Confidential Information in strictest confidence and take reasonable efforts to protect such Confidential Information fromdisclosure to any third party or person who is not authorized to receive, review or access the Confidential Information;
d. will not use Confidential Information for Officer’s own benefit or the benefit of others, without the prior written consent of Ameren; and
e. will return all Confidential Information to Ameren within two business days of the Officer’s termination of employment or immediately uponAmeren’s demand to return the Confidential Information to Ameren.
Non-Solicitation
In addition, in the event that you terminate employment with Ameren, you agree that, for one year from the end of your employment, you will not,directly or indirectly, on your behalf or on behalf of any other person, company or entity:
a. market, sell, solicit, or provide products or services competitive with or similar to products or services offered by Ameren to any person,company or entity that:
i. is a customer or potential customer of Ameren during the twelve (12) months prior to your termination of employment and
ii. with which you had direct contact with during the twelve (12) months prior to your termination of employment or possessed, utilizedor developed Confidential Information about during the twelve (12) months prior to your termination of employment;
b. raid, hire, solicit, encourage or attempt to persuade any employee or independent contractor of Ameren, or any person who was anemployee or independent contractor of Ameren during the 24 months preceding your termination, to leave the employ of, terminate orreduce the person’s employment or business relationship with Ameren;
c. interfere with the performance of any Ameren employee or independent contractor’s duties for Ameren.
Impact on Incentive Award Payment
If an Officer violates the Confidentiality and Non-Solicitation obligations or engages in conduct or activity that is detrimental to Ameren in the oneyear after employment with Ameren ends, then the Officer will not be eligible for the incentive award and the award will be rescinded. If an Officerviolates the Confidentiality and Non-Solicitation obligations after the award is paid, or if Ameren learns of the violations after the award is paid, theOfficer shall repay the award to Ameren within thirty (30) days of receiving a demand from Ameren for the repayment of the award.
Similarly, if an Officer engages in conduct or activity that is detrimental to Ameren after the award is paid, or if Ameren learns of the detrimentalconduct or activity after the award is paid, and such conduct occurred less than one year after Officer’s employment with Ameren ended, Officershall repay the award to Ameren within thirty (30) days of receiving a demand from Ameren for the repayment of the award and Ameren shall beentitled to an award of attorneys’ fees incurred in connection with securing such repayment.
AMEREN RELIEF
Officer acknowledges and agrees that the Confidentiality and Non-Solicitation provisions set forth above are necessary to protect Ameren’slegitimate business interests, such as its Confidential Information, goodwill and customer relationships. Officer acknowledges and agrees that abreach by Officer of either the Confidentiality or Non-Solicitation provision will cause irreparable damage to Ameren for which monetary damagesalone will not constitute an adequate remedy.
In the event of such breach or threatened breach, Ameren shall be entitled as a matter of right (without being required to prove damages or furnishany bond or other security) to obtain a restraining order, an injunction, or
35663733v.2

other equitable or extraordinary relief that restrains any further violation or threatened violation of either the Confidentiality or Non-Solicitationprovision, as well as an order requiring Officer to comply with the Confidentiality and/or Non-Solicitation provisions. Ameren’s right to a restrainingorder, an injunction, or other equitable or extraordinary relief shall be in addition to all other rights and remedies to which Ameren may be entitled toin law or in equity, including, without limitation, the right to recover monetary damages for Officer’s violation or threatened violation of theConfidentiality and/or Non-Solicitation provisions.
Finally, Ameren shall be entitled to an award of attorneys’ fees incurred in connection with securing any relief hereunder and/or pursuant to a breachor threatened breach of the Confidentiality and/or Non-Solicitation provisions.
ADMINISTRATION
The EIP and the employee’s rights hereunder are subject to all the terms and conditions of the Ameren Corporation 2014 Omnibus IncentiveCompensation Plan (“Plan”), as the same may be amended from time to time, as well as to such rules and regulations as the Committee or itsdesignee may adopt for administration of the Plan. The Committee, or its designee, is authorized to administer, construe and make alldeterminations necessary or appropriate to the administration of this EIP, all of which will be binding upon participants. If any provision of this EIPconflicts in any manner with the Plan, the terms of the Plan shall control.
GOVERNING LAW AND JURISDICTION
The EIP shall be interpreted and governed in accordance with the laws of the State of Missouri. Any action regarding the EIP shall be brought ineither the state or Federal court located in St. Louis, Missouri, and Officer agrees to submit himself/herself to the jurisdiction of the state or Federalcourt located in St. Louis, Missouri without regard to conflicts of law principles or personal jurisdiction. If a court construes any provision, or any partof any provision, found in either the above Confidentiality or Non-Solicitation provisions to be unreasonable or unenforceable, such court may revisethe provision to the maximum extent permitted by Missouri law and then enforce such provision as so revised.
MISCELLANEOUS
No employee shall have any claim or right to receive an award under this EIP. Neither this EIP nor any action taken hereunder shall be construed asgiving an employee any right to be retained by Ameren Corporation or any of its subsidiaries or to limit in any way the right of Ameren Corporation orany of its subsidiaries to change such employee’s compensation or other benefits or to terminate the employment or service of such person with orwithout cause. For purposes of this EIP, the transfer of employment by an employee between subsidiaries shall not be deemed a termination of theemployee’s employment.
CONTACT
Questions regarding this plan may be directed to the Director, Compensation & Performance at 314.206.0391, or the Executive CompensationManager at 314.206.0642.
35663733v.2
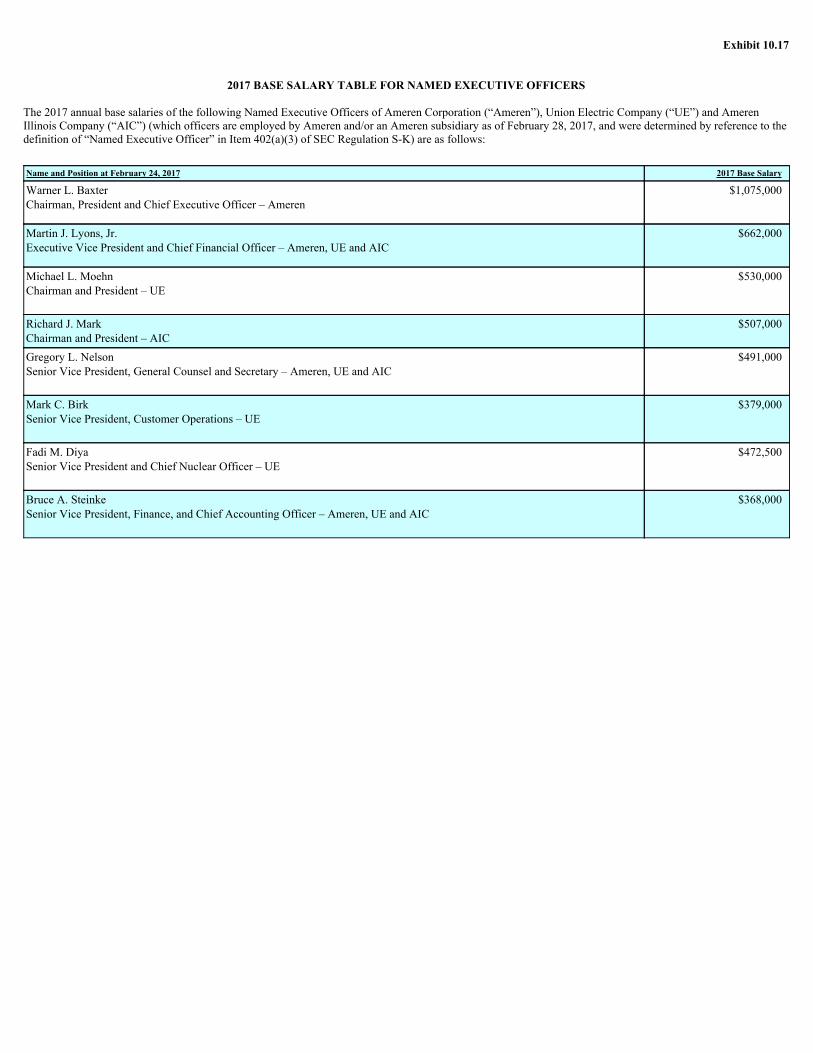
Exhibit 10.17
2017 BASE SALARY TABLE FOR NAMED EXECUTIVE OFFICERS
The 2017 annual base salaries of the following Named Executive Officers of Ameren Corporation (“Ameren”), Union Electric Company (“UE”) and AmerenIllinois Company (“AIC”) (which officers are employed by Ameren and/or an Ameren subsidiary as of February 28, 2017, and were determined by reference to thedefinition of “Named Executive Officer” in Item 402(a)(3) of SEC Regulation S-K) are as follows:
Name and Position at February 24, 2017 2017 Base Salary
Warner L. BaxterChairman, President and Chief Executive Officer – Ameren
$1,075,000
Martin J. Lyons, Jr.Executive Vice President and Chief Financial Officer – Ameren, UE and AIC
$662,000
Michael L. MoehnChairman and President – UE
$530,000
Richard J. MarkChairman and President – AIC
$507,000
Gregory L. NelsonSenior Vice President, General Counsel and Secretary – Ameren, UE and AIC
$491,000
Mark C. BirkSenior Vice President, Customer Operations – UE
$379,000
Fadi M. DiyaSenior Vice President and Chief Nuclear Officer – UE
$472,500
Bruce A. SteinkeSenior Vice President, Finance, and Chief Accounting Officer – Ameren, UE and AIC
$368,000
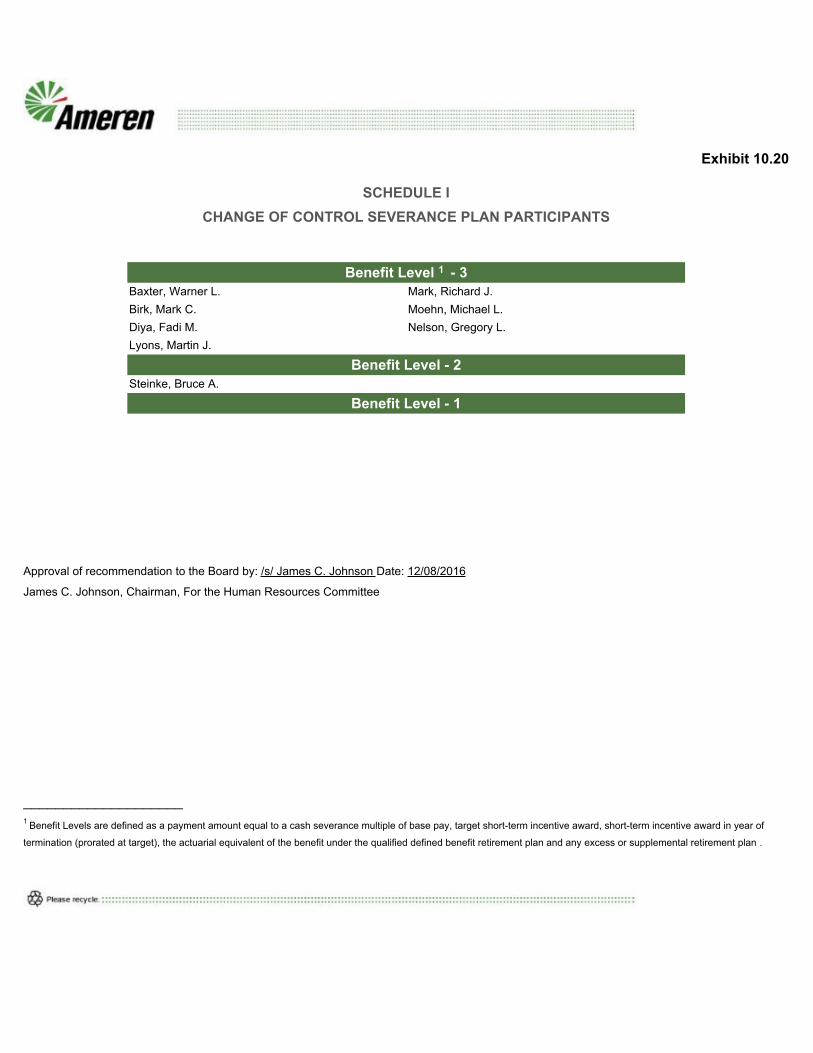
Exhibit 10.20
SCHEDULE ICHANGE OF CONTROL SEVERANCE PLAN PARTICIPANTS
Benefit Level 1 - 3Baxter, Warner L. Mark, Richard J.Birk, Mark C. Moehn, Michael L.Diya, Fadi M. Nelson, Gregory L.Lyons, Martin J.
Benefit Level - 2Steinke, Bruce A.
Benefit Level - 1
Approval of recommendation to the Board by: /s/ James C. Johnson Date: 12/08/2016
James C. Johnson, Chairman, For the Human Resources Committee
____________________1 Benefit Levels are defined as a payment amount equal to a cash severance multiple of base pay, target short-term incentive award, short-term incentive award in year of
termination (prorated at target), the actuarial equivalent of the benefit under the qualified defined benefit retirement plan and any excess or supplemental retirement plan .

Exhibit 10.24
FORMULA FOR DETERMINING 2017 TARGET PERFORMANCE SHARE UNITAWARDS TO BE ISSUED TO NAMED EXECUTIVE OFFICERS
The target number of performance share units to be issued to each Named Executive Officer listed below for 2017 will bedetermined in accordance with the following formula:
2017 Target NumberPSU Awards
=
Base Salary as of 1/1/17 x
Long‑Term IncentiveTarget listed below
Average closing price of Ameren Corporation Common Stock on The NewYork Stock Exchange for each trading day in December 2016
NAMED EXECUTIVE OFFICERLONG-TERM INCENTIVE
TARGET AS PERCENT OF BASE SALARYBaxter 360%Lyons 195%Nelson 160%Moehn 180%Mark 170%Diya 140%Birk 100%
Steinke 100%

Exhibit 10.31
Form of 2017 Performance Share Unit
Award Agreement
January 1, 2017
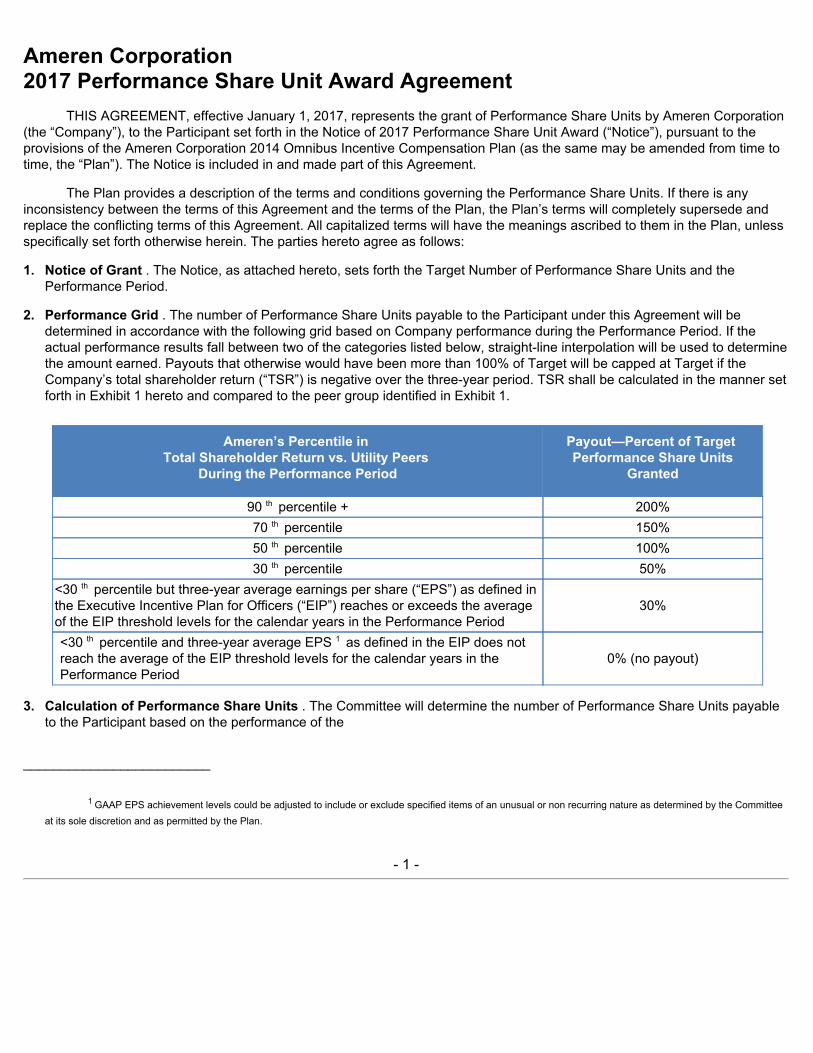
Ameren Corporation 2017 Performance Share Unit Award Agreement
THIS AGREEMENT, effective January 1, 2017, represents the grant of Performance Share Units by Ameren Corporation(the “Company”), to the Participant set forth in the Notice of 2017 Performance Share Unit Award (“Notice”), pursuant to theprovisions of the Ameren Corporation 2014 Omnibus Incentive Compensation Plan (as the same may be amended from time totime, the “Plan”). The Notice is included in and made part of this Agreement.
The Plan provides a description of the terms and conditions governing the Performance Share Units. If there is anyinconsistency between the terms of this Agreement and the terms of the Plan, the Plan’s terms will completely supersede andreplace the conflicting terms of this Agreement. All capitalized terms will have the meanings ascribed to them in the Plan, unlessspecifically set forth otherwise herein. The parties hereto agree as follows:
1. Notice of Grant . The Notice, as attached hereto, sets forth the Target Number of Performance Share Units and thePerformance Period.
2. Performance Grid . The number of Performance Share Units payable to the Participant under this Agreement will bedetermined in accordance with the following grid based on Company performance during the Performance Period. If theactual performance results fall between two of the categories listed below, straight-line interpolation will be used to determinethe amount earned. Payouts that otherwise would have been more than 100% of Target will be capped at Target if theCompany’s total shareholder return (“TSR”) is negative over the three-year period. TSR shall be calculated in the manner setforth in Exhibit 1 hereto and compared to the peer group identified in Exhibit 1.
Ameren’s Percentile in Total Shareholder Return vs. Utility Peers
During the Performance Period
Payout—Percent of Target Performance Share Units
Granted
90 th percentile + 200%70 th percentile 150%50 th percentile 100%30 th percentile 50%
<30 th percentile but three-year average earnings per share (“EPS”) as defined inthe Executive Incentive Plan for Officers (“EIP”) reaches or exceeds the averageof the EIP threshold levels for the calendar years in the Performance Period
30%
<30 th percentile and three-year average EPS 1 as defined in the EIP does notreach the average of the EIP threshold levels for the calendar years in thePerformance Period
0% (no payout)
3. Calculation of Performance Share Units . The Committee will determine the number of Performance Share Units payableto the Participant based on the performance of the
_________________________
1 GAAP EPS achievement levels could be adjusted to include or exclude specified items of an unusual or non recurring nature as determined by the Committeeat its sole discretion and as permitted by the Plan.
- 1 -

Company during the Performance Period, calculated using the performance grid set forth in Section 2 of thisAgreement. Subject to Sections 4 and 8, payment of any Performance Share Units determined pursuant to this Section isexpressly conditioned upon continued employment from the first day of the Performance Period through the payment date(as determined in Section 5) (the “Vesting Period”). The Participant expressly agrees that no Performance Share Units shallbe considered earned under applicable law until the last day of the Vesting Period. Notwithstanding anything in thisAgreement to the contrary, the value of vested Performance Share Units, if any, paid to the Participant under this Agreementshall in no event exceed 1.2% of the Company’s cumulative GAAP Net Income for the Performance Period, as determinedby the Committee in its sole discretion, subject to the maximum payout amount set forth in Section 4.03(e) of the Plan andthe Committee’s right to adjust payment downwards pursuant to Section 12.06 of the Plan.
4. Vesting of Performance Share Units . Subject to provisions set forth in Section 8 of this Agreement related to a Change ofControl (as defined in the Second Amended and Restated Ameren Corporation Change of Control Severance Plan, asamended (the “Change of Control Severance Plan”)) of the Company, Section 9 of this Agreement relating to termination forCause (as defined in the Change of Control Severance Plan), and Section 10 of this Agreement relating to Participant’sobligations, the Performance Share Units will vest as set forth below:
(a) Provided the Participant has continued employment through such date, one hundred percent (100%) of the calculatedPerformance Share Units will vest on the payment date; or
(b) Provided the Participant has continued employment through the date of his death and such death occurs prior to thepayment date, the Participant will be entitled to a prorated award based on the Target Number of Performance ShareUnits set forth in the Notice to this Agreement plus accrued dividends as of the date of his death, with such proratednumber based upon the total number of days the Participant worked during the Performance Period; or
(c) Provided the Participant has continued employment through the date of his Disability (as defined in Code Section 409A),and such Disability occurs prior to the payment date, one hundred percent (100%) of the Performance Share Units hewould have received had he remained employed by the Company through the payment date, based on the actualperformance of the Company during the entire Performance Period; or
(d) Provided the Participant has continued employment through the date of retirement (as described below) and suchretirement occurs before the payment date if the Participant retires at an age of 55 or greater with five (5) or more yearsof service (as defined in the Ameren Retirement Plan, as supplemented and amended from time to time), the Participantis entitled to receive a prorated portion of the Performance Share Units that would have been earned had the Participantremained employed by the Company for the entire Vesting Period, based on the actual performance of the Companyduring the entire Performance Period, with the prorated number based upon the total number of days the Participantworked during the Performance Period.
Notwithstanding anything in this Agreement to the contrary, no Performance Share Units will be paid to the Participant, norshall the Participant be entitled to payment, if the Participant’s employment with the Company terminates during the VestingPeriod for any reason other
- 2 -
than death, Disability, retirement as described above, or on or after a Change of Control in accordance with Section 8.
5. Form and Timing of Payment . All payments of vested Performance Share Units pursuant to this Agreement will be madein the form of Shares. Except as otherwise provided in this Agreement, payment will be made upon the earlier to occur of thefollowing:
(a) February of the calendar year immediately following the last day of the Performance Period or as soon as practicablethereafter (but in no event later than March 15 of the calendar year immediately following the last day of the PerformancePeriod);
(b) The Participant’s death or as soon as practicable thereafter (but in no event later than March 15 of the calendar yearfollowing the year in which the Participant’s death occurred).
Fractional Performance Share Units that constitute less than a single share may be rounded to the nearest full Share orconverted to cash, at the Company’s option.
6. Right as Shareholder . Except as specifically set forth in this Agreement, the Participant shall not have voting or any otherrights as a shareholder of the Company with respect to Performance Share Units. The Participant will obtain full voting andother rights as a shareholder of the Company upon the payment of the Performance Share Units in Shares as provided inSection 5 or 8 of this Agreement.
7. Dividends . The Participant shall be entitled to receive dividend equivalents, which represent the right to receive Sharesmeasured by the dividend payable with respect to the corresponding number of Performance Share Units. Dividendequivalents on Performance Share Units will accrue and be reinvested into additional Performance Share Units throughoutthe three-year Performance Period. The additional Shares will be paid as set forth in Section 5 or 8 of this Agreement.Participants will not be entitled to any dividend equivalent amount on Performance Share Units covered by this Agreementwhich are not ultimately earned.
8. Change of Control .
(a) Company No Longer Exists . Upon a Change of Control which occurs on or before the last day of the Performance Periodin which the Company ceases to exist or is no longer publicly traded on the New York Stock Exchange or the NASDAQStock Market, Sections 2, 3, 4 and 5 of this Agreement, unless otherwise provided, shall no longer apply and instead, theamount distributed under this Award shall be based on the Target Number of Performance Share Units awarded as setforth in the Notice to this Agreement plus any accrued dividends and interest as follows:
(i) The amount underlying this Award as of the date of the Change of Control shall equal the value of one Share basedon the closing price on the New York Stock Exchange on the last trading day prior to the date of the Change ofControl multiplied by the sum of the Target Number of Performance Share Units awarded as set forth in the Noticeto this Agreement plus the additional Performance Share Units attributable to accrued dividends as of the date ofthe Change of Control;
(ii) Interest on this Award shall accrue based on the prime rate (adjusted on the first day of each calendar quarter) aspublished in the “Money Rates” section in the
- 3 -
WallStreetJournalfrom the date of the Change of Control until this Award is distributed or forfeited;
(iii) If the Participant remains employed with the Company or its successor until the last day of the Vesting Period, thisAward, including interest, shall be paid to the Participant in an immediate lump sum in January of the calendar yearimmediately following the last day of the Performance Period, or as soon as practicable thereafter (but in no eventlater than March 15 of the calendar year immediately following the last day of the Performance Period);
(iv) If the Participant retired (as described in Section 4(d) of this Agreement) or terminated employment due to Disabilityprior to the Change of Control under Section 8(a) of this Agreement, the Participant shall immediately receivepayment under this Award upon such Change of Control;
(v) If the Participant remains employed with the Company or its successor until his death or Disability which occursafter the Change of Control and before the last day of the Vesting Period, the Participant (or his estate ordesignated beneficiary) shall immediately receive payment under this Award, including interest (if any), upon suchdeath or Disability;
(vi) If the Participant has a qualifying termination (as defined in Section 8(c) of this Agreement) before the last day of theVesting Period, the Participant shall immediately receive payment under this Award, including interest (if any), uponsuch termination; and
(vii) In the event the Participant terminates employment before the end of the Vesting Period for any reason other thanas described in Sections (iv), (v) or (vi) above, this Award, including interest (if any), the Participant shall not receivepayment of, nor shall be entitled to payment for, any Performance Share Units.
(b) Company Continues to Exist . If there is a Change of Control of the Company but the Company continues in existenceand remains a publicly traded company on the New York Stock Exchange or the NASDAQ Stock Market, thePerformance Share Units will pay out upon the earliest to occur of the following:
(i) As set forth in Section 5 of this Agreement in accordance with the vesting provisions of Sections 4(a), (b), (c) and(d) of this Agreement; or
(ii) If the Participant experiences a qualifying termination (as defined in Section 8(c) of this Agreement) during the two-year period following the Change of Control and the termination occurs during the Performance Period, onehundred percent (100%) of the Performance Share Units he would have received had he remained employed by theCompany for the entire Vesting Period based on the actual performance of the Company during the entirePerformance Period. Such Performance Share Units will vest on the last day of the Performance Period and thevested Performance Share Units will be paid in Shares in January of the calendar year immediately following thelast day of the Performance Period or as soon as practicable thereafter (but in no event later than March 15 of thecalendar year immediately following the last day of the Performance Period).
(c) Qualifying Termination . For purposes of Sections 8(a)(vi) and 8(b)(ii) of this Agreement, a qualifying termination means(i) an involuntary termination without Cause, (ii) for
- 4 -

Change of Control Severance Plan participants, a voluntary termination of employment for Good Reason (as defined inthe Change of Control Severance Plan) or (iii) an involuntary termination that qualifies for severance under the AmerenCorporation Severance Plan for Ameren Employees (as in effect immediately prior to the Change of Control).
(d) Termination in Anticipation of Change of Control . If a Participant qualifies for benefits as provided in the last sentence ofSection 4.1 of the Change of Control Severance Plan, or if a Participant is not a Participant in the Change of ControlSeverance Plan but is terminated within six (6) months prior to the Change of Control and qualifies for severance benefitsunder the Company’s general severance plan and the Participant’s termination of employment occurs before thecalculated Performance Share Units are paid, then the Participant shall receive (i) upon a Change of Control described inSection 8(a) of this Agreement, an immediate cash payout equal to the value of one Share based on the closing price onthe New York Stock Exchange on the last trading day prior to the date of the Change of Control multiplied by the sum ofthe Target Number of Performance Share Units awarded as set forth in the Notice to this Agreement plus the additionalPerformance Share Units attributable to accrued dividends or (ii) upon a Change of Control described in Section 8(b) ofthis Agreement, the payout provided for in Section 8(b) of this Agreement.
9. Termination for Cause. No distribution of any Shares will be made in the event of a termination of employment for Cause atany time prior to payout of the Shares.
10. Participant Obligations .
(a) Detrimental Conduct or Activity . If the Participant engages in conduct or activity that is detrimental to the Company,including but not limited to violating Sections 10(b) and 10(c) of this Agreement, after the Performance Share Units arepaid, or if the Company learns of the detrimental conduct or activity after the Performance Share Units are paid, and suchconduct occurred less than one year after the Participant’s employment with the Company ended, the following shallapply.
(1) If the Participant retired, the Participant shall not be entitled to receive payment of any Shares that would otherwise bepayable to the Participant with respect to the last award of Performance Share Units granted to the Participant beforehis termination of employment due to retirement.
(2) In all other cases, the Participant shall repay to the Company the equivalent of the value of Shares received as of thepayment date determined under Section 5 of this Agreement within thirty (30) days of receiving a demand from theCompany for the repayment of the award.
Finally, the Company shall be entitled to an award of attorneys’ fees incurred with securing any relief hereunder and/orpursuant to a breach or threatened breach of Sections 10(b) and 10(c).
(b) Confidentiality .Participants, by virtue of their position with the Company, have access to and/or receive trade secretsand other confidential and proprietary information about the Company’s business that is not generally available to thepublic and which has been developed or acquired by the Company at considerable effort and expense (hereinafter“Confidential Information”). Confidential Information includes, but is not limited to, information about the Company’sbusiness plans and strategy, environmental strategy,
- 5 -

legal strategy, legislative strategy, finances, marketing, management, operations, and/or personnel. The Participantagrees that, both during and after the Participant’s employment with the Company, the Participant:
(1) will only use Confidential Information in connection with the Participant’s duties and activities on behalf of or for thebenefit of the Company;
(2) will not use Confidential Information in any way that is detrimental to the Company;
(3) will hold the Confidential Information in strictest confidence and take reasonable efforts to protect such ConfidentialInformation from disclosure to any third party or person who is not authorized to receive, review or access theConfidential Information;
(4) will not use Confidential Information for the Participant’s own benefit or the benefit of others, without the prior writtenconsent of the Company; and
(5) will return all Confidential Information to the Company within two business days of the Participant’s termination ofemployment or immediately upon the Company’s demand to return the Confidential Information to the Company.
(c) Non-Solicitation . The Participant agrees that, for one year from the end of the Participant’s employment, the Participantwill not, directly or indirectly, on behalf of the Participant or any other person, company or entity:
(1) market, sell, solicit, or provide products or services competitive with or similar to products or services offered by theCompany to any person, company or entity that: (i) is a customer or potential customer of the Company during thetwelve (12) months prior to the Participant’s termination of employment and (ii) with which the Participant (A) haddirect contact with during the twelve (12) months prior to the Participant’s termination of employment or (B)possessed, utilized or developed Confidential Information about during the twelve (12) months prior to theParticipant’s termination of employment;
(2) raid, hire, solicit, encourage or attempt to persuade any employee or independent contractor of the Company, or anyperson who was an employee or independent contractor of the Company during the 24 months preceding theParticipant’s termination, to leave the employ of, terminate or reduce the person’s employment or businessrelationship with the Company; or
(3) interfere with the performance of any Company employee or independent contractor’s duties for the Company.
(d) Acknowledgments and Remedies . The Participant acknowledges and agrees that the Confidentiality and Non-Solicitationprovisions set forth above are necessary to protect the Company’s legitimate business interests, such as its ConfidentialInformation, goodwill and customer relationships. The Participant acknowledges and agrees that a breach by theParticipant of either the Confidentiality or Non-Solicitation provision will cause irreparable damage to the Company forwhich monetary damages alone will not constitute an adequate remedy. In the event of such breach or threatenedbreach, the Company shall be entitled as a matter of right (without being required to prove damages or furnish any bondor other security) to obtain a restraining order, an injunction, or other equitable or extraordinary relief that restrains anyfurther violation or threatened violation
- 6 -

of either the Confidentiality or Non-Solicitation provision, as well as an order requiring the Participant to comply with theConfidentiality and/or Non-Solicitation provisions. The Company’s right to a restraining order, an injunction, or otherequitable or extraordinary relief shall be in addition to all other rights and remedies to which the Company may be entitledto in law or in equity, including, without limitation, the right to recover monetary damages for the Participant’s violation orthreatened violation of the Confidentiality and/or Non-Solicitation provisions. Finally, the Company shall be entitled to anaward of attorneys’ fees incurred in connection with securing any relief hereunder and/or pursuant to a breach orthreatened breach of the Confidentiality and/or Non-Solicitation provisions.
11. Nontransferability . Performance Share Units awarded pursuant to this Agreement may not be sold, transferred, pledged,assigned or otherwise alienated or hypothecated (a “Transfer”) other than by will or by the laws of descent and distribution,except as provided in the Plan. If any Transfer, whether voluntary or involuntary, of Performance Share Units is made, or ifany attachment, execution, garnishment, or lien will be issued against or placed upon the Performance Share Units, theParticipant’s right to such Performance Share Units will be immediately forfeited to the Company, and this Agreement willlapse.
12. Requirements of Law . The granting of Performance Share Units under the Plan will be subject to all applicable laws, rules,and regulations, and to such approvals by any governmental agencies or national securities exchanges as may be required.
13. Tax Withholding . The Company will have the power and the right to deduct or withhold, or require the Participant or theParticipant’s beneficiary to remit to the Company, the minimum statutory amount to satisfy federal, state, and local taxes,domestic or foreign, required by law or regulation to be withheld with respect to any taxable event arising as a result of thisAgreement.
14. Stock Withholding . With respect to withholding required upon any taxable event arising as a result of Performance ShareUnits granted hereunder, the Company, unless notified by the Participant in writing within thirty (30) days prior to the taxableevent that the Participant will satisfy the entire minimum tax withholding requirement by means of personal check or othercash equivalent, will satisfy the tax withholding requirement by withholding Shares having a Fair Market Value equal to (i) thetotal minimum statutory amount required to be withheld on the transaction, or (ii) such other amount as may be withheldpursuant to the Plan and such withholding would not cause adverse accounting consequences or costs. The Participantagrees to pay to the Company, its Affiliates and/or its Subsidiaries any amount of tax that the Company, its Affiliates and/orits Subsidiaries may be required to withhold as a result of the Participant’s participation in the Plan that cannot be satisfied bythe means previously described.
15. Administration . This Agreement and the Participant’s rights hereunder are subject to all the terms and conditions of thePlan, as the same may be amended from time to time, as well as to such rules and regulations as the Committee may adoptfor administration of the Plan. It is expressly understood that the Committee is authorized to administer, construe, and makeall determinations necessary or appropriate to the administration of the Plan and this Agreement, all of which will be bindingupon the Participant.
16. Continuation of Employment . This Agreement will not confer upon the Participant any right to continuation of employmentby the Company, its Affiliates, and/or its Subsidiaries,
- 7 -

nor will this Agreement interfere in any way with the Company’s, its Affiliates’, and/or its Subsidiaries’ right to terminate theParticipant’s employment at any time.
17. Amendment to the Plan . The Plan is discretionary in nature and the Committee may terminate, amend, or modify the Plan;provided, however, that no such termination, amendment, or modification of the Plan may in any way adversely affect theParticipant’s rights under this Agreement, without the Participant’s written approval.
18. Amendment to this Agreement . The Company may amend this Agreement in any manner, provided that no suchamendment may adversely affect the Participant’s rights hereunder without the Participant’s written approval.
19. Successor. All obligations of the Company under the Plan and this Agreement, with respect to the Performance Share Units,will be binding on any successor to the Company, whether the existence of such successor is the result of a direct or indirectpurchase, merger, consolidation, or otherwise, of all or substantially all of the business and/or assets of the Company.
20. Severability . The provisions of this Agreement are severable and if any one or more provisions are determined to be illegalor otherwise unenforceable, in whole or in part, the remaining provisions will nevertheless be binding and enforceable.
21. Applicable Laws and Consent to Jurisdiction. The validity, construction, interpretation and enforceability of thisAgreement will be determined and governed by the laws of the State of Missouri without giving effect to the principles ofconflicts of law. For the purpose of litigating any dispute that arises under this Agreement, the parties hereby consent toexclusive jurisdiction and agree that such litigation will be conducted in the federal or state courts of the State of Missouri.
22. Section 409A of the Code. This Agreement shall be interpreted in a manner that satisfies the requirements of Code Section409A. The Committee may make changes in the terms or operation of the Plan and/or this Agreement (including changesthat may have retroactive effect) deemed necessary or desirable to comply with Code Section 409A. The Company makesno representation or covenants that this Award will comply with Section 409A of the Code.
- 8 -
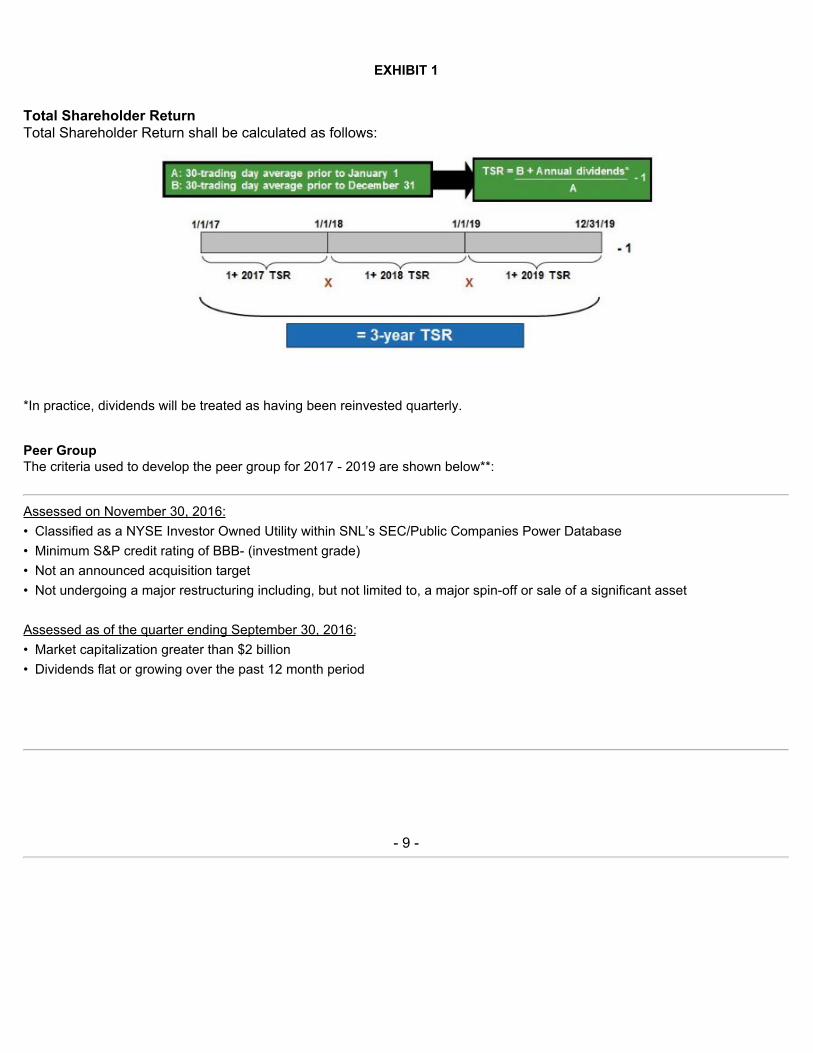
EXHIBIT 1
Total Shareholder Return Total Shareholder Return shall be calculated as follows:
A: 30-trading day average prior to January 1
*In practice, dividends will be treated as having been reinvested quarterly.
Peer GroupThe criteria used to develop the peer group for 2017 - 2019 are shown below**:
Assessed on November 30, 2016:• Classified as a NYSE Investor Owned Utility within SNL’s SEC/Public Companies Power Database• Minimum S&P credit rating of BBB- (investment grade)• Not an announced acquisition target• Not undergoing a major restructuring including, but not limited to, a major spin-off or sale of a significant asset
Assessed as of the quarter ending September 30, 2016:• Market capitalization greater than $2 billion• Dividends flat or growing over the past 12 month period
- 9 -
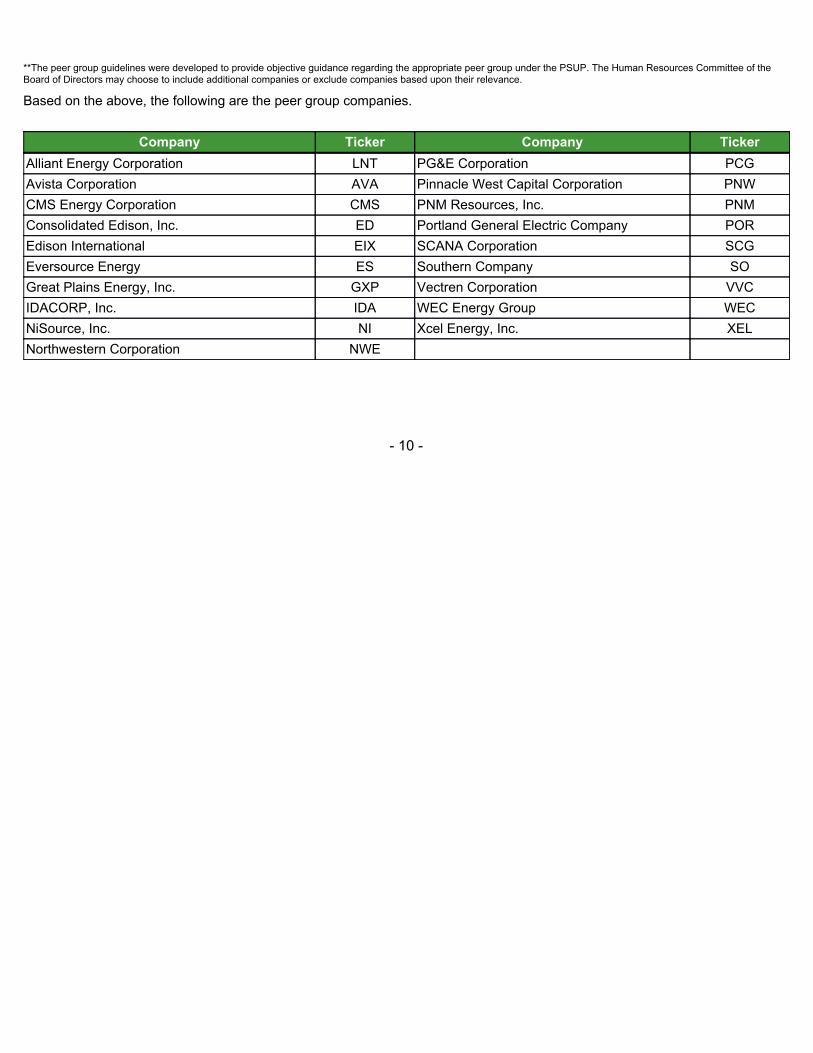
**The peer group guidelines were developed to provide objective guidance regarding the appropriate peer group under the PSUP. The Human Resources Committee of theBoard of Directors may choose to include additional companies or exclude companies based upon their relevance.
Based on the above, the following are the peer group companies.
Company Ticker Company TickerAlliant Energy Corporation LNT PG&E Corporation PCGAvista Corporation AVA Pinnacle West Capital Corporation PNWCMS Energy Corporation CMS PNM Resources, Inc. PNMConsolidated Edison, Inc. ED Portland General Electric Company POREdison International EIX SCANA Corporation SCGEversource Energy ES Southern Company SOGreat Plains Energy, Inc. GXP Vectren Corporation VVCIDACORP, Inc. IDA WEC Energy Group WECNiSource, Inc. NI Xcel Energy, Inc. XELNorthwestern Corporation NWE
- 10 -

EXHIBIT 12.1Ameren Corporation
Computation of Ratio of Earnings to Fixed Charges(Thousands of Dollars, Except Ratios)
Year Ended December 31, 2012 2013 2014 2015 (a) 2016 Earnings available for fixed charges, as defined:
Net income from continuing operationsattributable to Ameren Corporation $ 515,491 $ 512,055 $ 587,313 $ 578,866 $ 652,614 (Income) Loss from equity investee — (57) (498) (484) 4,177 Distributed income from equity investee — — 1,020 — — Tax expense based on income 307,319 311,288 376,448 362,947 382,250 Fixed charges excluding capitalized interest andsubsidiary preferred stock dividends taxadjustment (b)(c) 478,998 455,574 385,326 387,286 413,393 Amortization of capitalized interest (c) 3,435 1,477 — — —
Earnings available for fixed charges, as defined $ 1,305,243 $ 1,280,337 $ 1,349,609 $ 1,328,615 $ 1,452,434
Fixed charges, as defined: Interest expense on short-term and long-term debt (b) $ 440,590 $ 415,465 $ 348,470 $ 350,299 $ 375,110 Capitalized interest (c)(d) 13,069 17,076 — — — Estimated interest cost within rental expense 8,039 8,189 9,079 8,748 9,513 Amortization of net debt premium, discount,and expenses 23,926 25,477 21,334 21,796 22,327 Subsidiary preferred stock dividends 6,443 6,443 6,443 6,443 6,443 Adjust preferred stock dividends to pretaxbasis 4,529 4,116 4,102 3,783 3,928
Total fixed charges, as defined $ 496,596 $ 476,766 $ 389,428 $ 391,069 $ 417,321
Consolidated ratio of earnings to fixed charges 2.63 2.69 3.47 3.40 3.48
(a) Includes a $69 million provision for the Callaway construction and operating license. See Note 2 - Rate and Regulatory Matters under Part II, Item 8, of this Form 10-K for additionalinformation.
(b) Includes net interest related to uncertain tax positions.(c) All capitalized interest is associated with discontinued operations.(d) Excludes allowance for funds used during construction.

Exhibit 12.2Union Electric Company
Computation of Ratio of Earnings to Fixed Charges and CombinedFixed Charges and Preferred Stock Dividend Requirements
(Thousands of Dollars, Except Ratios)
2012 2013 2014 2015 (a) 2016Earnings available for fixed charges, as defined:
Net income $ 419,950 $ 398,523 $ 393,676 $ 355,736 $ 360,210Tax expense based on income 251,736 241,657 228,480 208,740 216,121Fixed charges (b) 241,529 229,720 232,293 235,285 227,844
Earnings available for fixed charges, as defined $ 913,215 $ 869,900 $ 854,449 $ 799,761 $ 804,175
Fixed charges, as defined: Interest expense on short-term and long-term debt (b) $ 231,679 $ 218,725 $ 220,648 $ 224,418 $ 217,069Estimated interest cost within rental expense 3,445 3,534 4,806 4,500 4,680Amortization of net debt premium, discount, and expenses 6,405 7,461 6,839 6,367 6,095
Total fixed charges, as defined $ 241,529 $ 229,720 $ 232,293 $ 235,285 $ 227,844
Ratio of earnings to fixed charges 3.78 3.79 3.68 3.40 3.53
Earnings required for combined fixed charges and preferred stock dividends: Preferred stock dividends $ 3,420 $ 3,420 $ 3,420 $ 3,420 $ 3,420Adjustment to pretax basis 2,050 2,074 1,985 2,007 2,052
$ 5,470 $ 5,494 $ 5,405 $ 5,427 $ 5,472
Combined fixed charges and preferred stock dividend requirements $ 246,999 $ 235,214 $ 237,698 $ 240,712 $ 233,316Ratio of earnings to combined fixed charges and preferred stock dividendrequirements 3.70 3.70 3.59 3.32 3.45
(a) Includes a $69 million provision for the Callaway construction and operating license. See Note 2 - Rate and Regulatory Matters under Part II, Item 8, of
this Form 10-K for additional information.(b) Includes net interest related to uncertain tax positions.

Exhibit 12.3Ameren Illinois Company
Computation of Ratio of Earnings to Fixed Charges and CombinedFixed Charges and Preferred Stock Dividend Requirements
(Thousands of Dollars, Except Ratios)
2012 2013 2014 2015 2016Earnings available for fixed charges, as defined:
Net income from continuing operations $ 143,626 $ 163,011 $ 203,752 $ 216,917 $ 255,181Tax expense based on income 94,166 110,115 142,701 127,403 158,322Fixed charges (a) 134,191 135,424 128,315 140,047 147,884
Earnings available for fixed charges, as defined $ 371,983 $ 408,550 $ 474,768 $ 484,367 $ 561,387
Fixed charges, as defined: Interest expense on short-term and long-term debt (a) $ 119,248 $ 117,327 $ 111,205 $ 121,591 $ 128,885Estimated interest cost within rental expense 3,577 3,731 4,237 4,224 4,833Amortization of net debt premium, discount, and expenses 11,366 14,366 12,873 14,232 14,166
Total fixed charges, as defined $ 134,191 $ 135,424 $ 128,315 $ 140,047 $ 147,884
Ratio of earnings to fixed charges 2.77 3.02 3.70 3.46 3.80
Earnings required for combined fixed charges and preferred stock dividends: Preferred stock dividends $ 3,023 $ 3,023 $ 3,023 $ 3,023 $ 3,023Adjustment to pretax basis 1,982 2,042 2,117 1,776 1,876
$ 5,005 $ 5,065 $ 5,140 $ 4,799 $ 4,899
Combined fixed charges and preferred stock dividend requirements $ 139,196 $ 140,489 $ 133,455 $ 144,846 $ 152,783Ratio of earnings to combined fixed charges and preferred stock dividendrequirements 2.67 2.91 3.56 3.34 3.67
(a) Includes net interest related to uncertain tax positions.
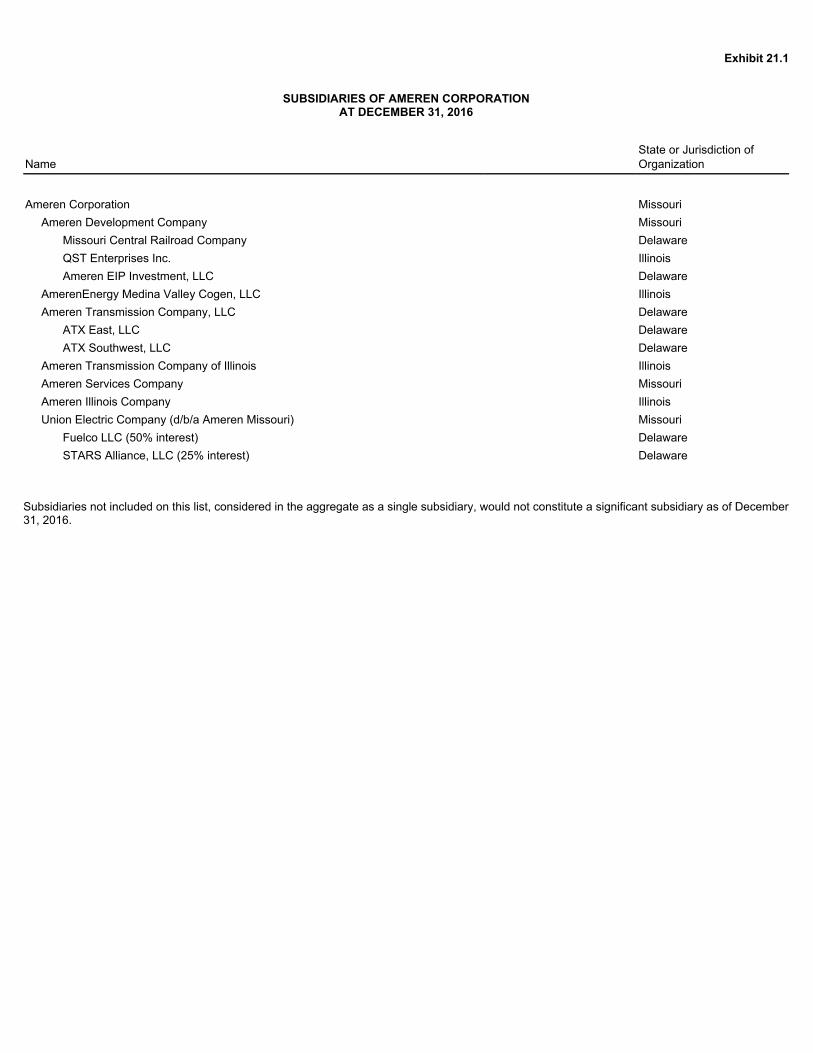
Exhibit 21.1
SUBSIDIARIES OF AMEREN CORPORATIONAT DECEMBER 31, 2016
Name State or Jurisdiction ofOrganization
Ameren Corporation MissouriAmeren Development Company Missouri
Missouri Central Railroad Company DelawareQST Enterprises Inc. IllinoisAmeren EIP Investment, LLC Delaware
AmerenEnergy Medina Valley Cogen, LLC IllinoisAmeren Transmission Company, LLC Delaware
ATX East, LLC DelawareATX Southwest, LLC Delaware
Ameren Transmission Company of Illinois IllinoisAmeren Services Company MissouriAmeren Illinois Company IllinoisUnion Electric Company (d/b/a Ameren Missouri) Missouri
Fuelco LLC (50% interest) DelawareSTARS Alliance, LLC (25% interest) Delaware
Subsidiaries not included on this list, considered in the aggregate as a single subsidiary, would not constitute a significant subsidiary as of December31, 2016.

Exhibit 23.1
CONSENT OF INDEPENDENT REGISTERED PUBLIC ACCOUNTING FIRM
We hereby consent to the incorporation by reference in the Registration Statements on Form S-3 (Nos. 333-196298 and 333-205139) and the RegistrationStatements on Form S-8 (Nos. 333-50793, 333-133998, 333-157655, 333-191786 and 333-196515) of Ameren Corporation of our report dated February 28, 2017relating to the financial statements, financial statement schedules, and the effectiveness of internal control over financial reporting, which appears in this Form10‑K.
/s/ PricewaterhouseCoopers LLPPricewaterhouseCoopers LLPSt. Louis, MissouriFebruary 28, 2017

Exhibit 23.2
CONSENT OF INDEPENDENT REGISTERED PUBLIC ACCOUNTING FIRM
We hereby consent to the incorporation by reference in the Registration Statement on Form S-3 (No. 333-205139-01) of Union Electric Company of our reportdated February 28, 2017 relating to the financial statements and financial statement schedule, which appears in this Form 10-K.
/s/ PricewaterhouseCoopers LLPPricewaterhouseCoopers LLPSt. Louis, MissouriFebruary 28, 2017

Exhibit 23.3
CONSENT OF INDEPENDENT REGISTERED PUBLIC ACCOUNTING FIRM
We hereby consent to the incorporation by reference in the Registration Statement on Form S-3 (No. 333-205139-02) of Ameren Illinois Company of our reportdated February 28, 2017 relating to the financial statements and financial statement schedule, which appears in this Form 10-K.
/s/ PricewaterhouseCoopers LLPPricewaterhouseCoopers LLPSt. Louis, MissouriFebruary 28, 2017
Exhibit 24.1POWER OF ATTORNEY
WHEREAS, AMEREN CORPORATION, a Missouri corporation (herein referred to as the "Company"), is required to file with the Securities and ExchangeCommission, under the provisions of the Securities Exchange Act of 1934, as amended, its annual report on Form 10-K for the year ended December 31, 2016; and
WHEREAS, each of the individuals identified below is a director of the Company.
NOW, THEREFORE, each of the undersigned hereby constitutes and appoints Warner L. Baxter and/or Martin J. Lyons, Jr. and/or Gregory L. Nelson the true andlawful attorneys-in-fact of the undersigned, for and in the name, place and stead of the undersigned, to affix the name of the undersigned to said Form 10-K and any amendmentsthereto, and, for the performance of the same acts, each with power to appoint in their place and stead and as their substitute, one or more attorneys-in-fact for the undersigned,with full power of revocation; hereby ratifying and confirming all that said attorneys-in-fact may do by virtue hereof.
IN WITNESS WHEREOF, the undersigned have hereunto set their hands this 28th day of February, 2017:
Catherine S. Brune, Director /s/ Catherine S. Brune J. Edward Coleman, Director /s/ J. Edward Coleman Ellen M. Fitzsimmons, Director /s/ Ellen M. Fitzsimmons Rafael Flores, Director /s/ Rafael Flores Walter J. Galvin, Director /s/ Walter J. Galvin Richard J. Harshman, Director /s/ Richard J. Harshman Gayle P. W. Jackson, Director /s/ Gayle P. W. Jackson James C. Johnson, Director /s/ James C. Johnson Steven H. Lipstein, Director /s/ Steven H. Lipstein Stephen R. Wilson, Director /s/ Stephen R. Wilson
Exhibit 24.2POWER OF ATTORNEY
WHEREAS, UNION ELECTRIC COMPANY, a Missouri corporation (herein referred to as the "Company"), is required to file with the Securities andExchange Commission, under the provisions of the Securities Exchange Act of 1934, as amended, its annual report on Form 10-K for the year ended December 31,2016; and
WHEREAS, each of the individuals identified below is a director of the Company.
NOW, THEREFORE, each of the undersigned hereby constitutes and appoints Michael L. Moehn and/or Marty J. Lyons, Jr. and/or Gregory L. Nelson thetrue and lawful attorneys-in-fact of the undersigned, for and in the name, place and stead of the undersigned, to affix the name of the undersigned to said Form 10-K and any amendments thereto, and, for the performance of the same acts, each with power to appoint in their place and stead and as their substitute, one or moreattorneys-in-fact for the undersigned, with full power of revocation; hereby ratifying and confirming all that said attorneys-in-fact may do by virtue hereof.
IN WITNESS WHEREOF, the undersigned have hereunto set their hands this 28th day of February, 2017:
Mark C. Birk, Director /s/ Mark C. Birk
Fadi M. Diya, Director /s/ Fadi M. Diya
Gregory L. Nelson, Director /s/ Gregory L. Nelson
David N. Wakeman, Director /s/ David N. Wakeman
Exhibit 24.3POWER OF ATTORNEY
WHEREAS, AMEREN ILLINOIS COMPANY, an Illinois corporation (herein referred to as the "Company"), is required to file with the Securities andExchange Commission, under the provisions of the Securities Exchange Act of 1934, as amended, its annual report on Form 10-K for the year ended December 31,2016; and
WHEREAS, each of the individuals identified below is a director of the Company.
NOW, THEREFORE, each of the undersigned hereby constitutes and appoints Richard J. Mark and/or Marty J. Lyons, Jr. and/or Gregory L. Nelson thetrue and lawful attorneys-in-fact of the undersigned, for and in the name, place and stead of the undersigned, to affix the name of the undersigned to said Form 10-K and any amendments thereto, and, for the performance of the same acts, each with power to appoint in their place and stead and as their substitute, one or moreattorneys-in-fact for the undersigned, with full power of revocation; hereby ratifying and confirming all that said attorneys-in-fact may do by virtue hereof.
IN WITNESS WHEREOF, the undersigned have hereunto set their hands this 28th day of February, 2017:
Craig D. Nelson, Director /s/ Craig D. Nelson
Gregory L. Nelson, Director /s/ Gregory L. Nelson
David N. Wakeman, Director /s/ David N. Wakeman
Exhibit 31.1RULE 13a-14(a)/15d-14(a) CERTIFICATION
OF PRINCIPAL EXECUTIVE OFFICER OF AMEREN CORPORATION(required by Section 302 of the Sarbanes-Oxley Act of 2002)
I, Warner L. Baxter, certify that:
1. I have reviewed this report on Form 10-K for the fiscal year ended December 31, 2016, of Ameren Corporation; 2. Based on my knowledge, this report does not contain any untrue statement of a material fact or omit to state a material fact necessary to
make the statements made, in light of the circumstances under which such statements were made, not misleading with respect to the period coveredby this report;
3. Based on my knowledge, the financial statements, and other financial information included in this report, fairly present in all material respectsthe financial condition, results of operations and cash flows of the registrant as of, and for, the periods presented in this report;
4. The registrant’s other certifying officer and I are responsible for establishing and maintaining disclosure controls and procedures (as defined inExchange Act Rules 13a-15(e) and 15d-15(e)) and internal control over financial reporting (as defined in Exchange Act Rules 13a-15(f) and 15d-15(f)) for the registrant and have:
a) Designed such disclosure controls and procedures, or caused such disclosure controls and procedures to be designedunder our supervision, to ensure that material information relating to the registrant, including its consolidated subsidiaries, is made known tous by others within those entities, particularly during the period in which this report is being prepared;
b) Designed such internal control over financial reporting, or caused such internal control over financial reporting to bedesigned under our supervision, to provide reasonable assurance regarding the reliabilityof financial reporting and the preparation of financial statements for external purposes in accordance with generally accepted accountingprinciples;
c) Evaluated the effectiveness of the registrant’s disclosure controls and procedures and presented in this report ourconclusions about the effectiveness of the disclosure controls and procedures, as of the end of the period covered by this report based onsuch evaluation; and
d) Disclosed in this report any change in the registrant’s internal control over financial reporting that occurred during theregistrant’s most recent fiscal quarter (the registrant’s fourth fiscal quarter in the case of an annual report) that has materially affected, or isreasonably likely to materially affect, the registrant’s internal control over financial reporting; and
5. The registrant’s other certifying officer and I have disclosed, based on our most recent evaluation of internal control over financial reporting, tothe registrant’s auditors and the audit committee of the registrant’s board of directors (or persons performing the equivalent functions):
a) All significant deficiencies and material weaknesses in the design or operation of internal control over financial reportingwhich are reasonably likely to adversely affect the registrant’s ability to record, process, summarize and report financial information; and
b) Any fraud, whether or not material, that involves management or other employees who have a significant role in theregistrant’s internal control over financial reporting.
Date: February 28, 2017
/s/ Warner L. BaxterWarner L. BaxterChairman, President and Chief Executive Officer(Principal Executive Officer)

Exhibit 31.2
RULE 13a-14(a)/15d-14(a) CERTIFICATIONOF PRINCIPAL FINANCIAL OFFICER OF AMEREN CORPORATION
(required by Section 302 of the Sarbanes-Oxley Act of 2002)
I, Martin J. Lyons, Jr., certify that:1. I have reviewed this report on Form 10-K for the fiscal year ended December 31, 2016, of Ameren Corporation;2. Based on my knowledge, this report does not contain any untrue statement of a material fact or omit to state a material fact necessary to
make the statements made, in light of the circumstances under which such statements were made, not misleading with respect to the period coveredby this report;
3. Based on my knowledge, the financial statements, and other financial information included in this report, fairly present in all materialrespects the financial condition, results of operations and cash flows of the registrant as of, and for, the periods presented in this report;
4. The registrant’s other certifying officer and I are responsible for establishing and maintaining disclosure controls and procedures (as definedin Exchange Act Rules 13a-15(e) and 15d-15(e)) and internal control over financial reporting (as defined in Exchange Act Rules 13a-15(f) and 15d-15(f)) for the registrant and have:
a) Designed such disclosure controls and procedures, or caused such disclosure controls and procedures to be designed under oursupervision, to ensure that material information relating to the registrant, including its consolidated subsidiaries, is made known to us byothers within those entities, particularly during the period in which this report is being prepared;
b) Designed such internal control over financial reporting, or caused such internal control over financial reporting to be designedunder our supervision, to provide reasonable assurance regarding the reliability of financial reporting and the preparation of financialstatements for external purposes in accordance with generally accepted accounting principles;
c) Evaluated the effectiveness of the registrant’s disclosure controls and procedures and presented in this report our conclusionsabout the effectiveness of the disclosure controls and procedures, as of the end of the period covered by this report based on suchevaluation; and
d) Disclosed in this report any change in the registrant’s internal control over financial reporting that occurred during the registrant’smost recent fiscal quarter (the registrant’s fourth fiscal quarter in the case of an annual report) that has materially affected, or is reasonablylikely to materially affect, the registrant’s internal control over financial reporting; and
5. The registrant’s other certifying officer and I have disclosed, based on our most recent evaluation of internal control over financial reporting,to the registrant’s auditors and the audit committee of the registrant’s board of directors (or persons performing the equivalent functions):
a) All significant deficiencies and material weaknesses in the design or operation of internal control over financial reporting whichare reasonably likely to adversely affect the registrant’s ability to record, process, summarize and report financial information; and
b) Any fraud, whether or not material, that involves management or other employees who have a significant role in the registrant’sinternal control over financial reporting.
Date: February 28, 2017
/s/ Martin J. Lyons, Jr.Martin J. Lyons, Jr.Executive Vice President and Chief Financial Officer(Principal Financial Officer)

Exhibit 31.3
RULE 13a-14(a)/15d-14(a) CERTIFICATIONOF PRINCIPAL EXECUTIVE OFFICER OF UNION ELECTRIC COMPANY
(required by Section 302 of the Sarbanes-Oxley Act of 2002)
I, Michael L. Moehn, certify that:1. I have reviewed this report on Form 10-K for the fiscal year ended December 31, 2016, of Union Electric Company;2. Based on my knowledge, this report does not contain any untrue statement of a material fact or omit to state a material fact necessary to
make the statements made, in light of the circumstances under which such statements were made, not misleading with respect to the period coveredby this report;
3. Based on my knowledge, the financial statements, and other financial information included in this report, fairly present in all materialrespects the financial condition, results of operations and cash flows of the registrant as of, and for, the periods presented in this report;
4. The registrant’s other certifying officer and I are responsible for establishing and maintaining disclosure controls and procedures (as definedin Exchange Act Rules 13a-15(e) and 15d-15(e)) and internal control over financial reporting (as defined in Exchange Act Rules 13a-15(f) and 15d-15(f)) for the registrant and have:
a) Designed such disclosure controls and procedures, or caused such disclosure controls and procedures to be designed under oursupervision, to ensure that material information relating to the registrant, including its consolidated subsidiaries, is made known to us byothers within those entities, particularly during the period in which this report is being prepared;
b) Designed such internal control over financial reporting, or caused such internal control over financial reporting to be designedunder our supervision, to provide reasonable assurance regarding the reliability of financial reporting and the preparation of financialstatements for external purposes in accordance with generally accepted accounting principles;
c) Evaluated the effectiveness of the registrant’s disclosure controls and procedures and presented in this report our conclusionsabout the effectiveness of the disclosure controls and procedures, as of the end of the period covered by this report based on suchevaluation; and
d) Disclosed in this report any change in the registrant’s internal control over financial reporting that occurred during the registrant’smost recent fiscal quarter (the registrant’s fourth fiscal quarter in the case of an annual report) that has materially affected, or is reasonablylikely to materially affect, the registrant’s internal control over financial reporting; and
5. The registrant’s other certifying officer and I have disclosed, based on our most recent evaluation of internal control over financial reporting,to the registrant’s auditors and the audit committee of the registrant’s board of directors (or persons performing the equivalent functions):
a) All significant deficiencies and material weaknesses in the design or operation of internal control over financial reporting whichare reasonably likely to adversely affect the registrant’s ability to record, process, summarize and report financial information; and
b) Any fraud, whether or not material, that involves management or other employees who have a significant role in the registrant’sinternal control over financial reporting.
Date: February 28, 2017
/s/ Michael L. MoehnMichael L. MoehnChairman and President(Principal Executive Officer)

Exhibit 31.4
RULE 13a-14(a)/15d-14(a) CERTIFICATIONOF PRINCIPAL FINANCIAL OFFICER OF UNION ELECTRIC COMPANY
(required by Section 302 of the Sarbanes-Oxley Act of 2002)
I, Martin J. Lyons, Jr., certify that:1. I have reviewed this report on Form 10-K for the fiscal year ended December 31, 2016, of Union Electric Company;2. Based on my knowledge, this report does not contain any untrue statement of a material fact or omit to state a material fact necessary to
make the statements made, in light of the circumstances under which such statements were made, not misleading with respect to the period coveredby this report;
3. Based on my knowledge, the financial statements, and other financial information included in this report, fairly present in all materialrespects the financial condition, results of operations and cash flows of the registrant as of, and for, the periods presented in this report;
4. The registrant’s other certifying officer and I are responsible for establishing and maintaining disclosure controls and procedures (as definedin Exchange Act Rules 13a-15(e) and 15d-15(e)) and internal control over financial reporting (as defined in Exchange Act Rules 13a-15(f) and 15d-15(f)) for the registrant and have:
a) Designed such disclosure controls and procedures, or caused such disclosure controls and procedures to be designed under oursupervision, to ensure that material information relating to the registrant, including its consolidated subsidiaries, is made known to us byothers within those entities, particularly during the period in which this report is being prepared;
b) Designed such internal control over financial reporting, or caused such internal control over financial reporting to be designedunder our supervision, to provide reasonable assurance regarding the reliability of financial reporting and the preparation of financialstatements for external purposes in accordance with generally accepted accounting principles;
c) Evaluated the effectiveness of the registrant’s disclosure controls and procedures and presented in this report our conclusionsabout the effectiveness of the disclosure controls and procedures, as of the end of the period covered by this report based on suchevaluation; and
d) Disclosed in this report any change in the registrant’s internal control over financial reporting that occurred during the registrant’smost recent fiscal quarter (the registrant’s fourth fiscal quarter in the case of an annual report) that has materially affected, or is reasonablylikely to materially affect, the registrant’s internal control over financial reporting; and
5. The registrant’s other certifying officer and I have disclosed, based on our most recent evaluation of internal control over financial reporting,to the registrant’s auditors and the audit committee of the registrant’s board of directors (or persons performing the equivalent functions):
a) All significant deficiencies and material weaknesses in the design or operation of internal control over financial reporting whichare reasonably likely to adversely affect the registrant’s ability to record, process, summarize and report financial information; and
b) Any fraud, whether or not material, that involves management or other employees who have a significant role in the registrant’sinternal control over financial reporting.
Date: February 28, 2017
/s/ Martin J. Lyons, Jr.Martin J. Lyons, Jr.Executive Vice President and Chief Financial Officer(Principal Financial Officer)
Exhibit 31.5
RULE 13a-14(a)/15d-14(a) CERTIFICATIONOF PRINCIPAL EXECUTIVE OFFICER OF AMEREN ILLINOIS COMPANY
(required by Section 302 of the Sarbanes-Oxley Act of 2002)I, Richard J. Mark, certify that:1. I have reviewed this report on Form 10-K for the fiscal year ended December 31, 2016, of Ameren Illinois Company;2. Based on my knowledge, this report does not contain any untrue statement of a material fact or omit to state a material fact necessary to
make the statements made, in light of the circumstances under which such statements were made, not misleading with respect to the period coveredby this report;
3. Based on my knowledge, the financial statements, and other financial information included in this report, fairly present in all materialrespects the financial condition, results of operations and cash flows of the registrant as of, and for, the periods presented in this report;
4. The registrant’s other certifying officer and I are responsible for establishing and maintaining disclosure controls and procedures (as definedin Exchange Act Rules 13a-15(e) and 15d-15(e)) and internal control over financial reporting (as defined in Exchange Act Rules 13a-15(f) and 15d-15(f)) for the registrant and have:
a) Designed such disclosure controls and procedures, or caused such disclosure controls and procedures to be designed under oursupervision, to ensure that material information relating to the registrant, including its consolidated subsidiaries, is made known to us byothers within those entities, particularly during the period in which this report is being prepared;
b) Designed such internal control over financial reporting, or caused such internal control over financial reporting to be designedunder our supervision, to provide reasonable assurance regarding the reliability of financial reporting and the preparation of financialstatements for external purposes in accordance with generally accepted accounting principles;
c) Evaluated the effectiveness of the registrant’s disclosure controls and procedures and presented in this report our conclusionsabout the effectiveness of the disclosure controls and procedures, as of the end of the period covered by this report based on suchevaluation; and
d) Disclosed in this report any change in the registrant’s internal control over financial reporting that occurred during the registrant’smost recent fiscal quarter (the registrant’s fourth fiscal quarter in the case of an annual report) that has materially affected, or is reasonablylikely to materially affect, the registrant’s internal control over financial reporting; and
5. The registrant’s other certifying officer and I have disclosed, based on our most recent evaluation of internal control over financial reporting,to the registrant’s auditors and the audit committee of the registrant’s board of directors (or persons performing the equivalent functions):
a) All significant deficiencies and material weaknesses in the design or operation of internal control over financial reporting whichare reasonably likely to adversely affect the registrant’s ability to record, process, summarize and report financial information; and
b) Any fraud, whether or not material, that involves management or other employees who have a significant role in the registrant’sinternal control over financial reporting.
Date: February 28, 2017
/s/ Richard J. MarkRichard J. MarkChairman and President(Principal Executive Officer)

Exhibit 31.6
RULE 13a-14(a)/15d-14(a) CERTIFICATIONOF PRINCIPAL FINANCIAL OFFICER OF AMEREN ILLINOIS COMPANY
(required by Section 302 of the Sarbanes-Oxley Act of 2002)
I, Martin J. Lyons, Jr., certify that:1. I have reviewed this report on Form 10-K for the fiscal year ended December 31, 2016, of Ameren Illinois Company;2. Based on my knowledge, this report does not contain any untrue statement of a material fact or omit to state a material fact necessary to
make the statements made, in light of the circumstances under which such statements were made, not misleading with respect to the period coveredby this report;
3. Based on my knowledge, the financial statements, and other financial information included in this report, fairly present in all materialrespects the financial condition, results of operations and cash flows of the registrant as of, and for, the periods presented in this report;
4. The registrant’s other certifying officer and I are responsible for establishing and maintaining disclosure controls and procedures (as definedin Exchange Act Rules 13a-15(e) and 15d-15(e)) and internal control over financial reporting (as defined in Exchange Act Rules 13a-15(f) and 15d-15(f)) for the registrant and have:
a) Designed such disclosure controls and procedures, or caused such disclosure controls and procedures to be designed under oursupervision, to ensure that material information relating to the registrant, including its consolidated subsidiaries, is made known to us byothers within those entities, particularly during the period in which this report is being prepared;
b) Designed such internal control over financial reporting, or caused such internal control over financial reporting to be designedunder our supervision, to provide reasonable assurance regarding the reliability of financial reporting and the preparation of financialstatements for external purposes in accordance with generally accepted accounting principles;
c) Evaluated the effectiveness of the registrant’s disclosure controls and procedures and presented in this report our conclusionsabout the effectiveness of the disclosure controls and procedures, as of the end of the period covered by this report based on suchevaluation; and
d) Disclosed in this report any change in the registrant’s internal control over financial reporting that occurred during the registrant’smost recent fiscal quarter (the registrant’s fourth fiscal quarter in the case of an annual report) that has materially affected, or is reasonablylikely to materially affect, the registrant’s internal control over financial reporting; and
5. The registrant’s other certifying officer and I have disclosed, based on our most recent evaluation of internal control over financial reporting,to the registrant’s auditors and the audit committee of the registrant’s board of directors (or persons performing the equivalent functions):
a) All significant deficiencies and material weaknesses in the design or operation of internal control over financial reporting whichare reasonably likely to adversely affect the registrant’s ability to record, process, summarize and report financial information; and
b) Any fraud, whether or not material, that involves management or other employees who have a significant role in the registrant’sinternal control over financial reporting.
Date: February 28, 2017
/s/ Martin J. Lyons, Jr.Martin J. Lyons, Jr.Executive Vice President and Chief Financial Officer(Principal Financial Officer)
Exhibit 32.1
SECTION 1350 CERTIFICATION OFAMEREN CORPORATION
(required by Section 906 of theSarbanes-Oxley Act of 2002)
In connection with the report on Form 10-K for the fiscal year ended December 31, 2016, of Ameren Corporation (the “Registrant”) as filed bythe Registrant with the Securities and Exchange Commission on the date hereof (the “Form 10-K”), each undersigned officer of the Registrant doeshereby certify, pursuant to 18 U.S.C. §1350, as adopted pursuant to §906 of the Sarbanes-Oxley Act of 2002, that:
(1) The Form 10-K fully complies with the requirements of Section 13(a) or 15(d) of the Securities Exchange Act of 1934 (15 U.S.C. 78m or78o(d)); and
(2) The information contained in the Form 10-K fairly presents, in all material respects, the financial condition and results of operations of theRegistrant.
Date: February 28, 2017
/s/ Warner L. BaxterWarner L. BaxterChairman, President and Chief Executive Officer(Principal Executive Officer) /s/ Martin J. Lyons, Jr.Martin J. Lyons, Jr.Executive Vice President and Chief Financial Officer(Principal Financial Officer)

Exhibit 32.2
SECTION 1350 CERTIFICATION OFUNION ELECTRIC COMPANY(required by Section 906 of theSarbanes-Oxley Act of 2002)
In connection with the report on Form 10-K for the fiscal year ended December 31, 2016, of Union Electric Company (the “Registrant”) as filedby the Registrant with the Securities and Exchange Commission on the date hereof (the “Form 10-K”), each undersigned officer of the Registrantdoes hereby certify, pursuant to 18 U.S.C. §1350, as adopted pursuant to §906 of the Sarbanes-Oxley Act of 2002, that:
(1) The Form 10-K fully complies with the requirements of Section 13(a) or 15(d) of the Securities Exchange Act of 1934 (15 U.S.C. 78m or78o(d)); and
(2) The information contained in the Form 10-K fairly presents, in all material respects, the financial condition and results of operations of theRegistrant.
Date: February 28, 2017
/s/ Michael L. MoehnMichael L. MoehnChairman and President(Principal Executive Officer) /s/ Martin J. Lyons, Jr.Martin J. Lyons, Jr.Executive Vice President and Chief Financial Officer(Principal Financial Officer)
Exhibit 32.3
SECTION 1350 CERTIFICATION OFAMEREN ILLINOIS COMPANY(required by Section 906 of theSarbanes-Oxley Act of 2002)
In connection with the report on Form 10-K for the fiscal year ended December 31, 2016, of Ameren Illinois Company (the “Registrant”) as filedby the Registrant with the Securities and Exchange Commission on the date hereof (the “Form 10-K”), each undersigned officer of the Registrantdoes hereby certify, pursuant to 18 U.S.C. §1350, as adopted pursuant to §906 of the Sarbanes-Oxley Act of 2002, that:
(1) The Form 10-K fully complies with the requirements of Section 13(a) or 15(d) of the Securities Exchange Act of 1934 (15 U.S.C. 78m or78o(d)); and
(2) The information contained in the Form 10-K fairly presents, in all material respects, the financial condition and results of operations of theRegistrant.
Date: February 28, 2017
/s/ Richard J. MarkRichard J. MarkChairman and President(Principal Executive Officer) /s/ Martin J. Lyons, Jr.Martin J. Lyons, Jr.Executive Vice President and Chief Financial Officer(Principal Financial Officer)