form 10-q - i.dell.comi.dell.com/sites/doccontent/corporate/financials/en/.../10q06q3.pdf · form...
TRANSCRIPT

UNITED STATESSECURITIES AND EXCHANGE COMMISSION
Washington, D.C. 20549
Form 10-Q
(Mark One)
¥ QUARTERLY REPORT PURSUANT TO SECTION 13 OR 15(d)OF THE SECURITIES EXCHANGE ACT OF 1934
For the quarterly period ended October 28, 2005
or
n TRANSITION REPORT PURSUANT TO SECTION 13 OR 15(d) OFTHE SECURITIES EXCHANGE ACT OF 1934
For the transition period from to .
Commission File Number: 0-17017
Dell Inc.(Exact name of registrant as specified in its charter)
Delaware 74-2487834(State or other jurisdiction (I.R.S. Employer Identification No.)
of incorporation or organization)
One Dell WayRound Rock, Texas 78682
(Address of Principal Executive Offices) (Zip Code)
(512) 338-4400(Registrant's telephone number, including area code)
Indicate by check mark whether the registrant (1) has filed all reports required to be filed by Section 13 or15(d) of the Securities Exchange Act of 1934 during the preceding 12 months (or for such shorter periodthat the registrant was required to file such reports), and (2) has been subject to such filing requirementsfor the past 90 days. Yes ¥ No n
Indicate by check mark whether the registrant is an accelerated filer (as defined in Rule 12b-2 of theExchange Act). Yes ¥ No n
Indicate by check mark whether the registrant is a shell company (as defined in Rule 12b-2 of the ExchangeAct). Yes n No ¥
As of the close of business on November 25, 2005, 2,353,521,757 shares of common stock, par value $.01 pershare, were outstanding.

INDEX
Page
Part I Ì FINANCIAL INFORMATION
Item 1. Financial Statements (unaudited)
Condensed Consolidated Statement of Financial Position as of October 28, 2005 andJanuary 28, 2005ÏÏÏÏÏÏÏÏÏÏÏÏÏÏÏÏÏÏÏÏÏÏÏÏÏÏÏÏÏÏÏÏÏÏÏÏÏÏÏÏÏÏÏÏÏÏÏÏÏÏÏÏÏÏÏÏÏÏÏ 2
Condensed Consolidated Statement of Income for the three and nine month periodsended October 28, 2005 and October 29, 2004ÏÏÏÏÏÏÏÏÏÏÏÏÏÏÏÏÏÏÏÏÏÏÏÏÏÏÏÏÏÏÏÏÏÏ 3
Condensed Consolidated Statement of Cash Flows for the nine month periods endedOctober 28, 2005 and October 29, 2004 ÏÏÏÏÏÏÏÏÏÏÏÏÏÏÏÏÏÏÏÏÏÏÏÏÏÏÏÏÏÏÏÏÏÏÏÏÏÏÏ 4
Notes to Condensed Consolidated Financial Statements ÏÏÏÏÏÏÏÏÏÏÏÏÏÏÏÏÏÏÏÏÏÏÏÏÏÏÏÏ 5
Item 2. Management's Discussion and Analysis of Financial Condition and Results ofOperationsÏÏÏÏÏÏÏÏÏÏÏÏÏÏÏÏÏÏÏÏÏÏÏÏÏÏÏÏÏÏÏÏÏÏÏÏÏÏÏÏÏÏÏÏÏÏÏÏÏÏÏÏÏÏÏÏÏÏÏÏÏÏÏÏ 11
Item 3. Quantitative and Qualitative Disclosures about Market Risk ÏÏÏÏÏÏÏÏÏÏÏÏÏÏÏÏÏÏÏÏÏÏÏ 19
Item 4. Controls and ProceduresÏÏÏÏÏÏÏÏÏÏÏÏÏÏÏÏÏÏÏÏÏÏÏÏÏÏÏÏÏÏÏÏÏÏÏÏÏÏÏÏÏÏÏÏÏÏÏÏÏÏÏÏÏÏ 19
Part II Ì OTHER INFORMATION
Item 1. Legal Proceedings ÏÏÏÏÏÏÏÏÏÏÏÏÏÏÏÏÏÏÏÏÏÏÏÏÏÏÏÏÏÏÏÏÏÏÏÏÏÏÏÏÏÏÏÏÏÏÏÏÏÏÏÏÏÏÏÏÏÏÏ 20
Item 2. Unregistered Sales of Equity Securities and Use of ProceedsÏÏÏÏÏÏÏÏÏÏÏÏÏÏÏÏÏÏÏÏÏÏÏ 20
Item 6. Exhibits ÏÏÏÏÏÏÏÏÏÏÏÏÏÏÏÏÏÏÏÏÏÏÏÏÏÏÏÏÏÏÏÏÏÏÏÏÏÏÏÏÏÏÏÏÏÏÏÏÏÏÏÏÏÏÏÏÏÏÏÏÏÏÏÏÏÏÏÏ 20
1

PART I Ì FINANCIAL INFORMATION
ITEM 1. Financial Statements
DELL INC.
CONDENSED CONSOLIDATED STATEMENT OF FINANCIAL POSITION(in millions; unaudited)
October 28, January 28,2005 2005
ASSETS
Current assets:
Cash and cash equivalentsÏÏÏÏÏÏÏÏÏÏÏÏÏÏÏÏÏÏÏÏÏÏÏÏÏÏÏÏÏÏÏÏÏÏÏÏÏÏÏÏ $ 6,841 $ 4,747
Short-term investments ÏÏÏÏÏÏÏÏÏÏÏÏÏÏÏÏÏÏÏÏÏÏÏÏÏÏÏÏÏÏÏÏÏÏÏÏÏÏÏÏÏÏ 2,440 5,060
Accounts receivable, net ÏÏÏÏÏÏÏÏÏÏÏÏÏÏÏÏÏÏÏÏÏÏÏÏÏÏÏÏÏÏÏÏÏÏÏÏÏÏÏÏÏ 4,860 4,414
InventoriesÏÏÏÏÏÏÏÏÏÏÏÏÏÏÏÏÏÏÏÏÏÏÏÏÏÏÏÏÏÏÏÏÏÏÏÏÏÏÏÏÏÏÏÏÏÏÏÏÏÏÏÏÏ 582 459
Other ÏÏÏÏÏÏÏÏÏÏÏÏÏÏÏÏÏÏÏÏÏÏÏÏÏÏÏÏÏÏÏÏÏÏÏÏÏÏÏÏÏÏÏÏÏÏÏÏÏÏÏÏÏÏÏÏÏ 2,841 2,217
Total current assets ÏÏÏÏÏÏÏÏÏÏÏÏÏÏÏÏÏÏÏÏÏÏÏÏÏÏÏÏÏÏÏÏÏÏÏÏÏÏÏÏÏ 17,564 16,897
Property, plant and equipment, net ÏÏÏÏÏÏÏÏÏÏÏÏÏÏÏÏÏÏÏÏÏÏÏÏÏÏÏÏÏÏÏÏÏÏÏÏ 1,895 1,691
InvestmentsÏÏÏÏÏÏÏÏÏÏÏÏÏÏÏÏÏÏÏÏÏÏÏÏÏÏÏÏÏÏÏÏÏÏÏÏÏÏÏÏÏÏÏÏÏÏÏÏÏÏÏÏÏÏÏÏ 2,994 4,319
Other non-current assets ÏÏÏÏÏÏÏÏÏÏÏÏÏÏÏÏÏÏÏÏÏÏÏÏÏÏÏÏÏÏÏÏÏÏÏÏÏÏÏÏÏÏÏÏÏ 421 308
Total assets ÏÏÏÏÏÏÏÏÏÏÏÏÏÏÏÏÏÏÏÏÏÏÏÏÏÏÏÏÏÏÏÏÏÏÏÏÏÏÏÏÏÏÏÏÏÏÏÏ $ 22,874 $ 23,215
LIABILITIES AND STOCKHOLDERS' EQUITY
Current liabilities:
Accounts payable ÏÏÏÏÏÏÏÏÏÏÏÏÏÏÏÏÏÏÏÏÏÏÏÏÏÏÏÏÏÏÏÏÏÏÏÏÏÏÏÏÏÏÏÏÏÏÏ $ 9,376 $ 8,895
Accrued and other ÏÏÏÏÏÏÏÏÏÏÏÏÏÏÏÏÏÏÏÏÏÏÏÏÏÏÏÏÏÏÏÏÏÏÏÏÏÏÏÏÏÏÏÏÏÏ 5,871 5,241
Total current liabilitiesÏÏÏÏÏÏÏÏÏÏÏÏÏÏÏÏÏÏÏÏÏÏÏÏÏÏÏÏÏÏÏÏÏÏÏÏÏÏÏ 15,247 14,136
Long-term debtÏÏÏÏÏÏÏÏÏÏÏÏÏÏÏÏÏÏÏÏÏÏÏÏÏÏÏÏÏÏÏÏÏÏÏÏÏÏÏÏÏÏÏÏÏÏÏÏÏÏÏÏÏ 504 505
Other non-current liabilities ÏÏÏÏÏÏÏÏÏÏÏÏÏÏÏÏÏÏÏÏÏÏÏÏÏÏÏÏÏÏÏÏÏÏÏÏÏÏÏÏÏÏ 2,302 2,089
Total liabilities ÏÏÏÏÏÏÏÏÏÏÏÏÏÏÏÏÏÏÏÏÏÏÏÏÏÏÏÏÏÏÏÏÏÏÏÏÏÏÏÏÏÏÏÏÏ 18,053 16,730
Stockholders' equity:
Preferred stock and capital in excess of $.01 par value; shares issued andoutstanding: none ÏÏÏÏÏÏÏÏÏÏÏÏÏÏÏÏÏÏÏÏÏÏÏÏÏÏÏÏÏÏÏÏÏÏÏÏÏÏÏÏÏÏÏÏÏ Ì Ì
Common stock and capital in excess of $.01 par value; shares authorized:7,000; shares issued: 2,803 and 2,769, respectivelyÏÏÏÏÏÏÏÏÏÏÏÏÏÏÏÏÏÏ 9,185 8,195
Treasury stock, at cost: 422 and 284 shares, respectively ÏÏÏÏÏÏÏÏÏÏÏÏÏÏ (16,008) (10,758)
Retained earningsÏÏÏÏÏÏÏÏÏÏÏÏÏÏÏÏÏÏÏÏÏÏÏÏÏÏÏÏÏÏÏÏÏÏÏÏÏÏÏÏÏÏÏÏÏÏÏ 11,734 9,174
Other comprehensive loss ÏÏÏÏÏÏÏÏÏÏÏÏÏÏÏÏÏÏÏÏÏÏÏÏÏÏÏÏÏÏÏÏÏÏÏÏÏÏÏÏ (33) (82)
Other ÏÏÏÏÏÏÏÏÏÏÏÏÏÏÏÏÏÏÏÏÏÏÏÏÏÏÏÏÏÏÏÏÏÏÏÏÏÏÏÏÏÏÏÏÏÏÏÏÏÏÏÏÏÏÏÏÏ (57) (44)
Total stockholders' equity ÏÏÏÏÏÏÏÏÏÏÏÏÏÏÏÏÏÏÏÏÏÏÏÏÏÏÏÏÏÏÏÏÏÏÏÏ 4,821 6,485
Total liabilities and stockholders' equity ÏÏÏÏÏÏÏÏÏÏÏÏÏÏÏÏÏÏÏÏÏÏÏÏ $ 22,874 $ 23,215
The accompanying notes are an integral part of these condensed consolidated financial statements.
2

DELL INC.
CONDENSED CONSOLIDATED STATEMENT OF INCOME(in millions, except per share amounts; unaudited)
Three Months Ended Nine Months Ended
October 28, October 29, October 28, October 29,2005 2004 2005 2004
RevenueÏÏÏÏÏÏÏÏÏÏÏÏÏÏÏÏÏÏÏÏÏÏÏÏÏÏÏ $13,911 $12,502 $40,725 $35,748
Cost of revenueÏÏÏÏÏÏÏÏÏÏÏÏÏÏÏÏÏÏÏÏÏ 11,660 10,189 33,484 29,228
Gross marginÏÏÏÏÏÏÏÏÏÏÏÏÏÏÏÏÏÏÏ 2,251 2,313 7,241 6,520
Operating expenses:
Selling, general and administrative 1,391 1,101 3,802 3,100
Research, development andengineering ÏÏÏÏÏÏÏÏÏÏÏÏÏÏÏÏÏÏ 106 117 338 353
Total operating expenses ÏÏÏÏÏ 1,497 1,218 4,140 3,453
Operating income ÏÏÏÏÏÏÏÏÏÏÏ 754 1,095 3,101 3,067
Investment and other income, net ÏÏÏÏÏ 50 48 170 143
Income before income taxes ÏÏÏÏÏÏ 804 1,143 3,271 3,210
Income tax provision ÏÏÏÏÏÏÏÏÏÏÏÏÏÏÏÏ 198 297 711 834
Net income ÏÏÏÏÏÏÏÏÏÏÏÏÏÏÏÏÏÏÏÏ $ 606 $ 846 $ 2,560 $ 2,376
Earnings per common share:
BasicÏÏÏÏÏÏÏÏÏÏÏÏÏÏÏÏÏÏÏÏÏÏÏÏÏÏ $ 0.25 $ 0.34 $ 1.06 $ 0.94
DilutedÏÏÏÏÏÏÏÏÏÏÏÏÏÏÏÏÏÏÏÏÏÏÏÏ $ 0.25 $ 0.33 $ 1.03 $ 0.92
Weighted average shares outstanding:
BasicÏÏÏÏÏÏÏÏÏÏÏÏÏÏÏÏÏÏÏÏÏÏÏÏÏÏ 2,395 2,493 2,423 2,517
DilutedÏÏÏÏÏÏÏÏÏÏÏÏÏÏÏÏÏÏÏÏÏÏÏÏ 2,435 2,546 2,476 2,572
The accompanying notes are an integral part of these condensed consolidated financial statements.
3

DELL INC.
CONDENSED CONSOLIDATED STATEMENT OF CASH FLOWS(in millions; unaudited)
Nine Months Ended
October 28, October 29,2005 2004
Cash flows from operating activities:
Net income ÏÏÏÏÏÏÏÏÏÏÏÏÏÏÏÏÏÏÏÏÏÏÏÏÏÏÏÏÏÏÏÏÏÏÏÏÏÏÏÏÏÏÏÏÏÏÏÏÏÏÏÏ $ 2,560 $ 2,376
Adjustments to reconcile net income to net cash provided by operatingactivities:
Depreciation and amortization ÏÏÏÏÏÏÏÏÏÏÏÏÏÏÏÏÏÏÏÏÏÏÏÏÏÏÏÏÏÏÏÏ 286 243
Tax benefits from employee stock plans ÏÏÏÏÏÏÏÏÏÏÏÏÏÏÏÏÏÏÏÏÏÏÏÏ 153 110
Effects of exchange rate changes on monetary assets and liabilitiesdenominated in foreign currencies ÏÏÏÏÏÏÏÏÏÏÏÏÏÏÏÏÏÏÏÏÏÏÏÏÏÏÏ 24 (304)
Other ÏÏÏÏÏÏÏÏÏÏÏÏÏÏÏÏÏÏÏÏÏÏÏÏÏÏÏÏÏÏÏÏÏÏÏÏÏÏÏÏÏÏÏÏÏÏÏÏÏÏÏÏÏ 104 56
Changes in:
Operating working capital ÏÏÏÏÏÏÏÏÏÏÏÏÏÏÏÏÏÏÏÏÏÏÏÏÏÏÏÏÏÏÏÏÏÏÏÏ (200) 726
Non-current assets and liabilities ÏÏÏÏÏÏÏÏÏÏÏÏÏÏÏÏÏÏÏÏÏÏÏÏÏÏÏÏÏÏ 330 285
Net cash provided by operating activities ÏÏÏÏÏÏÏÏÏÏÏÏÏÏÏÏÏÏÏ 3,257 3,492
Cash flows from investing activities:
Investments:
PurchasesÏÏÏÏÏÏÏÏÏÏÏÏÏÏÏÏÏÏÏÏÏÏÏÏÏÏÏÏÏÏÏÏÏÏÏÏÏÏÏÏÏÏÏÏÏÏÏÏÏÏ (4,762) (9,484)
Maturities and sales ÏÏÏÏÏÏÏÏÏÏÏÏÏÏÏÏÏÏÏÏÏÏÏÏÏÏÏÏÏÏÏÏÏÏÏÏÏÏÏÏÏ 8,693 9,177
Capital expendituresÏÏÏÏÏÏÏÏÏÏÏÏÏÏÏÏÏÏÏÏÏÏÏÏÏÏÏÏÏÏÏÏÏÏÏÏÏÏÏÏÏÏÏÏÏ (507) (355)
Net cash provided by (used in) investing activities ÏÏÏÏÏÏÏÏÏÏÏ 3,424 (662)
Cash flows from financing activities:
Repurchase of common stockÏÏÏÏÏÏÏÏÏÏÏÏÏÏÏÏÏÏÏÏÏÏÏÏÏÏÏÏÏÏÏÏÏÏÏÏÏ (5,250) (3,349)
Issuance of common stock under employee plans and otherÏÏÏÏÏÏÏÏÏÏÏÏ 773 447
Net cash used in financing activities ÏÏÏÏÏÏÏÏÏÏÏÏÏÏÏÏÏÏÏÏÏÏÏÏÏ (4,477) (2,902)
Effect of exchange rate changes on cash and cash equivalentsÏÏÏÏÏÏÏÏÏÏÏÏÏÏ (110) 280
Net increase in cash and cash equivalents ÏÏÏÏÏÏÏÏÏÏÏÏÏÏÏÏÏÏÏÏÏÏÏÏÏÏÏÏÏÏ 2,094 208
Cash and cash equivalents at beginning of period ÏÏÏÏÏÏÏÏÏÏÏÏÏÏÏÏÏÏÏÏÏÏÏÏ 4,747 4,317
Cash and cash equivalents at end of period ÏÏÏÏÏÏÏÏÏÏÏÏÏÏÏÏÏÏÏÏÏÏÏÏÏÏÏÏÏ $ 6,841 $ 4,525
The accompanying notes are an integral part of these condensed consolidated financial statements.
4

DELL INC.
NOTES TO CONDENSED CONSOLIDATED FINANCIAL STATEMENTS(Unaudited)
NOTE 1 Ì BASIS OF PRESENTATION
The accompanying unaudited condensed consolidated financial statements of Dell Inc. (""Dell'') should beread in conjunction with the consolidated financial statements and accompanying notes filed with theU.S. Securities and Exchange Commission (""SEC'') in Dell's Annual Report on Form 10-K for the fiscalyear ended January 28, 2005. The accompanying unaudited condensed consolidated financial statements havebeen prepared in accordance with accounting principles generally accepted in the United States of America(""GAAP''). In the opinion of management, the accompanying unaudited condensed consolidated financialstatements reflect all adjustments of a normal recurring nature considered necessary to fairly state thefinancial position of Dell and its consolidated subsidiaries as of October 28, 2005 and January 28, 2005; andthe results of its operations for the three and nine month periods ended October 28, 2005 and October 29,2004; and its cash flows for the nine month periods ended October 28, 2005 and October 29, 2004.
NOTE 2 Ì INVENTORIES
October 28, January 28,2005 2005
(in millions)
Inventories:
Production materials ÏÏÏÏÏÏÏÏÏÏÏÏÏÏÏÏÏÏÏÏÏÏÏÏÏÏÏÏÏÏÏÏÏÏÏÏÏÏÏÏÏÏÏÏ $340 $228
Work-in-process ÏÏÏÏÏÏÏÏÏÏÏÏÏÏÏÏÏÏÏÏÏÏÏÏÏÏÏÏÏÏÏÏÏÏÏÏÏÏÏÏÏÏÏÏÏÏÏÏ 86 58
Finished goods ÏÏÏÏÏÏÏÏÏÏÏÏÏÏÏÏÏÏÏÏÏÏÏÏÏÏÏÏÏÏÏÏÏÏÏÏÏÏÏÏÏÏÏÏÏÏÏÏÏ 156 173
$582 $459
NOTE 3 Ì EARNINGS PER COMMON SHARE AND PRO FORMA EFFECTS OF STOCK-BASED COMPENSATION
Earnings Per Common Share Ì Basic earnings per share is based on the weighted effect of all common sharesissued and outstanding, and is calculated by dividing net income by the weighted average shares outstandingduring the period. Diluted earnings per share is calculated by dividing net income by the weighted averagenumber of common shares used in the basic earnings per share calculation plus the number of common sharesthat would be issued assuming exercise or conversion of all potentially dilutive common shares outstanding.
Dell excludes equity instruments from the calculation of diluted weighted average shares outstanding if theeffect of including such instruments is antidilutive to earnings per share. Accordingly, certain employee stockoptions totaling 162 million and 131 million shares have been excluded from the calculation of dilutedweighted average shares for the third quarters of fiscal 2006 and fiscal 2005, respectively, and 103 million and125 million shares have been excluded for the nine month periods ended October 28, 2005 and October 29,2004, respectively.
5
DELL INC.
NOTES TO CONDENSED CONSOLIDATED FINANCIAL STATEMENTS Ì (Continued)(Unaudited)
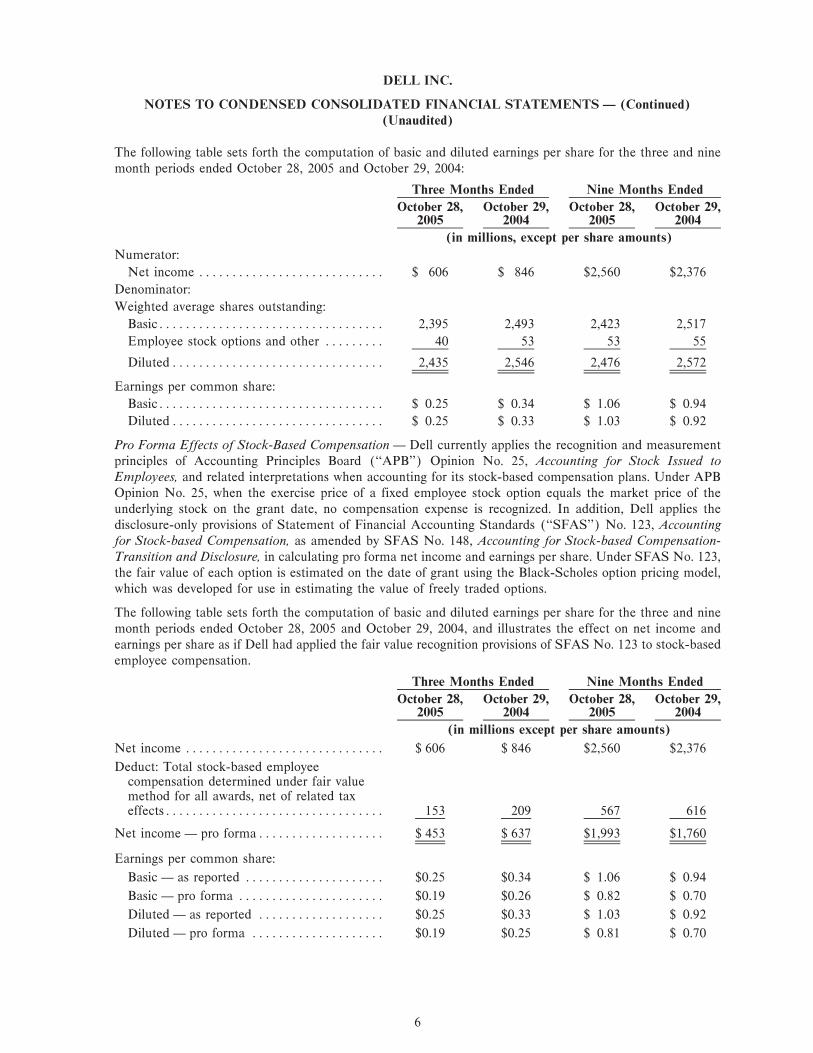
The following table sets forth the computation of basic and diluted earnings per share for the three and ninemonth periods ended October 28, 2005 and October 29, 2004:
Three Months Ended Nine Months Ended
October 28, October 29, October 28, October 29,2005 2004 2005 2004
(in millions, except per share amounts)
Numerator:
Net income ÏÏÏÏÏÏÏÏÏÏÏÏÏÏÏÏÏÏÏÏÏÏÏÏÏÏÏÏ $ 606 $ 846 $2,560 $2,376
Denominator:
Weighted average shares outstanding:
BasicÏÏÏÏÏÏÏÏÏÏÏÏÏÏÏÏÏÏÏÏÏÏÏÏÏÏÏÏÏÏÏÏÏÏ 2,395 2,493 2,423 2,517
Employee stock options and other ÏÏÏÏÏÏÏÏÏ 40 53 53 55
DilutedÏÏÏÏÏÏÏÏÏÏÏÏÏÏÏÏÏÏÏÏÏÏÏÏÏÏÏÏÏÏÏÏ 2,435 2,546 2,476 2,572
Earnings per common share:
BasicÏÏÏÏÏÏÏÏÏÏÏÏÏÏÏÏÏÏÏÏÏÏÏÏÏÏÏÏÏÏÏÏÏÏ $ 0.25 $ 0.34 $ 1.06 $ 0.94
DilutedÏÏÏÏÏÏÏÏÏÏÏÏÏÏÏÏÏÏÏÏÏÏÏÏÏÏÏÏÏÏÏÏ $ 0.25 $ 0.33 $ 1.03 $ 0.92
Pro Forma Effects of Stock-Based Compensation Ì Dell currently applies the recognition and measurementprinciples of Accounting Principles Board (""APB'') Opinion No. 25, Accounting for Stock Issued toEmployees, and related interpretations when accounting for its stock-based compensation plans. Under APBOpinion No. 25, when the exercise price of a fixed employee stock option equals the market price of theunderlying stock on the grant date, no compensation expense is recognized. In addition, Dell applies thedisclosure-only provisions of Statement of Financial Accounting Standards (""SFAS'') No. 123, Accountingfor Stock-based Compensation, as amended by SFAS No. 148, Accounting for Stock-based Compensation-Transition and Disclosure, in calculating pro forma net income and earnings per share. Under SFAS No. 123,the fair value of each option is estimated on the date of grant using the Black-Scholes option pricing model,which was developed for use in estimating the value of freely traded options.
The following table sets forth the computation of basic and diluted earnings per share for the three and ninemonth periods ended October 28, 2005 and October 29, 2004, and illustrates the effect on net income andearnings per share as if Dell had applied the fair value recognition provisions of SFAS No. 123 to stock-basedemployee compensation.
Three Months Ended Nine Months Ended
October 28, October 29, October 28, October 29,2005 2004 2005 2004
(in millions except per share amounts)
Net income ÏÏÏÏÏÏÏÏÏÏÏÏÏÏÏÏÏÏÏÏÏÏÏÏÏÏÏÏÏÏ $ 606 $ 846 $2,560 $2,376
Deduct: Total stock-based employeecompensation determined under fair valuemethod for all awards, net of related taxeffectsÏÏÏÏÏÏÏÏÏÏÏÏÏÏÏÏÏÏÏÏÏÏÏÏÏÏÏÏÏÏÏÏÏ 153 209 567 616
Net income Ì pro formaÏÏÏÏÏÏÏÏÏÏÏÏÏÏÏÏÏÏÏ $ 453 $ 637 $1,993 $1,760
Earnings per common share:
Basic Ì as reported ÏÏÏÏÏÏÏÏÏÏÏÏÏÏÏÏÏÏÏÏÏ $0.25 $0.34 $ 1.06 $ 0.94
Basic Ì pro forma ÏÏÏÏÏÏÏÏÏÏÏÏÏÏÏÏÏÏÏÏÏÏ $0.19 $0.26 $ 0.82 $ 0.70
Diluted Ì as reported ÏÏÏÏÏÏÏÏÏÏÏÏÏÏÏÏÏÏÏ $0.25 $0.33 $ 1.03 $ 0.92
Diluted Ì pro forma ÏÏÏÏÏÏÏÏÏÏÏÏÏÏÏÏÏÏÏÏ $0.19 $0.25 $ 0.81 $ 0.70
6

DELL INC.
NOTES TO CONDENSED CONSOLIDATED FINANCIAL STATEMENTS Ì (Continued)(Unaudited)
NOTE 4 Ì COMPREHENSIVE INCOME
Dell's comprehensive income is comprised of net income, unrealized gains and losses on derivative financialinstruments related to foreign currency hedging, unrealized gains and losses on marketable securities classifiedas available-for-sale and foreign currency translation adjustments. Comprehensive income for the three andnine month periods ended October 28, 2005 and October 29, 2004 was as follows:
Three Months Ended Nine Months Ended
October 28, October 29, October 28, October 29,2005 2004 2005 2004
(in millions)
Comprehensive income:
Net income ÏÏÏÏÏÏÏÏÏÏÏÏÏÏÏÏÏÏÏÏÏÏÏÏÏÏÏÏ $606 $ 846 $2,560 $2,376
Unrealized gains (losses) on foreigncurrency hedging instruments, net of taxes (24) (100) 81 (36)
Unrealized gains (losses) on marketablesecurities, net of taxes ÏÏÏÏÏÏÏÏÏÏÏÏÏÏÏÏÏ (10) 35 (29) (14)
Foreign currency translation ÏÏÏÏÏÏÏÏÏÏÏÏÏÏ (1) 1 (3) (2)
Total comprehensive income, net of taxesÏÏÏÏÏ $571 $ 782 $2,609 $2,324
NOTE 5 Ì AGGREGATE DEFERRED REVENUE AND WARRANTY LIABILITY
Dell records warranty liabilities at the time of sale for the estimated costs that may be incurred under its basiclimited warranty. Revenue from extended warranty and service contracts, for which Dell is obligated toperform, is recorded as deferred revenue and subsequently recognized over the term of the contract or whenthe service is completed. Changes in Dell's aggregate deferred revenue and warranty liability are presented inthe following table:
Nine Months Ended
October 28, October 29,2005 2004
(in millions)
Aggregate deferred revenue and warranty liability at beginning of periodÏÏÏÏÏ $ 3,594 $2,694
Revenue deferred and costs accrued for new warranties(a) ÏÏÏÏÏÏÏÏÏÏÏÏÏÏ 3,318 2,420
Service obligations honoredÏÏÏÏÏÏÏÏÏÏÏÏÏÏÏÏÏÏÏÏÏÏÏÏÏÏÏÏÏÏÏÏÏÏÏÏÏÏÏÏÏ (1,191) (846)
Amortization of deferred revenueÏÏÏÏÏÏÏÏÏÏÏÏÏÏÏÏÏÏÏÏÏÏÏÏÏÏÏÏÏÏÏÏÏÏÏÏ (1,408) (946)
Aggregate deferred revenue and warranty liability at end of periodÏÏÏÏÏÏÏÏÏÏ $ 4,313 $3,322
(a) During the quarter, Dell recognized a product charge of $307 million for estimated warranty costs of servicing or replacing certain
OptiPlexTM systems that include a vendor part that failed to perform to Dell's specifications. At October 28, 2005, $274 million of the
accrued warranty obligation remains outstanding for servicing or replacing additional OptiPlexTM systems.
7
DELL INC.
NOTES TO CONDENSED CONSOLIDATED FINANCIAL STATEMENTS Ì (Continued)(Unaudited)
NOTE 6 Ì DELL FINANCIAL SERVICES
Dell is currently a partner in Dell Financial Services L.P. (""DFS''), a joint venture with CIT Group Inc.(""CIT''). In general, DFS originates customer financing transactions through either loan or lease financing.Dell recognized revenue from the sale of products pursuant to loan and lease financing transactions made byDFS of $1.5 billion and $1.4 billion during the three month periods ended October 28, 2005 and October 29,2004, respectively, and $4.6 billion and $3.9 billion for the nine month periods ended October 28, 2005 andOctober 29, 2004, respectively.
Dell currently owns a 70% equity interest in DFS and began consolidating DFS's financial results during fiscal2004. CIT's equity ownership in the net assets of DFS was $7 million and $13 million as of October 28, 2005and January 28, 2005, respectively, which is recorded as minority interest and included in other non-currentliabilities.
Dell has the option to purchase CIT's 30% interest in DFS in February 2008 for an approximate purchaseprice ranging from $100 million to $345 million depending on DFS's profitability. If Dell does not exercise thispurchase option, Dell is obligated to purchase CIT's 30% interest upon the occurrence of certain terminationevents, or upon expiration of the joint venture on January 29, 2010 for an approximate purchase price rangingfrom $100 million to $345 million.
DFS retains a residual interest in the equipment that it leases. As of October 28, 2005, $137 million and$126 million of equipment residuals were included in other current and other non-current assets, respectively.As of January 28, 2005, $108 million and $133 million of equipment residuals were included in other currentand other non-current assets, respectively. The equipment residuals are partially funded by a credit facilitythat DFS maintains with CIT that provides DFS with residual funding capacity of up to $1.0 billion. As ofOctober 28, 2005 and January 28, 2005, outstanding advances under this residual facility totaled $139 millionand $158 million, respectively, and were included in other current and other non-current liabilities.
Dell is dependent upon DFS to provide financing for a significant number of customers who elect to financeDell products. DFS is dependent upon CIT to access the capital markets to provide funding for thesetransactions. If CIT were unable to access the capital markets, Dell would be required to find additionalalternative sources of financing for its customers or self-finance these activities. During the fourth quarter offiscal 2005, DFS began selling loan and lease receivables to Dell on the same terms and conditions as sold toCIT. Dell's purchase of these assets allows Dell to retain a greater portion of the assets' future earnings. Infiscal 2006, Dell has the right to purchase 25% of the transactions funded through DFS. The percentage oftransactions that Dell may purchase increases in future years. Dell expects to continue to purchase loan andlease receivables in the future, and expects that the amount of Dell-funded loan and lease receivables willincrease over time. Loan and lease receivables that Dell currently holds are included in other current and othernon-current assets. Promotional financing receivables are included in accounts receivable.
During the nine month period ended October 28, 2005, Dell sold $253 million of the $340 million loan andlease finance receivables purchased from DFS to unconsolidated qualifying special purpose entities that arewholly-owned by Dell. The qualifying special purpose entities are bankruptcy remote legal entities with assetsand liabilities separate from those of Dell. The sole purpose of the qualifying special purpose entities is tofacilitate the funding of purchased receivables in the capital markets. The qualifying special purpose entitieshave entered into financing arrangements with three multi-seller conduits that, in turn, issue asset-backed debtsecurities in the capital markets. Transfers of financing receivables are recorded in accordance with theprovisions of SFAS No. 140, Accounting for Transfers and Servicing of Financial Assets and Extinguishmentof Liabilities.
8

DELL INC.
NOTES TO CONDENSED CONSOLIDATED FINANCIAL STATEMENTS Ì (Continued)(Unaudited)
NOTE 7 Ì SEGMENT INFORMATION
Dell conducts operations worldwide and is managed in three geographic segments: the Americas, Europe, andAsia Pacific-Japan regions. The Americas region, which is based in Round Rock, Texas, covers the U.S.,Canada, and Latin America. Within the Americas, Dell is further segmented into Business andU.S. Consumer. The Americas Business segment includes sales to corporate, government, healthcare,education, and small and medium business customers within the Americas region, while the U.S. Consumersegment includes sales primarily to individual consumers within the U.S. The European region, which is basedin Bracknell, England, covers Europe, the Middle East, and Africa. The Asia Pacific-Japan region covers Asiaand the Pacific Rim, including Australia and New Zealand, and is based in Singapore.
The accounting policies of Dell's reportable segments are the same as those described in the summary ofsignificant accounting policies in its Annual Report on Form 10-K for the fiscal year ended January 28, 2005.Dell allocates resources to and evaluates the performance of its segments based on operating income. In thethird quarter, Dell announced that it will begin consolidating the U.S. Consumer segment into the AmericasBusiness segment to drive efficiencies. Dell expects this consolidation to be complete in the first quarter offiscal 2007 and will change this segment reporting at that time.
The table below presents information about Dell's reportable segments for the three and nine month periodsended October 28, 2005 and October 29, 2004:
Three Months Ended Nine Months Ended
October 28, October 29, October 28, October 29,2005 2004 2005 2004
(in millions)
Net revenue:
Americas:
Business ÏÏÏÏÏÏÏÏÏÏÏÏÏÏÏÏÏÏÏÏÏÏÏÏÏÏÏÏÏ $ 7,324 $ 6,644 $21,119 $18,806
U.S. Consumer ÏÏÏÏÏÏÏÏÏÏÏÏÏÏÏÏÏÏÏÏÏÏÏ 1,901 1,937 5,537 5,242
Total Americas ÏÏÏÏÏÏÏÏÏÏÏÏÏÏÏÏÏÏÏÏÏ 9,225 8,581 26,656 24,048
Europe ÏÏÏÏÏÏÏÏÏÏÏÏÏÏÏÏÏÏÏÏÏÏÏÏÏÏÏÏÏÏÏÏ 3,098 2,596 9,190 7,665
Asia Pacific-Japan ÏÏÏÏÏÏÏÏÏÏÏÏÏÏÏÏÏÏÏÏÏÏ 1,588 1,325 4,879 4,035
Total net revenue ÏÏÏÏÏÏÏÏÏÏÏÏÏÏÏÏÏÏÏÏÏÏÏÏÏ $13,911 $12,502 $40,725 $35,748
Segment operating income:
Americas:
Business ÏÏÏÏÏÏÏÏÏÏÏÏÏÏÏÏÏÏÏÏÏÏÏÏÏÏÏÏÏ $ 817 $ 689 $ 2,239 $ 1,896
U.S. Consumer ÏÏÏÏÏÏÏÏÏÏÏÏÏÏÏÏÏÏÏÏÏÏÏ 80 97 322 280
Total Americas ÏÏÏÏÏÏÏÏÏÏÏÏÏÏÏÏÏÏÏÏÏ 897 786 2,561 2,176
Europe ÏÏÏÏÏÏÏÏÏÏÏÏÏÏÏÏÏÏÏÏÏÏÏÏÏÏÏÏÏÏÏÏ 181 191 608 561
Asia Pacific-Japan ÏÏÏÏÏÏÏÏÏÏÏÏÏÏÏÏÏÏÏÏÏÏ 118 118 374 330
Total consolidated segment operating incomeÏÏ $ 1,196 $ 1,095 $ 3,543 $ 3,067
9

DELL INC.
NOTES TO CONDENSED CONSOLIDATED FINANCIAL STATEMENTS Ì (Continued)(Unaudited)
Corporate expenses are included in Dell's measure of segment operating income for management reportingpurposes; however, certain charges totaling $442 million, incurred in the third quarter of fiscal 2006, are notallocated to the business segments. The reconciliation of segment operating results to Dell's consolidated totalsis as follows:
Three Months Ended Nine Months Ended
October 28, October 29, October 28, October 29,2005 2004 2005 2004
(in millions)
Consolidated operating income:
Total consolidated segment operating income $1,196 $1,095 $3,543 $3,067
Other product charges(a) ÏÏÏÏÏÏÏÏÏÏÏÏÏÏÏÏ (338) Ì (338) Ì
Selling, general and administrativecharges(b)ÏÏÏÏÏÏÏÏÏÏÏÏÏÏÏÏÏÏÏÏÏÏÏÏÏÏÏ (104) Ì (104) Ì
Total consolidated operating income ÏÏÏÏÏÏÏÏÏ $ 754 $1,095 $3,101 $3,067
(a) Other product charges include $307 million for estimated warranty costs of servicing or replacing certain OptiPlexTM systems that
include a vendor part that failed to perform to Dell's specifications, as well as additional charges for product rationalizations and
workforce realignment.
(b) Charges relate to workforce realignment expenses, primarily for severance and related costs of $50 million, cost of operating leases on
office space no longer utilized of $25 million, and a write-off of goodwill of $29 million.
NOTE 8 Ì INCOME TAXES
On October 22, 2004, the American Jobs Creation Act of 2004 (the ""Act'') was signed into law. Among otheritems, the Act creates a temporary incentive for U.S. multinationals to repatriate accumulated income earnedoutside the U.S. at an effective tax rate of 5.25%, versus the U.S. federal statutory rate of 35%. In the fourthquarter of fiscal 2005, Dell recorded an initial estimated income tax charge of $280 million based on thedecision to repatriate $4.1 billion of foreign earnings. This tax charge included an amount relating to a draftingoversight that Congressional leaders expected to correct in calendar year 2005. On May 10, 2005, theDepartment of Treasury issued further guidance that addressed the drafting oversight. In the second quarter offiscal 2006, Dell reduced its original estimate of the tax charge by $85 million as a result of the guidanceissued by the Treasury Department. As of October 28, 2005, Dell has repatriated approximately one half of theexpected $4.1 billion in foreign earnings. The repatriation is required to be completed by the end of fiscal 2006.
10

ITEM 2. Management's Discussion and Analysis of Financial Condition and Results of Operations
Statements in this report that relate to future results and events are forward-looking statements based on Dell'scurrent expectations. Actual results in future periods could differ materially from those projected in thoseforward-looking statements because of a number of risks and uncertainties. For a discussion of factorsaffecting Dell's business and prospects, see ""Item 1 Ì Business Ì Factors Affecting Dell's Business andProspects'' in Dell's Annual Report on Form 10-K for the fiscal year ended January 28, 2005.
All percentage amounts and ratios were calculated using the underlying data in thousands. Unless otherwisenoted, all references to industry share and total industry growth data are for personal computers (includingdesktops, notebooks, and x86 servers), and are based on information provided by IDC Worldwide PC Tracker,November 28, 2005. Share data is for the calendar quarter, and all Dell growth rates are on a year-over-yearbasis. Unless otherwise noted, all references to time periods refer to Dell fiscal periods.
Executive Overview
Our Company
We are a leading global diversified technology provider, focused on providing custom solutions and the bestcustomer experience in the industry. Through our direct business model, we design, develop, manufacture,market, sell, and support a broad range of information technology systems and services that are uniquelydesigned to satisfy specific customer requirements. Our direct model begins and ends with our customers. Webelieve in entering the market quickly with new and relevant technology to meet changing customer needs,building systems to order, providing expert services tailored to differing customer needs, and maintaining lowlevels of inventory and capital investment. The unique strengths of our direct model facilitate our consistentdelivery of profitability and strong performances across our business segments.
Technology Industry
Our operating environment is competitive, yet our growth potential remains strong. Recent reports indicateeconomic growth in both the United States and worldwide is recovering at a measured pace. We believe theoverall market is healthy, particularly in our international regions.
Third Quarter Performance Highlights
Share position ‚ We shipped an industry record 9.2 million units, resulting in a worldwide PC shareposition of 17.9%.
Revenue ‚ Revenue increased 11% year-over-year to $13.9 billion, with unit shipments up15% year-over-year.
Operating Income and ‚ Operating income and earnings per share declined year-over-year due to chargesEarnings Per Share of $442 million primarily for warranty costs of $307 million for servicing or
replacing certain OptiPlexTM systems that include a vendor part that failed toperform to our specifications. This charge also included amounts for workforcerealignment, product rationalizations, excess facilities, and a write-off of goodwill.
‚ Operating income decreased 31% to $754 million for the quarter, or 5.4% ofrevenue, down from $1.1 billion and 8.8% of revenue in the third quarter offiscal 2005. Earnings per share decreased 24% to $0.25 for the quarter.
‚ Excluding the charges mentioned above, operating income increased 9% to$1.2 billion for the quarter, or 8.6% of revenue, up from $1.1 billion and 8.8% ofrevenue in the third quarter of fiscal 2005, and earnings per share increased 18%to $0.39 for the quarter (see ""Item 2 Ì Management's Discussion and Analysisof Financial Condition and Results of Operations Ì Additional FinancialMeasures for Year-Over-Year Comparison'').
Share Repurchases ‚ We spent $1.4 billion to repurchase 41 million shares in the third quarter of fiscal2006.
11

Results of Operations
The following table summarizes the results of our operations for the three and nine month periods endedOctober 28, 2005 and October 29, 2004:
Three Months Ended Nine Months Ended
October 28, 2005 October 29, 2004 October 28, 2005 October 29, 2004
% of % of % of % ofDollars Revenue Dollars Revenue Dollars Revenue Dollars Revenue
(in millions, except per share amounts and percentages)
Revenue ÏÏÏÏÏÏÏÏÏÏÏÏÏÏ $13,911 100.0% $12,502 100.0% $40,725 100.0% $35,748 100.0%
Gross margin ÏÏÏÏÏÏÏÏÏÏ 2,251 16.2% 2,313 18.5% 7,241 17.8% 6,520 18.2%
Operating expenses ÏÏÏÏÏ 1,497 10.8% 1,218 9.7% 4,140 10.2% 3,453 9.7%
Operating incomeÏÏÏÏÏÏÏ 754 5.4% 1,095 8.8% 3,101 7.6% 3,067 8.6%
Net incomeÏÏÏÏÏÏÏÏÏÏÏÏ 606 4.4% 846 6.8% 2,560 6.3% 2,376 6.6%
Earnings per share Ìdiluted ÏÏÏÏÏÏÏÏÏÏÏÏÏÏ $ 0.25 N/A $ 0.33 N/A $ 1.03 N/A $ 0.92 N/A
Consolidated Revenue
In both the three and nine month periods ended October 28, 2005, we grew revenue across all regions andproduct categories over the prior year periods, other than Desktop PCs, which declined 2% in the third quarterof fiscal 2006 compared to the prior year. The decline in Desktop PC revenue reflects continuing reductions inaverage selling prices and an industry-wide shift to mobility products. Revenue outside the U.S. comprised40% of consolidated revenue for the third quarter of fiscal 2006 compared to 37% for the same period last year.For the nine months ended October 28, 2005, revenue outside the U.S. represented 40% of the consolidatedrevenue compared to 38% in the prior year nine month period. Internationally, we produced 20% and 21%year-over-year revenue growth for the third quarter and first nine months of fiscal 2006, respectively.
Revenues by Segment
We conduct operations worldwide and manage our business in three geographic segments: the Americas,Europe, and Asia Pacific-Japan regions. The Americas region covers the U.S., Canada, and Latin America.Within the Americas, we are further divided into Business and U.S. Consumer segments. The AmericasBusiness segment includes sales to corporate, government, healthcare, education, and small and mediumbusiness customers within the Americas region, while the U.S. Consumer segment includes sales primarily toindividual consumers within the U.S. The Europe region covers Europe, the Middle East, and Africa(""EMEA''). The Asia Pacific-Japan (""APJ'') region covers Asia and the Pacific Rim, including Australiaand New Zealand.
12

The following table summarizes our revenue by segment:
Three Months Ended Nine Months Ended
October 28, 2005 October 29, 2004 October 28, 2005 October 29, 2004
% of % of % of % ofDollars Revenue Dollars Revenue Dollars Revenue Dollars Revenue
(in millions, except percentages)
Revenue:
Americas:
BusinessÏÏÏÏÏÏÏÏÏÏÏ $ 7,324 52.6% $ 6,644 53.1% $21,119 51.8% $18,806 52.6%
U.S. ConsumerÏÏÏÏÏ 1,901 13.7% 1,937 15.5% 5,537 13.6% 5,242 14.7%
Total AmericasÏÏÏ 9,225 66.3% 8,581 68.6% 26,656 65.4% 24,048 67.3%
EMEAÏÏÏÏÏÏÏÏÏÏÏÏÏÏ 3,098 22.3% 2,596 20.8% 9,190 22.6% 7,665 21.4%
APJ ÏÏÏÏÏÏÏÏÏÏÏÏÏÏÏÏ 1,588 11.4% 1,325 10.6% 4,879 12.0% 4,035 11.3%
Total revenue ÏÏÏÏÏÏ $13,911 100.0% $12,502 100.0% $40,725 100.0% $35,748 100.0%
‚ Americas Ì Americas' revenues increased 8% for the third quarter and 11% for the nine month periodended October 28, 2005. This increase includes 10% and 12% growth in our Americas Business segment forthe third quarter and first nine months of fiscal 2006, respectively, and a 2% decline and 6% growth in ourU.S. Consumer segment during the same periods. During the quarter, we began shipping products from ourthird U.S. manufacturing facility located in North Carolina, opened a new customer contact facility inOklahoma City, and expanded our small parts hub in Ohio.
‚ Business Ì For the third quarter of fiscal 2006, there was strong performance in corporate accounts,including large and small and medium businesses. Corporate growth and Americas International drovethe majority of the increase in revenue in the Americas. Our federal business experienced weakdemand for the first six months of fiscal 2006, but moderate year-over-year growth in the third quarterof fiscal 2006. As a result, the federal business had only a slight decline for the nine month periodended October 28, 2005 as compared to the first nine months of fiscal 2005. Americas Internationalproduced strong revenue growth of 22% and 29% year-over-year for the third quarter and first ninemonths of fiscal 2006.
‚ U.S. Consumer Ì U.S. Consumer revenue declined 2% for the third quarter of fiscal 2006, but grew6% for the first nine months ended October 28, 2005. U.S. Consumer revenue was less than the thirdquarter of fiscal 2005 due to slower desktop growth and overall competitive price pressure. Asnotebooks become more affordable, we continue to see a positive shift to mobility products inU.S. Consumer and our other segments. In the third quarter we announced that we will beginconsolidating our U.S. Consumer segment into our Americas Business segment to drive efficiencies.We expect this consolidation to be complete in the first quarter of fiscal 2007 and will change thisreporting at that time.
‚ EMEA Ì EMEA revenue grew 19% for the third quarter and 20% for the nine month period endedOctober 28, 2005. During the third quarter, excluding the United Kingdom, EMEA revenue grew 25%.Year-over-year revenue growth for the United Kingdom slowed to 8% and 10% for the quarter and first ninemonths of fiscal 2006, respectively, due to weak performance in our relationship business. All productcategories in EMEA experienced growth for both the three and nine month periods ended October 28, 2005with mobility, enhanced services and software and peripherals revenues posting strong gains.
‚ APJ Ì Year-over-year net revenue growth during the third quarter and first nine months of fiscal 2006 was20% and 21%, respectively. China had revenue growth of 29% on unit shipment growth of 46% year-over-year, led by home and small business. South Korea and Taiwan produced significant year-over-year growthat a higher rate than the overall region for the third quarter of fiscal 2006. Driving the growth were increasesin mobility, enhanced services, and software and peripherals.
13

Revenues by Product and Services Categories
Beginning the first quarter of fiscal 2006 we began providing new supplemental revenue reporting by productand services categories as illustrated in the following table:
Three Months Ended Nine Months Ended
October 28, 2005 October 29, 2004 October 28, 2005 October 29, 2004
% of % of % of % ofDollars Revenue Dollars Revenue Dollars Revenue Dollars Revenue
(in billions, except percentages)
Revenue:
Desktop PCs ÏÏÏÏÏÏÏÏ $ 5.1 37% $ 5.2 42% $15.5 38% $15.2 43%
Mobility ÏÏÏÏÏÏÏÏÏÏÏÏ 3.6 26% 3.1 25% 10.3 25% 8.7 24%
Software & Peripherals 2.1 15% 1.7 14% 6.1 15% 4.7 13%
Servers & Networking 1.4 10% 1.2 9% 4.0 10% 3.6 10%
Enhanced Services ÏÏÏ 1.2 9% 1.0 7% 3.5 9% 2.6 7%
Storage ÏÏÏÏÏÏÏÏÏÏÏÏÏ 0.5 3% 0.3 3% 1.3 3% 0.9 3%
Total revenueÏÏÏÏÏÏ $13.9 100% $12.5 100% $40.7 100% $35.7 100%
‚ Desktop PCs Ì Revenue from sales of Desktop PCs, consisting of OptiPlexTM, XPSTM and DimensionTM
desktop computer systems, and Dell's PrecisionTM desktop workstations, declined 2% on unit growth of 6%year-over-year for the third quarter and increased 2% on unit growth of 12% year-over-year for the first ninemonths of fiscal 2006. Business and consumer demand continues to shift toward mobility products asnotebook computers become more affordable.
‚ Mobility Ì Revenue from mobility products, consisting of Dell XPSTM, LatitudeTM and InspironTM note-books, Dell PrecisionTM mobile workstations, Dell DJTM, and Dell AximTM, grew by 14% on unit growth of38% year-over-year for the third quarter and 18% on unit growth of 41% year-over-year for the first ninemonths of fiscal 2006. As notebooks become more affordable and wireless products become standardized,demand for our mobility products continues to accelerate.
‚ Software & Peripherals Ì Revenue from sales of software and peripherals (""S&P'') consists of Dell-branded printers, monitors (not sold with systems), plasma and LCD televisions, projectors, and amultitude of competitively priced third-party printers, software, digital cameras and other products. Thisrevenue grew 25% year-over-year for the third quarter and 29% year-over-year for the first nine months offiscal 2006 led by digital displays, as well as imaging and printing products. We experienced strong laserprinter demand, driven by color lasers, for the quarter contributing to an overall 8% increase in Dell printerunits. Shipments of replacement ink and toner cartridges doubled year-over-year.
‚ Servers & Networking Ì Revenue from sales of servers and networking products, consisting of ourstandards-based PowerEdgeTM line of network hardware and PowerConnectTM networking solutions, grew16% on unit growth of 21% year-over-year for the third quarter and grew 12% on unit growth of 24% year-over-year for the first nine months of fiscal 2006. Servers and networking remains a strategic focus area. Wecompetitively price our server products to facilitate additional sales of storage products and higher marginenhanced services. As a result, for the third quarter of fiscal 2006, we grew the enhanced services revenuerelated to enterprise products by 31% year-over-year. During the quarter we unveiled our portfolio of single,dual and four-socket PowerEdgeTM servers with Intel's Xeon» technology.
‚ Enhanced Services Ì Enhanced services consists of a wide range of services including professionalconsulting, custom hardware and software integration, extended warranties, leasing and asset management,network installation and support as well as onsite services. Enhanced services revenue increased 36% year-over-year for both the three and nine month periods ended October 28, 2005, to $1.2 billion and $3.5 billion,respectively. We are expanding our services offerings and capabilities globally, resulting in a 72% year-over-year growth in revenues outside the Americas for the third quarter of fiscal 2006. In addition, we increasedour deferred revenue balance by $190 million over the second quarter of fiscal 2006 to $3.4 billion.
‚ Storage Ì Revenue from sales of storage products, consisting of Dell C EMC and Dell PowerVaultTM
storage devices, increased 35% and 36% year-over-year for the third quarter and first nine months of fiscal2006, respectively. Americas led the revenue growth in Storage with a 44% and 37% increase for the threeand nine month periods ended October 28, 2005, respectively.
14

Gross Margin
Three Months Ended Nine Months Ended
October 28, 2005 October 29, 2004 October 28, 2005 October 29, 2004
% of % of % of % ofDollars Revenue Dollars Revenue Dollars Revenue Dollars Revenue
(in millions, except percentages)
Revenue ÏÏÏÏÏÏÏÏÏÏÏÏÏ $13,911 100.0% $12,502 100.0% $40,725 100.0% $35,748 100.0%
Gross margin ÏÏÏÏÏÏÏÏÏ 2,251 16.2% 2,313 18.5% 7,241 17.8% 6,520 18.2%
Our gross margin declined for the third quarter of fiscal 2006, while for the first nine months of fiscal 2006gross margin increased in absolute dollars as compared to the same period in the prior year. Our year-over-year decline in the third quarter is due to a product charge of $338 million for estimated warranty costs ofservicing or replacing certain OptiPlexTM systems that include a vendor part that failed to perform to ourspecifications, as well as additional charges for product rationalizations and workforce realignment. Thesecharges were offset by favorable pricing on certain commodity components, higher revenue to leverage fixedproduction costs, and a favorable shift in product mix as compared to the prior year periods. Gross marginpercentages excluding the charges discussed above were 18.6% for both the three and nine month periodsended October 28, 2005. See ""Item 2 Ì Management's Discussion and Analysis of Financial Condition andResults of Operations Ì Additional Financial Measures for Year-Over-Year Comparison''.
As part of our focus on improving margins, we remain committed to reducing costs in three primary areas:warranty costs, structural materials, and infrastructure. Cost savings initiatives include providing certaincustomer technical support and back-office functions from cost-effective locations as well as driving moreefficient processes and tools globally. We routinely pass cost reductions to our customers to improve customervalue and increase share.
Operating Expenses
The following table summarizes our operating expenses:
Three Months Ended Nine Months Ended
October 28, 2005 October 29, 2004 October 28, 2005 October 29, 2004
% of % of % of % ofDollars Revenue Dollars Revenue Dollars Revenue Dollars Revenue
(in millions, except percentages)
Selling, general andadministrative ÏÏÏÏÏÏ $ 1,391 10.0% $ 1,101 8.8% $ 3,802 9.4% $ 3,100 8.7%
Research, developmentand engineering ÏÏÏÏÏ 106 0.8% 117 0.9% 338 0.8% 353 1.0%
Total operatingexpenses ÏÏÏÏÏÏÏÏÏÏÏ $ 1,497 10.8% $ 1,218 9.7% $ 4,140 10.2% $ 3,453 9.7%
‚ Selling, general and administrative Ì During the third quarter and first nine months of fiscal 2006, selling,general and administrative expenses increased 26% and 23%, respectively, to $1.4 billion and $3.8 billioncompared to $1.1 and $3.1 billion in the same periods of fiscal 2005. Costs primarily related to headcountgrowth drove the increase in the third quarter and first nine months of fiscal 2006, as well as charges of$104 million related to workforce realignment costs ($50 million), costs of operating leases on office spaceno longer utilized ($25 million) and a write-off of goodwill ($29 million). The goodwill relates to anacquisition in June 2002. As a result of the previously mentioned product rationalization review, we decidedto discontinue the service offerings acquired with this business. Therefore, the related goodwill was deemedimpaired in the third quarter of fiscal 2006. Selling, general and administrative expenses excluding thecharges discussed above is $1.3 billion or 9.2% of revenue, and $3.7 billion or 9.1% of revenue, for the threeand nine month periods ended October 28, 2005, respectively. See ""Item 2 Ì Management's Discussionand Analysis of Financial Condition and Results of Operations Ì Additional Financial Measures for Year-Over-Year Comparison''.
‚ Research, development and engineering Ì During the third quarter and first nine months of fiscal 2006,research, development and engineering expenses decreased 9% and 4%, respectively, to $106 million and$338 million compared to $117 million and $353 million in the same periods of fiscal 2005. We manage our
15

R&D spending by targeting those innovations and products most valuable to our customers, and by relyingupon the capabilities of our strategic partners. We will continue to invest in research, development andengineering activities to support our growth and to provide for new, competitive products. We have obtained1,225 U.S. patents and have applied for 867 additional U.S. patents as of October 28, 2005.
Investment and Other Income, net
Net investment and other income primarily include interest income and expense, gains and losses from thesale of investments and related fees, as well as foreign exchange transaction gains and losses. Net investmentand other income, increased to $50 million and $170 million for the third quarter and first nine months offiscal 2006, respectively, compared to $48 million and $143 million for the same periods in fiscal 2005,respectively. This increase is primarily due to an increase in investment income earned on fluctuating averagebalances of cash and investments, as well as higher interest rates during the three month and nine monthperiods of fiscal 2006 compared to fiscal 2005.
Income Taxes
On October 22, 2004, the American Jobs Creation Act of 2004 (the ""Act'') was signed into law. Among otheritems, the Act creates a temporary incentive for U.S. multinationals to repatriate accumulated income earnedoutside the U.S. at an effective tax rate of 5.25%, versus the U.S. federal statutory rate of 35%. In the fourthquarter of fiscal 2005, we recorded an initial estimated income tax charge of $280 million based on thedecision to repatriate $4.1 billion of foreign earnings. This tax charge included an amount relating to a draftingoversight that Congressional leaders expected to correct in calendar year 2005. On May 10, 2005, theDepartment of Treasury issued further guidance that addressed the drafting oversight. In the second quarter offiscal 2006, we reduced our original estimate of the tax charge by $85 million as a result of guidance issued bythe Treasury Department. As of October 28, 2005, we have repatriated approximately one half of the expected$4.1 billion in foreign earnings. The repatriation is required to be completed by the end of fiscal 2006.
The differences between our effective tax rate and the U.S. federal statutory rate of 35% principally resultfrom our geographical distribution of taxable income, and differences between the book and tax treatment ofcertain items. We reported an effective tax rate of approximately 25% for the third quarter of fiscal 2006, ascompared to 26% for the same quarter last year. For the nine month periods ended October 28, 2005 andOctober 29, 2004, our effective rate was approximately 22% and 26%, respectively. The decline in our effectivetax rate is primarily due to the $85 million tax expense reduction related to the Act and regulatory guidanceissued by the IRS, as well as a higher proportion of our operating profits being generated in lower foreign taxjurisdictions during the first nine months of fiscal 2006 as compared to a year ago.
Off-Balance Sheet Arrangements
Securitized Lending Transactions
During the third quarter of fiscal 2006, we continued to sell loan and lease receivables purchased from DFS tounconsolidated qualifying special purpose entities that are wholly-owned by Dell. See Note 6, ""Dell FinancialServices'' for further discussion. This market-based financing structure gives us the ability to directly accessthe capital markets. The qualifying special purpose entities are bankruptcy remote legal entities with assetsand liabilities separate from those of Dell. The sole purpose of the qualifying special purpose entities is tofacilitate the funding of finance receivables in the capital markets. The qualifying special purpose entities haveentered into financing arrangements with three multi-seller conduits that, in turn, issue asset-backed debtsecurities in the capital markets. Transfers of financing receivables are recorded in accordance with theprovisions of SFAS No. 140, Accounting for Transfers and Servicing of Financial Assets and Extinguishmentof Liabilities. We expect to continue to purchase loan and lease receivables in the future, and expect that theamount of Dell-funded loan and lease receivables will increase over time.
16

Liquidity and Capital Commitments
Liquidity
We ended the third quarter of fiscal 2006 with $12.3 billion in cash, cash equivalents, and investments,compared to $12.4 billion at October 29, 2004. We invest a large portion of our available cash in highly liquidand highly rated government, agency, and corporate debt securities of varying maturities at the date ofacquisition. Our investment policy is to manage our investment portfolio to preserve principal and liquiditywhile maximizing the return through the full investment of available funds. The following table summarizesthe results of our statement of cash flows for the nine month periods ended October 28, 2005 and October 29,2004:
Nine Months Ended
October 28, October 29,2005 2004
(in millions)
Net cash flow provided by (used in):Operating activitiesÏÏÏÏÏÏÏÏÏÏÏÏÏÏÏÏÏÏÏÏÏÏÏÏÏÏÏÏÏÏÏÏÏÏÏÏÏÏÏÏÏÏÏÏÏÏÏÏ $ 3,257 $ 3,492Investing activities ÏÏÏÏÏÏÏÏÏÏÏÏÏÏÏÏÏÏÏÏÏÏÏÏÏÏÏÏÏÏÏÏÏÏÏÏÏÏÏÏÏÏÏÏÏÏÏÏ 3,424 (662)Financing activitiesÏÏÏÏÏÏÏÏÏÏÏÏÏÏÏÏÏÏÏÏÏÏÏÏÏÏÏÏÏÏÏÏÏÏÏÏÏÏÏÏÏÏÏÏÏÏÏÏ (4,477) (2,902)Effect of exchange rate changes on cash and cash equivalentsÏÏÏÏÏÏÏÏÏÏÏÏ (110) 280
Net increase in cash and cash equivalents ÏÏÏÏÏÏÏÏÏÏÏÏÏÏÏÏÏÏÏÏÏÏÏÏÏÏÏÏÏÏ $ 2,094 $ 208
Operating Activities Ì Cash provided by operating activities during the nine month period ended October 28,2005 was $3.3 billion, compared to $3.5 billion for the same period last year. Cash flows from operatingactivities resulted primarily from net income during both periods, which represents our principal source ofcash. Our direct model allows us to maintain an efficient cash conversion cycle, which compares favorablywith that of others in our industry.
The following table presents the components of our cash conversion cycle as of October 28, 2005 andJanuary 28, 2005:
October 28, January 28,2005 2005
Days of sales outstanding(a) ÏÏÏÏÏÏÏÏÏÏÏÏÏÏÏÏÏÏÏÏÏÏÏÏÏÏÏÏÏÏÏÏÏÏÏÏÏÏÏÏÏ 34 32Days of supply in inventory(b)ÏÏÏÏÏÏÏÏÏÏÏÏÏÏÏÏÏÏÏÏÏÏÏÏÏÏÏÏÏÏÏÏÏÏÏÏÏÏÏÏ 5 4Days in accounts payable(b) ÏÏÏÏÏÏÏÏÏÏÏÏÏÏÏÏÏÏÏÏÏÏÏÏÏÏÏÏÏÏÏÏÏÏÏÏÏÏÏÏÏ (75) (73)
Cash conversion cycle ÏÏÏÏÏÏÏÏÏÏÏÏÏÏÏÏÏÏÏÏÏÏÏÏÏÏÏÏÏÏÏÏÏÏÏÏÏÏÏÏÏÏÏÏÏÏÏ (36) (37)
(a) Days of sales outstanding include the effect of product costs related to customer shipments not yet recognized as revenue that are
classified in other current assets. For both periods ended October 28, 2005 and January 28, 2005, days of sales in accounts receivable
and days of customer shipment not yet recognized were 31 and 3 days and 29 and 3 days, respectively.
(b) Days supply in inventory and days in accounts payable have been calculated excluding $338 million of other product charges for the
period ended October 28, 2005. If these product charges were included, as of October 28, 2005, days supply in inventory would have
been 4 days and days in accounts payable would have been (72) days.
Production materials inventory increased as compared to the fourth quarter of fiscal 2005 contributing to thegrowth in the average number of days in inventory as well as the increase in the days in accounts payable.
We defer the cost of revenue associated with customer shipments not yet recognized as revenue until they aredelivered. These deferred costs are included in our reported days of sales outstanding because we believe itpresents a more accurate presentation of our days of sales outstanding and cash conversion cycle. Thesedeferred costs are recorded in other current assets and totaled $446 million and $430 million as of October 28,2005 and January 28, 2005, respectively.
Investing Activities Ì Cash provided by investing activities for the nine month period ended October 28, 2005was $3.4 billion, compared to cash used in investing activities of $662 million for the same period last year.Cash provided by and used in investing activities principally consists of net maturities and sales or purchases ofinvestments and capital expenditures for property, plant and equipment. During the nine month period endedOctober 28, 2005, we re-invested a lower amount of proceeds from maturities and sales of investments to buildliquidity for share repurchases, which totaled $5.3 billion for the first nine month period of fiscal 2006 ascompared to $3.3 billion to the same period last year.
17

Financing Activities Ì Cash used in financing activities during the nine month period ended October 28, 2005was $4.5 billion, compared to $2.9 billion during the same period last year. Financing activities primarilyconsist of the repurchase of our common stock, partially offset by proceeds from the issuance of common stockunder employee stock plans and other items. The year-over-year increase in cash used in financing activities isdue primarily to the increase in share repurchases of 138 million shares at an aggregate cost of $5.3 billionduring the nine month period ended October 28, 2005, compared to 97 million shares at an aggregate cost of$3.3 billion in the same period last year.
We typically generate annual cash flows from operating activities in amounts greater than net income, drivenmainly by our efficient cash conversion cycle, the growth in accrued service liabilities and deferred revenue,and noncash depreciation and amortization expenses. We currently believe that our fiscal 2006 cash flowsfrom operations will exceed net income and be more than sufficient to support our operations and capitalrequirements. We currently anticipate that we will continue to utilize our strong liquidity and cash flows fromoperations to repurchase our common stock, make capital investments, and fund DFS's operations.
Capital Commitments
Share Repurchases Ì We have a share repurchase program that authorizes us to purchase common stock toreturn cash to stockholders and manage dilution resulting from shares issued under our employee stock plans.The number of authorized shares available for repurchase is 1.5 billion and the aggregate dollar amountauthorized to be spent is $30 billion. We expect to repurchase shares of common stock through a systematicprogram of open market purchases. During the three and nine month periods ended October 28, 2005, werepurchased 41 and 138 million shares, respectively, at an aggregate cost of over $1.4 billion and $5.3 billion.See ""Part II Ì Item 2 Ì Unregistered Sales of Equity Securities and Use of Proceeds.'' We evaluate ourshare repurchase program quarterly and expect future share repurchases during the fourth quarter of fiscal2006 to be at least $1.7 billion.
Capital Expenditures Ì We spent approximately $507 million on property, plant, and equipment during thenine month period ended October 28, 2005, driven in part by the construction of our North Carolina plant.Product demand and mix, as well as ongoing investments in operating and information technology infrastruc-ture, influence the level and prioritization of our capital expenditures. Capital expenditures for all of fiscal2006 are currently expected to be approximately $750 million.
Restricted Cash Ì Pursuant to the joint venture agreement between Dell and CIT, Dell is required tomaintain certain escrow cash accounts that are held as recourse reserves for credit losses, performance feedeposits related to our private label credit card and deferred servicing revenue. Accordingly, $497 million and$438 million in restricted cash is included in other current assets as of October 28, 2005 and January 28, 2005,respectively.
Contractual Cash Obligations
Operating Leases Ì We lease property and equipment, manufacturing facilities, and office space under non-cancelable leases. Certain leases obligate us to pay taxes, maintenance, and repair costs. Our future operatinglease commitments increased from $257 million at January 28, 2005 to $304 million at October 28, 2005primarily due to the expansion of our call centers.
Purchase Obligations Ì Our purchase obligations increased from $107 million at January 28, 2005 toapproximately $365 million at October 28, 2005, largely due to commitments entered into in connection withthe construction of our new North Carolina manufacturing facility and facilities in Oklahoma, Canada,Philippines and Xiamen.
New Accounting Pronouncements
In December 2004, the FASB issued SFAS No. 123 (revised 2004) (""SFAS No. 123(R)''), Share-BasedPayment, which replaced SFAS No. 123, Accounting for Stock-Based Compensation, and supersededAccounting Principles Board Opinion No. 25, Accounting for Stock Issued to Employees. SFAS No. 123(R)requires all share-based payments to employees, including grants of employee stock options, to be recognizedin the financial statements based on their fair values. The pro forma disclosures previously permitted underSFAS No. 123 will no longer be an alternative to financial statement recognition. Under SFAS No. 123(R),we must determine the appropriate fair value method to be used for valuing share-based payments, theamortization method of compensation cost and the transition method to be used at the date of adoption.
18
In April 2005, the Securities Exchange Commission (""SEC'') amended Rule 401(a) of Regulation S-X todelay the effective date for compliance with SFAS No. 123(R). Based on the amended rule, we are requiredto adopt SFAS No. 123(R) beginning with our fiscal year 2007. We are evaluating the requirements ofSFAS No. 123(R) and expect the adoption of SFAS No. 123(R) will have a material effect on our results ofoperations and earnings per share. We have not yet determined our method of adoption of SFAS No. 123(R).See Note 3, ""Earnings Per Common Share and Pro Forma Effects of Stock-Based Compensation'' for theimpact on net income and earnings per share as if we had applied the fair value recognition provisions ofSFAS No. 123.
Additional Financial Measures for Year-Over-Year Comparison
This report includes additional financial measures of gross margin, operating expenses, operating income, andearnings per share that are intended to provide a more complete understanding of our operational perform-ance. These measures have been adjusted to exclude $442 million of third quarter charges including estimatedwarranty costs of servicing or replacing OptiPlexTM systems, workforce realignment, product rationalizations,excess facilities and a write-off of goodwill. Management believes that these additional measures provideanother basis for which year-over-year operating performance comparisons can be made. The presentation ofthis additional information is not meant to be a substitute for financial statements prepared in accordance withgenerally accepted accounting principles in the United States.
Factors Affecting Dell's Business and Prospects
There are many factors that affect our business and the results of our operations, some of which are beyondour control. Actual results in future periods could differ materially from those projected in our forward-lookingstatements because of a number of risks and uncertainties, including general economic, business and industryconditions; the level and intensity of competition in the technology industry and the pricing pressures that haveresulted; local economic and labor conditions, political instability, unexpected regulatory changes, tradeprotection measures, changes in tax laws; fluctuations in foreign currency exchange rates; the ability toaccurately predict product, customer and geographic sales mix; the ability to timely and effectively manageperiodic product transitions; reliance on third-party suppliers for product components, including dependenceon several single-source supplier relationships; the failure to attract and retain qualified personnel; the abilityto effectively manage operating costs; the level of demand for the products and services we offer; the ability tomanage inventory levels to minimize excess inventory, declining inventory values and obsolescence; and theeffect of armed hostilities, terrorism, natural disasters and public health issues on the global economygenerally, on the level of demand for our products and services and on our ability to manage our supply anddelivery logistics in such an environment. For a discussion of these and other factors affecting our business andprospects, see ""Item 1 Ì Business Ì Factors Affecting Dell's Business and Prospects'' in our Annual Reporton Form 10-K for the fiscal year ended January 28, 2005.
ITEM 3. Quantitative and Qualitative Disclosures About Market Risk
For a description of Dell's market risks, see ""Item 7 Ì Management's Discussion and Analysis of FinancialCondition and Results of Operations Ì Market Risk'' in Dell's Annual Report on Form 10-K for the fiscalyear ended January 28, 2005. Dell's exposure to market risks has not changed materially from the descriptionin the Annual Report on Form 10-K.
ITEM 4. Controls and Procedures
Evaluation of Disclosure Controls and Procedures Ì Dell's Chief Executive Officer and Chief FinancialOfficer, after evaluating the effectiveness of Dell's disclosure controls and procedures (as defined inRule 13a-15(e) or 15d-15(e) under the Exchange Act) as of the end of the period covered by this report,have concluded that, based on the evaluation of these controls and procedures, Dell's disclosure controls andprocedures were effective.
Changes in Internal Control Over Financial Reporting Ì Dell's management, with the participation of Dell'sChief Executive Officer and Chief Financial Officer, has evaluated whether any change in Dell's internalcontrol over financial reporting occurred during the third quarter of fiscal 2006. Based on that evaluation,management concluded that there has been no change in Dell's internal control over financial reporting duringthe third quarter of fiscal 2006 that has materially affected, or is reasonably likely to materially affect, Dell'sinternal control over financial reporting.
19

PART II Ì OTHER INFORMATION
ITEM 1. Legal Proceedings
Dell is subject to various legal proceedings and claims arising in the ordinary course of business. Dell'smanagement does not expect that the outcome in any of these legal proceedings, individually or collectively,will have a material adverse effect on Dell's financial condition, results of operations, or cash flows.
ITEM 2. Unregistered Sales of Equity Securities and Use of Proceeds
Dell has a share repurchase program that authorizes it to purchase shares of common stock in order to bothdistribute cash to stockholders and manage dilution resulting from shares issued under Dell's equitycompensation plans. As of October 28, 2005, Dell's share repurchase program authorized the purchase of upto 1.5 billion shares of common stock at an aggregate cost not to exceed $30 billion. The following are detailsof repurchases under this program for the period covered by this report:
Total MaximumNumber of Number of
Shares Shares thatRepurchased May Yet Beas Part of Repurchased
Total Number Average Publicly Under theof Shares Price Paid Announced Announced
Period Repurchased(a) per Share Plans Plans
(in millions, except average price paid per share)
Repurchases from July 30, 2005 throughAugust 26, 2005 ÏÏÏÏÏÏÏÏÏÏÏÏÏÏÏÏÏÏÏ 18 $36.76 18 212
Repurchases from August 27, 2005through September 23, 2005 ÏÏÏÏÏÏÏÏÏ 8 $34.61 8 204
Repurchases from September 24, 2005through October 28, 2005 ÏÏÏÏÏÏÏÏÏÏÏ 15 $33.06 15 189
TotalÏÏÏÏÏÏÏÏÏÏÏÏÏÏÏÏÏÏÏÏÏÏÏÏÏÏÏÏÏÏÏ 41 $34.93 41
(a) All shares were purchased in open-market transactions. Dell's share repurchase program was announced on February 20, 1996; up to
1.5 billion shares of common stock at an aggregate cost not to exceed $30 billion are currently authorized to be purchased.
ITEM 6. Exhibits
(a) Exhibits Ì See Index to Exhibits below.
20

SIGNATURE
Pursuant to the requirements of the Securities Exchange Act of 1934, the registrant has duly caused thisreport to be signed on its behalf by the undersigned thereunto duly authorized.
DELL INC.
Date: November 28, 2005 /s/ JOAN S. HOOPER
Joan S. HooperVice President, Corporate Finance and
Chief Accounting Officer(On behalf of the registrant and as
principal accounting officer)
21

INDEX TO EXHIBITS
ExhibitNo. Description of Exhibit
3.1 Ì Restated Certificate of Incorporation, filed July 24, 2003 (incorporated by reference to Exhibit 3.2of Dell's Quarterly Report on Form 10-Q for the fiscal quarter ended August 1, 2003, CommissionFile No. 0-17017)
3.2 Ì Restated Bylaws, as adopted on July 18, 2003 (incorporated by reference to Exhibit 3.3 of Dell'sQuarterly Report on Form 10-Q for the fiscal quarter ended August 1, 2003, Commission FileNo. 0-17017)
4.1 Ì Rights Agreement, dated as of November 29, 1995 (incorporated by reference to Exhibit 4 ofDell's Current Report on Form 8-K filed on November 30, 1995, Commission File No. 0-17017)
4.2 Ì Indenture, dated as of April 27, 1998, between Dell Computer Corporation and Chase Bank ofTexas, National Association (incorporated by reference to Exhibit 99.2 of Dell's Current Reporton Form 8-K filed April 28, 1998, Commission File No. 0-17017)
4.3 Ì Officers' Certificate pursuant to Section 301 of the Indenture establishing the terms of Dell's6.55% Senior Notes Due 2008 (incorporated by reference to Exhibit 99.3 of Dell's Current Reporton Form 8-K filed April 28, 1998, Commission File No. 0-17017)
4.4 Ì Officers' Certificate pursuant to Section 301 of the Indenture establishing the terms of Dell's7.10% Senior Debentures Due 2028 (incorporated by reference to Exhibit 99.4 of Dell's CurrentReport on Form 8-K filed April 28, 1998, Commission File No. 0-17017)
4.5 Ì Form of Dell's 6.55% Senior Notes Due 2008 (incorporated by reference to Exhibit 99.5 of Dell'sCurrent Report on Form 8-K filed April 28, 1998, Commission File No. 0-17017)
4.6 Ì Form of Dell's 7.10% Senior Debentures Due 2028 (incorporated by reference to Exhibit 99.6 ofDell's Current Report on Form 8-K filed April 28, 1998, Commission File No. 0-17017)
31.1‰ Ì Certification of Kevin B. Rollins, President and Chief Executive Officer, pursuant toRule 13a-14(a) under the Securities Exchange Act of 1934
31.2‰ Ì Certification of James M. Schneider, Senior Vice President and Chief Financial Officer, pursuantto Rule 13a-14(a) under the Securities Exchange Act of 1934
32.1‰‰ Ì Certifications of Kevin B. Rollins, President and Chief Executive Officer, and James M.Schneider, Senior Vice President and Chief Financial Officer, pursuant to 18 U.S.C. Section 1350
‰ Filed herewith.
‰‰ Furnished herewith.
EXHIBIT 31.1
CERTIFICATION OF KEVIN B. ROLLINS, PRESIDENT AND CHIEF EXECUTIVE OFFICER, PURSUANT TO RULE 13a-14(a) UNDER
THE SECURITIES EXCHANGE ACT OF 1934
I, Kevin B. Rollins, certify that:
1. I have reviewed this Quarterly Report on Form 10-Q of Dell Inc.;
2. Based on my knowledge, this report does not contain any untrue statement of a material fact or omit to state a material fact necessary to make the statements made, in light of the circumstances under which such statements were made, not misleading with respect to the period covered by this report;
3. Based on my knowledge, the financial statements, and other financial information included in this report, fairly present in all material respects the financial condition, results of operations and cash flows of the registrant as of, and for, the periods presented in this report;
4. The registrant’s other certifying officer(s) and I are responsible for establishing and maintaining disclosure controls and procedures (as defined in Exchange Act Rules 13a-15(e) and 15d-15(e)) and internal control over financial reporting (as defined in Exchange Act Rules 13a-15(f) and 15d-15(f)) for the registrant and have:
(a) Designed such disclosure controls and procedures, or caused such disclosure controls and procedures to be designed under our supervision, to ensure that material information relating to the registrant, including its consolidated subsidiaries, is made known to us by others within those entities, particularly during the period in which this report is being prepared;
(b) Designed such internal control over financial reporting, or caused such internal control over financial reporting to be designed under our supervision, to provide reasonable assurance regarding the reliability of financial reporting and the preparation of financial statements for external purposes in accordance with generally accepted accounting principles;
(c) Evaluated the effectiveness of the registrant’s disclosure controls and procedures and presented in this report our conclusions about the effectiveness of the disclosure controls and procedures, as of the end of the period covered by this report based on such evaluation; and
(d) Disclosed in this report any change in the registrant’s internal control over financial reporting that occurred during the registrant’s most recent fiscal quarter that has materially affected, or is reasonably likely to materially affect, the registrant’s internal control over financial reporting; and
5. The registrant’s other certifying officer(s) and I have disclosed, based on our most recent evaluation of internal control over financial reporting, to the registrant’s auditors and the audit committee of registrant’s board of directors (or persons performing the equivalent functions):
(a) All significant deficiencies and material weaknesses in the design or operation of internal control over financial reporting which are reasonably likely to adversely affect the registrant’s ability to record, process, summarize and report financial information; and
(b) Any fraud, whether or not material, that involves management or other employees who have a significant role in the registrant’s internal control over financial reporting.
/s/ KEVIN B. ROLLINSDate: November 28, 2005
Kevin B. Rollins President and Chief Executive Officer

EXHIBIT 31.2
CERTIFICATION OF JAMES M. SCHNEIDER, SENIOR VICE PRESIDENT AND CHIEF FINANCIAL OFFICER, PURSUANT TO RULE 13a-14(a) UNDER
THE SECURITIES EXCHANGE ACT OF 1934
I, James M. Schneider, certify that:
1. I have reviewed this Quarterly Report on Form 10-Q of Dell Inc.;
2. Based on my knowledge, this report does not contain any untrue statement of a material fact or omit to state a material fact necessary to make the statements made, in light of the circumstances under which such statements were made, not misleading with respect to the period covered by this report;
3. Based on my knowledge, the financial statements, and other financial information included in this report, fairly present in all material respects the financial condition, results of operations and cash flows of the registrant as of, and for, the periods presented in this report;
4. The registrant’s other certifying officer(s) and I are responsible for establishing and maintaining disclosure controls and procedures (as defined in Exchange Act Rules 13a-15(e) and 15d-15(e)) and internal control over financial reporting (as defined in Exchange Act Rules 13a-15(f) and 15d-15(f)) for the registrant and have:
(a) Designed such disclosure controls and procedures, or caused such disclosure controls and procedures to be designed under our supervision, to ensure that material information relating to the registrant, including its consolidated subsidiaries, is made known to us by others within those entities, particularly during the period in which this report is being prepared;
(b) Designed such internal control over financial reporting, or caused such internal control over financial reporting to be designed under our supervision, to provide reasonable assurance regarding the reliability of financial reporting and the preparation of financial statements for external purposes in accordance with generally accepted accounting principles;
(c) Evaluated the effectiveness of the registrant’s disclosure controls and procedures and presented in this report our conclusions about the effectiveness of the disclosure controls and procedures, as of the end of the period covered by this report based on such evaluation; and
(d) Disclosed in this report any change in the registrant’s internal control over financial reporting that occurred during the registrant’s most recent fiscal quarter that has materially affected, or is reasonably likely to materially affect, the registrant’s internal control over financial reporting; and
5. The registrant’s other certifying officer(s) and I have disclosed, based on our most recent evaluation of internal control over financial reporting, to the registrant’s auditors and the audit committee of registrant’s board of directors (or persons performing the equivalent functions):
(a) All significant deficiencies and material weaknesses in the design or operation of internal control over financial reporting which are reasonably likely to adversely affect the registrant’s ability to record, process, summarize and report financial information; and
(b) Any fraud, whether or not material, that involves management or other employees who have a significant role in the registrant’s internal control over financial reporting.
/s/ JAMES M. SCHNEIDERDate: November 28, 2005
James M. Schneider Senior Vice President and Chief Financial Officer
EXHIBIT 32.1
CERTIFICATIONS OF KEVIN B. ROLLINS, PRESIDENT AND CHIEF EXECUTIVE OFFICER, AND JAMES M. SCHNEIDER, SENIOR VICE PRESIDENT
AND CHIEF FINANCIAL OFFICER, PURSUANT TO 18 U.S.C. SECTION 1350
The undersigned officers of Dell Inc. hereby certify that (a) Dell’s Quarterly Report on Form 10-Q for the quarter ended October 28, 2005, as filed with the Securities and Exchange Commission, fully complies with the requirements of Section 13(a) of the Securities Exchange Act of 1934 and (b) information contained in the report fairly presents, in all material respects, the financial condition and results of operations of Dell.
/s/ KEVIN B. ROLLINSDate: November 28, 2005
Kevin B. Rollins President and Chief Executive Officer Dell Inc.
/s/ JAMES M. SCHNEIDER
Date: November 28, 2005 James M. Schneider
Senior Vice President and Chief Financial Officer Dell Inc.