forex analysis and money management
TRANSCRIPT
Forex Analysis and Money Management
Interactive Qualifying Project
Submitted to the Faculty
of the
WORCESTER POLYTECHNIC INSTITUTE
in partial fulfillment of the requirements for the
Degree of Bachelor of Science
Submitted by:
Kimberly Maciejczyk
Xianjing Hu
Advisor:
Professor Hossein Hakim
March 8, 2012
ii
Abstract
In this paper we cover the technical and fundamental aspects of Forex analysis and the
development of our own money management and risk assessment system. We also show the
inner aspects of a money management company including the legal structure, licenses needed,
performance measurement and marketing aspects. Finally, we explored possibilities of auto-
trading and provided documentation for an indicator and an expert adviser developed in MQL4.
iii
Table of Contents
Abstract....................................................................................................................................................... ii
Table of Figures ......................................................................................................................................... vii
1. Introduction ............................................................................................................................................ 1
1.1 Introduction ....................................................................................................................................... 1
1.2 Project Description............................................................................................................................ 3
2. Background ............................................................................................................................................. 5
2.1 Different Markets .............................................................................................................................. 5
2.2 History of the Forex Market .............................................................................................................. 8
2.3 Understanding the Forex Market ....................................................................................................... 9
3. Methodology ......................................................................................................................................... 11
3.1 Background Research ..................................................................................................................... 11
3.2 Fundamental Analysis ..................................................................................................................... 11
3.3 Technical Analysis .......................................................................................................................... 11
3.4 Practical Trading in MT4 ................................................................................................................ 12
3.5 Learning and Writing MQL4 Indicators and Robots ....................................................................... 12
3.6 Money / Risk Management ............................................................................................................. 12
3.7 Researching the Launch of a Money Management Company ......................................................... 13
4. Project Execution .................................................................................................................................. 14
4.1 Learning to Trade ............................................................................................................................ 14
4.1.1 Fundamental Analysis .............................................................................................................. 14
4.1.1.1 The Gartman Letter ........................................................................................................... 15
4.1.1.2 Important Websites ........................................................................................................... 15
4.1.1.3 Interest Rates ..................................................................................................................... 16
4.1.1.5 GDP .................................................................................................................................. 18
4.1.1.6 Unemployment .................................................................................................................. 19
4.1.1.7 Inflation ............................................................................................................................. 20
4.1.2 Technical Indicators ................................................................................................................. 21
4.1.2.1 Forex Support and Resistance Indicators........................................................................... 22
4.1.2.1.1 Fibonacci Indicator ..................................................................................................... 22
4.1.2.1.2 Forex Pivot Point ........................................................................................................ 24
iv
4.1.2.1.3 Bollinger Bands Indicator........................................................................................... 25
4.1.2.2 Three Popular Indicators ................................................................................................... 27
4.1.2.2.1 200 Day Exponential Moving Average ...................................................................... 27
4.1.2.2.2 Stochastic Oscillator ................................................................................................... 29
4.1.2.2.3 MACD ........................................................................................................................ 31
4.1.3 Lessons Learned ....................................................................................................................... 34
4.1.4 Psychology of Trading ............................................................................................................. 35
4.2 Implementing our Trading Plan .......................................................................................................... 36
4.2.1 Selecting a Platform ..................................................................................................................... 36
4.2.2 Trading Resources ....................................................................................................................... 37
4.2.3 Risk Management ........................................................................................................................ 38
4.3 Trading Summary and Results ............................................................................................................ 39
4.3.1 Kimberly‘s Trading Summary and Results .................................................................................. 39
4.3.2 Xianjing‘s Trading Summary and Results .................................................................................... 39
4.4 Money / Risk Management ................................................................................................................. 40
4.4.1 Account Information: ................................................................................................................... 40
4.4.2 Trading Information: .................................................................................................................... 40
4.4.3 Trading Time Frame: ................................................................................................................... 41
4.4.4 Risk Management ........................................................................................................................ 41
4.5 Launching a Money Management Company....................................................................................... 42
4.5.1 Legal Structure ............................................................................................................................. 42
4.5.2 Off-Shore or On-Shore Accounts ................................................................................................. 45
4.5.2.1 Advantages for Investment Off-Shore ................................................................................... 45
4.5.2.2 Disadvantages of Off-Shore Investment ................................................................................ 46
4.5.3 Money Management .................................................................................................................... 47
4.5.3.1 General money management options .................................................................................... 47
4.5.3.2 Money and Risk Management of our Forex Money Management Company ........................ 48
4.5.4 Licensing...................................................................................................................................... 50
4.5.4.1 FSB Licensing - Forex Broker License ................................................................................. 50
4.5.4.4 Series 3 License .................................................................................................................... 50
4.5.4.5 Series 65 License .................................................................................................................. 51
4.5.4.4 Series 34 License .................................................................................................................. 51
v
4.5.5 Regulations and Organizations ..................................................................................................... 51
4.5.5.1 Commodities Futures Trading Commission – CFTC ............................................................ 51
4.5.5.2 National Futures Association – NFA .................................................................................... 52
4.5.5.3 FAIS Act ............................................................................................................................... 54
4.5.5.4 FIA Act ................................................................................................................................. 55
4.5.6 Performance Measurement ........................................................................................................... 55
4.5.6.1 Alpha ..................................................................................................................................... 56
4.5.6.2 Beta ....................................................................................................................................... 56
4.5.6.3 R-Squared ............................................................................................................................. 57
4.5.6.4 Standard Deviation ................................................................................................................ 57
4.5.6.5 Sharpe Ratio .......................................................................................................................... 57
4.5.7 Marketing ..................................................................................................................................... 58
4.5.7.1 Build a Website ..................................................................................................................... 58
4.5.7.2 Forex Advertising Agency .................................................................................................... 59
4.5.7.3 Reputation and Reviews: Serve the Current Customer Well! ................................................ 59
5. Programming Project ............................................................................................................................ 60
5.1 The Automation of the Silver Trend Indicator ................................................................................ 60
5.1.1 Initial Idea ................................................................................................................................ 60
5.1.2 Implementation and Back Testing ............................................................................................ 61
5.1.3 First Improvement: Adding Trend Condition ........................................................................... 63
5.1.4 Second Improvement: Adding RSI Condition .......................................................................... 64
5.1.5 Third Improvement: Stop Trading When Losing Consecutively .............................................. 64
5.1.5.1 Motivation ......................................................................................................................... 64
5.1.5.2 Hand-Analysis of the Algorithm ....................................................................................... 65
5.1.5.3 Implementation of the Algorithm ...................................................................................... 66
5.1.6 Final Improvement ................................................................................................................... 66
5.1.7 Analysis of Silver Trend Indicator Code .................................................................................. 67
5.2 Spread Indicator .............................................................................................................................. 70
5.2.1 How to Use It ........................................................................................................................... 70
5.2.2 Code Analysis and Explanation ............................................................................................... 72
6. Conclusions and Recommendations ...................................................................................................... 73
6.1 Conclusions ..................................................................................................................................... 73
vi
6.2 Recommendations for Professor Hakim .......................................................................................... 74
6.3 Recommendations for New Traders ................................................................................................ 74
Bibliography ............................................................................................................................................. 76
Appendixes ............................................................................................................................................... 85
Gartman Letter Reviews ....................................................................................................................... 85
Overview of Macroeconomic Issues during the Project ........................................................................ 99
Our Trades .......................................................................................................................................... 104
Kimberly‘s Trades .......................................................................................................................... 104
Xianjing‘s Trades ............................................................................................................................ 107
Silver Trend Indicator Code ................................................................................................................ 122
Spread Indicator Code......................................................................................................................... 127
vii
Table of Figures
Figure 1. Demonstrating Fibonacci Indicator (September 28, 2011, MT4, EURUSD, M5) ...................... 22
Figure 2. Demonstrating Forex Pivot Point Indicator (September 28, 2011, MT4, EURUSD, H1) .......... 25
Figure 3. Demonstrating Bollinger Bands Indicator (September 28, 2011, MT4, EURUSD, H1) ............ 26
Figure 4. EMA Demonstration (September 28, 2011, MT4, EURUSD, H1) ............................................ 27
Figure 5. EMA Demonstration: Inaccurate Application (September 28, 2011, MT4, EURUSD, H4) ...... 28
Figure 6. Stochastic Indicator Demonstration (September 28, 2011, MT4, EURUSD, M1) ..................... 29
Figure 7. MACD Demonstration............................................................................................................... 34
Figure 8. Silver Trend Robot Backtest Result ........................................................................................... 40
Figure 9. Silver Trend Auto Trading Program Back Test 1 ...................................................................... 62
Figure 10. Silver Trend Auto Trading Program Back Test 2 .................................................................... 62
Figure 11. Consecutive Losses in Back Test ............................................................................................. 65
Figure 12. Back Test Result With and Without the Consecutive Loss Algorithm ..................................... 65
1. Introduction
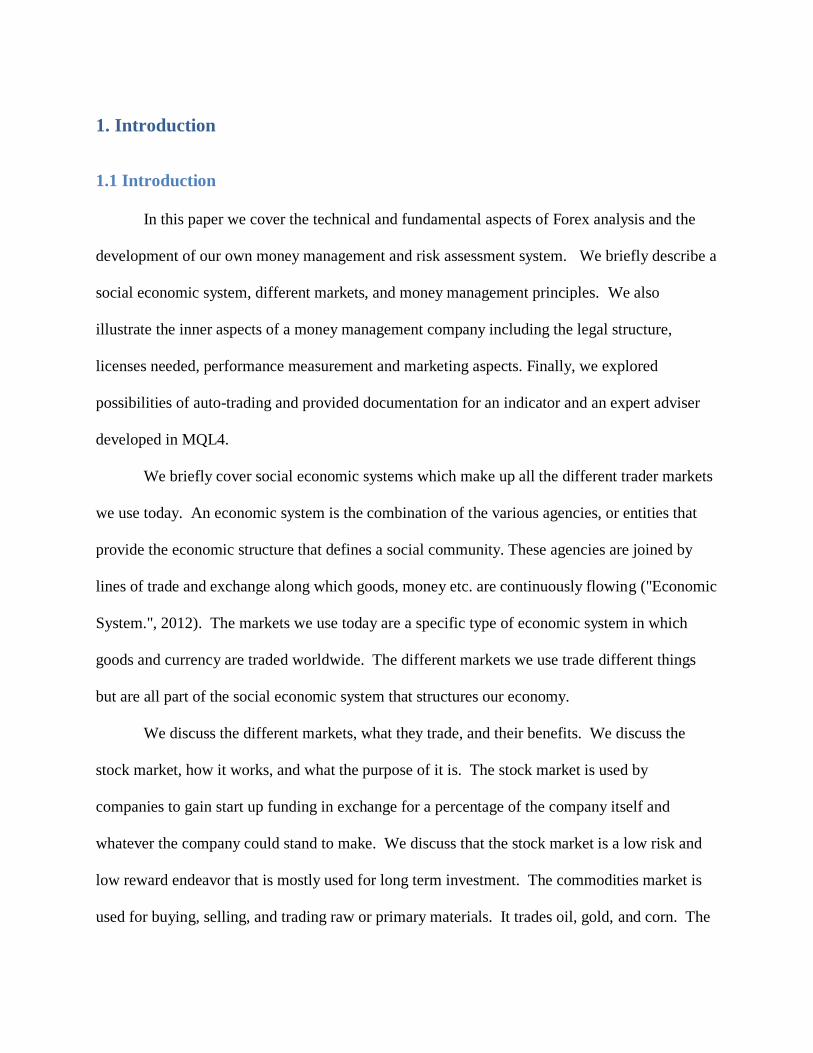
1.1 Introduction
In this paper we cover the technical and fundamental aspects of Forex analysis and the
development of our own money management and risk assessment system. We briefly describe a
social economic system, different markets, and money management principles. We also
illustrate the inner aspects of a money management company including the legal structure,
licenses needed, performance measurement and marketing aspects. Finally, we explored
possibilities of auto-trading and provided documentation for an indicator and an expert adviser
developed in MQL4.
We briefly cover social economic systems which make up all the different trader markets
we use today. An economic system is the combination of the various agencies, or entities that
provide the economic structure that defines a social community. These agencies are joined by
lines of trade and exchange along which goods, money etc. are continuously flowing ("Economic
System.", 2012). The markets we use today are a specific type of economic system in which
goods and currency are traded worldwide. The different markets we use trade different things
but are all part of the social economic system that structures our economy.
We discuss the different markets, what they trade, and their benefits. We discuss the
stock market, how it works, and what the purpose of it is. The stock market is used by
companies to gain start up funding in exchange for a percentage of the company itself and
whatever the company could stand to make. We discuss that the stock market is a low risk and
low reward endeavor that is mostly used for long term investment. The commodities market is
used for buying, selling, and trading raw or primary materials. It trades oil, gold, and corn. The
2
purpose of the commodities market is to allow businesses to plan ahead by setting the price of
commodities in advance. This means that farmers will know the price their goods will go for
when they bring them to market. It also means that other businesses, like airlines, will know
how much gas will cost before they sell tickets to passengers. We also discuss how to trade in
the commodities market, and how it works. We go into further depth with the forex market, as
this was the market we chose to trade in. We discuss how to trade in the forex market, all of the
currencies that make up the forex market, and how volatile the forex market can be. We
emphasize that this market is very difficult to make a profit in, but can be the most rewarding.
We cover the benefits and pitfalls of each market, and why we chose the forex market over the
others.
We also researched money and risk management principles and worked out our own
money management plan. We modified our plan during the whole process of this project so that
the plan could become more and more comprehensive and less prone to large risks. We followed
our plan while we were trading to test its validity, and made improvements when necessary. The
final plan includes the details of account information, trading information, trading time frame,
risk management, and rules to follow. The important principles that we have always been
following include, always risk 2% or less of our total account, calculating risk/reward ratio
before entering a trade, always put a stop loss, etc.
During the last term of the project we investigated the details of launching a money
management company. We researched possible legal structure of the company. We had four
options. We could structure our company to be a sole-proprietorship, partnership, corporation or
Limited Liabilities Company. After comparing the benefits and drawbacks of each we decided
on a Limited Liability Company. We also analyzed the options about whether to start our

3
company off-shore or on-shore. Money management is another aspect we looked into. Important
parameters that are related to the money management of the company include accounting,
balance sheet, cash flow, financing, managing vision, and crisis/disaster management. We also
looked at licenses required for starting the company. We mainly researched the Financial
Services Board – (FSB) licensing, Series 3 license, and Series 4 license which are all required for
becoming a financial advisor ("Financial Advisor Is FSB Licensed", 2012). We also investigated
different ways of doing performance measurement. Existing parameters include Alpha index,
beta coefficient, R-squared, Standard deviation, and Sharpe Ratio. At last, we thought about
possible ways of marketing our company. Although there are very strict regulations as to how
and if we can advertise a money management company, we still came up with a few ways to
market our company, including building a website, seeking a forex advertising agency, and most
importantly, building a good reputation among customers.
Another important part of our project is the development of the customized indicators and
expert advisors in MT4 using MQL4. We learned the language from scratch, and at the end of
the project we completed one indicator and one robot. The spread indicator displays the spread of
a currency pair at the current time in the corner of the chart. The Silver Trend robot uses the
Silver Trend indicator to automatically carry out trades that when back-tested, proved to be
profitable. The development process of the indicator and the robot is documented in this report.
1.2 Project Description
During this three-term project we investigated different aspects of forex trading,
investment, money and business management. During A term we focused on researching the
background of forex market, forex terminologies, fundamental and technical analysis and began
simulation trading in MT4. In B term we continued practicing trading using the techniques we

4
learned, and we also began learning MQL4 programming to create indicators and robots
ourselves. We also sharpened our money and risk management skills. In C term we explored
different aspects of launching our own money management company. This includes the
investigation of the required licenses, performance measurement, legal structure, marketing, etc.

5
2. Background
2.1 Different Markets
The stock market is a market of stock. Stock is divided into shares which are literally
small shares in the ownership of a company (Ross, 2012). So the stock market is a market
comprised of companies that want to sell off portions of their company for money. Companies
can sell stock to help cover the start up costs of opening a business. It could also borrow money
which is known as ‗debt financing‘ but then the company has to pay back the money with
interest. However, if a company chooses to sell stock there is no interest to pay and no
requirement to even pay the money back at all. There is the added benefit that if the company
fails, it isn‘t money out of the company‘s pocket, but out of several thousand other people‘s
pockets (Ross, 2012). Once someone buys a stock they are entitled to a small fraction of the
assets and earnings of that company. The assets of a company include everything the company
owns including buildings equipment and trademarks (Ross, 2012). Earnings are all of the money
the company brings in from selling its products and services (Ross, 2012). So when someone
invests in a company and the profits of that company rise, the stock goes up and the buyer of the
stock makes a profit. The stock market is a very long term investment, with a small profit
margin. However, a small profit margin means that there is less risk. While it is possible to lose
all your money in the stock market, it is significantly less likely than other forms of investment,
such as the Forex market.
There are other forms of investing as well. The commodities market is a virtual
marketplace for buying, selling, and trading raw or primary products ("Commodity Market",
2012). This means the commodities market sells anything from corn to oil to gold. The purpose
6
of the commodities market is so that farmers and other businesses can know the price of a
commodity beforehand so they can plan ahead. For farmers, they need to know what their goods
will sell for before they are produced as they need to take out money to produce that product.
Airlines likewise need to know the price of oil ahead of time so they can set the rates for flights.
There are many ways to invest in commodities. An investor can purchase stock in corporations
whose business relies on commodities prices, or purchase mutual funds, index funds or
exchange-traded funds (ETFs) that have a focus on commodities-related companies
("Commodity Market", 2012). The most direct way of investing in commodities is by buying
into a futures contract. Mutual funds are an investment vehicle that is made up of a pool of funds
collected from many investors for the purpose of investing in securities such as stocks, bonds,
money market instruments and similar assets ("Mutual Fund", 2012). Index funds are a type of
mutual fund with a portfolio constructed to match or track the components of a market index,
such as the Standard & Poor's 500 Index (S&P 500). An index mutual fund is said to provide
broad market exposure, low operating expenses and low portfolio turnover ("Index Fund", 2012).
ETFs are a security that tracks an index, a commodity or a basket of assets like an index fund,
but trades like a stock on an exchange. ETFs experience price changes throughout the day as
they are bought and sold ("Exchange-Traded Fund - ETF", 2012). Futures are a financial
contract obligating the buyer to purchase an asset and the seller to sell an asset, such as a
physical commodity, at a predetermined future date and price. Futures contracts detail the quality
and quantity of the underlying asset; they are standardized to facilitate trading on a futures
exchange. Some futures contracts may call for physical delivery of the asset, while others are
settled in cash. The futures markets are characterized by the ability to use very high leverage
relative to stock markets ("Futures" 2012). Futures can be used either to hedge or to speculate on
7
the price movement of the underlying asset. For example, a producer of corn could use futures to
lock in a certain price and reduce risk (hedge). On the other hand, anybody could speculate on
the price movement of corn by going long or short using futures ("Futures" 2012). Futures are
not as reliable as stock but some feel it is easier to predict the movement of commodities as
opposed to businesses.
The forex market is the most volatile of all the markets. Forex is an abbreviation of
foreign exchange, so the forex market is actually the foreign exchange market. It is the market in
which participants are able to buy, sell, exchange and speculate on currencies. The forex
markets is made up of banks, commercial companies, central banks, investment management
firms, hedge funds, and retail forex brokers and investors. The currency market is considered to
be the largest financial market in the world, processing trillions of dollars worth of transactions
each day ("Forex Market", 2012). This market is vitally important to any economy as it provides
the liquidity to process transactions and support currencies. This means that the thousands or
possibly millions of investors in the forex market are providing an invaluable service by allowing
economies to function. The foreign exchange market isn't dominated by a single market
exchange, but involves a global network of computers and brokers from around the
world. Central banks use their massive buying and selling capabilities to alter exchange rates
through their open market activities and in many cases will do so not with profit in mind, but
rather for any number of policy reasons. Forex brokers act as market makers as well, and may
post bid and ask prices for a currency pair that differs from the most competitive bid in the
market ("Forex Market", 2012).

8
2.2 History of the Forex Market
The foreign exchange market has existed as long as currencies have. In 1875 the birth of
the gold standard monetary came, with it came currencies. Prior to 1875, countries primarily
used gold and silver as a form of international payment. Payment using gold and silver were
hampered by their depreciation according to external factors such as an increase in the discovery
of new deposits, which would lead to a change in supply and demand. This factor would change
the Forex trading history forever ("Forex History", 2012). The aim was to standardize the
amount of gold that was allotted to a currency. Currency was now backed by gold, measured in
ounces. Countries needed large gold reserves to back the demand for currency. The price
difference of an ounce of gold between two different currencies now became the foreign
exchange rate for those two currencies. This History of Forex was changed by the birth of an
international standard by which foreign exchange could take place between countries ("Forex
History", 2012).
The gold standard monetary broke down during the start of the First World War political
turmoil with Germany forced the larger European powers to focus on military projects. This
financial drain on Europe gave way to a lack of gold to back the excess printing of currency and
changed the course of FX history. The abolishment of the gold standard monetary system left a
mess of the method of foreign exchange. This matter was a concern to the Allied countries so
they held a convention in Bretton Woods, New Hampshire. This convention led to the inception
of the Bretton Woods monetary system. The Bretton Woods monetary system allowed a new
method of obtaining a fixed foreign exchange rate. It also let the gold standard be replaced with
the US Dollar as the ultimate exchange currency. In this plan the US Dollar was supposed to be

9
the only currency backed by gold. This didn‘t last long as the U.S announced the end of the
exchange of gold for US Dollars by foreign banks on 15 August 1971 ("Forex History‖, 2012).
The forex market has made many advances from that day to what we now have. The
forex market is now almost entirely virtual, but it still determines the exchange rate between
nations. The forex market is based entirely on currencies, which have a tendency to fluctuate
wildly. This makes the forex market unpredictable and the most risky. However, the benefits of
trading in the forex market are the potential for large profits. It is easy to gain a fortune in the
forex market if you know what you‘re doing. It is also just as easy to lose everything you have
invested in the market. It is not recommended that someone have more money than they can
afford to lose invested in the forex market at one time. I always recommend that anything you
invest in the forex market, you should be prepared to lose.
2.3 Understanding the Forex Market
There are many factors that go into determining the prices of the currencies in the forex
market. We will cover most of those factors later in this paper. In order to understand the forex
market, you need to understand people. The forex market is comprised of thousands of people
all trading at once during and given part of the day. In order to make good trades, you need to
know how other people might trade. The time is also another vital role. If it is during banking
hours in the major countries there will be large companies with a large amount of money and
influence trading at the same time you are. The fact of the matter is, they want to take your
money, and will trick you if they can. Psychology is a big part of trading, and even a bigger part
of the forex market. With the currencies based of people, the prices tend to fluctuate with
people‘s emotions. If a natural disaster hits Japan, people are going to bail on the Yen, and it
will take a nosedive. Some people trade based on the news by predicting the reactions of people
10
all over the globe, but one never knows how people are going to react. Most people avoid
trading during those times because sometimes the market reacts too quickly to respond to. Big
moves in the market like this can bankrupt an account. There are many factors that go into
understanding the forex market, and even more to predict what it will do, but the main way to
understand the forex market is to understand people.
11
3. Methodology
3.1 Background Research
The first step to take when we enter into a completely new field is to do a thorough
background research, so that we can dive into the subject and become familiar with it. This is
how we approach the basics of Forex trading. During the background research period, we
attended weekly meetings with Professor Hakim, and researched aspects of forex market and
forex trading through all kinds of online tutorials. We wrote weekly report about our findings,
and presented our results to other groups. We also learned from other groups‘ research results.
3.2 Fundamental Analysis
After researching general ideas of fundamental analysis, we were introduced to the daily
Gartman Letter from which we learned the right way of thinking about fundamental analysis. We
kept an eye on important events happening around the world every day and tried to think about
them analytically. We then tried to merge the thinking habits of fundamental analysis to guide
our practical trading and observed how these events influenced the forex market. We also briefly
touched on the aspects of corporate financing. We cover fundamental analysis in more depth
later on in our project execution section.
3.3 Technical Analysis
Technical Analysis was one of the most important methods we learned during the project.
We carefully studied lots of different technical indicators, compared their advantages and
disadvantages, attached them to the charts and then observed how they gave us insights into the
movement of the currency prices. We became familiar with using technical indicators to

12
determine trends, identify overbought / oversold regions, entry / exit points, etc. The analysis
further helped us to come up with ideas of custom indicators and robots we wrote about later on.
3.4 Practical Trading in MT4
Doing research, reading tutorials and learning theories were definitely helpful and
necessary; however we couldn‘t learn real forex trading until we actually traded. We did
practical trading in MT4 using simulation accounts, which gave us the opportunity to apply what
we learned while we practiced. In the process we modified and improved our trading plans,
became more familiar with the use of different technical indicators, and gained valuable
experience on how to control our emotions when we trade. We kept records of all the important
trades we carried out so that we could learn from our mistakes.
3.5 Learning and Writing MQL4 Indicators and Robots
The MQL4 programming is a big part of our project. We learned the language from ABC
and later on wrote our own indicators and robots. The process includes tons of trial and error,
which is common for anybody learning a new programming language. At the end we finally got
something that works. We then tested it and documented it in the report.
3.6 Money / Risk Management
Our money / risk management skills were gradually developed during the whole process
of the project. We adjusted our initial plan over and over during the course of our practical
trading to make it balance between high profit and low risks. We designed the plan in a
comprehensive way, trying to take into account as many factors that might influence the results
as possible.

13
3.7 Researching the Launch of a Money Management Company
During the last stage of the project we researched a relatively new field: launching a
money management company. The research process resembles the process of the very first
background research; however, we do not have available tutorials that directly teach us the step-
by-step procedure of starting such a company, therefore we need to figure out the process by
comprehensive research ourselves. We still had weekly presentations where we can discuss with
other groups our findings and learn from each other.
14
4. Project Execution
4.1 Learning to Trade
Learning to trade is not difficult, all you have to do is push a few buttons on a computer
with a trading platform loaded and bam, a trade. Making a profit, however, is much more
difficult. To learn how to make money in the forex market, first we need to understand various
factors that influence the forex market.
4.1.1 Fundamental Analysis
The definition of fundamental analysis is ―a method of evaluating a security that
entails attempting to measure its intrinsic value by examining related economic, financial and
other qualitative and quantitative factors. Fundamental analysts attempt to study everything that
can affect the security's value, including macroeconomic factors (like the overall economy and
industry conditions) and company-specific factors (like financial condition and management).
The end goal of performing fundamental analysis is to produce a value that an investor can
compare with the security's current price, with the aim of figuring out what sort of position to
take with that security (underpriced = buy, overpriced = sell or short)‖ ("Fundamental Analysis",
2012). This means that fundamental analysis is basically looking out at the world and seeing the
potential issues that could affect currency and anticipating how these issues will affect the forex
market. There are a lot of potential issues. For example, the crisis in Greece is affecting the
entire European Monetary Union, and in response the Euro became incredibly volatile.
Fundamental analysis is essentially anticipating what people‘s reactions will be to world news
and if it will make the prices of currency go up or down. Therefore, for the Greece crisis, the
fundamental analysis would be expecting people to panic, and when people panic, things become
15
unpredictable. It would be almost impossible to predict how the price would react so perhaps
what you take away from the fundamental analysis is to not trade the Euro until things are more
stable. Fundamental analysis is all about interpretation of world events. The scope of events that
fundamental analysis attempts to study is incredibly wide. So to help pinpoint which events are
important, there are many tools to help with fundamental analysis. Such tools are the Gartman
Letter, and several important websites. There are many factors which influence the forex market
that fundamental analysis attempts to take into account and then predict the reaction in the forex
market. Such factors are interest rates, unemployment, inflation, ect.
4.1.1.1 The Gartman Letter
The Gartman Letter is a daily magazine that comes out every weekday at 6am. It is
written by Dennis Gartman, a respected figure in the trading world. Every day Mr. Gartman
goes over what has happened in the world and what it means. He breaks down the world,
political, and monetary events to basic terms and reasoning. He also offers recommendations at
the end of each letter. The Gartman Letter is an invaluable resource that is beneficial to
understanding any market.
Gartman Letter reviews can be found in the Appendix.
4.1.1.2 Important Websites
There are several important websites that help navigate the forex market.
ForexFactory.com is an excellent website that helps determine at what times news will affect the
forex market. This critical website also tells you what level of impact the news will have and on
which currencies. Overall, this website is a must have for surviving the forex market.
Another website vital to know about and use in the forex market is babypips.com. This
website has an entire tutorial for new forex traders. This website can almost single handedly
16
carry a new trader through the trial and error period of mistakes and mishaps as the new trader
gets acquainted with the forex market. This website is incredibly important to have for new
traders.
Finally, forexlive.com has proved to me at least to be of incredible importance while
trading in the forex market. This website posts live world news about the forex market and has
speculation about the implications of said news. Forexlive.com helps me to determine the news,
and more importantly, people‘s reactions to the news. I find this source of information to be
very helpful in determining fundamental analysis and possible trends in the forex market.
4.1.1.3 Interest Rates
The Forex, or foreign currency exchange, is all about money. Money from all over the
world is bought, sold and traded. On the Forex, anyone can buy and sell currency and with
possibly come out ahead in the end. When dealing with the forex market, it is possible to buy the
currency of one country, sell it and make a profit. For example, a broker might buy a Japanese
yen when the yen to dollar ratio increases, then sell the yen‘s and buy back American dollars for
a profit ("Do Interest Rates Drive the Foreign Exchange Markets?" 2011).
Interest rates are something that drives the forex market. While currency prices are what
the market is all about, interest rates have a direct affect on those prices. While economic and
political conditions are also among the things that greatly affect the Forex, there is nothing that
affects it more than interest rates. When the interest rates raise, investors will want to capitalize
high returns and you will see money flowing into the country. When one country's interest rates
rise, their currency is seen as being stronger than other currencies. This happens because
investors seek more of that currency to profit more. Otherwise, it is seen as a good event when
interest rates rise and a bad event when they fall ("Do Interest Rates Drive the Foreign Exchange
Markets?" 2011).
17
Government participation in the Forex is not an uncommon action. Sometimes
governments will flood the foreign exchange market with their own domestic currency. This
action may seem foolish to someone who knows nothing about the foreign exchange market,
however to those who know it well, it seems like a wise strategy move. When governments
flood the Forex with their own domestic currency, they are attempting to lower the price. When
they buy their own domestic currency, they are attempting to raise the price. One might know
this strategy as Central Bank intervention. Governments do this to help their overall economy.
This is a type of action that keeps the foreign exchange market strong and steady. When you
have extremely large players making appearances to keep everything as fair as possible, you
create an extremely attractive market ("Do Interest Rates Drive the Foreign Exchange Markets?"
2011).
While interest rates can drive the market for a short time, the nature of the foreign
exchange market makes it difficult for them to drive it for a long period of time. The design of
the market, with it being large in size and volume, restricts interest rates from having complete
control over the system. Many times however, experts try to figure out when interest rates will
rise or fall. The most common thing they do in order to keep up with rates is to pay attention to
economic inflation indicators to try and predict how the interest rate will change. Most of the
time however, there is a little advance notice before interest rates move ("Do Interest Rates
Drive the Foreign Exchange Markets?" 2011).
As you can see, the influences of interest rates on the foreign exchange market are
strong. They can help determine which countries' currencies are the strongest. This of course is
relative to all other currencies in the market at the time. When you think about the rise and fall
of interest rates, you can remember that when interest rates fall, it is typically a good thing for
18
investors and for domestic currency. When rates fall, it is not such a great thing. When rates stay
low for an extended period of time, the market may seem a little dull, however the great thing
about the foreign exchange market is that when government gets involved, which it usually does
at these troubled times, there is hope for improvement ("Do Interest Rates Drive the Foreign
Exchange Markets?" 2011).
4.1.1.5 GDP
To meet the needs of a growing population, an economy must expand. However, if
growth occurs too rapidly, price increases will outpace wage advances so that even if workers
earn more on average, their actual buying power decreases. Most countries target economic
growth at a rate of about 2% per year. With higher growth comes higher inflation, and in this
situation central banks typically raise interest rates to increase the cost of borrowing in an
attempt to slow spending within the economy. A change in interest rates may signal a change in
currency rates ("Effect of GDP on Forex Market?", 2011).
The simple thing that is portrayed by GDP is the way money is earned and spent on a
regular basis, which is why it has a very direct relationship to the foreign exchange rate. The
currency grows stronger when the production is high and it translates into good revenue.
However there are other factors that may lead to negative trends in the forex market ("Effect of
GDP on Forex Market?", 2011).
You may take into account the situation of GDP getting too high. This might happen due
to some factors like illegal dealings such as money laundering or criminal activity or due to huge
ransoms in the case of piracy in the high seas or kidnapping. All such effects lead to inflation and
the dollar's purchasing power is decreased, as due to these illegal dealings too much money
19
would be circulating that has not actually been earned ("Effect of GDP on Forex Market?",
2011).
This in turn would reduce the demand for the dollar and eventually force the forex rates
to come down. If the inflation persists, the federal bank might be forced to adjust interest rates in
order to regulate the situation. Whenever a federal bank becomes involved in manipulating
interest rates, the effect is immediate and effective. As discussed above, the interest rates have a
heavy impact on the forex market and would most likely counteract the inflation ("Effect of GDP
on Forex Market?", 2011).
4.1.1.6 Unemployment
Currency is directly related to economic growth, and employment levels have an
immediate impact on economic growth and therefore currency. As unemployment increases,
consumer spending falls because jobless workers have less money to spend on non-essentials.
Those still employed worry for the future and also tend to reduce spending and save more of
their income ("Top 5 Factors Affecting Exchange Rates", 2011).
An increase in unemployment signals a slowdown in the economy and possible
devaluation of a country's currency because of declining confidence and lower demand. If
demand continues to decline, the currency supply builds and further exchange rate depreciation
is likely. One of the most anticipated employment reports is the U.S. Non-Farm Payroll (NFP), a
reliable indicator of U.S. employment issued the first Friday of every month ("Top 5 Factors
Affecting Exchange Rates", 2011).
Because these reports are so anticipated, the first Friday of every month is a news day for
the forex market. This means that if a trader wants to trade with the news, they enter or exit a
trade based on the report that comes out on that day. This method of trading is mostly unreliable,
however, and can frequently get a trader into trouble.

20
4.1.1.7 Inflation
Inflation has long been a serious enemy to economic growth and the world's central
banks constantly try to keep inflation in check by adjusting monetary policy. Inflation influences
currency exchange rates significantly, and the perception of inflationary trends makes up one of
the basic items affecting central bank monetary policy ("The Impact of Inflation Measures on the
Forex Market", 2011).
Inflation can perhaps be most basically described as what results when too many dollars
start chasing too few goods. This represents an oversimplification of the issue, but it does give an
idea of the nature of inflation, which generally signals not the increase in worth of goods, but the
declining value of the paper money used to buy those goods. This of course is the effect
inflation has on the forex market ("The Impact of Inflation Measures on the Forex Market",
2011).
Deflation is the opposite of inflation; it occurs during times of recession and is a sign of
economic stagnation. Central banks often lower interest rates to boost consumer spending in
hopes of reversing this trend ("Effect of GDP on Forex Market?", 2011).
Because inflation affects all levels of society and the totality of consumers in an
economy, it makes up one of the most important economic indicators to central banks and forex
traders alike ("The Impact of Inflation Measures on the Forex Market", 2011).
In addition, many large central banks such as the U.S. Federal Reserve have an obligation
to keep inflationary forces from negatively impacting the economy. As a result, they may raise
the level of short term interest rates to contain inflation. In addition, they might lower these
same rates to counteract deflationary tendencies and to stimulate the economy by making money
easier to borrow ("The Impact of Inflation Measures on the Forex Market", 2011).
21
There are many ways of assessing inflation levels used by fundamental analysts with a
focus on the U.S. economy, as well as the impact that inflation controls can have on the forex
market ("The Impact of Inflation Measures on the Forex Market", 2011).
Central banks tend to fight inflation by adjusting interest rates as a key part of their
economic control policy. In this way, central banks indirectly affect wholesale and consumer
prices. These in turn affect the value of the nation's currency, and as a result, the level of
economic activity in the country. Inflation and interest rates try to balance each other out, but it
doesn‘t always work that way ("The Impact of Inflation Measures on the Forex Market", 2011).
Inflation has a serious impact on the foreign exchange rate as central banks adjust interest
rates to quell inflation. As we have already seen how interest rates affect the forex market, it
comes as no surprise that inflation has such a profound effect on the forex market as well.
4.1.2 Technical Indicators
Along with fundamental analysis, there are several basic tools that are vastly important to
success in the forex market. One tool that is incredibly important is technical indicators.
Technical indicators are ―any class of metrics whose value is derived from generic price activity
in a stock or asset. Technical indicators look to predict the future price levels, or simply the
general price direction, of a security by looking at past patterns. Examples of common technical
indicators include Relative Strength Index, Money Flow Index, Stochastics, MACD and
Bollinger Bands‖ ("Technical Indicator", 2012) There are millions of technical indicators, and it
is difficult to know which ones are the most beneficial. Here are some examples of technical
indicators that have helped us in the past.
22
4.1.2.1 Forex Support and Resistance Indicators
4.1.2.1.1 Fibonacci Indicator
- How to display it in MT4
In the MT4 platform, I can pull out the Fibonacci indicator under the Insert tab, then
Fibonacci -> Retracement. Then, on the chart, draw a line between a high point and a low
point for a downward trend or between a low point and a high point for an upward trend.
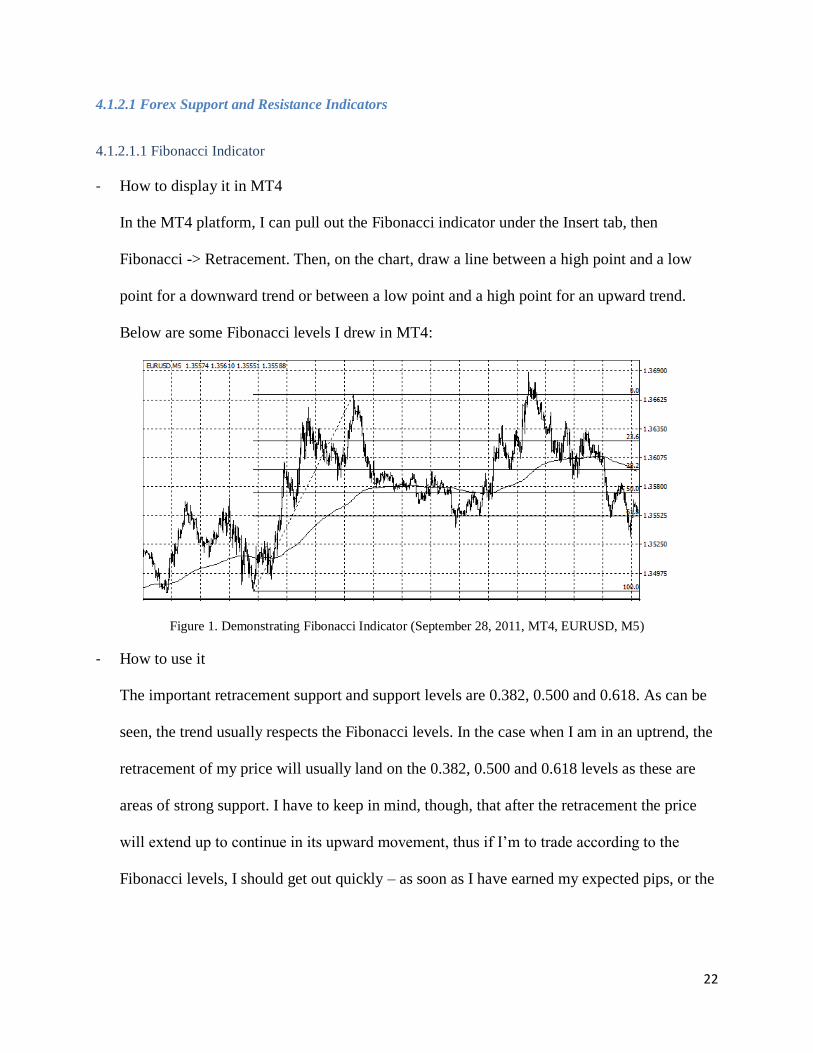
Below are some Fibonacci levels I drew in MT4:
Figure 1. Demonstrating Fibonacci Indicator (September 28, 2011, MT4, EURUSD, M5)
- How to use it
The important retracement support and support levels are 0.382, 0.500 and 0.618. As can be
seen, the trend usually respects the Fibonacci levels. In the case when I am in an uptrend, the
retracement of my price will usually land on the 0.382, 0.500 and 0.618 levels as these are
areas of strong support. I have to keep in mind, though, that after the retracement the price
will extend up to continue in its upward movement, thus if I‘m to trade according to the
Fibonacci levels, I should get out quickly – as soon as I have earned my expected pips, or the
23
trend will go back again and make me lose money. The same is true for a downward trend.
This indicator works for short-time-interval chart.
- Suggestions for myself
1) When I see the price retracing to the 0.618 level and then being repelled by it, there is a high
chance that the price will extend itself to the 1.618 level.
2) When I see the price retracing itself to the 0.500 level and then being repelled by it, there is a
high probability that I will see the price extends to the 1.500 level or even 1.618.
3) If I see the price retracing itself to the 0.382 level and then repelled by it, I will most probably
see the price extend itself to the 1.272 level and then move to the 1.382 level.
So how exactly should I use this indicator?
First of all, I need to setup either the Stochastic or RSI to help to identify whether the market is
oversold or overbought.
Next, I need to setup a MACD indicator to help I identify the right time for entry.
Once I got this 2 indicators setup, I will need to draw Fibonacci whenever I see a swing high and
a swing low. All I need to do is to wait for the price to retrace back to either one of the 3 levels
and then check my indicators for signal. If the price did not retrace but continue to move higher
or lower, I just have to remove my Fibonacci and then redraw them again with the new swing
highs or swing lows.
Whenever I see the price retracing near a level, I should check my indicators for the following
1) If I am in an uptrend and I see the price retracing back to the 0.500 level, I should check my
Stochastic indicator to see if the market is oversold or not. If it is indeed oversold, I should then
move on to see my MACD indicator and wait for the histogram to flip over to the upside again
before I enter my trade.
24
After I have entered a trade, my exit strategy is equally important. I will usually exit my trade 10
pips before the expected extension and I should always place a stop loss around 20 to 30 pips
below the level of retracement.
2) If I am in a downtrend, the conditions that are stated above shall be reversed.
If my Fibonacci retracement levels coincide with a major support or resistance level, this will
give me more strength in that level and thus increase my chance of winning.
Do not start to trade immediately with this forex Fibonacci strategy. I should always try any new
strategy out on my demo account and then move it to live only when I am able to trade profitable
with it consistently.
4.1.2.1.2 Forex Pivot Point
- How to display it in MT4
This one is a little bit complicated. Firstly, I searched online for auto pivot point calculator
for MT4 because I‘m sure that somebody has already written MQL code for the pivot points.
I was able to find one at http://www.forexfactory.com/showthread.php?t=3946. I unzipped
the package, and copied the two files (with extensions ex4 and mq4) to the corresponding
directory (expert advisors) in C:\Programm File\MetaTrader4\experts\indicators. Restart
MT4 Client Terminal, in Navigator window, I can see my auto pivot indicator appear under
the Custom Indicators. Double click on it and it appears in my chart!
- How to use it
- Use the pivot points as entry and exit levels. Before using the pivot points I first use the
200 EMA to decide the trend.
- If I‘m in an uptrend and I see the price breaking above a pivot level, I can draw a trend
line to make sure that it‘s reversing (means the bars break below the upward trend line)

25
and as soon as the trend line is broken I enter a long position. I also place my stop loss
below the pivot level and place my target profit 10 to 15 pips below the next higher
pivot level.
- If I‘m in an uptrend and I see the price repelled by the pivot level, I can also draw a
trend line and enter a short position when the trend line is broken and then place my
stop loss above the pivot level and exit my trade once the price move down to half the
pivot length.
- Below is a sample display that I pulled out on my MT4 cha
Figure 2. Demonstrating Forex Pivot Point Indicator (September 28, 2011, MT4, EURUSD, H1)
4.1.2.1.3 Bollinger Bands Indicator
- How to display it in MT4
The Bollinger Bands Indicator is a built-in indicator in MT4 so it is very convenient for us to
add it to our chart. In Navigator window, under Indicators, simply double click the Bollinger
Bands Indicator; accept the default settings which are the 20 days SMA and 2x standard
deviation.
- How to use it
26
- The upper band usually indicates a resistance level while the lower band usually
indicates a support level.
- Bollinger Bands can also be used to measure the volatility of the market. When the
upper and lower bands are narrow, the market is in a period of consolidation and when
the bands are widely apart, the market is in a period of strong price movement.
- If I want to trade breakout, always look for period where the market is in consolidation
as this is sign that the market is consolidating strength to break in a particular direction.
- The band can also be used to determine the trend. If the price is sticking to the upper
band, the market is in uptrend. If the price is sticking to the lower band, the market is in
downtrend.
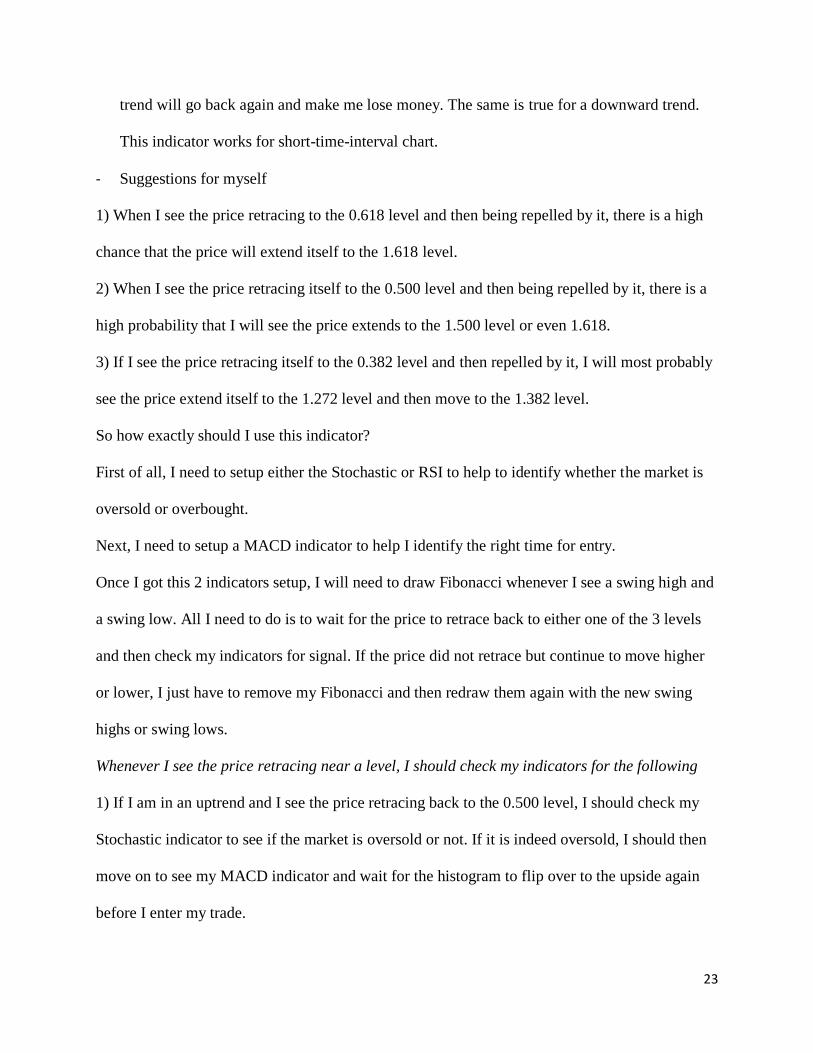
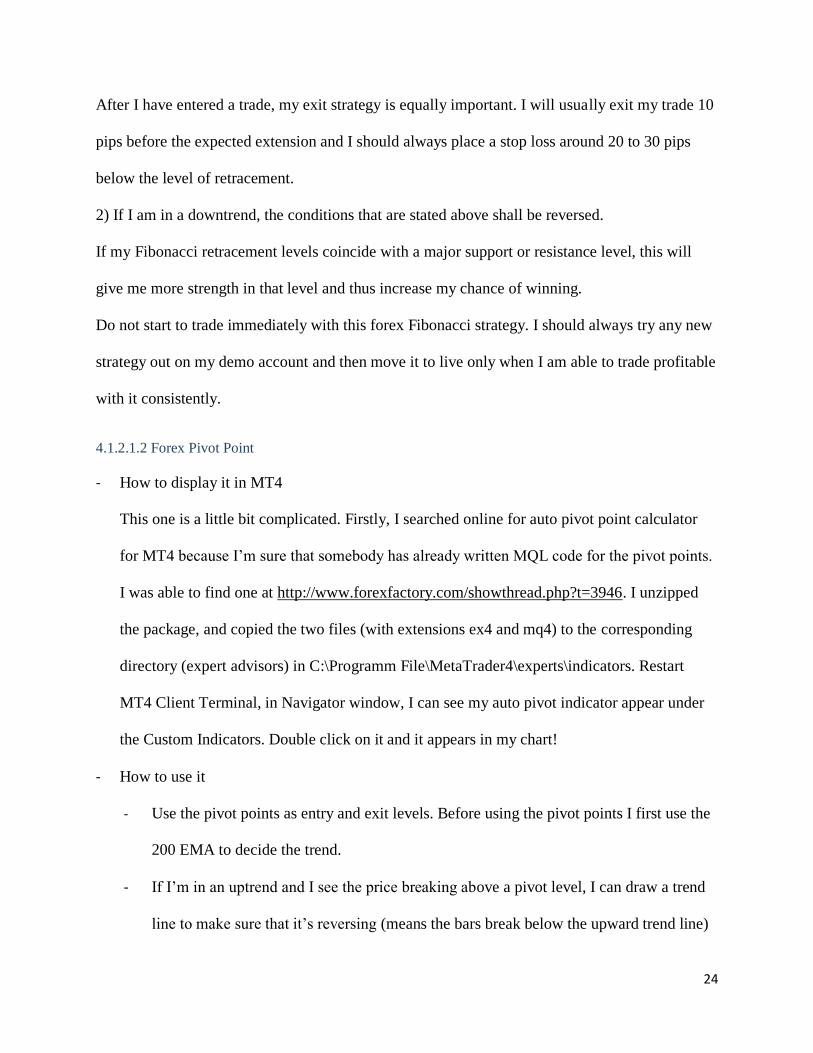
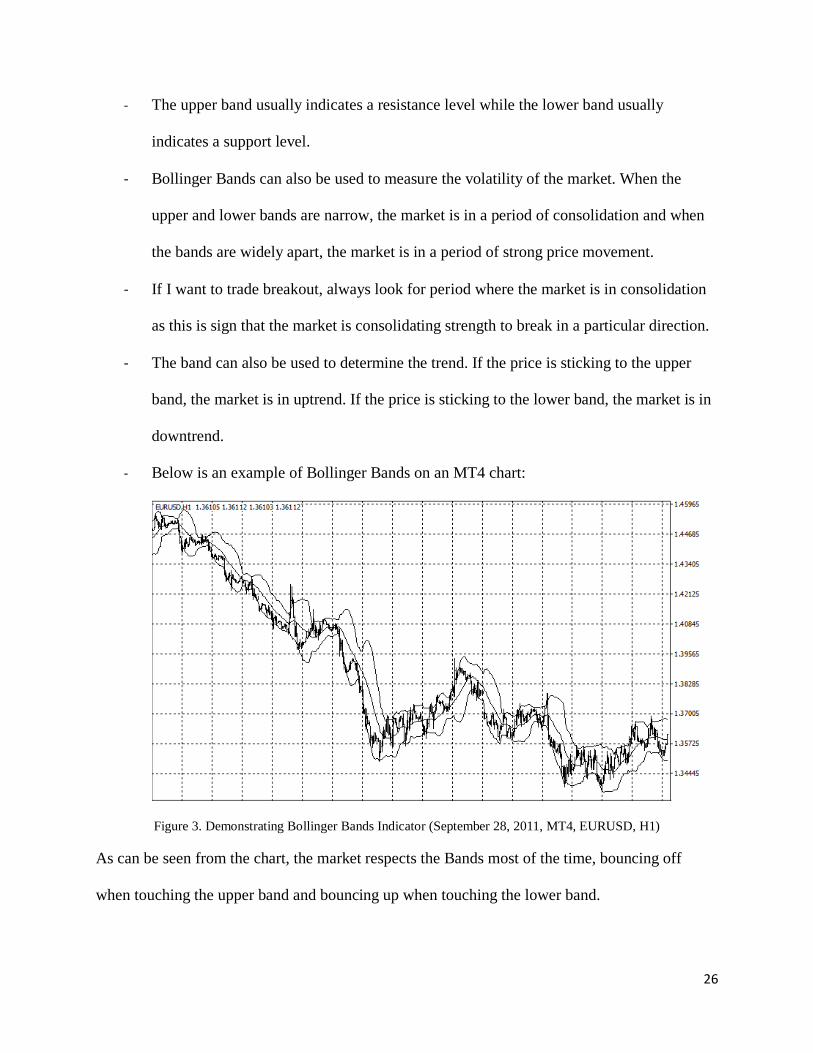
- Below is an example of Bollinger Bands on an MT4 chart:
Figure 3. Demonstrating Bollinger Bands Indicator (September 28, 2011, MT4, EURUSD, H1)
As can be seen from the chart, the market respects the Bands most of the time, bouncing off
when touching the upper band and bouncing up when touching the lower band.
27
Besides these three indicators for providing resistance and support information, I also found the
following three popular indicators helpful in my trading.
4.1.2.2 Three Popular Indicators
4.1.2.2.1 200 Day Exponential Moving Average
- How to display it in MT4
In MT4, under the Insert tab, go to Indicators -> Trend -> Moving Average. This brings up
the Moving Average indicator window. Under the Parameter tab, put 200 in the Period field,
and choose ―Exponential‖ as the MA method. Click OK, and we can see the 200 day
exponential moving average appearing on our chart.
- How to use it
- If the 200 EMA is sloping upward, I‘m in an uptrend; if the 200 EMA is sloping
downward, I‘m in a downtrend.
- The deeper the gradient, the more volatile the market is and the stronger the trend is.
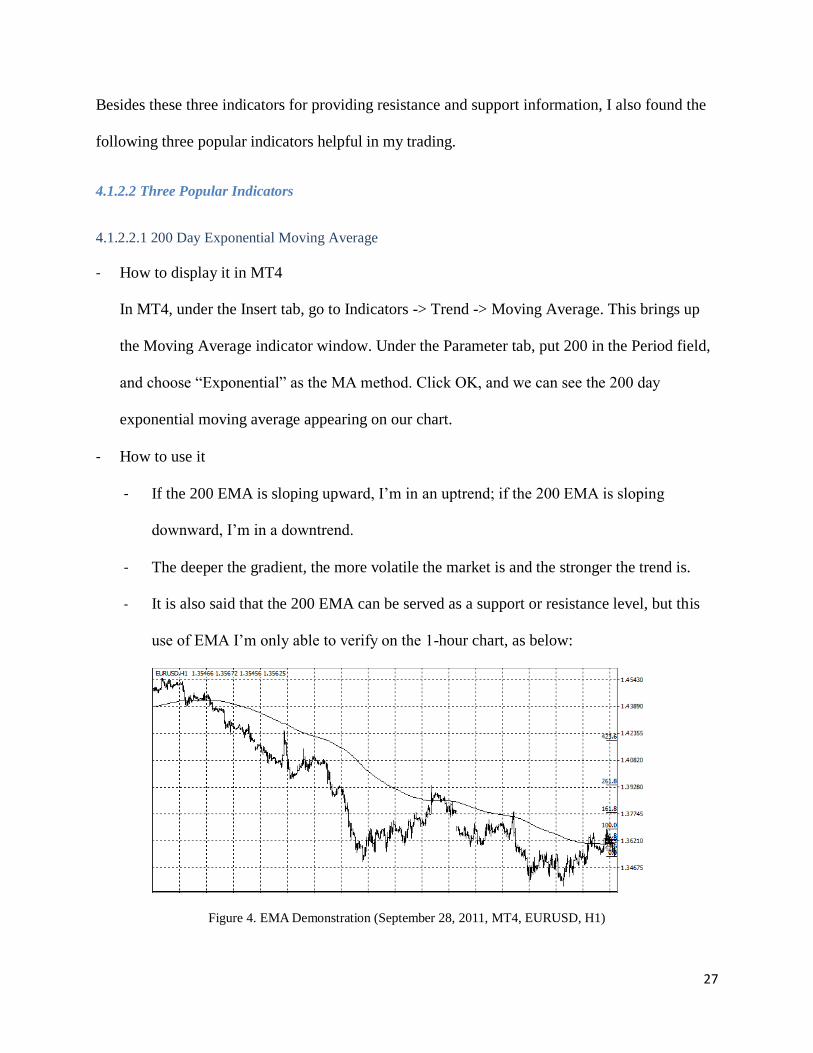
- It is also said that the 200 EMA can be served as a support or resistance level, but this
use of EMA I‘m only able to verify on the 1-hour chart, as below:
Figure 4. EMA Demonstration (September 28, 2011, MT4, EURUSD, H1)

28
As can be seen, the market generally respects the 200 EMA. However, if we display it
on chart with time intervals less or bigger than 1 hour, the indicator doesn‘t serve as a
resistance or support level very well, as can be seen in the following 4-hour chart:
Figure 5. EMA Demonstration: Inaccurate Application (September 28, 2011, MT4, EURUSD, H4)
- We can also use it as an entry signal. When the price moves above the signal, I can enter
my long position. If the price moves below it, I can enter my short position.
- Suggestions:
- Moving averages give trading signals by interacting with the prices or with each
other. If you use one moving average, a signal to buy is generated when the
currency prices close above the average; a sell signal is given when the currency
prices close below it. A longer-term moving average (e.g. 100-day moving average)
will often provide strong support (in up trends) or resistance (in down trends),
giving trend continuation signals when the prices bounce away from it
- When you use two moving averages with different time periods (e.g. a 5-day and a
21-day moving average), a buy signal occurs when a shorter-term moving
average crosses above a longer-term moving average. This crossover signal is also
known as a golden cross. A sell signal is produced when a fast moving average falls
29
below a slower moving average. This crossover signal is called a dead cross. The
points of old crossovers between the averages will usually act as support or
resistance areas in the future.
- Examples of the moving average combinations watched for the dead and the golden
crosses are: 5 and 21 days, 5 and 55 days, 21 and 55 days, 5 and 100 days, 5 and
200 days.
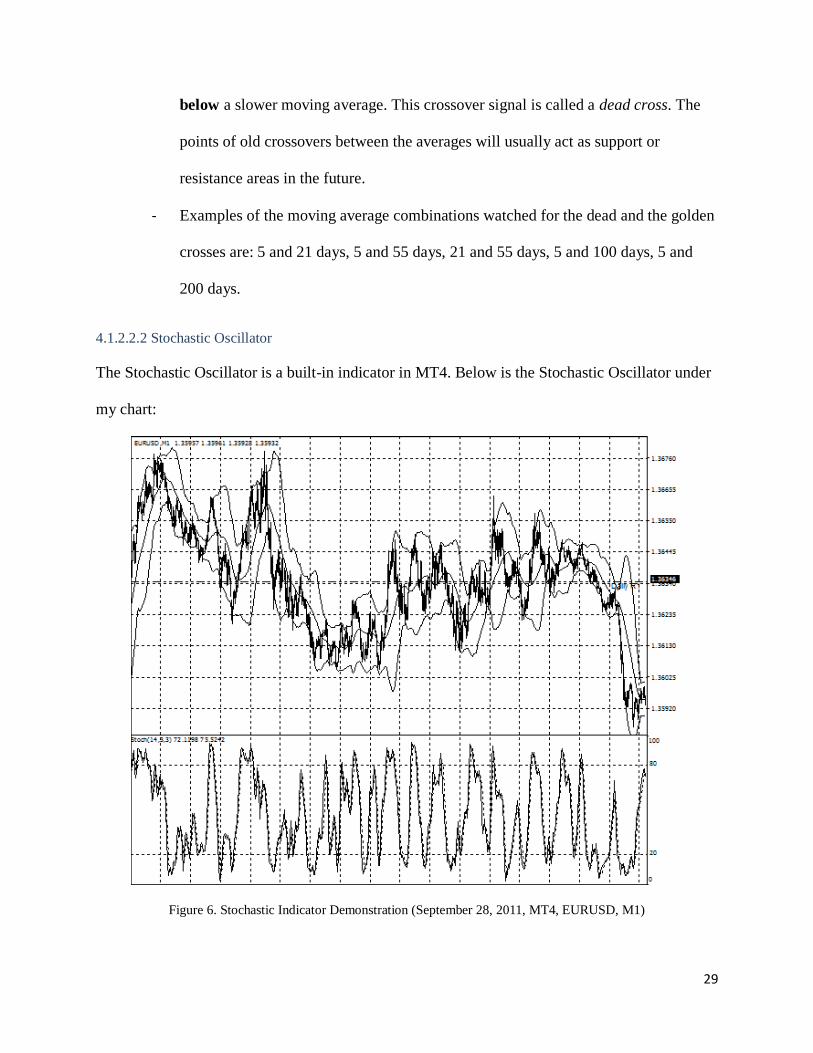
4.1.2.2.2 Stochastic Oscillator
The Stochastic Oscillator is a built-in indicator in MT4. Below is the Stochastic Oscillator under
my chart:
Figure 6. Stochastic Indicator Demonstration (September 28, 2011, MT4, EURUSD, M1)
30
The stochastic is made up of 2 lines, %K and %D. When the stochastic moves above the 80
level, the market is considered to be overbought and when it moves below the 20 level, the
market is considered to be oversold.
- Entry signal. If I am looking to go LONG, I will wait for the stochastic %K to cross above
the %D and move above the 20 mark. If I am looking for a SHORT trade, I will wait for the
%K to cross below the %D and move below the 80 mark.
- Exit signal. If I have taken a LONG trade, I will wait for it to move to the overbought zone
and exit my position after %K crosses below %D and move below the 80 mark.
- Reversal signal. We can also make use of stochastic divergence to enter a trade. The positive
divergence occurs when the market makes lower low while the stochastic make higher low.
This is usually an indication that the market is going to reverse up. The negative divergence
occurs when the market makes higher high and the stochastic make lower high. This usually
signifies a downward reversal is going to occur.
- Suggestions:
- The stochastic oscillator identifies overbought and oversold conditions, helping us to
buy low or sell high. Just as important, it helps avoid buying at high prices or shorting at
low prices. The stochastic indicator should not be used by itself but rather with other
technical indicators. When a strong uptrend starts, the stochastic indicator quickly
becomes overbought and starts flashing sell signals. In a sudden sell off, the Stochastic
indicator becomes oversold and flashes premature buy signals. This indicator works
well only if you use it with another trend-following indicator and take only those
Stochastic signals that point in the direction of the main trend. If you are looking for an
opportunity to enter, as soon as the stochastic indicator reaches an extreme you enter.
31
- Do not buy when the Stochastics is above its upper reference line and do not sell short
when it is below its lower reference line. This is the most useful way to use the
Stochastic. Moving averages are better than the Stochastics at identifying trends,
MACD-Histogram is better at identifying reversals, channels are better at identifying
profit targets, and the ADX is quicker at catching entry and exit points. The trouble with
them is that they give action signals most of the time. The Stochastic identifies no trade
zones.
4.1.2.2.3 MACD
- The MACD is a built-in indicator in MT4. I usually accept the default settings, which is 26
days or 12 days EMA.
- Long. When the MACD is under the 0-axis for a large distance and it‘s displaying higher and
higher valley and cross the signal line from below, it‘s a good time to enter a long position.
- Short. When the MACD is above the 0-axis for a large distance and it‘s displaying lower and
lower peak and cross the signal line from above, it‘s a good time to enter a short position.
- Divergence. When the highs of a currency pair is getting higher and higher, MACD highs are
getting lower and lower. We are experiencing something called ―Negative Divergence‖. We
will usually see a downside movement after a negative divergence is formed. When the lows
of a currency pair is getting lower and lower, MACD lows are getting higher and higher. We
are experiencing ―Positive Divergence‖. Whenever we see positive divergence, we will
usually see an upside movement in price. Below is the method of trading MACD divergence.
- Make sure that there is a trend in action. Plot a 20 EMA, 50 EMA and a 100 EMA
moving average. If they are stacked nicely with good angle and separation, it is a good
indication of a trending market and if the EMAs are flat and mixed, there is no trend in
32
the market.
- Observe the MACD and the price to look for divergence.
- Look for good reversal candle patterns like railway track, hammer and hanging man.
- Draw a trend line and wait for breakout.
- Suggestions:
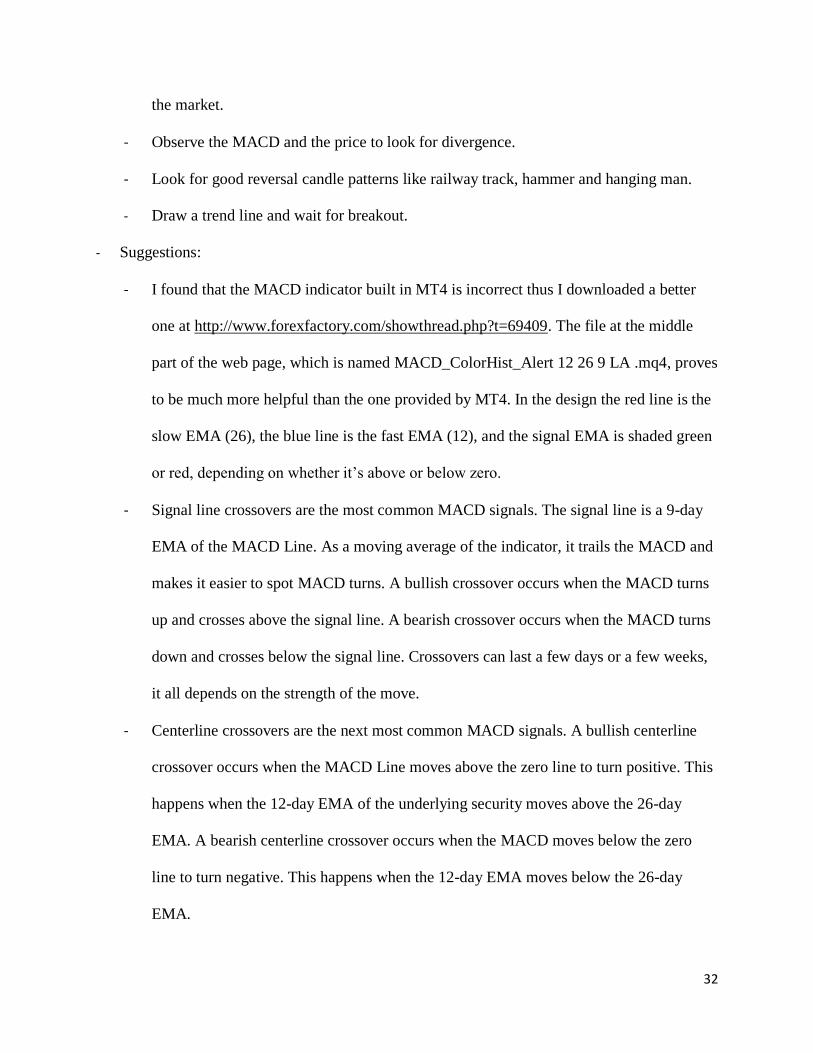
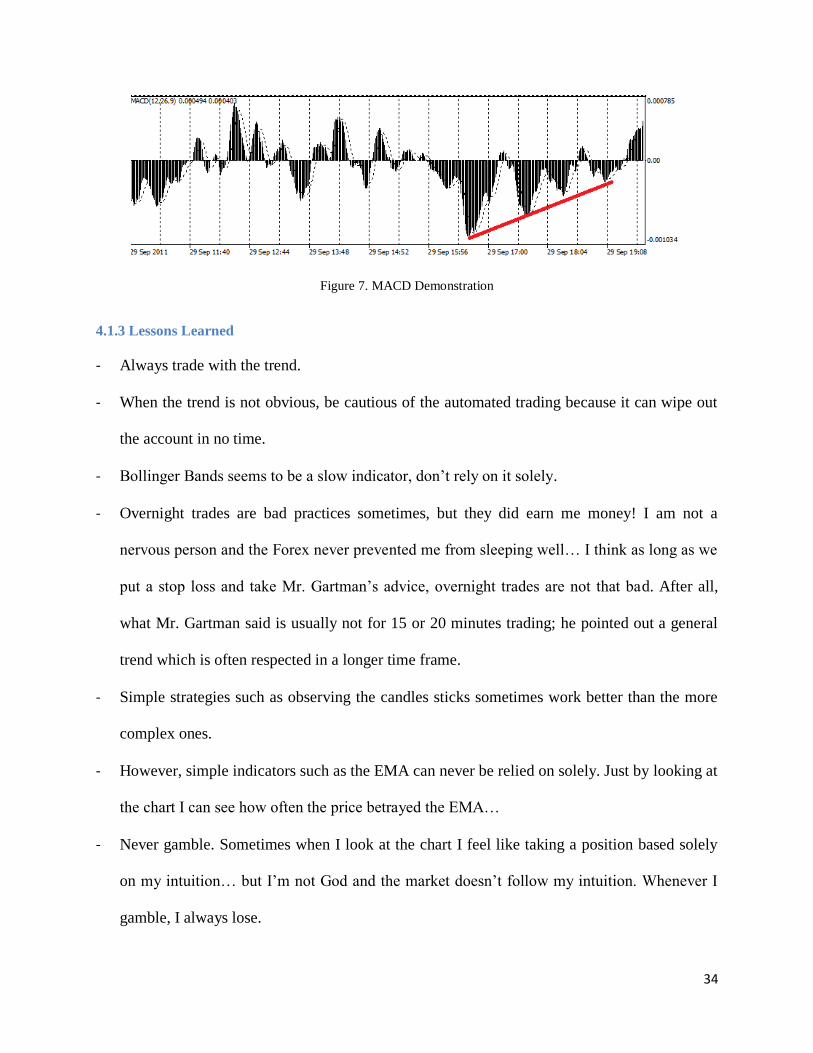
- I found that the MACD indicator built in MT4 is incorrect thus I downloaded a better
one at http://www.forexfactory.com/showthread.php?t=69409. The file at the middle
part of the web page, which is named MACD_ColorHist_Alert 12 26 9 LA .mq4, proves
to be much more helpful than the one provided by MT4. In the design the red line is the
slow EMA (26), the blue line is the fast EMA (12), and the signal EMA is shaded green
or red, depending on whether it‘s above or below zero.
- Signal line crossovers are the most common MACD signals. The signal line is a 9-day
EMA of the MACD Line. As a moving average of the indicator, it trails the MACD and
makes it easier to spot MACD turns. A bullish crossover occurs when the MACD turns
up and crosses above the signal line. A bearish crossover occurs when the MACD turns
down and crosses below the signal line. Crossovers can last a few days or a few weeks,
it all depends on the strength of the move.
- Centerline crossovers are the next most common MACD signals. A bullish centerline
crossover occurs when the MACD Line moves above the zero line to turn positive. This
happens when the 12-day EMA of the underlying security moves above the 26-day
EMA. A bearish centerline crossover occurs when the MACD moves below the zero
line to turn negative. This happens when the 12-day EMA moves below the 26-day
EMA.

33
- The MACD is not particularly good for identifying overbought and oversold levels.
- The MACD Line oscillates above and below the zero line, which is also known as the
centerline. These crossovers signal that the 12-day EMA has crossed the 26-day EMA.
The direction, of course, depends on direction of the moving average cross.
Positive MACD indicates that the 12-day EMA is above the 26-day EMA. Positive
values increase as the shorter EMA diverges further from the longer EMA. This means
upside momentum is increasing. Negative MACD values indicate that the 12-day EMA
is below the 26-day EMA. Negative values increase as the shorter EMA diverges further
below the longer EMA. This means downside momentum is increasing.
I earned 150 bucks trading the MACD divergence. I attached my price chart and MACD
window below. I entered a long position after I see the divergence form. This method is thus
proved to be helpful.
34
Figure 7. MACD Demonstration
4.1.3 Lessons Learned
- Always trade with the trend.
- When the trend is not obvious, be cautious of the automated trading because it can wipe out
the account in no time.
- Bollinger Bands seems to be a slow indicator, don‘t rely on it solely.
- Overnight trades are bad practices sometimes, but they did earn me money! I am not a
nervous person and the Forex never prevented me from sleeping well… I think as long as we
put a stop loss and take Mr. Gartman‘s advice, overnight trades are not that bad. After all,
what Mr. Gartman said is usually not for 15 or 20 minutes trading; he pointed out a general
trend which is often respected in a longer time frame.
- Simple strategies such as observing the candles sticks sometimes work better than the more
complex ones.
- However, simple indicators such as the EMA can never be relied on solely. Just by looking at
the chart I can see how often the price betrayed the EMA…
- Never gamble. Sometimes when I look at the chart I feel like taking a position based solely
on my intuition… but I‘m not God and the market doesn‘t follow my intuition. Whenever I
gamble, I always lose.
35
- I always follow the trend. This might cost me some good opportunities, but it also reduces
the chances of losing. I read the Gartman letter and look at the 200-day EMA to get the
general trend. And when the price is going in an opposite direction of the trend I will not try
to enter into the trade.
- During the day I trade the 15-minite chart, but I constantly look at the 1-hour chart, because I
know the noises in a small time frame can cost me a lot.
- Not trading is also a position. When I‘m in doubt, I simply don‘t trade.
- Fibonacci levels can sometimes be very helpful in trading, even partially used. To determine
the best exit, for example.
- Always ensure that a signaling candle on the chart is fully formed and closed before entering
a trade.
4.1.4 Psychology of Trading
The market is governed by four basic human emotions: fear, greed, euphoria and
desperation. These emotions and how they play out are shown on the charts. Extreme levels,
such as panic selling or a torrid uptrend are associated with those emotions. A trading plan is
created to manage a trader‘s emotions.
Since all traders are people it is understandable that we will have emotional responses to
trades. When the market moves with someone, they may feel happy and if it does not, some
people may get mad or depressed. The reason that traders have trading plans is to try and
anticipate their actions before they even place a trade. In other words, before each trade a trader
should sit down and write the steps he or she will take depending on hypothetical changes in the
market. These steps would take into account the potential good and bad scenarios. When a trader
is already holding an open position it can be hard to think clearly as to what to do next, as
36
emotions may cloud one‘s judgment. When one has predetermined guidelines beforehand - a
trading plan - it works as an aid in taking emotions out of trading.
There is a potential threat to one's trading if one is not disciplined and does not follow his
or her plan. Many new traders fail because they create a plan but then they don‘t follow it,
because they are emotional and make exceptions. They think, "just for this trade I'm not going to
follow my plan because I know the market is going to change in my favor." This can be a recipe
for disaster. A trader should not change his or her plan unless they sit down and re-evaluate their
whole trading strategy. If the trader comes up with a better plan, then he or she needs to exercise
discipline in sticking to it. (2011 Capital Market Services, LLC., 2011)
4.2 Implementing our Trading Plan
4.2.1 Selecting a Platform
We were introduced to MetaTrader 4 when we first started our project and we got used to
it very soon. Later on we were introduced to Trade Station. Below we did some comparisons
about the advantages and disadvantages of each platform.
MetaTrader 4: It‘s free. Most brokers offer the platform. It has lots of ready-to-go built-in
indicators and Expert Advisors. However, the execution is slower compared to Trade Station,
and there are no customizable time frames on charts. MQL contains bugs.
Trade Station: It‘s more advanced. It has great technical support on their forums. Simple
strategies are easy to program. There are lots of third-party add-ons. However, it‘s much more
expensive than other platforms. The learning curve is more even compared to the learning of
other platforms, as it took me more time to get used to.

37
We ended up using MT4 for most of our trades because we were already very familiar
with it, and we already started learning MQL4, the programming tool in MT4. Programming
robots became an important part of our project, so we decided to stick with MT4.
4.2.2 Trading Resources
For our trading we used several previously mentioned resources. The Gartman Letter
was an invaluable resource for determining fundamental analysis and help with predicting the
reactions of foreign nations. We used the website ForexFactory.com to determine what times
were appropriate to trade as our strategy does not include trading with the news. We feel that
trading off of news is unreliable and complicated so we prefer to trade with steady, reliable and
consistent profits. When we first started out trading, we used babypips.com to help get oriented
with the forex market. I used babypips.com to help with unfamiliar terms that the Gartman
Letter used. Babypips.com also offered several basic strategies that we later expounded upon
and made our own. Another website I always use when trading is forexlive.com. I use this
whenever I am currently trading to keep up to date and to help explain any jumps in price. I try
to avoid currencies that are reacting to news, so if an unplanned announcement happens,
forexlive.com will tell me about it so I may exit my trades.
Other resources we use while trading is our technical indicators. We both have preferred
technical indicators and it is important to find the ones that work for you. I prefer MACD,
Stochastic Oscillator, and the Moving Average to help me trade. It is unwise to have more than
three technical indicators up at a time as it will crowd your display and most likely overload you
with information. Once you find your rhythm of trading, you will also find which technical
indicators are best for you. After you are trading long enough, you will not need technical
38
indicators anymore, as the chart will tell you everything you need to know. This is after years of
training and trading, and should not be expected to happen any time soon.
Using these resources, we learned how to trade efficiently and with profit. These assets
helped us to become better traders, and helped us implement our trading strategy without too
much trouble.
4.2.3 Risk Management
- Take Profit: 25 pips. This is meant to be flexible. 1st take profit level can also be set on
the nearest trend line or resistance level.
- Stop Loss: 35 pips. This is meant to be flexible. There can be other types of
considerations:
- putting the stop loss 5 pips below the nearest Support Level for long position or 5 pips
above the nearest Resistance Level for short position.
- Or 10 pips below or above previous day‘s high or low.
- Or 10 pips above/below the first Parabolic SAR spot appeared over/below the price
candles for short/long trades.
- Remember to modify the open position plan if we choose the other data as our new stop
loss – the 35 pips gap shouldn‘t be expanded too much.
- Maximum risk: 2%.
2% x $100,000 = $2000.
1 pip movement corresponds to 10 dollars if trading 1 standard lot. Maximum risk
$2000 means that I can bear at most 200 pips loss.
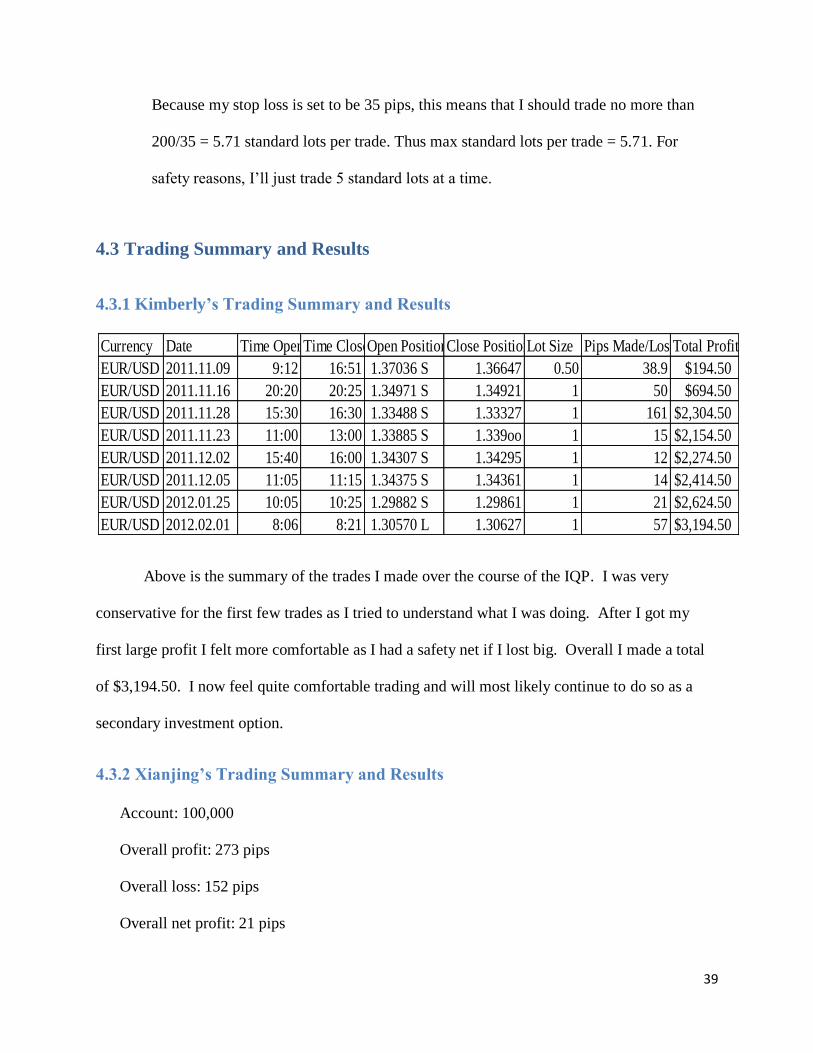
39
Because my stop loss is set to be 35 pips, this means that I should trade no more than
200/35 = 5.71 standard lots per trade. Thus max standard lots per trade = 5.71. For
safety reasons, I‘ll just trade 5 standard lots at a time.
4.3 Trading Summary and Results
4.3.1 Kimberly’s Trading Summary and Results
Above is the summary of the trades I made over the course of the IQP. I was very
conservative for the first few trades as I tried to understand what I was doing. After I got my
first large profit I felt more comfortable as I had a safety net if I lost big. Overall I made a total
of $3,194.50. I now feel quite comfortable trading and will most likely continue to do so as a
secondary investment option.
4.3.2 Xianjing’s Trading Summary and Results
Account: 100,000
Overall profit: 273 pips
Overall loss: 152 pips
Overall net profit: 21 pips
Currency Date Time OpenTime CloseOpen PositionClose PositionLot Size Pips Made/LossTotal Profit
EUR/USD 2011.11.09 9:12 16:51 1.37036 S 1.36647 0.50 38.9 $194.50
EUR/USD 2011.11.16 20:20 20:25 1.34971 S 1.34921 1 50 $694.50
EUR/USD 2011.11.28 15:30 16:30 1.33488 S 1.33327 1 161 $2,304.50
EUR/USD 2011.11.23 11:00 13:00 1.33885 S 1.339oo 1 15 $2,154.50
EUR/USD 2011.12.02 15:40 16:00 1.34307 S 1.34295 1 12 $2,274.50
EUR/USD 2011.12.05 11:05 11:15 1.34375 S 1.34361 1 14 $2,414.50
EUR/USD 2012.01.25 10:05 10:25 1.29882 S 1.29861 1 21 $2,624.50
EUR/USD 2012.02.01 8:06 8:21 1.30570 L 1.30627 1 57 $3,194.50

40
From manual trading, my profit is almost the same as loss, thus roughly breaking even.
Since last term I shifted my emphasis to developing MQL4 robots, and the profit from back
test is shown below:
Figure 8. Silver Trend Robot Backtest Result
4.4 Money / Risk Management
4.4.1 Account Information:
Account type: Forex – USD
Leverage: 50:1
Deposit: $100,000
4.4.2 Trading Information:
Pair: EUR/USD
41
Volume: 5 standard lots. The movement of 1 pip corresponds to $10 when 1 standard lot is
traded. The detailed calculation of why we are using 5 standard lots is given in the Risk
Management section.
Goal: Earn $500 per week. This means that I need to earn 50 pips every week, which are 10
pips per day on average. Not an ambitious goal but I hope to keep it.
4.4.3 Trading Time Frame:
Lower time frames like the 1 min or 5 min produce a lot of noises. However I do not have
too much time to spare thus too long a time frame is not affordable. Thus my strategy would be
using higher time frame chart like the 4 hours to look for trading opportunity as it has less noise
and then go to the lower time frame like the 5 minutes chart to look for best entry.
4.4.4 Risk Management
- Take Profit: 25 pips. This is meant to be flexible. 1st take profit level can also be set on
the nearest trend line or resistance level.
- Stop Loss: 35 pips. This is meant to be flexible. There can be other types of
considerations:
- putting the stop loss 5 pips below the nearest Support Level for long position or 5 pips
above the nearest Resistance Level for short position.
- Or 10 pips below or above previous day‘s high or low.
- Or 10 pips above/below the first Parabolic SAR spot appeared over/below the price
candles for short/long trades.
- Remember to modify the open position plan if we choose the other data as our new stop
loss – the 35 pips gap shouldn‘t be expanded too much.
- Maximum risk: 2%.
42
2% x $100,000 = $2000.
1 pip movement corresponds to 10 dollars if trading 1 standard lot. Maximum risk
$2000 means that I can bear at most 200 pips loss.
Because my stop loss is set to be 35 pips, this means that I should trade no more than
200/35 = 5.71 standard lots per trade. Thus max standard lots per trade = 5.71. For
safety reasons, I‘ll just trade 5 standard lots at a time.
4.5 Launching a Money Management Company
Assuming we become successful enough to obtain the capital of starting our own
company, here is exactly how we would do it.
4.5.1 Legal Structure
There are four basic ways to legally structure your company when you are just starting
out. These structures are sole-proprietorships, partnerships, corporations and limited liabilities
companies. To narrow down which structure we want for our company we first needed to take
into account the type of business you own, the size of the business and many other individual
factors. If that still doesn‘t help we will then seek the advice of a lawyer that specializes in
business law (Ehrhardt, 2012).
A sole-proprietorship can only be constructed by an individual that is the only owner of
the company. The only exception to this rule is if the owners are husband and wife. In a sole-
proprietorship there is one very distinctive benefit and one equally distinctive drawback. The
benefit to this legal structure is that there is no legal requirement necessary to form it. Basically,
this means that we could create a sole-proprietorship for little if any cost and maintain it without
further paperwork or legal filings. The disadvantage to this structure is that the individual that

43
forms the sole-proprietorship is solely responsible for any debts incurred by the business. This
means that if a customer were to sue our company, our personal assets could be used to pay off
any judgment against our business (Ehrhardt, 2012). Unfortunately, as both my partner and I are
trying to form a company, this legal structure would be impossible.
In a partnership, two separate individuals must own the business and the individuals must
choose not to incorporate. This means if we chose to structure our business this way, we could
not participate. As with a sole-proprietorship, no legal filings are required to establish this
business structure but it is highly recommended that you at the very least draft an agreement
between all parties involved in case of disagreements. This document or contract can be drawn
up by the partners but it is more beneficial to have a lawyer that specializes in business law draw
it up for us. If we chose to draw up the contract ourselves, we must be sure to include
information regarding the financial responsibilities of each partner, the terms for the sharing of
profits and losses and the responsibilities in decision making for each partner (Ehrhardt, 2012).
This legal structure is possible, but both my partner and I want to be involved in our company,
and we would not be able to be incorporated with this structure.
A corporation has many legal requirements, and these requirements are state-issued so
they vary by location. As we are not sure as to where we would place our company yet, we will
have to look into this matter if we chose a corporation as our legal structure. The advantage to
organizing a corporation as our legal structure is that the liability for the company is limited to
only what an individual puts into the company. This means that my partner and I do not have to
worry about our personal finances or assets seized to pay off company debt. However, the
disadvantage to owning a corporation is the time it takes to maintain one. In a corporation, the
company must elect a board of directors, write articles of incorporation, and issue stock. Owners
44
must also attend shareholder meetings and follow all corporate guidelines while running the
business (Ehrhardt, 2012). As my partner and I are starting off small, with minimal employees,
we do not necessarily think that a corporation would be a good fit.
One of the most common legal structures to set up our company is Limited Liability
Company (LLC). LLC combines features from both corporation and partnership structures. It is a
legal form of company that provides limited liability to its owners in the vast majority of United
States jurisdictions (Wikipedia, 2011). The LLC structure is advantageous in that owners will not
be held personally liable for debts (unless a personal documentation is signed). It resembles a
corporation in this way, by protecting its owners from carrying all the responsibility. LLC also
allows flexible profit distributions. A common partnership usually has a 50-50 profit
distribution, while a LLC can define much more flexible profit distributions. In a LLC, meeting
minutes are not required. Unlike corporations, which must keep formal minutes and meeting
resolutions for every meeting, a LLC doesn‘t require that and thus is more efficient in this aspect.
A LLC avoids double taxation. A corporation needs to pay both corporate tax and individual tax,
while a LLC has all its losses, profits and expenses going to the individual members. The
disadvantages of a LLC are that a LLC is dissolved if a member dies or the company goes
bankruptcy, while corporations can always exist. It is more convenient to choose the
Corporation structure if the business owner plans to take the company public. LLC is also much
more complex than any other structure we have discussed and requires more paperwork.
With the analysis above, we decided to set up our company as a LLC. The procedure is
more complex than setting up a sole proprietor or a partnership, but much simpler than starting
up a corporation. However, as both my partner and I were already planning to consult our
lawyer about our legal structure choice to help us make a decision, this is not as big of a

45
disadvantage as it could have been. Also, our lawyer would help us understand which legal
structures would have the best tax situation while still allowing protection for our assets
(Ehrhardt, 2012).
The first step is to file Articles of Organization. To set up a LLC we need to have a
lawyer prepare the Articles of Organization with the Secretary of State and pay the required fees.
The next step is to draft an Operating Agreement. The Operating Agreement resembles corporate
by-laws or partnership agreements. The Agreement defines the company‘s responsibilities,
ownership changes and profit sharing.
4.5.2 Off-Shore or On-Shore Accounts
To choose where to start our business, be it off-shore or stateside is a tough decision. If
we started the company in the United States we have the advantage of being here already. We
would not need to move or acquire residency or citizenship. However, off-shore trading has
some major advantages.
4.5.2.1 Advantages for Investment Off-Shore
Off-shore trading has several benefits. Trading off-shore would give us tax advantages.
Tax regulations often contain provisions to protect against taxation by multiple jurisdictions
which can be exploited for legal tax reductions. Nations intentionally attract business
investments through lower tax rates. The corporate-tax trend over the period from 1980 to 2010
has trended lower, with the top rate in OECD countries (excluding America) moving from 51%
to 32% (Wikipedia, 2011). This has the potential to improve our rate of return on investments.
Another benefit to starting out company off-shore is investment diversification. Risk can be
managed by diversifying investments among a wider range of options than are available for on-
shore investments. Off-shore trading also has the advantage of choice inheritance. This means
46
that inheritance may be passed to the preferred heir, regardless of regulations such as community
property laws in the jurisdiction of residence/death. Another plus to trading off shore is lower
levels of regulation. A broader range of investment options are available off-shore (e.g. hedge
funds, which thrive in low regulatory environments due to their highly aggressive investments
strategies, thrive in offshore jurisdictions, principally the Cayman Islands) (Wikipedia, 2011).
Off-shore trading also allows much more privacy. Confidential financial information helps us
manage taxes on capital gains, income, and inheritance. Lastly, off-shore trading has the
opportunity for specialist financial services. The leading offshore centers have highly developed
financial services sectors with expertise in asset management, banking, insurance, trusts, funds
and legal services (Wikipedia, 2011).
4.5.2.2 Disadvantages of Off-Shore Investment
However, there are some disadvantages to trading off-shore. Off-shore brokers are not
well protected by the well-established regulations and laws of the United States. They bypass
the security exchange legislation put into place after the great depression (e.g., the U.S.
Securities Act of 1933 and the Securities Exchange Act of 1934) to stabilize the world's
economies and establish a fair marketplace (Wikipedia, 2011). This increases the risk that the
financial markets are not properly regulated, increasing the likelihood of bubbles and subsequent
recessions. Basically, markets in other parts of the world are more unstable than in America.
Ethically, it might be considered an abuse of national sovereignty by reducing transparency to
regulators of financial transactions. Off-shore investments reduce transparency, which abets
illegal activities such as allowing investment firms to bypass their fiduciary responsibility and
exploit their customers. As an example, it is alleged in a SEC-filed civil fraud suit that Goldman
Sachs set up an "offshore deal in which a longtime client, the hedge fund Paulson & Co., helped
select and then bet against the securities in the deal without telling investors of Paulson's role"
47
(Wikipedia, 2011). It exploits the advantages created to earn wealth by a taxed economy while
not paying its fair share of taxes in that economy. Wealth earned in one (taxed) economy is
taken out of circulation (i.e., it cannot be taxed again when re-spent to provide services and
infrastructure). It encourages Tax competition between states, provinces, countries, and regions
in the way that the search for ever cheaper source of manual labor brings down wages
everywhere. Offshore investments in poorly regulated tax havens may bypass sanctions against
countries established to encourage conventions important to societies (e.g., UN sanctions for
failure to adhere to nuclear nonproliferation treaties). This has the effect of undercutting the
effectiveness of such sanctions (Wikipedia, 2011).
Also, most off-shore companies do not even allow US customers to trade with them as it
brings the IRS into the picture because the US customers are subject to audits. If we were to go
off-shore, we would most likely not be able to include the US customers either because then we
would be subject to the trade regulations we were trying to avoid ("Advantages of Offshore
Forex Brokers", 2011). This would limit our clients, and we wouldn‘t want to do that. Also, we
would need much more capital than we have now in order to move off-shore. It seems that
starting a company in the US is far easier to manage.
4.5.3 Money Management
4.5.3.1 General money management options
1. Accounting and balance sheet.
The first step in money management is tracking the money coming in and the money
flowing out. The Balance Sheet presents a picture of your business' net worth at a
particular point in time. It summarizes all the financial data about your business, breaking
that data into 3 categories; assets, liabilities, and equity. (Ward, 2011)
48
2. Cash Flow Management.
Cash flow management is the process of monitoring, analyzing, and adjusting our
business' cash flows. For small businesses, the most important aspect of cash flow
management is avoiding extended cash shortages, caused by having too great a gap
between cash inflows and outflows. Therefore, we need to perform a cash flow analysis
on a regular basis, and use cash flow forecasting so we can take the steps necessary to
head off cash flow problems. The second step of cash flow management is to develop and
use strategies that will maintain an adequate cash flow for our business. One of the most
useful strategies for small businesses is to shorten our cash flow conversion period so that
our business can bring in money faster. (Ward, 2011)
3. Financing. Sooner or later, our business is going to need more money. From angel
investors and private lenders through traditional sources of small business financing,
figuring out where we‘re going to get the money we need and managing our business's
debt is vital to good business management.
4. Managing Vision. Managing the vision means having long-range goals and objectives for
our company and then planning how to achieve those goals.
5. Crisis/Disaster Management. Being prepared for the unexpected (and undesired) is
another aspect of business management that we want to devote some attention to.
4.5.3.2 Money and Risk Management of our Forex Money Management Company
We set more conservative benchmarks of our forex money management company. We will
not risk more than 2% of our customers‘ total capital. Below is an average standard when trading
customers‘ accounts, when no specific requirements are given by the customers:
Leverage: 1:50
49
Pair: EUR/USD
Volume: For a customer deposit of $100,000, we‘ll set the volume to 5 standard lots. The
movement of 1 pip corresponds to $10 when 1 standard lot is traded. The detailed
calculation of why we are using 5 standard lots is given in the Maximum Risk section below.
Goal: Earn $500 per week. This means that we need to earn 50 pips every week, which are
10 pips per day on average.
Time frame: Lower time frames like the 1 min or 5 min produce a lot of noises. However I
do not have too much time to spare thus too long a time frame is not affordable. Thus my
strategy would be using higher time frame chart like the 4 hours to look for trading
opportunity as it has less noise and then go to the lower time frame like the 5 minutes chart to
look for best entry.
Take Profit: 25 pips. This is meant to be flexible. 1st take profit level can also be set on the
nearest trend line or resistance level.
Stop Loss: 35 pips. This is meant to be flexible. There can be other types of considerations:
- putting the stop loss 5 pips below the nearest Support Level for long position or 5 pips
above the nearest Resistance Level for short position.
- Or 10 pips below or above previous day‘s high or low.
- Or 10 pips above/below the first Parabolic SAR spot appeared over/below the price
candles for short/long trades.
- Remember to modify the open position plan if we choose the other data as our new stop
loss – the 35 pips gap shouldn‘t be expanded too much.
Maximum risk: 2%.
50
2% x $100,000 = $2000.
1 pip movement corresponds to 10 dollars if trading 1 standard lot. Maximum risk
$2000 means that we can bear at most 200 pips loss.
Because the stop loss is set to be 35 pips, this means that we should trade no more than
200/35 = 5.71 standard lots per trade. Thus max standard lots per trade = 5.71. For
safety reasons, we‘ll just trade 5 standard lots at a time.
4.5.4 Licensing
4.5.4.1 FSB Licensing - Forex Broker License
The broker license is the accurate means of checking the authenticity and reliability of the
trader. Under the Financial Advisory and Intermediary Services Act (FAIS Act), the traders need
to register themselves for licensing in the FSB, if they are trading with client's funds. This act is
not applicable to the individual investors. At the same time, the Financial Information Act (FIA)
confers the traders with evaluation of their services, forex advices and education.
FSB handles the entire process of registrations. The trading and service providers who manage
the forex accounts instead of the investors need to get registered for license in terms of FSP
category 2 of FAIS. Those who introduce brokers and others who solicit the forex investments
under their financial advice process need to be registered in FSP category of FAIS.
4.5.4.4 Series 3 License
Series 3 is a securities license that entitles the holder to sell commodities or futures
contracts. The Series 3 exam covers options, futures, hedging, margin requirements, and
regulations. (Investopedia.com, 2011)
51
4.5.4.5 Series 65 License
The Series 65 exam is also known as the Uniform Investment Adviser Law Examination.
This examination is designed to prepare candidates as investment adviser representatives. The
examination consists of 130 questions and 10 pretest questions. Applicants are allowed 180
minutes to complete the exam. A score of at least 72% is required in order to pass ("Series 65
License", 2012).
4.5.4.4 Series 34 License
The Series 34 exam is a National Futures Association (NFA) exam required for
individuals seeking to engage in off-exchange forex transactions with retail customers. It is part
of a regulatory forex registration process for most forex managers, dealers and intermediaries. It
tests applicants in five major areas: forex terminology, forex concepts, forex regulations, forex
trading computations and the risks of forex trading. The Series 34 exam consists of 40 questions,
all of which are either true or false, or multiple choice. To pass the exam, the applicant must get
at least 28 questions correct, for a passing score of 70%. (Investopedia.com, 2011)
4.5.5 Regulations and Organizations
4.5.5.1 Commodities Futures Trading Commission – CFTC
The Commodities Futures Trading Commission or CFTC was formed in 1974 to protect
investors in the futures and commodities trades. The aim of CFTC is to provide security from
fraud and manipulation. Prior to the CFTC, futures had been traded on the stock market under
federal restrictions. However, those rulings only kept the market stable and fair without
regulating how companies worked with clients. Throughout its brief history the Commodities
Futures Trading Commission has undergone many changes and improvements, all with the focus
on promoting open and competitive forex and commodities trading in a safe and secure
52
environment. In December of 2002 Congress demanded the Modernization Act of 2000 to
protect single stock futures allowing for price discovery, offsetting of prices and risks, stops
abusive practices in commodity trading and for the private investors, the CFTC very pointedly
protects the integrity of the financial clearing process ("CFTC (Commodities Futures Trading
Commission)", 2012).
The CFTC is carefully watched by the federal commissioners who are appointed by the
President for terms of five years. Operating primarily out of Washington, DC but having offices
in all cities with Exchanges (New York, Chicago, and Kansas City) the CTFC closely watches
all activity on the foreign exchange market and futures stock. With the CFTC watching over the
forex market, everyone can take part without fear of being cheated ("CFTC (Commodities
Futures Trading Commission)", 2012).
All parties wishing to trade on the foreign exchange or make trades for others must be
registered with the CFTC. The Commodity Futures Trading Commission also makes adamant
demands that all persons or companies who make trades for outside individuals clearly post
statements of risk that are upfront and honest about the futures trading environment. Forex
trading being a big part of the futures trading system is inherent with risks even under strict
regulations and everyone who decides to participate should be made to understand those hazards
("CFTC (Commodities Futures Trading Commission)", 2012).
4.5.5.2 National Futures Association – NFA
The National Futures Association or NFA is an organization within the U.S futures
market that was created in 1982. It is industry-wide and is self regulated. The NFA fills many
roles and purposes within the commodities and futures market, but its main role is the protection
of investors. Any person or entity conducting business with investors within the futures

53
exchange market is required to register as a member with the NFA. This ensures that all firms
and associates adhere to the stringent set of rules of professional conduct that have been
mandated by the NFA. Members are required to pay membership dues, and users are required to
pay assessment fees. This allows the NFA to remain completely and financially independent,
and prevents any costs to taxpayers. All registered members are required to have a background
screening before the member can conduct business with the public. The NFA uses this
information to ensure that members are up to the high standards of regulation, and not out to prey
upon investors. Fingerprint cards are required to be on file as well. In addition to the
background screening, members must also pass a series of proficiency testing requirements. The
most important aspect of the NFA is that it has the right to bar registration if any information
proves unsatisfactory. The stringent rules and regulations are not just for the benefit of the
investors. This also allows for market integrity, and the NFA is more than willing to help
members meet the standards of the regulatory responsibilities. They also have developed new
programs to ensure that markets are maintained as the futures market and Forex market are
changing to a more electronic format. The National Futures Association monitors registered
members, and performs audits to make sure that all rules are being abided by. If individuals
lodge complaints against a company, the NFA investigates. The NFA has the authority to take
action against any member who violates the rules or regulations, including prosecution for major
rule infractions. If prosecution is necessary, the NFA works hand in hand with the FBI and
CFTC (Commodity Futures Trading Commission) to ensure that the prosecution is successful.
In addition to monitoring and auditing members, the National Futures Association also provides
dispute resolution. To resolve any futures related issues, the NFA began an arbitration program
in 1983. This is the current primary resolution for the futures industry. In 1991, the NFA
54
developed a mediation program as a faster, more cost effective alternative. To move even farther
forward in this arena, they began accepting claims online in October of 2001. The NFA was the
first in the financial services industry to take this step ("NFA (National Futures Association)",
2012).
4.5.5.3 FAIS Act
The purpose of the Financial Advisory and Intermediary Services Act (FAIS Act) is to
regulate the activities of all financial service providers who give advice or provide intermediary
services to clients as regards certain financial products. The Act requires that such providers be
licensed and that professional conduct be controlled through a code of conduct and specific
enforcement measures.
The FAIS Act applies to any body that offers financial advice and/or provides an
intermediary service to a client on any transaction that has to do with a financial product.
Companies that are subject to the FAIS Act have to either register with the Financial
Services Board as Financial Service Providers (FSPs) or have to fall under the control of another
Financial Service Provider.
A FSP will have one or more key individuals. These are people who control or manage
the activities of providing financial services. Key individuals have to meet the requirements of
being fit and proper in terms of the Act. A FSP has to also appoint a compliance officer to ensure
that the activities of the FSP are being conducted in compliance with the FAIS Act.
The employees who are offering advice within the FSP to clients need to be appointed as
representatives. The Act imposes specific controls on representatives and requires that
representatives, as well as the key individuals and the company itself, operate in terms of a
55
specific code of conduct. Note that employees who are not appointed representatives in terms of
the Act cannot provide advice to a client (Ekos Risk, 2011).
4.5.5.4 FIA Act
The Financial Information Act (FIA) is part of the Financial Information Regulation
(FIR). The FIR applies to corporations with fiscal years starting on or after April 1, 1994. The
FIR was amended in 2002 to increase the reporting thresholds for employee remuneration and
payments to suppliers for goods and services, and for various housekeeping changes. Schedule 1
of the FIR outlines the information corporations are required to report in the Statement of
Financial Information (SOFI) and how the information is to be made available to the public. The
SOFI consists of four core financial statements and schedules for employee remuneration and for
payments to suppliers for goods and services provided to the corporation. These statements and
schedules are detailed in this Guidance Package. A revised Minister of Finance Directive was
introduced in 2002 to provide for timelier reporting by FIA corporations and for various
administrative improvements, one of which is the mandatory use of a checklist addressing the
contents of the FIR. The checklist must be used by corporations to assist in completing the SOFI,
and by ministries in reviewing their corporations' SOFIs for compliance with the Act and the
FIR. (Queen‘s Printer for British Columbia, 2002)
4.5.6 Performance Measurement
There are five main indicators of investment risk that apply to the analysis of funds. They
are alpha, beta, r-squared, standard deviation and the Sharpe ratio. These statistical measures are
historical predictors of investment risk/volatility and are all major components of modern
portfolio theory (MPT). The MPT is a standard financial and academic methodology used for
56
assessing the performance of equity, fixed-income and mutual fund investments by comparing
them to market benchmarks.
All of these risk measurements are intended to help investors determine the risk-reward
parameters of their investments. (Investopedia.com, 2011)
4.5.6.1 Alpha
Alpha is a measure of an investment's performance on a risk-adjusted basis. It takes the
volatility (price risk) of a security or fund portfolio and compares its risk-adjusted performance
to a benchmark index. The excess return of the investment relative to the return of the
benchmark index is its "alpha".
Simply stated, alpha is often considered to represent the value that a portfolio manager
adds or subtracts from a fund portfolio's return. A positive alpha of 1.0 means the fund has
outperformed its benchmark index by 1%. Correspondingly, a similar negative alpha would
indicate an underperformance of 1%. For investors, the more positive an alpha is, the better it is.
4.5.6.2 Beta
Beta, also known as the "beta coefficient," is a measure of the volatility, or systematic
risk, of a security or a portfolio in comparison to the market as a whole. Beta is calculated using
regression analysis, and you can think of it as the tendency of an investment's return to respond
to swings in the market. By definition, the market has a beta of 1.0. Individual security and
portfolio values are measured according to how they deviate from the market.
A beta of 1.0 indicates that the investment's price will move in lock-step with the market.
A beta of less than 1.0 indicates that the investment will be less volatile than the market, and,
correspondingly, a beta of more than 1.0 indicates that the investment's price will be more
volatile than the market. For example, if a fund portfolio's beta is 1.2, it's theoretically 20% more
volatile than the market.
57
Conservative investors looking to preserve capital should focus on securities and fund
portfolios with low betas, whereas those investors willing to take on more risk in search of
higher returns should look for high beta investments.
4.5.6.3 R-Squared
R-Squared is a statistical measure that represents the percentage of a fund portfolio's or
security's movements that can be explained by movements in a benchmark index. For fixed-
income securities and their corresponding mutual funds, the benchmark is the U.S. Treasury Bill
and, likewise with equities and equity funds, the benchmark is the S&P 500 Index.
R-squared values range from 0 to 100. According to Morningstar, a mutual fund with an
R-squared value between 85 and 100 has a performance record that is closely correlated to the
index. A fund rated 70 or less would not perform like the index.
4.5.6.4 Standard Deviation
Standard deviation measures the dispersion of data from its mean. In plain English, the
more that data is spread apart, the higher the difference is from the norm. In finance, standard
deviation is applied to the annual rate of return of an investment to measure its volatility (risk). A
volatile stock would have a high standard deviation. With mutual funds, the standard deviation
tells us how much the return on a fund is deviating from the expected returns based on its
historical performance.
4.5.6.5 Sharpe Ratio
The Sharpe ratio was developed by Nobel laureate economist William Sharpe, this ratio
measures risk-adjusted performance. It is calculated by subtracting the risk-free rate of return
(U.S. Treasury Bond) from the rate of return for an investment and dividing the result by the
investment's standard deviation of its return.
58
The Sharpe ratio tells investors whether an investment's returns are due to smart
investment decisions or the result of excess risk. This measurement is very useful because
although one portfolio or security can reap higher returns than its peers, it is only a good
investment if those higher returns do not come with too much additional risk. The greater an
investment's Sharpe ratio, the better its risk-adjusted performance.
Many investors tend to focus exclusively on investment return, with little concern for
investment risk. The five risk measures we have just discussed can provide some balance to the
risk-return equation. The good news for investors is that these indicators are calculated for them
and are available on several financial websites, as well as being incorporated into many
investment research reports. As useful as these measurements are, keep in mind that when
considering a stock, bond, or mutual fund investment, volatility risk is just one of the factors you
should be considering that can affect the quality of an investment.
4.5.7 Marketing
There are very strict regulations as to how and if you can advertise a money management
company. The best way is by word of mouth, that is having a customer or supporter tell other
people how well our company is doing and how much money we make. This method is by far
the most beneficial as it is free and legal. Any other forms of advertising or marketing would
have to be put through a rigorous legal checklist and have the approval of our attorney.
4.5.7.1 Build a Website
We can build a website ourselves. To ensure that the website shows up in the search
result, include keywords that people tend to search for often. Write articles with novel ideas.
Avoid general articles / tutorials that people can easily get from the big websites.

59
4.5.7.2 Forex Advertising Agency
Post advertisements on big forex websites through forex advertising agencies. FXAA is a
forex advertising agency that sells advertisements on quality forex websites including forex-
indicators.net, ForexMarketHours.com, Forex-strategies-revealed.com, etc.
4.5.7.3 Reputation and Reviews: Serve the Current Customer Well!
Money management companies survive only when a good reputation is built. People
would not hand their money to a company with bad reputation. In order to get top reviews it is
critical that the company does its job well – maybe more than well.
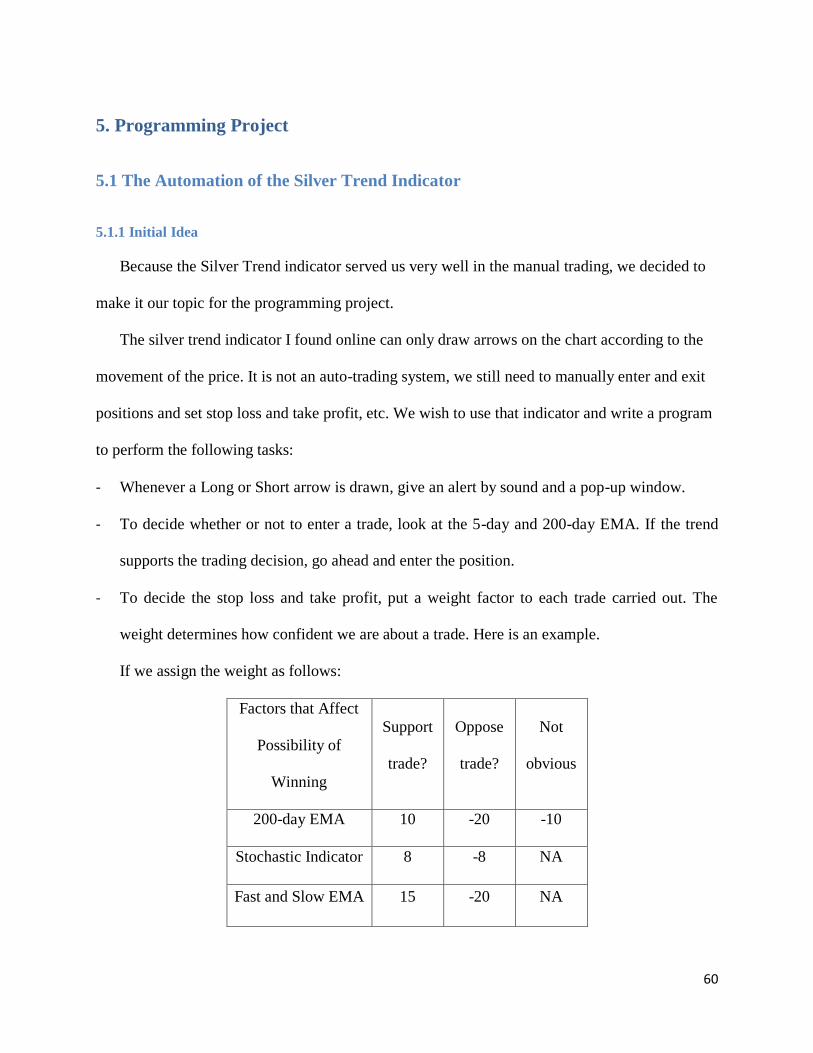
60
5. Programming Project
5.1 The Automation of the Silver Trend Indicator
5.1.1 Initial Idea
Because the Silver Trend indicator served us very well in the manual trading, we decided to
make it our topic for the programming project.
The silver trend indicator I found online can only draw arrows on the chart according to the
movement of the price. It is not an auto-trading system, we still need to manually enter and exit
positions and set stop loss and take profit, etc. We wish to use that indicator and write a program
to perform the following tasks:
- Whenever a Long or Short arrow is drawn, give an alert by sound and a pop-up window.
- To decide whether or not to enter a trade, look at the 5-day and 200-day EMA. If the trend
supports the trading decision, go ahead and enter the position.
- To decide the stop loss and take profit, put a weight factor to each trade carried out. The
weight determines how confident we are about a trade. Here is an example.
If we assign the weight as follows:
Factors that Affect
Possibility of
Winning
Support
trade?
Oppose
trade?
Not
obvious
200-day EMA 10 -20 -10
Stochastic Indicator 8 -8 NA
Fast and Slow EMA 15 -20 NA
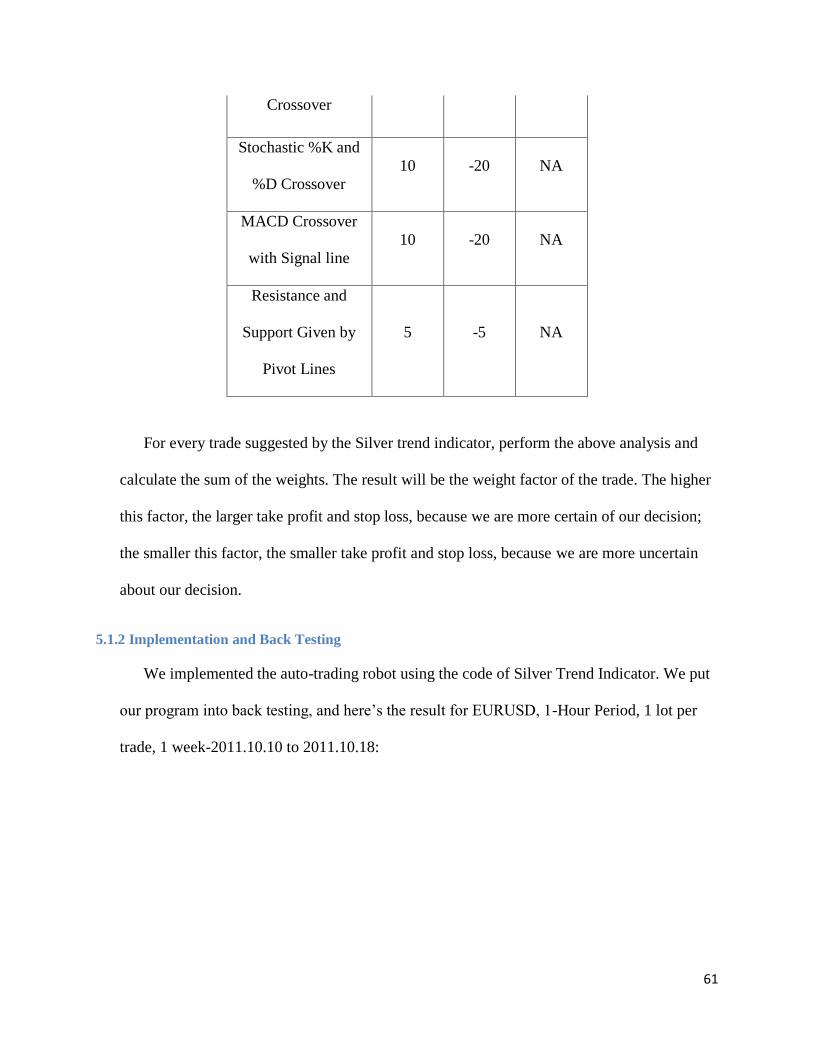
61
Crossover
Stochastic %K and
%D Crossover
10 -20 NA
MACD Crossover
with Signal line
10 -20 NA
Resistance and
Support Given by
Pivot Lines
5 -5 NA
For every trade suggested by the Silver trend indicator, perform the above analysis and
calculate the sum of the weights. The result will be the weight factor of the trade. The higher
this factor, the larger take profit and stop loss, because we are more certain of our decision;
the smaller this factor, the smaller take profit and stop loss, because we are more uncertain
about our decision.
5.1.2 Implementation and Back Testing
We implemented the auto-trading robot using the code of Silver Trend Indicator. We put
our program into back testing, and here‘s the result for EURUSD, 1-Hour Period, 1 lot per
trade, 1 week-2011.10.10 to 2011.10.18:
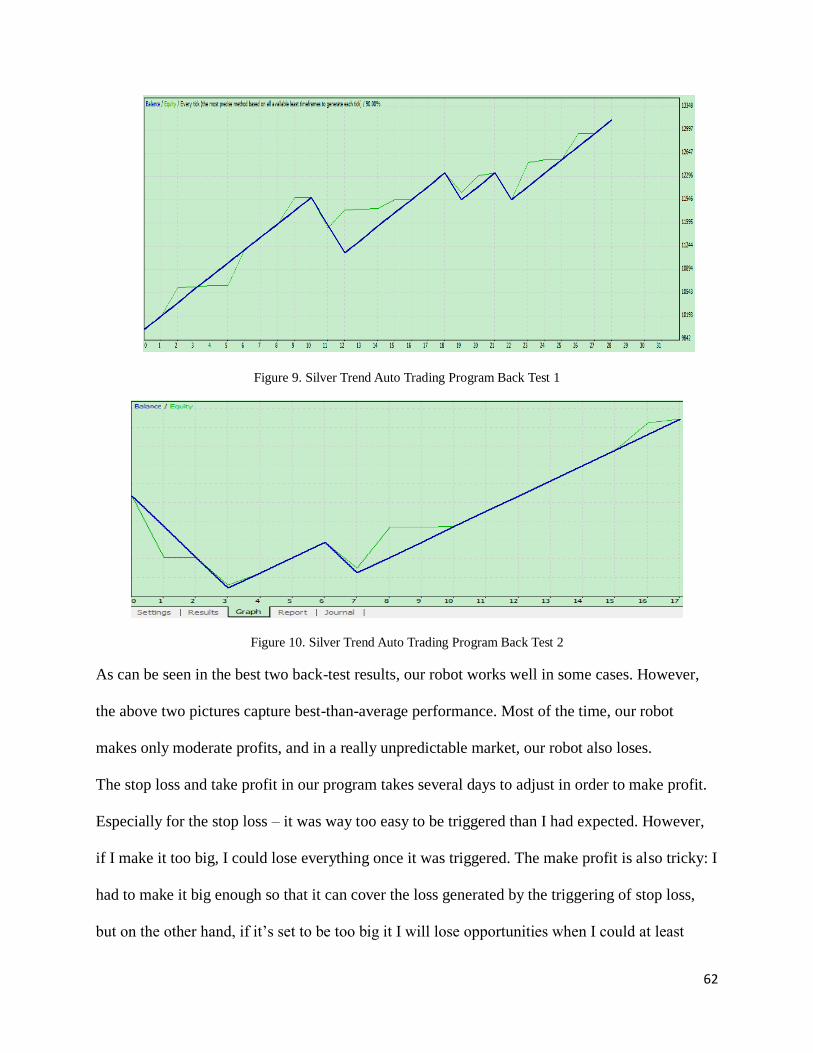
62
Figure 9. Silver Trend Auto Trading Program Back Test 1
Figure 10. Silver Trend Auto Trading Program Back Test 2
As can be seen in the best two back-test results, our robot works well in some cases. However,
the above two pictures capture best-than-average performance. Most of the time, our robot
makes only moderate profits, and in a really unpredictable market, our robot also loses.
The stop loss and take profit in our program takes several days to adjust in order to make profit.
Especially for the stop loss – it was way too easy to be triggered than I had expected. However,
if I make it too big, I could lose everything once it was triggered. The make profit is also tricky: I
had to make it big enough so that it can cover the loss generated by the triggering of stop loss,
but on the other hand, if it‘s set to be too big it I will lose opportunities when I could at least

63
make some money. At last I decided that the stop loss should be twice as much as the make
profit.
This robot works good if the market behavior is regular and predictable. However it can sweep
out my account if the market is too unpredictable, as was the case during the last month.
I also thought about the possibilities to make it more robust. As can be seen in the Back Test 2
graph above, at the very beginning it‘s all straight loss ($1200!). This indicates vulnerability of
my program. I tried to combine it with RSI indicator, however, the chances that the long and
short term EMAs cross over and the RSI happens to be in the oversold or overbought region is so
small that my program makes only one trade during the 1-month period. I need to think of other
ways to make my program more robust.
5.1.3 First Improvement: Adding Trend Condition
I experimented on new ways to make the robot more profitable and make less wrong
judgments. One of the methods is to add trend condition before opening a position. The basic
idea is that, whenever the robot tries to open a position, first check the trend giving by EMA. If
the trend is in favor of opening the position, execute the code that opens the position. If the trend
opposes opening the position, do nothing.
More specifically, we decide the trend by looking at the 13-day EMA. If the current
EMA value is larger than the last one by 4 pips or so, it indicates the market is in a somewhat
obvious upward trend, and long positions raised at such times should be carried out and short
positions shouldn‘t. If the current EMA value is smaller than the last one by a few pips, it
indicates the market is in an obvious downward trend, and short positions should be approved
and long positions should be held back.

64
We modified the code and tested on the history data. The result is different, but we can‘t
say its better – overall, the benefit and loss aren‘t much better than our previous code. We then
tried modifying the parameters such as shift, period, and ma_shift.
5.1.4 Second Improvement: Adding RSI Condition
We tried to combine the code with a RSI condition. The basic principle is, when the
Silver Trend Indicator is triggered, look at the RSI indicator. If the it indicates the an oversold or
overbought in favor of carrying out the operation decided by Silver Trend, then enter the
position. If it indicates a state opposite to the operation decided by Silver Trend, do nothing. For
example, when a Silver Trend indicator gives a buy signal but the RSI indicator says the price is
in the overbought region, then the robot will not enter the position. This is designed to lower the
risks of wrong judgments.
However, during the back testing we discovered that the circumstances of RSI and Silver
Trend give the same signal are so rare that sometimes no trades are carried out at all during
several days of time. Thus I need to think of yet another way to increase the stability of my
robot.
5.1.5 Third Improvement: Stop Trading When Losing Consecutively
5.1.5.1 Motivation
During back-testing we discovered that there exists time periods when consecutive losses occur:
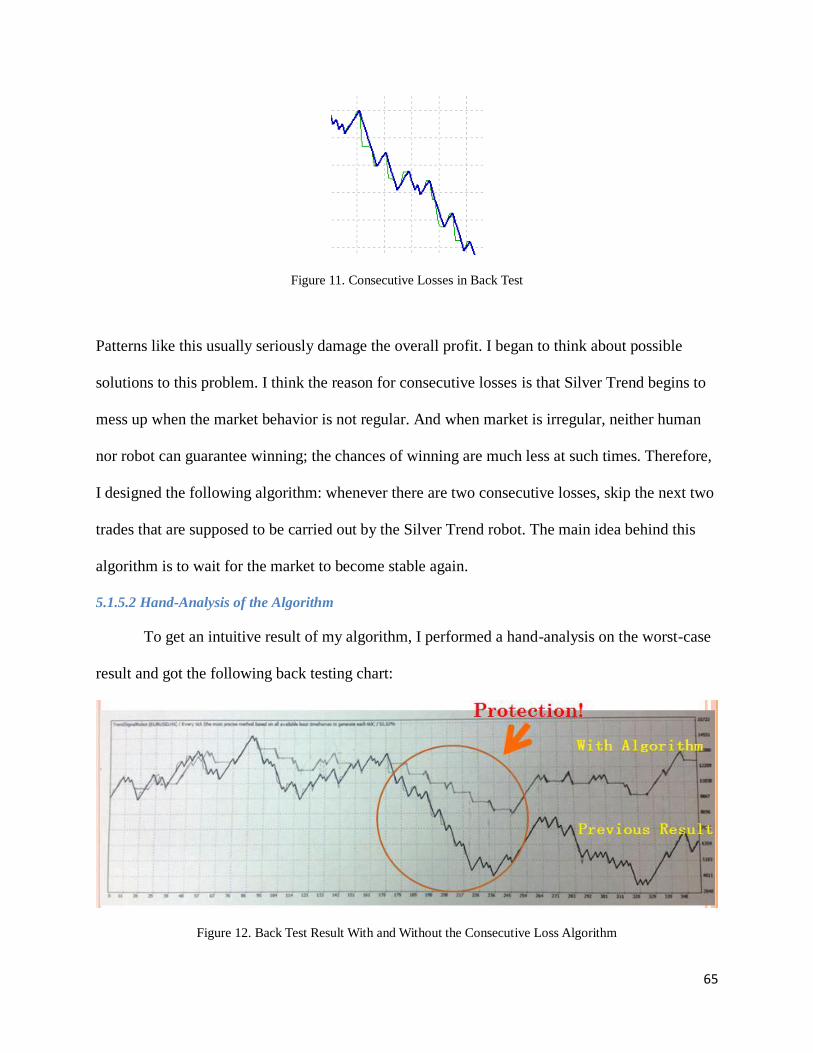
65
Figure 11. Consecutive Losses in Back Test
Patterns like this usually seriously damage the overall profit. I began to think about possible
solutions to this problem. I think the reason for consecutive losses is that Silver Trend begins to
mess up when the market behavior is not regular. And when market is irregular, neither human
nor robot can guarantee winning; the chances of winning are much less at such times. Therefore,
I designed the following algorithm: whenever there are two consecutive losses, skip the next two
trades that are supposed to be carried out by the Silver Trend robot. The main idea behind this
algorithm is to wait for the market to become stable again.
5.1.5.2 Hand-Analysis of the Algorithm
To get an intuitive result of my algorithm, I performed a hand-analysis on the worst-case
result and got the following back testing chart:
Figure 12. Back Test Result With and Without the Consecutive Loss Algorithm
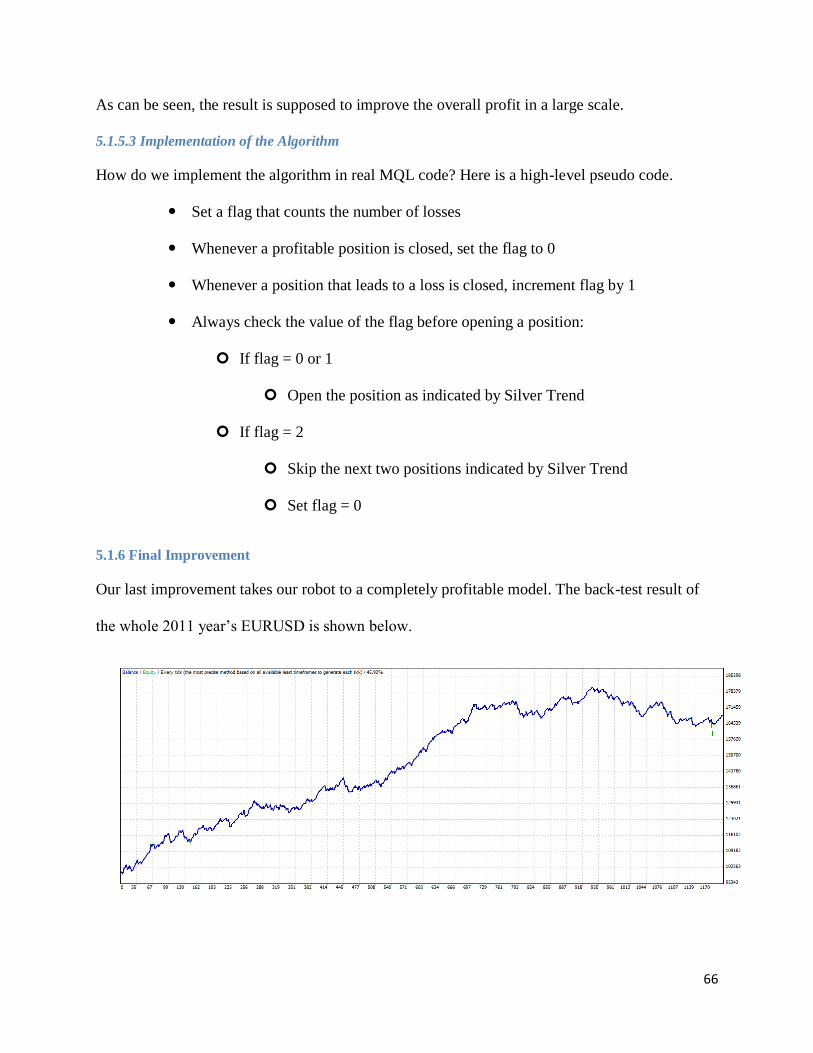
66
As can be seen, the result is supposed to improve the overall profit in a large scale.
5.1.5.3 Implementation of the Algorithm
How do we implement the algorithm in real MQL code? Here is a high-level pseudo code.
Set a flag that counts the number of losses
Whenever a profitable position is closed, set the flag to 0
Whenever a position that leads to a loss is closed, increment flag by 1
Always check the value of the flag before opening a position:
If flag = 0 or 1
Open the position as indicated by Silver Trend
If flag = 2
Skip the next two positions indicated by Silver Trend
Set flag = 0
5.1.6 Final Improvement
Our last improvement takes our robot to a completely profitable model. The back-test result of
the whole 2011 year‘s EURUSD is shown below.
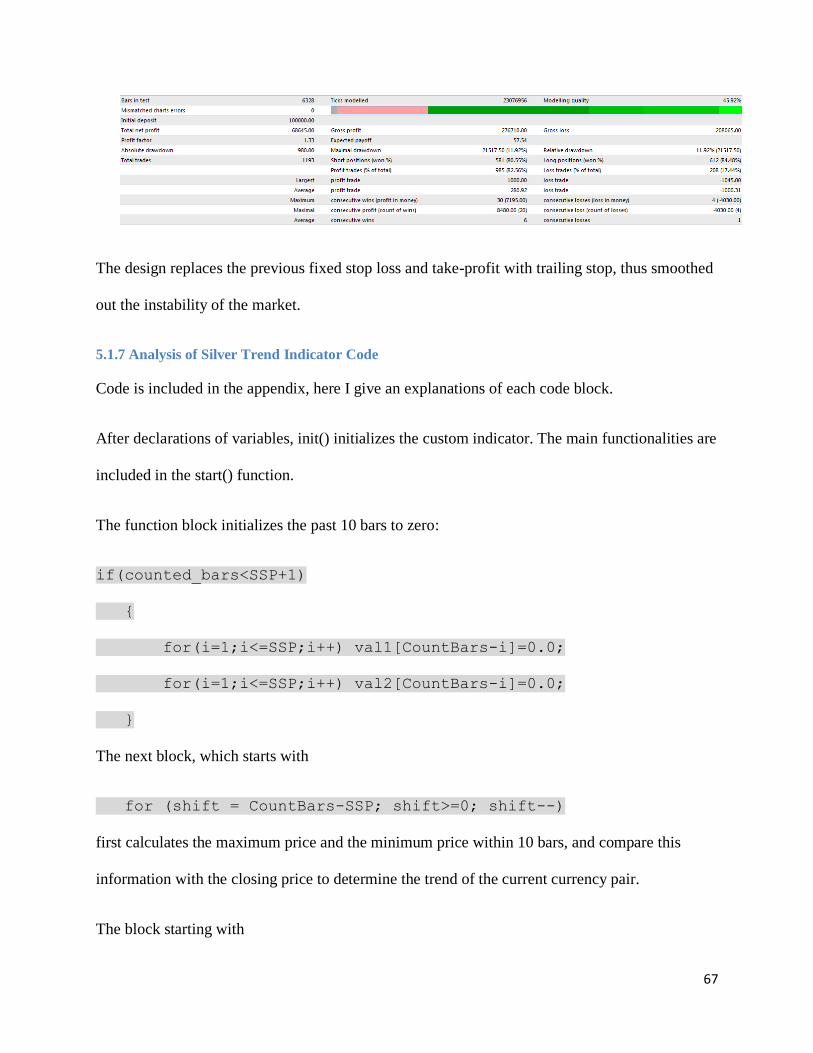
67
The design replaces the previous fixed stop loss and take-profit with trailing stop, thus smoothed
out the instability of the market.
5.1.7 Analysis of Silver Trend Indicator Code
Code is included in the appendix, here I give an explanations of each code block.
After declarations of variables, init() initializes the custom indicator. The main functionalities are
included in the start() function.
The function block initializes the past 10 bars to zero:
if(counted_bars<SSP+1)
{
for(i=1;i<=SSP;i++) val1[CountBars-i]=0.0;
for(i=1;i<=SSP;i++) val2[CountBars-i]=0.0;
}
The next block, which starts with
for (shift = CountBars-SSP; shift>=0; shift--)
first calculates the maximum price and the minimum price within 10 bars, and compare this
information with the closing price to determine the trend of the current currency pair.
The block starting with

68
if (uptrend!=old && uptrend==true)
checks whether the price is in an uptrend, and if it is, the code allows for a certain amount of
slippage to protect from irregular price fluctuations:
if (Bars>alertBar && shift==0 && (CurTime() - PrevAlertTime >
Period()*Alert_Delay_In_Seconds))
Only until then a BUY signal will be issued, and a long position will be opened:
ticket = OrderSend(Symbol(),OP_BUY,5,Ask,0,Ask-
stopLoss*Point,Ask+takeProfit*Point,"buy",1,0,Green);
The lot size is pre-set to 5 lots.
The block starting with
if (uptrend!=old && uptrend==false)
is similar to the last block; this time it checks for downtrend. Again, if downtrend is verified and
a certain amount of slippage is allowed, a short position will be opened:
ticket =
OrderSend(Symbol(),OP_SELL,5,Bid,0,Bid+stopLoss*Point,Bid-
takeProfit*Point,"sell",2,0,Blue);
All the remaining code is to modify the fixed stop loss and take profit to a trailing stop:
OrderSymbol()==Symbol()) // check for symbol
{
if(OrderType()==OP_BUY) // long position is
opened
{

69
// check for trailing stop
if(trailingStop>0)
{
if(Bid-
OrderOpenPrice()>Point*trailingStop)
{
if(OrderStopLoss()<Bid-
Point*trailingStop)
{
OrderModify(OrderTicket(),OrderOp
enPrice(),Bid-Point*trailingStop,OrderTakeProfit(),0,Green);
return(0);
}
}
}
}
else // go to short position
{
// should it be closed?
// check for trailing stop
if(trailingStop>0)
{
if((OrderOpenPrice()-
Ask)>(Point*trailingStop))

70
{
if((OrderStopLoss()>(Ask+Point*traili
ngStop)) || (OrderStopLoss()==0))
{
OrderModify(OrderTicket(),OrderOp
enPrice(),Ask+Point*trailingStop,OrderTakeProfit(),0,Red);
return(0);
}
}
}
5.2 Spread Indicator
5.2.1 How to Use It
The spread indicator shows the current spread of the currency pair in the chart. Below is
how it looks on the chart. The code is attached in the appendix.
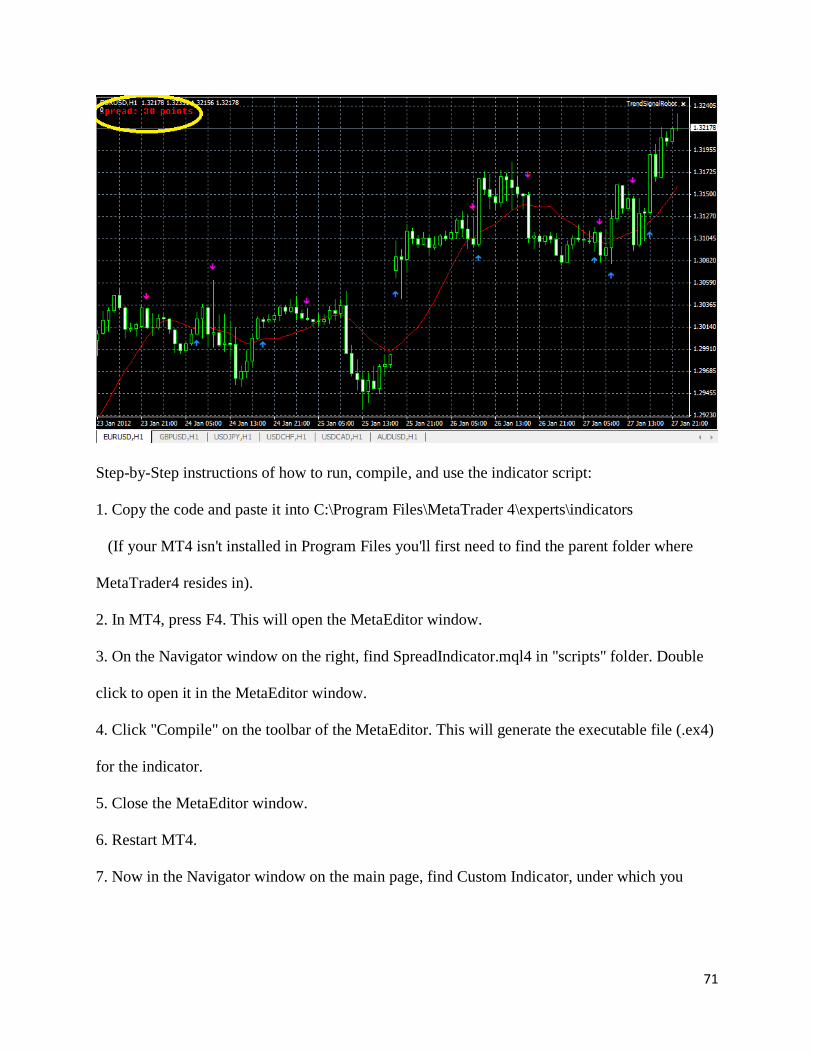
71
Step-by-Step instructions of how to run, compile, and use the indicator script:
1. Copy the code and paste it into C:\Program Files\MetaTrader 4\experts\indicators
(If your MT4 isn't installed in Program Files you'll first need to find the parent folder where
MetaTrader4 resides in).
2. In MT4, press F4. This will open the MetaEditor window.
3. On the Navigator window on the right, find SpreadIndicator.mql4 in "scripts" folder. Double
click to open it in the MetaEditor window.
4. Click "Compile" on the toolbar of the MetaEditor. This will generate the executable file (.ex4)
for the indicator.
5. Close the MetaEditor window.
6. Restart MT4.
7. Now in the Navigator window on the main page, find Custom Indicator, under which you
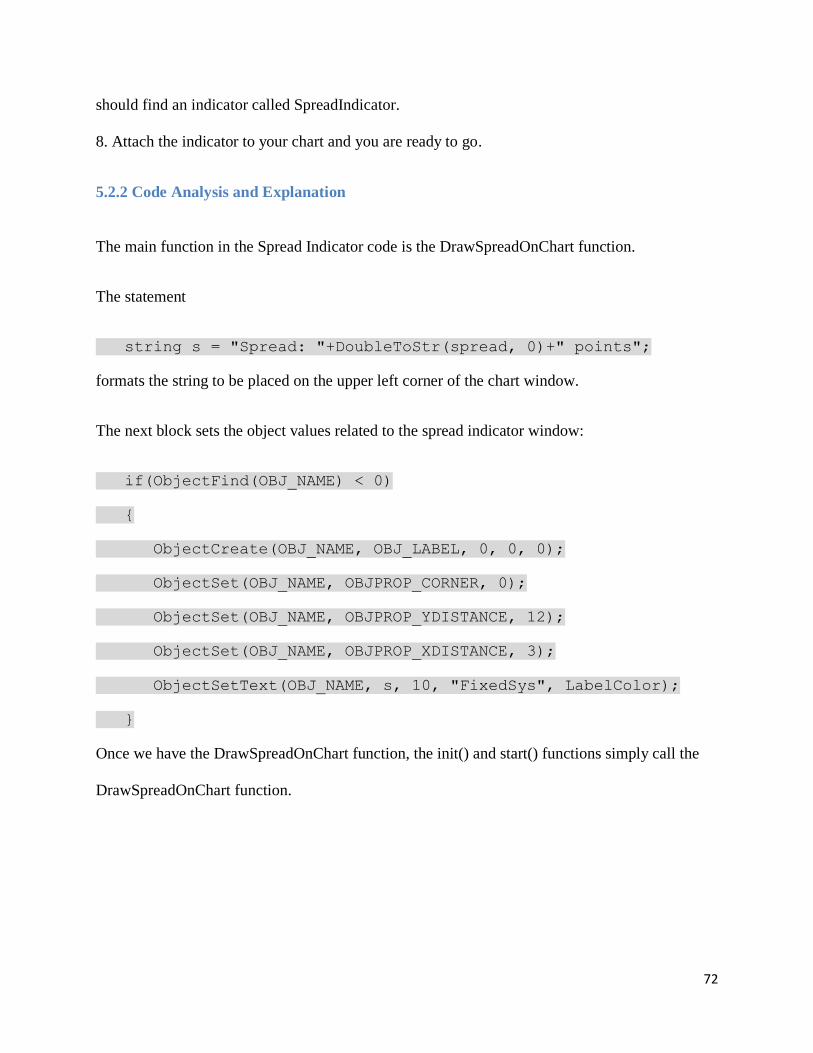
72
should find an indicator called SpreadIndicator.
8. Attach the indicator to your chart and you are ready to go.
5.2.2 Code Analysis and Explanation
The main function in the Spread Indicator code is the DrawSpreadOnChart function.
The statement
string s = "Spread: "+DoubleToStr(spread, 0)+" points";
formats the string to be placed on the upper left corner of the chart window.
The next block sets the object values related to the spread indicator window:
if(ObjectFind(OBJ_NAME) < 0)
{
ObjectCreate(OBJ_NAME, OBJ_LABEL, 0, 0, 0);
ObjectSet(OBJ_NAME, OBJPROP_CORNER, 0);
ObjectSet(OBJ_NAME, OBJPROP_YDISTANCE, 12);
ObjectSet(OBJ_NAME, OBJPROP_XDISTANCE, 3);
ObjectSetText(OBJ_NAME, s, 10, "FixedSys", LabelColor);
}
Once we have the DrawSpreadOnChart function, the init() and start() functions simply call the
DrawSpreadOnChart function.

73
6. Conclusions and Recommendations
6.1 Conclusions
The foreign exchange market is one of the world‘s largest and most liquid financial
markets. We systematically investigated the details and particulars of many aspects of forex in
this project. At the very beginning we learned the basics of forex market and forex trading,
which laid a solid foundation for later studies. Without the necessary concepts and theories in
mind we wouldn‘t be able to move to the next level, which is to perform practical trading using
real-time data in MT4. Practical trading gave us valuable experiences, let us consolidate what we
learned in theory and apply the techniques to real trading. We developed both fundamental and
technical analysis skills in this process. Fundamental analysis enabled us to have a high-level
overview of the forex market without being interfered with the short-time fluctuations. Technical
analysis provided us with systematic tools that gave us insight into the information and signals
contained in the prices. We also sharpened our money management and risk management skills
along the way.
After we became familiar with these techniques, we also started learning MQL4 to do
auto-trading. We learned the language from scratch and wrote our own customized indicators
and robots. Our programming projects include a Spread indicator and a Silver Trend robot.
Towards the end of the project we moved on to the subject of launching a money
management company. This is big subject, and we investigated the legal structure, money
management plans, licensing, performance measurement, and marketing aspects of it.

74
6.2 Recommendations for Professor Hakim
For Professor Hakim, we recommend more leeway in the scope of the project. If perhaps
a student was not a strong programmer, and instead wanted to focus on a certain method of
trading to optimize instead of the automated trading it should be allowed. There should be a
strong project goal in the beginning of what the student is supposed to accomplish, so that
everything leading up to that accomplishment of that project will be stepping stones to help them
on their way.
6.3 Recommendations for New Traders
Keep in mind that becoming a profitable trader is a never the end of the trip. Perfect
transaction does not exist. Try to do better every day and enjoy the process. Throw yourself into
learning technical analysis tools to improve your trading skills. This is more valuable than giving
too much attention to the everyday profit or loss.
When you have made a trading plan, encourage yourself and have a good feeling.
Comply with your own trading scheme - no matter it brings profit or loss. Always adjust your
trading scheme for a good reason.
Do not become over excited about a smooth transaction, and do not be too depressed
when losing. Try to calm down and use professional point of view towards your transaction.
Do not take for granted in a transaction. You are looking for the possibility of an
advantage, rather than trying to find sense under the shadow of doubt.
Have fun. No matter what happens take pride in your work. You can never be defeated
if you keep a positive attitude.
View every loss as a learning experience so you never make the same mistake twice. If
you never repeat the same mistake, you will eventually make money.

75
Your experience will shape your own transactions. If your first trading experience is
negative, then your long-term chance of remaining in this specific market goes down. Loss and
defeat have very negative impact on the psychology, and will last longer than physical injuries. If
you have not been overthrown by the unpleasant transaction, then this negative experience will
not mean too much to you.
Training plays an important role in shaping the views of traders. Formal training gives
you a first glimpse of the avenue to understanding the market - but does not guarantee success.
The vast majority of the knowledge learned in the university framework does not give you
knowledge about the details necessary to become a successful trader. In order to succeed you
must learn to seize the opportunity that others do not see, and you must find out from your own
knowledge lessons that can lead to success.
76
Bibliography
2011 Capital Market Services, LLC. "Psychology of Trading." CMS Forex.Web. 7 Mar 2012.
<http://www.cmsfx.com/en/forex-education/online-forex-course/chapter-3-technical-
tools/risk-management-creating-trading-methodolgy/psychology-of-trading/>.
2011 Investopedia ULC. "Series 65 Definition." Investopedia.com.Web. 21 Jan 2012.
<http://www.investopedia.com/terms/s/series65.asp#axzz1lGNTTAOd>.
"Advantages of Offshore Forex Brokers." Forex Trading Secrets. 25 June 2010. Web. 04 Dec.
2011. <http://secretforextrading.com/advantages-of-offshore-forex-brokers/>.
babypips.com. "Trade Balance." babypips.com. 2011.Web. 27 Oct 2011.
<http://www.babypips.com/forexpedia/Trade_Balance>.
Barber, Barrie. "Dave Camp: China an export opportunity, but 'trade abuses' hurt U.S. firms,
workers." mlive.com. 26 Oct 2011.Web. 27 Oct 2011.
<http://www.mlive.com/news/saginaw/index.ssf/2011/10/dave_camp_china_an_export_opp
o.html>.
Brain, Marshall, and Dave Roos. "How stocks and and the stock market work."
HowStuffWorks.com. 06 July 2011Web. 31 Aug 2011
<http://money.howstuffworks.com/personal-finance/financial-planning/stocks.htm>.
77
Capital Market Services, LLC. "Central Banks and Interest Rates." CMSForex.com. 2011.Web.
27 Oct 2011 <http://www.cmsfx.com/en/forex-education/online-forex-course/chapter-2-
fundamental-factors/central-bank-interest-rates/>.
"CFTC (Commodities Futures Trading Commission)." The CFTCs (Commodities Futures
Trading Commission) Role and Purpose. Web. 09 Mar. 2012.
<http://www.forexfraud.com/forex-articles/what-is-the-cftc.html>.
"Commodity Market." Investopedia. 10 Jan. 2012.
<http://www.investopedia.com/terms/c/commodity-market.asp>.
"Do Interest Rates Drive The Foreign Exchange Markets?" SG & Singapore Map. 02 Oct. 2011.
<http://www.streetdirectory.com/travel_guide/36986/investment/do_interest_rates_drive_
the_foreign_exchange_markets.html>.
"Division of Investment Management." U.S. Securities and Exchange Commission (Home Page).
Web. 24 Feb. 2012. <http://www.sec.gov/divisions/investment.shtml>.
"Economic System." Wikipedia. Wikimedia Foundation, 03 Aug. 2012. 07 Mar. 2012.
<http://en.wikipedia.org/wiki/Economic_system>.
"Effect of GDP on Forex Market?" WikiAnswers. Answers. Web. 08 Oct. 2011.
<http://wiki.answers.com/Q/Effect_of_GDP_on_forex_market>.
Ehrhardt, Jody. "How To Choose A Legal Structure For Your Business." MetaTrader Expert
Advisors. Web. 10 Feb. 2012. <http://www.iexpertadvisor.com/forex/how-to-choose-a-
legal-structure-for-your-business.html>.
78
Ekos Risk. ―Financial Advisory and Intermediary Services Act.‖ Ekos Risk. 11 March 2012.
<http://www.eikosriskapplications.com/RegulatoryInformation/FAISAct/tabid/8844/Default
.aspx>.
"Exchange-Traded Fund - ETF." Investopedia. 25 Jan. 2012.
<http://www.investopedia.com/terms/e/etf.asp>.
"Financial Advisor Is FSB Licensed." Find an Advisor. Web. 09 Mar. 2012.
<http://www.findanadvisor.co.za/content.asp?p=licensecheck>.
"Financial Services Authority - FSA." Investopedia. Web. 04 Feb. 2012.
<http://www.investopedia.com/terms/f/financial-services-authority-fsa.asp>.
"Five Chart Patterns You Need to Know." ChartAdvisor.com.Web. 6 Sept 2011
<http://www.chartadvisor.com/freereport/free_report_pg2.aspx>.
"Forex Brokers." EarnForex.com.Web. 6 Sept 2011. <http://www.earnforex.com/forex-
brokers/?sort=2>.
"Forex Indicator." ForexIndicator.org.Web. 8 Sept 2011.
<http://www.forexindicator.org/category/forex-indicator>.
"Forex Indicators." Forex Indicators.Web. 31 Aug 2011 <http://www.forexindicators.net/>.
"Forex Market." Investopedia. Web. 25 Jan. 2012.
<http://www.investopedia.com/terms/forex/f/forex-market.asp>.
79
"Forex Market Hours." Forex Market Hours. 2011.Web. 31 Aug 2011
<http://www.forexmarkethours.com/>.
Forex SOHO. "USA Employment Situation." Forex SOHO. 2011.Web. 27 Oct 2011.
<http://forexsoho.com/usa-employment-situation.html>.
"Forex technical vs forex fundamental analysis." ACM, FX Services of Swissquote Bank.Web.
Swissquote Bank SA. 31 Aug 2011 <http://www.ac-markets.com/forex-education/forex-
analysis.aspx>.
"Forex Trading Terminology." PFhub.com. 2011.Web. 31 Aug 2011
<http://www.pfhub.com/forex-trading-terminology/>.
"Forex Walkthrough." Investopedia.com.Web. 6 Sept 2011.
<http://www.investopedia.com/walkthrough/forex/getting-started/buying-
selling.aspx#axzz1XCtiGz7N>.
"Forex Walkthrough." Investopedia.com.Web. 7 Sept 2011.
<http://www.investopedia.com/walkthrough/forex/getting-
started/default.aspx#axzz1XJbpE66D>.
Forex-fundamental-analysis.com. "Forex Fundamental Analysis, Basics." Forex Fundamental
Analysis. 2011.Web. 27 Oct 2011. <http://www.forex-fundamental-analysis.com/>.
"Fundamental Analysis: What is it?" Investopedia.com.Web. 31 Aug 2011
<http://www.investopedia.com/university/fundamentalanalysis/fundanalysis1.asp#axzz1We
VV1CTs>.
80
"Futures." Investopedia. 25 Jan. 2012. <http://www.investopedia.com/terms/f/futures.asp>.
"GVI Forex Database: Free Forex Historical Data." GlobalView.com.Web. 7 Sept 2011
<http://www.global-view.com/forex-trading-tools/forex-history/index.html>.
Hedge Fund Lawyer. "What license do you need to start or manage a hedge fund?" Hedge Fund
Law Blog.Web. 21 Jan 2012. <http://www.hedgefundlawblog.com/what-licenses-do-you-
need-to-start-or-manage-a-hedge-fund.html>.
"The Impact of Inflation Measures on the Forex Market." Forextraders.com. 23 Feb. 2011. Web.
02 Oct. 2011. <http://www.forextraders.com/forex-strategy/the-impact-of-inflation-
measures-on-the-forex-market.html>.
"Indicator." Investopedia.com.Web. 31 Aug 2011
<http://www.investopedia.com/terms/i/indicator.asp#axzz1WeVV1CTs>.
International Encyclopedia of the Social Sciences. "Spreads, Bid-Ask." Encyclopedia.com.
2008.Web. 31 Aug 2011 <http://www.encyclopedia.com/doc/1G2-3045302575.html>.
Investopedia.com. "5 Ways to Measure Mutual Fund Risk." Investopedia.com.Web. 21 Jan 2012.
<http://www.investopedia.com/articles/mutualfund/112002.asp#axzz1oUPlUR2U>.
Investopedia.com. "Treasury Budget." Investopedia.com. 2011.Web. 27 Oct 2011.
<http://www.investopedia.com/terms/t/treasury-budget.asp#axzz1brPIQVNy>.
Karagiannis, Athanasios. "GDP Growth." OnlineForex.net. 2011.Web. 27 Oct 2011.
<http://www.onlineforex.net/macro/gdp-growth/>.
81
Kelvin. "200 Day Moving Average Trading System." ForexIndicator.org. 21 May 2010Web. 29
Sept 2011 <http://www.forexindicator.org/200-day-moving-average-trading-system.html>.
Kelvin. "Forex Bollinger Bands Explained." ForexIndicator.org. 7 Jan 2010Web. 29 Sept 2011
<http://www.forexindicator.org/forex-bollinger-bands-explained.html>.
Kelvin. "Forex Fibonacci Indicator Explained." ForexIndicator.org. 17 March 2010Web. 29
Sept 2011 <http://www.forexindicator.org/forex-fibonacci-indicator-explained.html>.
Kelvin. "Forex Pivot Point Trading Tutorial." ForexIndicator.org. 24 May 2010Web. 29 Sept
2011 <http://www.forexindicator.org/forex-pivot-point-trading-tutorial.html>.
Kelvin. "Forex Stochastic Indicator Explained." ForexIndicator.org. 2 June 2010.Web. 29 Sept
2011 <http://www.forexindicator.org/forex-stochastic-indicator-explained.html>.
Kelvin. "Forex Support and Resistance Indicator Explained." ForexIndicator.org. 22 Aug
2010Web. 26 Sept 2011 <http://www.forexindicator.org/forex-support-and-resistance-
indicator-explained.html>.
Kelvin. "How To Trade MACD Divergence." ForexIndicator.org. 2 Jan 2010Web. 29 Sept 2011
<http://www.forexindicator.org/how-to-trade-macd-divergence.html>.
"Index Fund." Investopedia. 25 Jan. 2012.
<http://www.investopedia.com/terms/i/indexfund.asp>.
Lien, Kathy, et al. "Forex Tutorial." Investopedia.com.Web. 6 Sept 2011.
<http://www.investopedia.com/university/forexmarket/#axzz1XCtiGz7N>.
82
"Long." Investopedia.com.Web. 31 Aug 2011
<http://www.investopedia.com/terms/l/long.asp#axzz1WdXKFHWH>.
MQL4 Community. "MQL4 Reference." MQL4 Community. 2011.Web. 27 Oct 2011.
<http://docs.mql4.com>.
"Mutual Fund." Investopedia. 25 Jan. 2012.
<http://www.investopedia.com/terms/m/mutualfund.asp>.
"NFA (National Futures Association)." The NFAs (National Futures Association) Role in the
Forex Market. Web. 09 Mar. 2012. <http://www.forexfraud.com/forex-articles/what-is-the-
nfa.html>.
"Open-ended Investment Company." Wikipedia. Wikimedia Foundation, 03 Apr. 2012. Web. 20
Jan. 2012. <http://en.wikipedia.org/wiki/Open-ended_investment_company>.
Ross, Dave, and Marshall Brain. "How Stocks and the Stock Market Work." HowStuffWorks. 20
Feb. 2012. <http://money.howstuffworks.com/personal-finance/financial-
planning/stocks.htm>.
"Series 65 License." Wikipedia. Wikimedia Foundation, 15 Dec. 2011. Web. 08 Mar. 2012.
<http://en.wikipedia.org/wiki/Series_65_license>.
"Short." Investopedia.com.Web. 31 Aug 2011
<http://www.investopedia.com/terms/s/short.asp#axzz1WdXKFHWH>.
83
"Stock Basics." Investopedia.com.Web. 31 Aug 2011
<http://www.investopedia.com/university/stocks/stocks1.asp#axzz1WeVV1CTs>.
"Stock Exchange." Encyclopædia Britannica. Encyclopædia Britannica Online Academic
Edition.Web. Encyclopædia Britannica, 2011. 30 Aug 2011.
<http://www.britannica.com/EBchecked/topic/566714/stock-exchange>.
"Technical Analysis: Introduction." Investopedia.com.Web. 31 Aug 2011
<http://www.investopedia.com/university/technical/default.asp#axzz1WeVV1CTs>.
"Technical Indicator." Investopedia. Web. 20 Feb. 2012.
<http://www.investopedia.com/terms/t/technicalindicator.asp>.
"Top 5 Factors Affecting Exchange Rates." OANDA. Web. 03 Oct. 2011.
<http://fxtrade.oanda.com/learn/top-5-factors-that-affect-exchange-rates>.
Ward, Susan. "Cash Flow Management." About.com.Web. 21 Jan 2012.
<http://sbinfocanada.about.com/cs/management/g/cashflowmgt.htm>.
Ward, Susan. "Writing the Business Plan." About.com.Web. 21 Jan 2012
<http://sbinfocanada.about.com/cs/businessplans/a/bizplanfinanc_4.htm>.
Wooding Trading. "Trading Times For The U.S. Stock Market." woodingtrading.com.Web. 31
Aug 2011 <http://www.woodingtrading.com/trading-times.html>.
YAHOO Finance. "Treasury Budget." YAHOO Finance. 14 Oct 2011.Web. 27 Oct 2011.
<http://www.fxpro.com/yahoo/news/economic-calendar/show-event?evid=FTT447252>.
84
Queen‘s Printer for British Columbia. ―FINANCIAL INFORMATION ACT (FIA) GUIDANCE
PACKAGE.‖ Queen‘s Printer for British Columbia. 2002. Web. 11 Mar 2012.
<http://www.fin.gov.bc.ca/ocg/fmb/FIA/FIA%20Guidance%20Package.pdf>

85
Appendixes
Gartman Letter Reviews
September 2011
At the beginning of the week, Prime Minister Papandreou cancelled his visit to the US
that as set up a long time ago; the Greek fiscal circumstances are becoming worse and worse;
these made the EUR gapping downward the beginning of the week. Mr. Gartman
recommended short of EUR then, and added to their short position Monday morning.
There are fresh calls for Prime Minister Berlusconi to resign his position following
reports that several businessmen in Italy‘s south secured women for the President in order to
win lucrative government contracts from Rome. Italy‘s reputation is suffering with each new
revelation regarding the Prime Minister.
Over the week, share prices were higher at the start of the week, but it didn‘t last long.
On Thursday it‘s almost collapsed.
The dollar strengthened after the Federal Reserve announced "Operation Twist", its
much-anticipated economic stimulus plan. The Fed intends by the end of June 2012 to
purchase $400 billion of Treasury securities with remaining maturities between six years and
30 years and to sell bonds maturing in three years or less. Mr. Gartman thinks that this action
is sterile as far as monetary policy is concerned for the swap is ―dollar-for-dollar;‖ that is no
new money shall be force fed into the banking system.
He also says that he will not be a relentless supporter of FOMC policies anymore,
because a modest 10-15 basis point downward shift in mortgage rates shall not have any
effect beyond that which is utterly marginal upon the housing market, and shall not spur
employment growth; rather, the damage done to the nation‘s banks is and shall be material,
86
and it will spur concerns amongst the monetary cognoscenti and amongst the public at large
that the monetary authorities are panicking. Concerning trading, there has been some support
for the EUR vs. the US dollar on night of 9/21 at the 1.3525 level, but following 9/21's
―reversal‖ to the downside, it seems but a matter of time until that support is ―given‖ and the
EUR falls sharply. They are already short of the EUR outright and it is their intention to add
to that short position when 1.3525 is ―given‖ and remains so for an hour or more.
The US dollar still reigns supreme as the world awaits the now inevitable default by the
Greek government on its debt obligations. Current situation verifies Mr. Gartman's previous
guess that a default by Greece was surely to be happen and it's only a matter of time. The delay
in announcing a Greek default is simply to allow the European banks time to shore up their
defenses. Pushing the Greeks into austerity program is illogical and will win almost no support.
It is also impossible for the banks in Europe to "ring fence" the damage that shall be wrought by
a Greek default, because no political leader will be able to tell their people that they will still be
paying the outstanding debts regardless of Greece's default.
In Russia, it is clear that Mr. Putin will run for the Presidency instead of Mr. Medvedev.
Putin also said that the decision to have him rather than Medvedev run for the Presidency was
made years ago, meaning that the passing of the presidential baton from Putin to Medvedev and
back to Putin was Putin's decision all along. President Medvedev was the President in name only,
and Putin was the true political power.
September is ending and the dollar is mixed as all attention is focused upon Germany where
the members of Germany's parliament will vote on whether Germany shall join with the other
nations in Europe that have already voted to support the proposed bailout of Greece. Mr.
Gartman says affirmatively that the proposal will pass because Germany itself has benefitted
87
greatly from the European Monetary Union. According to the EMU's own requirements, such
votes have to be unanimous -- each and every nation within the union has to approve for the
proposal to pass. Thus far, each nation that has voted has voted "yes", and all eyes then are on
Germany.
Mr. Gartman previously expected the "Commodity" currencies, which include the Aussie,
the Kiwi, the Canadian dollars, Brazilian Real and Mexican Peso to stay in a bullish run.
However these currencies have fallen dramatically on the forex market in the past two days as
gold, energy and the grains have all fallen.
On Sept 28, Dr. Bernanke spoke, and his comments are a bit surprising for he made it clear
that should inflationary pressures subside the Fed would take action rather readily. He said the
Fed might need to ease monetary policy further if inflation or inflation expectations fall
significantly and indicated a willingness to push toward even more unconventional policies if
economic growth wavers or deflationary pressures appear.
October 2011
The EUR has rebounded a bit since October 4 and given the severity of the EUR‘s weakness
in the preceding several days no one anywhere should be surprised by this bounce. Mr. Gartman
said that the EUR might make its way back to 1.3280-1.3305 on the 5th or 6th, but that was very
likely the very best that it can summon up. The upper boundary had been passed for a little bit,
then fell back again, then bounced on the news that the now rather infamous Belgian bank,
Dexia, has been ―ring-fenced‖ and its failure less likely to prove fatal to the other banks in
Europe. On the 4th Dr. Bernanke spoke to Congress in the very bluntest of terms. Mr. Gartman
thought the Congress needs to be spoken to in those terms and applauded the Fed Chairman for
taking Congress to task in this manner. He told Congress that the US was ―close to faltering‖;
88
that the Fed still has monetary weapons that can and will be used if must needs, and that the duty
to aid the faltering US economy has been pushed from the backs of the monetary officials to the
legislative and fiscal officials instead; that the Fed stands ready to take additional steps to aid US
economic growth but it is absolutely necessary that Congress ―avoid fiscal actions that could
impede the ongoing economic recovery.‖ He also made it clear that that was not sufficient
however to sustain growth and that more fiscal certainty ―will be needed to achieve fiscal
sustainability.‖
Japan, the most seriously indebted of the G-7 nations, pledged support for the ESFS. The
Chief Cabinet Secretary of the new Noda government, Mr. Osamu Fujimura, said today in Tokyo
that the government there was prepared to buy bonds from the ESFS for Japan wishes to
―support Europe‖ when and where it can. Japan presently holds 20% of the ESFS bonds
outstanding, which is quite surprising.
The European Monetary and Economic Affairs Commissioner, Mr. Olli Rehn, yesterday
said that although in the past the European authorities had taken no action on bank
recapitalization efforts, now they‘ve no choice but to consider such actions.
New Jersey‘s Governor, ―Chris‖ Christie formally removed himself from a run for the
Republican nomination for the Presidency and Mr. Gartman thinks it a very wise decision on the
Governor‘s part. Gartman said that although he had materially more ―governance‖ background
for a run to the Presidency than President Obama had four years ago when he ran, two years as a
Governor is hardly sufficient background to become the President of the United States of
America.
Steve Jobs passed away on Wednesday. ―The world has lost a visionary, and there may be
no greater tribute to Steve's success than the fact that much of the world learned of his passing on
89
a device he invented,‖ President Barack Obama said. All around the world, it seems, people
used the technology Jobs created to remark on his impact and his passing.
The major trend remains firmly against the EUR and that it is but a matter of time until the
small upward sloping trend in the course of the past three sessions since the low of 1.3170 was
made earlier this week is broken and new and lower lows are made.
Looking at the chart of the EUR in hourly terms going back into mid-August it is clear that
every new low for the EUR relative to the US dollar is lower and so too every interim high.
There is a pattern to be respected with strength to be sold aggressively while weakness is only to
be bought tentatively and in smaller size. The big picture is clearly bearish of the EUR. The
―huge‖ trend defined by the thickest red line is toward a weaker EUR, and the ―minor trends‖…
and they are minor only in terms of this chart for they do encompass moves of severe tens of
―Big figures‖… have each failed rather obviously. The last ―minor trend‖ failed at 1.500, and
the upward sloping trend line was broken at or near 1.4000. Mr. Gartman still believes that
Greece weighs heavily upon the collective mindset, and even if Greece is put aside and allowed
to default quietly and without fanfare, it shall be but a matter of time until Italy defaults, and/or
Portugal defaults, and/or Italy defaults et al. The debt burdens taken up by these governments
cannot and will not be paid in full. The only question is by how much their debt shall be marked
down and when.
November 2011
Recent macroeconomic issues as discussed in the Gartman Letter include the intervention
of the Japanese government to slow the rapid increase of the Yen. Mr. Gartman believed this
intervention to be long overdue, I‘m not so sure. The newly appointed Minister of Finance, Mr.
Jun, while just getting used to his position would not want to act overly hasty. He did intervene
90
however and with quite a large sum of money. Thus far, the BOJ/MOF has been in only once as
we understand it, and if the Ministry wishes truly to make its position known and to prove to the
market that it intends to fight the Yen‘s recent strength to the best of its abilities. I wish the best
of luck to Mr. Jun and the Japanese government.
Prime Minister Papandreou has rashly decided that a referendum shall be held to
determine the future of Greece within the Monetary Union. In response to this brash action,
Greece has been told that all further monetary aides to Greece will be withheld until the
referendum is held and passed. Greece was also warned that non-passage of the referendum
would be a bankruptcy and thus would be a ―credit event‖ thus bringing the CDS question back
into the light. It is now clear also that Mr. Papandreou was harshly summoned to Cannes last
night and met with French President Sarkozy and German Chancellor Merkel who questioned
the Greek Prime Minister on his actions, on Greece‘s ability to pay its debts, on the political
situation there, et al ad seemingly infinitum. As we understand it, Mr. Papandreou was told to
restructure the referendum from being a mere approval/or disapproval of the austerity programs
that Greece is being forced to go through to become a full vote in favor of or opposition to
Greece‘s membership in the European monetary and political unions.
As usual, Greece‘s actions do not only affect Greece. It is almost as though Greece looks
no further into the future than the next ten minutes. The problem is now that if the Greek public
is allowed to vote on austerity, what shall stop the Italian and Spanish and Portuguese
governments from doing the same? Indeed, what shall stop the Italian, Spanish and Portuguese
people from demanding the same sort of democratic vote on austerity that the Greeks shall be
given? The answer, obviously, is that nothing shall stop them from doing so, and nothing shall
stop the political leaders of these countries from hiding behind the façade of democracy in
91
making those calls. Apparently, no matter the amount of solutions we throw at Greece‘s feet,
they are intently trying to make everyone else look just as bad as they do.
Papandreou backed down over his referendum plan as it became clear that Greece faced
the prospect of going bust within weeks after EU powerhouses Germany and France threatened
to withdraw further financial support for the country until after the popular vote was held.
Over the past couple of days, attention has focused more on Rome than on Athens amid
concerns that Italy's economy was heading the same way as Greece's. The fear that Italy is
running out of time to get a handle on its debts hit markets in Europe hard Wednesday even
though Italy's Premier Silvio Berlusconi pledged to stand down, echoing a similar decision from
Greek Prime Minister George Papandreou. Berlusconi became the biggest political casualty of
Europe's debt crisis on Tuesday when he announced he would step down after being stripped of
his majority in parliament.
The news that Berlusconi had finally agreed to resign came after European markets
closed but had an immediate positive impact on markets in the United States. The euro jumped
against the dollar and U.S. stocks edged up. Even when Berlusconi goes, there is no guarantee
that reforms to cut the debt mountain and boost growth will be quickly implemented, and relief
on markets may not last long. There is no agreement among political parties on either a national
unity or technocratic government.
Italy is the third-largest economy in the EU, and the eighth largest on the planet. Its
outstanding debt of €1.9 trillion (£1.6 trillion) accounts for 25 per cent of all the debt in the
eurozone. The Greek crisis was never a serious threat to Europe. Greece accounts for less than
two per cent of the EU‘s economy. A default by Athens could be managed as a controlled
explosion. A default by Rome, on the other hand, would blow the European economy to pieces.

92
For several years, markets pretended that all debts in the eurozone were equally safe — that
Italian and German debt, for example, was interchangeable. Eventually, though, the realization
sank in: the Italian economy was not growing, which meant its debt, in relation to its GDP, was
as high as ever. On November 9th, panic set in. Those who have lent money to Italy are no
longer confident that they will get it back. Naturally enough, they demand a higher interest rate
to compensate for the risk of losing their loans. Their fear thus risks becoming self-fulfilling, as
Italy is unable to afford the interest rate. The prospect of Italy defaulting on its debts looms.
The movement of gold as of late is very telling of the state of the market. Gold prices are
rising relative to just about every currency, and this is because of the panic. People‘s reactions to
problems can often cause problems worse than the originals. Mass panic has begun to set in
about the problems of Europe, and the whole world seems to be reacting the same way, buy gold.
History shows us that as turmoil and panic set in across the globe, no matter the reason, people
always turn to gold as a backstop. When a nation‘s currency is in question, people often prefer
the security of gold as its value is accepted worldwide. Since Europe‘s currency is in question,
the reaction to buy gold came tenfold. Gold soared even relative to the US dollar. The fact that
America is bracing for the explosion that is sure to come from Europe‘s fallout raises gold‘s
value even more. The end result being that those who held the long position in gold as Mr.
Gartman suggested are now raking it in.
Over the weekend Mr. Berlusconi has stood down, leaving Mr. Mario Monti to try to
form a government. In Greece, Mr. Papademos has also assumed the Prime Minister‘s position,
following the resignation last week of Mr. Papandreou. These two men will try to reform their
economies so that they can have a financially secure term, but MR. Gartman fears that this is
close to impossible. Mr. Papademos has to try to push through severe and we think untenable
93
tax increases and spending cuts that few will be willing to accept. Later on in the week
confusion and chaos grew to frightening levels. The market became frantic, and sporadic. Mr.
Gartman stated that ―all good news is bad news and all bad news is horrid news.‖ That about
sums up the state of the market, but I will add a few more dramatic lines. I wonder if this is how
the market would act if the world was ending. It‘s an interesting thought. However, this is kind
of what is happening. The people cannot put their trust in the banks or their countries. It is as
though we went back in time and people are afraid that if they put their money in a bank, the
bank might get robbed and their money will be gone. The Europe economy is going in a
downward spiral and people their investments will be gone. At this point in the game, if a
country is anywhere near Europe, it suffers. As a result, the US, Canada, Mexico and even
Brazil have somewhat benefited from Europe‘s misfortune.
On our side of the ocean, President Obama called upon China to stop ―gaming‖ the
system and asked that China begin to act like a ―grown up‖ economy. These remarks were based
on China‘s unusually low currency which has enabled China to grow its freakishly large export
business. Mr. Gartman fears there will be political retribution for his statements.
These past couple of weeks has been big news for the forex market, and most of it isn‘t
good. Last week Germany tried to sell 10 year bonds, and 35% went un-bid for. This is
extremely bad news for everyone. For Germany not to be able to sell these bonds, when
Germany is arguably the most financially stable, does not bode well for the rest of Europe.
Overall, the EURO has plummeted, and Mr. Gartman expects it to drop down to 1.25 and keep
going. For Germany to experience such a catastrophe immediately changes things. As far as
traders are concerned, Europe in of itself cannot be trusted. As confusion and hysteria build,
people turn to the Canadian dollar, gold, and other hopefully stable enterprises. In a press
94
conference, Italy was forced to acknowledge, essentially, that it would adhere to any standard
Germany set forth. The IMF is going to try to come to the aid of Europe, but it does not seem
possible to get the American, or Canadian people to approve their money be spent on Greece‘s
mistakes. At this point the nations of Europe are bracing for impact, and Mr. Gartman explained
why. The outcome is by no means concrete, but Mr. Gartman believes that the European
experiment might fail. The result from this is the spiraling economies of everyone who is in, or
invested in, Europe. The effect of this disaster is much like an atomic bomb, even being near the
source causes you great sickness from radiation. I feel like this is what Europe has become, a
bomb waiting to go off. This bomb will destroy all of Europe, and have horrible effects on any
that are close. There is only so much one can say about the tragedies of Europe before one can
take no more, so let‘s move on to other matters.
The US was warned that it had to control its debts soon with substantial proof of what we
were going to do and the steps we have already taken to control our deficit. We seem to be
failing spectacularly in this regard. Poland went on record saying that it feared German power
less than it feared German inactivity, as Germany continues to do nothing to help with the
current crisis.
Not a Macroeconomic issue by any means, but I would like to address the letter Mr.
Cooperman wrote to the president. The Gartman Letter included its entirety in this morning‘s
issue. It was a well-written and thoughtful piece, and I wholly agree. To lead this wonderful
nation, of which I have called home for all of my life, into despair simply to maintain power is
despicable. Most likely, Mr. President has good intentions, and as much love for this country as
I do, but he needs to do something about this problem. He has the means and the motive to
accomplish what needs to get done, but is caught up in the debate and politics of the office. I
95
believe that if the President addressed the people and Congress publicly stating exactly what
needs to get done, what we must sacrifice, and how we would do it, it could get done. But still
the answer is shrouded in political speak and debate, and I am tired of it. Say what you need to
say and be done with it.
January 2012
Greece came out to solve the debt problem recently, causing the market to focus on the
European debt problems (at least with the Greek-related issues). Viewing from the evolution of
the situation, Greece's determination was firm. The slightly mandatory large-scale debt write-
down will reduce the debt pressure on Greece, and if the Greek problem could be effectively
resolved, Europe will be given a very positive emotional stimulus.
Greek Prime Minister said that the creditor may be forced to accept losses; it has been
reported that Greek Prime Minister would consider legislation to force creditors to accept losses,
it was expected that debt restructuring negotiations will be successful; from a series of messages,
the attitude of Greece is particularly strong this time, I believe Germany and France are
supporting it from behind, and if the negotiations can be successfully resolved, the Greek
problem might begin to evolve to a positive situation.
As for the Fitch Ratings, Italian rating may be cut by two levels, the future of Italy's
rating decision will be based on its growth initiatives and financial situation; Although the Greek
problems seem to begin resolving, the rating agencies are still very critical on other European
countries. At least Italy was issued a warning. These all show that the European debt problem
will not be fully resolved in the short term.
At the end of last week the Euro rallied and surprised Mr. Gartman. This is the result of
some ‗talks‘ in Europe about how to deal with the new progression of the European crisis. Mr.
96
Gartman is not optimistic about the outcome of such talks. He says ―All we know for certain is
that Greece is indeed the most basketed-case of basket cases, and it is only a matter of time until
Greece removes itself from the Euro-zone and/or is removed by others, but not until even more
money than has thus far been tossed into this very black and blackening hole shall be tossed in
and lost.‖ For Greece at least, Mr. Gartman has the foreboding sense of apocalyptic proportions.
Mr. Gartman predicts it will be soon that the Greece will be booted out of the European Currency
system. The Greek Finance Minister, Mr. Evangelos Venizelos, met with Mr. Charles Dallara of
the Institute for International Finance regarding the progress being made on the Greek debt issue.
Mr. Gartman said that if the meetings continue, a deal has been made, and if not more bad news.
Early this week, Greece has the attention of the world again as there was a meeting in
Brussels to determine how much the Greek people could help in the resurrection of Greece‘s
economy. Basically, they can‘t really help, and the private debt owners are going to take a loss
of about 70%. Mr. Gartman calls it a default in all but name. Finance Ministers of the Euro-
zone rejected the offer put forth by the private holders of Greek debt to restructure that debt.
Meeting in Brussels, the Euro-zone ministers said that they simply could not accept the demands
made by then bondholders for a 4% coupon on the now longer dated securities that they will be
forced to hold as Greece restructures its debts. Mr. Gartman has his opinion of the matter,
―Quite simply, our sympathies are with the debt holders and not with the Greek government nor
with the Finance Ministers, for neither would we accept anything approaching what the Finance
Ministers and ―Brussels‖ would want us to accept.‖
By Wednesday the world had different shocking news to focus on. The Japanese
Government reported its first annual trade deficit in more than three decades. Mr. Gartman
begins to wonder how long after this report will Japan be able to support itself from its export
97
business and to pay off its debt. There have been several contributing factors to this report
including the Tsunami that hit Japan which caused its fuel imports to rise, and its aging
population. The birth rate in Japan is less than the death rate and the declining population has
been a serious problem for many years. It is now apparent that it is finally taking its toll on
Japan‘s debt. Because the Japanese people are not plentiful enough to buy all of Japan‘s debt,
the Yen has started to weaken considerably. We will have to wait to see the full outcome of this.
Late last week the Fed announced that it will be keeping the lower interest rates through
late 2014 as opposed to mid 2013. Mr. Gartman explains why this happened, ―In reality that is
what the Fed is down to given that the o/n fed funds rate is already effectively zero. The rate
cannot be taken any lower, so all that is left is to extend the duration of this current ―stable‖
policy. This is easing in the ―New Normal‖ world. Reviewing as we might what the Fed has
done, it appears to us that the Fed sees modestly slower growth and less inflation over the next
few years, and as a result is prepared to hold rates steady. In the process the Fed has apparently
adopted an inflation target of 2%. So long as the Fed‘s perception of inflation remains below that
level the need or propensity to tighten monetary policy shall be at or near nil.‖ This means that
the Fed is keeping interest rates low so as to encourage borrowing from the people and banks to
boost the economy. This is imperative because the fed feels as though this economic crisis is the
gateway to tomorrow.
On Friday the announcement came out of actual progress with the Greek debt situation.
With the two sides split between 3.25% and 4.00%, the settled in the middle at 3.75%. Greek
made some statements that there would be more talks over the weekend but the matter is
basically settled. Yesterday, the head of the IMF, Ms. Christine Legarde, said that the European
Central Bank really has no choice but to accept rather substantive losses on its holdings of Greek

98
debt. Mr. Gartman adds, ―As one source said anonymously, it would be outrageous if the ECB
doesn‘t take part in [the Public Sector Involvement] as keeping their Greek bonds to maturity
would allow them to make a profit while everybody else is taking 70 per cent losses or more.
The ECB, we are told, own approximately €40 billion of Greek debt, a not insignificant portion
of its portfolio. The debate thus far has focused upon the coupon on the next debt tranche.‖ This
means that the debt of Greece actually has a chance of being resolved.
Early this week the Aussie dollar took a large hit because it was put on watch by Filtch.
The reaction seems kind of extreme given the comparative nose dive Greece had and the EUR is
still stronger than the Aussie. Over the weekend an agreement seems to have been struck and
will be announced regarding the Greek people and the Greek debt. Mr. Gartman adds, ―the
leaders there have finally agreed to a permanent rescue fund and will sign-off on the agreement
at a meeting there today in Brussels. Firstly, it does appear that we have ―summit meetings‖ on a
rather regular basis these days, but then again there seems to be problems of an egregious order
on a regular basis also. We are told that there has been ―progress‖ made on talks between private
holders of Greek debt and the Greek government, but we‘ve not seen anything concrete yet and
things could still go ―pear shaped‖ before a true agreement is reached and signed. But for now,
barring some disconcerting news, it would appear that some agreement shall be reached.‖ The
European Stability Mechanism has also been created and will combine funds with the EFSF to
create a super account in which to bail out Greece. However, Germany, as always is opposed to
the plan and will not sign off quite yet. We will see where this leads.
Later in the week the news spread that Greece would be bailed out of its troubles, at least
for a time. Mr. Gartman tells us, ―Only the UK and the Czech Republic have refused to sign
what is now being referred to as a ―fiscal compact.‖ This compact puts into place supposedly
99
automatic sanctions to be imposed upon countries that abrogate the EU budget deficit limits and
puts into law, eventually but immediately, balanced budget rules into national law.‖ With this
news out and around, the politicians everywhere are breathing a sigh of relief and saying ‗look,
we fixed it‘. However, if our bailout of the economy is anything to go by there will be trouble
brewing, and soon.
Overview of Macroeconomic Issues during the Project
This is an overview of macroeconomic issues that were not covered in the Gartman Letter.
In mid-October, German Chancellor Angela Merkel said that the EU summit will make a
clear commitment to stability in the euro area; the Slovak Parliament approved expansion of
EFSF in the second round of voting, thus, the 17 euro countries passed the expansion. The
continuous good news made investors feel that Greece could still be saved, but other factors
could not be ignored. Greece's economic was stagnant, if Greece could not go on a fast
development track, then it would be difficult to avoid bankruptcy. Greece needs a new round of
aid to meet their urgent needs, but other countries and investors proposed stringent conditions,
which may make the economy worse. Even if the difficulties are temporarily solved in Greece,
the promotion of those harsh austerity measures would be even more difficult for the Greek
cabinet to carry out. Collective resistance from the people, the constant pressure from the
opposition, the economic performance in the future would further put the Greek government into
dilemma.
Only a few days later, German Finance Ministry spokesman Martin Kotthaus said that
EFSF will not expand to over 440 billion Euros, and that the German contribution to the EFSF
will not exceed 211 billion Euros. German officials denied the expansion of EFSF; this to some
100
extent limited the euro's gains. However, market risk sentiment remains high, for the upcoming
EU summit weekend is full of expectations.
However, German Finance Minister Schäuble's presentation posed a direct challenge to
the above expectations, making a cloud of uncertainty. German Finance Minister Schäuble said
that European Union (EU) summit on the European debt crisis is not expected to produce the
final solution, extinguished good expectations. German Chancellor Angela Merkel's spokesman
Steffen Seibert warned that the EU summit producing a final solution to solve the debt crisis is
"unrealistic fantasy." EU summit on October 23rd failed to solve the debt crisis in Europe on
providing a rescue package, but still made some progress, such as the EU leaders agreed on bank
capital restructuring and relief fund playing a greater role; agreed to release 8 billion to Greece.
Germany and France's views on some important issues still have considerable differences, such
as how to make Greek debt controllable, how to expand the EFSF scale. As opposed by
Germany, France has given up to let the European Central Bank to provide unlimited funding.
The European bailout package of the summit was difficult to see short-term results. The
Italian bond yields approached record highs again. German Bundesbank President Weidmann
commented that EU assistance program enacted is based upon the sufferings of the European
countries; the European economy will remain mired in the doldrums. The double pressure of
speech and news pulled down 340 points of the euro. The hard-won gains were lost in a day.
In America, the 2008 financial crisis started from the collapse of Lehman Brothers. After
that the U.S. government together with the global financial system curbed further spread of the
crisis. But the debt crisis in Europe and in America is just a microcosm of the financial crisis in
2008. Given the opportunity, the crisis will re-erupt. The fuse appeared on October 31st, when
the world's leading global futures brokerage MF Global announced shortly after the market
101
opening in Wall Street that they filed for bankruptcy protection. The cause of this financial crisis
was that they held large amounts of euro zone sovereign debt which was downgraded, leading to
lack of liquidity. Although the Man Group could not be of the same impact level and the same
type of funds compared to the Lehman Brothers, its main lenders included JP Morgan Chase
Bank, Citibank and Bank of America.
Early November, the Greek Prime Minister Andreas Papandreou's decision to carry out a
referendum to accept the new rescue plan from EU shocked the market. The market feared
people in Greece will struggle to prevent accepting rescue plan, causing the rescue plan to be
stranded. People's fear that Greece would default or even out of the euro rose sharply again.
European stocks and U.S. stock futures also fell sharply, among which Germany and France fell
more than 4% intraday stock; euro, Australian dollar and other major non-US currencies also fell
sharply. Greek's referendum for the rescue plan put Greece into a very dangerous position. If the
referendum fails, Greece will immediately default and quit the euro zone. Even if the referendum
succeeded, it makes the recent market stuck in the shadows. French and German leaders asked
George Papandreou for an emergency meeting in Cannes, France, urging the rapid
implementation of the Greek aid agreement before G20.
Papandreou said in his speech to the Cabinet, Greece's primary responsibility was to
avoid national bankruptcy. The vote of confidence at the Congress was critical, and all the
problems could be discussed with the opposition. He appreciated opposition's attitude on EU's
new rescue plan. He also said that if the opposition in Congress was to support, then Greece
would not hold a referendum. Papandreou reiterated the Greek membership in the euro area was
not a problem, but an immediate general election would increase the domestic banking
bankruptcy risk. Papandreou also said that although Greece refused to accept aid could mean that
102
Greece would be out of euro zone, and its position has been at stake, but Greece would never put
the euro membership as a problem in a referendum.
On November 3rd, European Central Bank announced interest rate decision. Interest rate
was surprisingly cut by 25 basis points, causing the benchmark interest rate to go from 1.5% to
1.25%. This decision surprised the market, causing euro and US dollars fell sharply. The new
European Central Bank President Mario Draghi said to prevent the euro from the economic
recession before the end of 2011 is the main reason for the cut. Drudge's resolution made the
market more and more unsure of the next ECB policy. In response to the global slowdown of
major economies, many countries, whether it is in the developed markets of the United States,
Europe, Japan, Britain, Sweden, Israel, Australia, or the emerging markets of Turkey Brazil,
Russia, Indonesia and Romania, recently have begun to ease monetary policy.
As the European Central Bank continued to buy Italy's government bonds, Italian was
eased of the debt crisis concern. At the same time, the Italian Senate and House have decided to
vote this week on the Stabilization Act. Greece has appointed former vice president of the
European Central Bank as the new prime minister. Multiple indications showed that Italy and
Greece were resolving the political deadlock.
In Germany, on the 10th, German Chancellor Angela Merkel said Germany had always
sought "within the existing framework" to resolve the current debt crisis in Europe. She said that
since the debt crisis broke out in Europe, the German government has only one goal, which is to
stabilize the euro area under the existing framework of monetary union so as to make it more
competitive while improving the integration in the financial field. Also, rumors of the
establishment of "core euro area" had also been denied by SEIBERT, the German government
103
spokesman. He said Germany would not consider this "core euro area" program, and will adhere
to the "whole" to find a solution to Europe's debt the problem.
With the deterioration of European sovereign debt crisis, the euro zone leaders failed to
effectively curb the further spread of the crisis as soon as possible. Recently the voice of issuing
euro bonds sounded again, but on the issuance of euro bond, there are still large disagreements
within the euro area. Because of the deep mire of debt crisis in Greece, Portugal, Italy and other
countries, they fully support the issue of euro bonds, thinking it as the only truly effective
measure. However, Germany, the euro-zone economic locomotive, has strongly opposed this,
suggesting that they have no intention to share the debt of other countries. Market analysts said
the euro bond issuance is full of uncertainty. However, there were still some optimists on the
issuance of euro bonds. They thought that the current financial situation in Italy gradually
increased the risks of losing control. While the European Central Bank continued to buy Italian
bonds to down their yields, this did not play a significant effect. Once Italy defaulted the
consequences would be disastrous. German Chancellor Angela Merkel will likely change her
position of the usual hard-line stance, and had to finally agree to issue euro bonds.
Merkel was not only under pressure from other member countries, she had to bear the
negative impact that debt crisis has brought Germany. Germany is clearly not immune from the
crisis. The German government auctioned 60 billion Euros of 10-year bonds, with only 3.644
billion Euros sold (about $ 4.92 billion), with an average yield of 1.98%. After the auction, the
German 10-year bond yield jumped to 2.09%, reaching up the highest in three weeks, exceeded
the 10-year U.S. bond yield. German government bonds' unpopularity made the nerves of
investors once again taut. Some analysts believe that at a time when the debt crisis in Europe is
104
gradually deteriorating, the German bond auction's unpopularity showed that investors have
begun worrying about the most secure assets in the euro zone.
Our Trades
Kimberly’s Trades
Trade 1
Currency: EUR/USD
Account: Individual $100,000
Opening Position: 1.37036 Short
Time: 2011.11.09 09:12
Close Order Time: 2011.11.09 16:51
Closing Position 1.36647
1/2 Standard Lot
Pips made: 38.9
Total Profit: $194.50
Trade 2
EUR/USD
Account: 100,000
Open Position: Short at 1.34971
Time: 2011.11.16 20:20
Close Order Time: 2011.11.16 20:25
Close Price: 1.34921
Lots: 1 Standard Lot
Pips Made: 50
105
Total Profit: $694.50
Trade 3
EUR/USD
Account: 100,000
Open Position: Short at 1.33488
Time: 2011.11.28 15:30
Close Order Time: 2011.11.28 16:30
Close Price: 1.33327
Lots: 1 Standard lot
Pips Made: 161
Total Profit: $2304.50
Trade 4
EUR/USD
Account: 100,000
Open Position: Short at 1.33885
Time: 2011.11.23 11:00
Close Order Time: 2011.11.23 13:00
Close Price: 1.33900
Lots: 1 Standard lot
Pips Lost: 15
Total Profit: $2154.50
Trade 5
EUR/USD
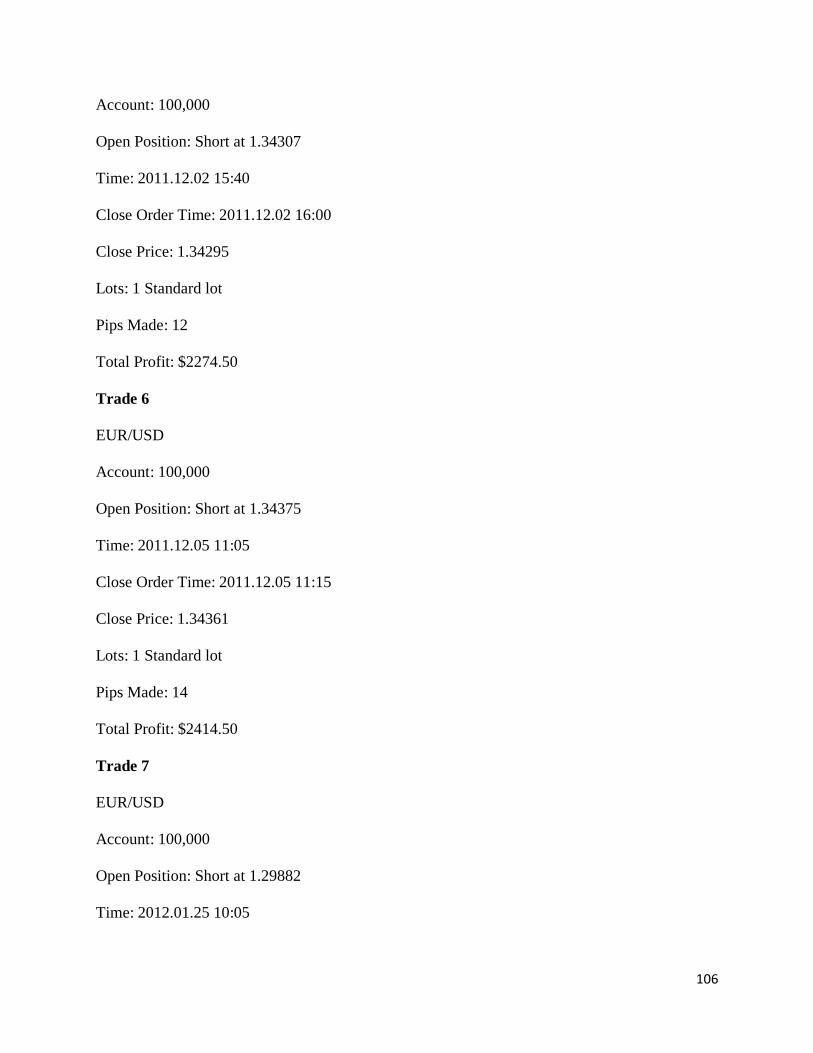
106
Account: 100,000
Open Position: Short at 1.34307
Time: 2011.12.02 15:40
Close Order Time: 2011.12.02 16:00
Close Price: 1.34295
Lots: 1 Standard lot
Pips Made: 12
Total Profit: $2274.50
Trade 6
EUR/USD
Account: 100,000
Open Position: Short at 1.34375
Time: 2011.12.05 11:05
Close Order Time: 2011.12.05 11:15
Close Price: 1.34361
Lots: 1 Standard lot
Pips Made: 14
Total Profit: $2414.50
Trade 7
EUR/USD
Account: 100,000
Open Position: Short at 1.29882
Time: 2012.01.25 10:05
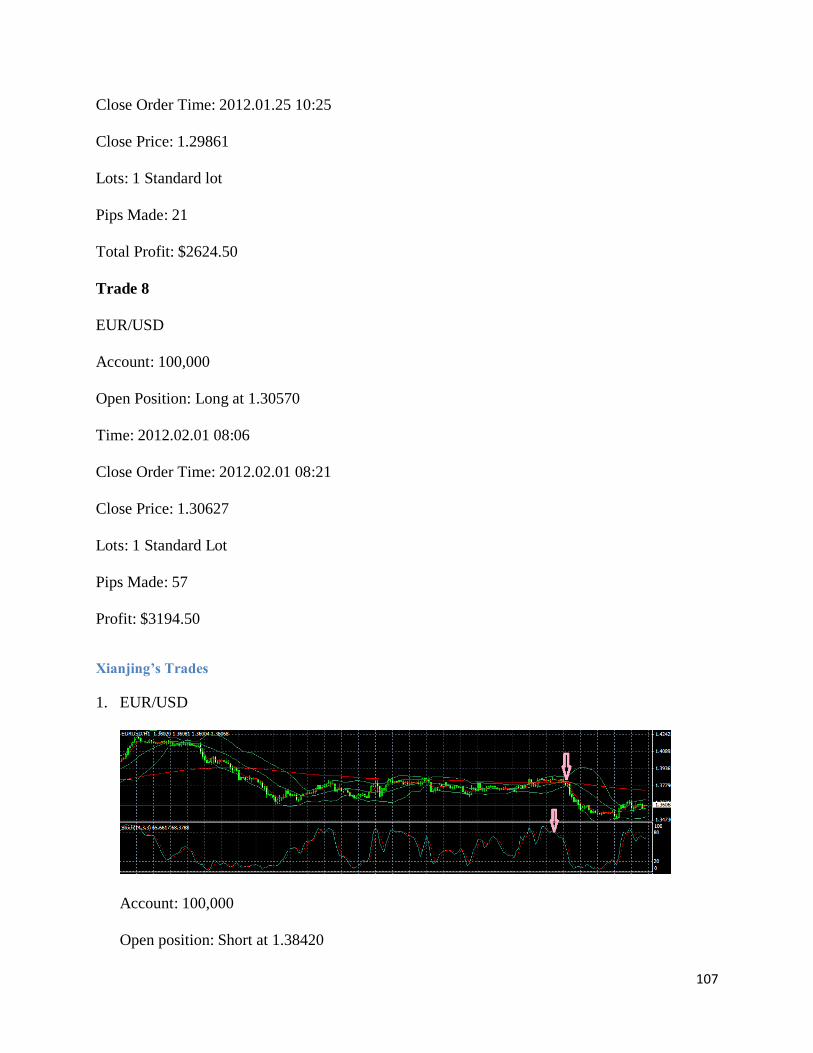
107
Close Order Time: 2012.01.25 10:25
Close Price: 1.29861
Lots: 1 Standard lot
Pips Made: 21
Total Profit: $2624.50
Trade 8
EUR/USD
Account: 100,000
Open Position: Long at 1.30570
Time: 2012.02.01 08:06
Close Order Time: 2012.02.01 08:21
Close Price: 1.30627
Lots: 1 Standard Lot
Pips Made: 57
Profit: $3194.50
Xianjing’s Trades
1. EUR/USD
Account: 100,000
Open position: Short at 1.38420
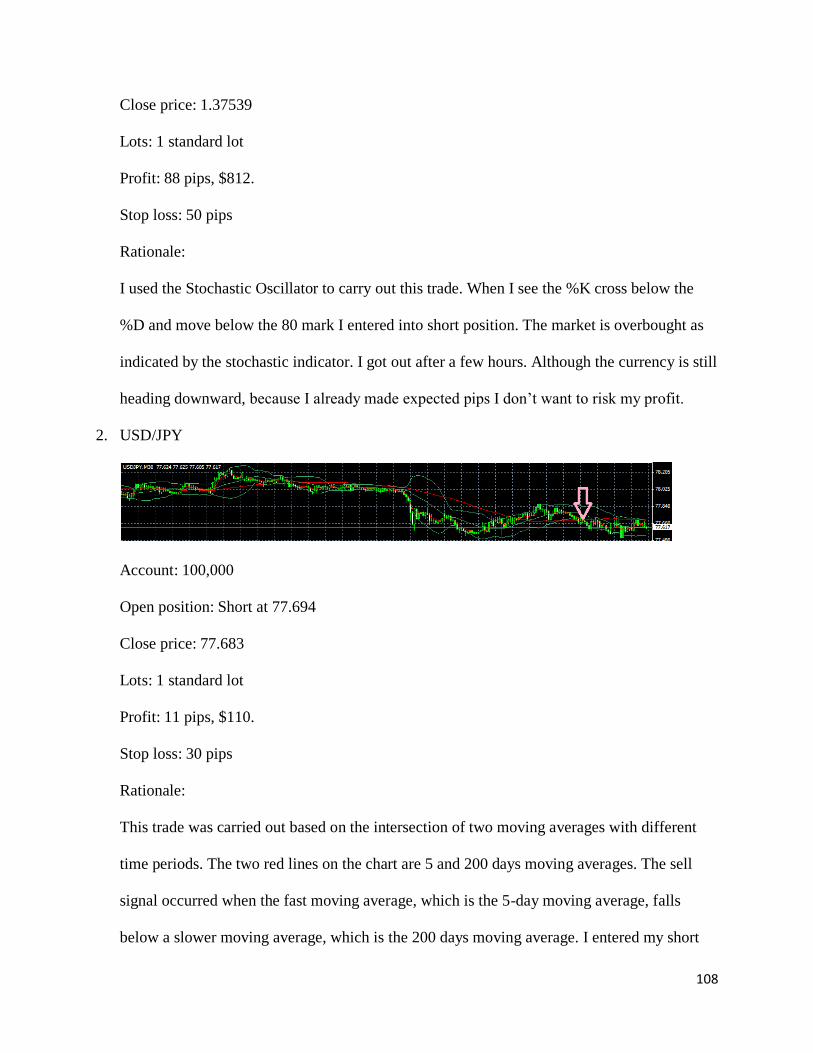
108
Close price: 1.37539
Lots: 1 standard lot
Profit: 88 pips, $812.
Stop loss: 50 pips
Rationale:
I used the Stochastic Oscillator to carry out this trade. When I see the %K cross below the
%D and move below the 80 mark I entered into short position. The market is overbought as
indicated by the stochastic indicator. I got out after a few hours. Although the currency is still
heading downward, because I already made expected pips I don‘t want to risk my profit.
2. USD/JPY
Account: 100,000
Open position: Short at 77.694
Close price: 77.683
Lots: 1 standard lot
Profit: 11 pips, $110.
Stop loss: 30 pips
Rationale:
This trade was carried out based on the intersection of two moving averages with different
time periods. The two red lines on the chart are 5 and 200 days moving averages. The sell
signal occurred when the fast moving average, which is the 5-day moving average, falls
below a slower moving average, which is the 200 days moving average. I entered my short
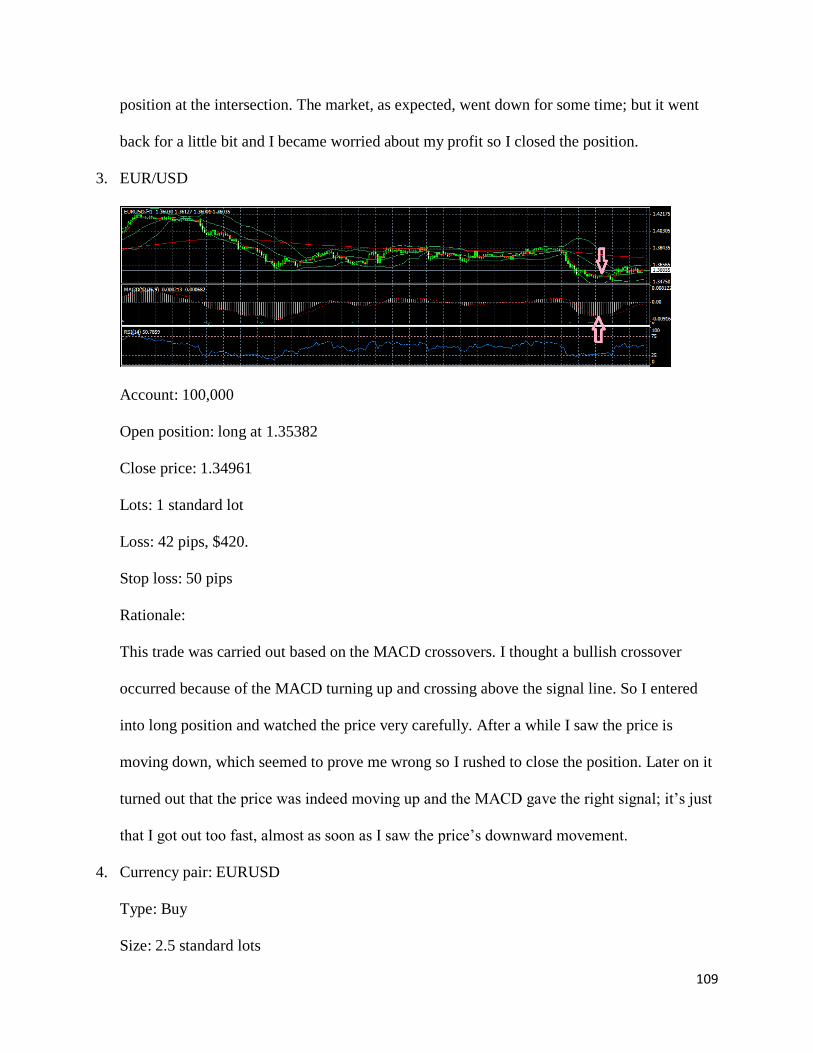
109
position at the intersection. The market, as expected, went down for some time; but it went
back for a little bit and I became worried about my profit so I closed the position.
3. EUR/USD
Account: 100,000
Open position: long at 1.35382
Close price: 1.34961
Lots: 1 standard lot
Loss: 42 pips, $420.
Stop loss: 50 pips
Rationale:
This trade was carried out based on the MACD crossovers. I thought a bullish crossover
occurred because of the MACD turning up and crossing above the signal line. So I entered
into long position and watched the price very carefully. After a while I saw the price is
moving down, which seemed to prove me wrong so I rushed to close the position. Later on it
turned out that the price was indeed moving up and the MACD gave the right signal; it‘s just
that I got out too fast, almost as soon as I saw the price‘s downward movement.
4. Currency pair: EURUSD
Type: Buy
Size: 2.5 standard lots
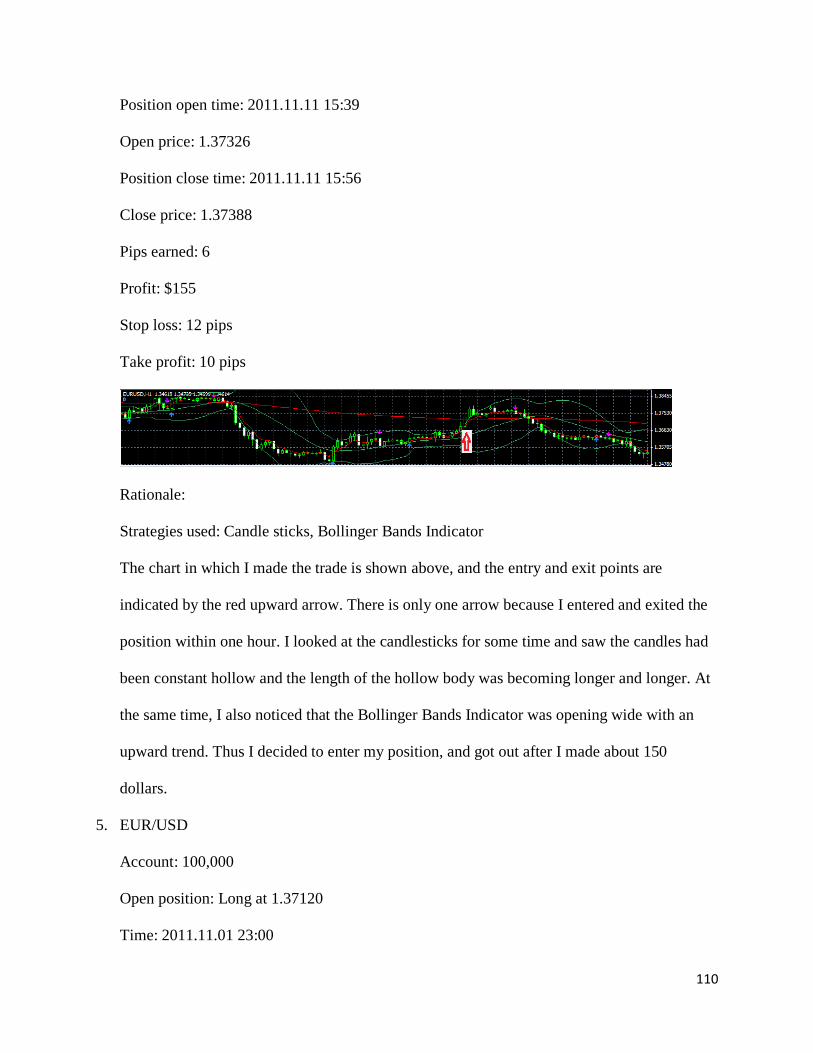
110
Position open time: 2011.11.11 15:39
Open price: 1.37326
Position close time: 2011.11.11 15:56
Close price: 1.37388
Pips earned: 6
Profit: $155
Stop loss: 12 pips
Take profit: 10 pips
Rationale:
Strategies used: Candle sticks, Bollinger Bands Indicator
The chart in which I made the trade is shown above, and the entry and exit points are
indicated by the red upward arrow. There is only one arrow because I entered and exited the
position within one hour. I looked at the candlesticks for some time and saw the candles had
been constant hollow and the length of the hollow body was becoming longer and longer. At
the same time, I also noticed that the Bollinger Bands Indicator was opening wide with an
upward trend. Thus I decided to enter my position, and got out after I made about 150
dollars.
5. EUR/USD
Account: 100,000
Open position: Long at 1.37120
Time: 2011.11.01 23:00

111
Close order time: at 2011.11.02 11:00
Close price: 1.38054
Lots: 1 standard lot
- Rationale:
I drew a trend line as shown in the above graph and saw it to be broken after long-lasting
downward trend. I entered into long position when the trend line was broken and sold it
when the price is still rising. I dare not keep it longer for I myself was not sure when the
trend will reverse.
- Pips made: 93
- Profit/Loss: +893
- Stop loss: 50 pips
6. EUR/USD
Account: 100,000
Open position: Short at 1.38342
Time: 2011.11.03 15:28
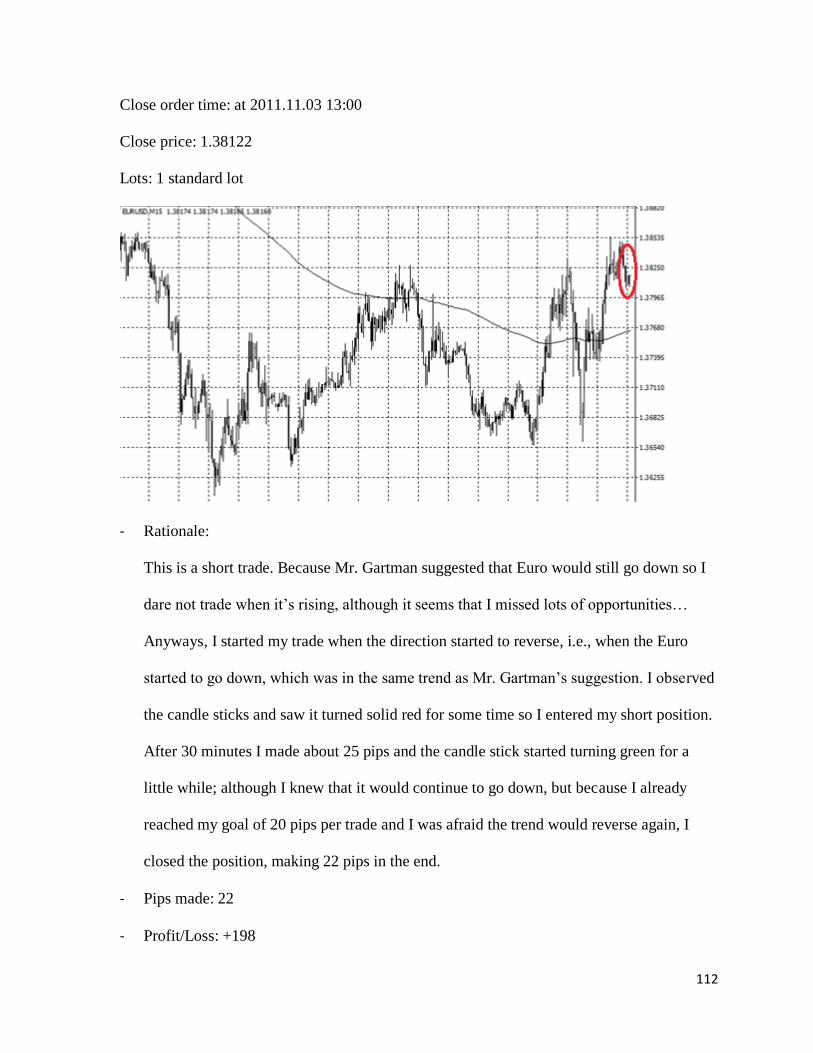
112
Close order time: at 2011.11.03 13:00
Close price: 1.38122
Lots: 1 standard lot
- Rationale:
This is a short trade. Because Mr. Gartman suggested that Euro would still go down so I
dare not trade when it‘s rising, although it seems that I missed lots of opportunities…
Anyways, I started my trade when the direction started to reverse, i.e., when the Euro
started to go down, which was in the same trend as Mr. Gartman‘s suggestion. I observed
the candle sticks and saw it turned solid red for some time so I entered my short position.
After 30 minutes I made about 25 pips and the candle stick started turning green for a
little while; although I knew that it would continue to go down, but because I already
reached my goal of 20 pips per trade and I was afraid the trend would reverse again, I
closed the position, making 22 pips in the end.
- Pips made: 22
- Profit/Loss: +198
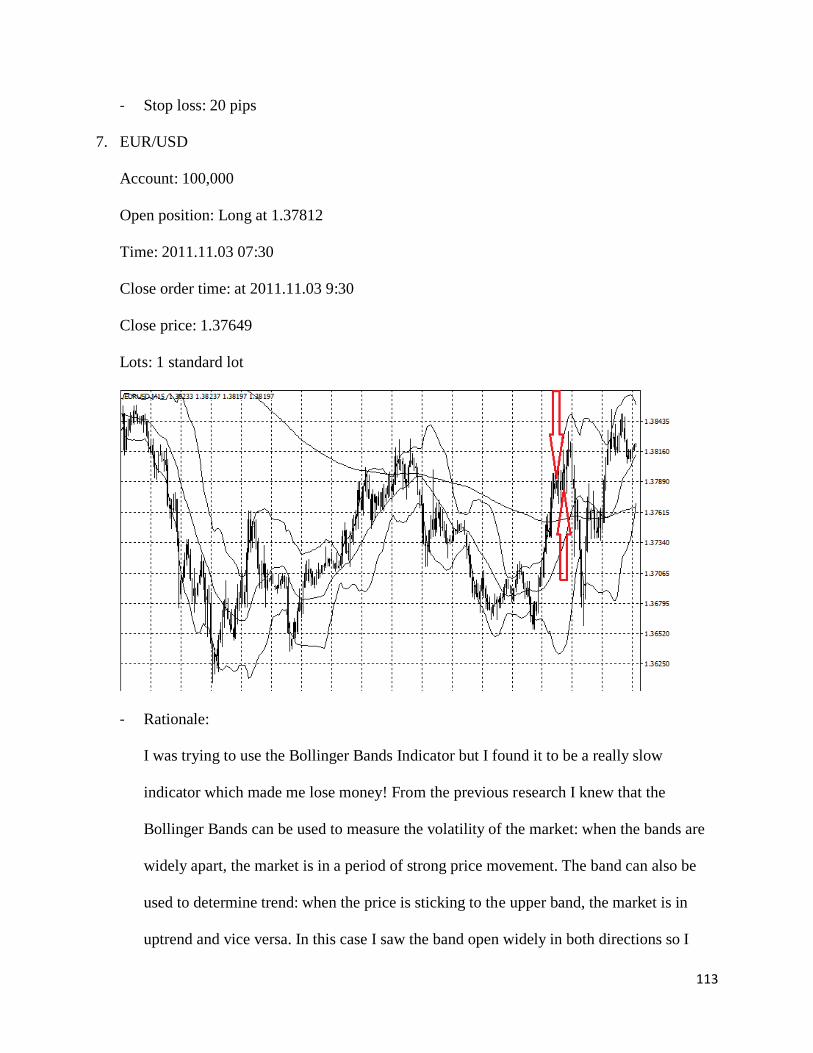
113
- Stop loss: 20 pips
7. EUR/USD
Account: 100,000
Open position: Long at 1.37812
Time: 2011.11.03 07:30
Close order time: at 2011.11.03 9:30
Close price: 1.37649
Lots: 1 standard lot
- Rationale:
I was trying to use the Bollinger Bands Indicator but I found it to be a really slow
indicator which made me lose money! From the previous research I knew that the
Bollinger Bands can be used to measure the volatility of the market: when the bands are
widely apart, the market is in a period of strong price movement. The band can also be
used to determine trend: when the price is sticking to the upper band, the market is in
uptrend and vice versa. In this case I saw the band open widely in both directions so I
114
waited to see that the price is sticking to the upper band, making me believe that the price
would rise significantly. So after seeing three candles sticking to the upper band, I
entered my long position. However, not long after I entered my long position, the price
went down for a little bit and triggered my stop loss… I think three consecutive candle
sticks are required to see the trend before any further action, but this made me lose the
best opportunity of entering my long position. That is why I said the band is relatively
slow.
- Pips lost: 17
- Profit/Loss: -170
- Stop loss: 15 pips
8. Currency pair: EURUSD
Type: Sell
Size: 5 standard lots
Position open time: 2011.11.11 17:47
Open price: 1.37627
Position close time: 2011.11.11 20:02
Close price: 1.37510
Pips earned: 11
Profit: $585
Stop loss: 12 pips
Take profit: 10 pips
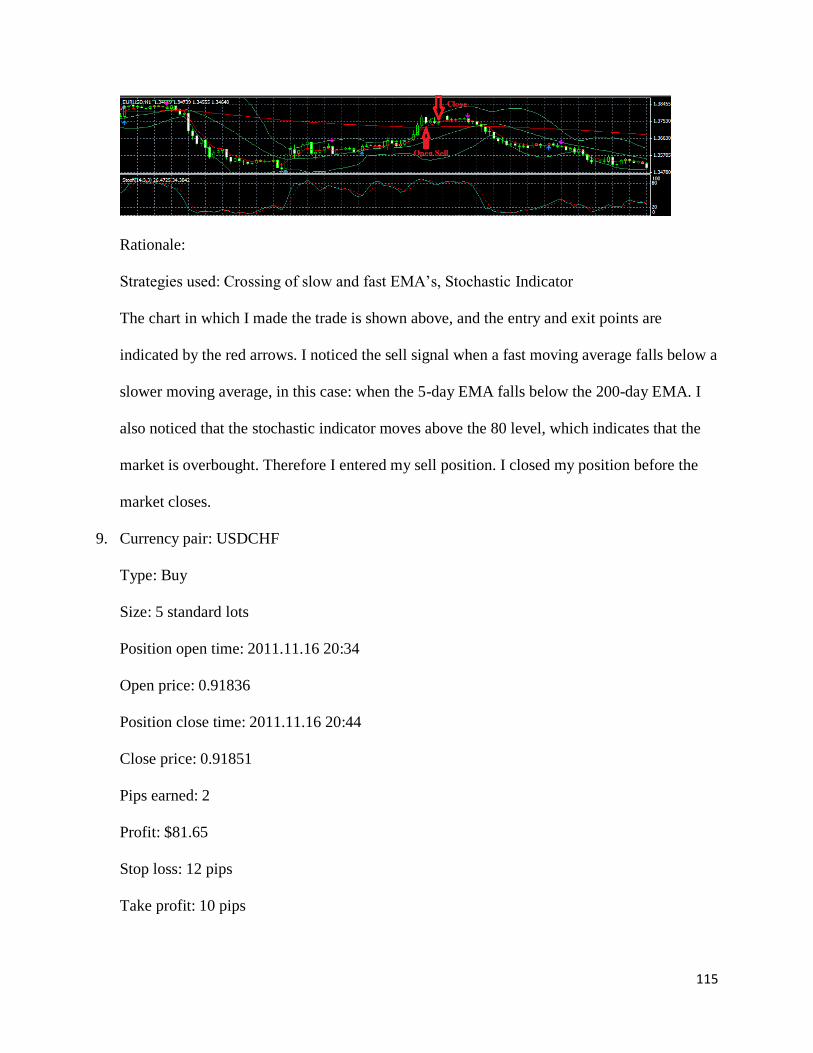
115
Rationale:
Strategies used: Crossing of slow and fast EMA‘s, Stochastic Indicator
The chart in which I made the trade is shown above, and the entry and exit points are
indicated by the red arrows. I noticed the sell signal when a fast moving average falls below a
slower moving average, in this case: when the 5-day EMA falls below the 200-day EMA. I
also noticed that the stochastic indicator moves above the 80 level, which indicates that the
market is overbought. Therefore I entered my sell position. I closed my position before the
market closes.
9. Currency pair: USDCHF
Type: Buy
Size: 5 standard lots
Position open time: 2011.11.16 20:34
Open price: 0.91836
Position close time: 2011.11.16 20:44
Close price: 0.91851
Pips earned: 2
Profit: $81.65
Stop loss: 12 pips
Take profit: 10 pips
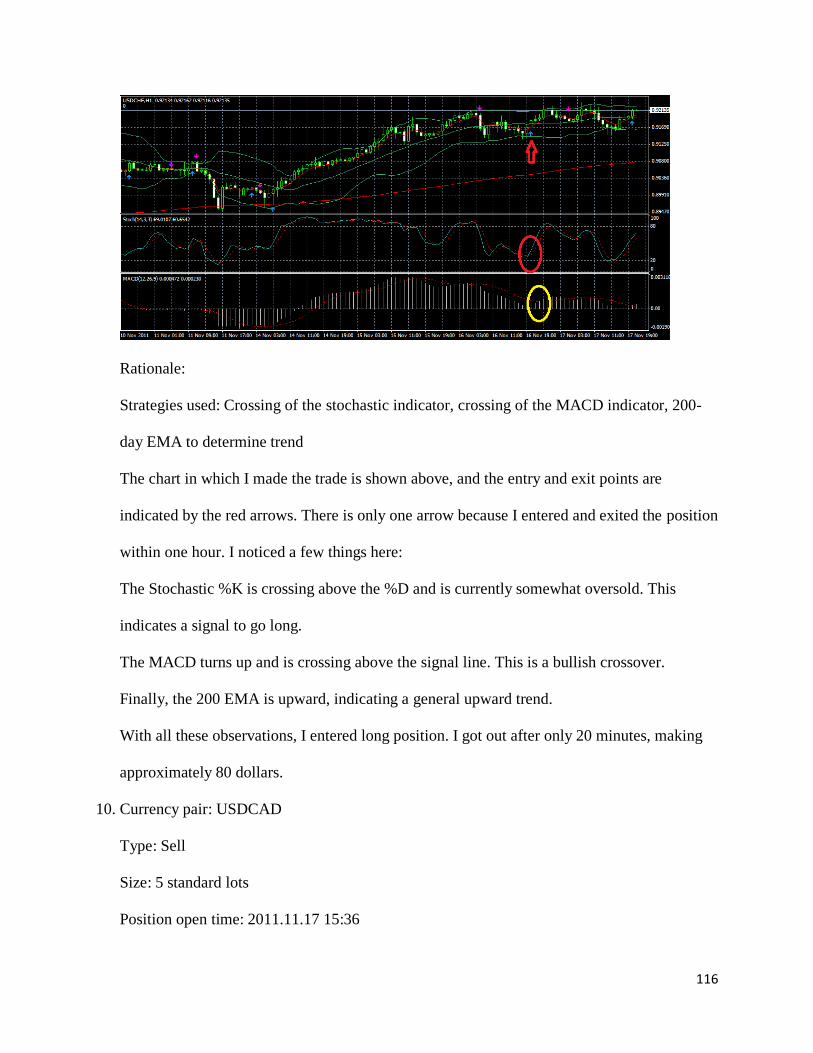
116
Rationale:
Strategies used: Crossing of the stochastic indicator, crossing of the MACD indicator, 200-
day EMA to determine trend
The chart in which I made the trade is shown above, and the entry and exit points are
indicated by the red arrows. There is only one arrow because I entered and exited the position
within one hour. I noticed a few things here:
The Stochastic %K is crossing above the %D and is currently somewhat oversold. This
indicates a signal to go long.
The MACD turns up and is crossing above the signal line. This is a bullish crossover.
Finally, the 200 EMA is upward, indicating a general upward trend.
With all these observations, I entered long position. I got out after only 20 minutes, making
approximately 80 dollars.
10. Currency pair: USDCAD
Type: Sell
Size: 5 standard lots
Position open time: 2011.11.17 15:36
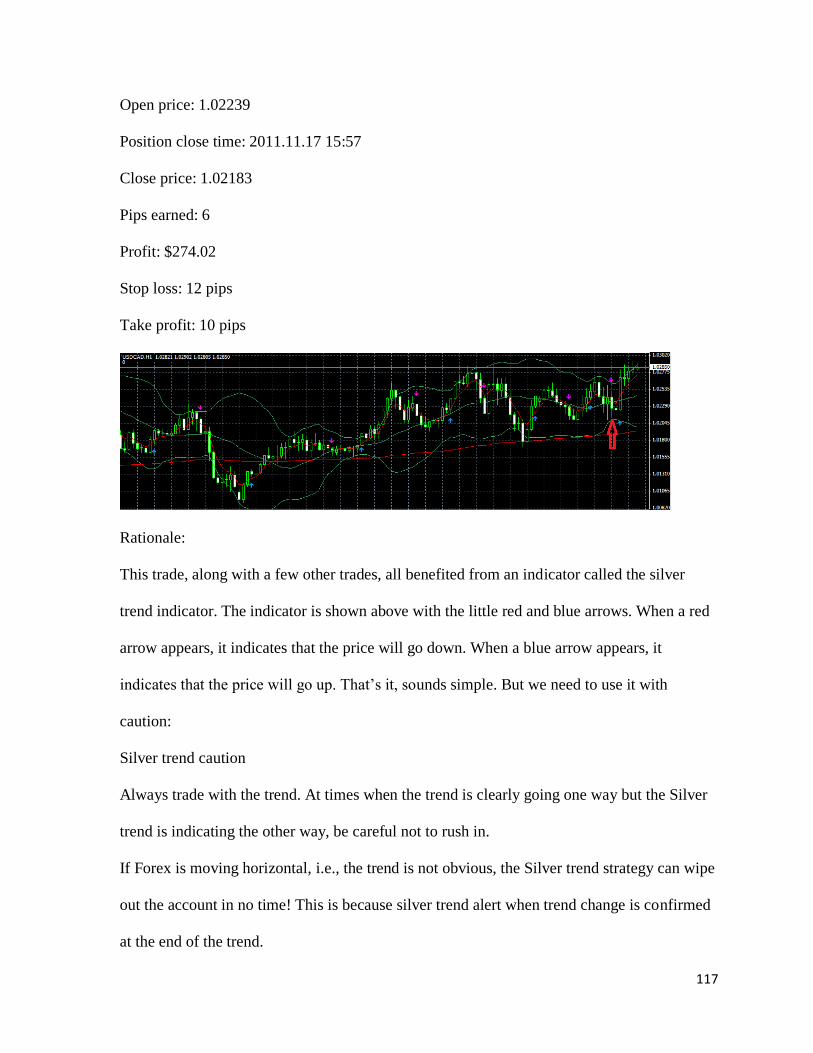
117
Open price: 1.02239
Position close time: 2011.11.17 15:57
Close price: 1.02183
Pips earned: 6
Profit: $274.02
Stop loss: 12 pips
Take profit: 10 pips
Rationale:
This trade, along with a few other trades, all benefited from an indicator called the silver
trend indicator. The indicator is shown above with the little red and blue arrows. When a red
arrow appears, it indicates that the price will go down. When a blue arrow appears, it
indicates that the price will go up. That‘s it, sounds simple. But we need to use it with
caution:
Silver trend caution
Always trade with the trend. At times when the trend is clearly going one way but the Silver
trend is indicating the other way, be careful not to rush in.
If Forex is moving horizontal, i.e., the trend is not obvious, the Silver trend strategy can wipe
out the account in no time! This is because silver trend alert when trend change is confirmed
at the end of the trend.

118
11. Currency pair: GBPUSD
Type: Buy
Size: 5 standard lots
Position open time: 2011.12.01 05:00
Open price: 1.57066
Take profit: 1.57166
Position close time: 2011.12.01 05:55
Close price: 1.57166 (Take profit triggered)
Pips earned: 10
Profit: $500
Stop loss: 12 pips
Take profit: 10 pips
Rationale:
Strategies used: Silver Trend Indicator, Stochastic Indicator
The chart in which I made the trade is shown above, and the entry and exit points are
indicated by the red arrows. The Silver Trend indicator gave out a buy alert and I noticed that
the Stochastic Indicator is in the oversold region so I entered my long position. I set my take
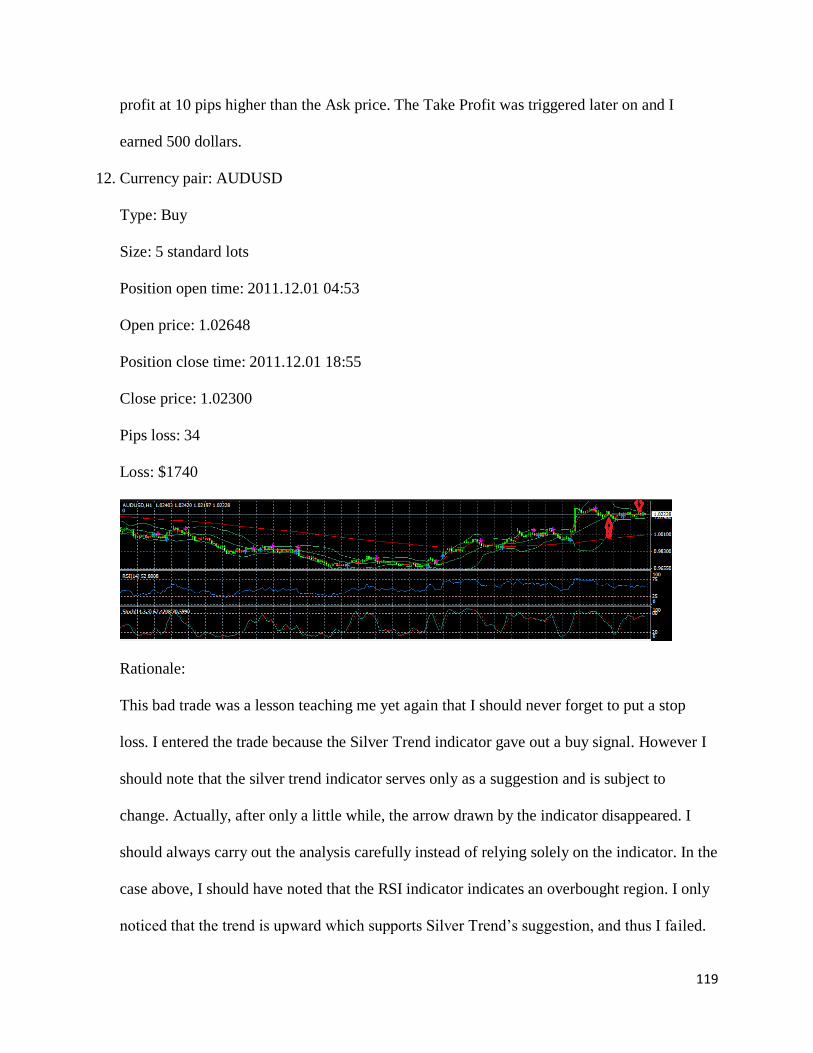
119
profit at 10 pips higher than the Ask price. The Take Profit was triggered later on and I
earned 500 dollars.
12. Currency pair: AUDUSD
Type: Buy
Size: 5 standard lots
Position open time: 2011.12.01 04:53
Open price: 1.02648
Position close time: 2011.12.01 18:55
Close price: 1.02300
Pips loss: 34
Loss: $1740
Rationale:
This bad trade was a lesson teaching me yet again that I should never forget to put a stop
loss. I entered the trade because the Silver Trend indicator gave out a buy signal. However I
should note that the silver trend indicator serves only as a suggestion and is subject to
change. Actually, after only a little while, the arrow drawn by the indicator disappeared. I
should always carry out the analysis carefully instead of relying solely on the indicator. In the
case above, I should have noted that the RSI indicator indicates an overbought region. I only
noticed that the trend is upward which supports Silver Trend‘s suggestion, and thus I failed.
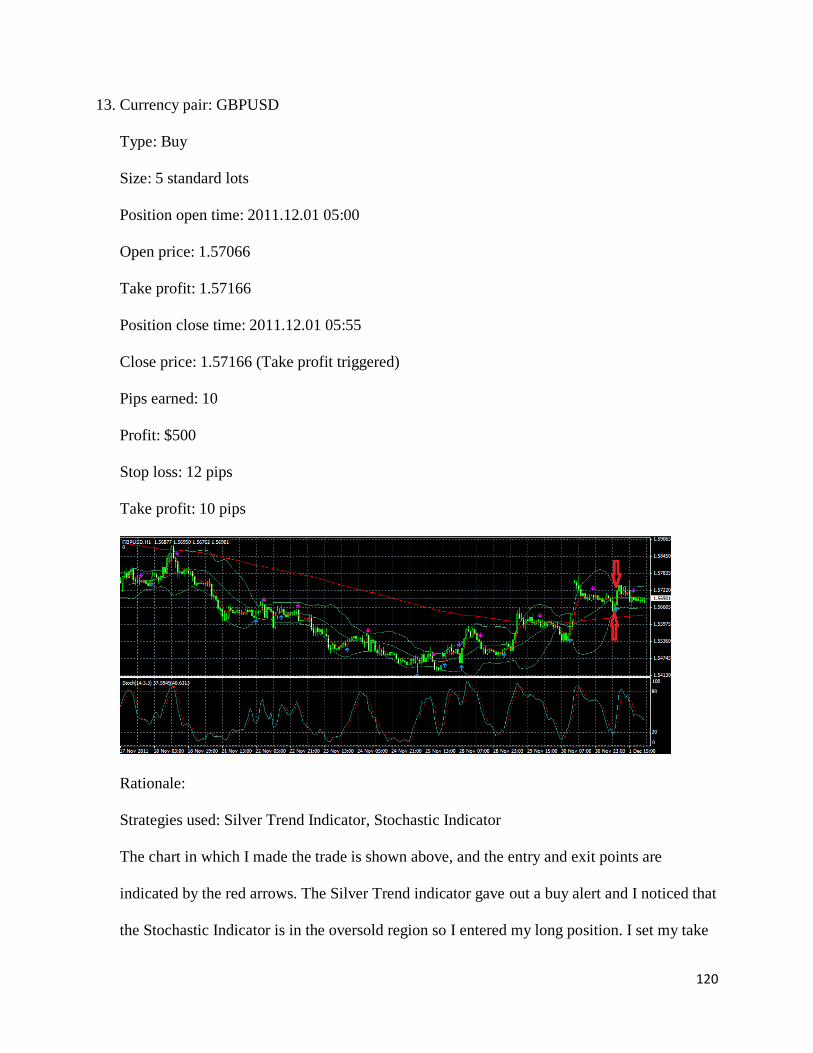
120
13. Currency pair: GBPUSD
Type: Buy
Size: 5 standard lots
Position open time: 2011.12.01 05:00
Open price: 1.57066
Take profit: 1.57166
Position close time: 2011.12.01 05:55
Close price: 1.57166 (Take profit triggered)
Pips earned: 10
Profit: $500
Stop loss: 12 pips
Take profit: 10 pips
Rationale:
Strategies used: Silver Trend Indicator, Stochastic Indicator
The chart in which I made the trade is shown above, and the entry and exit points are
indicated by the red arrows. The Silver Trend indicator gave out a buy alert and I noticed that
the Stochastic Indicator is in the oversold region so I entered my long position. I set my take
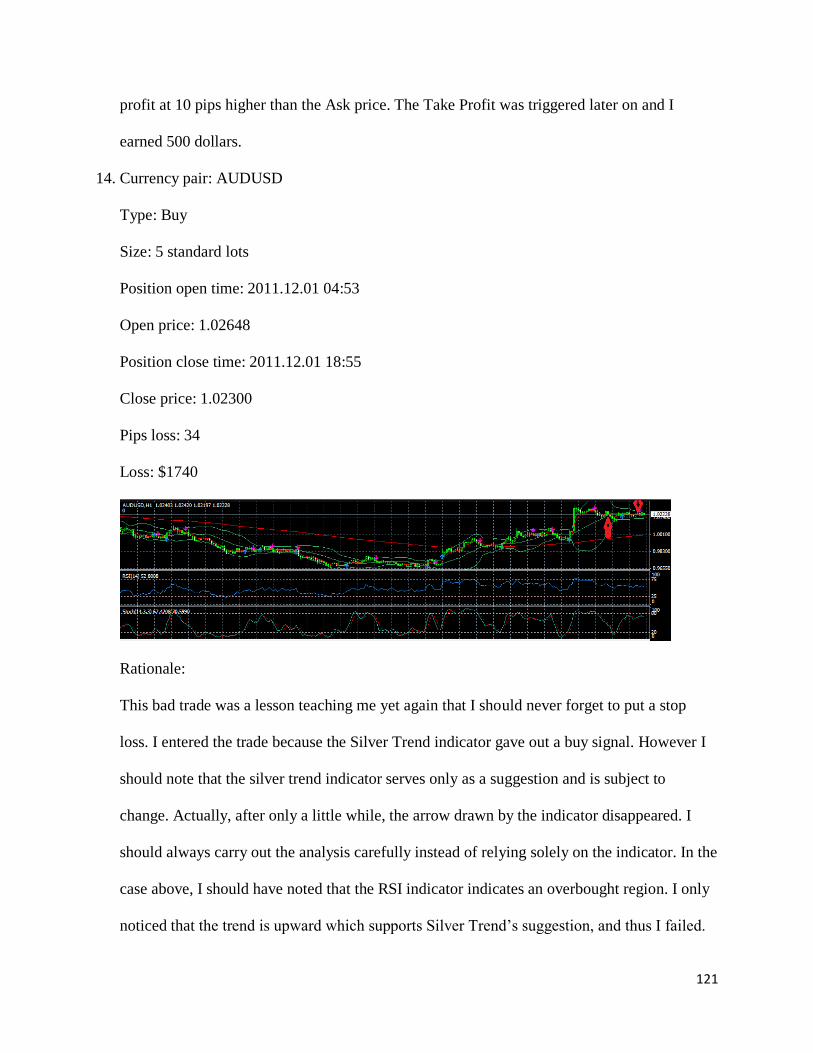
121
profit at 10 pips higher than the Ask price. The Take Profit was triggered later on and I
earned 500 dollars.
14. Currency pair: AUDUSD
Type: Buy
Size: 5 standard lots
Position open time: 2011.12.01 04:53
Open price: 1.02648
Position close time: 2011.12.01 18:55
Close price: 1.02300
Pips loss: 34
Loss: $1740
Rationale:
This bad trade was a lesson teaching me yet again that I should never forget to put a stop
loss. I entered the trade because the Silver Trend indicator gave out a buy signal. However I
should note that the silver trend indicator serves only as a suggestion and is subject to
change. Actually, after only a little while, the arrow drawn by the indicator disappeared. I
should always carry out the analysis carefully instead of relying solely on the indicator. In the
case above, I should have noted that the RSI indicator indicates an overbought region. I only
noticed that the trend is upward which supports Silver Trend‘s suggestion, and thus I failed.
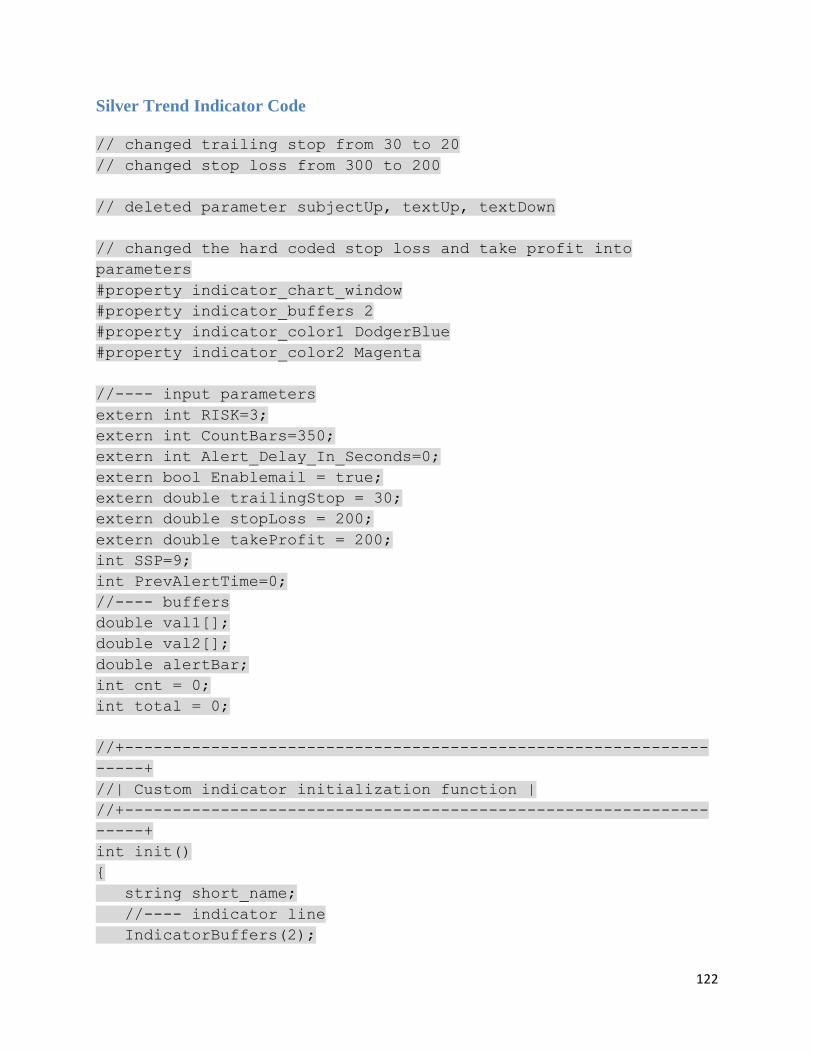
122
Silver Trend Indicator Code
// changed trailing stop from 30 to 20
// changed stop loss from 300 to 200
// deleted parameter subjectUp, textUp, textDown
// changed the hard coded stop loss and take profit into
parameters
#property indicator_chart_window
#property indicator_buffers 2
#property indicator_color1 DodgerBlue
#property indicator_color2 Magenta
//---- input parameters
extern int RISK=3;
extern int CountBars=350;
extern int Alert_Delay_In_Seconds=0;
extern bool Enablemail = true;
extern double trailingStop = 30;
extern double stopLoss = 200;
extern double takeProfit = 200;
int SSP=9;
int PrevAlertTime=0;
//---- buffers
double val1[];
double val2[];
double alertBar;
int cnt = 0;
int total = 0;
//+-------------------------------------------------------------
-----+
//| Custom indicator initialization function |
//+-------------------------------------------------------------
-----+
int init()
{
string short_name;
//---- indicator line
IndicatorBuffers(2);
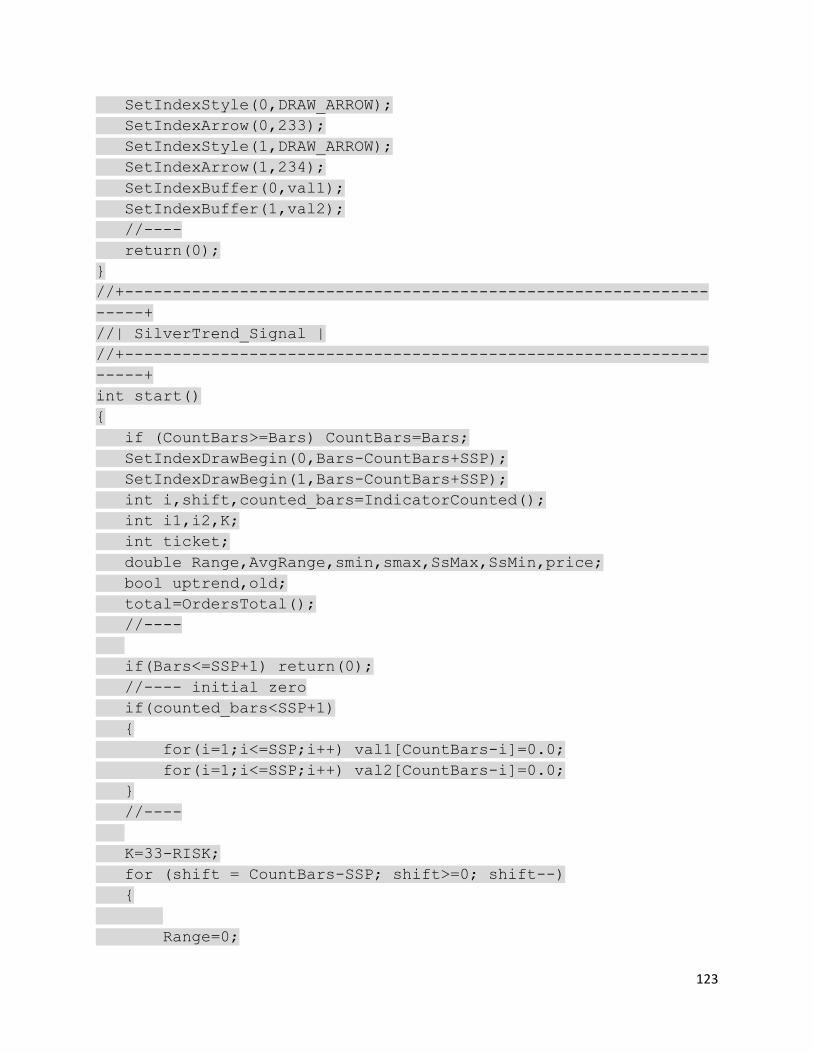
123
SetIndexStyle(0,DRAW_ARROW);
SetIndexArrow(0,233);
SetIndexStyle(1,DRAW_ARROW);
SetIndexArrow(1,234);
SetIndexBuffer(0,val1);
SetIndexBuffer(1,val2);
//----
return(0);
}
//+-------------------------------------------------------------
-----+
//| SilverTrend_Signal |
//+-------------------------------------------------------------
-----+
int start()
{
if (CountBars>=Bars) CountBars=Bars;
SetIndexDrawBegin(0,Bars-CountBars+SSP);
SetIndexDrawBegin(1,Bars-CountBars+SSP);
int i,shift,counted_bars=IndicatorCounted();
int i1,i2,K;
int ticket;
double Range,AvgRange,smin,smax,SsMax,SsMin,price;
bool uptrend,old;
total=OrdersTotal();
//----
if(Bars<=SSP+1) return(0);
//---- initial zero
if(counted_bars<SSP+1)
{
for(i=1;i<=SSP;i++) val1[CountBars-i]=0.0;
for(i=1;i<=SSP;i++) val2[CountBars-i]=0.0;
}
//----
K=33-RISK;
for (shift = CountBars-SSP; shift>=0; shift--)
{
Range=0;

124
AvgRange=0;
for (i1=shift; i1<=shift+SSP; i1++)
{AvgRange=AvgRange+MathAbs(High[i1]-Low[i1]);
}
Range=AvgRange/(SSP+1);
SsMax=High[shift]; SsMin=Low[shift];
for (i2=shift;i2<=shift+SSP-1;i2++)
{
price=High[i2];
if(SsMax<price) SsMax=price;
price=Low[i2];
if(SsMin>=price) SsMin=price;
}
smin = SsMin+(SsMax-SsMin)*K/100;
smax = SsMax-(SsMax-SsMin)*K/100;
val1[shift]=0;
val2[shift]=0;
if (Close[shift]<smin)
{
uptrend = false;
}
if (Close[shift]>smax)
{
uptrend = true;
}
if (uptrend!=old && uptrend==true)
{
val1[shift]=Low[shift]-Range*0.5;
if (Bars>alertBar && shift==0 && (CurTime() -
PrevAlertTime > Period()*Alert_Delay_In_Seconds))
{
Alert("Trendsignal ",Period()," ",Symbol(),"
BUY");alertBar = Bars;
ticket = OrderSend(Symbol(),OP_BUY,5,Ask,0,Ask-
stopLoss*Point,Ask+takeProfit*Point,"buy",1,0,Green);
if (ticket<0) {
Print("OrderSend failed with error #",
GetLastError());

125
return(0);
}
if(Enablemail == true) {SendMail("Sell signal"+"
"+ Symbol(),"Short "+" "+ Close[1]+" "+ Symbol()); }
PrevAlertTime = CurTime();
}
}
if (uptrend!=old && uptrend==false)
{
val2[shift]=High[shift]+Range*0.5;
if (Bars>alertBar && shift==0 && (CurTime() -
PrevAlertTime > Period()*Alert_Delay_In_Seconds))
{
Alert("Trendsignal ",Period()," ",Symbol(),"
SELL");alertBar = Bars;
ticket =
OrderSend(Symbol(),OP_SELL,5,Bid,0,Bid+stopLoss*Point,Bid-
takeProfit*Point,"sell",2,0,Blue);
if (ticket<0) {
Print("OrderSend failed with error #",
GetLastError());
return(0);
}
if(Enablemail == true) {SendMail("Buy Signal" +"
"+ Symbol(),"Long "+" "+ Close[1]+" " + Symbol());}
PrevAlertTime = CurTime();
}
}
for(cnt=0;cnt<total;cnt++)
{
OrderSelect(cnt, SELECT_BY_POS, MODE_TRADES);
if(OrderType()<=OP_SELL && // check for opened
position
OrderSymbol()==Symbol()) // check for symbol
{
if(OrderType()==OP_BUY) // long position is
opened
{
126
// check for trailing stop
if(trailingStop>0)
{
if(Bid-
OrderOpenPrice()>Point*trailingStop)
{
if(OrderStopLoss()<Bid-
Point*trailingStop)
{
OrderModify(OrderTicket(),OrderOp
enPrice(),Bid-Point*trailingStop,OrderTakeProfit(),0,Green);
return(0);
}
}
}
}
else // go to short position
{
// should it be closed?
// check for trailing stop
if(trailingStop>0)
{
if((OrderOpenPrice()-
Ask)>(Point*trailingStop))
{
if((OrderStopLoss()>(Ask+Point*traili
ngStop)) || (OrderStopLoss()==0))
{
OrderModify(OrderTicket(),OrderOp
enPrice(),Ask+Point*trailingStop,OrderTakeProfit(),0,Red);
return(0);
}
}
}
}
}
}
Comment(shift);
old=uptrend;
}

127
return(0);
}
//+-------------------------------------------------------------
-----+
When using the code, you are free to change the value of trailingStop, Point, stopLoss, takeProfit
and slip to the values you want.
Spread Indicator Code
#property indicator_chart_window
//#property indicator_buffers 0
extern color LabelColor = Red;
#define OBJ_NAME "SpreadIndikatorObj"
int init()
{
ShowSpread();
}
int start()
{
ShowSpread();
}
int deinit()
{
ObjectDelete(OBJ_NAME);
}

128
void ShowSpread()
{
static double spread;
spread = MarketInfo(Symbol(), MODE_SPREAD);
DrawSpreadOnChart(spread);
}
void DrawSpreadOnChart(double spread)
{
string s = "Spread: "+DoubleToStr(spread, 0)+" points";
if(ObjectFind(OBJ_NAME) < 0)
{
ObjectCreate(OBJ_NAME, OBJ_LABEL, 0, 0, 0);
ObjectSet(OBJ_NAME, OBJPROP_CORNER, 0);
ObjectSet(OBJ_NAME, OBJPROP_YDISTANCE, 12);
ObjectSet(OBJ_NAME, OBJPROP_XDISTANCE, 3);
ObjectSetText(OBJ_NAME, s, 10, "FixedSys", LabelColor);
}
ObjectSetText(OBJ_NAME, s);
WindowRedraw();
}