foreword - pacific web · rmi statistical yearbook, 2002 economic policy, planning and statistics...
TRANSCRIPT

Foreword
Economic Policy, Planning and Statistics Office 1
Iokwe, The Economic Policy, Planning and Statistics Office (EPPSO) is pleased to present its annual publication, the 2002 Statistical Yearbook. For readers and users of previous additions it will be immediately apparent that this publication has more than twice the number of tables. There is much more information in the areas of health and education, as well as new information concerning the outer islands and NGO’s. In addition, the quality of the publication has been significantly enhanced by the inclusion of more analysis of data. During the course of producing this publication we found that most ministries and agencies need to improve the collection and quality of their administrative statistics, which are the backbone of this publication and government budget planning. Attempting to ensure that the information produced and given to EPPSO was accurate was a very time consuming process that required an extensive amount of patience by everyone involved. Work on the 2003 publication has already begun and will contain new sections with comprehensive information on the renegotiated Compact of Free Association with the United States, Government Finance and Budget Statistics, and information from the Banking Commission. I would like to take this opportunity to thank J.P. Yadav –UNV Social Monitoring Analyst, John Henry - EPPSO staff, and the UNDP office in Suva, Fiji for their efforts and assistance in making this publication a reality. Many long hours were spent meeting with ministries/agencies, putting these tables together and organizing the document. We are also very thankful for the cooperation and assistance EPPSO received from all government ministries, private sector, statutory agencies and NGO’s. Cooperation and sharing of information is essential if we are to improve the quality of life of our people and the services provided by government. For any questions or suggestions for improvements or requests for copies of this document please feel free to contact EPPSO at (692) 625 – 3802/3803 or fax (692) 625 – 3805. Our E – mail address is [email protected]. Users can also visit the Secretariat of the Pacific Community website at www.spc.int/prism/country/mh, or the Insular Areas Statistical Enhancement Program website at www.pacificweb.org for additional Marshall Islands statistics. Kommol Tata, Carl S. Hacker Director, EPPSO Office of the President

RMI Statistical Yearbook, 2002
Economic Policy, Planning and Statistics Office 2
Foreword ---------------------------------------------------------------------------------------------------------------1
Table of Contents -----------------------------------------------------------------------------------------------------2
Map ---------------------------------------------------------------------------------------------------------------------3
Chapter 1. Marshall Islands and Its People -------------------------------------------------------------------4-34 Chapter 2. Health Services ------------------------------------------------------------------------------------ 35-78 Chapter 3. Education ------------------------------------------------------------------------------------------79-119 Chapter 4. Labor and Employment------------------------------------------------------------------------ 120-139 Chapter 5. Justice and Crime------------------------------------------------------------------------------- 140-160 Chapter 6.Consumer Prices--------------------------------------------------------------------------------- 161-167 Chapter 7. Water and Energy ------------------------------------------------------------------------------ 168-175 Chapter 8. Transport and Communications -------------------------------------------------------------- 176-189 Chapter 9. Environmental Protection --------------------------------------------------------------------- 190-197 Chapter10. Tourism ----------------------------------------------------------------------------------------- 198-205 Chapter 11. Non Governmental Organizations---------------------------------------------------------- 206-212 Chapter 12. Agriculture, Fisheries and Rural Development------------------------------------------- 213-227

RMI Statistical Yearbook, 2002
Economic Policy, Planning and Statistics Office 3
RMI Statistical Yearbook, 2002
Economic Policy, Planning and Statistics Office 4
Chapter 1- Marshall Islands and Its People Location The Republic of Marshall Islands is situated in the Central Pacific Ocean between 4 degrees and 14 degrees North and 160 degrees and 173 degrees East in almost two parallel chains of 31 Atolls and Islands: the Eastern Ratak (Sunrise) with 15 Atolls and Islands and the Western Ralik (Sunset) having 16 Atolls and Islands. The total number of islands and islets is about 1,225. The total sea and land area of the country is approximately 1.94 million square kilometers and 181 square kilometers respectively. In other words, the land area is less than 0.01% of the total surface area. Both sea and land are of paramount importance to the people of this country for their livelihood. The climate is tropical - ocean. The temperature averages 80 degrees Fahrenheit and with little variation throughout the year. The Northern atolls receive about 80 inches of rainfall a year while the annual rainfall in Southern atolls is normally higher, about 160 inches. Brief History The Marshallese are thought to have come from Southeast Asia over 2000 years ago. At that time it appears stronger groups pushed down people through southern China, the Malay Peninsula and the island archipelagos in the east. Over time, the settlers organized themselves into lineage groups and spread through the double chain of atolls. They developed their own life style and social structure befitting the sparse and isolated environment. The ownership rights to the land, however, vested with the ‘Iroij’, who was the hereditary chief of several clans. Being the matrilineal society, all persons born to a woman inherited the right to cultivate and use land occupied by the clan. The ‘Iroij’ adjudicated land and lineage disputes as per the customary law and was responsible for the security of his subjects. The long period of isolation and harshness of the environment created a traditional system that is still strong and highly regarded. These islands were first sighted by Europeans in 1526 by the Spanish Captain Garcia de Loyasa but there were no further contacts until 1788 when the British Captain Marshall rediscovered them and they were given his name by the British Admiralty. Sea Voyagers from various parts of world passed across these islands but no nation claimed them as their colony. German trading companies started to build trading links around 1860 with some of the islands and built a network of island stations for trade in copra and retail goods. Later, Germany formally annexed the Marshall Islands in 1885 ignoring verbal counter claims by Spain. During the First World War, Japan declared war on Germany and occupied German Micronesia in September 1914. The islands remained under Japanese rule until the defeat of Japan by American forces in the Second World War. After a brief period of occupation by the US Navy, the UN entrusted the administration of these islands to the US as the Trust Territory of the Pacific Islands (TTPI). The American Navy established a strategic naval base in Kwajalein to support the newly created nuclear weapons testing program. Sixty seven nuclear tests between 1946 and 1958 at Bikini and Enewetak atolls exposed thousands of Marshallese to significant radiation hazards.
RMI Statistical Yearbook, 2002
Economic Policy, Planning and Statistics Office 5
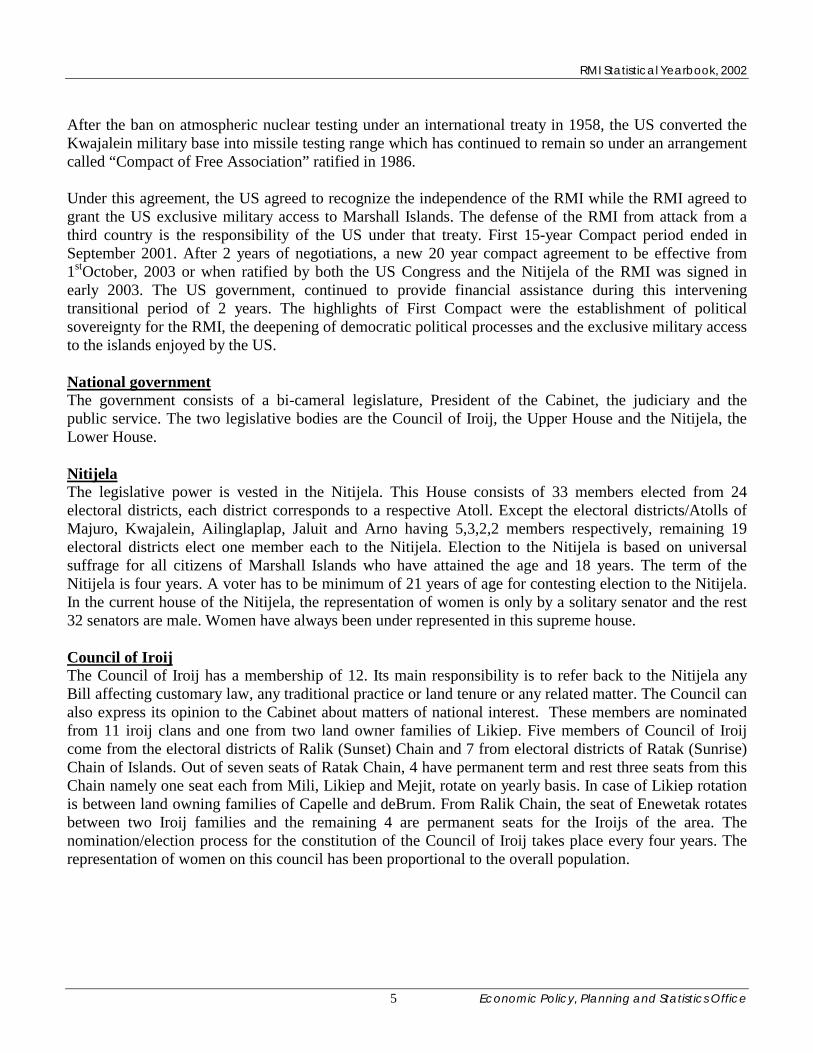
After the ban on atmospheric nuclear testing under an international treaty in 1958, the US converted the Kwajalein military base into missile testing range which has continued to remain so under an arrangement called “Compact of Free Association” ratified in 1986.
Under this agreement, the US agreed to recognize the independence of the RMI while the RMI agreed to grant the US exclusive military access to Marshall Islands. The defense of the RMI from attack from a third country is the responsibility of the US under that treaty. First 15-year Compact period ended in September 2001. After 2 years of negotiations, a new 20 year compact agreement to be effective from 1stOctober, 2003 or when ratified by both the US Congress and the Nitijela of the RMI was signed in early 2003. The US government, continued to provide financial assistance during this intervening transitional period of 2 years. The highlights of First Compact were the establishment of political sovereignty for the RMI, the deepening of democratic political processes and the exclusive military access to the islands enjoyed by the US. National government The government consists of a bi-cameral legislature, President of the Cabinet, the judiciary and the public service. The two legislative bodies are the Council of Iroij, the Upper House and the Nitijela, the Lower House.
Nitijela The legislative power is vested in the Nitijela. This House consists of 33 members elected from 24 electoral districts, each district corresponds to a respective Atoll. Except the electoral districts/Atolls of Majuro, Kwajalein, Ailinglaplap, Jaluit and Arno having 5,3,2,2 members respectively, remaining 19 electoral districts elect one member each to the Nitijela. Election to the Nitijela is based on universal suffrage for all citizens of Marshall Islands who have attained the age and 18 years. The term of the Nitijela is four years. A voter has to be minimum of 21 years of age for contesting election to the Nitijela. In the current house of the Nitijela, the representation of women is only by a solitary senator and the rest 32 senators are male. Women have always been under represented in this supreme house.
Council of Iroij The Council of Iroij has a membership of 12. Its main responsibility is to refer back to the Nitijela any Bill affecting customary law, any traditional practice or land tenure or any related matter. The Council can also express its opinion to the Cabinet about matters of national interest. These members are nominated from 11 iroij clans and one from two land owner families of Likiep. Five members of Council of Iroij come from the electoral districts of Ralik (Sunset) Chain and 7 from electoral districts of Ratak (Sunrise) Chain of Islands. Out of seven seats of Ratak Chain, 4 have permanent term and rest three seats from this Chain namely one seat each from Mili, Likiep and Mejit, rotate on yearly basis. In case of Likiep rotation is between land owning families of Capelle and deBrum. From Ralik Chain, the seat of Enewetak rotates between two Iroij families and the remaining 4 are permanent seats for the Iroijs of the area. The nomination/election process for the constitution of the Council of Iroij takes place every four years. The representation of women on this council has been proportional to the overall population.

RMI Statistical Yearbook, 2002
Economic Policy, Planning and Statistics Office 6
Bill are placed before the Nitijela for consideration and if passed the bill is then sent to the Council of Iroij for their approval. The Council of Iroij is required to make a decision on the referred bill within 7 days failing which the bill earlier passed by the Nitijela stands approved and becomes an Act. In case the Council of Iroij returns the bill to the Nitijela for reconsideration and the Nitijela passes it again, and if second time, the Council of Iroij still does not approve it, then the bill is considered in a joint session of two houses. A majority decision of the members of the lower and upper house decides the final fate of the bill. The appropriation bills, however, fall under the purview/consideration of the Nitijela only. The Executive Executive authority is vested with the President, the Cabinet, the Attorney General and the Chief Secretary. Members of which are collectively responsible to the Nitijela.
Local Government As embodied in the constitution, each atoll has a right to create a local government. Each local government consists of an elected council, a mayor, officials, and a local police force, with variations depending upon the constitution of each. People elect their counselors and Mayor directly. The term of the Council is of 4 years same as of the Nitijela. The Minister of Internal Affairs can constitutionally terminate a Council earlier if circumstances so necessitate. In the case of Ebon, instead of direct election, each family elects one member for the local council. As a result, there are 83 members on the Ebon council. Membership on Councils of other atolls ranges from 5 in Likiep to 25 in Ailinglaplap, depending upon the membership provisions in their local constitutions. Of a total membership of 393 in all of the Atoll Councils, the number of women totaled only 40. In the case of Mayors representation of women was even less. However, it is significant to observe that in four of the last five terms women have been mayors on both Majuro and Ebon. In Jaluit and Wotje women were mayors in 1995 and 1991 respectively.
The Judiciary The judiciary is independent of the Nitijela and the executive, its power vests in the Supreme Court, the High Court, the Traditional Rights Courts, the Community Courts and other subordinate courts created by law. The Supreme Court, the High Court and the Traditional Rights Court function from Majuro and the District Courts are located at Majuro, Ebeye and Jaluit. The Community Courts function on respective atolls. There is an independent Judicial Service Commission responsible for the appointments to the judiciary. Candidates for positions are recommended by this commission for the Traditional Rights Courts, the District Courts, the High Court and the Supreme Court to the government. The Council of Ministers after considering the proposal, places it before the Nitijela for a final decision. The appointments of judicial officers to the Community Courts are finalized at the level of the Judicial Public Service Commission itself. The Community courts have jurisdiction to decide civil cases of value up to $100 and the jurisdiction of the District courts are all cases having pecuniary limit up to $2,000. The jurisdiction of the High Court and the Supreme Court is with out any pecuniary limit. The Traditional Rights Court has no original jurisdiction and it provides advice on issues involving customary law and practices, referred to it by other courts. The jurisdictional court, however, makes the final decision in the case after taking into account the opinion of the Traditional Rights Court.

RMI Statistical Yearbook, 2002
Economic Policy, Planning and Statistics Office 7
Public Service The Public Service assists the Cabinet in exercising its executive authority. The Service is headed by the Chief Secretary, and includes the Attorney General, Chairmen of the Public Service Commission, Permanent Secretaries and all other public servants.
Culture and Social Structure The Marshallese culture is on the whole homogeneous but there are minor cultural and linguistic differences between Ratak and Ralik chains.
Marshallese are matrilineal society where family ties and mutual reciprocity are very strong despite modern influences. Unlike western society, the extended system of family is prevalent and family ties are strong. Average family size is 7.8 persons, the highest among the central pacific countries. The Church and religion has played a significant role in shaping the attitude and behavior of the people since the missionaries first arrived in the islands during the 1830’s. People are generally God fearing, peace loving, tolerant and secular. The life style throughout the islands is generally simple and easy going. Due to high wage earnings in non-traditional occupations, development of a cash based economy and the availability of imported western food, food habits have undergone a change for the worse. The traditional nutritious diet of primarily consisting of breadfruit, coconut, pandanus, taro, protein rich fish, chicken and pork has been overtaken by canned and processed food. Alcohol, smoking and substance abuse are on the rise particularly amongst the young and as is the crime rate. Combined, life style changes along with changes in the diet, have led to the increasing incidence of diabetes and diabetes related diseases. The health of the people is moving through a transition in morbidity and mortality. Now more people die from non-communicable life-style diseases than from communicable diseases.
Population Structure According to the 1999 Census the population of Marshall Islands was 50,840 persons. This number has more than doubled in 26 years from 24,135 persons enumerated during the 1973 Census. 96.7% of the population was born in the RMI and the rest, less than 2.3%, are from other Pacific islands, the USA and other countries. The sex ratio is 104.9, meaning that there are more men than women. The annual population growth of 4.3% during the inter-censal period 1980-88, this drastically decreased to 1.5% during the period 1988-99. The rate of natural increase, which is the difference between the crude birth rate and crude death rate, however, was as high as 3.7% in 1999. The wide difference in the two is because of migration of people mostly to the USA. The fertility rate is still high. About 68% of the total population resides in either Majuro and Kwajalein. During the inter-censal period 1988-99, the average annual growth rate of these two communities has decreased considerably from 6.3% and 4.2% during inter-censal period 1980-88 to 1.8% and 1.5% per year during the inter-censal period 19988-99. The population in the outer islands of Jabat, Jaluit, Mejit, Namdrik, and Ujae registered a declined in 1999 from their populations in 1988. The average annual population growth rate during 1988-99 was below 1% in case of Ailuk, Lae, Maloelap, and Utrik Atolls. This population change is mainly the result of migration of people within the country or to other countries.

RMI Statistical Yearbook, 2002
Economic Policy, Planning and Statistics Office 8
The infant mortality rate decreased from 56.9 in 1988 to 37.0 in 1999 but this and the child mortality rate are still quite high. Based on the results from the 1988 and 1999 censuses, the life expectancy of males has increased from 59.6 years to 65.7 years and for females life expectancy also increased from 62.6 years to 69.4 years. The population of the country is still quite young, 43% being under 14 years of age and 64.3% below 25 years of age, this still provides great potential for the population to grow fast. The average woman still bears about 6 children.
Age Dependency Ratio The percentage children below 14 years of age has decreased from 51% in 1988 to 43% in 1999 but strangely enough, the percentage of elderly that is people older than 65, has also declined from 2.9 % in 1988 to 2.2% in 1999. This has resulted in the decline in both the child and old age dependency ratios for the RMI. The child dependency ratio and old age dependency ratio were 75.1 per 100 persons and 3.8 per 100 persons for the respective age groups in 1999. These ratios were, however, higher for those living in rural areas, being 89.6 for the children and 4.6 for the old in 1999 per 100 persons. By comparison, these ratios in the urban population were much lower, being 68.3 and 3.4 per 100 persons in respective the age groups. Obviously, the rural wage earners have a greater burden in order to support children and the elderly. The higher child dependency in rural areas is primarily due to the higher fertility rates of women in rural areas. Economy The economy of the country, like many other central pacific island countries has three basic financial and economic problems: budget deficits, balance of payments and a low level of domestic savings. Both public and private investment has been low. As a result of the liberal foreign investment policy of the government, small business investment has increased with more traders from Asian countries like China, Taiwan, Hong Kong and Korea providing stiff competition for established local stores such as Gibson’s and RRE. The small size of the market, legal restrictions to land, distances and isolated places, high transportation costs in importing goods and high wages are the factors detracting foreign investment in this country.
The economy is heavily dependant on funds from the US, Asian Development Bank and assistance from other countries. The size of the annual budget is largely dependent on the size of the financial aid from these sources. The imports are rising without corresponding increase in exports and thus the balance of trade is unfavorable. The economic and administrative reforms carried out a few years ago are of late, are showing some favorable results for the economy. There are few reliable estimates of the GDP available, but is estimated that the GDP in 2002 grew by 3.8% based on current market prices. The RMI has no monetary system of its own and uses the US dollar. As a result, the economy has not had to face foreign exchange rate problems as experienced by other countries in the region who have their own monetary systems. The rate of inflation is minimal. The per capita income in 2002 was estimated at 1,867 US dollars, among the highest in the region after the Federated States of Micronesia.

RMI Statistical Yearbook, 2002
Economic Policy, Planning and Statistics Office 9
Employment Situation The country is facing a serious problem of providing jobs for its growing labor force. According to the 1999 census, the total number of job seekers was 14,677 but only 10,141 were working, 3,106 in the public sector and 7,035 in the private sector. In 1988 the number of people economically active was 11,488, out of which 10,056 were working, 3,392 being in government jobs and 6,664 in private employment. Unemployment rate at that time was 12.5% compared to 30.9% following the 1999 census. During the 11- year period from 1988 to 1999, the number of people who were economically active grew 27.76% while actual job creation grew only by 0.84%. Civil Registration System Under the Act of 1988, the registration of births, deaths and marriages is compulsory and the Secretary of Internal Affairs is the ex-officio the Registrar General of births, deaths and marriages. These events are to be registered by qualified informants who are appointed by the Registrar General. There is an element of under registration in both births and deaths, particularly in the outer islands where the registration system is not well known. If the total fertility rate of 5.7 and crude birth rate of 41.8 as estimated under the 1999 Census are taken into account, the annual number of births should be in the range of 2,100-2,200. Compared to the data collected from the Ministry of Health, the number of births registered in 2002 was only 1,355. The completeness of the registration of births, deaths and infant deaths is vital for the planning and the implementation of public health programs in particular and development plans in general. It is, therefore, necessary to take appropriate steps to improve the civil registration system. One recommendation is to issue the registration certificates of births and deaths at the atoll level instead of present arrangement of issuing these certificates on Majuro. Teen Age Pregnancies Despite recent signs of declining fertility in the country, the incidence of teen - age pregnancy continues to be the highest among the pacific island countries. 17.6% of total live births registered in 2002 were to mothers below 19 years of age and the highest percentage of live births, 36.5% were in the age group 20-24. Poor standards of education, high dropout rates from school, a lack of guidance from the home and under utilization of family planning practices are contributing factors for these pregnancies. This phenomenon is also major reason why many young girls do not complete high school studies.
High Lights • In 1999, the sex ratio was 104.9 males for 100 females. This imbalance is even greater in rural
areas where there were 107.6 males for 100 females. The sex ratio in urban areas was 103.5. • Of the total population, 42.9 % are children (0-14), 27.2 % adolescent (10-19) and 21.4 % are
youth (15-24) and 57.1 % are working age. Only 2.2 % are 65 and above. • The overall dependency ratio in 1999 was 82.2 but it was as high as 99.7 for the rural population
due to a proportionately higher number of dependents. The ratio of child • dependency was 70.6 in urban areas but in rural areas it was higher at 94.8. The old age
dependency ratio was also larger in rural areas, 4.9 as compared to 3.5 in urban areas. • The crude birth rate declined from 49.2 in 1988 to 41.8 in 1999 but the fall in crude death rate
was even more pronounced as it fell from 8.9 in 1988 to 4.9 in 1999.

RMI Statistical Yearbook, 2002
Economic Policy, Planning and Statistics Office 10
• The annual rate of population growth of the RMI registered a dramatic decrease from 4.3 % in 1988 to 1.5 % in 1999. At a 1.5 percent annual rate of growth, the population of the country will double in 47 years from 50,840 in 1999 to over 100,000 in 2046.
• If this trend in high birth rates continue and no other factors like out-migration and a decline in fertility, at the current natural increase rate of about 3.3 % (CBR-CDR), the population is likely to double in next 21 years.
• The explosive trend in urban population growth appears to have halted. The annual population growth rate of Majuro fell from 6.3 % in 1988 to 1.8 % in 1999 and similarly, there was a decline in the annual population growth rate of Ebeye from 4.2 % to 1.5 % over the same period.
• The average annual growth rates of atolls/islands varied widely from a negative rate of (-1.6 %) in Jabat to a positive rate of growth 4.5 % in Wotho.
• The population density of the country as a whole was 726 people per square mile. Majuro atoll has the highest population density, 6,314 persons per square mile. However, Ebeye was the most densely populated island with a density of 66,750 persons per square mile.
• The drop in total fertility from 7.2 in 1988 to 5.7 in 1999 is significant. • Life Expectancy has increased for both males and females. It being 65.7 years for males and 69.4
for females, a difference of 3.7 years. • On an average there were 7.8 persons per household in RMI in 1999. When compared to other
pacific island countries this size of household is the largest in the region. • The housing conditions in RMI are not adequate, there are too many persons living with
inadequate space. In housing units with floor area of less than 210 square feet, there was an average of 7.1 occupants.
• About 18 % of total live births take place to the teen mothers and this trend is not showing any definite signs of decline.
• Child mortality (mortality below 5 years) is estimated at 48 in males and 37 in females which is still high when compared with the overall death rate of 4.9 and infant mortality rate of 37.
• Female child mortality is lower than mortality amongst male children in all the countries of central pacific.
• Only 0.3 % persons speak English at home in the Marshall Islands, which is perhaps the lowest in the countries of the central pacific region.
• The percentage of foreign nationals in the RMI was 2.3 % and the smallest of other Pacific Island Countries in the region.
• The per capita income in the RMI was estimated at 2,158 US dollars at current prices, the highest after the FSM amongst its neighboring countries. However, per capita income has been stagnant for the last several years.

RMI Statistical Yearbook, 2002
Economic Policy, Planning and Statistics Office 11
Table 1.1 Resident Population and Annual Population Growth Rate, 1920-1999
Male Female Total Annual Natural Population Increase Census Year Growth Rate Rate
1999 26,026 24,814 50,840 1.5 3.7 1988 22,181 21,199 43,380 4.3 4.0 1980 15,851 15,022 30,873 3.6 3.2 1973 12,335 11,800 25,045 4.1 3.6 1967 9,658 9,267 18,925 3.5 3.5 1958 7,175 6,753 14,163 1.3 .. 1935 5,480 4,966 10,446 0.1 .. 1930 5,505 4,907 10,412 1.5 .. 1925 5,030 4,614 9,644 -0.3 .. 1920 5,196 4,604 9,800 .. ..
*Unknown:910 and 235 in 1973 & 1958 Totals Natural Increase Rate=CBR minus CDR Source: Concerned Census Reports/EPPSO
010,00020,00030,00040,00050,00060,000
Num
ber o
f Per
sons
1999 1988 1980 1973 1967 1958 1935 1930 1925 1920
Census Year
Fig. 1.1 Population of Marshall Islands: Census Figures, 1920-1999
Fig. 1.2 Population Growth Rates of RMI
3.5
1.5
4.33.6
4.1
3.6 3.23.7
4.0
0
1
2
3
4
5
1967 1973 1980 1988 1999Census Year
Perc
ent
AnnualGrowthRate
Rate ofNaturalIncrease
RMI Statistical Yearbook, 2002
Economic Policy, Planning and Statistics Office 12
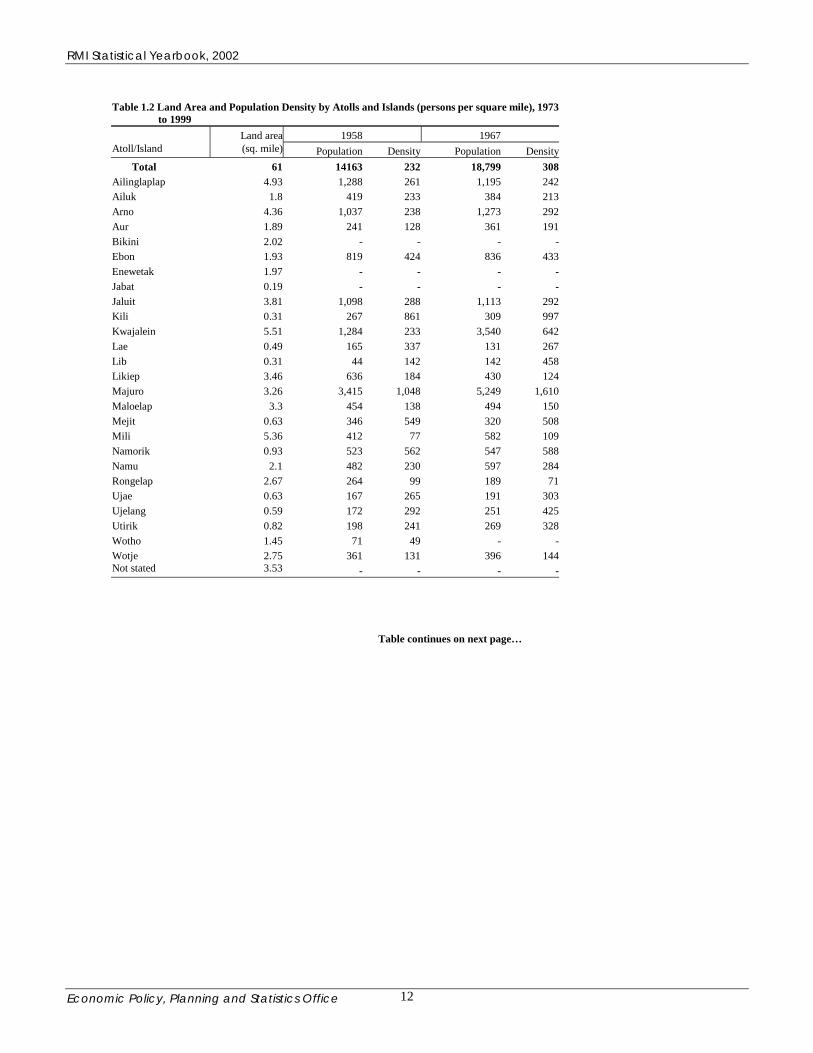
Table 1.2 Land Area and Population Density by Atolls and Islands (persons per square mile), 1973 to 1999 Land area 1958 1967 Atoll/Island (sq. mile) Population Density Population Density
Total 61 14163 232 18,799 308 Ailinglaplap 4.93 1,288 261 1,195 242 Ailuk 1.8 419 233 384 213 Arno 4.36 1,037 238 1,273 292 Aur 1.89 241 128 361 191 Bikini 2.02 - - - - Ebon 1.93 819 424 836 433 Enewetak 1.97 - - - - Jabat 0.19 - - - - Jaluit 3.81 1,098 288 1,113 292 Kili 0.31 267 861 309 997 Kwajalein 5.51 1,284 233 3,540 642 Lae 0.49 165 337 131 267 Lib 0.31 44 142 142 458 Likiep 3.46 636 184 430 124 Majuro 3.26 3,415 1,048 5,249 1,610 Maloelap 3.3 454 138 494 150 Mejit 0.63 346 549 320 508 Mili 5.36 412 77 582 109 Namorik 0.93 523 562 547 588 Namu 2.1 482 230 597 284 Rongelap 2.67 264 99 189 71 Ujae 0.63 167 265 191 303 Ujelang 0.59 172 292 251 425 Utirik 0.82 198 241 269 328 Wotho 1.45 71 49 - - Wotje 2.75 361 131 396 144 Not stated 3.53 - - - -
Table continues on next page…
RMI Statistical Yearbook, 2002
Economic Policy, Planning and Statistics Office 13
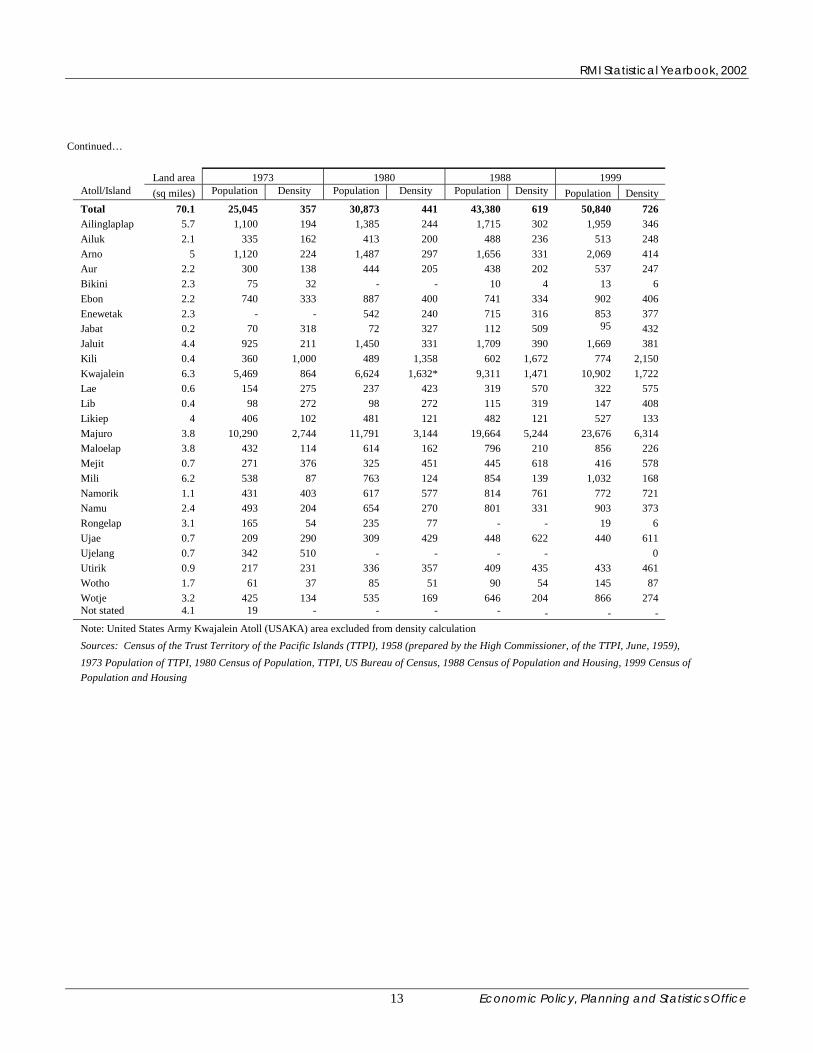
Continued…
Land area 1973 1980 1988 1999 Atoll/Island (sq miles) Population Density Population Density Population Density Population Density Total 70.1 25,045 357 30,873 441 43,380 619 50,840 726 Ailinglaplap 5.7 1,100 194 1,385 244 1,715 302 1,959 346 Ailuk 2.1 335 162 413 200 488 236 513 248 Arno 5 1,120 224 1,487 297 1,656 331 2,069 414 Aur 2.2 300 138 444 205 438 202 537 247 Bikini 2.3 75 32 - - 10 4 13 6 Ebon 2.2 740 333 887 400 741 334 902 406 Enewetak 2.3 - - 542 240 715 316 853 377 Jabat 0.2 70 318 72 327 112 509 95 432 Jaluit 4.4 925 211 1,450 331 1,709 390 1,669 381 Kili 0.4 360 1,000 489 1,358 602 1,672 774 2,150 Kwajalein 6.3 5,469 864 6,624 1,632* 9,311 1,471 10,902 1,722 Lae 0.6 154 275 237 423 319 570 322 575 Lib 0.4 98 272 98 272 115 319 147 408 Likiep 4 406 102 481 121 482 121 527 133 Majuro 3.8 10,290 2,744 11,791 3,144 19,664 5,244 23,676 6,314 Maloelap 3.8 432 114 614 162 796 210 856 226 Mejit 0.7 271 376 325 451 445 618 416 578 Mili 6.2 538 87 763 124 854 139 1,032 168 Namorik 1.1 431 403 617 577 814 761 772 721 Namu 2.4 493 204 654 270 801 331 903 373 Rongelap 3.1 165 54 235 77 - - 19 6 Ujae 0.7 209 290 309 429 448 622 440 611 Ujelang 0.7 342 510 - - - - 0 Utirik 0.9 217 231 336 357 409 435 433 461 Wotho 1.7 61 37 85 51 90 54 145 87 Wotje 3.2 425 134 535 169 646 204 866 274 Not stated 4.1 19 - - - - - - - Note: United States Army Kwajalein Atoll (USAKA) area excluded from density calculation Sources: Census of the Trust Territory of the Pacific Islands (TTPI), 1958 (prepared by the High Commissioner, of the TTPI, June, 1959), 1973 Population of TTPI, 1980 Census of Population, TTPI, US Bureau of Census, 1988 Census of Population and Housing, 1999 Census of Population and Housing
RMI Statistical Yearbook, 2002
Economic Policy, Planning and Statistics Office 14
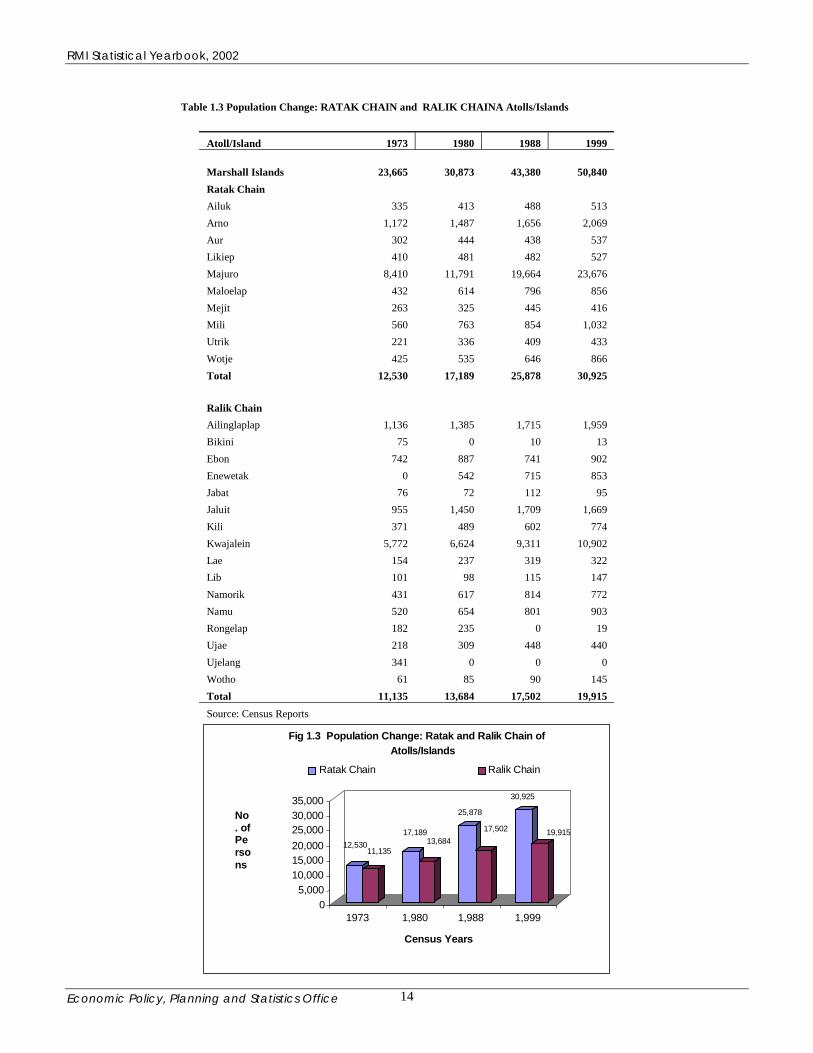
Table 1.3 Population Change: RATAK CHAIN and RALIK CHAINA Atolls/Islands
Atoll/Island 1973 1980 1988 1999 Marshall Islands 23,665 30,873 43,380 50,840 Ratak Chain Ailuk 335 413 488 513 Arno 1,172 1,487 1,656 2,069 Aur 302 444 438 537 Likiep 410 481 482 527 Majuro 8,410 11,791 19,664 23,676 Maloelap 432 614 796 856 Mejit 263 325 445 416 Mili 560 763 854 1,032 Utrik 221 336 409 433 Wotje 425 535 646 866 Total 12,530 17,189 25,878 30,925 Ralik Chain Ailinglaplap 1,136 1,385 1,715 1,959 Bikini 75 0 10 13 Ebon 742 887 741 902 Enewetak 0 542 715 853 Jabat 76 72 112 95 Jaluit 955 1,450 1,709 1,669 Kili 371 489 602 774 Kwajalein 5,772 6,624 9,311 10,902 Lae 154 237 319 322 Lib 101 98 115 147 Namorik 431 617 814 772 Namu 520 654 801 903 Rongelap 182 235 0 19 Ujae 218 309 448 440 Ujelang 341 0 0 0 Wotho 61 85 90 145 Total 11,135 13,684 17,502 19,915 Source: Census Reports
12,530 11,135
17,189 13,684
25,878 17,502
30,925
19,915
0 5,000
10,000 15,000 20,000 25,000 30,000 35,000
No. of Persons
1973 1,980 1,988 1,999 Census Years
Fig 1.3 Population Change: Ratak and Ralik Chain of Atolls/Islands
Ratak Chain Ralik Chain

RMI Statistical Yearbook, 2002
Economic Policy, Planning and Statistics Office 15
Table 1.4 Population of Majuro and Ebeye, 1930-1999
Year Majuro Ebeye 1930 753 19 1935 779 16 1958 3,415 1,284 1967 5,249 3,540 1973 10,290 5,123 1980 11,791 6,169 1988 19,664 8,324 1999 23,676 9,345
Source: Census Reports
19 16
1,28
4
3,54
0
5,12
3
6,16
9 8,32
4
9,34
50
5,000
10,000
15,000
20,000
25,000
No.
of P
erso
ns
1930 1935 1958 1967 1973 1980 1988 1999
Census Years
Fig. 1.4 Population of Majuro and Ebeye, 1930-1999MajuroEbeye

RMI Statistical Yearbook, 2002
Economic Policy, Planning and Statistics Office 16
Table 1.5 Population and Reproductive Health Indicators of RMI, 1999
Feature Country Urban Rural Total Male Female Total Male Female Total Male Female Total Population 50,840 26,026 24,814 33,125 16,846 16,279 17,715 9,180 8,535 Percent(%) 100.0 51.2 48.2 100.0 50.9 49.1 100.0 51.8 48.2 0-14 Population 21,805 11,227 10,578 13,432 6,840 6,592 8,373 4,387 3,986 Percent(%) 42.9 43.1 42.6 40.5 40.6 40.5 47.3 47.8 46.7 10-24 Population 18,374 9,345 9,029 11,854 5,994 5,860 6,520 3,351 3,169 Percent(%) 36.1 35.9 36.4 35.8 33.2 36.0 36.8 36.5 37.1 Adolescent(10-19) 13,829 7,079 6,750 8,659 4,390 3,660 3,504 1,762 1,742 Percent(%) 27.2 27.2 27.2 26.1 26.1 22.5 19.8 19.2 20.4 Youth(15-24) 10,861 5,459 5,402 7,357 3,697 3,660 3,504 1,762 1,742 Percent(%) 21.4 21.0 21.8 22.2 21.9 22.5 19.8 19.2 20.4 65+ Population 1,099 533 566 666 326 340 433 207 226 Percent(%) 2.2 2.0 2.3 2.0 1.9 2.1 2.4 2.3 2.6 15-64 Population 27,850 14,227 13,623 19,015 9,674 9,341 8,835 4,553 4,282 Percent(%) 54.9 54.7 55.0 57.4 57.4 57.4 50.1 49.8 50.4 Median Age 17.8 17.8 17.9 18.8 18.8 18.7 16.0 15.8 16.2 Mean Age 21.6 21.6 21.6 22.1 22.1 22.0 20.7 20.6 20.7 Total Dependency Ratio 82.2 74.1 99.7 Child Dependency Ratio 78.3 70.6 94.8 Old age Dependency Ratio 3.9 3.5 4.9 Sex Ratio 104.9 103.5 107.6 The percentages are to the same sex in the base population Source: Based on 1999 Census
The decrease in the proportion of the population of children below 15 and those who were 65 and above resulted in the decline of both the child and old age dependency ratios of the RMI. These ratios declined from 110.6 in 1988 to 78.3 in 1999 and from 6.3 in 1988 to 3.9 in 1999. It is worth noting that both these ratios are much higher in rural populations than in the urban areas.

RMI Statistical Yearbook, 2002
Economic Policy, Planning and Statistics Office 17
Table 1.6 Population, Annual Rate of Increase, Surface Area and Density of Population of Pacific Island Countries compared
Total Population Annual Rate(%) of Surface Area Density of Population Country (2000 Estimated) Increase(estimated) (square kms.) (Per Sq. Km.)
Cook Islands 18,000 11.1 236 76 Fiji 814,000 18,274 45 French Polynesia 233,000 2.1 4,000 58 Guam 155,000 2.0 549 282 Marshall Islands 51,000 2.0 181 282 FSM 120,000 0.0 702 171 Nauru 12,000 0.0 21 571 New Caledonia 211,000 2.4 18,575 11 Niue 2,000 0.0 260 8 Northern M. Islands 73,000 4.6 464 157 Palau 19,000 5.3 459 41 Papua n. Guinea 4,809,000 2.3 462,840 10 Samoa 171,000 1.2 2,831 60 Solomon Islands 447,000 3.4 28896 15 Tonga 99,000 0.0 650 152 Tuvalu 10,000 0.0 26 385 Vanautu 197,000 2.7 12189 16 Source: UN Demographic Year Book 2000 Table 1.7 Percent Population Increase in Selected Pacific Countries, 1980-2000.
Country Population Increase (%) Guam 46.1 CNMI 312.5 A.Samoa 77.4 Palau 57.9 FSM 46.3 RMI 64.7 Source: Ben Graham, IPC Statistical Enhancement Program, US Census Bureau
46.1
312.5
77.457.9 46.3 64.7
0.0
50.0
100.0
150.0
200.0
250.0
300.0
350.0
Perc
ent I
ncre
ase
Guam CNMI A.Sam oa Palau FSM RMI
Countries
Fig. 1.5 Percent Population Increase In Selected Pacific Countries, 1988-2000
46.1
312.5
77.457.9 46.3 64.7
0.0
50.0
100.0
150.0
200.0
250.0
300.0
350.0
Perc
ent I
ncre
ase
Guam CNMI A.Sam oa Palau FSM RMI
Countries
Fig. 1.5 Percent Population Increase In Selected Pacific Countries, 1988-2000

RMI Statistical Yearbook, 2002
Economic Policy, Planning and Statistics Office 18
Table 1.8 Percentage of Population Under 18 in Some Selected Pacific Countries, 2000 Under 18 Country % of Total Population Guam 35.4 CNMI 25.6 A.Samoa 44.6 Palau 28.6 FSM 48.0 RMI 50.5 Source: Ben Graham, IPC Statistical Enhancement Program, US Census Bureau
35.4
25.6
44.6
28.6
48.0 50.5
0
10
20
30
40
50
60
Perc
enta
ges
Guam CNMI
A.SamoaPalau
FSM RMI
Countries
Fig. 1.6 Percent Population Under 18 in Selected Pacific Countries, 2000
Table 1.9 Demographic Profile of RMI Item 1988 1999 Total Fertility Rate 7.23 5.71 Gross Reproduction Rate 3.50 2.65 General Fertility Rate 243.80 173.3 Crude Birth Rate 49.2 41.8 Crude Death Rate 8.9 4.9 Infant Mortality Rate 56.9 37.0
Life Expectancy at Birth in Years Both Sexes 61.0 67.5 Males 59.6 65.7 Females 62.6 69.4 Source: Census Reports
There has been a appreciable decline in crude birth rate, crude death rate, infant mortality rate, general fertility rate, total and gross fertility rates from 1988 to 1999. The life expectancy at birth increased from 61.0 years in 1988 to 67.5 years in 1999. The life expectancy of females increased even more, as it went up from 62.7 years in 1988 to 69.4 years in 1999. The life expectancy of males was 65.7 years.

RMI Statistical Yearbook, 2002
Economic Policy, Planning and Statistics Office 19
Table 1.10 Age Specific Fertility and Total Fertility Rates, 1973. 1980. 1988 and 1999, RMI
Age Rate Per Thousand Women
Group 1973 1980 1988 1999 15-19 126 155 162 94 20-24 322 332 391 285 25-29 380 356 347 273 30-34 374 305 246 237 35-39 284 242 182 139 40-44 130 133 89 68 45-49 70 53 29 41 TFR 8.4 7.9 7.2 5.7 Source: Census Reports and Statistical Abstracts
Fig 1.7 Total Fertility Rates RMI Over Years
8.4 7.97.2
5.7
0
2
4
6
8
10
1973 1980 1988 1999
Years
No.
Of C
hild
ren
Fig 1.8 Age Specific Rates in RMI Over Years
050
100150200250300350400450
15-19 20-24 25-29 30-34 35-39 40-44 45-49
Age Group of Women
Chi
ldre
n Pe
r Tho
usan
d
ASFR1973
ASFR1980
ASFR1988
ASFR1999

RMI Statistical Yearbook, 2002
Economic Policy, Planning and Statistics Office 20
Table 1.11 Age Specific Fertility Rates Of Marshall Islands 1999
No. of No. of Births Fertility Rates Age Women in 1999 Per Woman Per Thousand
15-19 3,115 292 0.094 94 20-24 2,257 643 0.285 285 25-29 1,846 504 0.273 273 30-34 1,562 370 0.237 237 35-39 1,389 193 0.139 139 40-44 1,190 81 0.068 68 45-49 898 42 0.047 47 Total 12,257 2,125
General Fertility Rate: 173.4 Total Fertility Rate: 5.7 Urban Rate: 5.5 Rural rate: 6.3 Source: RMI Census 1999
Fig 1.9 Age Specific Fertility Rates of RMI 1999
94
237
47
139
68
285 273
0
50100
150
200250
300
15-19 20-24 25-29 30-34 35-39 40-44 45-49
Age Group of Women
Per T
hous
and
The reproduction of children still starts at very early age in the Marshall Islands and remains high for many years resulting in a high total fertility rate. Fertility is higher in rural women. The contraception prevalence rate is very low and birth intervals are very close, this takes a toll on the health of the mother and child and is a serious constraint in improving health for the women.
RMI Statistical Yearbook, 2002
Economic Policy, Planning and Statistics Office 21
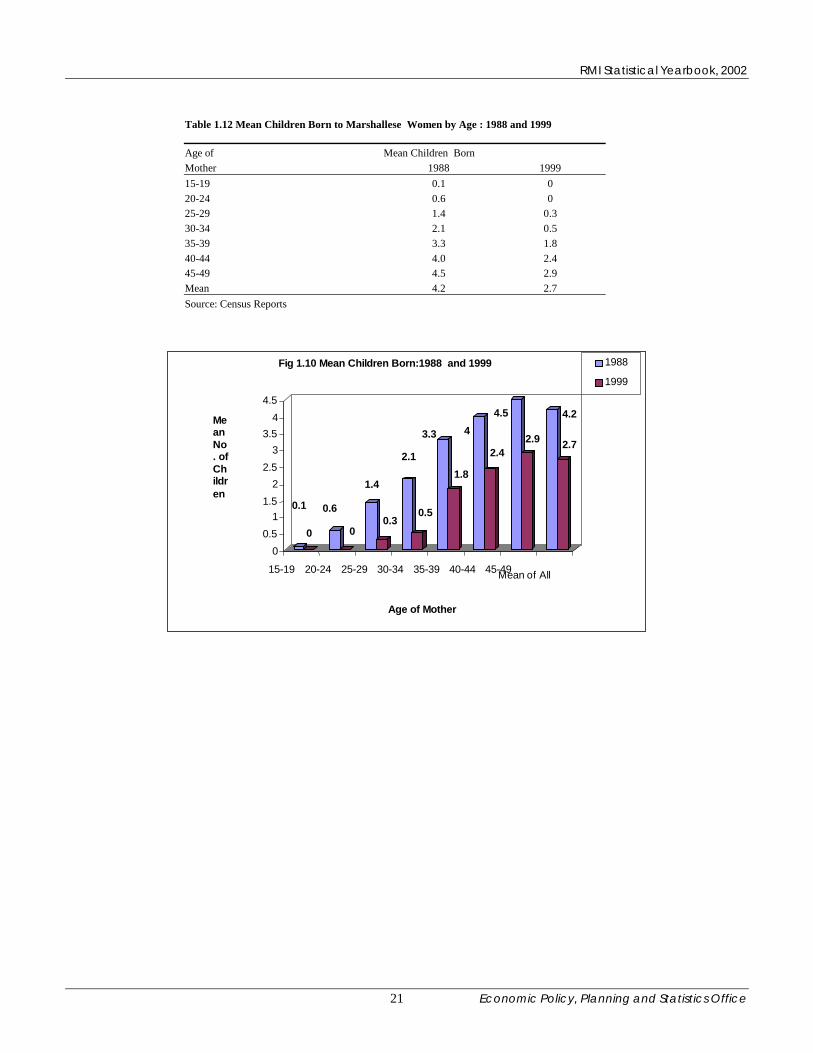
Table 1.12 Mean Children Born to Marshallese Women by Age : 1988 and 1999 Age of Mean Children Born Mother 1988 1999 15-19 0.1 0 20-24 0.6 0 25-29 1.4 0.3 30-34 2.1 0.5 35-39 3.3 1.8 40-44 4.0 2.4 45-49 4.5 2.9 Mean 4.2 2.7 Source: Census Reports
0.1
0 0.6
0
1.4
0.3
2.1
0.5
3.3
1.8
4 2.4
4.5 2.9
4.2
2.7
0 0.5
1 1.5
2 2.5
3 3.5
4 4.5
Mean No. of Children
15-19 20-24 25-29 30-34 35-39 40-44 45-49 Mean of All
Age of Mother
Fig 1.10 Mean Children Born:1988 and 1999 1988 1999

RMI Statistical Yearbook, 2002
Economic Policy, Planning and Statistics Office 22
Table 1.13 Child Mortality Rates in Selected Pacific Countries Country Male Female Marshall Islands 48 37 Kiribati 82 66 Solomon Islands 71 62 Tuvalu 58 52 Vanauatu 56 54 Tonga 36 23 Niue 33 26 Fiji 27 24 Palau 24 22 Samoa 24 19 Cook Islands 23 18 Nauru 18 13 FSM 65 42 Philippines 46 33 Child Mortality = Mortality of children before reaching the age of 5 Source: WHO website
������������������
������������������
�����
������������������������������
������������������������������
����� ��������������������
������������������������������������
����������
����������������
��������������������������������
�����������������������
������������������������
����������
��������
������������
��������������������
������������
���������� ���
���������
������������
����� ������������
������������
����� ������������
������������
����� ������������
������������
������������ ���
������
������������
������
���������������������
����������������������������
������������������
��������������������
����������
0
10
20
30
40
50
6070
80
90
Mor
talit
y ra
tes
Mar
shal
l Isl
ands
Kirib
ati
Solo
mon
Isla
nds
Tuva
lu
Vana
uatu
Tong
a
Niu
e Fiji
Pala
u
Sam
oa
Coo
k Is
land
s
Nau
ru
FSM
Philli
pine
s
Country
Fig 1.11 Child mortality in the Pacific countries
Male������ Female
RMI Statistical Yearbook, 2002
Economic Policy, Planning and Statistics Office 23
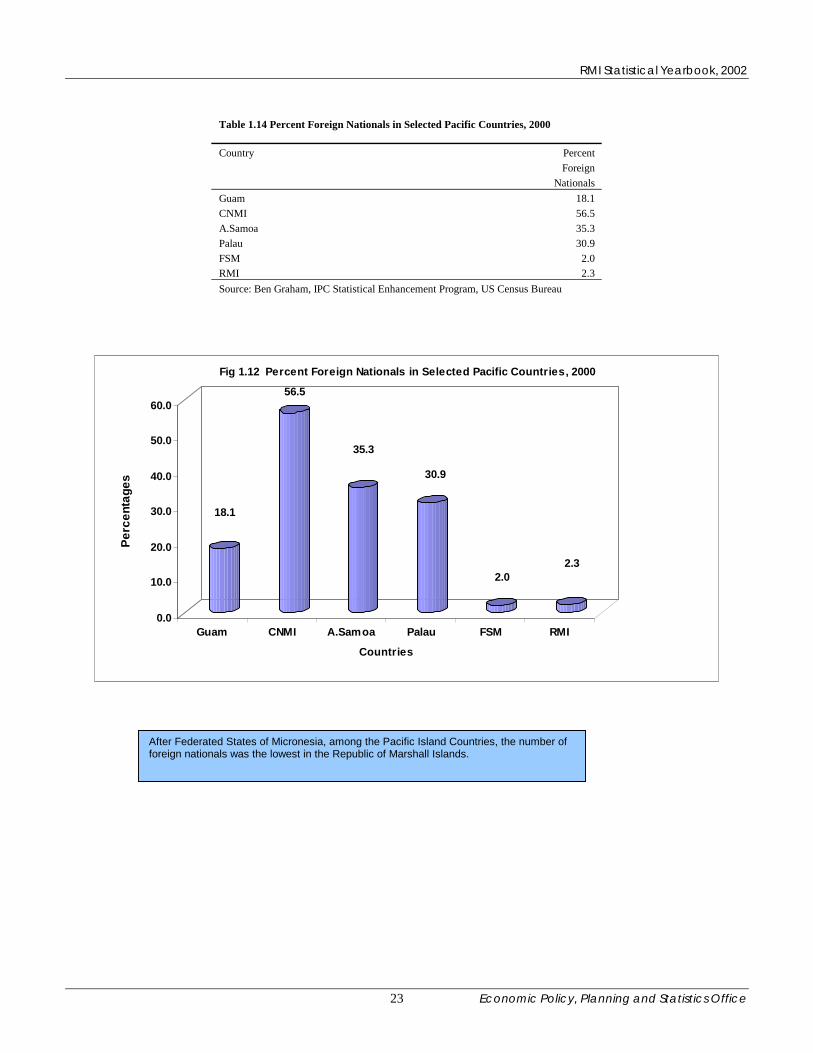
Table 1.14 Percent Foreign Nationals in Selected Pacific Countries, 2000 Country Percent Foreign Nationals Guam 18.1 CNMI 56.5 A.Samoa 35.3 Palau 30.9 FSM 2.0 RMI 2.3 Source: Ben Graham, IPC Statistical Enhancement Program, US Census Bureau
18.1
56.5
35.3
30.9
2.02.3
0.0
10.0
20.0
30.0
40.0
50.0
60.0
Perc
enta
ges
Guam CNMI A.Samoa Palau FSM RMI
Countries
Fig 1.12 Percent Foreign Nationals in Selected Pacific Countries, 2000
After Federated States of Micronesia, among the Pacific Island Countries, the number of foreign nationals was the lowest in the Republic of Marshall Islands.

RMI Statistical Yearbook, 2002
Economic Policy, Planning and Statistics Office 24
Table 1.15 Percent English Spoken at Home in Selected Pacific Countries, 2000 Country Percent English Spoken Guam 38.3 CNMI 10.8 A.Samoa 2.9 Palau 9.4 FSM 1.4 RMI 0.3 Source: Ben Graham, IPC Statistical Enhancement Program, US Census Bureau
38.3
10.8
2.9
9.4
1.4 0.3
0.0
5.0
10.0
15.0
20.0
25.0
30.0
35.0
40.0
Perc
enta
ges
Guam CNMI A.Samoa Palau FSM RMI
Countries
Fig 1.13 Percent English Spoken at Home in Selected Pacific Countries, 2000
RMI Statistical Yearbook, 2002
Economic Policy, Planning and Statistics Office 25
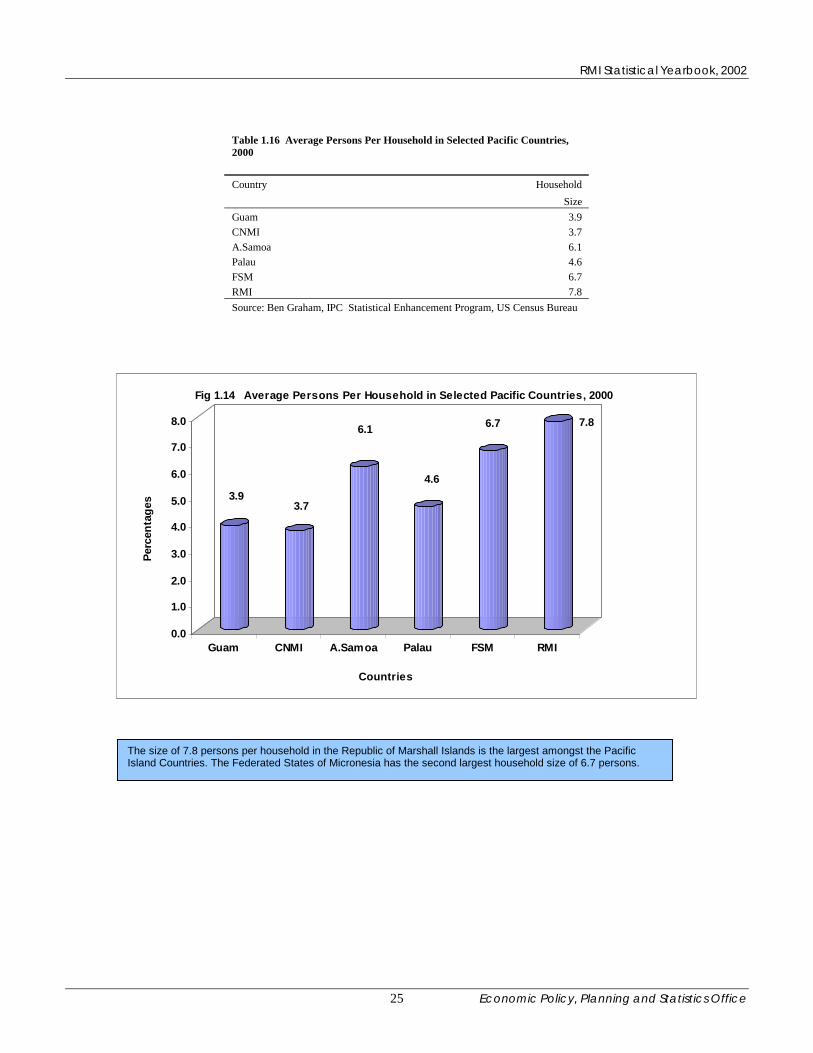
Table 1.16 Average Persons Per Household in Selected Pacific Countries, 2000 Country Household Size Guam 3.9 CNMI 3.7 A.Samoa 6.1 Palau 4.6 FSM 6.7 RMI 7.8 Source: Ben Graham, IPC Statistical Enhancement Program, US Census Bureau
3.93.7
6.1
4.6
6.7 7.8
0.0
1.0
2.0
3.0
4.0
5.0
6.0
7.0
8.0
Perc
enta
ges
Guam CNMI A.Samoa Palau FSM RMI
Countries
Fig 1.14 Average Persons Per Household in Selected Pacific Countries, 2000
The size of 7.8 persons per household in the Republic of Marshall Islands is the largest amongst the Pacific Island Countries. The Federated States of Micronesia has the second largest household size of 6.7 persons.

RMI Statistical Yearbook, 2002
Economic Policy, Planning and Statistics Office 26
Table 1.17 Percent Occupants in Housing Units by Floor Area and Mean Number of Occupants in RMI in 1999
Description of Floor Area of Housing Unit (in Square Feet) Percent Housing Units <100 108-209 210-317 318-532 533-748 749-963 964-1286 1287-1609 1610+ Occupants
1 Occupant 3.7 3.3 3.6 2.6 2.6 3.4 3.4 1.6 3.8 3.3 2-4 Occupants 25.0 24.2 21.7 16.2 16.4 21.0 20.6 16.9 25.1 21.2 5-9 Occupants 48.6 48.2 46.1 50.0 47.8 40.3 45.5 446.1 42.8 47.1 10-14 Occupants 16.6 18.4 18.7 21.6 22.4 22.1 19.1 21.4 17.6 10.4 15-19 Occupants 4.4 5.1 6.0 6.7 7.8 8.3 7.9 9.5 6.3 6.2 20 + Occupants 1.7 0.8 3.9 2.9 3.0 4.9 3.5 4.5 4.4 2.8 Total 100.0 100.0 100.0 100.0 100.0 100.0 100.0 100.0 100.0 100.0 Mean Number of occupants per house 7.1 7.1 8.0 8.3 8.4 8.6 8.1 8.8 7.9 7.8 Source: RMI Census 1999
7.1 7.18.0 8.3 8.4 8.6 8.1
8.87.9
0123456789
Num
bers
<100 108-209 210-317 318-532 533-748 749-963 964-1286 1287-1609 1610+
Floor Area of the Housing Units in Square Feet
Fig 1.15 Mean Number of Occupants Per Housing Unit
Housing in Marshall Islands, is a serious problem. Housing units are small and household size is large, about 8persons per household. Even in a small housing unit of size less than 108 square feet, in some cases, up to 20 peoplemake up the household. Crowding in housing units is worse in Kwajalein and Lae Atolls where in 6 percent of thehousing units have more than 20 persons per dwelling.
RMI Statistical Yearbook, 2002
Economic Policy, Planning and Statistics Office 27
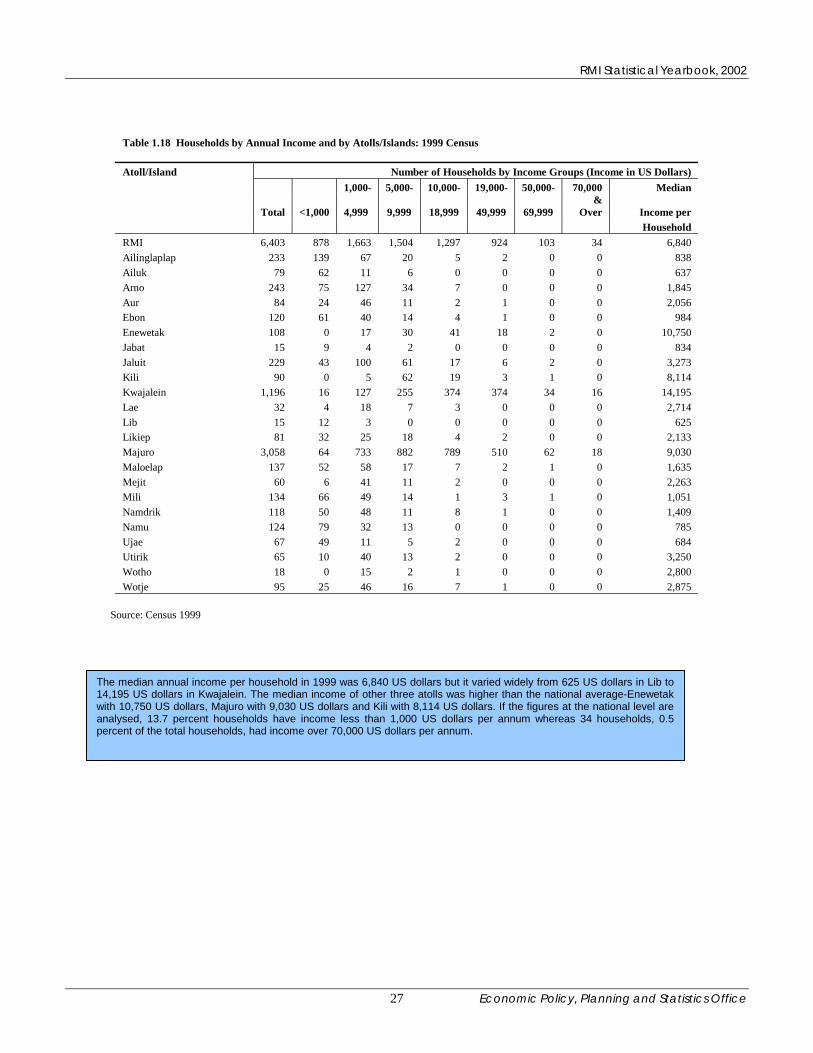
Table 1.18 Households by Annual Income and by Atolls/Islands: 1999 Census Atoll/Island Number of Households by Income Groups (Income in US Dollars) 1,000- 5,000- 10,000- 19,000- 50,000- 70,000 Median
Total <1,000 4,999 9,999 18,999 49,999 69,999 &
Over Income per Household RMI 6,403 878 1,663 1,504 1,297 924 103 34 6,840 Ailinglaplap 233 139 67 20 5 2 0 0 838 Ailuk 79 62 11 6 0 0 0 0 637 Arno 243 75 127 34 7 0 0 0 1,845 Aur 84 24 46 11 2 1 0 0 2,056 Ebon 120 61 40 14 4 1 0 0 984 Enewetak 108 0 17 30 41 18 2 0 10,750 Jabat 15 9 4 2 0 0 0 0 834 Jaluit 229 43 100 61 17 6 2 0 3,273 Kili 90 0 5 62 19 3 1 0 8,114 Kwajalein 1,196 16 127 255 374 374 34 16 14,195 Lae 32 4 18 7 3 0 0 0 2,714 Lib 15 12 3 0 0 0 0 0 625 Likiep 81 32 25 18 4 2 0 0 2,133 Majuro 3,058 64 733 882 789 510 62 18 9,030 Maloelap 137 52 58 17 7 2 1 0 1,635 Mejit 60 6 41 11 2 0 0 0 2,263 Mili 134 66 49 14 1 3 1 0 1,051 Namdrik 118 50 48 11 8 1 0 0 1,409 Namu 124 79 32 13 0 0 0 0 785 Ujae 67 49 11 5 2 0 0 0 684 Utirik 65 10 40 13 2 0 0 0 3,250 Wotho 18 0 15 2 1 0 0 0 2,800 Wotje 95 25 46 16 7 1 0 0 2,875
Source: Census 1999
The median annual income per household in 1999 was 6,840 US dollars but it varied widely from 625 US dollars in Lib to14,195 US dollars in Kwajalein. The median income of other three atolls was higher than the national average-Enewetakwith 10,750 US dollars, Majuro with 9,030 US dollars and Kili with 8,114 US dollars. If the figures at the national level areanalysed, 13.7 percent households have income less than 1,000 US dollars per annum whereas 34 households, 0.5percent of the total households, had income over 70,000 US dollars per annum.

RMI Statistical Yearbook, 2002
Economic Policy, Planning and Statistics Office 28
Table 1.19 Trend in Per Capita Income (US Dollars) at Current Prices: Some Selected Pacific Countries Year RMI FSM PNG Kiribati Samoa Tonga Vanautu
1985 1,046 .. 722 333 534 638 940 1990 1,487 1,554 875 393 699 1,192 1,023 1995 2,221 2,020 1,130 592 1,219 1,604 1,353 1998 1,922 1,929 876 563 1,339 1,491 1,349 1999 1,903 1,967 793 647 1,383 1,486 1,298 2000 1,852 2,085 663 571 1,330 1,480 1,222 2001 1,863 2,145 545 550 1,358 1,296 1,154 2002 1,867 2,158 512 611 1,544 1,337 1,058
Source: ADB, Key Indicators 2003
1,8672,158
512 611
1,544 1,3371,058
0
500
1,000
1,500
2,000
2,500
US
Dol
lars
RMI FSM PNG Kiribati Samoa Tonga Vanautu
Countries
Fig 1.16 Per Capita Income 2002: Selected Pacific Countries

RMI Statistical Yearbook, 2002
Economic Policy, Planning and Statistics Office 29
Table 1.20 Human Poverty Index for Pacific Island Countries, 1998 Country Percentage of Percentage Percentage of Percentage of Percentage of Combined Human
people not of adults people
without people
without children P3 Value Poverty expected who are access to access to >5 who are Index
to survive to age
40 illiterate safe water health
services underweight (P1) (P2) (P3) (P3) (P3) Niue 6.7 3 0 0 2 0.7 4.8 Tonga 8.4 1 5 0 2 2.3 5.9 Cook Islands 6.4 6.8 5 0 10 5 6.1 Tuvalu 9.8 5 15 0 0 5 7.3 Tokelau 8.3 9 6 0 0 2 7.6 Fiji Islands 7.4 7.1 23 0 7.9 10.3 8.5 Samoa 10.3 4.3 10 0 17 9 8.6 Palau 7.3 8.6 14 20 8 14 10.8 Nauru 17.4 5 0 0 0 0 12.1 Kiribati 16.3 7.8 20 0 12.9 11 12.6 Marshall Islands 13.2 25.6 23.5 5 17 15.2 19.5 FSM 10.5 28.7 56 25 15 32 26.7 Vanuatu 12.2 66.5 13 20 23 18.7 46.6 Solomon Islands 13.7 69.7 36 20 21 25.7 49.1 Papua new Guinea 22.6 71.8 76 5 29 36.7 52.2
Source: UNDP, Pacific Human Development Report 1999
The Marshall Islands ranked 11th among Pacific Island Countries in the Human Poverty Index.

RMI Statistical Yearbook, 2002
Economic Policy, Planning and Statistics Office 30
Table 1.21 Human Development Index for Pacific Island Countries, 1998 Country Adult Combined Life GDP Global
literacy(%) gross Expectancy per
capita HDI enrolment at birth (US$) HDI Rank* (%) Palau 91.4 83.4 69.0 8027 0.861 46 Cook Islands 93.2 84.8 72.0 4947 0.822 62 Niue 97.0 83.6 74.0 3714 0.774 70 Fiji Islands 92.9 81.3 66.5 2684 0.667 101 Nauru 95.0 79.5 58.2 3450 0.663 103 Tonga 99.0 83.3 68.0 1868 0.647 107 Samoa 95.7 85.7 66.6 1060 0.59 117 Tuvalu 95.0 74.0 67.0 1157 0.583 118 FSM 71.3 71.4 65.7 2070 0.569 120 Marshall Islands 74.4 71.7 65.0 1182 0.563 121 Kiribati 92.2 67.8 61.6 702 0.515 129 Vanuatu 33.5 57.4 65.8 1231 0.425 140 Solomon Islands 30.3 34.7 64.7 926 0.371 147 Papua New Guinea 28.2 28.6 54.0 1196 0.314 164 Tokelau 91.0 88.3 69.0 n.a n.a n.a Note: The per capita income figures do not match with the ADB estimates. Source: UNDP, Pacific Human Development Report 1999
The Marshall Islands ranked 10th among Pacific Island Countries in the Human Development Index.

RMI Statistical Yearbook, 2002
Economic Policy, Planning and Statistics Office 31
Table 1.22 Mayors in various Atolls by Male and Female from 1983 onwards in RMI
1983 1987 1991 1995 1999 Atoll Council Male Female Male Female Male Female Male Female Male
Ailinglaplap 1 1 1 1 1 Ailuk 1 1 1 1 1 Arno 1 1 1 1 1 Aur 1 1 1 1 1 Bikini 1 1 1 1 1 Ebon 1 1 1 1 1 1 Enewetak 1 1 1 1 1 Jabat 1 1 1 1 1 Jaluit 1 1 1 1 1 Kwajalein 1 1 1 1 1 Lae* 1 1 1 1 1 Lib* 1 1 1 1 1 Likiep 1 1 1 1 1 Majuro 1 1 1 1 1 Maloelap 1 1 1 1 1 Mejit 1 1 1 1 1 Mili 1 1 1 1 1 Namdrik 1 1 1 1 1 Namu 1 1 1 1 1 Rongelap 1 1 1 1 1 Ujae* 1 1 1 1 1 Utirik 1 1 1 1 1 Wotho 1 1 1 1 Wotje 1 1 1 1 1 Total 22 2 22 2 22 2 21 3 23 * Councilors of Lae, Lib and Ujae, elected unanimously same person as Mayor for 1995 term. Councilors of Lae and Ujae elected unanimously same person as their Mayor for 1999 term. Source: Ministry of Internal Affairs
The representation of women as Mayors in the elected bodies of the Local Councils has been very low with the exception of Majuro and Ebon where in 4 out of 5 terms women were elected as Mayors.
RMI Statistical Yearbook, 2002
Economic Policy, Planning and Statistics Office 32
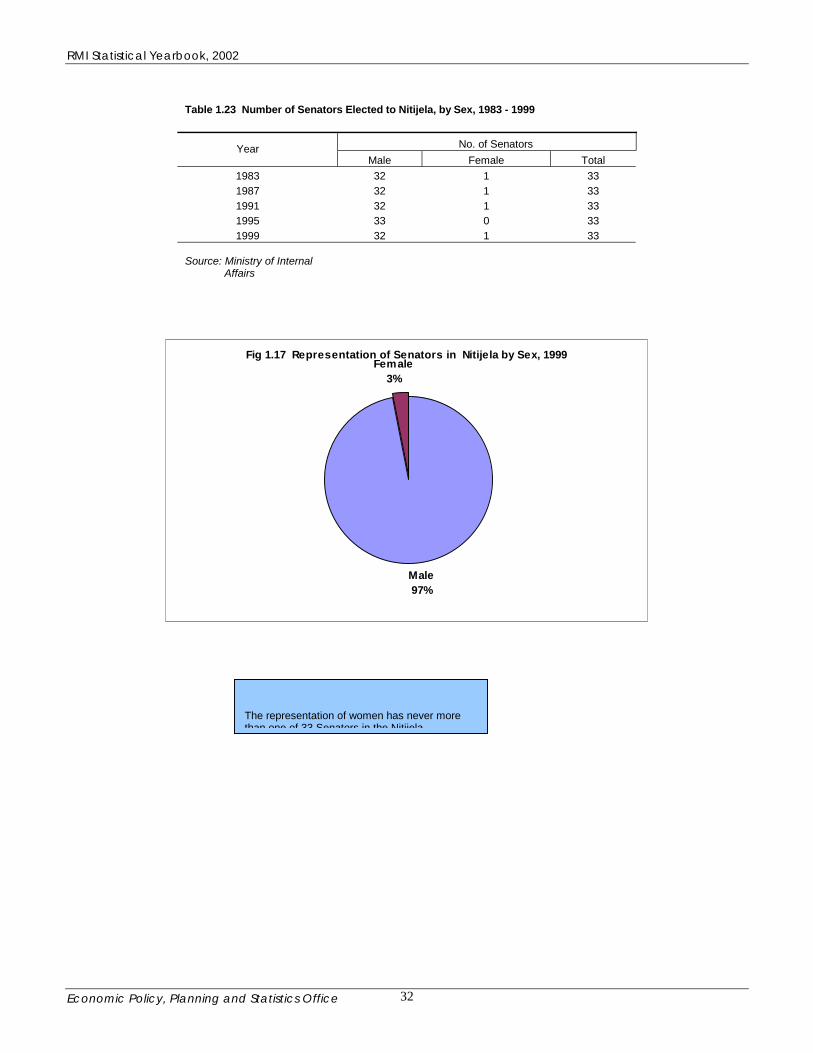
Table 1.23 Number of Senators Elected to Nitijela, by Sex, 1983 - 1999
No. of Senators Year Male Female Total
1983 32 1 33 1987 32 1 33 1991 32 1 33 1995 33 0 33 1999 32 1 33
Source: Ministry of Internal Affairs
Fig 1.17 Representation of Senators in Nitijela by Sex, 1999
Male97%
Female3%
The representation of women has never more than one of 33 Senators in the Nitijela

RMI Statistical Yearbook, 2002
Economic Policy, Planning and Statistics Office 33
Table 1.24 Number of Members on Council of Iroij by Sex, 1983-1999, RMI
Year No. of Council Members Male Female Total
1983 5 6 11 1987 6 5 11 1991 6 5 11 1995 5 6 11 1999 6 5 11
Source: Ministry of Internal Affairs
Fig 1.18 Representation of members in Council of Iroij by Sex, 1999
Female45%
Male55%
Strangely enough, the representation of women in the Council of Iroij, has always been close to the number of men.

RMI Statistical Yearbook, 2002
Economic Policy, Planning and Statistics Office 34
Table 1.25 Elected Council Members in Atoll Councils by Male and Female, 1983 to 1999 in RMI
Number of Council Members by Sex 1987 1991 1995 1999 Atoll Council
Male Female Male Female Male Female Male Female Ailinglaplap 25 0 25 0 22 3 22 3 Ailuk 14 1 13 2 13 2 12 3 Arno 17 0 17 0 17 0 17 0 Aur 15 2 15 2 15 2 16 1 Bikini 15 1 15 1 15 1 14 2 Ebon* 82 1 83 0 83 0 83 0 Enewetak 12 1 12 1 12 1 12 1 Jabat 10 1 9 2 8 3 7 4 Jaluit 15 1 13 3 13 3 13 3 Kwajalein 9 1 8 2 9 1 10 0 Lae 9 2 9 2 9 2 9 2 Lib 10 1 9 2 9 2 9 2 Likiep 4 1 4 1 4 1 4 1 Majuro 13 1 12 2 12 2 13 1 Maloelap 17 0 17 0 16 1 16 1 Mejit 13 3 12 4 10 6 11 5 Mili 9 2 10 1 10 1 9 2 Namdrik 13 0 13 0 13 0 13 0 Namu 10 0 10 0 10 0 10 0 Rongelap 8 1 8 1 8 1 8 1 Ujae 11 1 11 1 10 2 11 1 Utirik 17 0 16 1 16 1 15 2 Wotho 5 1 5 1 4 2 3 3 Wotje 17 1 17 1 17 1 16 2 Total 370 23 363 30 355 38 353 40 Note: Information for the year 1983 is not available. *All Clan Heads of Alaps are Councillors. Source: Ministry of Internal Affairs
The representation of women in elected bodies of the Local Councils has been very low. In Arno, women have never been elected as member to the Council. In most of other Councils as well, not more than two women at a time have ever sat on atoll councils.

RMI Statistical Yearbook, 2002
Economic Policy, Planning and Statistics Office 35
Chapter 2- Health Services
Medical and Health Services Medical and health services in the Marshall Islands are delivered in two distinct settings, hospitals in the urban areas of Majuro and Ebeye and medical dispensaries on the outer islands. Hospitals offer both primary and secondary health care services, and outer island health centers provide very basic health care services to the scattered populations in the outer islands. The Majuro hospital is the main national hospital with a total of 97 beds. It has facilities that provide specialist services in the areas of general medicine, surgery, orthopedics, obstetrics and gynecology, pediatrics, ENT, ophthalmology, and dentistry. The hospital has a qualified radiologist, anesthetist and pathologist who are available to provide back up to the specialists and the diagnostic laboratories. Sometimes the number of beds is not sufficient and temporary beds are placed in hallways to cope up with the increased admissions. The hospital is being extended with financial assistance from the Japanese government. This will include buildings for public health, diagnostic laboratories and administration. Plans are being developed to begin reconstruction of the hospital in fiscal year 2006. The primary health care wing of the Majuro hospital, handles the treatment for tuberculosis, leprosy, diabetes, STDs, immunization, reproductive health including family planning, pediatrics, adolescent health, school health, dental health, health education and oral health. The hospital at Ebeye serves the population of Ebeye, Kwajalein atoll and the surrounding outer islands. There are a total of 43 beds in the hospital. The hospital was newly constructed and opened in the Fall of 2002 with assistance from the Asian Development Bank and the US Department of the Interior. This hospital also has specialist services for treatment in medical, surgical, obstetric/gynecology and pediatric areas. Facilities for orthopedics, ENT and ophthalmology are, however, not available. The diagnostic laboratory facilities are limited because of a lack of equipment and regents. The services of the radiologist and anesthetist are available. In Ebeye, there is an acute shortage of residential accommodation and for housing foreign specialists and nursing staff. This makes healthcare delivery even more difficult for the community. The primary health care wing is responsible for preventive health and curative services in tuberculosis, leprosy, diabetes, STDs, immunization, reproductive health, family planning, pediatrics, school health, health education and oral health. To provide the medical and health care on isolated, scattered and sparsely populated atolls is a challenging task. In the Health Centers, the Health Assistant, is usually a high school graduate with multipurpose training in basic primary health. The facilities available in the outer island health centers are very basic. Currently there are 49 health centers functioning in the outer islands. The government has a target of 60 functional health centers, which is likely to be achieved in October, 2004 with the graduation of 16 health assistants currently undergoing training in Majuro hospital. Most of the health assistants are males whereas culturally women prefer services to be provided to them by women particularly in areas relating to prenatal, deliveries, postnatal care and family planning services.

RMI Statistical Yearbook, 2002
Economic Policy, Planning and Statistics Office 36
The majority of health centers are new or in good condition although six are scheduled for reconstruction. Some of the newly constructed buildings have also have a residence for the health assistant alongside the dispensary. That will help solve the problem of placing health assistants in otherwise isolated places where land rights can become problematic. Solar units are being installed in some of the health centers in order to store vaccines. Delivery of vaccination services and maintaining vaccination programs to the outer islands is a problem because of an over reliance on services from Majuro.
A large portion of the health budget has traditionally been spent to meet expenses for off island medical referrals. On average, one referral costs 19,000 US dollars covering expenditures for transportation, lodging and medical treatment. Often on these trips a member of the family or the hospital accompany the patient. For example, during the years 2001 and 2002, 313 patients were referred to hospitals in Honolulu and Manila involving an expenditure of $5.95 million. This figure accounts for 20-25 percent of the annual health budget. There has been a realization on the part of the government that the improvement of treatment and diagnostic facilities within the country will avoid some of the high referral costs. Over the last couple of years, a number of specialist doctors have been added to the Majuro hospital and diagnostic facilities are getting a boost with the services of the anesthetist and pathologist. This has already resulted in a decline of off island referrals. Plans to purchase more needed equipment like a CT Scanner and other necessary laboratory equipment for various departments will reduce the cost of these referrals even further. Health Status It is difficult to assess the health status of the people of the Marshall Islands due to a lack of adequate and reliable data. Great distances between atolls, cultural factors, communication difficulties and administrative problems constrain the collection and transmission of reliable data. Only a broad assessment can be made on the basis of the mortality estimates the population census. On this basis it can be inferred that there has been a marked improvement in the health status of the people during the past a decade or so. The infant and child mortality rates have been considerably reduced. Infant mortality registered a decline from 63 per thousand live births in 1988 to 37 per thousand live births in 1999. Similarly, the child mortality fell from 93 to 48 in the same period. The crude death rate also witnessed a significant fall from 8.9 in 1988 to 4.9 in 1999. As a result of lower rates of mortality in various age groups, the life expectancy at birth increased from 61.6 years in 1988 to 67.5 years in 1999. Despite these improvements, the infant and child mortality are still on high side with ample scope to bring them down further. Sickness Patterns & Reproductive Services In the RMI, the medical and health services are provided through the government run hospitals and health centers. There is only one private medical practitioner in the entire country. On the basis of the service statistics (though not complete and not very reliable, particularly in case of the statistics from the health centers), a pattern does emerges and it could be said that there is a prevalence of both communicable and non-communicable diseases. The common communicable diseases include gastroenteritis, diarrhoea, amoebiasis, hepatitis, influenza, conjunctivitis, scabies, gonorrhea, syphilis, chickenpox, measles, mumps, whooping cough, leprosy and tuberculosis. The non-communicable diseases include diabetes, heart diseases, cancer, pneumonia and noninfectious gastroenteritis. Some of the diseases may be due to an increase in poor heath habits associated with a more western diet and life style combined with a lack of exercise. The consumption of alcohol and smoking are high, contributing significantly to health problems. Poor housing and crowding makes it easier for the communicable diseases to spread.

RMI Statistical Yearbook, 2002
Economic Policy, Planning and Statistics Office 37
Reproductive health services are available at both the hospitals but the status of prenatal, natal and postnatal services in the outer islands are rudimentary. The deliveries are conducted mostly by the local midwives and in some cases by the Health Assistants. Though Health Assistants are trained in deliveries, most of them are males and culturally women normally prefer other women to assist in births. Although family planning services have been in place since the mid-sixties in the Marshall Islands, it was not possible to find a reliable number of acceptors for various methods of family planning even from the records maintained at the main reproductive health
clinics on Majuro and Ebeye. An NGO, Youth to Youth in Health, provides counseling services for family planning and distributes condoms but this organization also has not kept proper record of the services provided. There is a need to have proper a management information system to assess the quantity and the quality of the reproductive services offered from the Ministry of Health and Youth to Youth in Health. Sexually Transmitted Diseases Sexually transmitted diseases (STDs) and risk of HIV/AIDS has become a serous threat because of the increased mobility of the population the high rate of promiscuity among youth. Facilities for STD tests are available only at the STD clinics at the Majuro and Ebeye hospitals. But in these clinics too, particularly at Ebeye, reagents are in short supply. Chlamydia tests were not carried out regularly because of the lack of reagents. According to the published annual reports of the Bureau of Health Planning and Statistics, Ministry of Health, up to 1989, there were 6 HIV and 2 AIDS cases in the country. One case of HIV was detected in each of the following years 1993, 1994 and 1996 after that two cases were detected in Ebeye during the year 2000-01 and one more case was detected in the year 2001-02 per reports received from the hospital. But the Director of the Primary Health Care confirmed that there were only two cases in last two years and not three. He further explained that out of those two, one was confirmed positive on the second test performed. However, a confirmatory test on the second positive case was yet to be arranged. Since the facility to carry out the confirmatory tests is not available within the RMI, such tests are done in Hawaii. Because of some problem in sending the sample to Hawaii, the sample for the confirmatory test of one HIV positive case could not be sent to Hawaii for over a year. Details on the number of tests on various STDs and the positive test rates by sex and age cases tested in STD clinics at Majuro and Ebeye hospitals may be seen in the tables. On the whole, it has been found that the positive rates are higher for syphilis and gonorrhea at the Ebeye clinic than in Majuro. The results of the test also confirm that the incidence of STDS was comparatively higher for younger ages.
Diabetes Prevalence of diabetes is serous problem in the Marshall Islands and a national program for the prevention and control of the disease has been in operation throughout the country. Under the Nutrition and Diabetes Prevention Program, a number of health education activities are carried out by way of workshops, trainings, focus group meetings and also addressing community gatherings. A number of diabetes related materials has been developed, printed and disseminated. People are also provided information through radio program, radio spots and newspaper advertisements. People are screened for diabetes during community outreach events and they are encouraged to participate in weight loss programs. Simple diagnostic and treatment facilities have also been available at the health centers in the outer islands as well. The prevalence of diabetes is higher in women than among men. The increasing prevalence of diabetes among children is a disturbing factor because of future impacts on the health system.

RMI Statistical Yearbook, 2002
Economic Policy, Planning and Statistics Office 38
Tuberculosis The national program of tuberculosis prevention, treatment and control in the Marshall Islands provides services in case detection, counseling, treatment and follow up visits. The CDC and WHO are providing the required financial and technical assistance to the country and there has been no shortage of medicines. The facilities to diagnose and treat the patients are available in hospitals on Majuro and Ebeye. Patients from outer islands therefore have to stay in Majuro/Ebeye until the treatment program of 9 months is completed. There were 48 active cases of TB in the country at the end of the year 2002. Of which, 34 were under treatment in Majuro and 14 were receiving treatment from the hospital in Ebeye. The TB detection rate is high and this means that the number of active cases remains at a fairly constant level. In absence of any survey, T.B. prevalence rate could not be estimated, but on the basis of active cases under treatment, the TB prevalence rate in 2002 was 86.6 per 100,000 population. Leprosy Despite an active screening and treatment program for leprosy by the division of Public Health, patient compliance remains a problem. Every year quite a significant number of new cases are detected. At the end of 2002, there were 54 cases of leprosy under treatment, 52 in Majuro and 2 at the Ebeye hospital. The leprosy prevalence rate per 100,000 population thus came out to 97.5 in 2002. The actual prevalence rate is decidedly higher than that. Immunization From the immunization database maintained by the public health divisions on Majuro and Ebeye, it is not possible to find complete coverage for children against the vaccine preventable diseases in different areas of the country. The coverage of children in the urban areas is apparently much better than the immunization services in outer islands. However, the immunization report for the year 2002 by the Majuro Public Health Division indicates that out of 1,375 registered children below 2 years of age, only 232 were fully immunized, a coverage of only 17 percent. In Ebeye, out of 944 registered children below 2 years of age, only 375 were given all immunizations, a full coverage of 39.5 percent children. The visiting medical teams from Majuro often carry out immunizations in the outer islands after an interval of 6-9 months. The doses are therefore not followed up per the immunization schedule for each type of vaccine, which in most cases is after 4-6 weeks. In collaboration with the Ministry of Health, the Pacific Islands Health Officers Association conducted an immunization survey in the Marshall Islands in December 2001. The vaccine coverage developed by that survey follows:
• Diphtheria Pertussis-tetanus Vaccine (DPT): The vaccine schedule requires 4 doses of DPT before the age of two. The survey found 54 % of the children with 4 doses, and 82 % with at least 3 doses. Only 2% failed to receive any dose.
• Hepatitis B Vaccine (HepB): This is required to be given in three doses. The survey found that 67 % of children received full coverage. The birth dose, given shortly after birth, was given to 63 % of the newborns.
• Oral Polio Vaccine: Eighty percent of the children received the full three doses. • BCG: A single dose is required and 77 % of the children were immunized against TB. • Measles-Mumps-Rubella (MMR): The first dose of MMR is given at 12 months and second
dose before entry to school entry, but the recommendation for the second MMR is 30 days after the first. The coverage of MMR1 was 80 % and 40% of those two-year children had MMR2. Twenty percent of the children had no protection from the Measles.

RMI Statistical Yearbook, 2002
Economic Policy, Planning and Statistics Office 39
• Haemophilus Influenza Type B (Hib): It was a newly introduced vaccine for the Marshall Islands. 94 % of the target population received the first dose, but only 24 % completed the 3 dose series.
• Overall, 42 % of children received DPT4, OPV3, HepB3, MMR1 and BCG. Suicides The incidence of attempted suicides and completed suicides has been increasing in the country. The problem is more serious in Majuro. Figures from the Majuro and Ebeye hospitals, show the number of attempted suicides and completed suicides increased from 27 and 14 respectively in 2001 to 29 and 27 respectively in the year 2002. Expenditure on Health There are several sources of financing for health services including government tax revenue, Compact funds, US Federal grants, health insurance funds, user charges and funds from other donors for operational expenditures and development projects. The total expenditure on health services by all sources in FY2001-02 was $12,844,884, 12.1% of the total national budget. This computes to an expenditure figure of $227 per capita for health services. As mentioned earlier, almost all facilities for medical and health services are in the public sector and quite a significant portion of the budget has been used for off island referrals, the result being that in real terms the per capita expenditure on health is low.

RMI Statistical Yearbook, 2002
Economic Policy, Planning and Statistics Office 40
Table 2.1 No. of Registered Live Births by Atolls/Islands in RMI in 1991, 1996, 2001 and 2002.
Area 1991 1996 2001 2002 Majuro 791 946 1,026 955 Kwajalein 324 341 334 259 Other Atolls/Islands: Ailinlgaplap 23 40 18 26 Ailuk 4 14 11 7 Arno 18 36 29 13 Aur 9 6 9 3 Ebon 9 3 3 1 Enewetak 4 5 3 6 Jaluit 17 29 35 22 Jabat 0 0 2 2 Kili 5 10 4 10 Lae 1 8 16 6 Lib 2 0 0 5 Likiep 2 5 6 4 Maloelap 12 12 1 2 Mejit 5 0 4 1 Mili 14 16 5 8 Namdrik 13 12 11 12 Namu 7 3 17 1 Ujae 9 8 2 0 Utrik 8 10 0 0 Wotje 5 16 24 12 Wotho 1 2 1 0
Total
1,283 1,522 1,561 1,355
Source: Vital and Health Statistics Division, Ministry of Health
There is a high incidence of under-registration in outer islands and it varies from place to place mainly depending upon the registration facilities.
RMI Statistical Yearbook, 2002
Economic Policy, Planning and Statistics Office 41
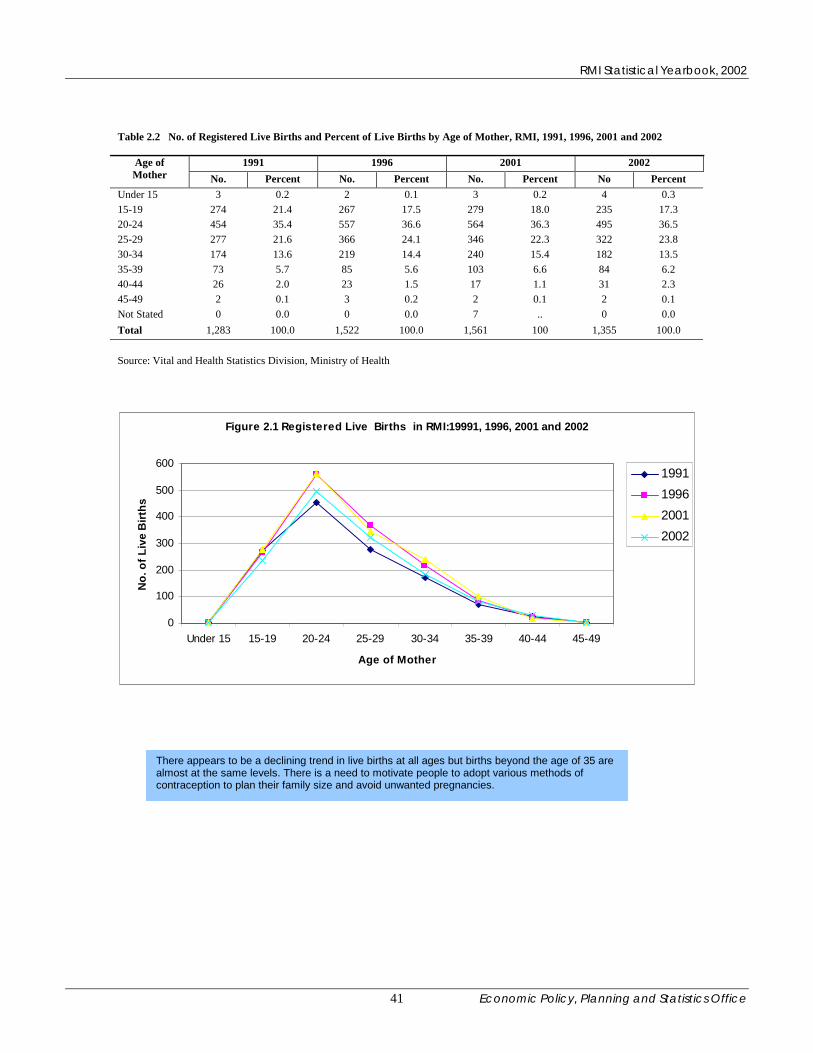
Table 2.2 No. of Registered Live Births and Percent of Live Births by Age of Mother, RMI, 1991, 1996, 2001 and 2002
1991 1996 2001 2002 Age of Mother No. Percent No. Percent No. Percent No Percent
Under 15 3 0.2 2 0.1 3 0.2 4 0.3 15-19 274 21.4 267 17.5 279 18.0 235 17.3 20-24 454 35.4 557 36.6 564 36.3 495 36.5 25-29 277 21.6 366 24.1 346 22.3 322 23.8 30-34 174 13.6 219 14.4 240 15.4 182 13.5 35-39 73 5.7 85 5.6 103 6.6 84 6.2 40-44 26 2.0 23 1.5 17 1.1 31 2.3 45-49 2 0.1 3 0.2 2 0.1 2 0.1 Not Stated 0 0.0 0 0.0 7 .. 0 0.0 Total 1,283 100.0 1,522 100.0 1,561 100 1,355 100.0
Source: Vital and Health Statistics Division, Ministry of Health
There appears to be a declining trend in live births at all ages but births beyond the age of 35 are almost at the same levels. There is a need to motivate people to adopt various methods of contraception to plan their family size and avoid unwanted pregnancies.
Figure 2.1 Registered Live Births in RMI:19991, 1996, 2001 and 2002
0
100
200
300
400
500
600
Under 15 15-19 20-24 25-29 30-34 35-39 40-44 45-49
Age of Mother
No.
of L
ive
Birt
hs
1991199620012002

RMI Statistical Yearbook, 2002
Economic Policy, Planning and Statistics Office 42
Table 2.3 No. of Births Among Teens during 1991, 1996, 2001 and 2002, RMI
Age 1991 1996 2001 2002 13 0 0 1 0 14 3 2 2 4 15 7 12 13 7 16 32 18 20 18 17 58 44 57 45 18 92 95 88 72 19 85 98 101 93
Total Teen Births 277 269 282 239 Total Births 1,283 1,522 1,561 1,355 % to Total Births 21.6 17.6 18.2 17.6 Source: Vital and Health Statistics Division, Ministry of Health
The incidence of pregnancies among adolescents and teens continues to be high. This is not only affecting the health of the mother and child but it is also a primary reason for the high drop out rate for female students.
21.6
17.6 18.2 17.6
0
5
10
15
20
25
Perc
enta
ges
1991 1996 2001 2002
Years
Figure 2.2 Teen Births Percent to Total Births: 1991, 1996, 2001 and 2002
RMI Statistical Yearbook, 2002
Economic Policy, Planning and Statistics Office 43
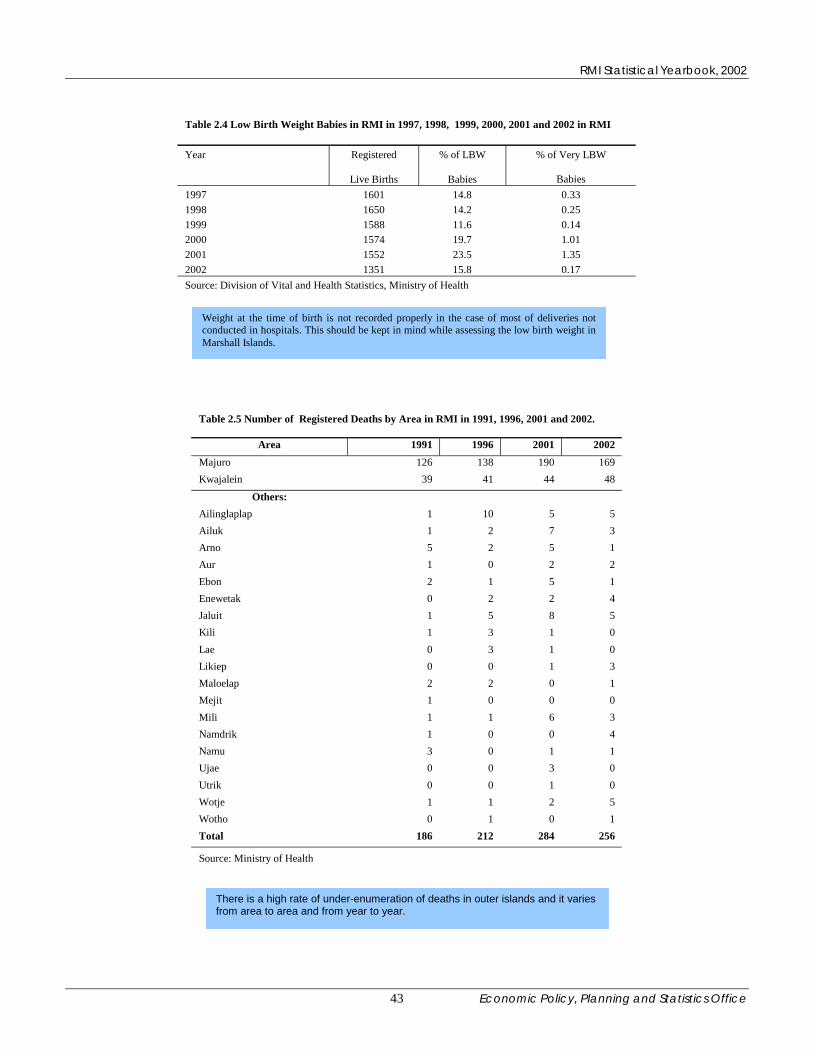
Table 2.4 Low Birth Weight Babies in RMI in 1997, 1998, 1999, 2000, 2001 and 2002 in RMI Year Registered % of LBW % of Very LBW
Live Births Babies
Babies 1997 1601 14.8 0.33 1998 1650 14.2 0.25 1999 1588 11.6 0.14 2000 1574 19.7 1.01 2001 1552 23.5 1.35 2002 1351 15.8 0.17 Source: Division of Vital and Health Statistics, Ministry of Health
Table 2.5 Number of Registered Deaths by Area in RMI in 1991, 1996, 2001 and 2002.
Area 1991 1996 2001 2002
Majuro 126 138 190 169 Kwajalein 39 41 44 48
Others: Ailinglaplap 1 10 5 5 Ailuk 1 2 7 3 Arno 5 2 5 1 Aur 1 0 2 2 Ebon 2 1 5 1 Enewetak 0 2 2 4 Jaluit 1 5 8 5 Kili 1 3 1 0 Lae 0 3 1 0 Likiep 0 0 1 3 Maloelap 2 2 0 1 Mejit 1 0 0 0 Mili 1 1 6 3 Namdrik 1 0 0 4 Namu 3 0 1 1 Ujae 0 0 3 0 Utrik 0 0 1 0 Wotje 1 1 2 5 Wotho 0 1 0 1 Total 186 212 284 256
Source: Ministry of Health
Weight at the time of birth is not recorded properly in the case of most of deliveries notconducted in hospitals. This should be kept in mind while assessing the low birth weight inMarshall Islands.
There is a high rate of under-enumeration of deaths in outer islands and it varies from area to area and from year to year.

RMI Statistical Yearbook, 2002
Economic Policy, Planning and Statistics Office 44
Table 2.6 Number of Registered Infant Deaths by Atolls in RMI during 1991, 1996, 2001 and 2002
Area 1991 1996 2001 2002 Majuro 18 7 27 23 Ebeye 4 2 4 14 Other Atolls / Islands:
Ailinglaplap 0 1 0 0 Ailuk 0 0 2 0 Arno 0 1 4 0 Jaluit 0 0 0 2 Likiep 0 0 1 0 Lae 0 2 0 0 Mili 0 0 2 0 Wotje 1 0 0 0 Total 23 13 40 39
Source: Ministry of Health
Table 2.7 Registered Live Births, Deaths, Infant Deaths, Fetal Deaths, Neo-natal Deaths, Post Neo-natal Deaths, Perinatal Deaths and Maternal Deaths in 1991,1996,2001 and 2002, RMI
Peri Natal Period Live Births Deaths Infant Deaths
Fetal Deaths
Neo-Natal
Deaths
Post Neo-Natal
Deaths Deaths
Maternal Deaths
1991 1,283 186 23 7 2 19 9 0 1996 1,522 212 13 28 4 9 32 0 2001 1,561 284 40 18 29 11 47 0 2002 1,355 256 39 14 26 13 40 1 2002 January 131 33 2 3 2 0 5 0 February 120 18 3 1 2 1 3 0 March 122 20 3 0 3 0 3 0 April 113 11 0 1 0 0 1 0 May 99 15 3 1 3 0 4 0 June 77 17 2 2 1 1 3 1 July 73 21 1 0 0 1 0 0 August 77 24 6 0 3 3 3 0 September 17 16 4 4 3 1 7 0 October 162 24 4 1 4 0 5 0 November 129 25 4 1 1 3 2 0 December 135 32 7 0 4 3 4 0
Source: Vital and Health Statistics Division, Ministry of Health
The recording of infant deaths is far below the number of actual deaths. These figures may not be considered to be reliable.
As is prevalent in most developing countries, the registration of vital events particularly theregistration of infant deaths and maternal deaths is very low. These figures are therefore notreflective of the actual levels.

RMI Statistical Yearbook, 2002
Economic Policy, Planning and Statistics Office 45
Table 2.8 No. of Encounters of Outpatients in Majuro Hospital, by Months, 2001 and 2002 Month 2001 2002 January 2,762 2,136 February 2,091 2,245 March 2,793 2,137 April 2,601 2,179 May 2,307 2,155 June 2,460 2,371 July 2,945 4,584 August 2,098 3,067 September 1,791 3,063 October 2,476 3,357 November 2,130 3,654 December 2,110 2,765 Total 28,564 33,713 Source: Medical Records, Majuro Hospital
Fig 2.3 Encounters of O utpatients in Majuro Hospital, in 2001 and 2002 By Months: Compared
0500
100015002000250030003500400045005000
Month
Janu
ary
Februa
ryMarc
hApri
lMay
June Ju
ly
Augus
t
Septem
ber
Octobe
r
Novem
ber
Decem
ber
No.
of V
isits
2001
2002

RMI Statistical Yearbook, 2002
Economic Policy, Planning and Statistics Office 46
Table 2.9 No. of Admissions in Majuro Hospital, by Months, 2001 and 2002 Month 2001 2002 January 236 319 February 247 304 March 276 308 April 211 318 May 258 304 June 225 290 July 234 360 August 360 386 September 328 364 October 350 376 November 407 435 December 309 371 Total 3,441 4,135 Source: Medical Records, Majuro Hospital
Fig 2.4 Admissions in Majuro Hospital in 2001 and 2002 By Months: Comparedure
050
100150200250300350400450500
Janu
ary
Februa
ryMarc
hApri
lMay
June Ju
ly
Augus
t
Septem
ber
Octobe
r
Novem
ber
Decem
ber
No.
of P
atie
nts
2001
2002
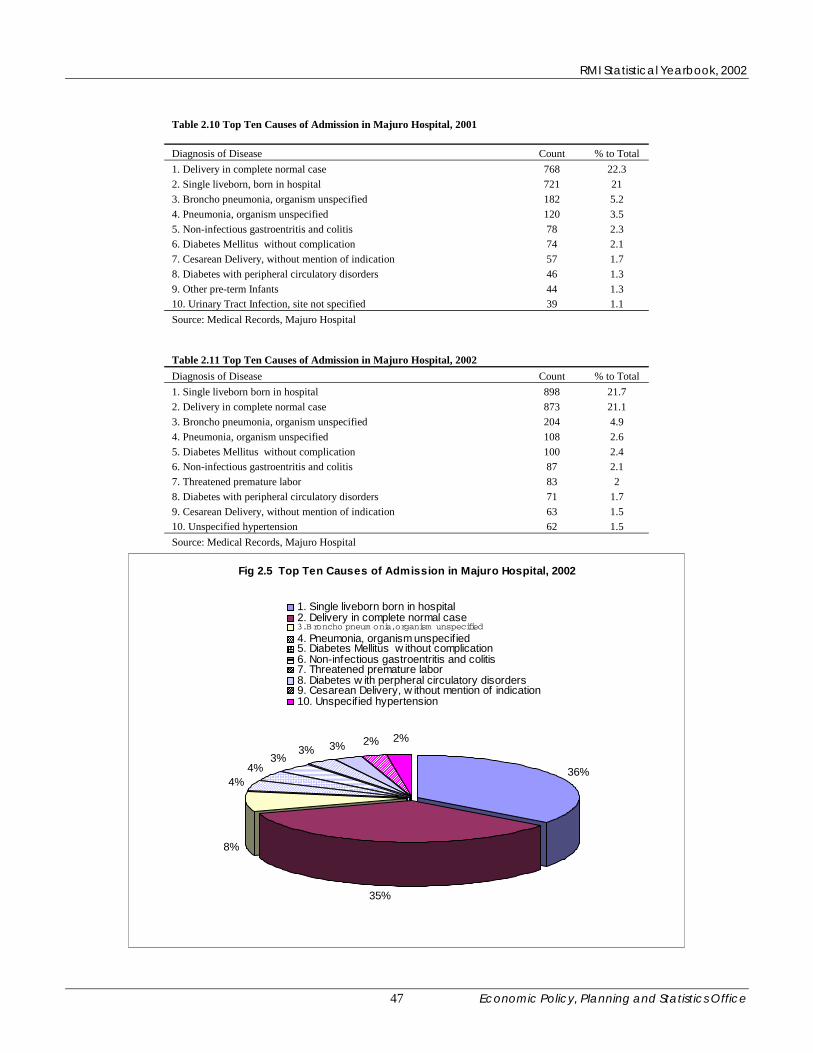
RMI Statistical Yearbook, 2002
Economic Policy, Planning and Statistics Office 47
Table 2.10 Top Ten Causes of Admission in Majuro Hospital, 2001 Diagnosis of Disease Count % to Total 1. Delivery in complete normal case 768 22.3 2. Single liveborn, born in hospital 721 21 3. Broncho pneumonia, organism unspecified 182 5.2 4. Pneumonia, organism unspecified 120 3.5 5. Non-infectious gastroentritis and colitis 78 2.3 6. Diabetes Mellitus without complication 74 2.1 7. Cesarean Delivery, without mention of indication 57 1.7 8. Diabetes with peripheral circulatory disorders 46 1.3 9. Other pre-term Infants 44 1.3 10. Urinary Tract Infection, site not specified 39 1.1 Source: Medical Records, Majuro Hospital
Table 2.11 Top Ten Causes of Admission in Majuro Hospital, 2002 Diagnosis of Disease Count % to Total 1. Single liveborn born in hospital 898 21.7 2. Delivery in complete normal case 873 21.1 3. Broncho pneumonia, organism unspecified 204 4.9 4. Pneumonia, organism unspecified 108 2.6 5. Diabetes Mellitus without complication 100 2.4 6. Non-infectious gastroentritis and colitis 87 2.1 7. Threatened premature labor 83 2 8. Diabetes with peripheral circulatory disorders 71 1.7 9. Cesarean Delivery, without mention of indication 63 1.5 10. Unspecified hypertension 62 1.5 Source: Medical Records, Majuro Hospital
���������������������������������������������������������������������������������������������������������������������������������������������������
������������������������������������������������������������������������������������
������������������������������������������������������������������������������������������������������������������������������������������������������������������������������������������������������������������������������������������������������
��������������������������������������������������������������������������������������������������������������������������������������������������������������������
������������������������������������������������������������������������������������������������������������������������������������������������������������������������������������������������������������������������������������������������������������������������������������������������������������
���������������������������������������������������������������������������������������������������������������������������������������������������������
�������������������������������������������������������������������������������������������������������������������������������������������������������������������������������������������������������������������������������������������������������������������������������������������������������
���������������������������������������������������������������������������������������������������������������������������������������������������������������������������������
��������������������������������������������������������������������������������������������������������������������������������������������������������������������������������������������������������������������������������������������������������������������������������������������������������������������������������
��������������������������������������������������������������������������������������������������������������������������������
Fig 2.5 Top Ten Causes of Admission in Majuro Hospital, 2002
36%
35%
8%
4%4%
3%3% 3% 2% 2%
1. Single liveborn born in hospital2. Delivery in complete normal case3. B roncho pneum onia, organism unspecified
������ 4. Pneumonia, organism unspecif ied���
5. Diabetes Mellitus w ithout complication���6. Non-infectious gastroentritis and colitis
������ 7. Threatened premature labor
8. Diabetes w ith perpheral circulatory disorders���9. Cesarean Delivery, w ithout mention of indication10. Unspecif ied hypertension
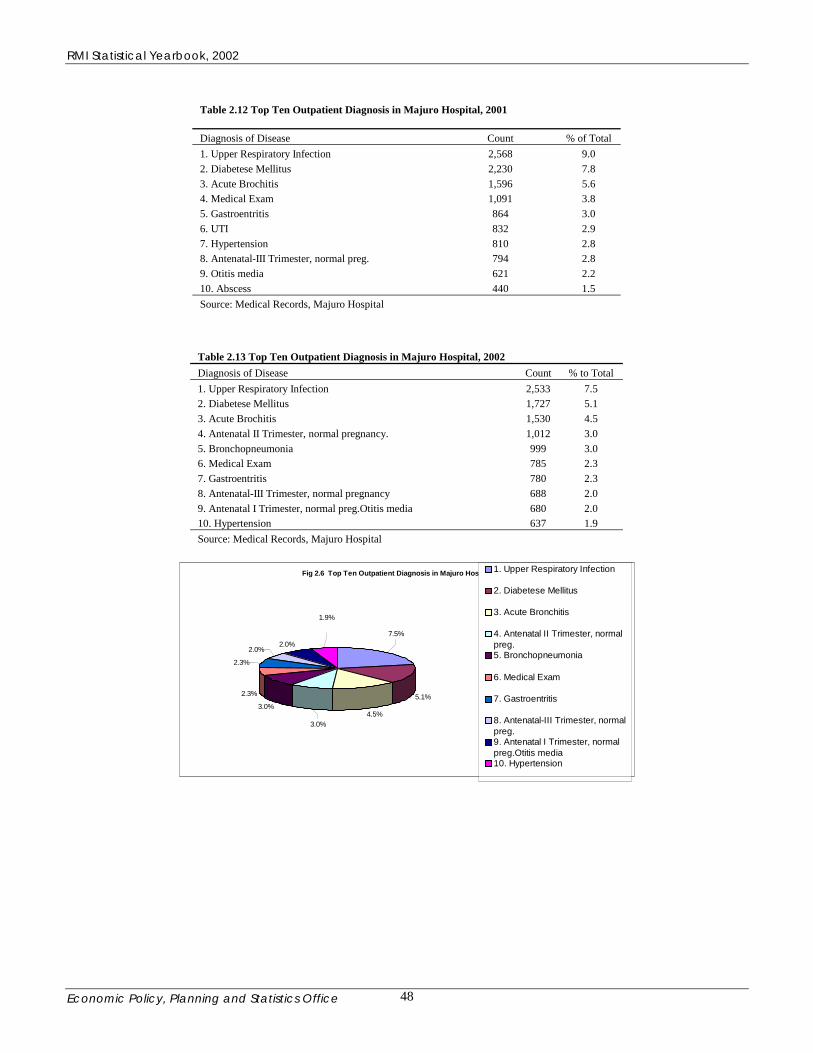
RMI Statistical Yearbook, 2002
Economic Policy, Planning and Statistics Office 48
Table 2.12 Top Ten Outpatient Diagnosis in Majuro Hospital, 2001 Diagnosis of Disease Count % of Total 1. Upper Respiratory Infection 2,568 9.0 2. Diabetese Mellitus 2,230 7.8 3. Acute Brochitis 1,596 5.6 4. Medical Exam 1,091 3.8 5. Gastroentritis 864 3.0 6. UTI 832 2.9 7. Hypertension 810 2.8 8. Antenatal-III Trimester, normal preg. 794 2.8 9. Otitis media 621 2.2 10. Abscess 440 1.5 Source: Medical Records, Majuro Hospital
Table 2.13 Top Ten Outpatient Diagnosis in Majuro Hospital, 2002 Diagnosis of Disease Count % to Total 1. Upper Respiratory Infection 2,533 7.5 2. Diabetese Mellitus 1,727 5.1 3. Acute Brochitis 1,530 4.5 4. Antenatal II Trimester, normal pregnancy. 1,012 3.0 5. Bronchopneumonia 999 3.0 6. Medical Exam 785 2.3 7. Gastroentritis 780 2.3 8. Antenatal-III Trimester, normal pregnancy 688 2.0 9. Antenatal I Trimester, normal preg.Otitis media 680 2.0 10. Hypertension 637 1.9 Source: Medical Records, Majuro Hospital
Fig 2.6 Top Ten Outpatient Diagnosis in Majuro Hospital, 2002
7.5%
1.9%
5.1%
4.5%3.0%
3.0%
2.3%
2.3%
2.0%2.0%
1. Upper Respiratory Infection
2. Diabetese Mellitus
3. Acute Bronchitis
4. Antenatal II Trimester, normalpreg.5. Bronchopneumonia
6. Medical Exam
7. Gastroentritis
8. Antenatal-III Trimester, normalpreg.9. Antenatal I Trimester, normalpreg.Otitis media10. Hypertension

RMI Statistical Yearbook, 2002
Economic Policy, Planning and Statistics Office 49
Table 2.14 Outpatients in Ebeye Hospital by Age and Sex in FY2001 and FY 2002 in Ebeye Hospital FY2001 FY2002 Age Male Female Total Male Female Total 0-1 482 367 849 513 683 1,196 1-4 711 685 1,396 966 918 1,884 5-12 577 566 1,143 727 703 1,430 13-19 414 605 1,019 544 676 1,220 20-24 272 546 818 290 538 828 25-44 818 1,140 1,958 823 1,254 2,077 45-64 360 442 802 420 564 984 65+ 70 73 143 97 129 226 Total 3,704 4,434 8,138 4,380 5,465 9,845 Source: Medical Records, Ebeye Hospital
Fig 2.7 Number of Outpatients by Age in Ebeye Hospital:FY2001 and FY2002
0
500
1,000
1,500
2,000
2,500
0-1 1-4 5-12 13-19 20-24 25-44 45-64 65+
Age Groups
Num
ber o
f Out
patie
nts
FY2001 FY2002
Y

RMI Statistical Yearbook, 2002
Economic Policy, Planning and Statistics Office 50
Table 2.15 Classification of Admitted Patients by Age & Sex-Ebeye Hospital FY2001 & FY2002 FY2001 FY2002 Age Male Female Total Male Female Total 0-1 239 188 427 238 198 436 1-4 98 75 173 80 75 155 5-12 48 32 80 37 35 72 13-19 35 119 154 40 128 168 20-24 14 163 177 25 183 208 25-44 78 281 359 67 271 338 45-64 56 81 137 39 104 143 65+ 22 31 53 15 17 32 Total 590 970 1,560 541 1,011 1,552 Source: Medical Records, Ebeye Hospital
Table 2.16 Condition on Discharge
Condition FY2001 FY2002 Fully recovered 137 0 Fair 35 7 Improved 1347 1483 Not Improved 8 12 Dead 28 47 Stable 5 3 Total 1560 1552 Average Stay in Hospital (Days) 5.0 4.2 Source: Medical Records, Ebeye Hospital
In Ebeye Hospital, the number of inpatients remained almost at the same level during FY2001 and FY2002.

RMI Statistical Yearbook, 2002
Economic Policy, Planning and Statistics Office 51
Table 2.17 Top Ten Reasons for Visiting OPD in Ebeye Hospital in FY2002 Reasons Encounters Percentage Respiratory Infections 4,310 23.6 Public Health Clinics 3,563 19.5 Dental Clinic 2,526 13.8 Prenatal Clinic 1,991 10.9 HEENT 1,412 7.7 Skin Problems 1,167 6.4 Various Infections 1,130 6.2 Gastro-intestinal Problems 1,125 6.1 Musculoskeletal 881 4.8 Others 140 1.0 Total 18,240 100.0 Source: Medical Records, Ebeye Hospital
������������������������������������������������������������������������������������������������������������������������������
���������������������������������������������������������������
���������������������������������������������������������������������������������������������������������������������������������������������������������������������������������������������������������������������������������������������������������������������������������������������
�����������������������������������������������������������������������������������������������������������������������������������������������������������������������������������
��������������������������������
�����������������������������������������������������������������������������������������������������������������������������������������������������������������������������������������������������������������������������������������������������������������������������������
������������������������������������������������������������������������������������������������������������������������������������������������������������������������������������������
Fig 2.8 Top Ten Reasons Visiting Out Patients Department in Ebeye Hospital:FY2002
23%
20%
14%11%
8%
6%
6%6% 5% 1%
Respiratory Infections Public Health Clinics Dental ClinicPrenatal Clinic
����HEENT Skin Problems���
Various Infections Gastro-intestinal Problems���
MusculoskeletalOthers

RMI Statistical Yearbook, 2002
Economic Policy, Planning and Statistics Office 52
Table 2.18 Diabetes Related Complications and Surgical Procedures Over Years in RMI Type of Procedure 1999 2000 2001 2002 Gangrene 54 61 13 51 Below Knee Amputation 15 8 6 14 Above Knee Amputation 5 4 1 2 Cataracts 0 1 0 1 Total 73 74 20 68 Source: Medical Records, Majuro Hospital
Figure 2.9 Diabidity Related Complications and surgical Procedures, Majuro Hospital
010203040506070
1999 2000 2001 2002
Years
Num
ber o
f Pr
oced
ures
G angrene B elow Knee A m putation A bove Knee A m putation C ataracts
Table 2.19 Hospitalization for Diabetese Related Morbidity Over Years in RMI Type of Diabidity Related Morbidity No. of Cases 2000 2001 2002 Diabetics with Ketoacidosis 10 6 1 Diabetics with Hypermolar 5 3 1 Diabetics with Other Coma 1 0 0 Diabetics with Renal Manifestation 3 6 8 Diabetics with Ophthalmic Manifestation 3 1 0 Diabetics with Neurological Manifestation 5 5 3 Diabetics with Peripheral Circulatory Disorders 96 83 92 Diabetics with Other Specified Manifestations 6 8 6 Diabetics with Unspecified Complications 0 0 10 Amputations due to Diabetes 0 0 0 Total 129 112 121 Source: Medical Records, Majuro Hospital
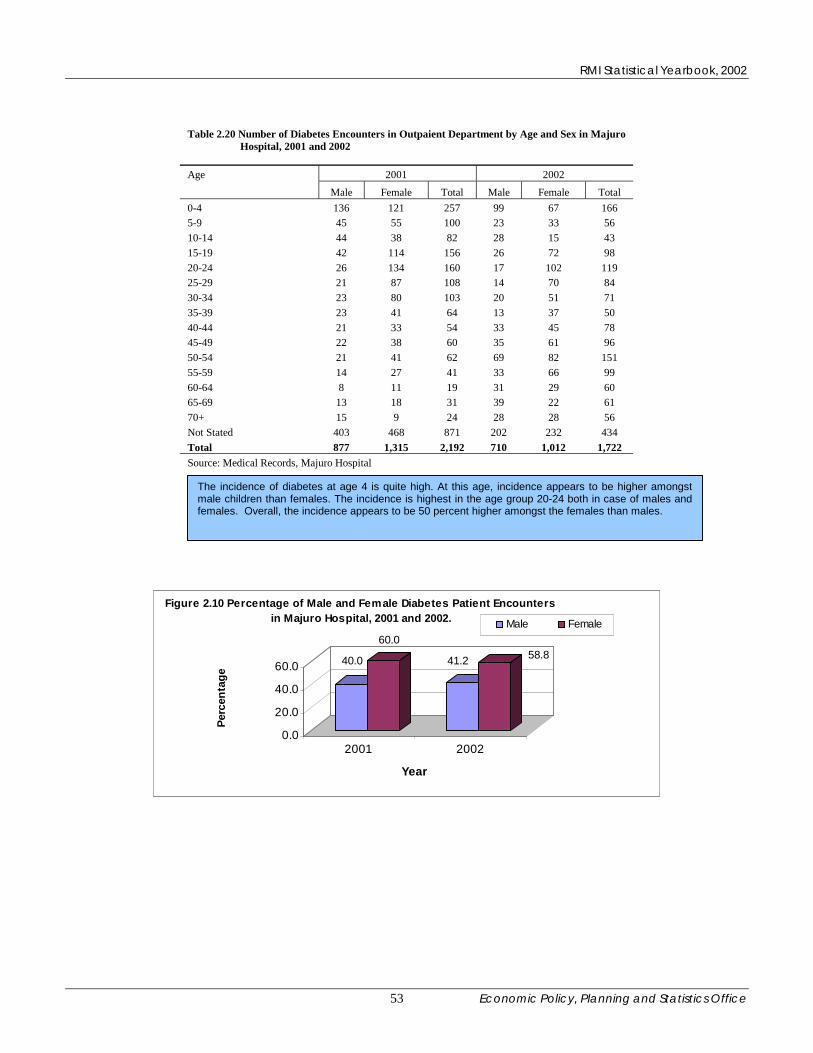
RMI Statistical Yearbook, 2002
Economic Policy, Planning and Statistics Office 53
Table 2.20 Number of Diabetes Encounters in Outpaient Department by Age and Sex in Majuro Hospital, 2001 and 2002
Age 2001 2002
Male Female Total Male Female Total 0-4 136 121 257 99 67 166 5-9 45 55 100 23 33 56 10-14 44 38 82 28 15 43 15-19 42 114 156 26 72 98 20-24 26 134 160 17 102 119 25-29 21 87 108 14 70 84 30-34 23 80 103 20 51 71 35-39 23 41 64 13 37 50 40-44 21 33 54 33 45 78 45-49 22 38 60 35 61 96 50-54 21 41 62 69 82 151 55-59 14 27 41 33 66 99 60-64 8 11 19 31 29 60 65-69 13 18 31 39 22 61 70+ 15 9 24 28 28 56 Not Stated 403 468 871 202 232 434 Total 877 1,315 2,192 710 1,012 1,722 Source: Medical Records, Majuro Hospital
40.0
60.0
41.2 58.8
0.0
20.0
40.0
60.0
Perc
enta
ge
2001 2002
Year
Figure 2.10 Percentage of Male and Female Diabetes Patient Encounters in Majuro Hospital, 2001 and 2002. Male Female
The incidence of diabetes at age 4 is quite high. At this age, incidence appears to be higher amongstmale children than females. The incidence is highest in the age group 20-24 both in case of males andfemales. Overall, the incidence appears to be 50 percent higher amongst the females than males.

RMI Statistical Yearbook, 2002
Economic Policy, Planning and Statistics Office 54
Table 2.21 Number of Patients Admitted due to Diabetes by Age and Sex in Majuro Hospital, 2001 and 2002 Age 2001 2002 Male Female Total Male Female Total 0-4 3 4 7 4 1 5 5-9 3 1 4 2 0 2 10-14 3 0 3 0 1 1 15-19 1 14 15 0 6 6 20-24 0 11 11 1 8 9 25-29 0 11 11 0 15 15 30-34 0 8 8 1 9 10 35-39 2 1 3 1 8 9 40-44 0 1 1 4 7 11 45-49 1 4 5 9 9 18 50-54 2 2 4 11 6 17 55-59 0 1 1 7 8 15 60-64 1 1 2 5 4 9 65-69 1 2 3 5 6 11 70+ 1 4 5 10 5 15 Not Stated 25 24 49 25 15 40 Total 43 89 132 85 108 193 Source: Medical Records, Majuro Hospital
Fig 2.11 Number of Indoor Diabetes by Age and Sex in Majuro Hospital, 2001 and 2002
02468
10121416
0-4
5-9
10-1
4
15-1
9
20-2
4
25-2
9
30-3
4
35-3
9
40-4
4
45-4
9
50-5
4
55-5
9
60-6
4
65-6
9
70+
Age Groups
No.
of P
atie
nts
Males 2001
Females 2001
Males 2002
Females 2002
The number of female patients admitted in Majuro Hospital was much higher than males. The number of femalepatients admitted was higher than male patients by 107.0 and 27.1 percent in the years 2001 and 2002, respectively.The number of male children admitted for diabetes was higher than female children. The incidence of disease washigher amongst females between the ages 25-34.

RMI Statistical Yearbook, 2002
Economic Policy, Planning and Statistics Office 55
Table 2.22 Classification of Diabetic Cases, FY2002 by age and sex Ebeye Hospital Clinic Attendence Age Male Female Total Percent <25 0 1 1 0.1 25-35 7 43 50 2.5 36-45 55 238 293 14.8 46-49 40 258 298 15.0 50-55 103 391 494 24.9 56+ 187 658 845 42.7 Total 392 1,589 1,981 100.0 Source: Ebeye Hospital Annual Report 2002
Fig 2.12 Classification in different Age Groups in Ebeye FY2002
0.1
42.7
24.9
15.014.8
2.50.0
10.0
20.0
30.0
40.0
50.0
<25 25-35 36-45 46-49 50-55 56+
age group
perc
enta
ge o
f Dai
bete
s
Table 2.23 Classification of Diabetics by FBS.200 MG/dl by Month in 2002-03(June to May) in Ebeye
Month Number of FBS*>200 MG/dl Encounters Number Percent June,2002 194 90 46.4 July 286 142 49.7 August 214 94 43.9 September 138 63 45.7 October 228 101 44.3 November 154 68 44.2 December 207 104 50.2 January, 2003 169 76 45.0 February 169 73 43.2 March 154 71 46.1 April 209 97 46.4 May 174 86 49.4 Total 2,296 1,065 46.3 * FBS means Fasting Blood Sugar Source: Coordinator Communicable Diseases, Ebeye Hospital

RMI Statistical Yearbook, 2002
Economic Policy, Planning and Statistics Office 56
Table 2.24 Yearwise Position of T.B Cases Detected, lost to Treatment, Completed Treatment, Died and Active Cases at the end of year in Majuro and Outer Islands, 1998-2002
Year Cases New Cases Lost Cases Cases Cases Active
at the Cases to
treat- Migrated died completed Cases beginning Detected ment Out treatment at the end of year 1998 46 .. 1 0 0 18 28 1999 28 24 0 0 0 23 29 2000 29 32 0 0 0 28 33 2001 33 31 0 0 0 27 37 2002 37 14 0 0 0 17 34 Source: Coordinator TB and Leprosy,Majuro Hospital
28 29 3337 34
0
10
20
30
40
No.
of C
ases
1998 1999 2000 2001 2002
Years
Fig 2. 13 Number of Active Cases of TB in Majuro and Outer Islands, 1998-2002
Table 2.25 Yearwise Position of T.B Cases Detected, lost to Treatment, Completed Treatment, Died, Active Cases at the end of year in Ebeye, FY2001 and FY2002 Year Cases New Cases Lost Cases Cases cases Active at the Cases to Treat- Migrated died completed Cases beginning Detected ment Out treatment at the end of year FY2001 .. 14 2 1 1 4 6 FY2002 6 141 15 7 1 110 14 Record of previous years was not available. Data of FY2001 are of 6 months only. Source: Coordinator TB and Leprosy, Ebeye Hospital
6
14
0
5
10
15
No.
of C
ases
FY2001 FY2002
Years
Fig 2.14 Number of Active Cases of TB in Ebeye in FY2001 - FY2002

RMI Statistical Yearbook, 2002
Economic Policy, Planning and Statistics Office 57
Table 2.26 Yearwise Position of Leprosy Cases Detected, lost to Treatment, Completed Treatment, Died and Active Cases at the end of year in Outer Islands and Majuro, 1998-2002 Cases New Cases Lost Cases Cases Cases Active Year at the Cases to Treat- Migrated died completed Cases beginning Detected ment Out treatment at the end of year 1998 55 .. 0 0 0 21 34 1999 34 71 0 0 0 26 79 2000 79 0 0 0 0 73 6 2001 6 47 0 0 0 17 36 2002 36 66 0 0 0 50 52 Source: Coordinator TB and Leprosy, Majuro Hospital
34
79
6
36
52
01020304050607080
No.
of C
ases
1998 1999 2000 2001 2002
Years
Fig 2.15 Number of Active Cases of Leprosy in Majuro and Outer Islands, 1998-2002
Table 2.29 Yearwise Position of Leprosy Cases Detected, lost to Treatment, Completed Treatment, Died, Active Cases at the end of year in Ebeye, FY2001 and FY2002. Cases New Cases Lost Cases Cases cases Active at the Cases to Treat- Migrated died completed Cases beginning Detected ment Out treatment at the end of year
0 1 0 0 0 0 1 1 3 0 0 0 1 2
Note: Record of previous years not available Source: Coodinator TB and Leprosy, Ebeye Hospital
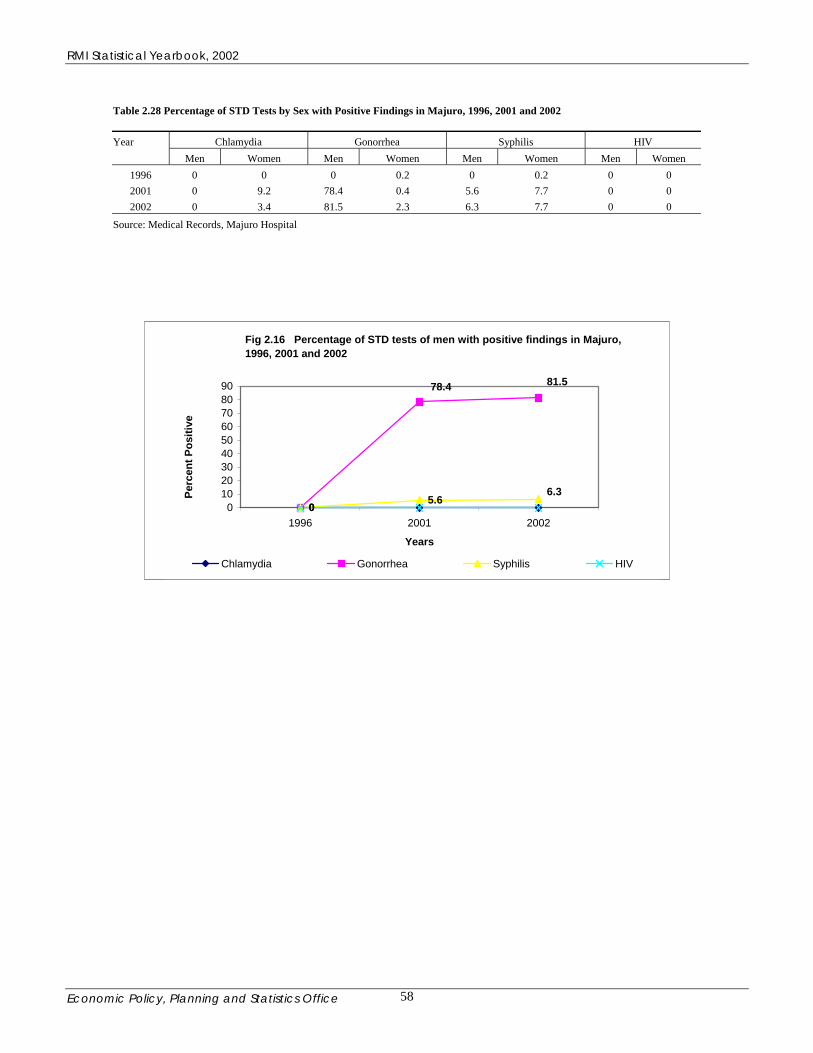
RMI Statistical Yearbook, 2002
Economic Policy, Planning and Statistics Office 58
Table 2.28 Percentage of STD Tests by Sex with Positive Findings in Majuro, 1996, 2001 and 2002 Year Chlamydia Gonorrhea Syphilis HIV Men Women Men Women Men Women Men Women
1996 0 0 0 0.2 0 0.2 0 0 2001 0 9.2 78.4 0.4 5.6 7.7 0 0 2002 0 3.4 81.5 2.3 6.3 7.7 0 0
Source: Medical Records, Majuro Hospital
Fig 2.16 Percentage of STD tests of men with positive findings in Majuro, 1996, 2001 and 2002
00
78.4 81.5
5.66.3
0102030405060708090
1996 2001 2002
Years
Perc
ent P
ositi
ve
Chlamydia Gonorrhea Syphilis HIV

RMI Statistical Yearbook, 2002
Economic Policy, Planning and Statistics Office 59
Table 2.29 Women tested for Gonorrhea and Found Positive in 1996, 2001 and 2002 in Majuro
1996 2001 2002 Age No.
Tested No.
Positive Percent Positive
No. Tested
No. Positive
Percent Positive
No. Tested
No. Positive
Percent Positive
<15 0 0 0.0 0 0 0.0 22 2 9.1 15-19 116 0 0.0 98 1 1.0 206 7 3.4 20-24 272 0 0.0 173 1 0.6 396 9 2.3 25-29 159 0 0.0 98 0 0.0 242 3 1.2 30-34 68 1 1.5 80 0 0.0 129 4 3.1 35-39 32 0 0.0 18 0 0.0 61 0 0.0 40-44 4 0 0.0 10 0 0.0 14 0 0.0 45-49 1 0 0.0 1 0 0.0 2 0 0.0 50+ 0 0 0.0 0 0 0.0 2 0 0.0 Total 652 1 0.2 478 2 0.4 1,074 25 2.3
Source: Medical Record, Majuro Hospital
Table 2.28 Women tested for Gonorrhea and Found Positive in in Ebeye, FY 2001 and FY2002
FY2001* FY2002 Age No.
Tested No.
Positive Percent Positive
No. Tested
No. Positive
Percent Positive
<15 0 0 0.0 15-19 3 0 0.0 20-24 5 1 20.0 25-29 2 1 50.0 30-34 1 0 0.0 35-39 1 0 0.0 40-44 0 0 0.0 45-49 0 0 0.0 50+ 2 0 0.0 Total 14 2 14.3
* Information was not available. Source: Administrator, Ebeye Hospital
Fig 2.17 Percent Positive Amongst Women Tested for Gonorrhea in 2002:Majuro and Ebeye
0.0
20.0
40.0
60.0
<15 15-19 20-24 25-29 30-34 35-39 40-44 45-49 50+
Ages of Women Tested for Gonorrhea
Perc
ent P
ositi
ve
In MajuroIn Ebeye

RMI Statistical Yearbook, 2002
Economic Policy, Planning and Statistics Office 60
Table 2.31 No. of Men Tested for Gonorrhea and Found Positive by Age in Majuro, 1996, 2001 and 2002.
1996 2001 2002 Age
No. Tested
No. Positive
Percent Positive
No. Tested
No. Positive
Percent Positive
No. Tested
No. Positive
Percent Positive
<15 0 0 0.0 1 1 100.0 2 2 100.0 15-19 5 0 0.0 17 13 76.4 7 5 71.1 20-24 2 0 0.0 11 8 72.7 8 8 100.0 25-29 1 0 0.0 2 2 100.0 4 3 75.0 30-34 0 0 1.5 3 2 66.6 6 4 66.6 35-39 1 0 0.0 3 3 100.0 0 0 0.0 40-44 0 0 0.0 0 0 0.0 0 0 0.0 45-49 0 0 0.0 0 0 0.0 0 0 0.0 50+ 0 0 0.0 0 0 0.0 0 0 0.0 Total 9 0 0.0 37 29 78.4 27 22 81.5
Source: Medical Record, Majuro Hospital
Table 2.32 No of Men Tested for Gonorrhea and Found Positive by Age in Ebeye, FY2001 & FY2002.
FY2001* FY2002 Age No.
Tested No.
Positive Percent Positive
No. Tested
No. Positive
Percent Positive
<15 0 0 0.0 15-19 6 1 16.7 20-24 4 0 0.0 25-29 2 2 100.0 30-34 1 1 100.0 35-39 0 0 0.0 40-44 1 0 0.0 45-49 0 0 0.0 50+ 0 0 0.0 Total 14 4 28.6
* Information was not available Source: Administrator, Ebeye Hosdpital
Fig 2.18 Percent Postive Amongst Men Tested for Gonorrhea in 2002:Majuro and Ebeye
0.0
20.0
40.0
60.0
80.0
100.0
120.0
<15 15-19 20-24 25-29 30-34 35-39 40-44 45-49 50+
Ages of Men Tested for Gonorrhea
Perc
ent P
ositi
ve
In Majuro
In Ebeye

RMI Statistical Yearbook, 2002
Economic Policy, Planning and Statistics Office 61
Table 2.33 Women Tested for Syphilis and Found Positive in 1996, 2001 and 2001 by Age in Majuro
1996 2001 2002
Age No. Tested
No. Positive
Percent Positive
No. Tested
No. Positive
Percent Positive
No. Tested
No. Positive
Percent Positive
<15 52 1 1.9 90 2 2.2 272 25 9.2 15-19 335 1 0.3 380 42 11.1 827 74 8.9 20-24 386 1 0.3 309 41 13.3 799 98 12.3 25-29 255 0 0.0 191 12 6.3 541 37 6.8 30-34 176 0 0.0 107 1 0.9 404 31 7.7 35-39 105 0 0.0 93 3 3.2 300 15 5.0 40-44 54 0 0.0 57 1 1.8 266 4 1.5 45-49 41 0 0.0 51 0 0.0 158 2 1.3 50+ 24 0 0.0 55 0 0.0 197 2 1.0 Total 1,428 3 0.2 1,333 102 7.7 3,724 288 7.7
Source: Medical Record, Majuro Hospital Table 2.34 Women Tested for Syphilis and Found Positive in Ebeye, FY01 & FY02
FY2001* FY2002
No. Tested
No. Positive
Percent Positive
No. Tested
No. Positive
Percent Positive
<15 5 0 0.0 21 6 28.5 15-19 28 5 17.9 114 19 16.7 20-24 34 8 23.5 150 27 18.0 25-29 50 9 18.0 85 3 3.5 30-34 40 2 5.0 50 2 4.0 35-39 24 1 4.2 40 2 5.0 40-44 12 0 0.0 15 0 0.0 45-49 3 0 0.0 10 0 0.0 50+ 7 0 0.0 21 1 4.8
Total 203 25 12.3 506 60 11.9
* Information is incomplete Source: Administrator, Ebeye Hospital
Fig 2.19 Percent Positive Amongst Women Tested for Syphilis in 2002 : Majuro and Ebeye
0.05.0
10.015.020.025.030.0
1
Ages of Women Tested for Syphilis
Perc
ent P
ositi
ve
Ebeye Majuro

RMI Statistical Yearbook, 2002
Economic Policy, Planning and Statistics Office 62
Table 2.35 MenTested for Syphilis and Found Positive in 1996, 2001 and 2002 by Age in Majuro
1996 2001 2002
Age No. Tested No. Positive Percent Postive
No. Tested No. Positive Percent Postive
No. Tested No. Positive Percent Postive
<15 29 0 0.0 44 0 0.0 111 9 8.1 15-19 151 0 0.0 256 8 3.1 281 17 6.0 20-24 89 0 0.0 89 10 11.2 165 16 15.8 25-29 56 0 0.0 38 2 5.3 89 5 5.6 30-34 39 0 0.0 20 3 15.0 82 5 6.1 35-39 24 0 0.0 20 3 15.0 56 2 3.6 40-44 17 0 0.0 15 1 6.7 37 1 2.7 45-49 11 0 0.0 8 1 12.5 223 0 0.0 50+ 23 0 0.0 12 0 0.0 43 1 2.3 Total 439 0 0.0 502 28 5.6 887 56 6.3
Source: Medical Record, Majuro Hospital
Table 2.36 Men Tested for Syphilis and Found Positive in Ebeye, FY 2001 & FY2002
FY2001* FY2002 Age No. Tested No. Positive Percent
Postive No. Tested No. Positive Percent
Postive <15 0 0 0.0 14 6 42.9 15-19 5 0 37 5 13.5 20-24 18 3 0.0 57 8 14.0 25-29 30 2 6.7 33 8 24.2 30-34 20 0 0.0 24 0 0.0 35-39 9 0 0.0 21 0 0.0 40-44 2 0 0.0 11 0 0.0 45-49 3 1 33.3 9 0 0.0 50+ 4 0 0.0 11 0 0.0 Total 91 6 6.6 217 27 12.4
* Information is incomplete. Source: Administrator, Ebeye Hospital
Fig 2.20 Percent Positive Amongst Men Tested for Syphilis in 2002: Majuro and Ebeye
0.010.020.030.040.050.0
<15 15-19 20-24 25-29 30-34 35-39 40-44 45-49 50+Ages of Men Tested for Syphilis
Perc
ent P
ositi
ve
Cases at Majuro Cases at Ebeye
Percent Positive amongst young men, particularly in adolescents, was significantly high in the year 2001-02 in Majuro.
Percent Positive was higher amongst the younger ages tested at Ebeye.

RMI Statistical Yearbook, 2002
Economic Policy, Planning and Statistics Office 63
Table 2.37 No. of Men Tested for Chlamydia and Found Positive by Age in1996, 2001 and 2002 in Majuro
1996 2001 2002 Age
No. Tested No. Positive Percent Positive
No. Tested No. Positive Percent Positive
No. Tested No. Positive Percent Positive
<15 0 0 0.0 1 1 100.0 0 0 0.0 15-19 5 0 0.0 17 13 76.4 1 0 0.0 20-24 2 0 0.0 11 8 72.7 0 0 0.0 25-29 1 0 0.0 2 2 100.0 0 0 0.0 30-34 0 0 0.0 3 2 66.6 1 0 0.0 35-39 1 0 0.0 3 3 100.0 0 0 0.0 40-44 0 0 0.0 0 0 0.0 0 0 0.0 45-49 0 0 0.0 0 0 0.0 0 0 0.0 50+ 0 0 0.0 0 0 0.0 0 0 0.0 Total 9 0 0.0 37 29 78.4 2 0 0.0
Source: Medical Record, Majuro Hospital
Table 2.38 No. of Women Tested for Chlamydia and Found Positive in1996, 2001 and 2002 by Age in Majuro Age 1996* 2001 2002 No. Tested No. Positive Percent
Positive No. Tested No. Positive Percent
Positive No. Tested No. Positive Percent
Positive
<15 2 0 0.0 4 1 25.0 15-19 148 19 12.8 130 4 3.1 20-24 211 23 10.9 270 11 4.1 25-29 127 9 7.0 157 5 3.2 30-34 70 4 5.7 67 0 0.0 35-39 33 0 0.0 38 2 5.3 40-44 6 0 0.0 6 0 0.0 45-49 2 0 0.0 1 0 0.0 50+ 0 0 0.0 0 0 0.0 Total 599 55 9.2 673 23 3.4 * No test done in 1996 Source: Medical Record, Majuro Hospital
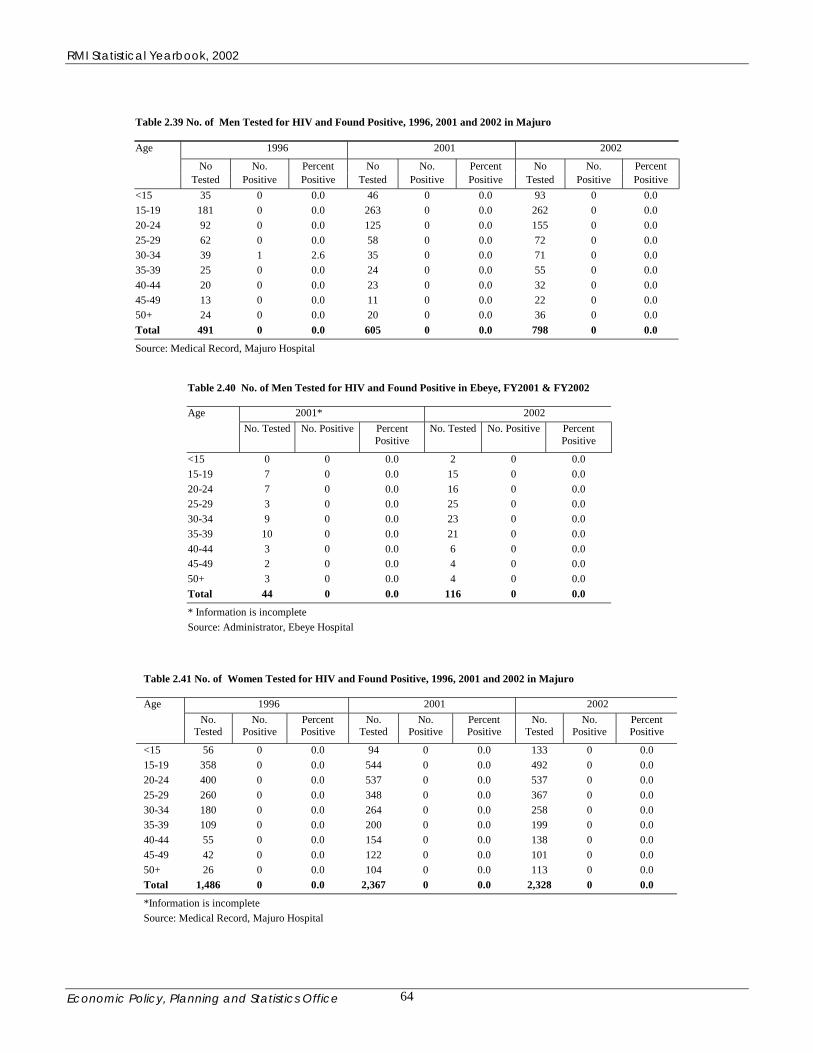
RMI Statistical Yearbook, 2002
Economic Policy, Planning and Statistics Office 64
Table 2.39 No. of Men Tested for HIV and Found Positive, 1996, 2001 and 2002 in Majuro
1996 2001 2002
No No. Percent No No. Percent No No. Percent
Age
Tested Positive Positive Tested Positive Positive Tested Positive Positive <15 35 0 0.0 46 0 0.0 93 0 0.0 15-19 181 0 0.0 263 0 0.0 262 0 0.0 20-24 92 0 0.0 125 0 0.0 155 0 0.0 25-29 62 0 0.0 58 0 0.0 72 0 0.0 30-34 39 1 2.6 35 0 0.0 71 0 0.0 35-39 25 0 0.0 24 0 0.0 55 0 0.0 40-44 20 0 0.0 23 0 0.0 32 0 0.0 45-49 13 0 0.0 11 0 0.0 22 0 0.0 50+ 24 0 0.0 20 0 0.0 36 0 0.0 Total 491 0 0.0 605 0 0.0 798 0 0.0
Source: Medical Record, Majuro Hospital
Table 2.40 No. of Men Tested for HIV and Found Positive in Ebeye, FY2001 & FY2002
2001* 2002 Age No. Tested No. Positive Percent
Positive No. Tested No. Positive Percent
Positive <15 0 0 0.0 2 0 0.0 15-19 7 0 0.0 15 0 0.0 20-24 7 0 0.0 16 0 0.0 25-29 3 0 0.0 25 0 0.0 30-34 9 0 0.0 23 0 0.0 35-39 10 0 0.0 21 0 0.0 40-44 3 0 0.0 6 0 0.0 45-49 2 0 0.0 4 0 0.0 50+ 3 0 0.0 4 0 0.0 Total 44 0 0.0 116 0 0.0 * Information is incomplete Source: Administrator, Ebeye Hospital
Table 2.41 No. of Women Tested for HIV and Found Positive, 1996, 2001 and 2002 in Majuro
1996 2001 2002 Age No.
Tested No.
Positive Percent Positive
No. Tested
No. Positive
Percent Positive
No. Tested
No. Positive
Percent Positive
<15 56 0 0.0 94 0 0.0 133 0 0.0 15-19 358 0 0.0 544 0 0.0 492 0 0.0 20-24 400 0 0.0 537 0 0.0 537 0 0.0 25-29 260 0 0.0 348 0 0.0 367 0 0.0 30-34 180 0 0.0 264 0 0.0 258 0 0.0 35-39 109 0 0.0 200 0 0.0 199 0 0.0 40-44 55 0 0.0 154 0 0.0 138 0 0.0 45-49 42 0 0.0 122 0 0.0 101 0 0.0 50+ 26 0 0.0 104 0 0.0 113 0 0.0 Total 1,486 0 0.0 2,367 0 0.0 2,328 0 0.0
*Information is incomplete Source: Medical Record, Majuro Hospital

RMI Statistical Yearbook, 2002
Economic Policy, Planning and Statistics Office 65
Table 2.42 No. of Women Tested for HIV and Found Positive in Ebeye, FY 2001 & FY2002
FY2001* FY2002 Age No.
Tested No.
Positive Percent Positive
No. Tested
No. Positive
Percent Positive
<15 0 0 0.0 5 0 0.0 15-19 17 0 0.0 79 1 1.3 20-24 35 0 0.0 91 0 0.0 25-29 26 1 3.8 71 1 1.4 30-34 19 0 0.0 43 0 0.0 35-39 5 0 0.0 21 0 0.0 40-44 4 0 0.0 9 0 0.0 45-49 0 0 0.0 1 0 0.0 50+ 0 0 0.0 2 0 0.0
Total 106 1 0.9 322 2 0.6
Source: Ebeye Hospital
One woman was found HIV Positive in 2000-01 and two were HIV Positive in 2001-02. According to the Director of the PHC, there were only two cases and not three as appears from the figures. One case, according to him, is the same who was tested again for confirmation.
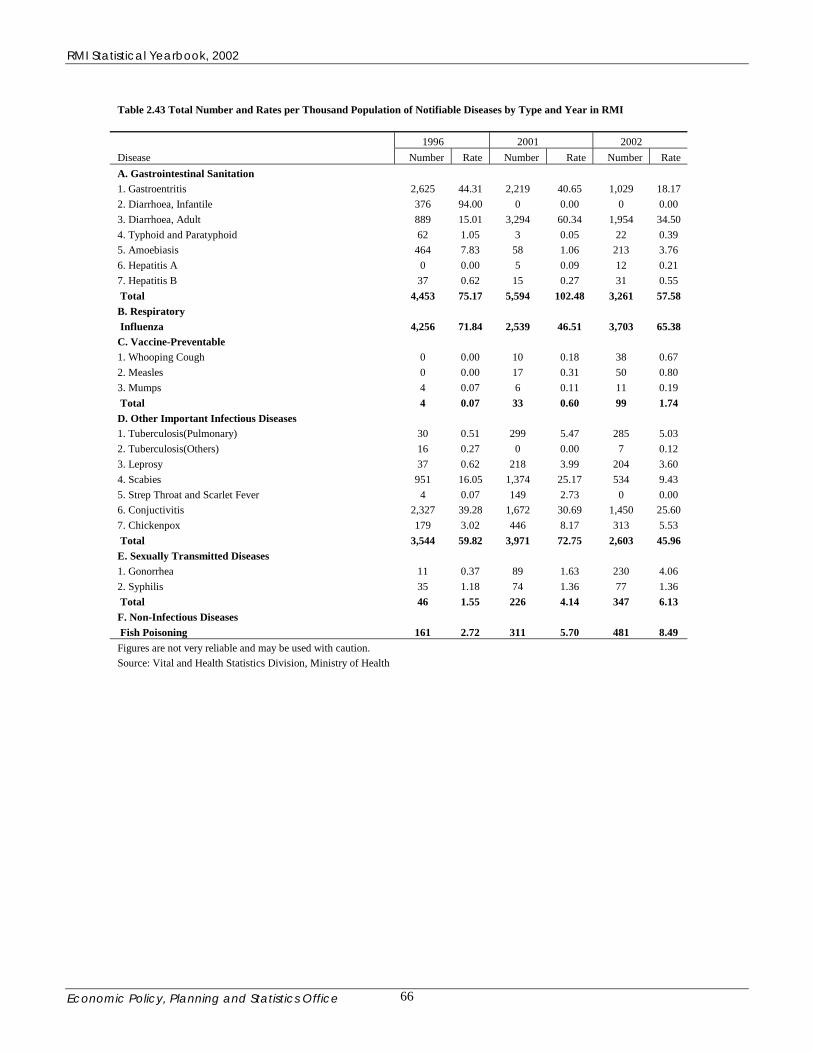
RMI Statistical Yearbook, 2002
Economic Policy, Planning and Statistics Office 66
Table 2.43 Total Number and Rates per Thousand Population of Notifiable Diseases by Type and Year in RMI 1996 2001 2002 Disease Number Rate Number Rate Number Rate A. Gastrointestinal Sanitation 1. Gastroentritis 2,625 44.31 2,219 40.65 1,029 18.17 2. Diarrhoea, Infantile 376 94.00 0 0.00 0 0.00 3. Diarrhoea, Adult 889 15.01 3,294 60.34 1,954 34.50 4. Typhoid and Paratyphoid 62 1.05 3 0.05 22 0.39 5. Amoebiasis 464 7.83 58 1.06 213 3.76 6. Hepatitis A 0 0.00 5 0.09 12 0.21 7. Hepatitis B 37 0.62 15 0.27 31 0.55 Total 4,453 75.17 5,594 102.48 3,261 57.58 B. Respiratory Influenza 4,256 71.84 2,539 46.51 3,703 65.38 C. Vaccine-Preventable 1. Whooping Cough 0 0.00 10 0.18 38 0.67 2. Measles 0 0.00 17 0.31 50 0.80 3. Mumps 4 0.07 6 0.11 11 0.19 Total 4 0.07 33 0.60 99 1.74 D. Other Important Infectious Diseases 1. Tuberculosis(Pulmonary) 30 0.51 299 5.47 285 5.03 2. Tuberculosis(Others) 16 0.27 0 0.00 7 0.12 3. Leprosy 37 0.62 218 3.99 204 3.60 4. Scabies 951 16.05 1,374 25.17 534 9.43 5. Strep Throat and Scarlet Fever 4 0.07 149 2.73 0 0.00 6. Conjuctivitis 2,327 39.28 1,672 30.69 1,450 25.60 7. Chickenpox 179 3.02 446 8.17 313 5.53 Total 3,544 59.82 3,971 72.75 2,603 45.96 E. Sexually Transmitted Diseases 1. Gonorrhea 11 0.37 89 1.63 230 4.06 2. Syphilis 35 1.18 74 1.36 77 1.36 Total 46 1.55 226 4.14 347 6.13 F. Non-Infectious Diseases Fish Poisoning 161 2.72 311 5.70 481 8.49 Figures are not very reliable and may be used with caution. Source: Vital and Health Statistics Division, Ministry of Health
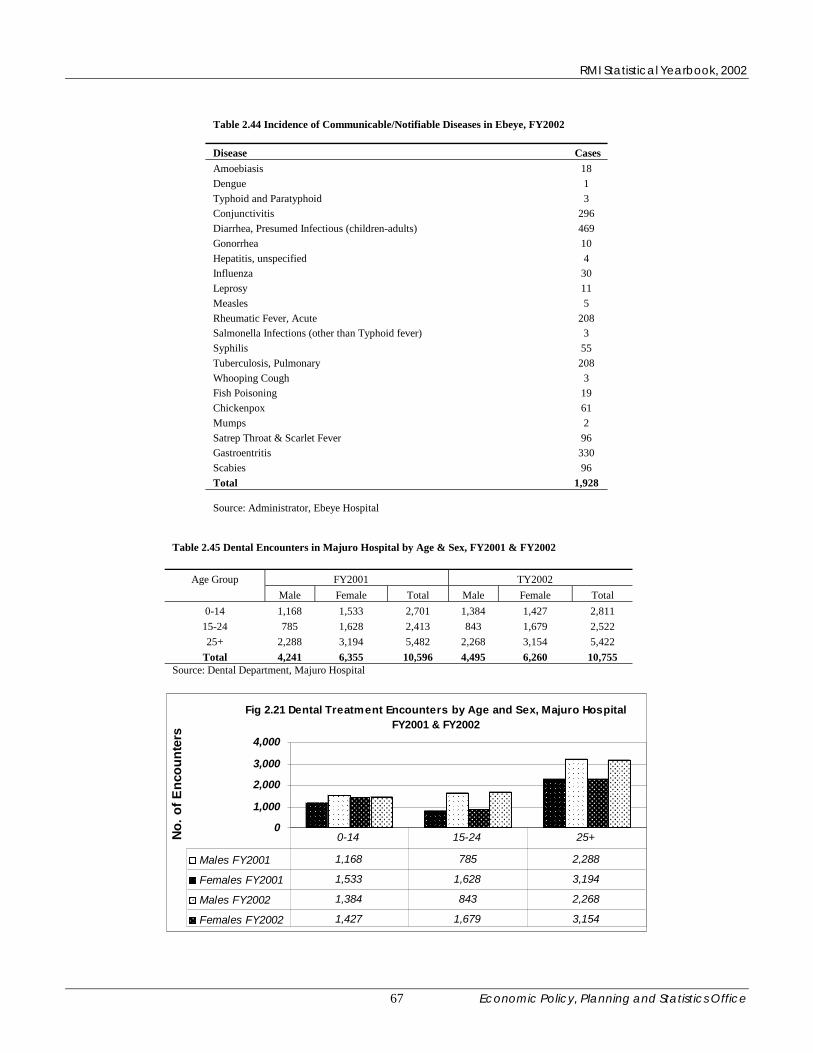
RMI Statistical Yearbook, 2002
Economic Policy, Planning and Statistics Office 67
Table 2.44 Incidence of Communicable/Notifiable Diseases in Ebeye, FY2002 Disease Cases Amoebiasis 18 Dengue 1 Typhoid and Paratyphoid 3 Conjunctivitis 296 Diarrhea, Presumed Infectious (children-adults) 469 Gonorrhea 10 Hepatitis, unspecified 4 Influenza 30 Leprosy 11 Measles 5 Rheumatic Fever, Acute 208 Salmonella Infections (other than Typhoid fever) 3 Syphilis 55 Tuberculosis, Pulmonary 208 Whooping Cough 3 Fish Poisoning 19 Chickenpox 61 Mumps 2 Satrep Throat & Scarlet Fever 96 Gastroentritis 330 Scabies 96 Total 1,928 Source: Administrator, Ebeye Hospital
Table 2.45 Dental Encounters in Majuro Hospital by Age & Sex, FY2001 & FY2002
Age Group FY2001 TY2002 Male Female Total Male Female Total
0-14 1,168 1,533 2,701 1,384 1,427 2,811 15-24 785 1,628 2,413 843 1,679 2,522 25+ 2,288 3,194 5,482 2,268 3,154 5,422
Total 4,241 6,355 10,596 4,495 6,260 10,755 Source: Dental Department, Majuro Hospital
������������������������������
������������������
����������������������������������������
���������������������������
������������������������������
������������������������������������������������������
������������������������������
������������������
����������������������������������������
���������������������������
����������������������������������������
������������������������������������������������������
Fig 2.21 Dental Treatment Encounters by Age and Sex, Majuro Hospital FY2001 & FY2002
0
1,000
2,000
3,000
4,000
No. o
f Enc
ount
ers
���Males FY2001 1,168 785 2,288���Females FY2001 1,533 1,628 3,194���
��� Males FY2002 1,384 843 2,268���
Females FY2002 1,427 1,679 3,154
0-14 15-24 25+

RMI Statistical Yearbook, 2002
Economic Policy, Planning and Statistics Office 68
Table 2.46 Dental Services by Type of Treatment in Majuro Hospital, FY2001 & FY2002 Type of Visit FY2001 FY2002 Emergency 7,160 7,202 Treatment 2,757 2,698 Preventive 679 855 Total 10,596 10,755 Source: Dental Department, Majuro Hospital
Fig 2.22 Dental Treatment in Majuro, FY2001 & FY2002
01,0002,0003,0004,0005,0006,0007,0008,000
Emergency TreatmentFiscal Years
Num
ber o
f Enc
ount
ers
Emergency Treatment Preventive
Table 2.47 Dental Services given by Type of treatment and Age and Sex, Majuro Hospital, 2002
Procedure 0-14 Years 15-24 Years 25+ Years Total Male Female Total Male Female Total Male Female Total Male Female Total Patient Visits 1,384 1,427 2,811 843 1,679 2,522 2,268 3,154 5,422 4,495 6,260 10,755 Extractions (No. of Teeth) 1,050 980 2,030 578 963 1,541 1,200 1,637 2,837 2,828 3,580 6,408 Fillings of Teeth (No. of Teeth) 385 531 916 267 647 914 790 1,020 1,810 1,442 2,198 3,640 Sealants (No. of Teeth) 111 108 219 7 24 31 4 9 13 122 141 263 Root Canals (No. of Visits) 7 6 13 16 40 56 45 68 113 68 114 182 Scaling and Cleaning 80 110 190 60 85 145 270 262 532 410 457 867 Dentures Delivered 0 0 0 7 1 8 60 57 117 67 58 125 Other Procedures 244 215 459 156 260 416 545 587 1,132 945 1,062 2,007 Source: Medical Records, Majuro Hospital
Table 2.48 Dental Services by Type of Treatment and Age and Sex, Majuro Hospital, 2001 Procedure 0-14 Years 15-24 Years 25+ Years Total Male Female Total Male Female Total Male Female Total Male Female Total Patient Visits 1,168 1,533 2,701 785 1,628 2,413 2,288 3,194 5,482 4,241 6,355 10,596 Extractions (No. of Teeth) 860 937 1,797 448 919 1,367 1,170 1,492 2,662 2,478 3,348 5,826 Fillings of Teeth (No. of Teeth) 479 697 1,176 266 612 878 511 1,071 1,582 1,256 2,380 3,636 Sealants(No. of Teeth) 71 49 120 1 8 9 2 7 9 74 64 138 Root Canals (No. of Visits) 18 10 28 29 34 63 47 119 166 94 163 257 Scaling and Cleaning 95 83 178 26 48 74 232 203 435 353 334 687 Dentures Delivered 0 0 0 3 1 4 68 108 176 71 109 180 Other Procedures 201 243 444 105 266 360 516 541 1,057 822 1,050 1,861 Source: Medical Records, Majuro Hospital

RMI Statistical Yearbook, 2002
Economic Policy, Planning and Statistics Office 69
Table 2.49 Dental Treatment by Type of Visit in Ebeye Hospital, FY2001 and FY2002 Type of Visit FY2001 FY2002 Emergency 1,837 1,891 Treatment 611 336 Preventive 205 299 Total 2,653 2,526 Source: Ebeye Hospital
0200400600800
1,0001,2001,4001,6001,8002,000
No.
of E
ncou
nter
s
FY2001 FY2002
Fiscal Year
Fig 2.23 Dental Treatment in Ebeye, FY2001 & FY2002
Emergency
Treatment
Preventive
Table 2.50 Dental Encounters in Ebeye Hospital by Age and Sex, FY2001 and FY2002
Age Group FY2001 FY2002 Male Female Total Male Female Total
0-14 319 410 729 350 371 721 15-24 265 450 715 185 490 675 25+ 490 719 1,209 516 614 1,130
Total 1,074 1,579 2,653 1,051 1,475 2,526 Source: Assistant Secretary, Ebeye Hospital
0200400
600800
10001200
1400
No.
of E
ncou
nter
s
0-14 15-24 25+Age Groups
Fig 2.24 Dental Treatment Encounters by Age and Sex, Ebeye Hospital, FY2001 & FY2002
FY2001
FY2002
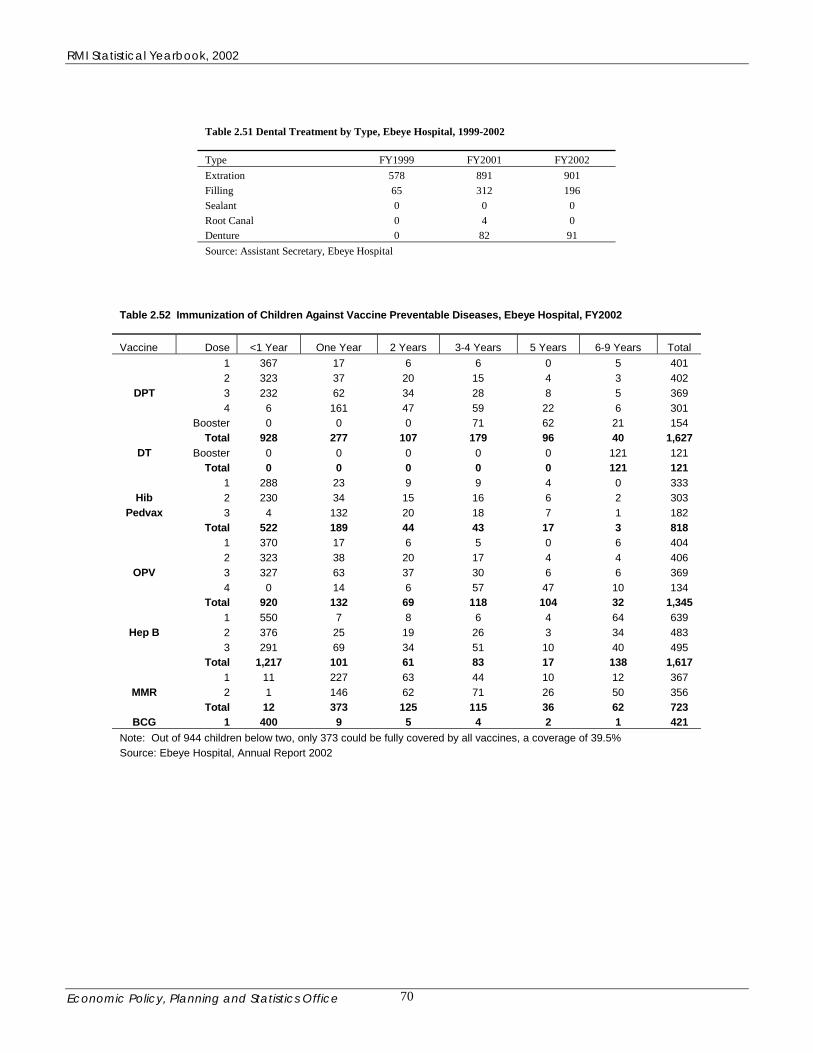
RMI Statistical Yearbook, 2002
Economic Policy, Planning and Statistics Office 70
Table 2.51 Dental Treatment by Type, Ebeye Hospital, 1999-2002 Type FY1999 FY2001 FY2002 Extration 578 891 901 Filling 65 312 196 Sealant 0 0 0 Root Canal 0 4 0 Denture 0 82 91 Source: Assistant Secretary, Ebeye Hospital
Table 2.52 Immunization of Children Against Vaccine Preventable Diseases, Ebeye Hospital, FY2002
Vaccine Dose <1 Year One Year 2 Years 3-4 Years 5 Years 6-9 Years Total 1 367 17 6 6 0 5 401 2 323 37 20 15 4 3 402
DPT 3 232 62 34 28 8 5 369 4 6 161 47 59 22 6 301 Booster 0 0 0 71 62 21 154 Total 928 277 107 179 96 40 1,627
DT Booster 0 0 0 0 0 121 121 Total 0 0 0 0 0 121 121 1 288 23 9 9 4 0 333
Hib 2 230 34 15 16 6 2 303 Pedvax 3 4 132 20 18 7 1 182
Total 522 189 44 43 17 3 818 1 370 17 6 5 0 6 404 2 323 38 20 17 4 4 406
OPV 3 327 63 37 30 6 6 369 4 0 14 6 57 47 10 134 Total 920 132 69 118 104 32 1,345
1 550 7 8 6 4 64 639 Hep B 2 376 25 19 26 3 34 483
3 291 69 34 51 10 40 495 Total 1,217 101 61 83 17 138 1,617 1 11 227 63 44 10 12 367
MMR 2 1 146 62 71 26 50 356 Total 12 373 125 115 36 62 723
BCG 1 400 9 5 4 2 1 421 Note: Out of 944 children below two, only 373 could be fully covered by all vaccines, a coverage of 39.5% Source: Ebeye Hospital, Annual Report 2002
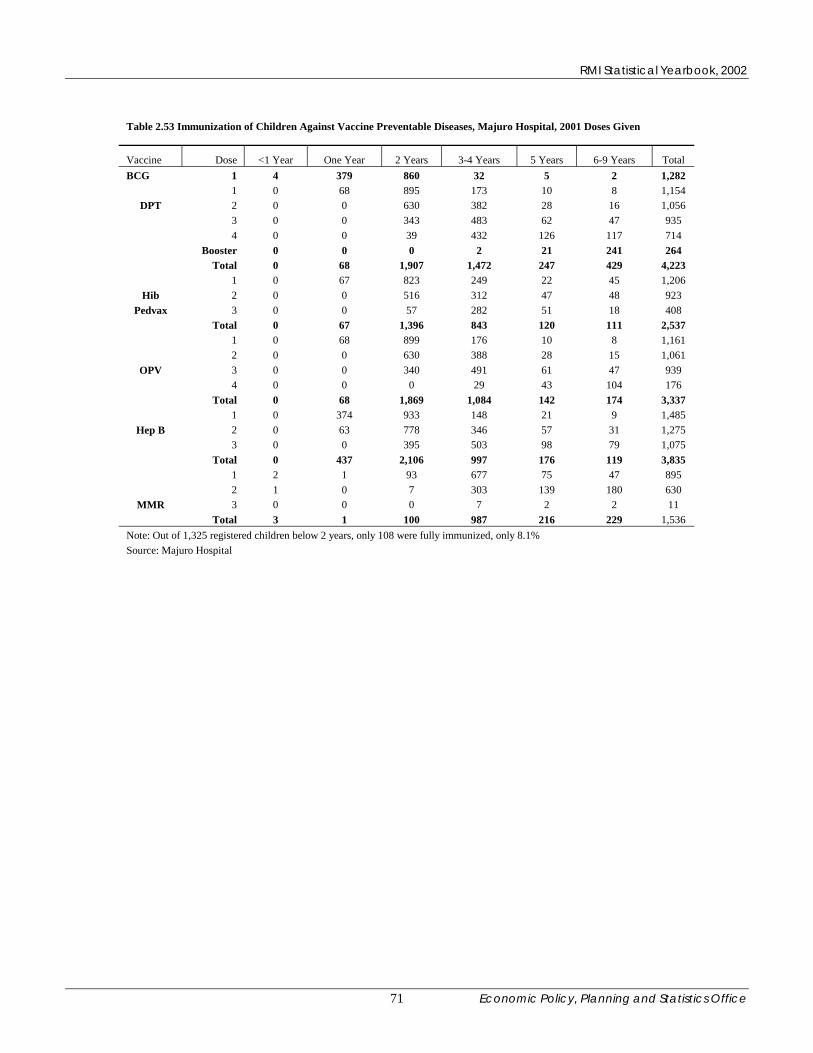
RMI Statistical Yearbook, 2002
Economic Policy, Planning and Statistics Office 71
Table 2.53 Immunization of Children Against Vaccine Preventable Diseases, Majuro Hospital, 2001 Doses Given
Vaccine Dose <1 Year One Year 2 Years 3-4 Years 5 Years 6-9 Years Total BCG 1 4 379 860 32 5 2 1,282 1 0 68 895 173 10 8 1,154
DPT 2 0 0 630 382 28 16 1,056 3 0 0 343 483 62 47 935 4 0 0 39 432 126 117 714 Booster 0 0 0 2 21 241 264 Total 0 68 1,907 1,472 247 429 4,223
1 0 67 823 249 22 45 1,206 Hib 2 0 0 516 312 47 48 923
Pedvax 3 0 0 57 282 51 18 408 Total 0 67 1,396 843 120 111 2,537
1 0 68 899 176 10 8 1,161 2 0 0 630 388 28 15 1,061
OPV 3 0 0 340 491 61 47 939 4 0 0 0 29 43 104 176 Total 0 68 1,869 1,084 142 174 3,337
1 0 374 933 148 21 9 1,485 Hep B 2 0 63 778 346 57 31 1,275
3 0 0 395 503 98 79 1,075 Total 0 437 2,106 997 176 119 3,835 1 2 1 93 677 75 47 895 2 1 0 7 303 139 180 630
MMR 3 0 0 0 7 2 2 11 Total 3 1 100 987 216 229 1,536
Note: Out of 1,325 registered children below 2 years, only 108 were fully immunized, only 8.1% Source: Majuro Hospital
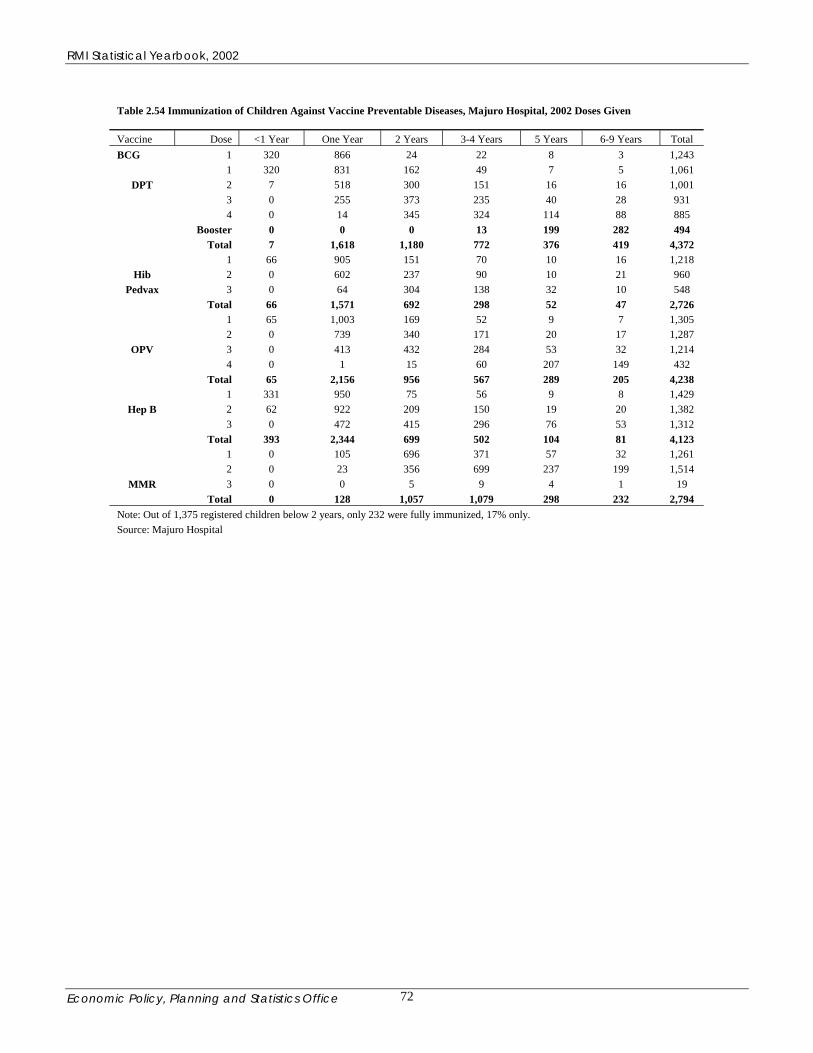
RMI Statistical Yearbook, 2002
Economic Policy, Planning and Statistics Office 72
Table 2.54 Immunization of Children Against Vaccine Preventable Diseases, Majuro Hospital, 2002 Doses Given Vaccine Dose <1 Year One Year 2 Years 3-4 Years 5 Years 6-9 Years Total BCG 1 320 866 24 22 8 3 1,243 1 320 831 162 49 7 5 1,061
DPT 2 7 518 300 151 16 16 1,001 3 0 255 373 235 40 28 931 4 0 14 345 324 114 88 885 Booster 0 0 0 13 199 282 494 Total 7 1,618 1,180 772 376 419 4,372
1 66 905 151 70 10 16 1,218 Hib 2 0 602 237 90 10 21 960
Pedvax 3 0 64 304 138 32 10 548 Total 66 1,571 692 298 52 47 2,726
1 65 1,003 169 52 9 7 1,305 2 0 739 340 171 20 17 1,287
OPV 3 0 413 432 284 53 32 1,214 4 0 1 15 60 207 149 432 Total 65 2,156 956 567 289 205 4,238
1 331 950 75 56 9 8 1,429 Hep B 2 62 922 209 150 19 20 1,382
3 0 472 415 296 76 53 1,312 Total 393 2,344 699 502 104 81 4,123 1 0 105 696 371 57 32 1,261 2 0 23 356 699 237 199 1,514
MMR 3 0 0 5 9 4 1 19 Total 0 128 1,057 1,079 298 232 2,794
Note: Out of 1,375 registered children below 2 years, only 232 were fully immunized, 17% only. Source: Majuro Hospital
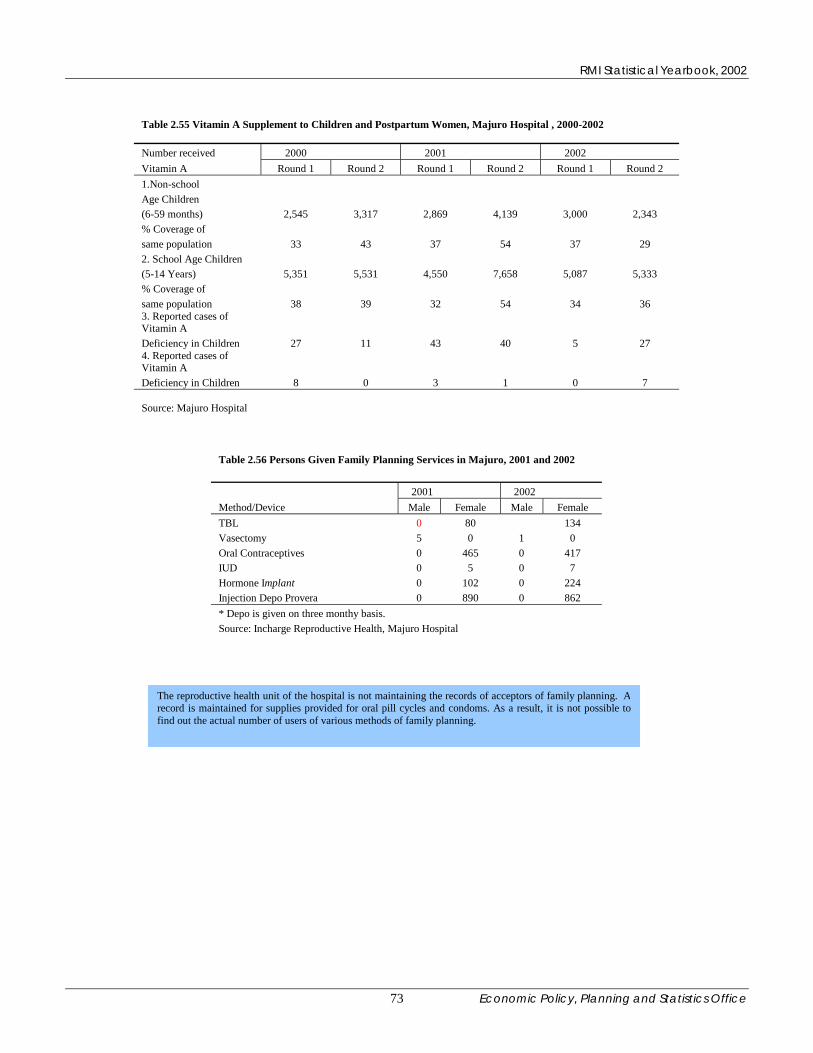
RMI Statistical Yearbook, 2002
Economic Policy, Planning and Statistics Office 73
Table 2.55 Vitamin A Supplement to Children and Postpartum Women, Majuro Hospital , 2000-2002 Number received 2000 2001 2002 Vitamin A Round 1 Round 2 Round 1 Round 2 Round 1 Round 2 1.Non-school Age Children (6-59 months) 2,545 3,317 2,869 4,139 3,000 2,343 % Coverage of same population 33 43 37 54 37 29 2. School Age Children (5-14 Years) 5,351 5,531 4,550 7,658 5,087 5,333 % Coverage of same population 38 39 32 54 34 36 3. Reported cases of Vitamin A Deficiency in Children 27 11 43 40 5 27 4. Reported cases of Vitamin A Deficiency in Children 8 0 3 1 0 7 Source: Majuro Hospital
Table 2.56 Persons Given Family Planning Services in Majuro, 2001 and 2002 2001 2002 Method/Device Male Female Male Female TBL 0 80 134 Vasectomy 5 0 1 0 Oral Contraceptives 0 465 0 417 IUD 0 5 0 7 Hormone Implant 0 102 0 224 Injection Depo Provera 0 890 0 862 * Depo is given on three monthy basis. Source: Incharge Reproductive Health, Majuro Hospital
The reproductive health unit of the hospital is not maintaining the records of acceptors of family planning. Arecord is maintained for supplies provided for oral pill cycles and condoms. As a result, it is not possible tofind out the actual number of users of various methods of family planning.

RMI Statistical Yearbook, 2002
Economic Policy, Planning and Statistics Office 74
Table 2.57 Acceptors of Female Sterilization and Male Sterilization Operations by Age, Majuro Hospital, 2001 and 2002 Age 2001 2002 Female Sterilization. Male Sterilization Female Sterilization Male Sterilization 20-25 17 0 24 0 26-30 29 2 53 0 31-35 25 0 47 0 36-40 6 1 10 0 41+ 3 2 0 1 Total 80 5 134 1 Source: Incharge Reproductive Health Unit Majuro Hospital
Fig 2.25 Female and Male Sterilization Acceptors by Age in Majuro,2001
17
2925
63
0 2 0 1 2
05
101520253035
20-25 26-30 31-35 36-40 41+
Age Groups
Num
bers
Female Sterilizatiom Male Sterilization
Table 2.58 Persons Given Family Planning Services in Ebeye During the 2001- 2003(Upto June) 2001 2002 2003 Method/Device Male Female Male Female Male Female TBL 0 23 0 24 0 25 Vasectomy 1 0 0 0 0 0 Oral Contraceptives 0 117 0 62 0 54 IUD 0 0 0 0 0 0 Hormone Implant 0 57 0 15 0 20 Injection Depo Provera 0 336 0 343 0 212 * Depo is given on three monthy basis. ** Breakup of family planning acceptors by age was not available. Source: Dr. Incharge Reproductive Health, Ebeye Hospital
Vasectomy operations, IUDs and condoms are not popular. Younger couples should be encouragedto practice family planning. The concept of regular users is very important for the prevention ofunwanted births. For qualitative monitoring, review of acceptance by age and method is veryimportant.
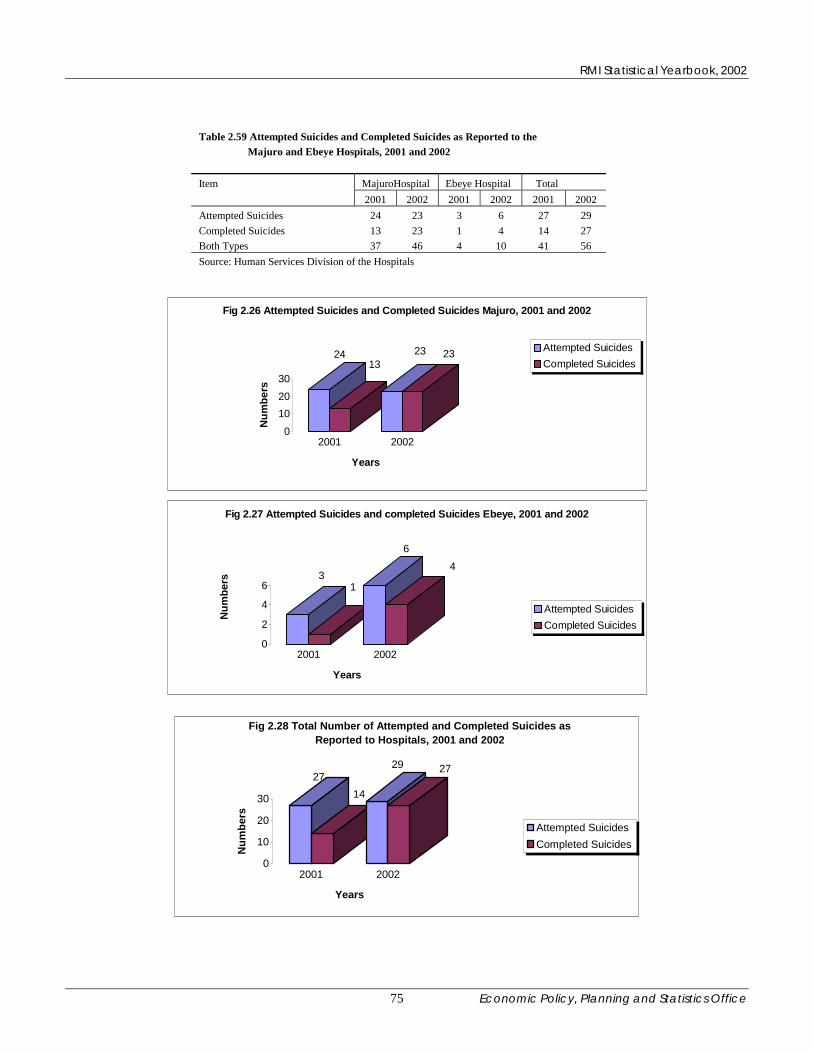
RMI Statistical Yearbook, 2002
Economic Policy, Planning and Statistics Office 75
Table 2.59 Attempted Suicides and Completed Suicides as Reported to the Majuro and Ebeye Hospitals, 2001 and 2002 Item MajuroHospital Ebeye Hospital Total 2001 2002 2001 2002 2001 2002 Attempted Suicides 24 23 3 6 27 29 Completed Suicides 13 23 1 4 14 27 Both Types 37 46 4 10 41 56 Source: Human Services Division of the Hospitals
2413
23 23
0102030
Num
bers
2001 2002
Years
Fig 2.26 Attempted Suicides and Completed Suicides Majuro, 2001 and 2002
Attempted SuicidesCompleted Suicides
31
64
0
2
4
6
Num
bers
2001 2002
Years
Fig 2.27 Attempted Suicides and completed Suicides Ebeye, 2001 and 2002
Attempted SuicidesCompleted Suicides
2714
29 27
0
10
20
30
Num
bers
2001 2002
Years
Fig 2.28 Total Number of Attempted and Completed Suicides as Reported to Hospitals, 2001 and 2002
Attempted SuicidesCompleted Suicides
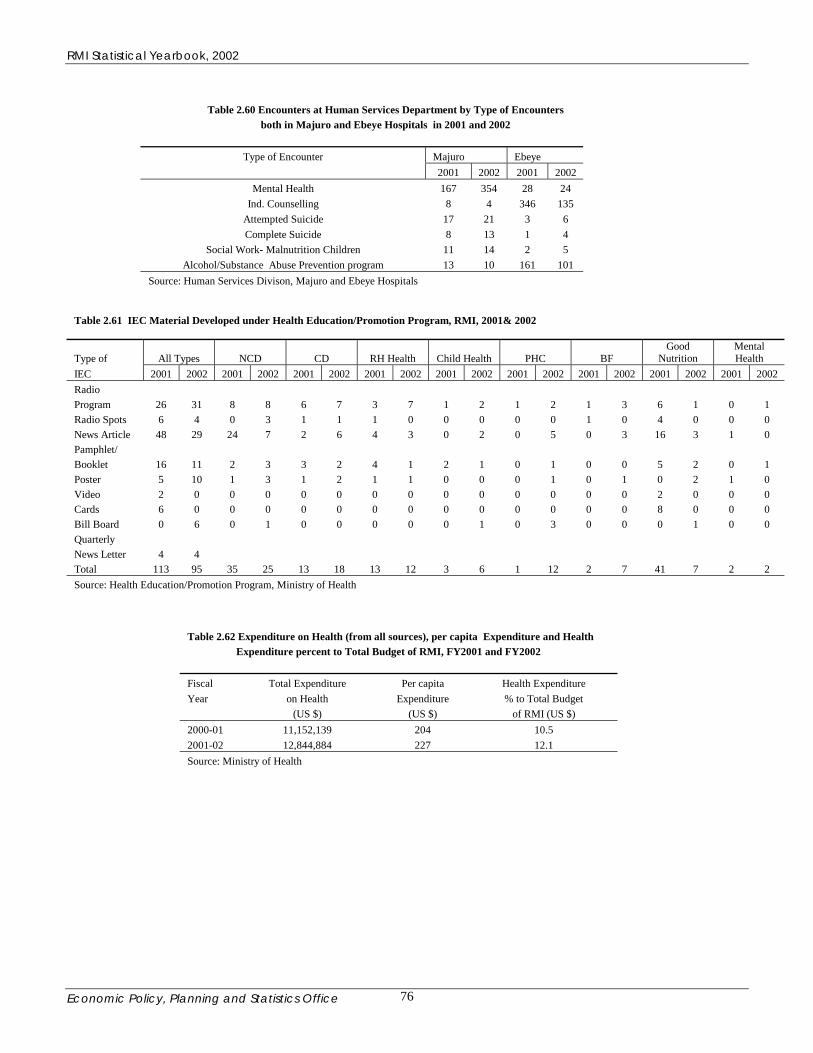
RMI Statistical Yearbook, 2002
Economic Policy, Planning and Statistics Office 76
Table 2.60 Encounters at Human Services Department by Type of Encounters both in Majuro and Ebeye Hospitals in 2001 and 2002
Type of Encounter Majuro Ebeye
2001 2002 2001 2002 Mental Health 167 354 28 24
Ind. Counselling 8 4 346 135 Attempted Suicide 17 21 3 6 Complete Suicide 8 13 1 4
Social Work- Malnutrition Children 11 14 2 5 Alcohol/Substance Abuse Prevention program 13 10 161 101
Source: Human Services Divison, Majuro and Ebeye Hospitals
Table 2.61 IEC Material Developed under Health Education/Promotion Program, RMI, 2001& 2002
Type of All Types NCD CD RH Health Child Health PHC BF Good
Nutrition Mental Health
IEC 2001 2002 2001 2002 2001 2002 2001 2002 2001 2002 2001 2002 2001 2002 2001 2002 2001 2002 Radio Program 26 31 8 8 6 7 3 7 1 2 1 2 1 3 6 1 0 1 Radio Spots 6 4 0 3 1 1 1 0 0 0 0 0 1 0 4 0 0 0 News Article 48 29 24 7 2 6 4 3 0 2 0 5 0 3 16 3 1 0 Pamphlet/ Booklet 16 11 2 3 3 2 4 1 2 1 0 1 0 0 5 2 0 1 Poster 5 10 1 3 1 2 1 1 0 0 0 1 0 1 0 2 1 0 Video 2 0 0 0 0 0 0 0 0 0 0 0 0 0 2 0 0 0 Cards 6 0 0 0 0 0 0 0 0 0 0 0 0 0 8 0 0 0 Bill Board 0 6 0 1 0 0 0 0 0 1 0 3 0 0 0 1 0 0 Quarterly News Letter 4 4 Total 113 95 35 25 13 18 13 12 3 6 1 12 2 7 41 7 2 2 Source: Health Education/Promotion Program, Ministry of Health
Table 2.62 Expenditure on Health (from all sources), per capita Expenditure and Health Expenditure percent to Total Budget of RMI, FY2001 and FY2002 Fiscal Total Expenditure Per capita Health Expenditure Year on Health Expenditure % to Total Budget (US $) (US $) of RMI (US $) 2000-01 11,152,139 204 10.5 2001-02 12,844,884 227 12.1 Source: Ministry of Health

RMI Statistical Yearbook, 2002
Economic Policy, Planning and Statistics Office 77
Table 2.63 Staff by Category Majuro Hospital and Ebeye Hospital as on September 2003 Category Majuro Ebeye Administrative 12 5 Doctors 21 10 Dentists 3 1 Staff Nurses 72 43 Practical Nurses 60 14 Primary Healthcare 73 14 Ancillary Services 19 15 Support Services 54 12 Security 8 5 Total 322 119 Source: Majuro Hospital Administration
Figure 2. 29 Staff by category for Majuro and Ebeye Hospital as on September 2003
0 10 20 30 40 50 60 70 80
Administrative
Doctors
Dentists
Staff Nurses
Practical Nurses
Primary Healthcare
Ancillary Services
Support Services
Security
No. of Staff
Majuro Hospital Ebeye Hospital
Out of 24 Doctors, 19 are foreigners and out of 63 Staff Nurses in Majuro Hospital, 32 are foreigners. In Ebeye out of 11 doctors, 9 are foreigners, and out of 43 staff nurses, 27 are from other countries.
The total number of beds in Majuro Hospital are 97, Medical:27,Surgical:27, Pediatrics:26, Maternity:14 and Incubator:3 In Ebeye Hospitaltotal number of beds are 43, Medical:10, Pediatrics:14, Surgical:8, andEmergency:3
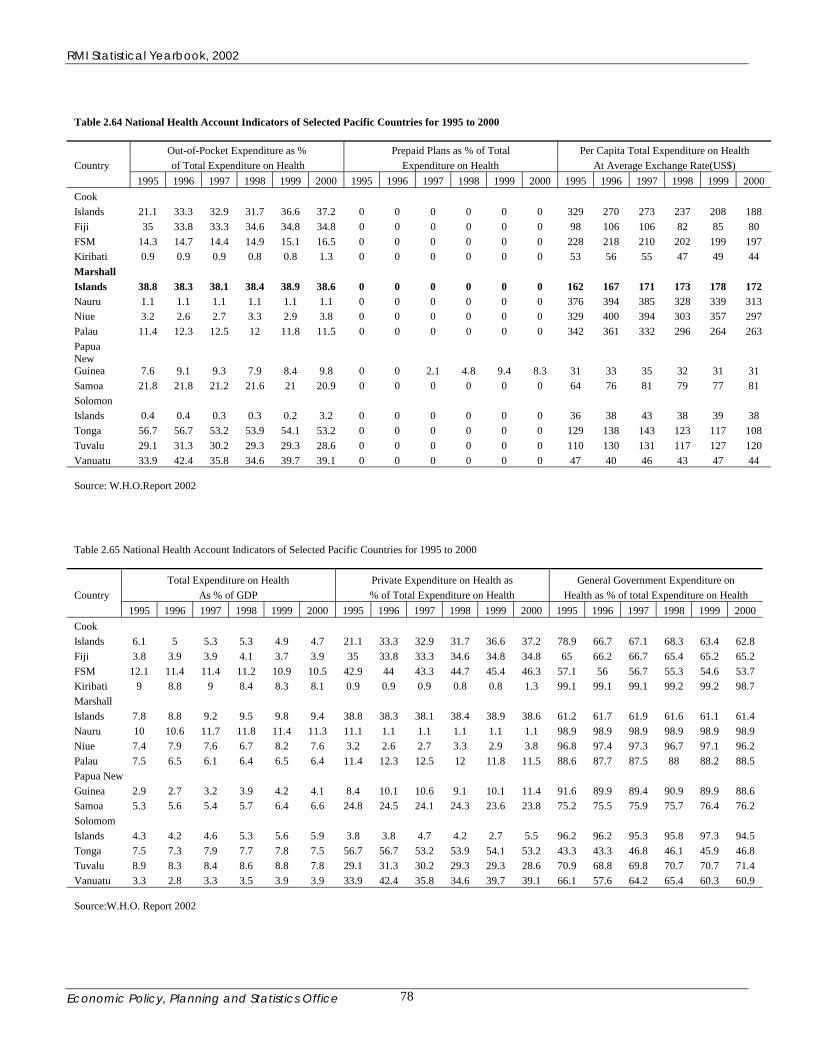
RMI Statistical Yearbook, 2002
Economic Policy, Planning and Statistics Office 78
Table 2.64 National Health Account Indicators of Selected Pacific Countries for 1995 to 2000 Out-of-Pocket Expenditure as % Prepaid Plans as % of Total Per Capita Total Expenditure on Health Country of Total Expenditure on Health Expenditure on Health At Average Exchange Rate(US$) 1995 1996 1997 1998 1999 2000 1995 1996 1997 1998 1999 2000 1995 1996 1997 1998 1999 2000 Cook Islands 21.1 33.3 32.9 31.7 36.6 37.2 0 0 0 0 0 0 329 270 273 237 208 188 Fiji 35 33.8 33.3 34.6 34.8 34.8 0 0 0 0 0 0 98 106 106 82 85 80 FSM 14.3 14.7 14.4 14.9 15.1 16.5 0 0 0 0 0 0 228 218 210 202 199 197 Kiribati 0.9 0.9 0.9 0.8 0.8 1.3 0 0 0 0 0 0 53 56 55 47 49 44 Marshall Islands 38.8 38.3 38.1 38.4 38.9 38.6 0 0 0 0 0 0 162 167 171 173 178 172 Nauru 1.1 1.1 1.1 1.1 1.1 1.1 0 0 0 0 0 0 376 394 385 328 339 313 Niue 3.2 2.6 2.7 3.3 2.9 3.8 0 0 0 0 0 0 329 400 394 303 357 297 Palau 11.4 12.3 12.5 12 11.8 11.5 0 0 0 0 0 0 342 361 332 296 264 263 Papua New Guinea 7.6 9.1 9.3 7.9 8.4 9.8 0 0 2.1 4.8 9.4 8.3 31 33 35 32 31 31 Samoa 21.8 21.8 21.2 21.6 21 20.9 0 0 0 0 0 0 64 76 81 79 77 81 Solomon Islands 0.4 0.4 0.3 0.3 0.2 3.2 0 0 0 0 0 0 36 38 43 38 39 38 Tonga 56.7 56.7 53.2 53.9 54.1 53.2 0 0 0 0 0 0 129 138 143 123 117 108 Tuvalu 29.1 31.3 30.2 29.3 29.3 28.6 0 0 0 0 0 0 110 130 131 117 127 120 Vanuatu 33.9 42.4 35.8 34.6 39.7 39.1 0 0 0 0 0 0 47 40 46 43 47 44 Source: W.H.O.Report 2002
Table 2.65 National Health Account Indicators of Selected Pacific Countries for 1995 to 2000
Total Expenditure on Health Private Expenditure on Health as General Government Expenditure on Country As % of GDP % of Total Expenditure on Health Health as % of total Expenditure on Health 1995 1996 1997 1998 1999 2000 1995 1996 1997 1998 1999 2000 1995 1996 1997 1998 1999 2000 Cook Islands 6.1 5 5.3 5.3 4.9 4.7 21.1 33.3 32.9 31.7 36.6 37.2 78.9 66.7 67.1 68.3 63.4 62.8 Fiji 3.8 3.9 3.9 4.1 3.7 3.9 35 33.8 33.3 34.6 34.8 34.8 65 66.2 66.7 65.4 65.2 65.2 FSM 12.1 11.4 11.4 11.2 10.9 10.5 42.9 44 43.3 44.7 45.4 46.3 57.1 56 56.7 55.3 54.6 53.7 Kiribati 9 8.8 9 8.4 8.3 8.1 0.9 0.9 0.9 0.8 0.8 1.3 99.1 99.1 99.1 99.2 99.2 98.7 Marshall Islands 7.8 8.8 9.2 9.5 9.8 9.4 38.8 38.3 38.1 38.4 38.9 38.6 61.2 61.7 61.9 61.6 61.1 61.4 Nauru 10 10.6 11.7 11.8 11.4 11.3 11.1 1.1 1.1 1.1 1.1 1.1 98.9 98.9 98.9 98.9 98.9 98.9 Niue 7.4 7.9 7.6 6.7 8.2 7.6 3.2 2.6 2.7 3.3 2.9 3.8 96.8 97.4 97.3 96.7 97.1 96.2 Palau 7.5 6.5 6.1 6.4 6.5 6.4 11.4 12.3 12.5 12 11.8 11.5 88.6 87.7 87.5 88 88.2 88.5 Papua New Guinea 2.9 2.7 3.2 3.9 4.2 4.1 8.4 10.1 10.6 9.1 10.1 11.4 91.6 89.9 89.4 90.9 89.9 88.6 Samoa 5.3 5.6 5.4 5.7 6.4 6.6 24.8 24.5 24.1 24.3 23.6 23.8 75.2 75.5 75.9 75.7 76.4 76.2 Solomom Islands 4.3 4.2 4.6 5.3 5.6 5.9 3.8 3.8 4.7 4.2 2.7 5.5 96.2 96.2 95.3 95.8 97.3 94.5 Tonga 7.5 7.3 7.9 7.7 7.8 7.5 56.7 56.7 53.2 53.9 54.1 53.2 43.3 43.3 46.8 46.1 45.9 46.8 Tuvalu 8.9 8.3 8.4 8.6 8.8 7.8 29.1 31.3 30.2 29.3 29.3 28.6 70.9 68.8 69.8 70.7 70.7 71.4 Vanuatu 3.3 2.8 3.3 3.5 3.9 3.9 33.9 42.4 35.8 34.6 39.7 39.1 66.1 57.6 64.2 65.4 60.3 60.9 Source:W.H.O. Report 2002

RMI Statistical Yearbook, 2002
Economic Policy, Planning and Statistics Office 79
Chapter 3- Education Education System The education system in Marshall Islands is comprised of the following four levels:
• Pre-school for children in the age group 3-5. This is through a network of Head Start Program centers and a few public and private kindergarten programs. There are 49 Head Start Centers and 16 schools with Kindergarten programs, 3 public and 13 private.
• Compulsory Primary Education for ages 6-14 through public and private schools. Number of Elementary / Primary Schools is 100, 75 public and 25 private.
• Secondary education covers the ages of 15-18 through public and private schools. There are 4 public high schools and 13 private high schools.
• Post Secondary education and training are conducted primarily through the College of Marshall Islands (CMI) and USP-CMI Joint Education Program.
Most of the private schools are affiliated with different churches. The detailed account of schools by area and management including the number of teachers, students by male and female, teacher-student ratios, for the past several years is presented in relevant tables under this chapter. Status of the Pre-School, Elementary, Secondary Education and Post- Secondary Education I. Pre-School Education
1. Head Start Program
This comprehensive early childhood development program has been in operation since in 1976 (except in 1993-94, when it was discontinued for a year due to financial constraints) in the Marshall Islands with financial assistance from the US Federal Government. During fiscal year 2002-03, total for the program expenditure was $3,131,136. The overall goal and objective of the Head Start is to increase the social competence of young children particularly those from low income families. The students enrolled under this program are entitled to benefits of a comprehensive health insurance scheme, regular medical examinations, free refreshment, lunch while in school and school bus service to school. The Head Start Centers are spread all over the country and one feature of this program is that its coverage in outer islands is better than in the urban areas of Majuro and Ebeye. All concerned have recognized the positive impact of the Program through early childhood intervention. In order to make best possible utilization of the existing facilities, sufficient for enrolment for about 1,200 children, the administration made a decision to first admit all five-year old children, followed by four year olds and lastly three year olds. Out of 1,260 pre-school children, enrolled in the year 2002-03, the number of 5 year, 4 year and 3- year old children was thus 889, 324 and 47 respectively. The total coverage of children in the program was only 29.3 percent in these age groups. The government has fixed a target of a 5 percent annual increase in enrollments under Head Start. However, there was only an increase of 1.5 percent in the enrolments for the school year 2002-03.

RMI Statistical Yearbook, 2002
Economic Policy, Planning and Statistics Office 80
2. Kindergarten Programs Three public elementary schools Longar(Arno), Ebeye and Ollet( Maloelap) enroll 3-5 year old children for preschool education. There are thirteen private schools with similar programs and all are located in the urban areas of Majuro and Kwajalein/Ebeye. The total number of kindergarten students was 115 and 342 in both public and private schools during 2002-03. The total number of pre-school children, both under Head Start and Kindergarten in the school year 2002-03, was 1,717. The overall coverage for pre-school education was 39.9 percent of the eligible population. This coverage could be enhanced considerably if all existing public and private elementary schools could add classes for kindergartens and an expansion of the Head Start Program. II. Elementary/ Primary Education Elementary education is compulsory and there are nominal registration fees in schools run by the government. The private schools charge a tuition fee. Where available, books are made available to all students free of charge by the government. There were 8,166 students comprised of 4,317 boys and 3,849 girls in 75 public schools. The number of students in private schools was 2,806, consisting of 1,360 boys and 1,446 girls. Girls out numbered boys in private schools but overall, the total number of boys is much higher than girls in primary schools. The enrolment in all public and private schools in 2002-03 in grade one was 1,504 students against an estimated number of over 2,000 children eligible for admission. This estimate is based on the crude birth rate of 41.8 per thousand of population (1999 Census). On that assumption, approximately 2,200 births are taking place every year. It is feared that a large number of children are not admitted into the schools or there is some problem with the education statistics. There are fluctuations in the yearly series of enrollments of students by grade in recorded statistics and that is surely an indication that there are some mistakes in enumeration for school enrollments even if the database from education ministry is comparatively better than most other ministries and agencies. Plausible reasons for low enrollment could also be due to emigration and the declining fertility rate. But when all these factors are taken into account, it appears that a large number of parents are not sending their children to schools. The problem of dropouts leaving school even without completing elementary education, is a matter of deep concern. The dropout rate was 23 percent for males and 18 percent for the females in 2003 from grade 1 to grade 8. It may be noted that the dropout rates have remained consistently higher among males than females.
III. Secondary Education Secondary education is also free in schools run by the government. The total number of male and female students in all the four public high schools in 2002-03 was 720 and 725, respectively. The number of male and female students in 13 private schools was 827 and 880, respectively. Private schools play a significant role in the provision of Secondary School Education. The number of female students is higher than male students for both private and public schools. The gross enrollment ratio is improving a bit, yet it was still as low as 51.9 in the year 2002-03. The problem is aggravated due to continuing high dropout rates at this level of education. The percentage of students in Grade 9, who did not complete the Grade 12, was 42.4% in year 2002-03. The dropout of female students was 43.3 % while it was 38.7 % for male students in 2002-03, thus a reversal of the trend in dropout rates from the primary level to secondary level. This is perhaps due to the practice of early marriage and teen-age pregnancies, forcing female students to abandon their studies.

RMI Statistical Yearbook, 2002
Economic Policy, Planning and Statistics Office 81
Standard of Education There is national system of examinations at the school level and students are usually promoted to the next grade at the end of the school year. The Pacific Islands Literacy levels (PILL) test which has been conducted every year except in the years 2000 and 2001, by the South Pacific Board for Educational Assessment (SPBEA) after 4 years of formal schooling indicates that though there is significant improvement in knowledge of the students in English and Marshallese but in Numeracy, the level is still declining. Overall, Marshall Islands is among lowest rankings for education in the pacific region.
In 2002, the percentage of students considered ‘At Risk’ from the PILL tests had increased from 51% in 1994 to 73% in 2002. The performance of students of the private schools, however, has been much better. The percentage of students in private schools ‘At Risk’ in Numeracy was 50% as compared to 80% students of public schools. Female students performed better than males in all three subjects. Under an Asian Development Bank funded a basic education project, where national evaluation tests were developed and field-tested and it was recommended to carry out these standardized achievement tests for the 4th, 6th and 8th grades from the year 2000. The Ministry of Education is still in the process of making a final decision on the implementation of these standardized national tests. Teacher student Ratios Elementary Schools This ratio provides an indication concerning the potential quality of education. The lower number of students per teacher means more focused attention by the teacher. Twenty students per teacher per class/grade could be considered very good. There were less than 20 students per teacher both in public and private elementary schools in Marshall Islands. But in this country, because of isolated and thinly populated islands/islets all schools have multi-grade classes (8 grades in Elementary Schools), the number of students in a majority of schools varies from 5-50. The number of teachers in such schools varies from 1-5. To teach one grade only at one time is not possible. In such schools, students of 3-4 grades are combined in one class and a teacher has to resort to multi-grade teaching. To teach students of different levels is not only difficult but it also takes a great deal of time and places demands on quality teaching. In such an environment, the potential for students to become careless increases and can aggravate school dropout statistics. The problem, therefore, needs some type of solution. Elementary schools on Majuro face the problem of inadequate number of class- rooms. To tide over this problem, some of the schools have two shifts but then the each shift is of only four and a half hours long as compared to six hours for schools in single shifts. Secondary Schools Since, the number of secondary schools is limited and they are serving larger areas, the numbers of students at the individual secondary schools is relatively high. These schools did not face a problem of inadequate number of teachers as far as numerical strength of teachers was concerned. The student teacher ratio both in public and private high schools was quite satisfactory as it worked out to 17 and 15 students for the public and private schools respectively. The number of teachers in both in public and private schools has been on increase in recent years. The problem of qualified teachers, particularly in mathematics, science and language continues to remain serious in these schools.

RMI Statistical Yearbook, 2002
Economic Policy, Planning and Statistics Office 82
Qualified Teachers In general teachers are not very well qualified. Nearly half of the teachers have a high school diploma as their highest education qualification. Very few teachers have a teaching certificate/diploma. Moreover, there is an acute shortage of teachers to teach English, Mathematics and Science. The shortage of such teachers has been alleviated to some degree by employing foreign teachers in the last two years.
Inadequate Class Room Capacity The acute shortage of class- room space in the public high schools has been a problem for many years. In view of this, admissions to Secondary schools are restricted to around only 500 students. An entrance exam is administered every year for admission to the 9th Grade and only first 500 or so students in order of merit, are admitted to the public secondary schools. Last year, out of 1,327 students who sought admission to the 9th Grade, only the first 545 were declared eligible. The importance of the private secondary schools can thus be seen in this situation. IV. Post- Secondary Education RMI-USP Joint Education Program The RMI-USP Joint Education Program was established at the request of the RMI government in 1996 to prepare indigenous Marshallese students for the vigorous demands of tertiary education. The program is a partnership in education between the Republic of the Marshall Islands and the University of the South Pacific (USP). The two-year program prepares Marshallese students for entry to tertiary (degree, diploma and certificate) studies at any university. Admission is granted into Preliminary studies to those students who have passed grade 11 with a 2.0 GPA. The USP Preliminary Program (equivalent to grade 12) provides the academic preparation for entry into the second year of the program, which comprises nine of USP Foundation courses. Students can opt for either the Science or the Social Science Streams. Students are required to take Mathematics and English. Students enrolled at RMI-USP receive the support and full involvement of a professional campus staff. The two-year program is intensive and rigorous. Between 1996 and 2002, eighty five students successfully completed the Foundation Program. University of South Pacific and RMI Established in 1968, the University of the South Pacific (USP) is a regional university with 12 member countries across the Pacific region. USP has three campuses (Suva, Fiji; Port Vila, Vanuatu; and Apia, Samoa) and 14 USP Centers in the Cook Islands, Fiji, Kiribati, Marshall Islands, Nauru, Niue, Samoa, Solomon Islands, Tokelau, Tonga, Tuvalu and Vanuatu. Each Campus and Center house satellite dishes, technology and infrastructure needed to deliver distance education programming to disparate populations over a large geographical area.
The Government of the Republic of the Marshall Islands became a full member of the University in 1990. The USP Marshall Islands Center was established in 1993. The Minister of Education sits on the University Council (Board of Regents). The Center Director reports directly to the Vice-Chancellor through the Director of Distance and Flexible Learning based in Fiji, who manages and supports University Centers in the region. The Center Advisory Committee, currently chaired by the Minister of Education of the Marshall Islands, comprises members of the education and general community
RMI Statistical Yearbook, 2002
Economic Policy, Planning and Statistics Office 83
Service Area and levels of Service The USP Center in Marshall Islands provides degree, diploma (AS degrees) and vocational certificates through both distance education (DEL) and on site (face- to- face) courses to all eligible students throughout the Marshall Islands. Since January 2000, Majuro students have had access to face-to-face instruction from lecturers and instructors via live video through USPNET, the communications network of the University. In 2003, 147 students enrolled in the following programs:
Continuing Education Certificate Programs: Early Childhood Education (16), Community Nutrition (14) and Disabilities Studies (1) Vocational Certificate Programs: Law (7), Library and Information Studies (7) Certificate Programs: Management Studies (6), Youth in Development
Studies (1), Computing Studies (2), Geographical Information Studies (10) Diploma Programs: Early Childhood education (40), Management (Public Administration) (8), Educational Ad- ministration (1), Youth Studies (1), Accounting (4) Baccalaureate Programs: LL.B (Law) (8), BA Early Childhood Education (14), BA Geography (2), BA Demography and Population Studies (1), BA History Politics (1), BA Accounting (1) And Economics (1) Postgraduate Programs: Post graduate Certificate in Education (1) Graduates In 2003, the following will graduate from different programs: Certificate in Early Childhood Education (10), Community Nutrition Certificate (7), Certificate in Management (5), Certificate in Law (2), Certificate in Library and Information Studies (5), Certificate in Geographical Information Systems (3), Diploma in early Childhood Education (22), Diploma in Educational Administration (1), Diploma in Management (2), BA Geography and Tourism (1), BA Management and Public Administration (1) and LLB (3). Total=62 College of Marshall Islands The College of the Marshall Islands, popularly known as CMI, is an autonomous institution offering two years associate degree courses in various programs. Historically, this college came into being officially when the Board of Regents of the Community College of Micronesia (CCM) issued its charter on 10 October 1989, designating it as the College of Micronesia-Majuro. Two years later, in January 1991, it was given its present name and was accredited by the Accrediting Commission for Community and Junior Colleges. In April 1993, the college became an independent entity with its own Board of Regents and was chartered to serve as the post-secondary institution for RMI. In 1996, a branch of the college was established at Guegeegue island on Kwajalein Atoll, replacing an earlier extension center. Due to renovation and rebuilding, academic programs at the Kwajalein campus have been temporarily suspended until August, 2004 and students from the Guegeegue campus are now continuing their studies at the main campus at Majuro.

RMI Statistical Yearbook, 2002
Economic Policy, Planning and Statistics Office 84
Courses of Studies Prior to academic year 2002-03, there were 9 programs leading to a Associate Degree of Arts/Science. These programs were: Nursing, Computer Science, Business Management, Management, Office Administration, Elementary Education, Engineering (Architecture), Accounts and Liberal arts. But due to a reorganization of programs and restructuring courses, three independent courses of Computer Science, Accounting and Business Management have been integrated into one called Business and Computer Science Associate Degree. Five Associate Degree programs, Office Administration, Management, Accountancy, Computer Science and Engineering were discontinued from 2002-03. Thus the college now provides instructions in four programs, Liberal Arts, Business and Computer Science, Elementary Education, and Nursing. In addition to these accredited regular courses, CMI provides community education courses and services that respond to local needs for lifelong learning. It offers Adult and Continuing Education, which includes preparation for the General Education Development (GED) Diploma or the RMI Adult High School (AHS) Diploma. For working individuals and for those wishing to improve and enrich themselves as part of a lifelong process, community continuing education courses are arranged in the evenings and on Saturdays. CMI also runs technical training programs specifically designed to qualify students for employment in areas of critical need to the country. These programs lead to a certificate in Business Studies, Accounting and Computer. The students are prepared for entry-level positions in the area of business, or for those already working, their skills are upgraded.
The percentage of students passing in different programs leading to an Associate Degree has been quite low. Overall, only 10 % of students graduate with an Associate Degree. Scholarships for Post-Secondary Education The government has been very liberal in offering scholarships to those who want to pursue their studies after the secondary level. While granting scholarships, preference has given for programs at CMI, particularly teachers training courses and for nursing education. It has been found that a large number of scholarship holders did not complete their courses. From 1988 to 1999, out of 1,614 persons granted scholarships, only 245 completed their programs. The skills, both technical and academic, that are most important for the development of the country and have more avenues of employment should be identified and the students who apply for such studies should be given priority for awarding of scholarships.
C.A.R.E. Program Community After-school Recreation and Education (C.A.R.E.) Program is a US federally funded program and has been operating since 2001 in all the 8 public elementary schools on Majuro, serving about 3,500 students.
A consortium of 29 partners composed of traditional leaders, national and local government agencies, community based organizations, businesses, non-government organizations, CMI, faith-based organizations, healthcare providers, volunteer educators and parents provide additional resources and help in various ways for the success of this community based program. The program is run in the afternoons from 3-5 PM after-school hours and on weekends and during school vacations. Through various activities, this program aims at reducing the incidence of juvenile crime, alcoholism, smoking, substance abuse, sexual promiscuity, frustration, and suicides among youth. It is also aimed at improving the education level of the students by providing extra coaching to academically weak students. Volleyball and basketball courts have been made available in all the 8 elementary schools for the program. Additionally, the libraries of the schools are being strengthened and hands-on-training with computers is arranged.

RMI Statistical Yearbook, 2002
Economic Policy, Planning and Statistics Office 85
The participation and involvement of teachers, parents and community has been encouraging. All participating students are provided with snacks on weekdays. Education in Marshallese culture, national heritage, traditional outrigger canoe building, handicrafts, kitchen-gardening, nutrition, social service, sanitation, health and life skills are a part of the activities under this program.
The following amount was received from the US Department of Education during the last three years for this program:
1st Year: $914,706 2nd Year: $897,253 3rd Year: $897,253
The number of students who have benefited during the year 2002-03 was 3,534. The program should be reviewed for its success and in case it is found to be useful and cost-effective, ways and means may be found to expand it to other schools in other areas of the country. Services of the Foreign Volunteers World Teach, which is based at Harvard University, Boston, has been providing the services of 27 student teachers in public schools at various locations in the RMI. The level of English for students of the schools where these volunteers worked has shown a significant improvement. Similarly, since 1998, the Japan Cooperation Volunteers have been very helpful particularly in teaching Mathematics and Science in various public and private schools. In addition, there has been a program with Dartmouth University, which has supplied an additional eight student teachers a year for the last three years. An Australian Volunteer has been designing and developing a proper statistical database in the Ministry of Education. National Training Council This Council was established in 1991 under the industries development act PL-140. It is an independent government organization and comes under the ministry of education. The Council has been vested with the responsibility to provide vocational training and other training programs, to coordinate other training programs and to expand human resources development in the Republic of the Marshall Islands. The alien workers fee fund collected by the division of taxation and revenue, Ministry of Finance, is the only funding source of the Council. The budget of the Council is both indefinite and insufficient. The NTC is not properly staffed to accomplish the assigned tasks.
Main Highlights Primary Schools
• There are 75 public schools and 25 private schools in the RMI. • The number of teachers increased from 500 in 1990-91 to 646 in 1995-96 to 703 in 2002-03. The
increase in teachers on outer islands has been significant from 234 in 1990-91 to 293 in 1995-96 to 369 in 2002-03.
• In 2002-03, the number of students both in public and private schools registered a decrease. • Arno atoll has the largest number of public schools at 10. But Majuro had a distinction of having
11 private schools. • The students considered ‘At Risk’ has decreased in all the three subject areas English,
Marshallese and Numeracy from 72 %, 66 % and 75 % respectively in 1999 to 57 %, 49 % and 73 % respectively in 2003. The at risk levels, particularly in Numeracy, are still very high.

RMI Statistical Yearbook, 2002
Economic Policy, Planning and Statistics Office 86
• Female students were better placed than male in all three tests at the 4th grade. The ‘At risk’ levels in case of males were 61.2 %, 51.8 % and 73.8 % in case of English, Marshallese and Numeracy, respectively, the corresponding percentage in case of females was comparatively less at 53.0, 45.1 and 72.6 %.
• The students from private schools faired much better than the students at the public schools. The ‘At Risk’ was 34 %, 44 % and 50 % in English, Marshallese and Numeracy respectively for students of private schools, whereas these percentages were as high as 64, 74 and 80 respectively in case of students of the public schools.
• The enrollment of students continued to decline in all grades in 2002-03.
High Schools • The newly opened Laura Public High School started functioning from 2002-03, increasing the
number of public high schools from 3 to 4.The number of private high schools remained the same 13.
• The number of teachers in both public and private high schools has increased from 66 and 95 respectively in 2000-01 to 95 and 115 respectively in 2002-03.
• The teacher student ratio was 14.8 in case of private schools but it was 16.6 in public schools. • Number of students both in public and private schools was on the increase. • There was not much difference in enrollment figures of males and females; the number of females
however, was marginally more than boys.
• Out of 1,327 students who appeared for the high schools admission test in 2003, only 545, 264 males and 281 females could qualify.
Head Start/Kindergarten • The enrolment of children has increased a little from 1,200 in 2000-01 to 1,212 in 2001-02, 1,241
in 2001-02 and 1,260 in 2002-03; an increase of 5 percent in three years. • This program has a better coverage of children in rural areas than in urban. 20.4%, 32.2% and
38.1% of children aged 3-5 were enrolled under this program in Majuro, Ebeye and outer islands, respectively during 2002-03.
• Only three public elementary schools, Longer in Arno, Ollet in Maloelap and Ebeye have kindergarten programs. Four Kindergarten programs in Ebeye and 9 in Majuro were functioning in the private schools. The total number of children in kindergarten was 457.
• The overall coverage of children in age group 3-5 (pre-school) was 39.9 %.
Drop-outs from Schools
Elementary Education • Over 20 % children leave the elementary schools before reaching the 8th grade. The dropout rate
is higher amongst boys than girls. • There is a slight improvement in the dropouts in the recent years.

RMI Statistical Yearbook, 2002
Economic Policy, Planning and Statistics Office 87
High School Education • The problem is more acute at this level of education, even if there has been some improvement
lately. Overall, 38.8 % of students dropout from school before completing the 12th grade. This percentage was 38.7 % in the case of male students and 43.0 % for female students.
• Due to shortage of space in schools, admission to 9th grade is limited to available about 500 seats. In 2003, out of 1,327 students who took the High School Admission Test, only the first 545 were declared eligible for admission into the 9th grade, meaning 58.9 % were refused admission. Remaining students, whose parents can afford education in private schools, can enroll in private schools.
• If we take into consideration the problem of dropouts and refusal for admission due to inadequate classroom space, only 20 % to 24 % of the students enrolled in grade 1 were in a position to complete high school level education.
High School Entrance Test • All the students from Likiep, Woja(A), Coop, St. Thomas, Mejatto, Enejellar, St. Paul, Woja SDA
and Jabnoden Elementary schools qualified whereas not a single student from 23 elementary schools could qualify. The performance of private schools was relatively better.
RMI-USP Joint Education Program Preliminary and Foundation Courses
• The number of students has increased from 49 in 2001 to 70 in 2002. These courses were designed for preparing the students for admission into foreign universities.
• The pass percentage has steadily increased from 51 % in 1996 to 83 % in 2002. • 85 % of female students were successful in these courses in 2002 compared to 81 % male students
during the same period. College of the Marshall Islands
• The number of associate degree programs has been reduced from 9 to 5. • The overall graduation rate for all programs was only 10%.
Scholarships • Under the RMI Scholarship Program, those who want to pursue post secondary school studies
could apply for scholarships financed out of Compact funds and RMI general funds. • From 1988-99, 1,614 persons were awarded scholarships costing $6,818,266 but only 245
completed their programs. • During 2000-01, 175 persons received scholarships, 45 for studies in CMI and 130 for pursuing
programs in other countries. The total amount spent was $727,000. On this basis, average cost per scholarship is $4,154.
• During 2002-03, the number of scholarship holders was 137, out of which the number of females was 77. Only 14received scholarships for pursuing studies in CMI and 113 scholarships were for studies in other countries.
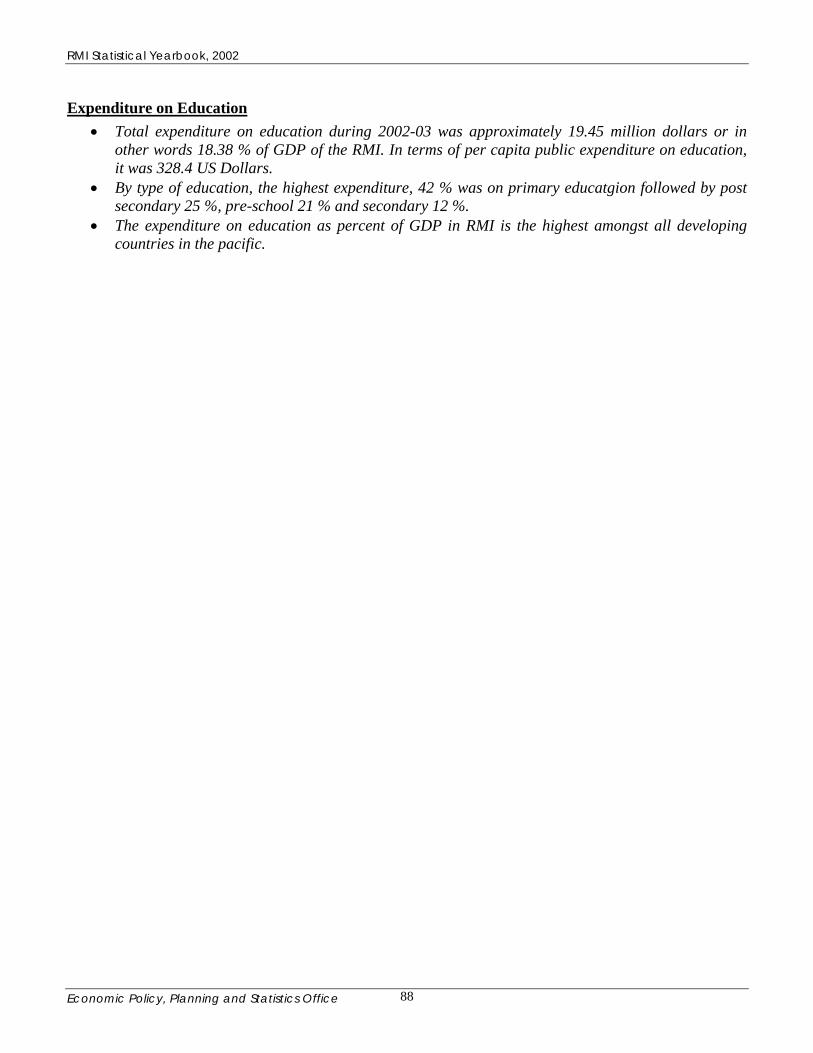
RMI Statistical Yearbook, 2002
Economic Policy, Planning and Statistics Office 88
Expenditure on Education • Total expenditure on education during 2002-03 was approximately 19.45 million dollars or in
other words 18.38 % of GDP of the RMI. In terms of per capita public expenditure on education, it was 328.4 US Dollars.
• By type of education, the highest expenditure, 42 % was on primary educatgion followed by post secondary 25 %, pre-school 21 % and secondary 12 %.
• The expenditure on education as percent of GDP in RMI is the highest amongst all developing countries in the pacific.

RMI Statistical Yearbook, 2002
Economic Policy, Planning and Statistics Office 89
Table 3.1 No. of Preschool/Kindergarten Schools by Management in Atolls in 2002-03 Public Schools Private Schools
Atoll Name of No. of Students No. of Students School Boys Girls Total Boys Girls Total Arno Longar 4 3 7 Kwajalein Ebeye 71 32 103 Calvary, Ebeye 6 10 16 Jebro Kabua 11 11 22 SDA, Ebeye 16 19 35 Queen of Peace 24 24 48 Total 75 35 110 57 64 121 Majuro Assumption 20 23 43 Calvary,Delap 3 0 3 SDA,Delap 13 7 20 SDA,Laura 2 3 5 Calvary, Laura 1 1 2 Laura, Christian 0 0 0 Academy 3 2 5 Majuro Coop 30 23 53 Majuro Baptist 27 27 54 Rita Christian 17 19 36 Total 116 105 221 Maloelap Ollet 1 4 5 Grand Total 76 39 115 173 169 342 Source: Ministry of Education and Baptist School, Majuro

RMI Statistical Yearbook, 2002
Economic Policy, Planning and Statistics Office 90
Table 3.2 Number of Schools and Teachers by area under Head Start Programme in RMI, 1994-95 to 2002-03
Item 1994-95 1999-00 2000-01 2001-02 2002-03 Number of Schools: Majuro 5 6 6 6 6 Kwajalein 3 3 3 3 3 Outer Islands 32 36 38 38 40 Total 40 45 47 47 49 Number of Teachers: Male … … 50 46 48 Female … … 76 71 75 Total … … 126 117 123 No. of Students 1200 1202 1212 1241 1260 Teacher: School Ratio … … 2.7 2.5 2.5 Students: Teacher Ratio … … 9.6 10.6 10.2 Source: Director Head Start Programme RMI, Majuro ... Figures not available
4045 47 47 49
05
101520253035404550
No.
of s
choo
ls
1994-95 1999-00 2000-01 2001-02 2002-03
Years
Figure 3.1 Number of Head Start Schools in RMI over years
3236 38 38
40
0
5
10
15
20
25
30
35
40
No.
of S
choo
ls
1994-95 1999-00 2000-01 2001-02 2002-03Years
Figure 3.2 Number of Head Start Schools in OuterIslands over years

RMI Statistical Yearbook, 2002
Economic Policy, Planning and Statistics Office 91
Table 3.3 Number of Students by Sex and Area under Head Start Programme in RMI, 1994-95 to 2002-03 No. of 1994-95 1999-2000 2000-01 2001-02 2002-03 Students Boys Girls Total Boys Girls Total Boys Girls Total Boys Girls Total Boys Girls Total Majuro: 3Years 13 9 22 11 18 29 2 3 5 5 4 9 3 4 7 4 Years 67 22 129 54 57 111 38 63 101 39 47 86 38 43 81 5 Years 95 74 169 89 109 198 155 121 276 169 147 316 163 132 295 Total 175 145 320 154 184 338 195 187 382 213 198 411 204 179 383 Kwajalein: 3 Years 0 0 0 0 0 0 0 0 0 0 1 1 0 0 0 4 Years 27 28 55 35 40 75 48 59 107 21 35 56 15 13 28 5 Years 100 105 205 107 112 219 75 62 137 118 79 197 108 121 229 Total 127 133 260 142 152 294 123 121 244 139 115 254 123 134 257 Outer Islands: 3 Years 40 25 65 31 19 50 21 26 47 32 25 57 21 19 40 4 Years 110 105 215 96 83 179 99 119 218 108 146 254 118 97 215 5 Years 155 106 261 182 159 341 191 130 321 145 120 265 200 165 365 Total 305 236 541 309 261 570 311 275 586 285 291 576 339 281 620 Grand Total 607 514 1,121 605 597 1,202 629 583 1,212 637 604 1,241 666 594 1,260 Source: Director Head Start Programme RMI, Majuro
Figure 3.3 No. of student under HeadStart programme, 2003
O uter Islands:
50%
K w ajalein:
21%
M ajuro :
29%
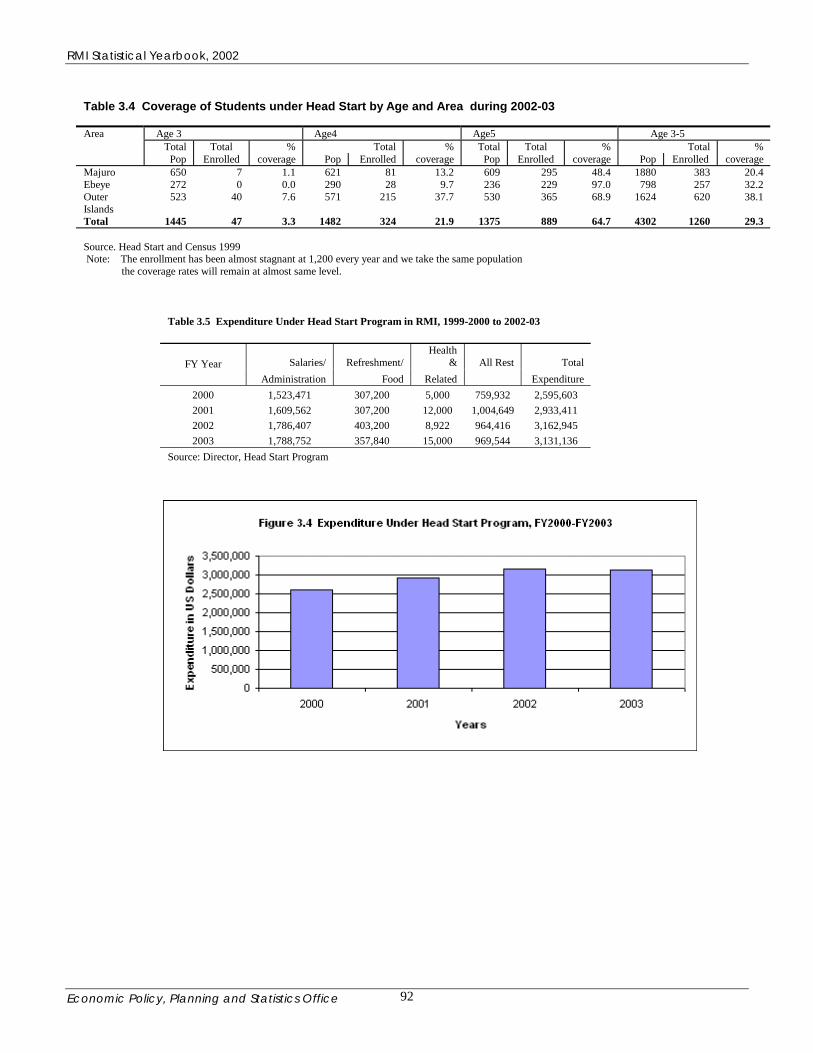
RMI Statistical Yearbook, 2002
Economic Policy, Planning and Statistics Office 92
Table 3.4 Coverage of Students under Head Start by Age and Area during 2002-03
Area Age 3 Age4 Age5 Age 3-5 Total Total % Total % Total Total % Total % Pop Enrolled coverage Pop Enrolled coverage Pop Enrolled coverage Pop Enrolled coverage
Majuro 650 7 1.1 621 81 13.2 609 295 48.4 1880 383 20.4 Ebeye 272 0 0.0 290 28 9.7 236 229 97.0 798 257 32.2 Outer Islands
523 40 7.6 571 215 37.7 530 365 68.9 1624 620 38.1
Total 1445 47 3.3 1482 324 21.9 1375 889 64.7 4302 1260 29.3
Source. Head Start and Census 1999 Note: The enrollment has been almost stagnant at 1,200 every year and we take the same population the coverage rates will remain at almost same level.
Table 3.5 Expenditure Under Head Start Program in RMI, 1999-2000 to 2002-03
Salaries/ Refreshment/ Health
& All Rest Total FY Year Administration Food Related Expenditure
2000 1,523,471 307,200 5,000 759,932 2,595,603 2001 1,609,562 307,200 12,000 1,004,649 2,933,411 2002 1,786,407 403,200 8,922 964,416 3,162,945 2003 1,788,752 357,840 15,000 969,544 3,131,136
Source: Director, Head Start Program
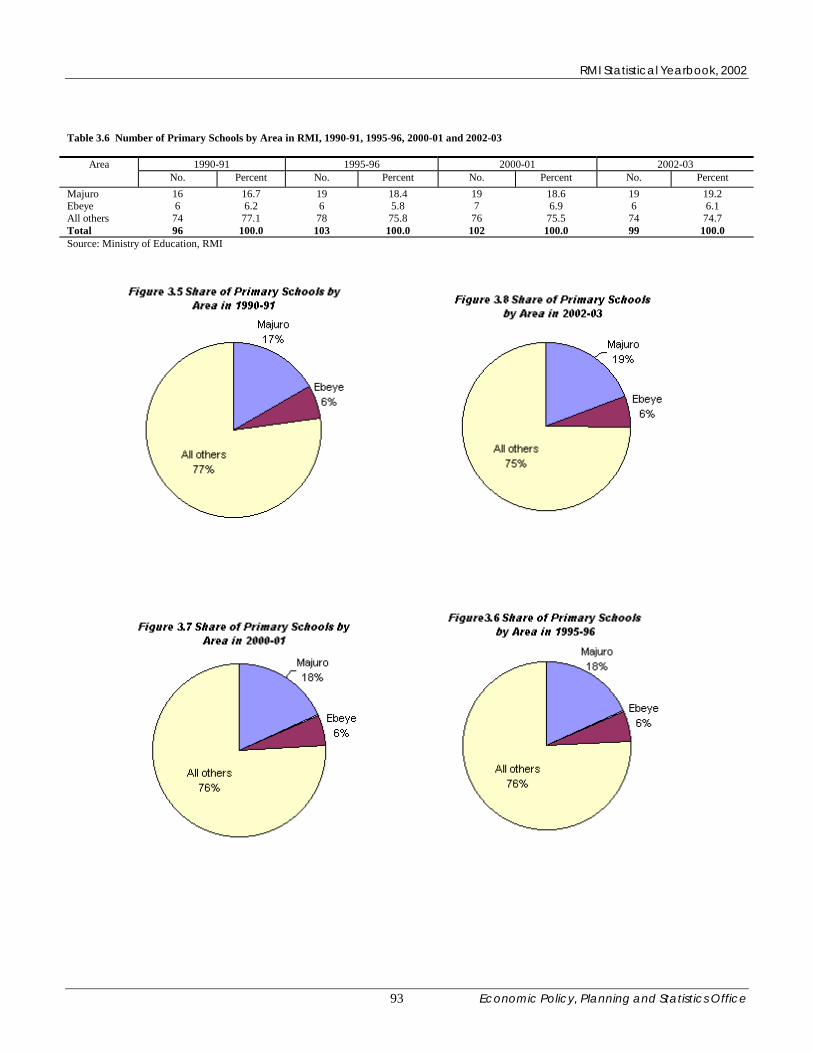
RMI Statistical Yearbook, 2002
Economic Policy, Planning and Statistics Office 93
Table 3.6 Number of Primary Schools by Area in RMI, 1990-91, 1995-96, 2000-01 and 2002-03
Area 1990-91 1995-96 2000-01 2002-03
No. Percent No. Percent No. Percent No. Percent Majuro 16 16.7 19 18.4 19 18.6 19 19.2 Ebeye 6 6.2 6 5.8 7 6.9 6 6.1 All others 74 77.1 78 75.8 76 75.5 74 74.7 Total 96 100.0 103 100.0 102 100.0 99 100.0 Source: Ministry of Education, RMI
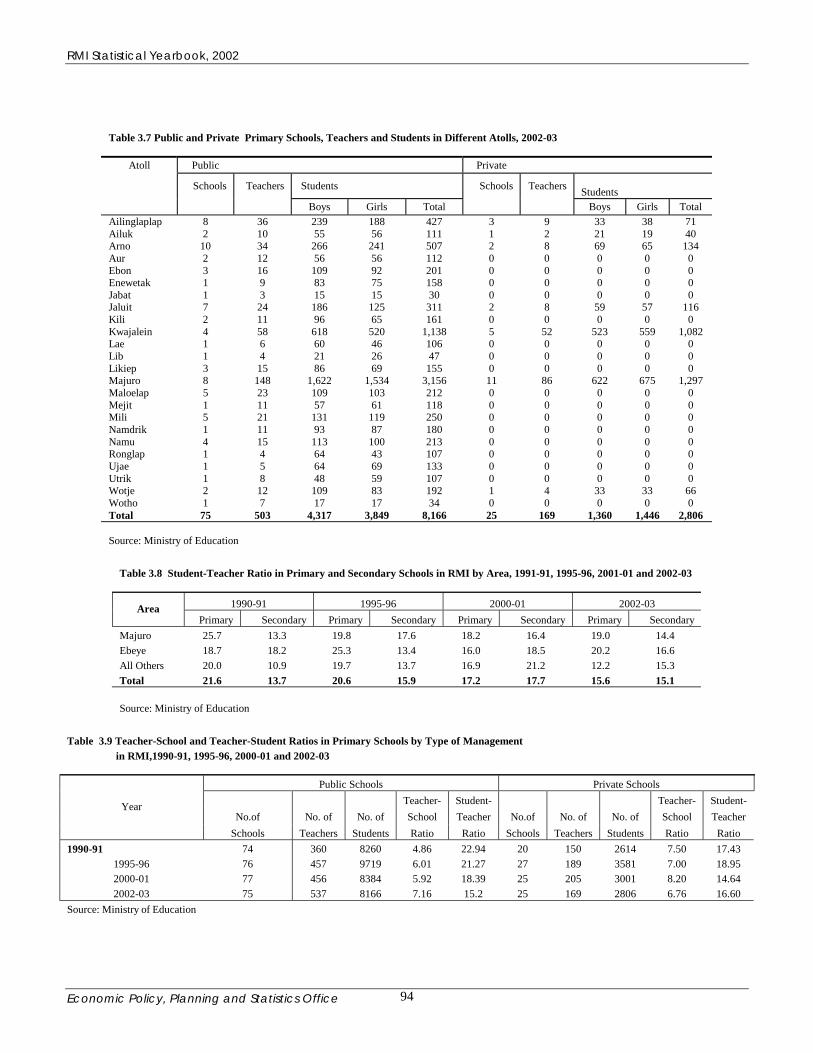
RMI Statistical Yearbook, 2002
Economic Policy, Planning and Statistics Office 94
Table 3.7 Public and Private Primary Schools, Teachers and Students in Different Atolls, 2002-03
Atoll Public Private
Schools Teachers Students Schools Teachers Students
Boys Girls Total Boys Girls Total Ailinglaplap 8 36 239 188 427 3 9 33 38 71 Ailuk 2 10 55 56 111 1 2 21 19 40 Arno 10 34 266 241 507 2 8 69 65 134 Aur 2 12 56 56 112 0 0 0 0 0 Ebon 3 16 109 92 201 0 0 0 0 0 Enewetak 1 9 83 75 158 0 0 0 0 0 Jabat 1 3 15 15 30 0 0 0 0 0 Jaluit 7 24 186 125 311 2 8 59 57 116 Kili 2 11 96 65 161 0 0 0 0 0 Kwajalein 4 58 618 520 1,138 5 52 523 559 1,082 Lae 1 6 60 46 106 0 0 0 0 0 Lib 1 4 21 26 47 0 0 0 0 0 Likiep 3 15 86 69 155 0 0 0 0 0 Majuro 8 148 1,622 1,534 3,156 11 86 622 675 1,297 Maloelap 5 23 109 103 212 0 0 0 0 0 Mejit 1 11 57 61 118 0 0 0 0 0 Mili 5 21 131 119 250 0 0 0 0 0 Namdrik 1 11 93 87 180 0 0 0 0 0 Namu 4 15 113 100 213 0 0 0 0 0 Ronglap 1 4 64 43 107 0 0 0 0 0 Ujae 1 5 64 69 133 0 0 0 0 0 Utrik 1 8 48 59 107 0 0 0 0 0 Wotje 2 12 109 83 192 1 4 33 33 66 Wotho 1 7 17 17 34 0 0 0 0 0 Total 75 503 4,317 3,849 8,166 25 169 1,360 1,446 2,806
Source: Ministry of Education
Table 3.8 Student-Teacher Ratio in Primary and Secondary Schools in RMI by Area, 1991-91, 1995-96, 2001-01 and 2002-03
1990-91 1995-96 2000-01 2002-03 Area Primary Secondary Primary Secondary Primary Secondary Primary Secondary
Majuro 25.7 13.3 19.8 17.6 18.2 16.4 19.0 14.4 Ebeye 18.7 18.2 25.3 13.4 16.0 18.5 20.2 16.6 All Others 20.0 10.9 19.7 13.7 16.9 21.2 12.2 15.3 Total 21.6 13.7 20.6 15.9 17.2 17.7 15.6 15.1 Source: Ministry of Education
Table 3.9 Teacher-School and Teacher-Student Ratios in Primary Schools by Type of Management in RMI,1990-91, 1995-96, 2000-01 and 2002-03
Public Schools Private Schools Teacher- Student- Teacher- Student-
No.of No. of No. of School Teacher No.of No. of No. of School Teacher Year
Schools Teachers Students Ratio Ratio Schools Teachers Students Ratio Ratio 1990-91 74 360 8260 4.86 22.94 20 150 2614 7.50 17.43
1995-96 76 457 9719 6.01 21.27 27 189 3581 7.00 18.95 2000-01 77 456 8384 5.92 18.39 25 205 3001 8.20 14.64 2002-03 75 537 8166 7.16 15.2 25 169 2806 6.76 16.60
Source: Ministry of Education

RMI Statistical Yearbook, 2002
Economic Policy, Planning and Statistics Office 95
Table 3.10 Gross Enrollment Ratios for Primary and Secondary schools Year Primary Schools Secondary Schools Pry. And Secondary 2000-01 102.0 50.3 84.7 2001-02 98.8 48.3 81.2 2002-03 101.6 51.9 84.0 Calculations based on the population as per 1999 census. Source: Ministry of Education/EPPSO
Figure 3.9 Gross Enrollment Ratios
102.0
50.3
84.7
98.8
48.3
81.2
51.9
101.6
84.0
0.0 50.0 100.0 150.0 200.0 250.0 300.0 350.0
Primary Schools
Secondary Schools
Pry. And Secondary
2000-01 2001-02 2002-03
Table 3.11 No. of Students in Primary Schools in RMI by Area, 1990-91, 1995-96, 2000-01 and 2002-03.
Area 1990-91 1995-96 2000-01 2002-03 No. Percent No. Percent No. Percent No. Percent
Majuro 4,313 40 4,999 38 4,578 40 4,453 41 Ebeye 1,831 17 2,531 19 2,257 20 2,021 19 All others 4,671 43 5,770 43 4,550 40 4,483 41 Total 10,815 100 13,300 100 11,385 100 10,957 100 Source: Ministry of Education

RMI Statistical Yearbook, 2002
Economic Policy, Planning and Statistics Office 96
Table 3.12 No. of Teachers in Primary Schools in RMI by Area, 1990-91, 1995-96, 2000-01 and 2002-03
Area 1990-91 1995-96 2000-01 2002-03
No. Percent No. Percent No. Percent No. Percent Majuro 168 33.6 253 39.2 251 38.0 234 33.3 Ebeye 98 19.6 100 15.5 141 21.3 100 14.2 All Others 234 46.8 293 45.3 269 40.7 369 52.5 Total 500 100.0 646 100.0 661 100.0 703 100.0 Source: Ministry of Education
Figure 3.10 Teachers in Primary Schools By Area
050
100150200250300350400
1990-91 1995-96 2000-01 2002-03
Year
No.
of T
each
ers
MajuroEbeyeOthers
Table 3.13 RMI Pacific Islands Literacy Level(Grade 4) Percent Students 'At Risk', 1994-2002.
Subject 1994 1995 1996 1997 1998 1999 2002 English 74 70 72 65 69 72 57 Marshallese 72 61 63 68 76 66 49 Numeracy 51 54 52 53 66 75 73
* This Test could not be administered during 2000 and 2001 Source: Ministry of Education
Figure 3.11 Grade 4 Test:Students 'At Risk'
0
10
20
30
40
50
60
70
80
1994 1995 1996 1997 1998 1999 2002
Year
Perc
ent S
tude
nt
English Marshallese Numeracy

RMI Statistical Yearbook, 2002
Economic Policy, Planning and Statistics Office 97
Table 3.14 RMI Pacific Islands Literacy Levels (Grade 4), Percent 'At Risk', Boys and Girls, 1994 and 2002
Subject 1994 2002 Boys Girls Boys Girls
English 74.7 71.1 61.2 53.0 Marshallese 76.1 67.7 51.8 45.1 Numeracy 52.8 48.3 73.8 72.6
Source: Ministry of Education
Table 3.15 Public and Private Secondary Schools, Teachers and Students in Different Atolls in 2002-03
Atoll Public Private Schools Teachers Students Schools Teachers Students
Boys Girls Total Boys Girls Total Ailinglaplap 0 0 0 0 0 1 4 41 40 81
Jaluit 1 21 164 174 338 0 0 0 0 0 Kwajalein 0 0 0 0 0 5 43 330 385 715
Majuro 1 52 432 424 856 7 72 451 455 911 Wotje 1 14 124 127 251 0 0 0 0 0 Total 3 87 720 725 1,445 13 115 822 880 1,702
Source: Ministry of Education
Table 3.16 RMI Pacific Islands literacy levels (Grade 4) percent 'At Risk', public & private school in 1998-2000
1994 2002 Subject Public Schools Private Schools Public Schools Private Schools
English 83 45 64 34 Marshalles 74 61 50 44 Numeracy 57 30 80 50 Source: Ministry of Education
Table 3.17 Number of Secondary Schools by Area in RMI, 1990-91, 1995-96, 2000-01 and 2002-03
Area 1990-91 1995-96 2000-01 2002-03 No. Percent No. Percent No. Percent No. Percent
Majuro 5 62.5 7 53.8 8 50.0 8 50.0 Ebeye 2 25.0 3 23.1 5 31.3 5 31.3 All others 1 12.5 3 23.1 3 18.7 3 18.7 Total 8 100.0 13 100.0 16 100.0 16 100.0
Source: Ministry of Education
Girls performed better than boys in all three subjects tested during grade 4

RMI Statistical Yearbook, 2002
Economic Policy, Planning and Statistics Office 98
Table 3.18 Teacher-School Ratios by Area in RMI in Primary and Secondary Schools, 1990-91, 1995-96, 2000-01 and 2002-03 Area 1990-91 1995-96 2000-01 2002-03 Primary Secondary Primary Secondary Primary Secondary Primary Secondary Majuro 10.5 22.2 12.3 13.0 13.2 10.9 12.3 15.0 Ebeye 16.3 9.5 16.7 12.7 20.1 6.6 16.7 8.6 All Others 3.2 17.0 3.8 7.7 3.5 10.0 5.0 13.0 Total 5.2 18.4 6.3 11.7 6.5 9.5 7.1 12.6 Ratio=No. of Teachers divided by No. of Schools Source: Ministry of Education
Table 3.19 Teacher-School and Teacher-Student Ratios in Secondary Schools by Type of Management in RMI,1990-91, 1995-96, 2000-01 and 2002-03
Public Schools Private Schools Teacher- Student- Teacher- Student-
No. of No. of No. of School Teacher No. of No. of No. of School Teacher Year
schools teachers students Ratio Ratio schools teachers students Ratio Ratio 1990-91 2 63 867 31.5 13.8 6 84 1,143 14.0 13.6 1995-96 2 65 978 32.5 15.1 8 90 1,442 11.3 16.0 2000-01 3 66 1,380 22.0 20.9 13 95 1,473 7.3 15.5 2002-03 3 87 1,445 29.0 16.6 13 115 1,702 8.9 14.8 Source: Ministry of Education
Table 3.20 Students Appeared and Qualified for Admission into Secondary Schools
Year Number Appeared for Test No. Qualified for Admission Majuro Ebeye All others Total Majuro Ebeye All Others Total
1990-91 468 141 494 1103 205 54 131 390 1995-96 528 173 611 1312 181 74 171 427 2000-01 556 224 598 1378 240 54 195 489 2001-02 584 175 626 1385 207 32 201 440 2002-03 554 164 609 1327 264 46 235 545
Source: High School Test Administered by the Ministry of Education
Table 3.21 Students Appeared and Qualified for Admission into Secondary Schools in RMI by Sex 2000-01 and 2002-03 Year Number Appeared Total No. Qualified Total
Male Female Male Female 2000-01 659 719 1378 250 239 489 2001-02 674 711 1385 199 241 440 2002-03 658 669 1327 264 281 545
Source: High School Entrance Test Administered by the Ministry of Education

RMI Statistical Yearbook, 2002
Economic Policy, Planning and Statistics Office 99
Table 3.22 Performance in RMI High School Entrance Test 2003 By Schools Name of School Avg WS Rank No. Tested No. Qualified Pass % Likiep Elementary 66.5 1 18 18 100.0 Woja(A) Elementary 65.3 1 19 19 100.0 Coop 61.6 1 19 19 100.0 St. Thomas 58.4 1 8 8 100.0 Mejatto Elementary 57.7 1 17 17 100.0 Enejelaar Elementary 57.0 1 1 1 100.0 St. Paul 56.0 1 7 7 100.0 Woja SDA 45.1 1 3 3 100.0 Jabnoden 41.6 1 1 1 100.0 Assumption 60.4 2 31 29 93.5 Woja(Majuro)Elementary 55.0 3 13 12 92.3 Delap SDA 57.3 4 24 21 87.5 Ebeye SDA 56.3 4 16 14 87.5 Ailuk Elementary 39.9 5 15 13 86.7 Laura Elementary 47.8 6 40 34 85.0 Imiej Elementary 42.3 7 10 8 80.0 Jebal Elementary 40.7 7 5 4 80.0 Majkon Elementary 41.1 8 9 7 77.8 St. Joseph 51.6 9 8 6 75.0 Buoj Elementary 38.7 9 4 3 75.0 Utrik Elementary 37.1 9 4 3 75.0 Tobal Elementary 36.2 9 4 3 75.0 Enewetak Elementary 49.9 10 14 9 64.3 Queen of Peace 44.3 11 20 12 60.0 Ebon Elementary 38.0 12 17 10 58.8 Jabor Elementary 38.6 13 21 11 52.4 Mejit Elementary 35.5 14 35 19 51.4 Delap Calvary 41.7 15 2 1 50.0 Japo Elementary 41.3 15 4 2 50.0 Tarawa Elementary 33.4 15 6 3 50.0 Jabro Pvt. School 39.5 16 11 5 45.5 Namdrik Elementary 37.0 17 38 17 44.7 Ajeltake Elementary 37.3 18 24 10 41.7 Loen Elementary 35.9 19 5 2 40.0 Majuro Middle School 38.9 20 301 115 38.2 Wotje Elementary 34.5 21 23 8 34.8 Rita Christian 42.7 22 9 3 33.3

RMI Statistical Yearbook, 2002
Economic Policy, Planning and Statistics Office 100
Performance in RMI High School Entrance Test 2003 By Schools (continuation) Name of School Avg WS Rank No. Tested No. Qualified Pass % Mejel Elementary 32.2 22 3 1 33.3 Airok(M) Elementary 29.9 22 12 4 33.3 Tokewa Elementary 37.7 23 7 2 28.6 Laura SDA 35.8 23 7 4 28.6 Kili Elementary 32.5 23 14 4 28.6 Kilange Elementary 37.6 24 4 1 25.0 Toka Elementary 33.1 24 16 4 25.0 Tutu Elementary 32.3 24 4 1 25.0 Wodmeej Elementary 30.7 24 8 2 25.0 Ine Elementary 37.9 25 13 3 23.1 Nallo Elementary 30.3 26 5 1 20.0 Enhancement School 33.3 27 72 16 22.2 Kaven Elementary 27.8 28 17 3 17.6 Ebeye Public 29.4 29 80 12 15.0 Mae Elementary 30.2 30 8 1 12.5 Aerok(A) Elementary 31.7 31 17 2 11.8 Ulien Elementary 32.7 32 10 1 10.0 Jaluit Elementary 29.3 32 10 1 10.0 Ebeye Calvary 23.0 33 37 3 8.1 Jeh Elementary 30.3 34 17 1 5.9 Lae Elementary 23.6 35 26 1 3.8 Enejet Elementary 37.4 36 2 0 0.0 Enewa Elementary 30.1 36 3 0 0.0 Lukoj Elementary 29.8 36 2 0 0.0 Mili Elementary 29.5 36 17 0 0.0 Jeh SDA 29.5 36 2 0 0.0 Namej Elementary 28.2 36 4 0 0.0 Jabat Elementary 27.4 36 3 0 0.0 Namu Elementary 27.4 36 12 0 0.0 Ollet Elementary 27.1 36 2 0 0.0 Imroj Elementary 26.9 36 8 0 0.0 Bikarej Elementary 26.9 36 5 0 0.0 Aur Elementary 26.5 36 2 0 0.0 Lib Elementary 25.7 36 5 0 0.0 Longar Elementary 25.1 36 2 0 0.0 Jang Elementary 23.2 36 4 0 0.0 Amo Elementary 23.2 36 11 0 0.0 Wotto Elementary 22.7 36 6 0 0.0 Melang Elementary 22.1 36 1 0 0.0 Ujae Elementary 20.9 36 17 0 0.0 Uliga Protestsant 20.1 36 12 0 0.0 Eniburr Elementary 19.8 36 6 0 0.0 Carlos Elementary 16.6 36 4 0 0.0 Ebadon Elementary 15.2 36 4 0 0.0 Total 1327 545 41.1 Source: Ministry of Education

RMI Statistical Yearbook, 2002
Economic Policy, Planning and Statistics Office 101
Table 3.23 Total Enrollment in Primary and Secondary Schools by Grade and Sex, 2000-01, 2001-02 and 2002-03, RMI Year Primary Schools Secondary Schools Grand 1st 2nd 3rd 4th 5th 6th 7th 8th Total 9th 10th 11th 12th Total Total Both Sexes 1989/90 1,863 1,585 1,541 1,449 1,329 1,265 1,166 1,145 11,343 711 516 417 322 1,966 13,309 1991/91 1,782 1,493 1,525 1,430 1,358 1,183 1,132 1,078 10,981 673 652 459 359 2,143 13,124 1991/92 2,515 1,436 1,623 1,469 1,461 1,356 1,175 1,213 12,248 813 584 443 375 2,215 14,463 1992/93 1,996 1,766 1,452 1,624 1,513 1,400 1,306 1,180 12,237 854 622 511 390 2,377 14,614 1993/94 2,129 1,725 1,665 1,463 1,585 1,376 1,351 1,272 12,566 865 646 548 423 2,482 15,048 1994/95 1,993 1,894 1,683 1,679 1,446 1,521 1,339 1,332 12,887 893 614 464 429 2,400 15,287 1995/96 1,657 1,580 1,661 1,716 1,522 1,520 1,233 1,328 12,217 879 709 507 415 2,510 14,727 1996/97 1,657 1,578 1,658 1,715 1,519 1,516 1,292 1,326 12,261 879 713 507 415 2,514 14,775 1997/98 1,599 1,349 1,474 1,625 1,657 1,534 1,444 1,380 12,062 901 645 580 436 2,562 14,624 1998/99 1,435 1,389 1,536 1,499 1,614 1,576 1,436 1,582 12,067 963 702 504 498 2,667 14,734 1999/00 1,394 1,339 1,396 1,420 1,477 1,530 1,474 1,353 11,383 908 699 572 407 2,586 13,969 2000-01 1,433 1,241 1,273 1,389 1,420 1,478 1,439 1,430 11,103 968 787 625 473 2,853 13,956 2001-02 1,591 1,390 1,361 1,371 1,517 1,527 1,488 1,556 11,801 1,015 832 626 511 2,984 14,785 2002-03 1,504 1,287 1,286 1,242 1,039 1,244 1,322 1,317 10,241 1,032 850 704 556 3,242 13,388 Males 1989/90 972 839 778 726 688 700 556 553 5,812 346 269 212 154 981 6,793 1990/91 893 765 800 709 690 605 610 513 5,585 326 315 228 175 1,044 6,629 1991/92 1,324 744 874 789 748 693 590 632 6,394 399 268 222 191 1,080 7,474 1992/93 1,026 937 730 842 741 698 654 592 6,220 445 305 248 199 1,197 7,417 1993/94 1,106 875 860 751 794 700 708 620 6,414 443 314 259 208 1,224 7,638 1994/95 1,034 970 850 864 761 757 696 686 6,618 437 304 221 217 1,179 7,797 1995/96 851 846 836 869 769 778 610 633 6,192 452 338 242 227 1,259 7,451 1996/97 851 845 836 868 766 776 610 633 6,185 452 338 242 227 1,259 7,444 1997/98 851 606 782 822 861 799 759 689 6,169 462 309 280 200 1,251 7,420 1998/99 697 741 773 808 831 796 710 794 6,150 483 350 269 240 1,342 7,492 1999/00 732 697 757 730 778 779 742 663 5,878 434 339 294 214 1,281 7,159 2000-01 712 629 655 782 693 787 736 700 5,694 453 399 301 238 1,391 7,085 2001-02 835 727 720 721 873 762 792 774 6,204 506 413 303 265 1,487 7,691 2002-03 801 648 626 667 675 670 662 656 5,405 517 431 328 266 1,542 6,947 Females 1989/90 891 746 763 723 641 565 610 592 5,531 365 247 205 168 985 6,516 1990/91 889 728 725 721 668 578 522 565 5,396 347 337 231 184 1,099 6,495 1991/92 1,191 692 749 680 713 663 585 581 5,854 414 316 221 184 1,135 6,989 1992/93 970 829 722 782 772 702 652 588 6,017 409 317 263 191 1,180 7,197 1993/94 1,023 850 805 712 791 676 643 652 6,152 422 332 289 215 1,258 7,410 1994/95 959 924 833 815 685 764 643 646 6,269 456 310 243 212 1,221 7,490 1995/96 806 734 825 847 753 742 623 695 6,025 427 371 265 188 1,251 7,276 1996/97 806 733 822 847 753 740 682 693 6,076 427 375 265 188 1,255 7,331 1997/98 748 743 692 803 796 735 685 691 5,893 439 336 300 236 1,311 7,204 1998/99 738 648 763 691 783 780 726 788 5,917 480 352 235 258 1,325 7,242 1999/00 662 642 639 690 699 751 732 690 5,505 474 360 278 193 1,305 6,810 2000-01 721 612 655 782 698 787 736 700 5,691 515 388 324 235 1,462 7,153 2001-02 756 663 641 650 644 765 696 782 5,597 509 419 322 246 1,496 7,093 2002-03 703 639 660 575 591 574 660 661 5,063 515 419 376 290 1,600 6,663 Source: Ministry of Education/EPPSO
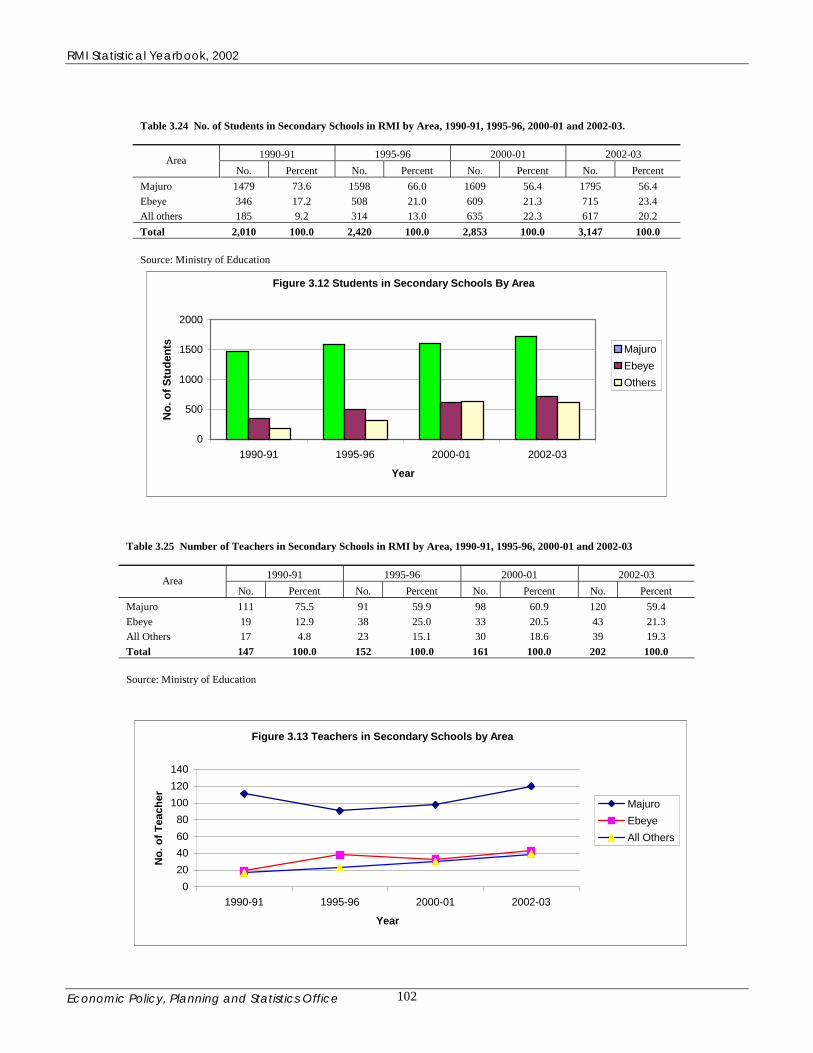
RMI Statistical Yearbook, 2002
Economic Policy, Planning and Statistics Office 102
Table 3.24 No. of Students in Secondary Schools in RMI by Area, 1990-91, 1995-96, 2000-01 and 2002-03.
1990-91 1995-96 2000-01 2002-03 Area No. Percent No. Percent No. Percent No. Percent
Majuro 1479 73.6 1598 66.0 1609 56.4 1795 56.4 Ebeye 346 17.2 508 21.0 609 21.3 715 23.4 All others 185 9.2 314 13.0 635 22.3 617 20.2 Total 2,010 100.0 2,420 100.0 2,853 100.0 3,147 100.0 Source: Ministry of Education
Figure 3.12 Students in Secondary Schools By Area
0
500
1000
1500
2000
1990-91 1995-96 2000-01 2002-03
Year
No.
of S
tude
nts
MajuroEbeyeOthers
Table 3.25 Number of Teachers in Secondary Schools in RMI by Area, 1990-91, 1995-96, 2000-01 and 2002-03
1990-91 1995-96 2000-01 2002-03 Area No. Percent No. Percent No. Percent No. Percent
Majuro 111 75.5 91 59.9 98 60.9 120 59.4 Ebeye 19 12.9 38 25.0 33 20.5 43 21.3 All Others 17 4.8 23 15.1 30 18.6 39 19.3 Total 147 100.0 152 100.0 161 100.0 202 100.0 Source: Ministry of Education
Figure 3.13 Teachers in Secondary Schools by Area
020406080
100120140
1990-91 1995-96 2000-01 2002-03
Year
No.
of T
each
er MajuroEbeyeAll Others
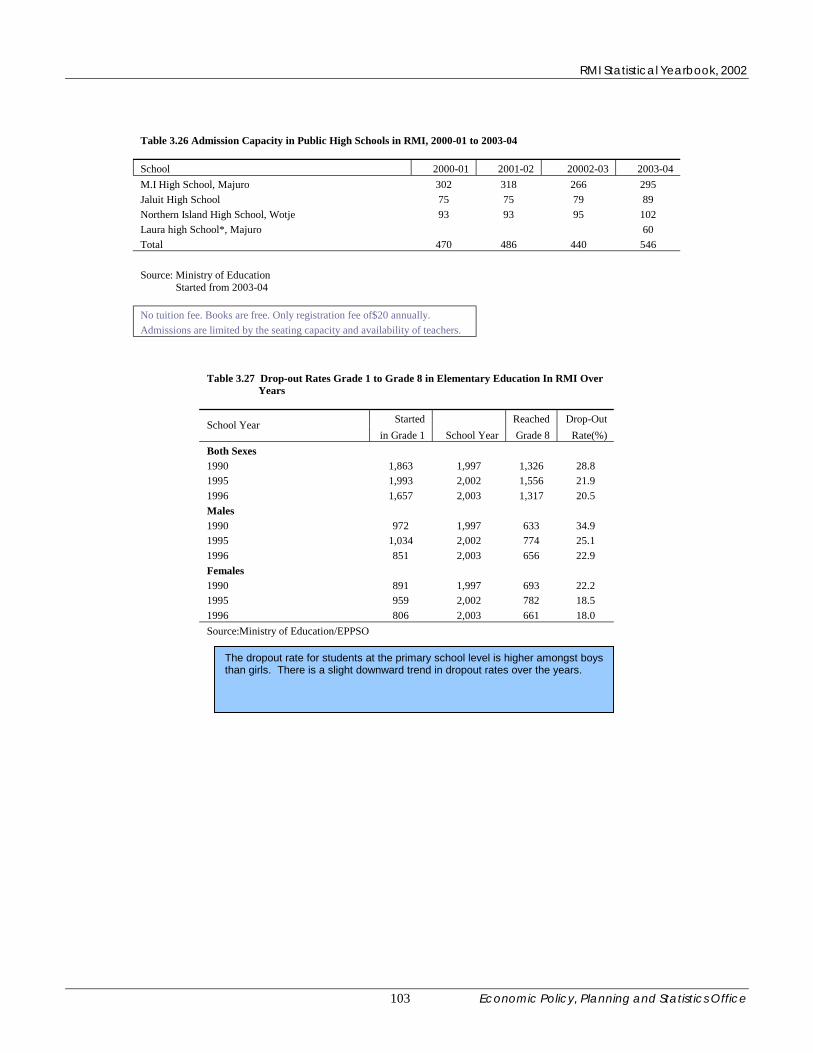
RMI Statistical Yearbook, 2002
Economic Policy, Planning and Statistics Office 103
Table 3.26 Admission Capacity in Public High Schools in RMI, 2000-01 to 2003-04 School 2000-01 2001-02 20002-03 2003-04 M.I High School, Majuro 302 318 266 295 Jaluit High School 75 75 79 89 Northern Island High School, Wotje 93 93 95 102 Laura high School*, Majuro 60 Total 470 486 440 546 Source: Ministry of Education Started from 2003-04
No tuition fee. Books are free. Only registration fee of$20 annually. Admissions are limited by the seating capacity and availability of teachers.
Table 3.27 Drop-out Rates Grade 1 to Grade 8 in Elementary Education In RMI Over Years
Started Reached Drop-Out School Year in Grade 1 School Year Grade 8 Rate(%)
Both Sexes 1990 1,863 1,997 1,326 28.8 1995 1,993 2,002 1,556 21.9 1996 1,657 2,003 1,317 20.5 Males 1990 972 1,997 633 34.9 1995 1,034 2,002 774 25.1 1996 851 2,003 656 22.9 Females 1990 891 1,997 693 22.2 1995 959 2,002 782 18.5 1996 806 2,003 661 18.0 Source:Ministry of Education/EPPSO
The dropout rate for students at the primary school level is higher amongst boys than girls. There is a slight downward trend in dropout rates over the years.

RMI Statistical Yearbook, 2002
Economic Policy, Planning and Statistics Office 104
Table 3.28 Drop-Out Rates Grade 9 to Grade 12 in High Schools in RMI Over Years School Year Started Reached Drop-Out in Grade 9 School Year Grade 12 Rate(%)
Both Sexes 1990 711 1993 390 45.1 1998 901 2001 473 47.5 1999 963 2002 511 46.9 2000 930 2003 536 38.8
Males 1990 346 1993 199 42.5 1998 462 2001 238 48.5 1999 483 2002 265 45.1 2000 434 2003 266 38.7
Females 1990 365 1993 191 47.7 1998 439 2001 235 46.5 1999 480 2002 246 48.8 2000 474 2003 270 43.0
Source: Ministry of Education/EPPSO
Table 3.29 Drop-out Rates Grade 1 to Grade 12 in RMI Schools Over Years School year Started in School Year Reached Drop-Out Grade 1 School Year Grade 12 Rate(%) Both Sexes 1990 1,863 2,001 473 75 1991 1,782 2,002 511 71 1992 2515* 2,003 556 78 Males 1990 972 2,001 238 76 1991 893 2,002 265 70 1992 1,324 2,003 266 80 Females 1990 891 2,001 235 74 1991 889 2,002 246 72 1992 1,191 2,003 290 76 * Appears to be wrong figure Source: Ministry of Education/EPPSO
Dropout rate in grade 9 to grade 12 has also registered a decline, but it is still a serous problem. Only 61.3% of boys and 57% of girls who started 9th grade in 2000 could reach the 12th grade in 2003.
Though, the dropout rate from grade 1 to grade 12 is showing signs of decline,this rate is still very high, Only 20% of the girls who started grade 1 in 1992 couldreach grade 12 in 2003.

RMI Statistical Yearbook, 2002
Economic Policy, Planning and Statistics Office 105
Table 3.30 Number of Students Enrolled and Number Passed Out under the Preliminary and Foundation Courses in the RMI-USP Joint Education Programme, by Sex, 1996-2002
Year Students Enrolled Students Passed out Pass Percentage Male Female Total Male Female Total Male Female Total
1996 39 32 71 23 13 36 59 41 51 1997 47 31 78 29 19 48 62 61 62 1998 48 44 92 28 13 41 58 30 45 1999 28 26 54 15 14 29 54 54 54 2000 28 37 65 16 20 36 57 54 55 2001 19 30 49 15 22 37 79 73 76 2002 37 33 70 30 28 58 81 85 83
Source: Centre For RMI-USP Joint Education Programme, Majuro Note: Academic Year is from January to November
Figure 3.14 Result of Male Students for Preliminary and Foundation Courses
0
10
20
30
40
50
1996 1997 1998 1999 2000 2001 2002
Years
Num
ber
Enrolled
Passed
Figure 3.15 Result of Female Students for Preliminary and Foundation Courses
0
510
1520
253035
4045
50
1996 1997 1998 1999 2000 2001 2002Years
Num
ber
Enrolled
Passed
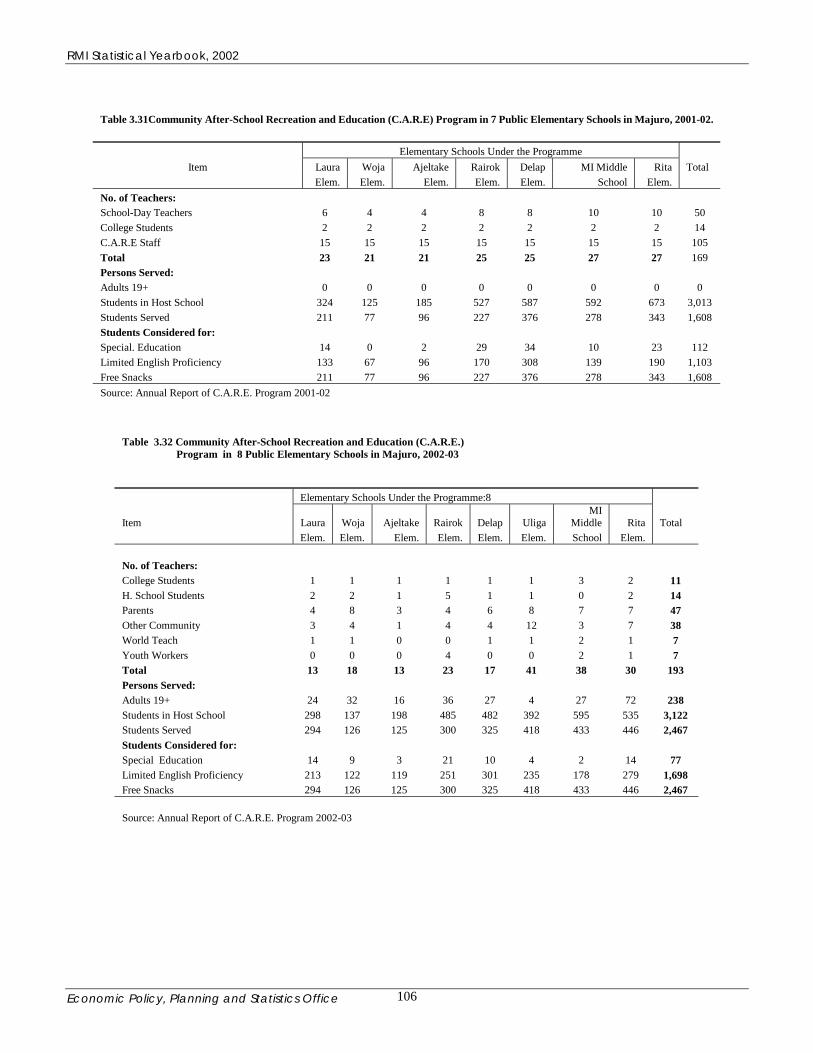
RMI Statistical Yearbook, 2002
Economic Policy, Planning and Statistics Office 106
Table 3.31Community After-School Recreation and Education (C.A.R.E) Program in 7 Public Elementary Schools in Majuro, 2001-02. Elementary Schools Under the Programme
Item Laura Woja Ajeltake Rairok Delap MI Middle Rita Total Elem. Elem. Elem. Elem. Elem. School Elem. No. of Teachers: School-Day Teachers 6 4 4 8 8 10 10 50 College Students 2 2 2 2 2 2 2 14 C.A.R.E Staff 15 15 15 15 15 15 15 105 Total 23 21 21 25 25 27 27 169 Persons Served: Adults 19+ 0 0 0 0 0 0 0 0 Students in Host School 324 125 185 527 587 592 673 3,013 Students Served 211 77 96 227 376 278 343 1,608 Students Considered for: Special. Education 14 0 2 29 34 10 23 112 Limited English Proficiency 133 67 96 170 308 139 190 1,103 Free Snacks 211 77 96 227 376 278 343 1,608 Source: Annual Report of C.A.R.E. Program 2001-02
Table 3.32 Community After-School Recreation and Education (C.A.R.E.) Program in 8 Public Elementary Schools in Majuro, 2002-03 Elementary Schools Under the Programme:8
Item Laura Woja Ajeltake Rairok Delap Uliga MI
Middle Rita Total Elem. Elem. Elem. Elem. Elem. Elem. School Elem. No. of Teachers: College Students 1 1 1 1 1 1 3 2 11 H. School Students 2 2 1 5 1 1 0 2 14 Parents 4 8 3 4 6 8 7 7 47 Other Community 3 4 1 4 4 12 3 7 38 World Teach 1 1 0 0 1 1 2 1 7 Youth Workers 0 0 0 4 0 0 2 1 7 Total 13 18 13 23 17 41 38 30 193 Persons Served: Adults 19+ 24 32 16 36 27 4 27 72 238 Students in Host School 298 137 198 485 482 392 595 535 3,122 Students Served 294 126 125 300 325 418 433 446 2,467 Students Considered for: Special Education 14 9 3 21 10 4 2 14 77 Limited English Proficiency 213 122 119 251 301 235 178 279 1,698 Free Snacks 294 126 125 300 325 418 433 446 2,467 Source: Annual Report of C.A.R.E. Program 2002-03

RMI Statistical Yearbook, 2002
Economic Policy, Planning and Statistics Office 107
Table 3.33 Number Enrolled and Number Graduated in Various Associate Degree Courses from the College of Marshall Islands by Sex cumulative upto 2002-03
Name of Period of Number Enrolled Number Graduated Pass Percentage Course Study Male Female Total Male Female Total Male Female Total Accounting 95/96-2001/02 111 81 192 7 8 15 6.3 9.9 7.8 Business Administration 2001/02-02/03 238 254 492 18 15 33 7.6 5.9 6.7 Computer Sc. 95/96-2001/02 263 222 485 30 10 40 11.4 4.5 8.2 Engineering (Arch.) 96/97-2002/03 128 0 128 19 0 19 14.8 0 14.8 Education 95/96-2002/03 445 371 816 89 42 131 20 11.3 16.1 Liberal Arts 95/96-2002/03 572 471 1043 49 46 95 8.6 14.6 9.1 Management 95/96-2001/02 70 40 110 11 3 14 15.7 7.5 12.7 Nursing 95/96-2002/03 321 454 775 25 46 71 7.8 10.1 9.2 Office Administration. 96/97-2001-02 0 33 33 0 8 8 0 24.2 24.2 All Nine Courses Up to 2002-03 2148 1926 4074 248 178 426 11.5 9.2 10.5 Source: The College of Marshall Islands
Table 3.34 Number Enrolled and Number Graduated in Architecture from the College of Marshall Islands by Year and Sex, 1995-96 to 2002-03.
Number Enrolled Number Graduated Pass Percentage Year Male Female * Total Male Female * Total Male Female * Total
1995-96 0 0 0 0 0 0 0 0 0 1996-97 17 0 17 2 0 2 11.8 0 11.8 1997-98 25 0 25 2 0 2 8.0 0 8.0 1998-99 28 0 28 1 0 1 3.6 0 3.6 1999-00 27 0 27 4 0 4 14.8 0 14.8 2000-01 23 0 23 2 0 2 8.7 0 8.7 2001-02 4 0 4 4 0 4 100.0 0 100.0 2002-03 4 0 4 4 0 4 100.0 0 100.0 Total 128 0 128 19 0 19 14.8 0 14.8 * There was no female enrollment for this course Source: The College of Marshall Islands
Fig. 3.16 Male Students Enrolled and Graduated in Architecture
0
5
10
15
20
25
30
1995-96 1996-97 1997-98 1998-99 1999-00 2000-01 2001-02 2002-03
Years
Num
ber o
f stu
dent
s
Enrolled Passed
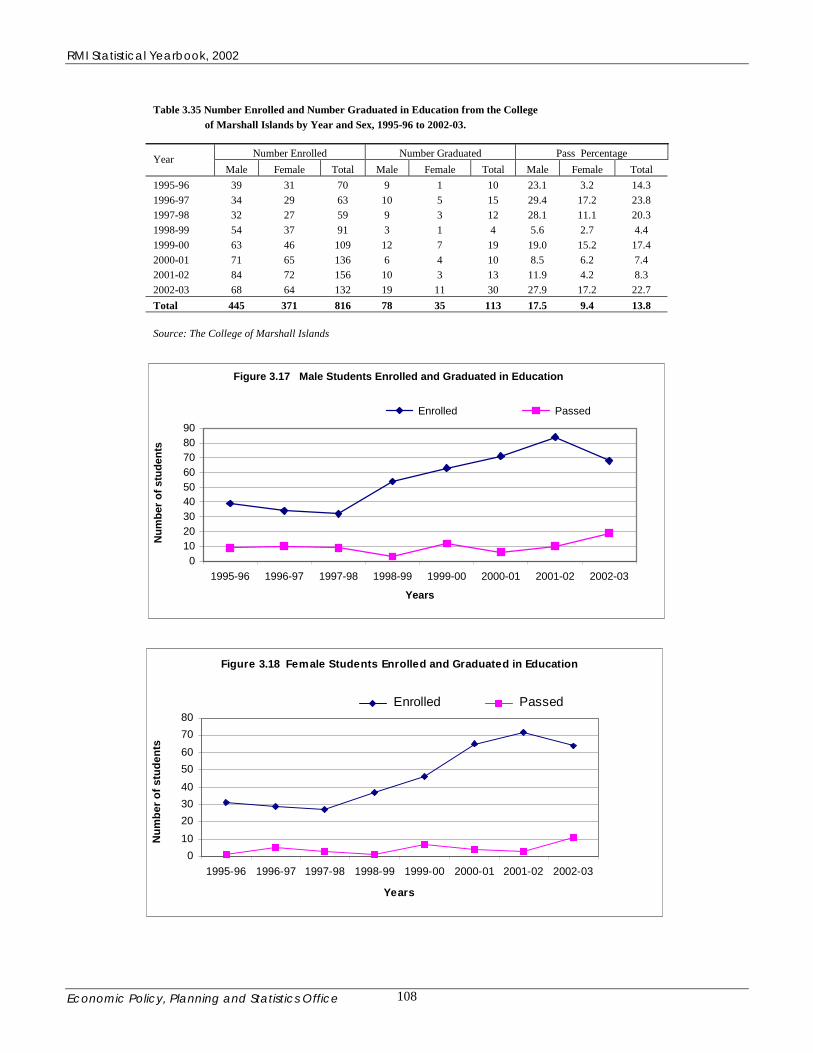
RMI Statistical Yearbook, 2002
Economic Policy, Planning and Statistics Office 108
Table 3.35 Number Enrolled and Number Graduated in Education from the College of Marshall Islands by Year and Sex, 1995-96 to 2002-03.
Number Enrolled Number Graduated Pass Percentage Year Male Female Total Male Female Total Male Female Total
1995-96 39 31 70 9 1 10 23.1 3.2 14.3 1996-97 34 29 63 10 5 15 29.4 17.2 23.8 1997-98 32 27 59 9 3 12 28.1 11.1 20.3 1998-99 54 37 91 3 1 4 5.6 2.7 4.4 1999-00 63 46 109 12 7 19 19.0 15.2 17.4 2000-01 71 65 136 6 4 10 8.5 6.2 7.4 2001-02 84 72 156 10 3 13 11.9 4.2 8.3 2002-03 68 64 132 19 11 30 27.9 17.2 22.7 Total 445 371 816 78 35 113 17.5 9.4 13.8 Source: The College of Marshall Islands
Figure 3.17 Male Students Enrolled and Graduated in Education
0102030405060708090
1995-96 1996-97 1997-98 1998-99 1999-00 2000-01 2001-02 2002-03
Years
Num
ber o
f stu
dent
s
Enrolled Passed
Figure 3.18 Female Students Enrolled and Graduated in Education
01020304050607080
1995-96 1996-97 1997-98 1998-99 1999-00 2000-01 2001-02 2002-03
Years
Num
ber o
f stu
dent
s
Enrolled Passed

RMI Statistical Yearbook, 2002
Economic Policy, Planning and Statistics Office 109
Table 3.36 Number Enrolled and Number Graduated in Office Administration from the College of the Marshall Islands by Year and Sex, 1995-96 to 2002-03
Number Enrolled Number Graduated Pass Percentage Male Female Total Male Female Total Male Female Total
1995-96 0 0 0 0 0 0 0 0 0 1996-97 0 9 9 0 1 1 0 11.1 11.1 1997-98 0 13 13 0 3 3 0 23.1 23.1 1998-99 0 10 10 0 3 3 0 30.0 30.0 1999-00 0 0 0 0 0 0 0 0 0 2000-01 0 0 0 0 0 0 0 0 0 2001-02 0 1 1 0 1 1 0 100.0 100.0 2002-03 0 0 0 0 0 0 0 0 0 Total 0 33 33 0 8 8 0 24.2 24.2 Source: The College of Marshall Islands
Figure 3.19 Result of Male Students Graduated in Office Adminstration
02468
101214
1995-96 1996-97 1997-98 1998-99 1999-00 2000-01 2001-02 2002-03
Years
Num
ber o
f stu
dent
s
Enrolled Passed

RMI Statistical Yearbook, 2002
Economic Policy, Planning and Statistics Office 110
Table 3.37 Number Enrolled and Number Graduated in Computer Science from the College of Marshall Islands by Year and Sex, 1995-96 to 2002-03.
Number Enrolled Number Graduated Pass Percentage Year Male Female Total Male Female Total Male Female Total
1995-96 20 14 34 0 0 0 0.0 0.0 0.0 1996-97 34 27 61 1 2 3 2.9 7.4 4.9 1997-98 45 40 85 1 1 2 2.2 7.4 4.9 1998-99 58 52 110 10 1 11 17.2 1.9 10.0 1999-00 40 47 87 4 3 7 10.0 6.4 8.0 2000-01 37 32 69 1 1 2 2.7 3.1 2.9 2001-02 29 10 39 13 2 15 44.8 20.0 38.5 2002-03* 0 0 0 0 0 0 0.0 0.0 0.0 Total 263 222 485 30 10 40 11.4 4.5 8.2 * This course as such has been discontinued and now form a part of "Business Administration and Management. Source: The College of Marshall Islands
Fig. 3.20 Male Students Enrolled and Graduated in Computer Science
010203040506070
1995-96 1996-97 1997-98 1998-99 1999-00 2000-01 2001-02 2002-03*
Years
Num
ber o
f stu
dent
s
Enrolled Passed
Fig. 3.21 Female Students Enrolled and Graduated in Computer Science
0
10
20
30
40
50
60
1995-96 1996-97 1997-98 1998-99 1999-00 2000-01 2001-02 2002-03*
Years
Num
ber o
f stu
dent
s
Enrolled Passed
2`

RMI Statistical Yearbook, 2002
Economic Policy, Planning and Statistics Office 111
Table 3.38 Number Enrolled and Number Graduated in Business Management from the College of Marshall Islands by Year and Sex, 1995-96 to 2002-03.
Number Enrolled Number Graduated Pass Percentage Year Male Female Total Male Female Total Male Female Total
2000-01 57 49 106 5 3 8 8.8 6.1 7.5 2001-02 64 106 170 1 5 6 1.6 4.7 3.5 2002-03* 117 99 216 12 7 19 10.3 7.1 8.8 Total 238 254 492 18 15 33 7.6 5.9 6.7 Source: The College of Marshall Islands Note: The Course started in 2000-01 and from the year 2002-03, it has been named as "Business Administration and Management." The courses of Accounting and Computing are also are part of this course now.
Fig. 3.23 Female Students Enrolled and Graduated in Business Management
020406080
100120
2000-01 2001-02 2002-03*
Years
Num
ber o
f stu
dent
s
Enrolled Passed
Fig. 3.22 Male Students Enrolled andGraduated in Business Management
020406080
100120140
2000-01 2001-02 2002-03*
Years
Num
ber o
f stu
dent
s
Enrolled Passed

RMI Statistical Yearbook, 2002
Economic Policy, Planning and Statistics Office 112
Table 3.39 Number Enrolled and Number Graduated in Management from the College of Marshall Islands by Year and Sex, 1995-96 to 2002-03.
Number Enrolled Number Graduated Pass Percentage Year Male Female Total Male Female Total Male Female Total
1995-96 0 0 0 0 0 0 0.0 0.0 0.0 1996-97 6 5 11 2 1 3 33.3 20.0 27.3 1997-98 22 11 33 2 0 2 9.1 0.0 6.1 1998-99 8 5 13 0 0 0 0.0 0.0 0.0 1999-00 13 11 24 4 1 5 30.8 9.1 20.8 2000-01 9 5 14 2 1 3 22.2 20.0 21.4 2001-02 12 3 15 1 0 1 8.3 0.0 6.7 2002-03* 0 0 0 0 0 0 0.0 0.0 0.0 Total 70 40 110 11 3 14 15.7 7.5 12.7 * This course as such discontinued and now form a part of "Business Administration and Management. Source: The College of Marshall Islands
Fig. 3.24 Male Students Enrolled and Graduated in Management
0
5
10
15
20
25
1995-96 1996-97 1997-98 1998-99 1999-00 2000-01 2001-02 2002-03*
Years
Num
ber o
f stu
dent
s
Enrolled Passed
Fig. 3.25 Female Students Enrolled and Graduated in Management
0
2
4
6
8
10
12
1995-96 1996-97 1997-98 1998-99 1999-00 2000-01 2001-02 2002-03*
Years
Num
ber o
f stu
dent
s
Enrolled Passed
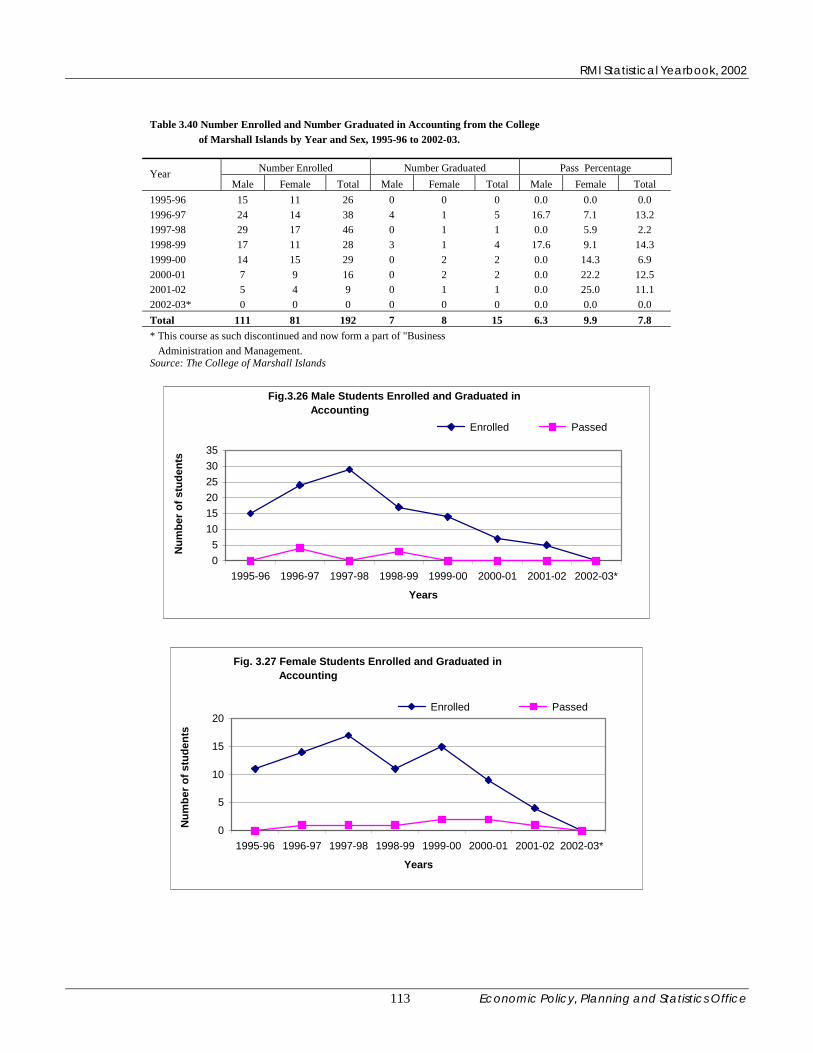
RMI Statistical Yearbook, 2002
Economic Policy, Planning and Statistics Office 113
Table 3.40 Number Enrolled and Number Graduated in Accounting from the College of Marshall Islands by Year and Sex, 1995-96 to 2002-03.
Number Enrolled Number Graduated Pass Percentage Year Male Female Total Male Female Total Male Female Total
1995-96 15 11 26 0 0 0 0.0 0.0 0.0 1996-97 24 14 38 4 1 5 16.7 7.1 13.2 1997-98 29 17 46 0 1 1 0.0 5.9 2.2 1998-99 17 11 28 3 1 4 17.6 9.1 14.3 1999-00 14 15 29 0 2 2 0.0 14.3 6.9 2000-01 7 9 16 0 2 2 0.0 22.2 12.5 2001-02 5 4 9 0 1 1 0.0 25.0 11.1 2002-03* 0 0 0 0 0 0 0.0 0.0 0.0 Total 111 81 192 7 8 15 6.3 9.9 7.8 * This course as such discontinued and now form a part of "Business Administration and Management. Source: The College of Marshall Islands
Fig.3.26 Male Students Enrolled and Graduated in Accounting
05
101520253035
1995-96 1996-97 1997-98 1998-99 1999-00 2000-01 2001-02 2002-03*
Years
Num
ber o
f stu
dent
s
Enrolled Passed
Fig. 3.27 Female Students Enrolled and Graduated in Accounting
0
5
10
15
20
1995-96 1996-97 1997-98 1998-99 1999-00 2000-01 2001-02 2002-03*
Years
Num
ber o
f stu
dent
s
Enrolled Passed
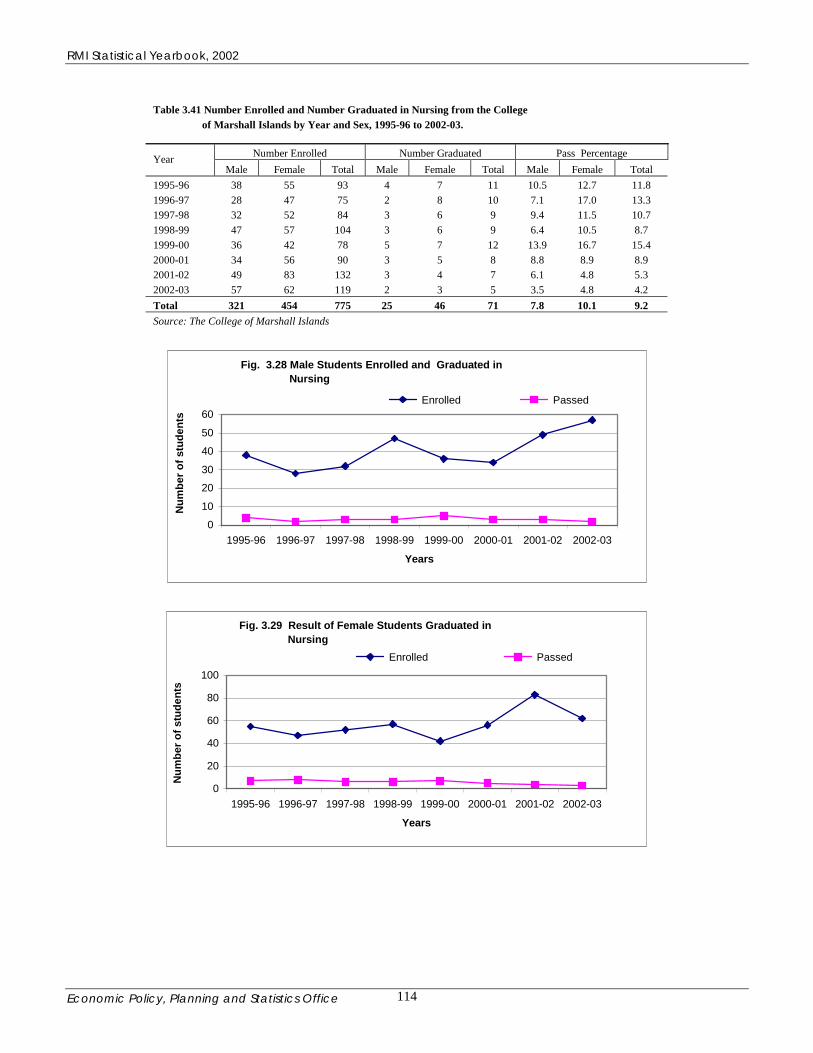
RMI Statistical Yearbook, 2002
Economic Policy, Planning and Statistics Office 114
Table 3.41 Number Enrolled and Number Graduated in Nursing from the College of Marshall Islands by Year and Sex, 1995-96 to 2002-03.
Number Enrolled Number Graduated Pass Percentage Year Male Female Total Male Female Total Male Female Total
1995-96 38 55 93 4 7 11 10.5 12.7 11.8 1996-97 28 47 75 2 8 10 7.1 17.0 13.3 1997-98 32 52 84 3 6 9 9.4 11.5 10.7 1998-99 47 57 104 3 6 9 6.4 10.5 8.7 1999-00 36 42 78 5 7 12 13.9 16.7 15.4 2000-01 34 56 90 3 5 8 8.8 8.9 8.9 2001-02 49 83 132 3 4 7 6.1 4.8 5.3 2002-03 57 62 119 2 3 5 3.5 4.8 4.2 Total 321 454 775 25 46 71 7.8 10.1 9.2 Source: The College of Marshall Islands
Fig. 3.28 Male Students Enrolled and Graduated in Nursing
0
10
2030
40
50
60
1995-96 1996-97 1997-98 1998-99 1999-00 2000-01 2001-02 2002-03
Years
Num
ber o
f stu
dent
s
Enrolled Passed
Fig. 3.29 Result of Female Students Graduated in Nursing
0
20
40
60
80
100
1995-96 1996-97 1997-98 1998-99 1999-00 2000-01 2001-02 2002-03
Years
Num
ber o
f stu
dent
s
Enrolled Passed

RMI Statistical Yearbook, 2002
Economic Policy, Planning and Statistics Office 115
Table 3.42 Number Enrolled and Number Graduated in Liberal Arts from the College of Marshall Islands by Year and Sex, 1995-96 to 2002-03.
Number Enrolled Number Graduated Pass Percentage Year Male Female Total Male Female Total Male Female Total
1995-96 41 32 73 4 3 7 9.8 9.4 9.6 1996-97 48 37 85 7 6 13 14.6 16.2 15.3 1997-98 48 45 93 3 2 5 6.3 4.4 5.4 1998-99 68 54 122 4 5 9 5.9 9.3 7.4 1999-00 81 62 143 4 2 6 4.9 3.2 4.2 2000-01 97 72 169 9 4 13 9.3 5.6 7.7 2001-02 93 88 181 8 13 21 8.6 14.8 11.6 2002-03 96 81 177 10 11 21 10.4 13.6 11.9 Total 572 471 1,043 49 46 95 8.6 14.6 9.1 Source: The College of Marshall Islands
Fig.3.30 Male Students Enrolled and Graduated in Liberal Arts
020
406080
100120
1995-96 1996-97 1997-98 1998-99 1999-00 2000-01 2001-02 2002-03
Years
Num
ber o
f stu
dent
s
Enrolled Passed
Fig. 3.31 Result of Female Students Graduated in Liberal Arts
0
20
40
60
80
100
1995-96 1996-97 1997-98 1998-99 1999-00 2000-01 2001-02 2002-03
Years
Num
ber o
f stu
dent
s
Enrolled Passed

RMI Statistical Yearbook, 2002
Economic Policy, Planning and Statistics Office 116
Table 3.43 Scholarship Holders by Sex in RMI,1995/96-2002/03
Year Male Female Total 1995-96 77 58 135 1996-97 95 89 184 1997-98 69 78 147 1998-99 57 57 114 1999-00 65 74 139 2000-01 96 75 171 2001-02 69 51 120 2002-03 60 77 137 Source: National Scholarship Office, Ministry of Education
Fig. 3.32 Scholarship Holders By Sex and Year
0
20
4060
80
100
120
1995-96 1996-97 1997-98 1998-99 1999-00 2000-01 2001-02 2002-03
Year
No.
of S
tude
nts
Male Female
Table 3.44 RMI Scholarship Programme, 1988- 1999 Item Data Total Compact Funds $6,818,266 Total RMI General Funds $529,452 Grand Total of Funds $7,344,718 No. of Scholarship Recipients 1,614 Average Cost Per Recipient $4,551 No. who completed programme 245 Cost per completer $29,978 Source: Marshall Islands Scholarship Office
1,614 persons were awarded scholarships to complete various levels of programs at different educational institutions/universities within and outside RMI from 1988-99, involving $7,344,718. Out of which, only 245 completed their programs, Cost per Completer was $29,978.

RMI Statistical Yearbook, 2002
Economic Policy, Planning and Statistics Office 117
Table 3.45 Post Secondary Scholarships Awarded in RMI, 2000-01
Item Data Total Compact Funds $727,000 Total RMI Funds $200,000 Grand Total $927,000 No. of Scholarship recipients 175 No. enroll in CMI 45 No. studying abroad 130 No. graduated in 2000-01 18 Average cost per recipient $5,297 Source: Marshall Islands Scholarship Office
Table 3.46 Percentage Adults (25+) with Bachelor level Education in selected Pacific Countries, 2000 % with Bachelor Level Country Education Guam 20.0 CNMI 15.5 A.Samoa 7.4 Palau 10.0 FSM 3.6 RMI 2.7 Source: IPC Statistical Enhancement Program, US Census Bureau
0
5
10
15
20
perc
enta
ge
Guam CNMI A.Samoa Palau FSM RMI
Country
Figure 3.33 Percentage of 25+ with Bachelor level Education in Selected Pacific Countries, 2000
Percentage of 25+ having a Bachelor's level Education in the Marshall Islands was 2.7 in the 2000, the lowest in the pacific region.

RMI Statistical Yearbook, 2002
Economic Policy, Planning and Statistics Office 118
Table 3.47 Percentage of Adults(25+) completed High School Education in South pacific Countries, 2000 Percent with Country high school education Guam 76.3 CNMI 69.2 A.Samoa 66.1 Palau 74.1 FSM 37.4 RMI 39.6 Source: IPC Statistical Enhancement Program, US Census Bureau
01020304050607080
perc
ent
Guam CNMI A.Samoa Palau FSM RMI
country
Figure 3.34 Percentage of 25+ having high school education in selected pacific countries, 2000
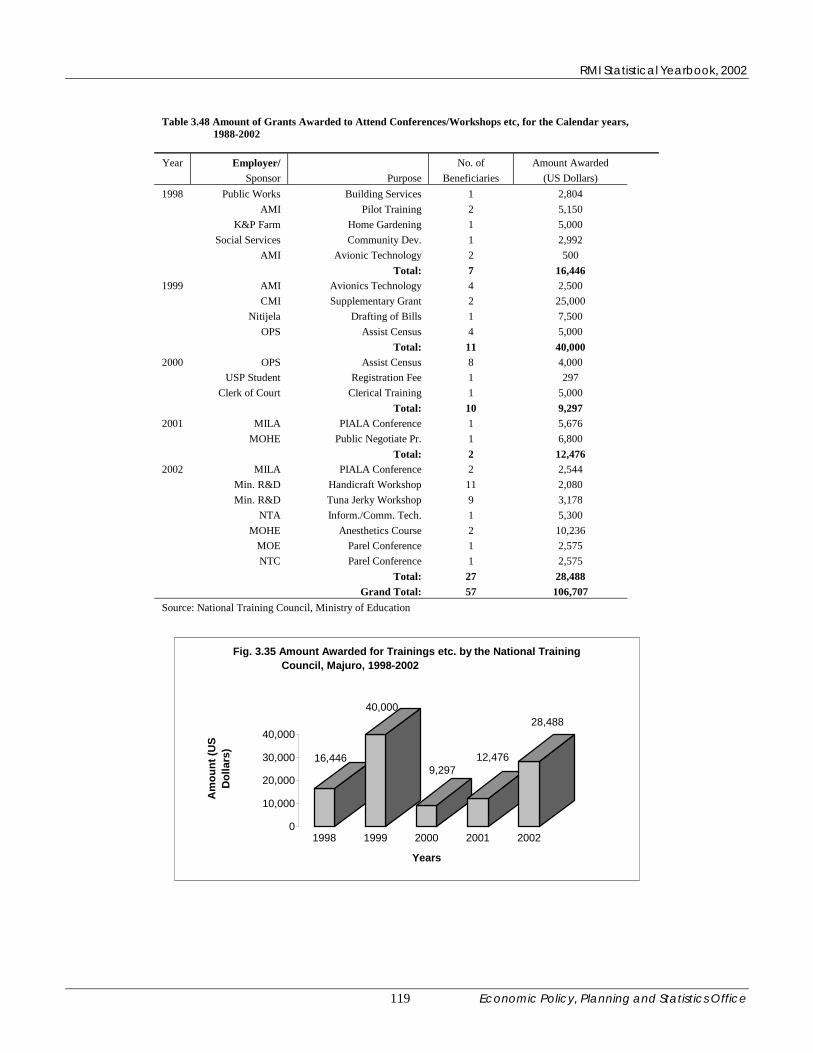
RMI Statistical Yearbook, 2002
Economic Policy, Planning and Statistics Office 119
Table 3.48 Amount of Grants Awarded to Attend Conferences/Workshops etc, for the Calendar years, 1988-2002 Year Employer/ No. of Amount Awarded
Sponsor Purpose Beneficiaries (US Dollars) 1998 Public Works Building Services 1 2,804
AMI Pilot Training 2 5,150 K&P Farm Home Gardening 1 5,000 Social Services Community Dev. 1 2,992 AMI Avionic Technology 2 500 Total: 7 16,446
1999 AMI Avionics Technology 4 2,500 CMI Supplementary Grant 2 25,000 Nitijela Drafting of Bills 1 7,500 OPS Assist Census 4 5,000 Total: 11 40,000
2000 OPS Assist Census 8 4,000 USP Student Registration Fee 1 297 Clerk of Court Clerical Training 1 5,000 Total: 10 9,297
2001 MILA PIALA Conference 1 5,676 MOHE Public Negotiate Pr. 1 6,800 Total: 2 12,476
2002 MILA PIALA Conference 2 2,544 Min. R&D Handicraft Workshop 11 2,080 Min. R&D Tuna Jerky Workshop 9 3,178 NTA Inform./Comm. Tech. 1 5,300 MOHE Anesthetics Course 2 10,236 MOE Parel Conference 1 2,575 NTC Parel Conference 1 2,575 Total: 27 28,488 Grand Total: 57 106,707
Source: National Training Council, Ministry of Education
16,446
40,000
9,29712,476
28,488
0
10,000
20,000
30,000
40,000
Am
ount
(US
Dol
lars
)
1998 1999 2000 2001 2002
Years
Fig. 3.35 Amount Awarded for Trainings etc. by the National Training Council, Majuro, 1998-2002

RMI Statistical Yearbook, 2002
Economic Policy, Planning and Statistics Office 120
Chapter 4-Labour and Employment
Labor and Employment According to the population census of 1999, 54.1 percent (11,488 persons) of the working age population (15 years and over) was economically active. The other 45.9 percent consisted of homemakers, students, disabled and those who have retired. The breakdown of the labor force by sex, employed, unemployed in different sectors and by broad occupation and industry groups has been presented in this chapter. The projection of labor force likely for the years 2004, 2009, 2014 and 2019 has also been provided. The number of job seekers has increased from 11, 488 in 1988 to 14,677 in 1999 but the number of those employed increased by only 85 from 10,056 in 1988 to 10,141 in 1999. In 1999, the overall unemployment rate was 30.9 percent, compared to an unemployment rate of 12.5 percent in 1988. By sex, the unemployment rate was 27.6 percent among males and 37.3 percent among females. 31 percent were working in public sector, 40 percent in private sector and 29 percent were self employed or unpaid family workers. Employment in the public sector registered a decline from 3,392 in 1988 to 3,106 in 1999. This was primarily due to the administrative reforms in the mid 1990s. On the other hand, employment in the private sector increased from 3,369 in 1988 to 4,115 in 1999. The number of self employed and unpaid family workers also increased from 2,721 in 1988 to 3,133 in 1999. 56.9 percent of the unemployed were in the most productive age group 20-34. Most of the employed both in the public and the private sectors, was confined to the urban centers of Majuro and Ebeye. The population of the Marshall Islands is young and the fertility is high. The labor force will grow from 14,677 in 1999 to 18,788 in 2004 and then to 21,702 in 2009. By 2019, it will reach a staggering figure of 30,247. This projection is based on the labor participation rate of 0.527 from the 1999 census and has been assumed to remain constant. Every year, on average, about 1,000 people are added to the labor force. This additional number plus the unemployed, is going to push the unemployment rate even higher. Fishing and agriculture also have potential for further development. Fisheries if developed to its full extent, could provide more jobs and become a more important foreign earnings commodity. Tourism is another sector that has room for development. This would provide more jobs in hotels and the service sector. The handicrafts could provide employment particularly for women and the outer islands. The problems of transportations and marketing of goods from outer islands to Majuro and from Majuro to other markets outside the country, if solved, it could encourage nationals and foreigners to invest in many local ventures. A number of vocations both in public and private sector have been filled by foreign labor because of a lack of adequate educational levels, training and skills. Trades like auto mechanics, electricians, air conditioner technicians, commercial fisherman, construction are in short supply. Professionals like teachers, doctors, nurses, medical technicians; software and hardware computer engineers, business managers, accountants and lawyers are in demand. Under the Compact of Free Association Marshallese can migrate and seek jobs in the USA, but unless the standard of education is improved and knowledge and skills most wanted in the US are acquired, it will be a difficult transition. An increased savings rate savings in the economy is necessary for sustainable economic growth that at present is absent from the economy. It is time that suitable policies were adopted to encourage greater savings and investment in both the public sector and the private sectors. An efficient and reliable transport/ communication infrastructure is needed to link the outer islands to the urban centers and to the

RMI Statistical Yearbook, 2002
Economic Policy, Planning and Statistics Office 121
world markets is a basic for growth and success of business. An offer of more incentives could further attract foreign investment. The Ministry of Resources and Development is responsible for the industrial and agricultural development in the RMI. The Agriculture Division, of the ministry, through various programs, is involved in assisting people in the promotion of subsistence activities like raising of livestock and poultry, planting of fruit trees and kitchen gardening, etc. The Ministry has been trying to establish marketing facilities through MIMRA for fishermen at as many places as feasible. The Trade and Investment Services Division of the Ministry has four units: Trade Promotion, Investment Promotion, Small Business Development Center and Center for Development of Enterprises, has been tasked with the following objectives:
• Development and improvement of Marshallese products for the domestic and into foreign
niche markets. • Support and promote the development of small business in the Marshall Islands, both
product and service oriented businesses, through the support of entrepreneurship, particularly among the more vulnerable and economically disadvantaged Marshallese communities.
• Facilitate and promote foreign and domestic investment in the Marshall Islands through the development of economic partnerships with foreign and local companies for the overall economic development of the Marshall Islands.
The RMI Small Business Development Center Majuro, has been fostering sustainable business development by providing management, technical assistance and training to business clientele throughout the Republic of the Marshall Islands. This Center is linked to hundreds of resources through its partnership with the US Small Business Administration and the US Association of Small Business Development Centers. It has also linkages with the National Business Incubation Association and other economic development groups, regionally and internationally and puts local business in touch with the most appropriate sources of assistance.

RMI Statistical Yearbook, 2002
Economic Policy, Planning and Statistics Office 122
Table 4.1 Total Labor Force by Atoll / Island, Persons Employed, Persons Unemployed and Unemployment Rate, Republic of the Marshall Islands, 1988 and 1999 Atoll/Island 1988 1999 Labor Unemployment Labor Unemployment Force Employed Unemployed Rate Force Employed Unemployed Rate Ailinglaplap 436 409 27 6.2 529 365 164 31.0 Ailuk 171 171 0 0.0 133 107 26 19.5 Arno 352 352 0 0.0 458 348 110 24.0 Aur 169 162 7 4.1 272 230 42 15.4 Bikini 10 10 0 0.0 0 0 0 0.0 Ebon 195 188 7 3.6 176 149 27 15.3 Enewetak 127 127 0 0.0 222 126 96 43.2 Jabat 36 33 3 8.3 19 17 2 10.5 Jaluit 359 312 47 13.1 414 326 88 21.3 Kili 162 162 0 0.0 227 177 50 22.0 Kwajalein 2,274 1,943 331 14.6 2,856 1,944 912 31.9 Lae 72 71 1 1.4 132 32 100 75.8 Lib 50 50 0 0.0 24 20 4 16.7 Likiep 170 161 9 5.3 188 107 81 43.1 Majuro 5,540 4,598 942 17.0 7,196 4,980 2,216 30.8 Maloelap 180 173 7 3.9 274 197 77 28.1 Mejit 111 111 0 0.0 167 163 4 2.4 Mili 224 224 0 0.0 405 200 205 50.6 Namorik 184 178 6 3.3 226 193 33 14.6 Namu 230 220 10 4.3 273 189 84 30.8 Ujae 133 131 2 1.5 108 49 59 28.1 Utirik 94 86 8 8.5 147 93 54 36.7 Wotho 27 27 0 0.0 68 12 56 82.3 Wotje 182 157 25 13.7 163 117 46 28.2 Total 11,488 10,056 1,432 12.5 14,677 10,141 4,536 30.9 Source:Census Reports and EPPSO
The unemployment rate shot up from 12.5 percent in 1988 to 30.9 percent in 1999. In 1998, no person was unemployed In Ailuk, Arno, Bikini, Enewetak, Kili, Lib, Mejit, Mili and Namorik and Wotho except in Jaluit, Kwajalein, Majuro and Wotje, the rate of unemployment was in single figure. Except in Mejit, all areas have double figure unemployment rates and in Wotho, Lae, Mili, Enewetak and Likiep it was as high as 82.3, 75.8, 50.6, 43.2 and 43.1 percent respectively.

RMI Statistical Yearbook, 2002
Economic Policy, Planning and Statistics Office 123
Table 4.2 Distribution of Economically Active Population of RMI,1999 Age Group Employed Unemployed Total Unemployment Rate(%) 15-19 335 914 1,249 73.2 20-24 951 1,242 2,193 56.6 25-29 1,482 842 2,324 36.2 30-34 1,642 497 2,139 23.2 35-39 1,548 380 1,928 19.7 40-44 1,405 260 1,665 15.6 45-49 1,231 183 1,414 12.9 50-54 784 114 898 12.7 55-59 401 53 454 11.7 60-64 188 48 236 20.3 65-69 103 2 105 1.9 70-74 44 0 44 0.0 75+ 27 1 28 3.6 Total 10,141 4,536 14,677 30.9 Source: Census 1999 and EPPSO
Fig 4.1 Number of Persons Employed and Unemployed in 1991 in RMI
0
500
1,000
1,500
2,000
2,500
15-19 20-24 25-29 30-34 35-39 40-44 45-49 50-54 55-59 60-64 65-69 70-74 75+
Age Groups
Num
ber o
f Per
sons
UnemployedEmployed
Fig. 4.2 Unemployment Rate by Age Groups in RMI in 1999
0.010.020.030.040.050.060.070.080.0
15-1
9
20-2
4
25-2
9
30-3
4
35-3
9
40-4
4
45-4
9
50-5
4
55-5
9
60-6
4
65-6
9
70-7
4
75+
Age Groups
Une
mpl
oym
ent P
erce
nt
58.5 percent of the labor force was in the age group 20-39. Out of the total unemployed population of 4,536 in Marshall Islands in 1999, 2,961 that is 65.3 percent of the total unemployed were in the 20 – 39 age group.

RMI Statistical Yearbook, 2002
Economic Policy, Planning and Statistics Office 124
Table 4.3 Employed Population of RMI by Sex and Sectors of Employment:1988 and 1999 Sector of Employment 1988 1999
Male Female Total Male Female Total
Public Sector 2,592 800 3,392 2,234 872 3,106 Private Sector 2,407 962 3,369 2,870 1,245 4,115 Self Emolyed or Unpaid family Workers 2,336 959 3,295 1,904 1,016 2,920 Total 7,335 2,721 10,056 7,008 3,133 10,141
Source: Census Reports
Fig 4.3 Labour Force Employment by Sectors: 1999
Public Sector31%
Private Sector40%
Self Em olyed or Unpaid fam ily W orkers
29%
Fig 4.4 Labour Force Employment by Sectors: 1988
Private Sector34%
Self Em olyed or Unpaid
fam ily W orkers
33%
Public Sector33%

RMI Statistical Yearbook, 2002
Economic Policy, Planning and Statistics Office 125
Table 4.5 Position of Economically Active Population and Employed Population in RMI: 1998 and 1999
1988 1999 Description Public Private Public Private Sector Sector Total Sector Sector Total Economically Acive Total 11,488 14,677 Male 8,353 9,679 Female 3,135 4,998 Employed Total 3,392 6,664 10,056 3,106 7,035 10,141 Male 2,592 4,743 7,335 2,234 4,774 7,008 Female 800 1,921 2,721 872 2,261 3,133 Unemployed Total 1,432 4,536 Male 1,018 2,671 Female 414 1,865
Source: Censuses of 1988 and 1999
0 2,000 4,000 6,000 8,000
10,000 12,000 14,000 16,000
Labor Force Employed Unemployed
Fig. 4.5 Labor Force, Employed and Unemployed in RMI: 1988 and 1999
Table 4.4 Employment by Occupational Groups in RMI, 1980, 1988 and 1999
Occupational Groups 1980 1988 1999 Male Female Total Male Female Total Male Female Total Professional, Technical and Related 479 205 684 1,148 534 1,682 991 555 1,546 Admn. & Management 252 31 283 247 18 265 352 84 436 Clerical & Related 248 138 386 428 474 902 534 831 1,365 Sales 105 120 225 281 220 501 212 132 344 Service 483 258 741 825 497 1,322 1,155 532 1,687 Agriculture & Related/ Fishermen 1,887 1,199 3,086 2,067 62 2,129 1,838 241 2,079 Production & Transport Equipment Operators and laboorers 1,133 60 1,193 2,355 914 3,249 1,780 691 2,471 Not stated 0 0 0 4 2 6 146 67 213 Total 4,587 2,011 6,598 7,355 2,721 10,056 7,008 3,133 10,141 Source: Census Reports

RMI Statistical Yearbook, 2002
Economic Policy, Planning and Statistics Office 126
Table 4.6 Projection of Labour Force:1999-2019 in RMI Period From To Increase 1999-2004 14,677 18,788 4,111 2004-2009 18,788 21,702 2,914 2009-2014 21,702 25,070 3,368 2014-2019 25,070 30,247 5,177 Note: Assumed Labour Participation Rate =0.527 as in 1999 Source: EPPSO
14,67718,788
21,70225,070
30,247
0
5,000
10,000
15,000
20,000
25,000
30,000
35,000
Pers
ons
1999 2004 2009 2014 2019
Years
Fig 4.6 Projection of Labor Force
The labour force of the Marshall Islands will continue to grow at a rapid rate due to a high fertility rate and a very young population. Every year more than one thousand new job seekers will be added to the labour market making it a challenging task to create job opportunities.
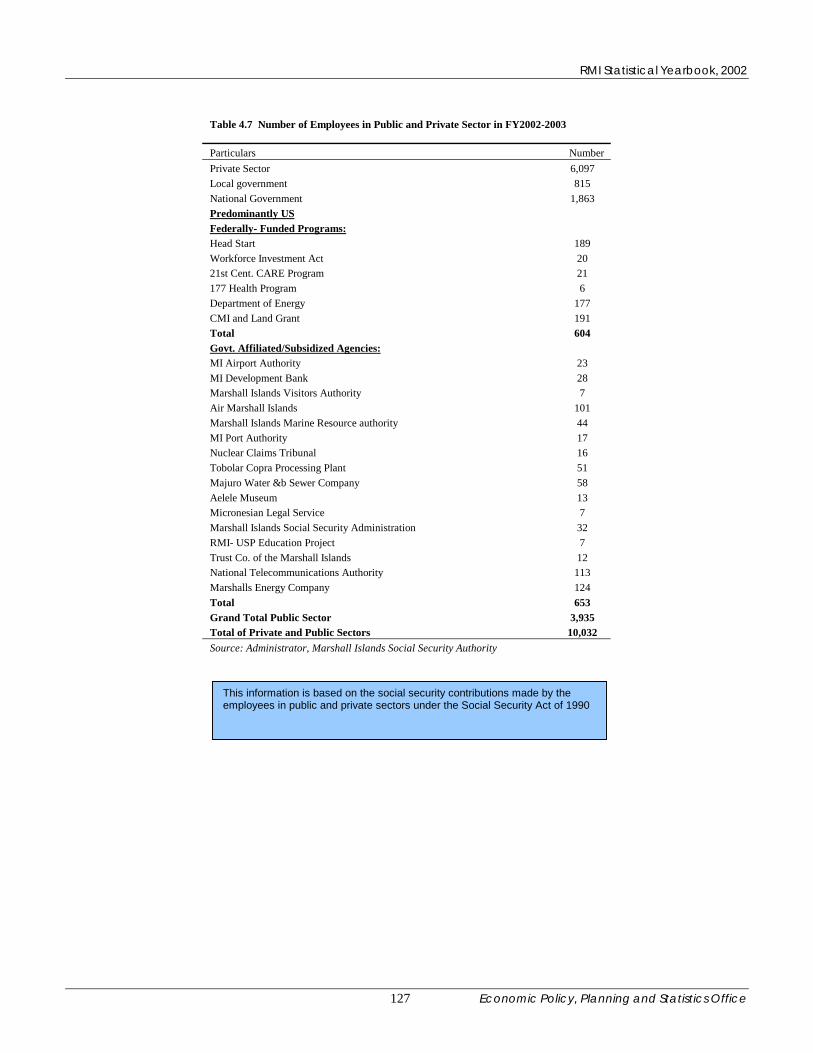
RMI Statistical Yearbook, 2002
Economic Policy, Planning and Statistics Office 127
Table 4.7 Number of Employees in Public and Private Sector in FY2002-2003 Particulars Number Private Sector 6,097 Local government 815 National Government 1,863 Predominantly US Federally- Funded Programs: Head Start 189 Workforce Investment Act 20 21st Cent. CARE Program 21 177 Health Program 6 Department of Energy 177 CMI and Land Grant 191 Total 604 Govt. Affiliated/Subsidized Agencies: MI Airport Authority 23 MI Development Bank 28 Marshall Islands Visitors Authority 7 Air Marshall Islands 101 Marshall Islands Marine Resource authority 44 MI Port Authority 17 Nuclear Claims Tribunal 16 Tobolar Copra Processing Plant 51 Majuro Water &b Sewer Company 58 Aelele Museum 13 Micronesian Legal Service 7 Marshall Islands Social Security Administration 32 RMI- USP Education Project 7 Trust Co. of the Marshall Islands 12 National Telecommunications Authority 113 Marshalls Energy Company 124 Total 653 Grand Total Public Sector 3,935 Total of Private and Public Sectors 10,032 Source: Administrator, Marshall Islands Social Security Authority
This information is based on the social security contributions made by the employees in public and private sectors under the Social Security Act of 1990

RMI Statistical Yearbook, 2002
Economic Policy, Planning and Statistics Office 128
Table 4.8 Social Security Benefits Paid to the RMI Employees by MISSA , FY1996-FY2002
Particulars FY1996 FY1997 FY1998 FY1999 FY2000 FY2001 FY2002
Retirement 3,040,307 3,270,609 3,559,325 2,717,047 3,989,116 4,248,669 4,519,133 Health Care 3,704,259 2,921,640 2,107,747 3,723,304 4,980,200 3,931,601 3,294,312 Survivors 1,749,563 1,970,179 2,090,775 2,282,175 2,579,726 2,797,078 2,947,508 Disability 250,914 457,959 619,163 591,234 722,222 840,425 940,492
Reduction-in- Force 0 460,002 559,380 765,358 344,262 285,055 108,604 Lump Sum 14,515 73,892 36,034 23,131 22,555 57,794 48,279 Total 8,759,558 9,154,281 8,972,424 10,102,249 12,638,081 12,160,622 11,858,328
Source: Administrator, Marshall Islands Social Security Authority
Fig 4.7 Social Security Benefits to Employees Paid by MISSA
0
2,000,000
4,000,000
6,000,000
8,000,000
10,000,000
12,000,000
14,000,000
FY1996 FY1997 FY1998 FY1999 FY2000 FY2001 FY2002
Am
ount
Pai
d in
US
Dol
lars

RMI Statistical Yearbook, 2002
Economic Policy, Planning and Statistics Office 129
Table 4.9 RMI National Government Employees By Department and Sex as on 30 June 2003
Ministry/Execution Authority Male Female Total % of Total Education 451 235 686 35.2 Health 240 210 450 23.0 Justice 183 27 210 10.8 Transport & Communication 152 3 155 7.9 Public Works 103 6 109 5.6 Finance 74 21 95 4.9 Internal Affairs 35 24 59 3.0 President/Cabinet 32 10 42 2.2 Nitijela 32 17 49 2.5 Foreign Affairs 20 11 31 1.6 Resources & Development 27 3 30 1.5 Council of Iroij 9 5 14 0.7 Public Service Commission 8 3 11 0.6 Chief Secretary 9 1 10 0.5 Total 1,375 576 1,951 100.0 Note: Education was the largest number employees, followed by the health
Source:Pay Rolls, Ministry of Finance
Fig 4.8 National Government Employees in RMI, 2003
686
450
210
155
109
95
59
42
49
14
11
10
0 100 200 300 400 500 600 700 800
Education
Health
Justice
Transport & Communication
Public Works
Finance
Internal Affairs
President/Cabinet
Nitijela
Foreign Affairs
Resources & Development
Council of Iroij
Public Service Commission
Chief Secretary
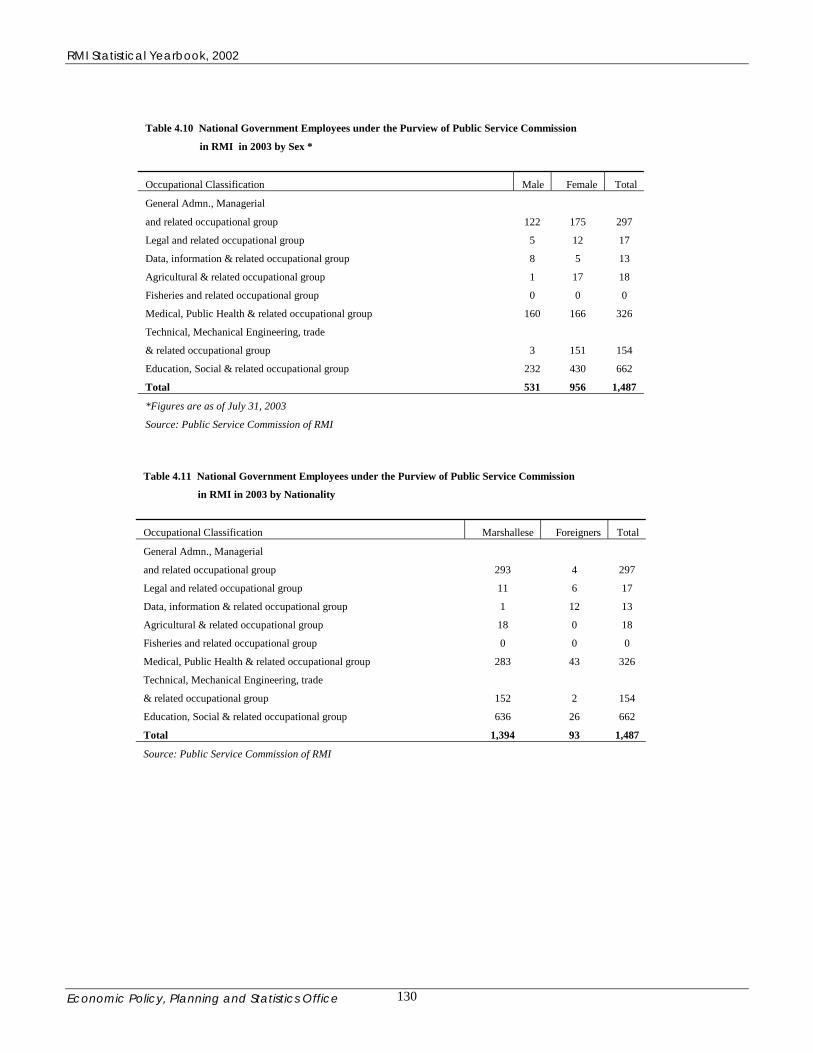
RMI Statistical Yearbook, 2002
Economic Policy, Planning and Statistics Office 130
Table 4.10 National Government Employees under the Purview of Public Service Commission
in RMI in 2003 by Sex * Occupational Classification Male Female Total General Admn., Managerial and related occupational group 122 175 297 Legal and related occupational group 5 12 17 Data, information & related occupational group 8 5 13 Agricultural & related occupational group 1 17 18 Fisheries and related occupational group 0 0 0 Medical, Public Health & related occupational group 160 166 326 Technical, Mechanical Engineering, trade & related occupational group 3 151 154 Education, Social & related occupational group 232 430 662 Total 531 956 1,487 *Figures are as of July 31, 2003 Source: Public Service Commission of RMI
Table 4.11 National Government Employees under the Purview of Public Service Commission
in RMI in 2003 by Nationality Occupational Classification Marshallese Foreigners Total General Admn., Managerial and related occupational group 293 4 297 Legal and related occupational group 11 6 17 Data, information & related occupational group 1 12 13 Agricultural & related occupational group 18 0 18 Fisheries and related occupational group 0 0 0 Medical, Public Health & related occupational group 283 43 326 Technical, Mechanical Engineering, trade & related occupational group 152 2 154 Education, Social & related occupational group 636 26 662 Total 1,394 93 1,487 Source: Public Service Commission of RMI

RMI Statistical Yearbook, 2002
Economic Policy, Planning and Statistics Office 131
Table 4.12 Alien Workers by Sex in RMI, 1996-2002
Year Male Female Total
1995 223 74 297 1996 233 89 322 1997 254 87 341 1998 359 105 464 1999 371 134 505 2000 421 164 585 2001 548 264 812 2002 623 299 922
Source: Immigration Office / Division of Labour, Ministry of Foreign Affairs
0
100
200
300
400
500
600
700
Num
ber o
f Wor
kers
1995 1996 1997 1998 1999 2000 2001 2002
Year
Fig 4.9 Alien Workers in RMI by Sex, 1995-2002
Male Female
0100200300400500600700800900
1000
Num
ber o
f Wor
kers
1995 1996 1997 1998 1999 2000 2001 2002
Year
Fig 4.10 Alien Workers in RMI, 1995-2002
Though the unemployment rate in the Marshall Islands is growing fast, the number of foreign workers in the country has been on the increase. Due to non-availability of suitable manpower in many technical and administrative areas in the economy, these positions have been filled by foreign workers.

RMI Statistical Yearbook, 2002
Economic Policy, Planning and Statistics Office 132
Table 4.13 Civilian Labor Force (16+) in US Affiliated Island Countries: 1990, 1995 & 2000
Year Guam CNMI A.Samoa Palau FSM RMI 1990 54,186 26,581 14,187 6,070 .. 11,488 1995 .. 37,540 14,622 8,347 25,972 .. 2000 64,452 44,465 17,627 9,607 37,414 14,677
% increase 1990 to 2000 18.9 67.3 24.2 58.3 .. 27.8 Source: Ben Graham, IPC Statistical Enhancement Program, US Census Bureau
18.9
67.3
24.2
58.3
27.8
0
20
40
60
80
Perc
ent
Gro
wth
Guam CNMI A.Samoa Palau RMI
Countries
Fig 4.11 Percent Growth in Labour Force in Pacific Countries, 1990:2000
Table 4.14 Number Employed in Selected Pacific Countries: 1990, 1995 & 2000 Year Guam CNMI A.Samoa Palau FSM RMI
1990 52,144 25,965 13,461 5,599 .. 10,056 1995 .. 34,812 13,785 7,759 21,756 .. 2000 57,053 42,753 16,718 9,383 29,175 10,141
% increase 1990 to 2000 9.4 64.7 24.2 67.6 .. 0.8 Source: Ben Graham, IPC Statistical Enhancement Program, US Census Bureau
9.4
64.7
24.2
67.6
0.8
010203040506070
Perc
ent G
row
th
Guam CNMI A.Samoa Palau RMI
countries
Fig 4.12 Percent Growth in Employment in Selected Pacific Countries, 1990:2000
The labor force increased from 11,488 in 1988 to 14,677 in 1999 a growth of 27.8 percent but employment grew only 0.8 percent in the corresponding period of 11 years, the lowest in the pacific region.

RMI Statistical Yearbook, 2002
Economic Policy, Planning and Statistics Office 133
Table 4.15 Number Unemployed in US Affiliated Island Countries: 1990, 1995 & 2000 Year Guam CNMI A.Samoa Palau FSM RMI
1990 2,042 616 726 471 .. 1,432 1995 .. 2,728 837 588 4,216 .. 2000 7,399 1,712 909 224 8,239 4,536
% increase 1990 to 2000 262.3 177.9 25.2 -52.4 .. 216.8 Source: Ben Graham, IPC Statistical Enhancement Program, US Census Bureau
262.3177.9
25.2
-52.4
216.8
-100-50
050
100150200250300
Perc
ent C
hang
e
Guam CNMI A.Samoa Palau RMI
Countries
Fig 4.13 Percent Change in Unemployment in selected Pacific Countries, 1990-2000
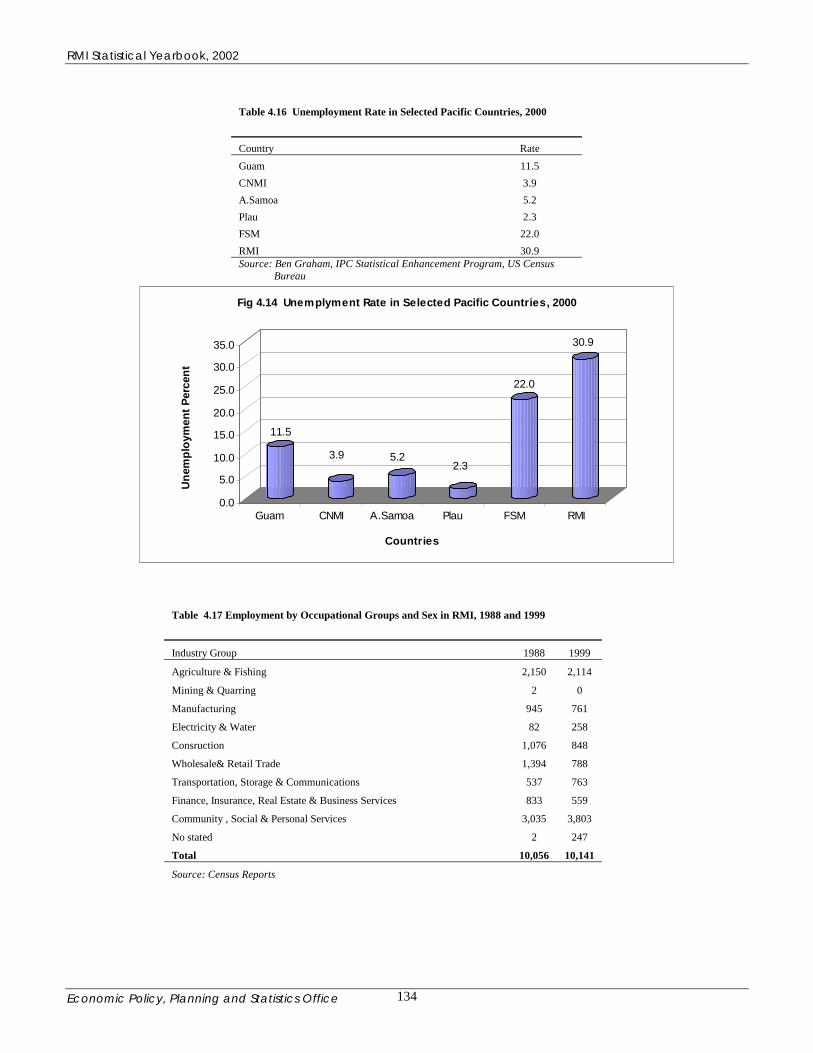
RMI Statistical Yearbook, 2002
Economic Policy, Planning and Statistics Office 134
Table 4.16 Unemployment Rate in Selected Pacific Countries, 2000 Country Rate
Guam 11.5 CNMI 3.9 A.Samoa 5.2 Plau 2.3 FSM 22.0 RMI 30.9 Source: Ben Graham, IPC Statistical Enhancement Program, US Census Bureau
11.5
3.9 5.22.3
22.0
30.9
0.0
5.0
10.0
15.0
20.0
25.0
30.0
35.0
Une
mpl
oym
ent P
erce
nt
Guam CNMI A.Samoa Plau FSM RMI
Countries
Fig 4.14 Unemplyment Rate in Selected Pacific Countries, 2000
Table 4.17 Employment by Occupational Groups and Sex in RMI, 1988 and 1999 Industry Group 1988 1999 Agriculture & Fishing 2,150 2,114 Mining & Quarring 2 0 Manufacturing 945 761 Electricity & Water 82 258 Consruction 1,076 848 Wholesale& Retail Trade 1,394 788 Transportation, Storage & Communications 537 763 Finance, Insurance, Real Estate & Business Services 833 559 Community , Social & Personal Services 3,035 3,803 No stated 2 247 Total 10,056 10,141 Source: Census Reports

RMI Statistical Yearbook, 2002
Economic Policy, Planning and Statistics Office 135
Table 4.18 Business Survey Majuro Town, 2000-2002
Type of Business Number of Units
Number of Employees
2000 2001 2002 2000 2001 2002 Mom & Pops 35 41 36 73 72 68 Taxi Company 3 5 5 7 17 20 Auto Shops, Repair 6 6 6 29 28 31 Dealership, Used Cars 6 6 6 16 17 16 Gas Station 6 6 6 16 20 18 Importers, Retailers 22 44 39 727 1,146 979 Importers, Wholesalers 5 6 6 85 97 124 Barber Shops 2 3 3 2 3 3 Hotels 3 4 4 81 184 101 Bars/Clubs 4 5 5 31 36 36 Restaurants 11 16 17 86 91 116 Leasing of Apartments 4 4 5 11 13 9 Travel Agencies 2 1 1 5 4 5 Construction Companies 10 15 18 68 155 126 Bowling Alley 1 1 1 22 25 27 Video Rentals 7 7 7 7 7 7 Shipping Agencies 4 4 5 6 5 11 Handicraft Shops 1 1 1 7 7 4 Export Fishing Agency 0 1 1 0 3 3 Air condition Shop 1 1 1 2 2 2 Hauling Company, Towing 1 1 1 2 2 2 Diver Company 3 3 3 4 4 4 Engineering Service, Architect 0 1 1 0 1 1 Recycle Corporation 1 1 1 2 2 2 Consulting, Professional Agencies 2 2 2 4 4 4 Private Clinic 1 1 1 2 2 2 Stevedor & Terminal Company 1 1 1 54 69 58 Accounting Service 1 1 1 1 1 1 Importer/Construction 1 1 1 110 23 16 Newspaper Agency 1 1 1 14 7 7 Live Fish Exporter 1 1 1 10 6 8 Office Building Rental Company 1 1 1 8 9 8 Total 147 192 188 1,492 2,062 1,819 Source:Ministry of Finance, Division of Revenue & Taxation, Majuro

RMI Statistical Yearbook, 2002
Economic Policy, Planning and Statistics Office 136
Table 4. 19 Business Survey Ebeye Town, 2000-2002
Type of Business Number of Units Number of Employees
2000 2001 2002 2000 2001 2002 Mom & Pops 17 17 13 27 21 25 Importers, Retailers 6 5 4 169 128 122 Hotel 1 1 1 8 8 8 Restaurants 1 1 1 6 5 8 Mobil Oil Company 1 1 1 5 5 5 Construction Company 0 1 1 0 17 17 Total 26 26 21 215 184 185 Source: Ministry of Finance, Division of Revenue & Taxation, Ebeye
26 26
21
0
5
10
15
20
25
30
Num
ber o
f Uni
ts
2000 2001 2002
Year
Fig 4.17 Number of Business Units in Ebeye
215
184 185
160
170
180
190
200
210
220
Num
ber o
f Em
ploy
ees
2000 2001 2002
Year
Fig 4.18 Number of Employees in Private Business in Ebeye
The information is based upon the compulsory enrollment of various businesses in Majuro and Ebeye under the Act
The information is based upon the statutory requirement for the enrolment of various businesses in the Republic of Marshall islands.

RMI Statistical Yearbook, 2002
Economic Policy, Planning and Statistics Office 137
Table 4.20 Number of Persons Given Counseling at the Small Business Development Center, Majuro Number of Persons Given Counseling Type of Counseling 2001 2002 2003 Men Women Total Men Women Total Men Women Total Business Plan 2 1 3 12 5 17 14 7 21 Government Procurement 0 0 0 0 2 2 10 1 11 Record Keeping 0 0 0 1 2 3 5 2 7 Tax Planning 0 0 0 1 1 2 1 5 6 Accounting and Records 0 0 0 2 0 2 4 2 6 Marketing and Sales 0 0 0 3 0 3 0 0 0 Financial Analysis/Cost Control 0 0 0 0 2 2 6 0 6 Business Start-Up 0 0 0 2 0 2 22 10 32 Total 2 1 3 21 12 33 62 27 89 Source: Small Business Development Center, Majuro
21
11
7 6 6
0
6
32
0
5
10
15
20
25
30
35
Num
ber o
f Per
sons
Busi
ness
Pla
n
Gov
ernm
ent
Proc
urem
ent
Rec
ord
Keep
ing
Tax
Plan
ning
Acco
untin
g an
dR
ecor
ds
Mar
ketin
g an
dSa
les
Fina
ncia
lAn
alys
is/C
ost
Con
trol
Busi
ness
Sta
rt-U
p
Fig 4.19 Number of Persons Availed Counselling at the Busuness Development Center Majuro

RMI Statistical Yearbook, 2002
Economic Policy, Planning and Statistics Office 138
Table 4.21 One Day Trainings Imparted at the Small Business Development Center, Majuro
No. of Persons Imparted Training Type of Training 2001 2003(Jan.-Sept.) Cumulative Total Men Women Total Men Women Total Men Women Total Pre-Business 5 7 12 12 8 20 17 15 32 Tax & Licensing 4 1 5 4 7 11 8 8 16 Record Keeping 5 1 6 9 4 13 14 5 19 Financial Statements 4 3 7 16 3 19 20 6 26 Business Plan Over view 3 10 13 30 7 37 33 17 50 Total 21 22 43 71 29 100 92 51 143 Note No work done during 2002. Date of Start of Center: 21 Oct, 2000 Source: Small Business Development Center, Majuro.
32
1619
26
50
05
101520253035404550
No.
of P
erso
ns
Pre-
Busi
ness
Tax
& Li
cens
ing
Rec
ord
Keep
ing
Fina
ncia
lSt
atem
ents
Busi
ness
Pla
nO
ver v
iew
Field of Trainining
Fig 4.20 No. of Persons Received Training at the Business Development Center Majuro

RMI Statistical Yearbook, 2002
Economic Policy, Planning and Statistics Office 139
Table 4.22 Trainings/Workshops Conducted Under the Ministry of Resources and Development in RMI, 2000-01 and 2001-02 2000-01 2001-02 Sector No. of Trainings No. of Participants No. of Trainings No. of Participants and workshops Male Female Total and Workshops Male Female Total Agriculture/Live stock Agriculture/Live stock 5 20 10 30 10 25 15 40 Composting/Manuring 10 40 15 55 10 15 5 20 Planting Propagation 10 40 15 55 10 15 5 20 Raising of Livestock/ Poultry 5 20 10 30 10 15 5 20 Trade and Investment* Marketing & Business Planning 1 3 4 7 0 0 0 0 Handicrafts Networking between handi crafts & product development 0 0 0 0 1 0 33 33 Total 31 123 54 177 41 70 63 133
*Excluding those at the Small Business Development Center. Source: Ministry of Resources and Development
RMI Statistical Yearbook, 2002
Economic Policy, Planning and Statistics Office 140
Chapter 5-Justice and Crime This chapter presents information concerning justice and crime in the Republic of the Marshall Islands. Though crime statistics were collected and compiled on an annual basis regularly by the Office of Planning and Statistics, scrutiny of the data found that the information concerned work handled by the national police only and it did not include work carried out by the local government police forces. In addition to the national police under the Department of Public Safety, the local government police on respective atolls were also handling criminal cases and traffic violations independent of the national police. After strenuous efforts, it was possible to collect and compile data on the work of the local government police forces from Majuro, Ebeye and Jaluit for the year 2002. Records prior to 2002 were not available with any of these agencies. The concerned staff from these offices have been trained to maintain a statistical database. It is a matter of great satisfaction that the database of the national and local police Ebeye and District Court at Ebeye was maintained and in case of High Court, Majuro and national police Majuro there have improvements. But the record keeping at the District Court, Majuro could not be kept properly in accordance with the database training provided last year. An attempt has been made to provide as complete and comprehensive information as possible by incorporating the work conducted by all the police forces in the RMI. The case workload at the District Courts and the High Court including the cases decided and the number of pending cases has also been tabulated. Highlights • The number of persons in the national police force at the end of year 2002 was 133 compared to
294 police personnel under the local governments. • The largest category of cases listed with the High Court was assault and battery. • Cases involving illegal entry and passports listed with the High Court are increasing. The number
of such cases went from 3 in 2000 to 9 in 2001 and 16 in 2002. • The number of burglary cases with the High Court has declined from 26 in 2000 to 24 in 2001 and
only 9 in 2002. • The number of kidnapping cases filed in the High Court was 5, while only one such case was filed
in 2001. • The disposal of criminal cases at the district court Majuro was slightly more than at the District
Court Ebeye. • The database for the court work in the District Court Ebeye has improved appreciably after it was
established in 2002. • During the year 2002, local police listed 1,730 offenses as against only 904 cases of offenses
known to the Criminal Investigation Division of the national police Majuro. • According to the statistics supplied by the human services division, Ministry of Health for the year
2002, the division provided services to 23 attempted suicides and 29 completed suicide cases. But not a single such case was registered with the national police. This omission on the part of the national police is a matter for taking appropriate remedial measures.
• Of 2,634 offenses known to the national and local government police on Majuro in 2002, 989 were for drunken disorderly conduct alone. Next was drunken disturbing peace, 694. 192 cases were for malicious mischief. There were 76 Grand larceny cases. The number burglary of cases remained steady at 73.

RMI Statistical Yearbook, 2002
Economic Policy, Planning and Statistics Office 141
• As many as 420 persons under the age of 17 were arrested in Majuro, 330 by local police and 117 by the national police.
• Substance abuse and drinking appears to be on the increase particularly among the underage.
• Most cases of juvenile crime were for curfew violation and drinking underage. • Because of a lack of crime statistics in previous years from the local as well as the national
police, it is not possible to provide a complete picture on trends in crime in the RMI, but indications are that the juvenile crime is on the increase particularly in the urban areas of Majuro and Ebeye. The cases of larceny and burglary are rising. There is a rising trend in suicides and attempted suicides, a matter of deep concern.
• In 2002, out of 2,491 persons arrested in Majuro by the national and local government police, 1,524 was of those below the age of 19, 61.2 percent of total arrested persons during the year. However, the highest percentage arrested in Ebeye 51.1 percent belonged to the age group 20-30 and only 28 percent of arrested persons were below age 20.
• The number of persons arrested in Ebeye for various offenses in 2002 was 1,042 that was. 29.5 percent of total arrests made by police in the RMI.
• The total number of persons arrested by the national police and local government police in Majuro and Ebeye during the year 2002 was 3,533.
• In Jaluit, the total number of offenses recorded in 2002 was 57, out of which 44 were for drunken disorderly conduct, 5 for trespassing, 3 each for affray and grand larceny and one each for attempted suicide and assault & battery with a dangerous weapon.
• It was not possible to find the total number of offenses committed in 2001 in Majuro. But with more complete information available for Ebeye, the number of offenses increased from 854 in 2001 to 1,368 in 2002, an increase of 60.2 percent in one year.
• There were 416 traffic accidents in the country during the year 2002, out of which, 384 were in Majuro and 32 in Ebeye.
• Out of 1,666 traffic violation offenses in the year 2002; 1,658 were in Majuro, 305 in Ebeye and 3 in Jabwor/Jaluit.

RMI Statistical Yearbook, 2002
Economic Policy, Planning and Statistics Office 142
Table 5. 1 Criminal Cases listed at RMI High Court, 1996-2002
Type of Crime 1996 1997 1998 1999 2000 2001 2002 Assault & Battery 21 14 7 46 25 41 37 Arson 0 2 0 5 1 0 0 Burglary 17 14 0 20 26 24 9 Cheating/Embezzlement/Forgery/Bribery 6 5 2 2 6 13 11 Child abuse and rape 0 0 0 1 1 2 0 Conspiracy 3 0 0 0 0 0 3 Creating Pollution 0 0 0 0 7 9 6 Illegal entry and passport 0 0 1 0 3 9 16 Child abuse and rape 0 1 1 5 2 7 1 Conspiracy 3 0 0 0 0 0 3 Disturbing peace/Drunk 1 1 2 0 1 5 3 Drunken driving/Negligent driving 0 1 0 4 15 8 13 Grand/small larceny and theft 12 2 0 7 14 9 9 Malicious mischief/mayhem 3 3 0 1 3 10 5 Perjury/obstructing justice 0 0 1 0 0 0 0 Robbery 0 0 0 0 1 1 0 Escape 6 1 0 2 0 2 1 Sale of Alcohol to minor 0 0 0 0 0 1 0 Selling illegal passports 0 0 0 1 0 0 0 Sexual molestation/sodomy 0 0 0 0 0 3 1 Trespass 0 1 0 1 5 2 4 Doing business without license 0 0 0 0 0 5 0 Failure to pay tax 0 0 0 0 5 6 0 Kidnapping 0 0 0 0 0 1 5 Illegal possession and use of fire arms 3 0 0 2 0 0 0 Receiving stolen goods 0 0 0 0 9 2 0 Operating gambling machines 0 0 4 0 0 5 0 Search warrants 0 0 0 0 0 3 1 Illegal possession of govt. property 0 1 0 0 0 0 0 Miscellaneous 2 6 6 2 36 13 17 Total 77 52 24 99 160 181 145 Source: High Court of RMI, Majuro
7752
24
99
160181
145
0
50
100
150
200
No.
of C
ases
1996 1997 1998 1999 2000 2001 2002
Years
Fig 5.1 Criminal Cases Listed at RMI High Court, 1996-2002
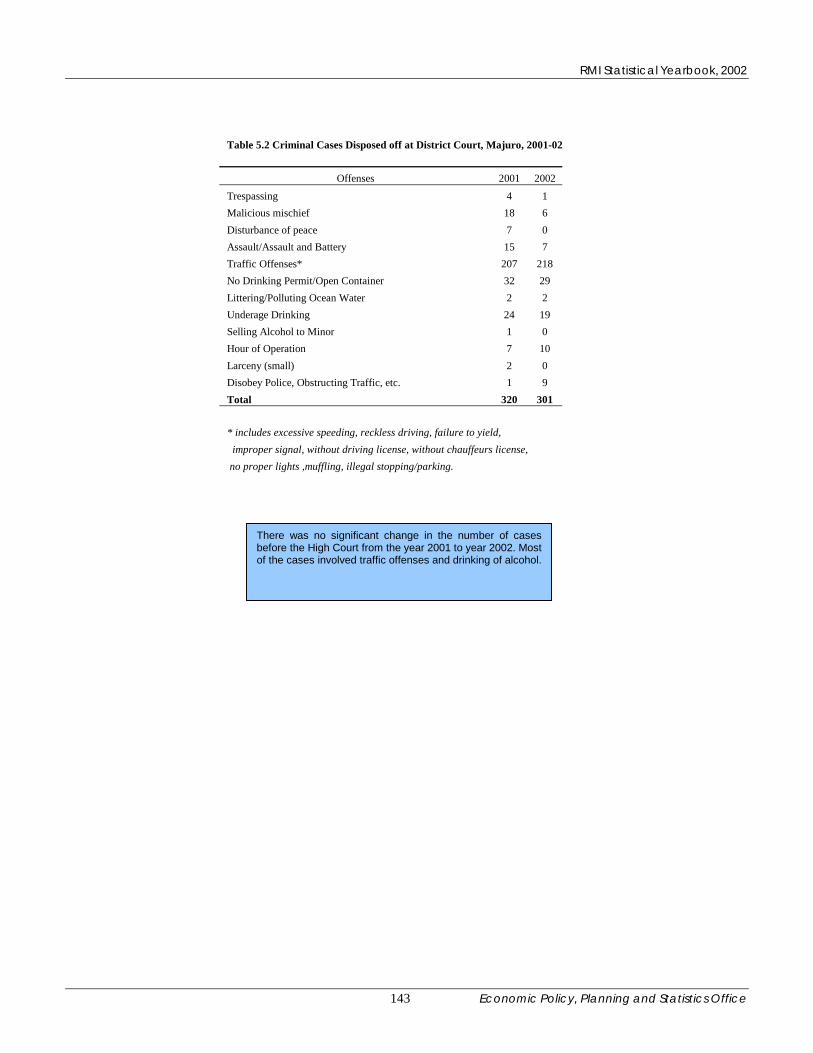
RMI Statistical Yearbook, 2002
Economic Policy, Planning and Statistics Office 143
Table 5.2 Criminal Cases Disposed off at District Court, Majuro, 2001-02
Offenses 2001 2002 Trespassing 4 1 Malicious mischief 18 6 Disturbance of peace 7 0 Assault/Assault and Battery 15 7 Traffic Offenses* 207 218 No Drinking Permit/Open Container 32 29 Littering/Polluting Ocean Water 2 2 Underage Drinking 24 19 Selling Alcohol to Minor 1 0 Hour of Operation 7 10 Larceny (small) 2 0 Disobey Police, Obstructing Traffic, etc. 1 9 Total 320 301 * includes excessive speeding, reckless driving, failure to yield, improper signal, without driving license, without chauffeurs license, no proper lights ,muffling, illegal stopping/parking.
There was no significant change in the number of cases before the High Court from the year 2001 to year 2002. Most of the cases involved traffic offenses and drinking of alcohol.

RMI Statistical Yearbook, 2002
Economic Policy, Planning and Statistics Office 144
Table 5.3 Number of Criminal Cases disposed of at the District Court Majuro, 1996-2002
Year No. of Cases Disposed of
1996 180 1997 161 1998 70 1999 210 2000 179 2001 320 2002 301
Source: District Court Majuro
Fig. 5.2 Number of Criminal Cases Disposed of at District Court Majuro,1996-2002
180 161
70
210179
320 301
050
100150200250300350
1996 1997 1998 1999 2000 2001 2002
Years
No.
of C
ases

RMI Statistical Yearbook, 2002
Economic Policy, Planning and Statistics Office 145
Table 5.4 No. of Criminal and Civil Cases Decided at the District Court Ebeye, 1996-2002
Offences 1996 1997 1998 1999 2000 2001 2002 Assault and Battery 0 0 4 1 7 5 12 Negligent Driving* 0 2 0 0 3 12 0 Drunken Driving 0 12 2 7 21 5 14 No Registration Card 5 2 10 44 55 7 26 Malicious mischief 2 1 2 63 4 44 114 Disturbance of peace 0 0 1 1 0 0 4 Larceny(grand and small) 0 0 0 0 1 2 0 All others** 45 55 58 98 242 294 390 Total 52 72 77 214 333 369 560 ** It includes remaining criminal cases and civil cases. Source: District Judge Ebeye.
Fig. 5.3 Number of Cases Decided at District Court Ebeye, 1996-2002
52 72 77
214
333369
560
0
100
200
300
400
500
600
1996 1997 1998 1999 2000 2001 2002
Years
No.
of C
ases

RMI Statistical Yearbook, 2002
Economic Policy, Planning and Statistics Office 146
Table 5.5 Position of Criminal Cases at the District Court Ebeye,1997-2002 Description 1997 1998 1999 2000 2001 2002 No. at the beginning of the year 15 35 44 148 242 300 No. Filed during the year 57 42 170 185 127 260 No. Decided during the year 37 33 66 91 69 98 No. Outstanding at the end ofe year 35 44 148 242 300 462 Source: District Court Ebeye
0100200300400500
No.
of C
ases
1997
1998
1999
2000
2001
2002
Years
Fig. 5.4 No. of Criminal Cases Decided and No. Pending at District Court Ebeye,1997-2002
Cases DecidedCases Pending

RMI Statistical Yearbook, 2002
Economic Policy, Planning and Statistics Office 147
Table 5.6 Police Force in RMI,1991, 1996, 2001and 2002
Description 1991 1996 2001 2002
National Majuro 102 105 106 106 National Ebeye 33 30 27 21 National Jabwor … … 6 6 Local Majuro 44 50 96 96 Local Ebeye 55 47 57 43 Sea Patrol … … 29 25 Other Atolls … … … 155
Total … … … 452 … Not Known Source: Concerned Offices
Fig. 5.5 Police Force in Majuro, Ebeye and Jabwor over years
102 105 106 106
33 30 2721
0 06 6
4455 57
43
50
9696
47
0
20
40
60
80
100
120
1991 1996 2001 2002
Year
Num
ber i
n Po
lice
Forc
e
NationalMajuroNationalEbeyeNationalJabworLocalMajuroLocalEbeye

RMI Statistical Yearbook, 2002
Economic Policy, Planning and Statistics Office 148
Table 5.7 Local Government Police Force in Different Atolls in RMI, 2002
Atoll No. of
Persons Majuro 96 Ebeye 43 Likiep 6 Aur 12 Arno 17 Mejit 6 Wotja 10 Jaluit 12 Maloelap 14 Wotha 2 Namdrik 4 Mili 8 Namu 8 Ailinglaplap 15 Ebon 7 Ujae 4 Ailuk 7 Kili 19 Lae 4 Total 294 Source: Ministry of Internal Affairs

RMI Statistical Yearbook, 2002
Economic Policy, Planning and Statistics Office 149
Table 5.8 Traffic Accidents, Various Traffic Violations, Drunken Driving and Citations Issued by the National and
Local Government Police at Different Places in the RMI, 2002 Description National Local Govt. Total Natioal Police National Local Govt. Total Grand Police,Majuro Police,Majuro Majuro Jabwor Police,Ebeye Police, Ebeye Ebeye Total Traffic Accidents 240 144 384 0 32 0 32 416 Drunken Driving 86 69 155 0 36 0 36 191 Other Traffic Violations 461 1,197 1,658 3 259 46 305 1,666 Traffic Citations Issued 312 213 525 3 68 46 114 574 Source: Concerned Police Authorities
Majuro Ebeye Majuro Ebeye 384 32 156 36 Majuro Ebeye Majuro Ebeye 1,658 305 525 114

RMI Statistical Yearbook, 2002
Economic Policy, Planning and Statistics Office 150
able 5.9 Details of Various Traffic Violations in Majuro as Detected by the National Police, 2002 Type of Violation Number of Violations No Registration Card 31 No Driver License 47 Driver License not Possessing 92 Chauffeur License Not Possessing 27 Disobey Traffic Signal 53 Unsafe Passing 14 Following too closely 4 Failure to yield vehicle 23 Failure to yield Pedestrian 4 Improper Signal 7 Excessive Speed 23 Drunken Driving 86 Illegal Park/Stop 91 Obstructing Driver 9 Faulty Head lamp 26 Faulty Tail lamp 10 Total 547 Source: Traffic Investigation Division, Department of Public Safety, Majuro
Fig 5.11 Details of Traffic Violations Detected in Majuro by National Police in 2002
020406080
100
No
Reg
istra
tion
Driv
erLi
cens
e no
t
Dis
obey
Traf
fic
Follo
win
gto
o cl
osel
y
Failu
re to
yiel
d
Exce
ssiv
eSp
eed
Illeg
alPa
rk/S
top
Faul
ty H
ead
lam
p
Type of Traffic Violation
Num
bers
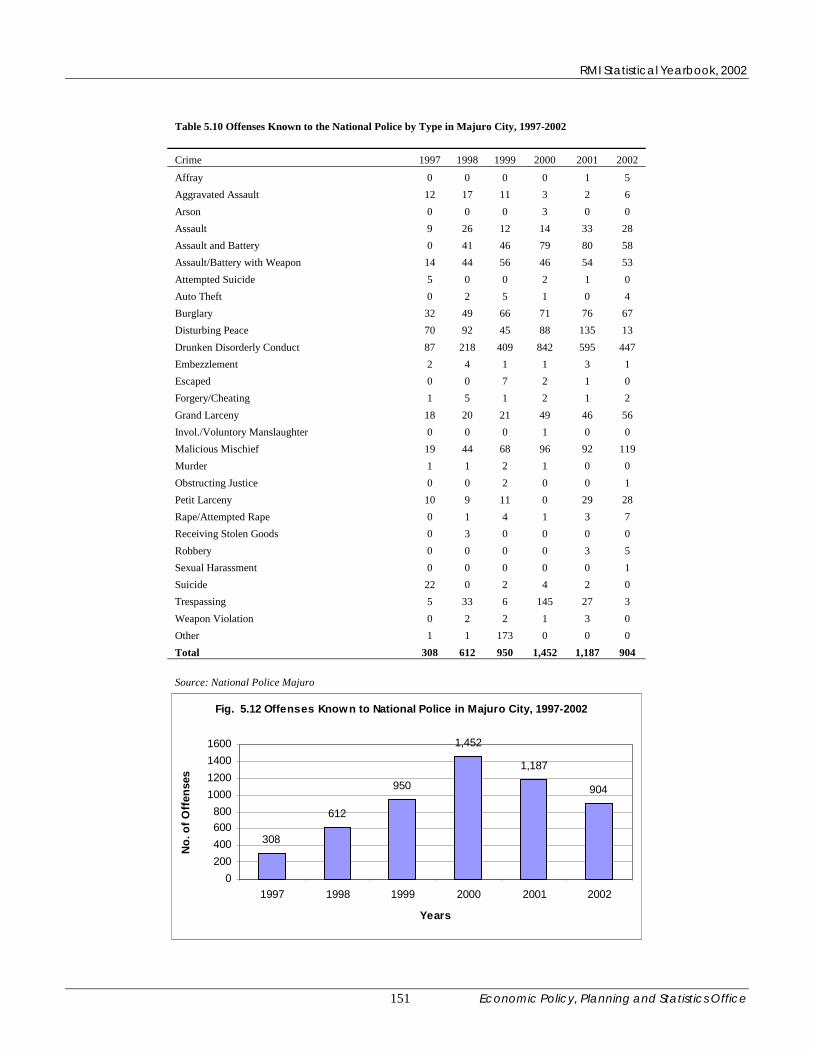
RMI Statistical Yearbook, 2002
Economic Policy, Planning and Statistics Office 151
Table 5.10 Offenses Known to the National Police by Type in Majuro City, 1997-2002 Crime 1997 1998 1999 2000 2001 2002
Affray 0 0 0 0 1 5 Aggravated Assault 12 17 11 3 2 6 Arson 0 0 0 3 0 0 Assault 9 26 12 14 33 28 Assault and Battery 0 41 46 79 80 58 Assault/Battery with Weapon 14 44 56 46 54 53 Attempted Suicide 5 0 0 2 1 0 Auto Theft 0 2 5 1 0 4 Burglary 32 49 66 71 76 67 Disturbing Peace 70 92 45 88 135 13 Drunken Disorderly Conduct 87 218 409 842 595 447 Embezzlement 2 4 1 1 3 1 Escaped 0 0 7 2 1 0 Forgery/Cheating 1 5 1 2 1 2 Grand Larceny 18 20 21 49 46 56 Invol./Voluntory Manslaughter 0 0 0 1 0 0 Malicious Mischief 19 44 68 96 92 119 Murder 1 1 2 1 0 0 Obstructing Justice 0 0 2 0 0 1 Petit Larceny 10 9 11 0 29 28 Rape/Attempted Rape 0 1 4 1 3 7 Receiving Stolen Goods 0 3 0 0 0 0 Robbery 0 0 0 0 3 5 Sexual Harassment 0 0 0 0 0 1 Suicide 22 0 2 4 2 0 Trespassing 5 33 6 145 27 3 Weapon Violation 0 2 2 1 3 0 Other 1 1 173 0 0 0 Total 308 612 950 1,452 1,187 904 Source: National Police Majuro
Fig. 5.12 Offenses Known to National Police in Majuro City, 1997-2002
308
612
950
1,452
1,187
904
0200400600800
1000120014001600
1997 1998 1999 2000 2001 2002
Years
No.
of O
ffen
ses

RMI Statistical Yearbook, 2002
Economic Policy, Planning and Statistics Office 152
Table 5.11 Monthly Crime Statistics Reported by National Police Majuro, 2002 Type of Crime Jan. Feb. March April May June July Aug. Sept. Oct. Nov. Dec. Total
Assault 2 1 3 3 4 0 1 2 0 5 5 2 28 DDC 42 29 33 23 26 28 40 32 21 50 49 74 447 Burglary 3 3 12 6 7 9 5 9 3 2 6 2 67 Malicious Mischief 6 9 17 10 8 12 8 6 7 12 14 10 119 Auto Theft 1 1 1 0 0 0 0 0 0 0 0 1 4 Obstructing Justice 0 0 0 0 0 0 0 0 0 0 0 1 1 Trespass 0 0 0 0 0 0 0 0 2 0 0 1 3 Grand Larceny 3 10 4 5 2 5 3 7 4 4 4 5 56 Disturbing Peace 1 1 4 0 0 2 0 1 0 1 0 3 13 Assault & Battery 5 2 7 2 9 3 3 1 4 7 8 7 58 Sexual Harassment 0 0 0 0 0 0 0 0 0 0 0 1 1 A.B W/Danger. Weapon 5 3 5 5 2 5 5 5 3 9 2 4 53 Petit Larceny 0 2 4 3 3 3 3 5 0 3 1 1 28 Rape 1 1 0 0 0 0 0 0 0 0 1 0 3 Affray 2 0 0 0 0 0 2 0 1 0 0 0 5 Aggravated Assault 0 0 0 0 3 1 1 1 0 0 0 0 6 Embezzlement 0 0 0 0 0 1 0 0 0 0 0 0 1 Forgery 0 0 0 0 0 1 0 0 0 0 0 0 1 Robbery 0 0 0 1 1 2 0 0 0 0 1 0 5 Attempted Rape 0 0 0 0 0 0 1 1 1 1 0 0 4 Cheating 0 0 0 0 0 0 0 1 0 0 0 0 1
Total 71 62 90 58 65 72 72 71 46 94 91 112 904 Source: Criminal Investigation Division, National Police Majuro
Fig 5.13 Incidence of Crime as detected by the National Police Majuro in 2002 by Months
7162
90
5865
72 72 71
46
94 91
112
0
20
40
60
80
100
120
Jan.. Feb. March April May June July Aug. Sept. Oct. Nov. Dec.
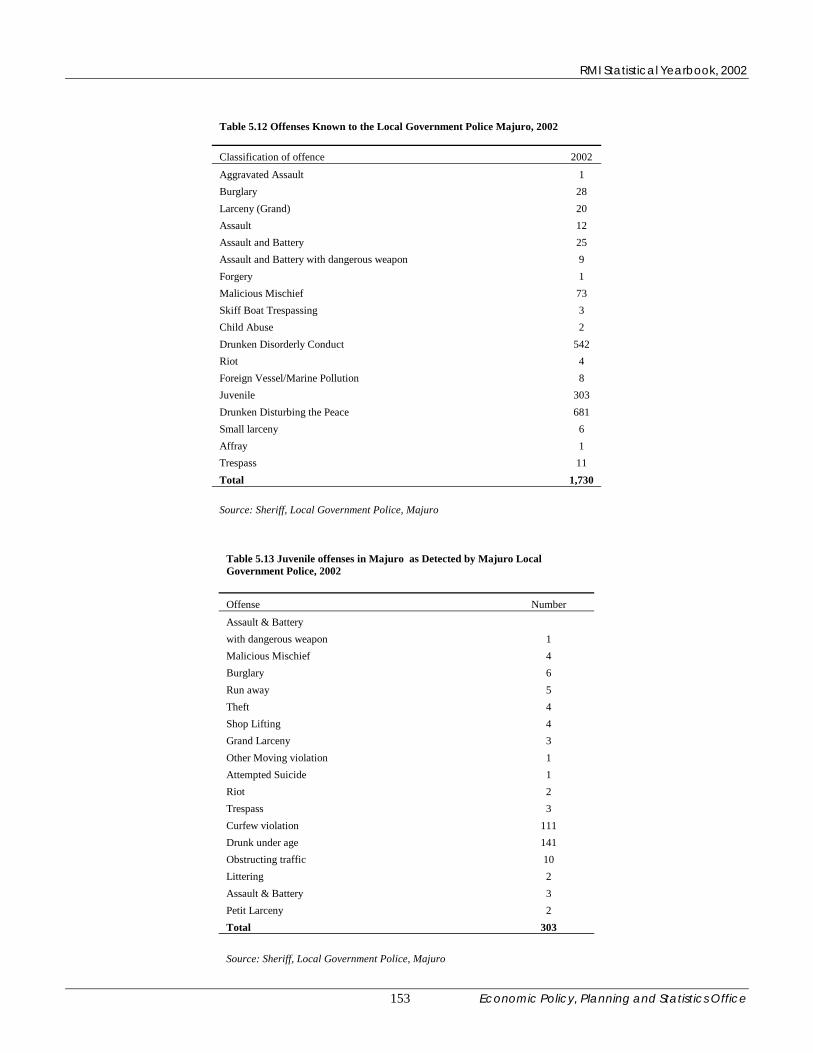
RMI Statistical Yearbook, 2002
Economic Policy, Planning and Statistics Office 153
Table 5.12 Offenses Known to the Local Government Police Majuro, 2002
Classification of offence 2002
Aggravated Assault 1 Burglary 28 Larceny (Grand) 20 Assault 12 Assault and Battery 25 Assault and Battery with dangerous weapon 9 Forgery 1 Malicious Mischief 73 Skiff Boat Trespassing 3 Child Abuse 2 Drunken Disorderly Conduct 542 Riot 4 Foreign Vessel/Marine Pollution 8 Juvenile 303 Drunken Disturbing the Peace 681 Small larceny 6 Affray 1 Trespass 11 Total 1,730 Source: Sheriff, Local Government Police, Majuro
Table 5.13 Juvenile offenses in Majuro as Detected by Majuro Local Government Police, 2002 Offense Number
Assault & Battery with dangerous weapon 1 Malicious Mischief 4 Burglary 6 Run away 5 Theft 4 Shop Lifting 4 Grand Larceny 3 Other Moving violation 1 Attempted Suicide 1 Riot 2 Trespass 3 Curfew violation 111 Drunk under age 141 Obstructing traffic 10 Littering 2 Assault & Battery 3 Petit Larceny 2 Total 303 Source: Sheriff, Local Government Police, Majuro

RMI Statistical Yearbook, 2002
Economic Policy, Planning and Statistics Office 154
Table 5. 14 Number of Offenses Known to the National Police in Ebeye, 1996-2002
Year Number of Offenses
1996 221 1997 395 1998 318 1999 302 2000 406 2001 854 2002 1,368
Source: National Police, Ebeye
Fig. 5. 14 Number of Offenses Known to National Police in Ebeye, 1996-2002
395 406
854
1,368
302318221
0200400600800
1000120014001600
1996 1997 1998 1999 2000 2001 2002
Years
Num
ber o
f Off
ense
s

RMI Statistical Yearbook, 2002
Economic Policy, Planning and Statistics Office 155
Table 5. 15 Offenses known to the National Police by offence, Ebeye, 2001 and 2002 Classification of offence 2001 2002
Murder 0 0 Rape 5 2 Aggravated Assault 0 6 Burglary 40 49 Larceny (Grand) 44 45 Auto theft 0 2 Assault 56 98 Assault and Battery 98 113 Assault and Battery with dangerous weapon 29 30 Forgery 0 1 Embezzlement 0 0 Receiving stolen goods 1 8 Weapon violation 1 1 Drunken disorderly conduct 12 38 Escaped 11 15 Suicide 0 3 Attempted suicide 0 6 Arson 1 0 Malicious mischief 25 59 Trespassing 27 24 Disturbing the peace 284 605 Obstructing justice 17 32 Small larceny 0 19 Robbery 5 3 Affray 64 81 Others 134 128 Total 854 1368 Source: Ebeye National Police
There was a 60.2 percent increase in offences on Ebeye from 854 cases in 2001 to 1,368 cases in2002. The largest increase was in cases of disturbing the peace including drunken disorderlybehavior. Burglary and Larceny cases also showed increases. The incidences of assault andbattery cases were also on the rise.

RMI Statistical Yearbook, 2002
Economic Policy, Planning and Statistics Office 156
Table 5.16 Juvenile Offenses in Ebeye city as Detected by the Ebeye National Police , 2002 Offense No.
Affray 17 Assault 31 Assault and Battery 4 Assault and Battery with dangerous weapon 1 Burglary 9 Disturbing the Peace 13 Grand Larceny 8 Drunken Disorderly conduct 3 Malicious Mischief 3 Petit Larceny 3 Escape 1 Riot 31 Curfew 4 Substance Abuse 8 Underage Drinking 5 Drinking in Public 3 Total 144
Source: National Police, Ebeye
Fig 5.15 Juvenile Offences as Detected by the National Police Ebeye, 2002
0 5 10 15 20 25 30 35
A ffray
A ssault
A ssault and B attery
A ssault and B attery with dangerous weapon
B urglary
D isturbing the P eace
G rand Larceny
D runken D isorderly conduct
M alicious M ischief
P etit Larceny
Escape
R iot
C urfew
Substance Abuse
Underage D rinking
D rinking in P ublic

RMI Statistical Yearbook, 2002
Economic Policy, Planning and Statistics Office 157
Table 5.17 Offenses known to the National Government Police by offence in Sub-station Jabor (Jaluit), 2002 Classification of offence 2002 Murder 0 Rape 0 Aggravated Assault 0 Burglary 0 Larceny (Grand) 3 Auto theft 0 Assault 0 Assault and Battery 0 Assault and Battery with dangerous weapon 1 Forgery 0 Embezzlement 0 Receiving stolen goods 0 Weapon violation 0 Drunken disorderly conduct 44 Escaped 0 Suicide 0 Attempted suicide 1 Arson 0 Malicious mischief 0 Trespassing 5 Disturbing the peace 0 Obstructing justice 0 Small larceny 0 Robbery 0 Affray 3 Others 0 Total 57 Source: National Police Sub-station, Jaluit Atoll
Table 5. 18 Total Number of persons arrested by sex and age by the National & Local Government Police at Majuro, Ebeye and Jaluit, 2002 Age Male Female Total Percent <17 546 77 623 17.3 18-19 1,288 77 1,365 37.7 20-30 1,092 68 1,160 32.1 31-40 337 18 355 9.8 41-50 81 7 88 2.4 51+ 25 0 25 0.7 Total 3,369 247 3,616 100.0 Source: Police Authorities Concerned
Fig 5.16 Total number of persons Arrested in RMI by Age and Sex in 2002
546
1288
1092
337
2581
70
687777180
200400600800
100012001400
<17 18-19 20-30 31-40 41-50 51+
Age Group
Num
ber o
f Per
sons
MaleFemale

RMI Statistical Yearbook, 2002
Economic Policy, Planning and Statistics Office 158
Table 5.19 Persons Arrested by National Police Majuro by Age and Sex, 2002 Age Male Female Total <17 103 14 117 18-19 926 64 990 20-30 101 29 130 31-40 24 0 24 41-50 6 1 7 51+ 0 0 0 Total 1,160 108 1,268 Source: National Police, Ebeye
Fig. 5.17 Persons Arrested by Age and Sex in Majuro by National Police in 2002
103
926
101 24 6 014 64 29 0 1 00200
400600
8001000
<17 18-19 20-30 31-40 41-50 51+
Age Groups
No.
of P
erso
ns
MaleFemale
Table 5.20 Persons Arrested by Local Government Police, Majuro by Age and Sex, 2002 Age Male Female Total <17 244 59 303 18-19 105 9 114 20-30 546 17 563 31-40 166 12 178 41-50 48 3 51 51+ 14 0 14 Total 1,123 100 1,223 Source: Sheriff, Local Government Police, Majuro
Fig 5.18 Persons Arrested by Age and Sex in Majuro by Local Government Police in 2002
244
105
546
166
48 1459
9 12 3 0170100200300400500600
<17 18-19 20-30 31-40 41-50 51+
Age Groups
No.
of P
erso
ns
MaleFemale

RMI Statistical Yearbook, 2002
Economic Policy, Planning and Statistics Office 159
Table 5.21 Persons Arrested by National Police Ebeye by Age and Sex in 2002 Age Male Female Total <17 82 1 83 18-19 125 0 125 20-30 373 7 380 31-40 120 3 123 41-50 22 1 23 51+ 9 0 9 Total 731 12 743 Source: National Police, Ebeye
Fig. 5.19 Persons Arrested by Age and Sex, in Ebeye by National Police in 2002
82125
373
120
22 91 0 7 3 1 00
100
200
300
400
<17 18-19 20-30 31-40 41-50 51+
Age Groups
No.
of P
erso
ns
MaleFemale
Table 5.22 Persons Arrested by Local Government Police Ebeye by Age and Sex in 2002 Age Male Female Total <17 64 3 67 18-20 120 4 124 21-30 55 15 70 31-40 26 3 29 41-50 5 2 7 51+ 2 0 2 Total 272 27 299 Source: KALGOV Police Department
Fig. 5.20 Persons Arrested by Age and Sex in Ebeye by Local Government Police in 2002
64
120
55
265 23 4
153 2 00
20406080
100120140
<17 18-20 21-30 31-40 41-50 51+
Age Groups
No.
of P
erso
ns
MaleFemale
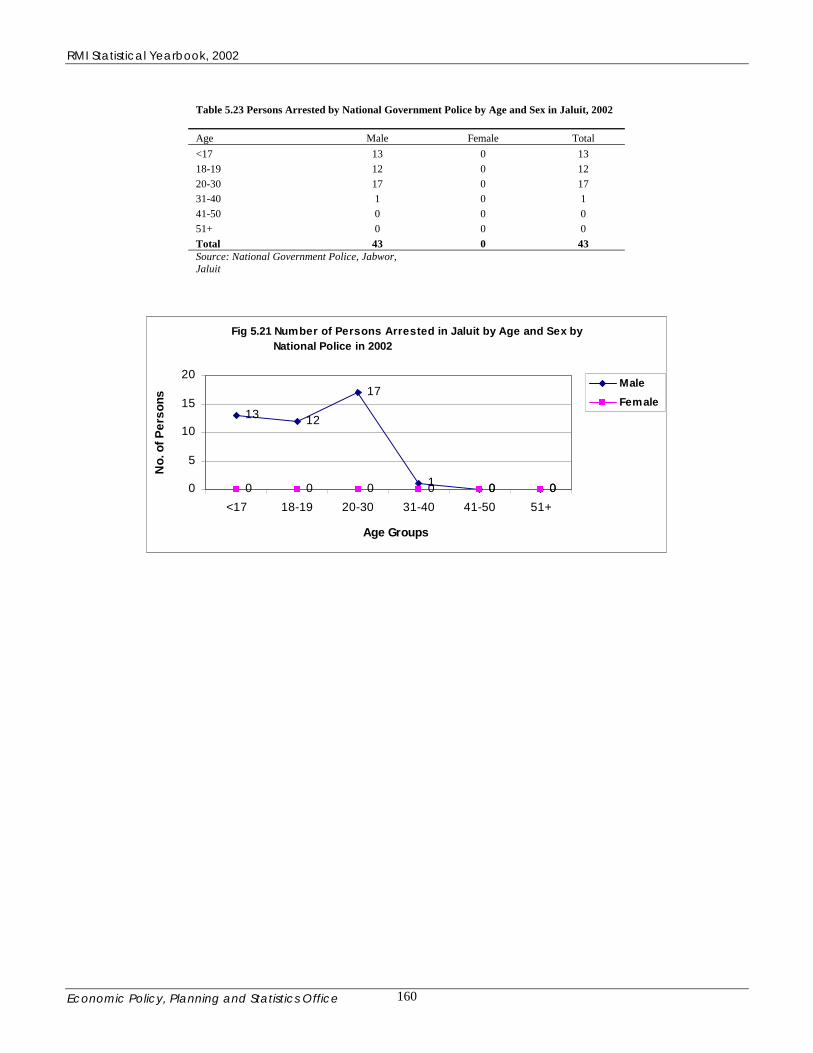
RMI Statistical Yearbook, 2002
Economic Policy, Planning and Statistics Office 160
Table 5.23 Persons Arrested by National Government Police by Age and Sex in Jaluit, 2002 Age Male Female Total <17 13 0 13 18-19 12 0 12 20-30 17 0 17 31-40 1 0 1 41-50 0 0 0 51+ 0 0 0 Total 43 0 43 Source: National Government Police, Jabwor, Jaluit
Fig 5.21 Number of Persons Arrested in Jaluit by Age and Sex by National Police in 2002
13 12
17
1 0 00 0 0 0 0 00
5
10
15
20
<17 18-19 20-30 31-40 41-50 51+
Age Groups
No.
of P
erso
ns
MaleFemale

RMI Statistical Yearbook, 2002
Economic Policy, Planning and Statistics Office 161
Chapter 6- Consumer Prices Consumer Price Index The Consumer Price Index measures the change in prices for a fixed market basket of goods and services over time. This important economic statistic is the principal means that a country uses to measure inflation, in the case of rising prices, or deflation, if prices are decreasing. In order to convert prices into index numbers, the prices or other relatives are weighted. While conducting the budget enquiry, the amount spent on each item by an average family is decided and that constitute the weights. Because consumption pattern and life styles of people change over time, it is also necessary to conduct a new Household Income and Expenditure Survey to determine the new baskets of various items of expenditure and weights thereof. The CPI is then based on the new ground realities. In the Marshall Islands, the CPI was developed in 1977 by the then Office of Planning and Statistics of the Trust Territory of the Pacific Islands in Saipan. Although the RMI continued to rely upon this CPI, (which was only for the price levels in Majuro), the methodology utilized for deciding various items of consumptions and services and assigning them weights was questionable when they were not based on formal survey. In this background, ultimately a proper Household Income and Expenditure Survey with representation to all classes and covering all areas on random basis, was carried out. Survey Overview: Over a 2-month period from April to May 2002, the Office of Planning and Statistics, which was renamed the Economic Policy, Planning and Statistics Office (EPPSO), of the Republic of the Marshall Islands (RMI), conducted a Household Income and Expenditure Survey (HIES) from April 1 until mid-May. The staff selected four sample areas of Majuro, Ebeye, Jaluit and Likiep. The selection of these sample areas was judgmental and was based on choosing the largest population centers (Majuro and Ebeye) and then two other areas that were logistically feasible to reach in conducting the survey and were in the middle of the islands that were ranked by population. This survey used two types of survey methods to gather data. For the more expensive and less frequently purchased items, such as major appliances, electronic goods, new and used vehicles, etc., a pre-printed, survey questionnaire was completed by an interviewer. For those items which are more frequently purchased, such as food, tobacco, drinks, etc., the household respondent was given a diary to record all purchases during a one-week period. Household Sample: A total sample size of 700 in all four areas was used for the questionnaire portion of the survey. Remarkably, a total of 657 households agreed to participate. For any country getting such a high participation rate is an enviable achievement. For the diary portion of the survey, 355 households participated. Selection of the Item Sample: In the summer of 2002, staff members of the U.S. Bureau of the Census International Program’s Center processed the RMI’s HIES data. These items and expenditures were arrayed using the U.S. Bureau of Labor Statistics CPI classification system as a frame of reference. Then, using a statistical technique called “Probability Proportionate to Size”, a new item sample was selected. Using the PPS technique to select the item sample ensured that those items with the highest monthly household expenditures were selected in the sample. The sample included a total of 61 items compared in the revised CPI.

RMI Statistical Yearbook, 2002
Economic Policy, Planning and Statistics Office 162
Expanding the Major Groups: Using the BLS Classification System as a frame of reference allowed the EPPSO to expand the number of groups included in the RMI’s CPI. Instead of having four major groups, the revised CPI now has 9 major groups. Having more groups allows the users to understand better which groups are responsible for the increases/decreases of the CPI. In the previous CPI, for example, alcoholic beverages were a part of the Food Group. Now, it is one of the 5 new groups. The others are: Housing, Utilities and Appliances, Medical Care, Education and Communication and Other Goods and Services. Expansion of the Outlet Sample: The previous CPI collected price data from 4 different outlets. In the revised CPI, the number of retail outlets has been expanded by more than ten-fold and the outlet sample now consists of 46 different retail outlets. These are more diversified and geographically dispersed throughout Majuro. This substantially larger outlet sample ensures that the EPPSO collects retail price data from a wide variety of outlets. Data Collection and Price Review Manual: The EPPSO has made another enhancement to the CPI by increasing the data collection training and by formalizing this vital aspect of price collection by developing a Data Collection Manual. This new manual covers virtually all aspects of price collection ranging from initiating the retail outlet to the rules for selecting a retail item and re-pricing. This new manual will improve data collection quality because it will provide guidance to the data collectors in handling almost any type of re-pricing situation. Linking the Old and New CPIs: In the 1st Quarter of 2003, data collectors collected price data for both the old and revised CPIs and the two indexes were “spliced” together at that point. In order for two indexes to be linked together, there must be at least one period where prices are collected for both the old and the new indexes. Beginning in the 2nd Quarter 2003, the EPPSO collected price data for only the items in the revised CPI. From the 4th Quarter 2002 to the 1st Quarter 2003, the price change was based on the previous CPI; from the 1st to the 2nd Quarters 2003, the price movement reflected the change in prices for revised CPI. But it may be kept in mind that the current CPI is reflective of the price levels in Majuro only. Efforts are being made to include price levels from other areas of the RM as well. Changing the Base Period: Another change in the CPI was rebasing it from 1882 = 100 to the 1st Quarter 2003 = 100. This is a mathematical change in the CPI but the more recent base period will make the CPI easier for users to understand. It may be clarified that the price levels under the CPI base 2003 as presented in the tables under this chapter is based on the prices in Majuro only and does not reflect changes in prices levels in other areas of the RMI.

RMI Statistical Yearbook, 2002
Economic Policy, Planning and Statistics Office 163
Table 6.1 Items Taken for Price Collection with Weights
Item Number Item Code Item Title Weight
100000 All Items 100.00
110000 Food 35.91 101000 Bread and Cereals 9.83
1 101001 Cereals (breakfast cereal, etc.) 0.48 2 101002 Rice 4.86 3 101003 Flour 1.43 4 101005 Ramen and other instant noodles 1.04 5 102001 Bread 1.15 6 102003 Donuts, pastries, etc. 0.87 103000 Meats, Poultry, Fish and Eggs 16.37
7 103001 Steak/beef (all types) 0.73 8 103003 Canned corned beef 2.42 9 105002 Canned luncheon meat (Spam, etc.) 1.42
10 106001 Whole chicken (frying chicken, etc.) 2.02 11 106002 Turkey and turkey parts 1.41 12 106003 Chicken legs 3.11 13 106004 Chicken breasts and all other parts 0.42 14 107001 Canned mackerel 0.70 15 107002 Canned tuna 2.05 16 107007 Fresh deep-sea fish (tuna, marlin, wahoo, etc.) 0.52 17 107008 Fresh reef fish 0.67 18 108001 Eggs 0.91
109000 Dairy Products 1.07 19 109002 Milk - evaporated 0.53 20 109004 Ice cream 0.54
111000 Fruits and Vegetables 0.52 21 111099 Other fruits and vegetables 0.52
113000 Non-alcoholic Beverages 4.22 22 113002 Coke 0.79 23 113003 Pepsi 0.59 24 113005 Colas- all others 0.75 25 113006 Coffee (instant coffee) 0.91 26 113008 Bottled water/spring water 0.58 27 113011 Drink mix (KoolAid, Luau mix, etc.) 0.60
114000 Sugar and Sweets 1.04 28 114002 Sugar 1.04
116000 Other Food at Home 1.79 29 116007 Chips- potato, banana, etc. 0.47 30 116008 Soy sauce 0.75 31 116099 Other food products 0.57
117000 Food Away from Home 1.07 32 117001 Plate lunch 0.40 33 117002 Restaurant meals 0.67
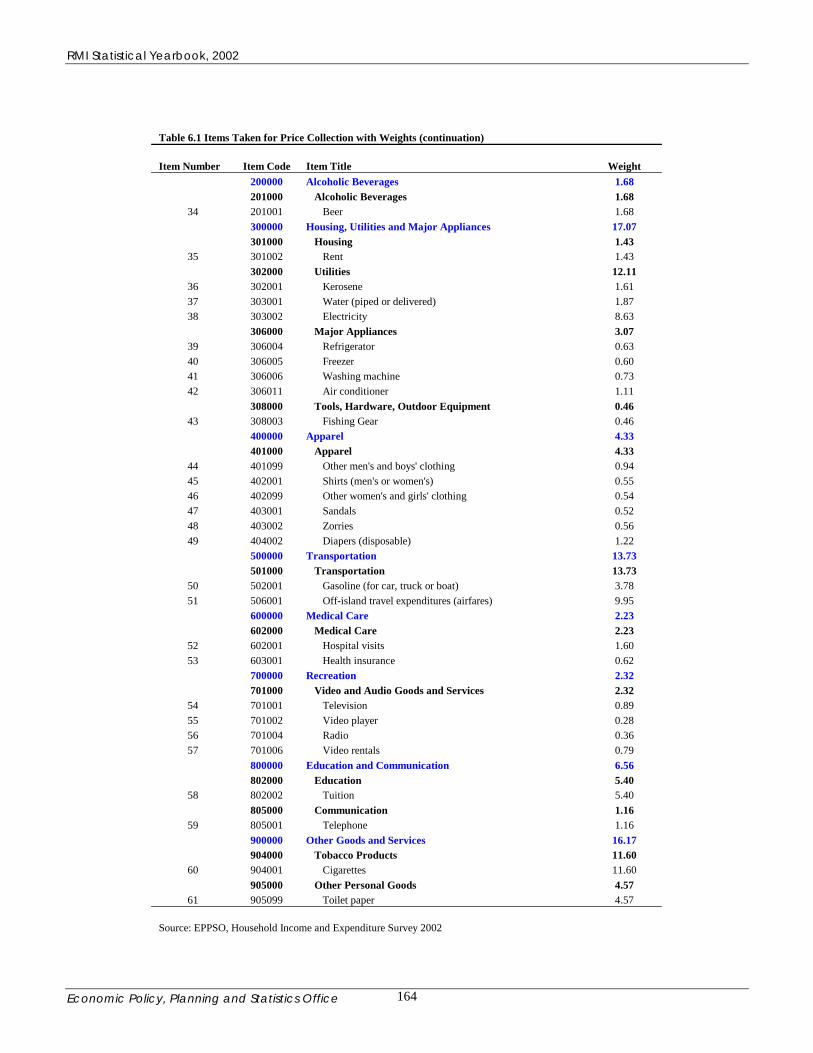
RMI Statistical Yearbook, 2002
Economic Policy, Planning and Statistics Office 164
Table 6.1 Items Taken for Price Collection with Weights (continuation) Item Number Item Code Item Title Weight
200000 Alcoholic Beverages 1.68 201000 Alcoholic Beverages 1.68
34 201001 Beer 1.68 300000 Housing, Utilities and Major Appliances 17.07 301000 Housing 1.43
35 301002 Rent 1.43 302000 Utilities 12.11
36 302001 Kerosene 1.61 37 303001 Water (piped or delivered) 1.87 38 303002 Electricity 8.63
306000 Major Appliances 3.07 39 306004 Refrigerator 0.63 40 306005 Freezer 0.60 41 306006 Washing machine 0.73 42 306011 Air conditioner 1.11
308000 Tools, Hardware, Outdoor Equipment 0.46 43 308003 Fishing Gear 0.46
400000 Apparel 4.33 401000 Apparel 4.33
44 401099 Other men's and boys' clothing 0.94 45 402001 Shirts (men's or women's) 0.55 46 402099 Other women's and girls' clothing 0.54 47 403001 Sandals 0.52 48 403002 Zorries 0.56 49 404002 Diapers (disposable) 1.22
500000 Transportation 13.73 501000 Transportation 13.73
50 502001 Gasoline (for car, truck or boat) 3.78 51 506001 Off-island travel expenditures (airfares) 9.95
600000 Medical Care 2.23 602000 Medical Care 2.23
52 602001 Hospital visits 1.60 53 603001 Health insurance 0.62
700000 Recreation 2.32 701000 Video and Audio Goods and Services 2.32
54 701001 Television 0.89 55 701002 Video player 0.28 56 701004 Radio 0.36 57 701006 Video rentals 0.79
800000 Education and Communication 6.56 802000 Education 5.40
58 802002 Tuition 5.40 805000 Communication 1.16
59 805001 Telephone 1.16 900000 Other Goods and Services 16.17 904000 Tobacco Products 11.60
60 904001 Cigarettes 11.60 905000 Other Personal Goods 4.57
61 905099 Toilet paper 4.57
Source: EPPSO, Household Income and Expenditure Survey 2002

RMI Statistical Yearbook, 2002
Economic Policy, Planning and Statistics Office 165
Table 6.2 Average Monthly Household Expenditure by Nine Major Groups, 2002 Groups Average Percent Food 512.12 30.93 Alcoholic Beverages 20.57 1.24 Housing, Utilities and Major Appliances 225.15 13.60 Apparel 56.99 3.44 Transportation 194.04 11.72 Medical Care 27.55 1.66 Recreation 33.14 2.00 Education and Communication 91.37 5.52 Other Goods and Services 494.84 29.89
Note: Data based on survey of 657 households on Majuro, Ebeye, Jabwor and Likiep Source: 2002 Household Income and Expenditure Survey
Fig 6.1 Percent Avg Monthly Household Expenditure, 2002
Transportation12%
Medical Care 2%
Recreation 2%
Other Goods andServices
30%Food 30%
Apparel 3%
Alcoholic Beverages 1%
Housing, Utilities andMajor Appliances
14%
Education andCommunication
6%
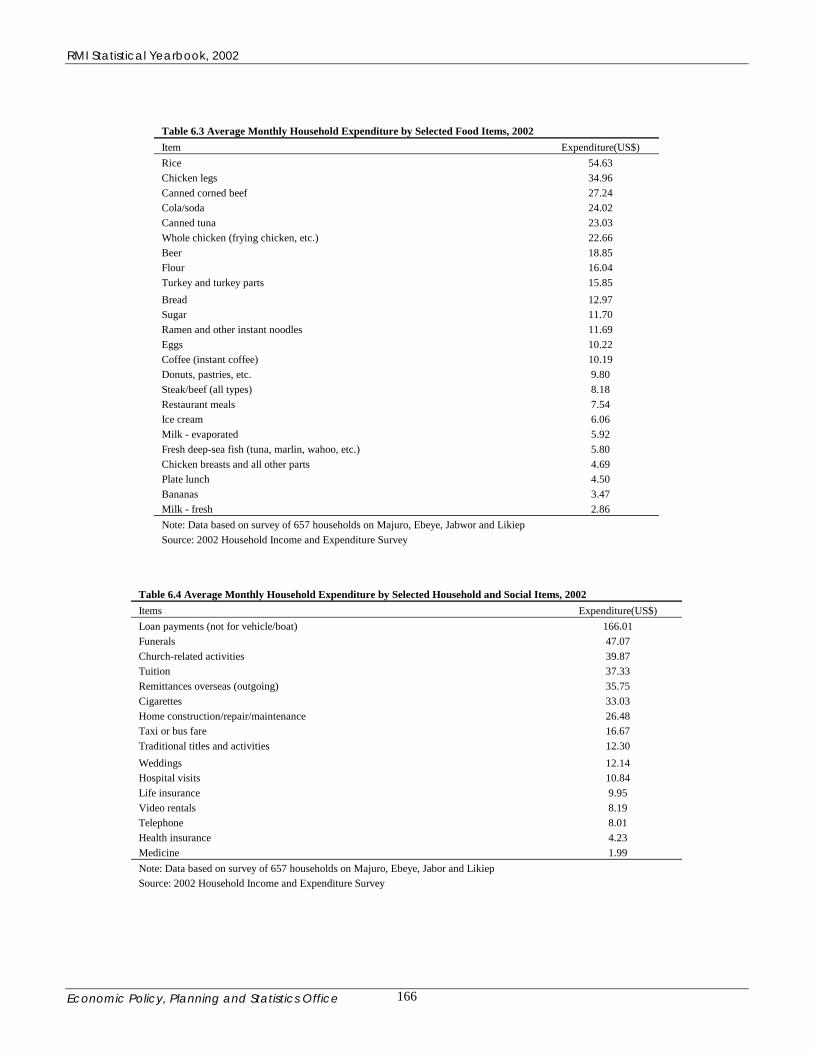
RMI Statistical Yearbook, 2002
Economic Policy, Planning and Statistics Office 166
Table 6.3 Average Monthly Household Expenditure by Selected Food Items, 2002 Item Expenditure(US$) Rice 54.63 Chicken legs 34.96 Canned corned beef 27.24 Cola/soda 24.02 Canned tuna 23.03 Whole chicken (frying chicken, etc.) 22.66 Beer 18.85 Flour 16.04 Turkey and turkey parts 15.85 Bread 12.97 Sugar 11.70 Ramen and other instant noodles 11.69 Eggs 10.22 Coffee (instant coffee) 10.19 Donuts, pastries, etc. 9.80 Steak/beef (all types) 8.18 Restaurant meals 7.54 Ice cream 6.06 Milk - evaporated 5.92 Fresh deep-sea fish (tuna, marlin, wahoo, etc.) 5.80 Chicken breasts and all other parts 4.69 Plate lunch 4.50 Bananas 3.47 Milk - fresh 2.86 Note: Data based on survey of 657 households on Majuro, Ebeye, Jabwor and Likiep Source: 2002 Household Income and Expenditure Survey
Table 6.4 Average Monthly Household Expenditure by Selected Household and Social Items, 2002 Items Expenditure(US$) Loan payments (not for vehicle/boat) 166.01 Funerals 47.07 Church-related activities 39.87 Tuition 37.33 Remittances overseas (outgoing) 35.75 Cigarettes 33.03 Home construction/repair/maintenance 26.48 Taxi or bus fare 16.67 Traditional titles and activities 12.30 Weddings 12.14 Hospital visits 10.84 Life insurance 9.95 Video rentals 8.19 Telephone 8.01 Health insurance 4.23 Medicine 1.99 Note: Data based on survey of 657 households on Majuro, Ebeye, Jabor and Likiep Source: 2002 Household Income and Expenditure Survey

RMI Statistical Yearbook, 2002
Economic Policy, Planning and Statistics Office 167
Table 6.5 RMI CONSUMER PRICE INDEX, 2003 FIRST QUARTER 2003 = 100 ALL 1 2 3 4 5 6 7 8 9 GROUPS GROUP GROUP GROUP GROUP GROUP GROUP GROUP GROUP GROUP
REVISED CPI BASE WEIGHTS 100.00 35.91 1.68 17.07 4.33 13.73 2.23 2.32 6.56 16.17 Q1 2003 100.00 100.00 100.00 100.00 100.00 100.00 100.00 100.00 100.00 100.00 Q2 2003 100.50 102.27 100.00 99.30 99.70 98.08 100.00 100.15 100.00 100.50 Q3 2003 100.99 103.09 103.79 99.24 102.08 97.65 100.00 100.10 100.00 101.08 Q4 2003 % CHANGE 0.48 0.80 3.79 -0.06 2.38 -0.44 0.00 -0.05 0.00 0.58 1: Food, 2: Alcoholic Beverages, 3:Housing, Utilities, 4:Apparel, 5: Transportation, 6: Medical, 7:Recreation, 8: Education & Communication, 9:Other Goods & Services SOURCE: EPPSO
Fig 6.2 Consumer Price Index during three quarters of 2003
99.4099.6099.80
100.00100.20100.40100.60100.80101.00101.20
Q1 2003 Q2 2003 Q3 2003
RMI Statistical Yearbook, 2002
Economic Policy, Planning and Statistics Office 168
Chapter 7-Water and Energy Water The Marshall Islands are heavily reliant on rainfall for its water supply. Natural ground water is limited to the wider land formations, such as Laura on Majuro. Only Ebeye on Kwajalein atoll and parts of Majuro Atoll are served by a public water supply service. The remaining islands rely mainly on roof catchments and wells for their water. The main source of water for Ebeye is desalinated seawater using two reverse osmosis machines each with capacities of 100,000 gallons per day. Majuro on the other hand relies on rainwater runoff from the 7,900 feet runway at the Amatma Kabua International Airport and ground water supplied from the Laura Lens. The water capacity of the reservoir is 36 million gallons. There is a shortage of water in the Marshall Islands, despite relatively high rainfall to most of the country. The current water availability to Majuro residents is approximately 26 gallons per person per day. In Ebeye it is approximately 24 gallons per person per day. Unrestricted water demand for the Marshall Islands has been estimated at 45 gallons per person per day. As a result, water is normally rationed in Ebeye and Majuro, with water supply restricted to limited hours and days depending up on the supply. Water availability on the outer islands is a significant challenge, particularly when rainfall is not timely or frequent. The Sanitation and Water Testing division of the Environment Protection Authority, is responsible for testing the quality of water used by residents for drinking purposes from different sources of supply. Salt water is made available to the residents of Majuro and Ebeye by the local water and sewer companies. Salt water is used for flushing toilets. According to the 1999 Census, out of total 6,478 households in the RMI, 404 households had public piped water inside the dwellings, 520 had public piped water outside the dwellings, the largest number 4,560, depended upon rain catchments, 223 were using water from wells, 353 were drinking bottled water and the remaining households used other means. Energy According to the 1999 Census, the main sources of energy were electricity (63.3 %), kerosene (30.9 %) and solar energy (5.2 %). For cooking, the main sources were kerosene (40.5 %), wood (29.9 %), electricity (26.3 %), propane gas (1.7 %) and charcoal (1.1 %). There are three power utility services in the Marshall Islands namely: Majuro, Ebeye and Jabwor (Jaluit Atoll). A new power station has been recently constructed on Wotje, but is not yet in service. On Kili, the local Government manages a power station to supply power to residents. In some other islands such as Mili, Enewetak, Namu, Wotje, Arno, Maloelap, there are some households who have small power generators. Solar energy is being used for lighting and for operation of HF radios in some of the islands. Energy issues for the Marshall Islands focus around the unavailability of energy in most of the rural areas. Considering the problems of electricity generation in the outer islands, the need to exploit affordable renewable energy sources such as solar and wind energy is vital for the improvement of the quality of life and development. Information on water supply and power generation in Majuro and Ebeye may be seen in the appended tables. The following are the highlights:

RMI Statistical Yearbook, 2002
Economic Policy, Planning and Statistics Office 169
Highlights • The source of drinking water varies from area to area in the RMI but on country as a
whole, 70.6 percent of total drinking water is from rainwater collection. • On average 20 million gallons of drinking water was supplied every month in 2000 to the
residents in Majuro and Laura by the Majuro Water Supply Company. • The drinking water is charged @ 0.6 cents per gallon from the residents of Majuro and 0.5
cents per gallon from those living in Laura. The salt water is charged at monthly flat rate of 10 US dollars in Majuro, whereas it is supplied free of charge by KAJUR Power Supply Company to the inhabitants of Ebeye. The drinking water in Ebeye is also charged at monthly flat rate of 25 US dollars per water connection.
• The electricity is cheaper in Majuro than in Ebeye. The charges for domestic users in Majuro were 12 cents per KWH and for commercial and government organizations the charge per KWH was 16 cents per KWH. But in Ebeye the domestic and commercial rates were 15.5 cents and 18.5 cents per KWH, respectively.
• The power generation in Majuro went up from 42,912 MW/HRS in 1990 to 79,764 MW/HRS in 2002, an increase of 85.9 percent in a period of 12 years. In Ebeye, the power production in 2002 was 16,184 MW/HRS, 15.5 percent more than the power generated in the previous year 2001.

RMI Statistical Yearbook, 2002
Economic Policy, Planning and Statistics Office 170
Table 7.1 Households (%) by Type of Fuel Used for Lighting by Atolls, RMI, 1999 Atoll/Island Use of Fuel for Lighting in Percentages Electricity Kerosene Solar Energy Others RMI 63.4 31.0 5.2 0.4 Ailinglaplap 3.4 86.0 9.7 0.9 Ailuk 1.2 76.1 20.4 2.3 Arno 7.0 77.0 15.6 0.4 Aur 1.2 93.0 5.8 0.0 Ebon 0.0 93.4 6.6 0.0 Enewetak 42.2 56.9 0.0 0.9 Jabat 0.0 26.7 73.3 0.0 Jaluit 35.8 63.3 0.0 0.9 Kili 100.0 0.0 0.0 0.0 Kwajalein 89.9 9.7 0.0 0.4 Lae 0.0 87.5 12.5 0.0 Lib 0.0 100.0 0.0 0.0 Likiep 16.0 76.6 6.2 1.2 Majuro 88.3 11.0 0.3 0.4 Maloelap 13.0 76.1 10.9 0.0 Mejit 0.0 100.0 0.0 0.0 Mili 3.7 83.1 13.2 0.0 Namdrik 0.0 4.2 94.9 0.9 Namu 2.4 93.6 2.4 1.6 Ujae 1.5 86.6 11.9 0.0 Utirik 1.5 38.5 60.0 0.0 Wotho 0.0 72.2 27.8 0.0 Wotje 6.5 77.6 15.9 0.0 Source: Census, 1999
Table 7.2 Percent Households With Electricity in Palau, FSM and RMI, 2000 Country % Households With Electricity Palau 98.0 FSM 53.6 RMI 68.5 Source: Ben Graham, IPC Statistical Enhancement Program, US Census Bureau
98.0
53.668.5
0.020.040.060.080.0
100.0
Perc
ent
Hou
seho
lds
Palau FSM RMI
Country
Fig 7.1 Percent Households With Electricity in Palau, FSM and RMI, 2000

RMI Statistical Yearbook, 2002
Economic Policy, Planning and Statistics Office 171
Table 7.3 No. of Electricity Customers in Majuro, 1990 to 2002 Year Commercial Government Metered Life Line All Others Total 1990 … … … … … 2,261 1995 … … … … … 2,327 1996 193 80 955 1,481 25 2,734 1997 203 87 905 1,604 39 2,838 1998 222 73 961 1,554 36 2,846 1999 258 70 1,621 1,067 18 3,034 2000 272 82 1,174 1,585 35 3,148 2001 389 124 1,125 1,525 39 3,202 2002 322 97 1,411 1,479 24 3,333 … Beak-up not available. Source: Marshalls Energy Company
Fig 7.2 Electricity Consumers in Majuro, 1990-2002
0
1,000
2,000
3,000
4,000
1990 1995 1996 1997 1998 1999 2000 2001 2002
Years
Num
ber
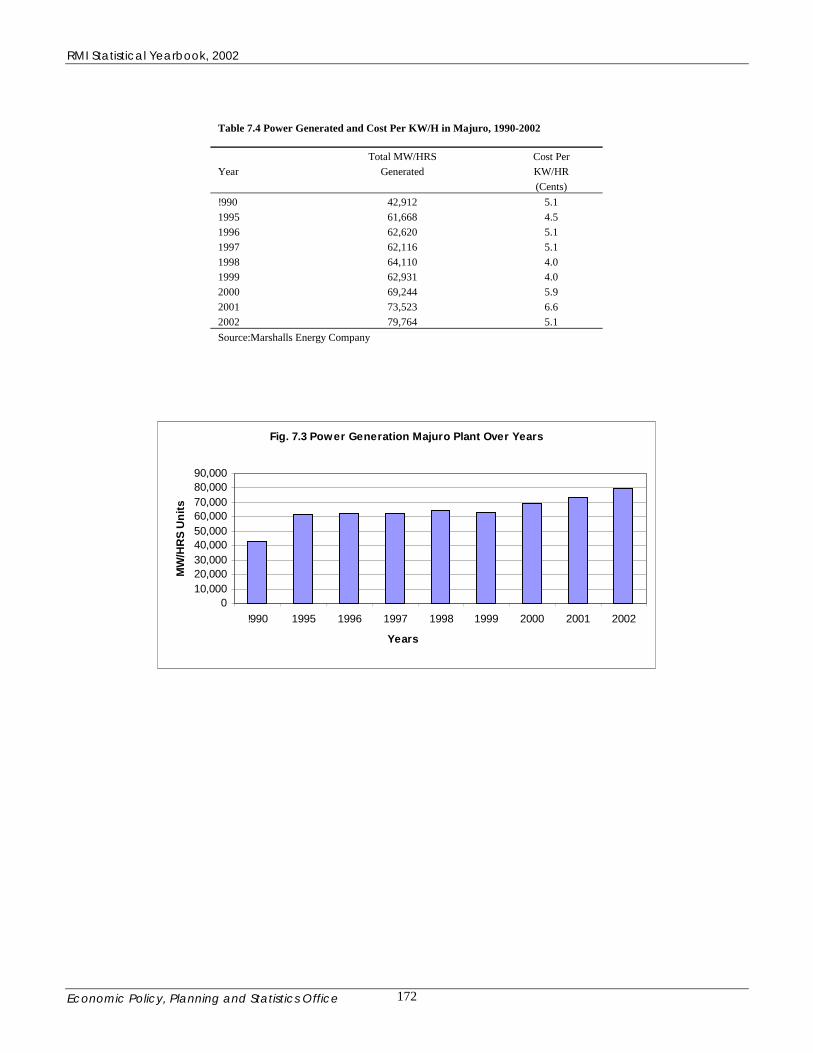
RMI Statistical Yearbook, 2002
Economic Policy, Planning and Statistics Office 172
Table 7.4 Power Generated and Cost Per KW/H in Majuro, 1990-2002 Total MW/HRS Cost Per Year Generated KW/HR (Cents) !990 42,912 5.1 1995 61,668 4.5 1996 62,620 5.1 1997 62,116 5.1 1998 64,110 4.0 1999 62,931 4.0 2000 69,244 5.9 2001 73,523 6.6 2002 79,764 5.1 Source:Marshalls Energy Company
Fig. 7.3 Power Generation Majuro Plant Over Years
010,00020,00030,00040,00050,00060,00070,00080,00090,000
!990 1995 1996 1997 1998 1999 2000 2001 2002
Years
MW
/HR
S U
nits

RMI Statistical Yearbook, 2002
Economic Policy, Planning and Statistics Office 173
Table 7.5 Electricity Generation(MW/HRS), Cost on Fuel (US Dollars and Cost Per KW/HRS in Ebeye Power Generation Plant, FY2000, FY2001 and FY2002 Total Power Cost on Average Cost Fiscal Year Generated Fuel Per KW/HRS (MW/HRS) (US Dollars) (US Cents) 2000 14,999.3 1,315,781 8.8 2001 14,006.6 1,576,082 11.3 2002 16,183.6 1,535,216 9.5 Source: Kwajalein Atoll Joint Utility Resources
Fig 7.4 Power Generated By KAJUR in Ebye
14,999.3
14,006.6
16,183.6
12,500.0
13,000.0
13,500.0
14,000.0
14,500.0
15,000.0
15,500.0
16,000.0
16,500.0
2000 2001 2002
MW/HRS Units
Year
s
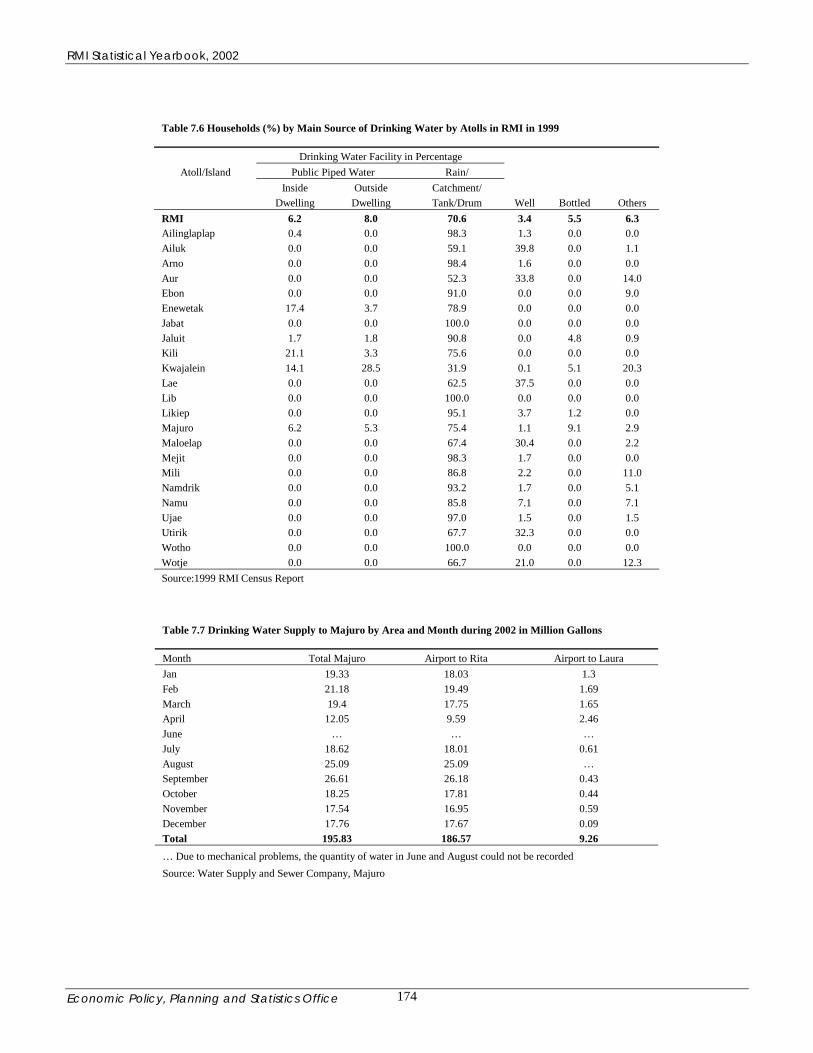
RMI Statistical Yearbook, 2002
Economic Policy, Planning and Statistics Office 174
Table 7.6 Households (%) by Main Source of Drinking Water by Atolls in RMI in 1999
Drinking Water Facility in Percentage Atoll/Island Public Piped Water Rain/
Inside Outside Catchment/ Dwelling Dwelling Tank/Drum Well Bottled Others
RMI 6.2 8.0 70.6 3.4 5.5 6.3 Ailinglaplap 0.4 0.0 98.3 1.3 0.0 0.0 Ailuk 0.0 0.0 59.1 39.8 0.0 1.1 Arno 0.0 0.0 98.4 1.6 0.0 0.0 Aur 0.0 0.0 52.3 33.8 0.0 14.0 Ebon 0.0 0.0 91.0 0.0 0.0 9.0 Enewetak 17.4 3.7 78.9 0.0 0.0 0.0 Jabat 0.0 0.0 100.0 0.0 0.0 0.0 Jaluit 1.7 1.8 90.8 0.0 4.8 0.9 Kili 21.1 3.3 75.6 0.0 0.0 0.0 Kwajalein 14.1 28.5 31.9 0.1 5.1 20.3 Lae 0.0 0.0 62.5 37.5 0.0 0.0 Lib 0.0 0.0 100.0 0.0 0.0 0.0 Likiep 0.0 0.0 95.1 3.7 1.2 0.0 Majuro 6.2 5.3 75.4 1.1 9.1 2.9 Maloelap 0.0 0.0 67.4 30.4 0.0 2.2 Mejit 0.0 0.0 98.3 1.7 0.0 0.0 Mili 0.0 0.0 86.8 2.2 0.0 11.0 Namdrik 0.0 0.0 93.2 1.7 0.0 5.1 Namu 0.0 0.0 85.8 7.1 0.0 7.1 Ujae 0.0 0.0 97.0 1.5 0.0 1.5 Utirik 0.0 0.0 67.7 32.3 0.0 0.0 Wotho 0.0 0.0 100.0 0.0 0.0 0.0 Wotje 0.0 0.0 66.7 21.0 0.0 12.3 Source:1999 RMI Census Report
Table 7.7 Drinking Water Supply to Majuro by Area and Month during 2002 in Million Gallons Month Total Majuro Airport to Rita Airport to Laura Jan 19.33 18.03 1.3 Feb 21.18 19.49 1.69 March 19.4 17.75 1.65 April 12.05 9.59 2.46 June … … … July 18.62 18.01 0.61 August 25.09 25.09 … September 26.61 26.18 0.43 October 18.25 17.81 0.44 November 17.54 16.95 0.59 December 17.76 17.67 0.09 Total 195.83 186.57 9.26
… Due to mechanical problems, the quantity of water in June and August could not be recorded Source: Water Supply and Sewer Company, Majuro
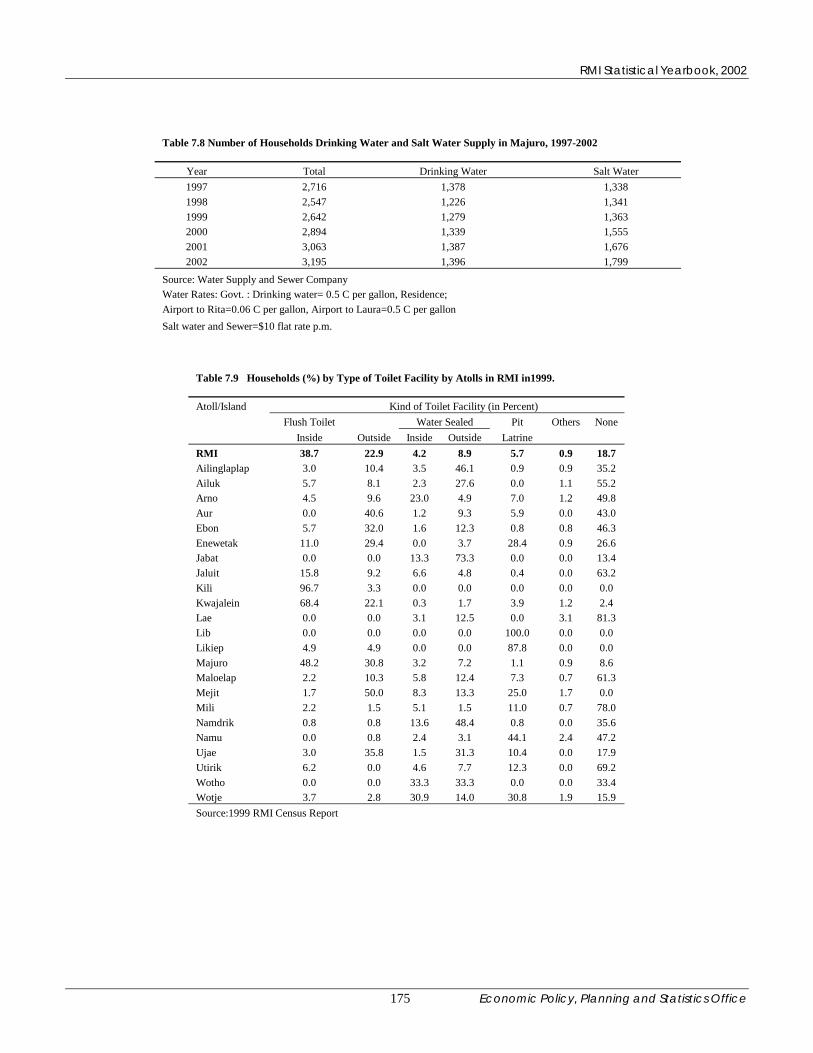
RMI Statistical Yearbook, 2002
Economic Policy, Planning and Statistics Office 175
Table 7.8 Number of Households Drinking Water and Salt Water Supply in Majuro, 1997-2002
Year Total Drinking Water Salt Water 1997 2,716 1,378 1,338 1998 2,547 1,226 1,341 1999 2,642 1,279 1,363 2000 2,894 1,339 1,555 2001 3,063 1,387 1,676 2002 3,195 1,396 1,799
Source: Water Supply and Sewer Company Water Rates: Govt. : Drinking water= 0.5 C per gallon, Residence; Airport to Rita=0.06 C per gallon, Airport to Laura=0.5 C per gallon Salt water and Sewer=$10 flat rate p.m.
Table 7.9 Households (%) by Type of Toilet Facility by Atolls in RMI in1999. Atoll/Island Kind of Toilet Facility (in Percent) Flush Toilet Water Sealed Pit Others None Inside Outside Inside Outside Latrine RMI 38.7 22.9 4.2 8.9 5.7 0.9 18.7 Ailinglaplap 3.0 10.4 3.5 46.1 0.9 0.9 35.2 Ailuk 5.7 8.1 2.3 27.6 0.0 1.1 55.2 Arno 4.5 9.6 23.0 4.9 7.0 1.2 49.8 Aur 0.0 40.6 1.2 9.3 5.9 0.0 43.0 Ebon 5.7 32.0 1.6 12.3 0.8 0.8 46.3 Enewetak 11.0 29.4 0.0 3.7 28.4 0.9 26.6 Jabat 0.0 0.0 13.3 73.3 0.0 0.0 13.4 Jaluit 15.8 9.2 6.6 4.8 0.4 0.0 63.2 Kili 96.7 3.3 0.0 0.0 0.0 0.0 0.0 Kwajalein 68.4 22.1 0.3 1.7 3.9 1.2 2.4 Lae 0.0 0.0 3.1 12.5 0.0 3.1 81.3 Lib 0.0 0.0 0.0 0.0 100.0 0.0 0.0 Likiep 4.9 4.9 0.0 0.0 87.8 0.0 0.0 Majuro 48.2 30.8 3.2 7.2 1.1 0.9 8.6 Maloelap 2.2 10.3 5.8 12.4 7.3 0.7 61.3 Mejit 1.7 50.0 8.3 13.3 25.0 1.7 0.0 Mili 2.2 1.5 5.1 1.5 11.0 0.7 78.0 Namdrik 0.8 0.8 13.6 48.4 0.8 0.0 35.6 Namu 0.0 0.8 2.4 3.1 44.1 2.4 47.2 Ujae 3.0 35.8 1.5 31.3 10.4 0.0 17.9 Utirik 6.2 0.0 4.6 7.7 12.3 0.0 69.2 Wotho 0.0 0.0 33.3 33.3 0.0 0.0 33.4 Wotje 3.7 2.8 30.9 14.0 30.8 1.9 15.9 Source:1999 RMI Census Report

RMI Statistical Yearbook, 2002
Economic Policy, Planning and Statistics Office 176
Chapter 8-Transport and Communications The Ministry of Transport and Communications is responsible for the overall regulation, promotion and development of transportation and communications in the Marshall Islands. The country has international airports at Majuro and Kwajalein and airstrips all inhabited atolls and islands. Besides Majuro, there are other three designated international ports of entry: Enewetak, Ebeye and Jaluit. Domestic Shipping The Ministry of Transport and Communications contracts with private ship operators to make voyages into 5 designated shipping regions, namely: Lower Northern, Upper Northern, Central Eastern, Southern and Western. There are 4 vessels involved in inter-island shipping under this arrangement, three are government owned and one is private. Intra-Atoll Shipping Intra-atoll shipping is conducted mainly by small boats with diesel engines, often ranging from 14 feet to 30 feet in length, called “bumbums”. International Shipping Several International shipping lines service like the Marshall Islands calling in at Majuro and Ebeye. The ship are mainly container carriers with some multipurpose container and break-bulk carriers. The bulk of the shipping is from the US West Coast, by the Matson and PM&O Lines. The remainder is from East Asia and Australia. Shipping services for the various carriers range from bi-weekly to monthly. Air Transportation The Marshall Islands has 32 airfields located on 24 atolls and islands. Two of these- Majuro and Kwajalein are international airports capable of handling regular service by airliners up to the size of a 757. Kwajalein airport is operated by the US Military. The government owned Airline of the Marshall Islands is the sole air service provider to the outer islands operating two Dornier 228-19 seat turboprop aircraft. AMI recently added a larger Dash 8 aircraft to service the busier routes. Service is available at least once a week to most of the outer islands from Majuro except Arno. Telecommunications The Marshall Islands National Telecommunications Authority provides telecommunications services in the Marshall Islands. Telecommunications services in the Marshall Islands consist of fixed line telephones networks, mobile (cellular) networks and internet, international satellite communications is out of Majuro and Ebeye. There are a number of mobile satellite telephone systems on various outer islands. Some government ministries and agencies, as well as private sector companies operate radio communication networks. Plans are underway to install satellite dishes for provision of communication services on the island of Kili and atolls of Jaluit and Wotje. Outer Island communications Public telecommunications in the outer islands consists of high frequency single side band radio links. There are 14 mini satellite phones in various islands, however there is no regular public access to these facilities. The Ministries of Internal Affairs, Health and Education have substantial communications needs with the outer islands.
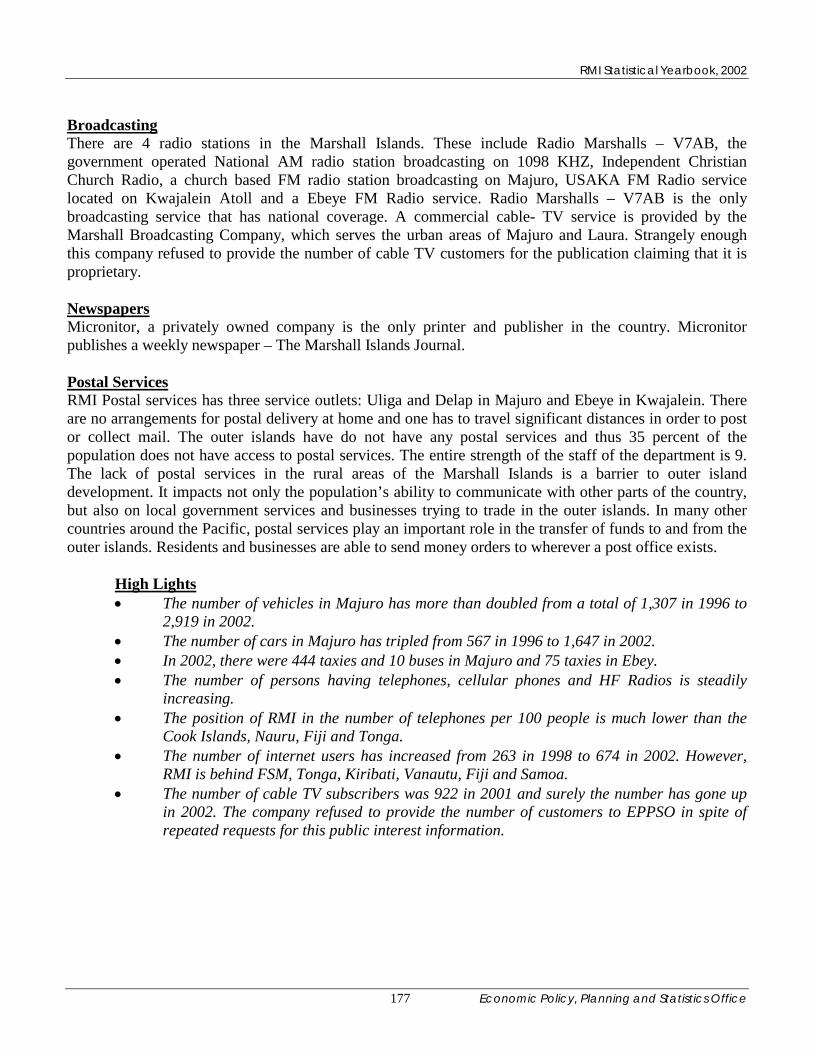
RMI Statistical Yearbook, 2002
Economic Policy, Planning and Statistics Office 177
Broadcasting There are 4 radio stations in the Marshall Islands. These include Radio Marshalls – V7AB, the government operated National AM radio station broadcasting on 1098 KHZ, Independent Christian Church Radio, a church based FM radio station broadcasting on Majuro, USAKA FM Radio service located on Kwajalein Atoll and a Ebeye FM Radio service. Radio Marshalls – V7AB is the only broadcasting service that has national coverage. A commercial cable- TV service is provided by the Marshall Broadcasting Company, which serves the urban areas of Majuro and Laura. Strangely enough this company refused to provide the number of cable TV customers for the publication claiming that it is proprietary. Newspapers Micronitor, a privately owned company is the only printer and publisher in the country. Micronitor publishes a weekly newspaper – The Marshall Islands Journal. Postal Services RMI Postal services has three service outlets: Uliga and Delap in Majuro and Ebeye in Kwajalein. There are no arrangements for postal delivery at home and one has to travel significant distances in order to post or collect mail. The outer islands have do not have any postal services and thus 35 percent of the population does not have access to postal services. The entire strength of the staff of the department is 9. The lack of postal services in the rural areas of the Marshall Islands is a barrier to outer island development. It impacts not only the population’s ability to communicate with other parts of the country, but also on local government services and businesses trying to trade in the outer islands. In many other countries around the Pacific, postal services play an important role in the transfer of funds to and from the outer islands. Residents and businesses are able to send money orders to wherever a post office exists.
High Lights • The number of vehicles in Majuro has more than doubled from a total of 1,307 in 1996 to
2,919 in 2002. • The number of cars in Majuro has tripled from 567 in 1996 to 1,647 in 2002. • In 2002, there were 444 taxies and 10 buses in Majuro and 75 taxies in Ebey. • The number of persons having telephones, cellular phones and HF Radios is steadily
increasing. • The position of RMI in the number of telephones per 100 people is much lower than the
Cook Islands, Nauru, Fiji and Tonga. • The number of internet users has increased from 263 in 1998 to 674 in 2002. However,
RMI is behind FSM, Tonga, Kiribati, Vanautu, Fiji and Samoa. • The number of cable TV subscribers was 922 in 2001 and surely the number has gone up
in 2002. The company refused to provide the number of customers to EPPSO in spite of repeated requests for this public interest information.
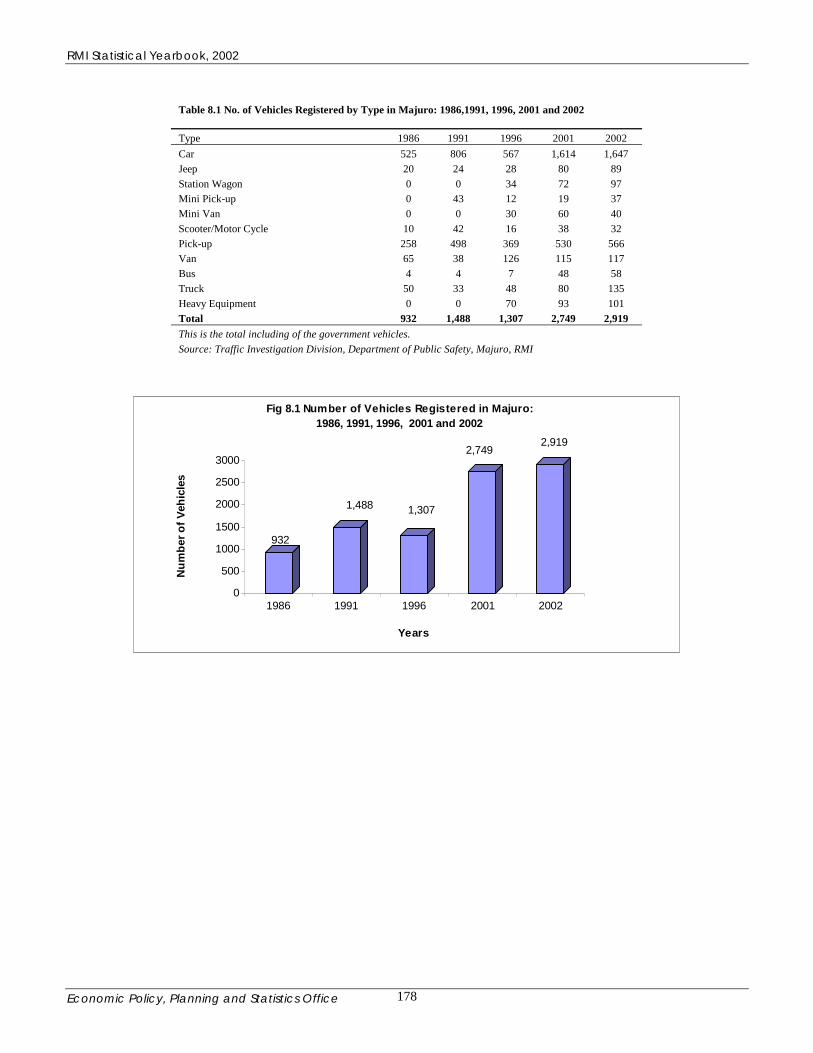
RMI Statistical Yearbook, 2002
Economic Policy, Planning and Statistics Office 178
Table 8.1 No. of Vehicles Registered by Type in Majuro: 1986,1991, 1996, 2001 and 2002 Type 1986 1991 1996 2001 2002 Car 525 806 567 1,614 1,647 Jeep 20 24 28 80 89 Station Wagon 0 0 34 72 97 Mini Pick-up 0 43 12 19 37 Mini Van 0 0 30 60 40 Scooter/Motor Cycle 10 42 16 38 32 Pick-up 258 498 369 530 566 Van 65 38 126 115 117 Bus 4 4 7 48 58 Truck 50 33 48 80 135 Heavy Equipment 0 0 70 93 101 Total 932 1,488 1,307 2,749 2,919 This is the total including of the government vehicles. Source: Traffic Investigation Division, Department of Public Safety, Majuro, RMI
932
1,488 1,307
2,7492,919
0
500
1000
1500
2000
2500
3000
Num
ber o
f Veh
icle
s
1986 1991 1996 2001 2002
Years
Fig 8.1 Number of Vehicles Registered in Majuro:1986, 1991, 1996, 2001 and 2002
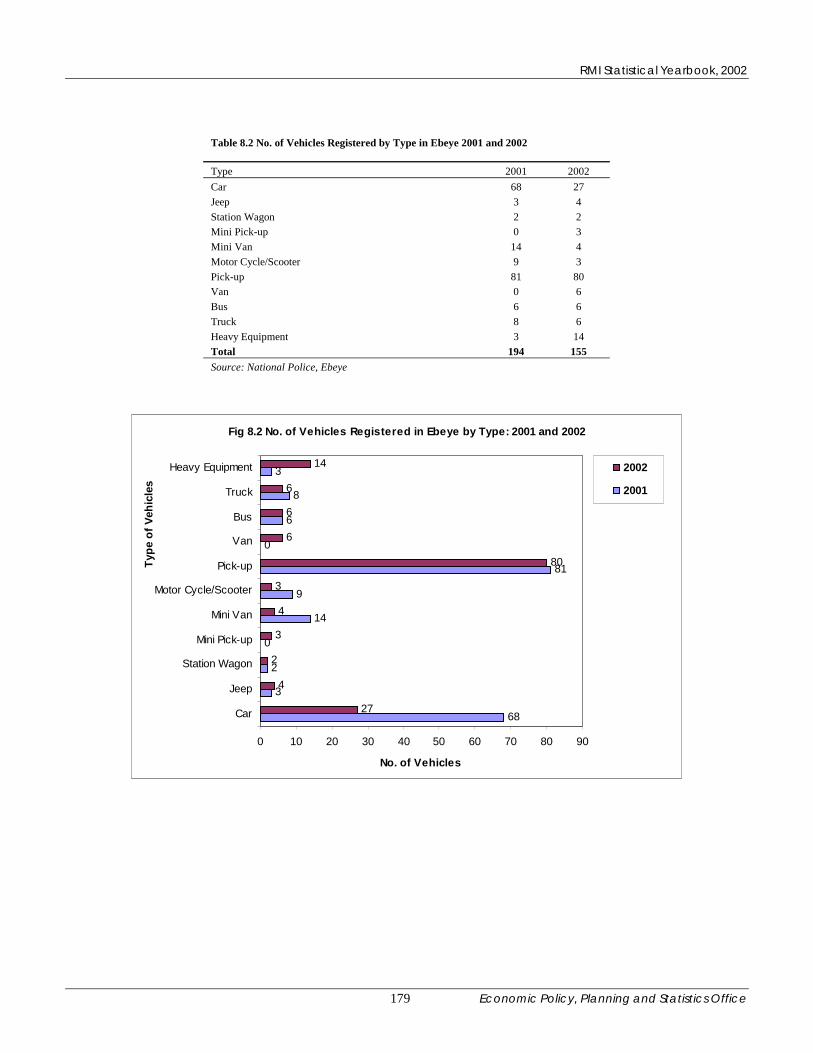
RMI Statistical Yearbook, 2002
Economic Policy, Planning and Statistics Office 179
Table 8.2 No. of Vehicles Registered by Type in Ebeye 2001 and 2002 Type 2001 2002 Car 68 27 Jeep 3 4 Station Wagon 2 2 Mini Pick-up 0 3 Mini Van 14 4 Motor Cycle/Scooter 9 3 Pick-up 81 80 Van 0 6 Bus 6 6 Truck 8 6 Heavy Equipment 3 14 Total 194 155 Source: National Police, Ebeye
Fig 8.2 No. of Vehicles Registered in Ebeye by Type: 2001 and 2002
68
3
2
0
14
9
81
0
6
8
3
27
4
2
3
4
3
80
6
6
6
14
0 10 20 30 40 50 60 70 80 90
Car
Jeep
Station Wagon
Mini Pick-up
Mini Van
Motor Cycle/Scooter
Pick-up
Van
Bus
Truck
Heavy Equipment
Type
of V
ehic
les
No. of Vehicles
2002
2001
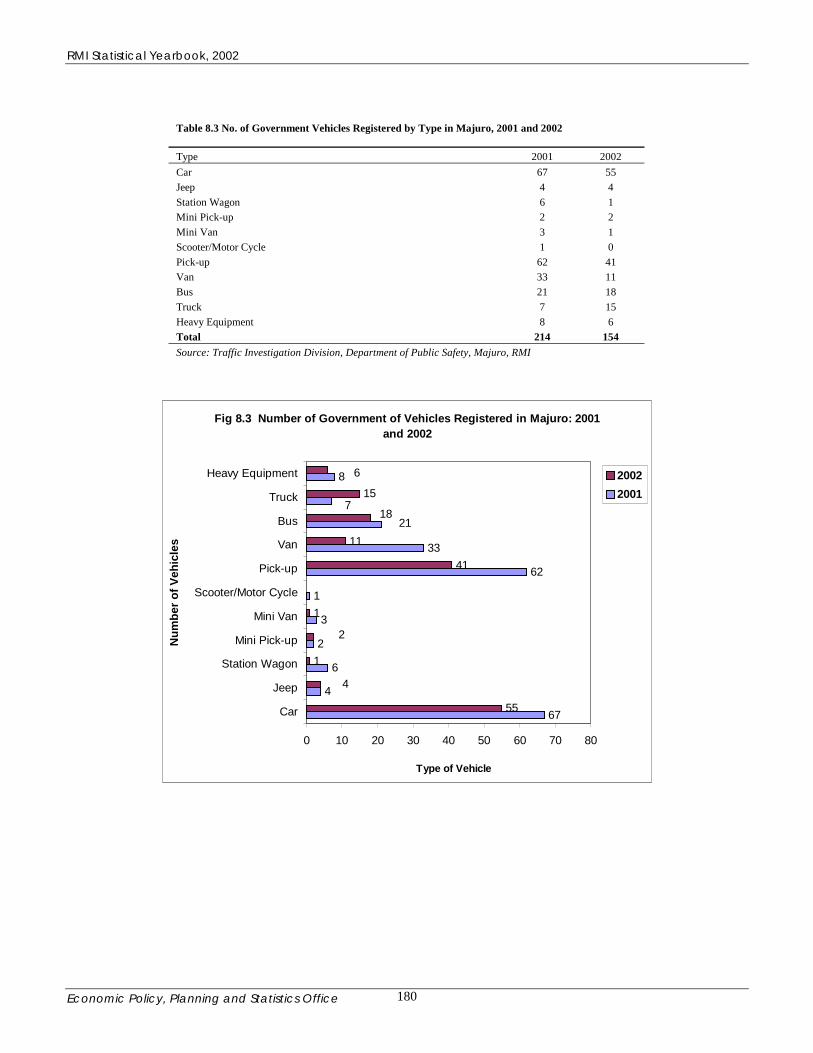
RMI Statistical Yearbook, 2002
Economic Policy, Planning and Statistics Office 180
Table 8.3 No. of Government Vehicles Registered by Type in Majuro, 2001 and 2002 Type 2001 2002 Car 67 55 Jeep 4 4 Station Wagon 6 1 Mini Pick-up 2 2 Mini Van 3 1 Scooter/Motor Cycle 1 0 Pick-up 62 41 Van 33 11 Bus 21 18 Truck 7 15 Heavy Equipment 8 6 Total 214 154 Source: Traffic Investigation Division, Department of Public Safety, Majuro, RMI
Fig 8.3 Number of Government of Vehicles Registered in Majuro: 2001 and 2002
67
4
6
2
3
1
62
33
8
55
1
1
41
11
15
217
18
2
4
6
0 10 20 30 40 50 60 70 80
Car
Jeep
Station Wagon
Mini Pick-up
Mini Van
Scooter/Motor Cycle
Pick-up
Van
Bus
Truck
Heavy Equipment
Num
ber o
f Veh
icle
s
Type of Vehicle
20022001

RMI Statistical Yearbook, 2002
Economic Policy, Planning and Statistics Office 181
Table 8.4 Number of Taxies and Buses in Majuro and Ebeye, 1995-2002
Year Majuro Ebeye Taxies Buses Taxies Buses
1995 … … 6 0 1996 … … 13 0 1997 … … 19 0 1998 … … 24 0 1999 … … 45 0 2000 288 6 53 0 2001 391 8 67 0 2002 444 10 75 0
Source: Local Government, Majuro and National Police, Ebeye.
294399 454
0100200300400500
Num
ber
2000 2001 2002
Years
Fig 8.4 Number of Taxies and Public Buses in Majuro, 2000-2002

RMI Statistical Yearbook, 2002
Economic Policy, Planning and Statistics Office 182
Table 8.5 Subscribers of Various Telecommunications and Internet in RMI
Calendar Number of Subscribers Year Telephones Mini-satellite Phone Cellular HF Radio CB Radio Internet
1995 2,880 * * 203 .. * 1996 3,012 * * 208 .. * 1997 3,167 * * 218 .. * 1998 3,445 * 345 218 .. 263 1999 3,463 * 452 189 .. 324 2000 3,566 14 486 178 .. 409 2001 3,710 16 528 199 .. 472 2002 3,861 14 574 264 225 674
* Service not started then. .. Information not available Source: National Telecommunication Authority, RMI and Ministry of Transport and Communications
3,861
14
574264 225
674
0
500
1,000
1,500
2,000
2,500
3,000
3,500
4,000
Num
ber
Telephones Mini-satellitePhone
Cellular HF Radio CB Radio Internet
Fig 8.6 Telephones, Mini Satellite Phones, Cellulars, HF and CB Radios and Internet Users in RMI, 2002

RMI Statistical Yearbook, 2002
Economic Policy, Planning and Statistics Office 183
Table 8.6 Cable TV Subscribers in Majuro, 1995-2001
Year Subscribers
1995 527 1996 544 1997 499 1998 569 1999 657 2000 760 2001 922 2002 Information refused*
* The Company refused to supply this public interest information in spite of bringing to their notice that under the Statistical Act such public interest information can’t be refused. Source: Marshalls Broadcasting Company, Majuro
527544 499
569657
760
922
0100200300400500600700800900
1000
Num
ber o
f Sub
scrib
ers
1995 1996 1997 1998 1999 2000 2001
Year
Fig 8 .7 Cable TV Subscribers in Majuro, 1995-2001

RMI Statistical Yearbook, 2002
Economic Policy, Planning and Statistics Office 184
Table 8.7 Telephone Lines and Cellular Subscribers, Per 100 population in Pacific Countries, 1990,1995 and 2001
Country 1990 1995 2001
Marshall Islands 1.12 7.19 8.56 Cook Islands 16.24 27.12 34.25 Kiribati 1.66 2.61 4.79 Micronesia, Fed. States of 2.5 7.37 8.67 Nauru 13.33 18.64 28.98 Papua New Guinea 0.8 0.99 1.37 Solomon Islands 2.56 4.64 7.48* Tonga 4.58 7.11 14.70* Tuvalu 1.33 5.09 6.50 Vanuatu 1.77 2.56 3.54 Fiji Islands 5.76 8.72 21.09
* Figures are of 2002 Source: UNSD, Millennium Indicators Database, ADB Key Indicators 2003
Fig. 7.8 No. of Telephone Lines and Cellular Subscribers in Pacific Countries in 2001
0 5 10 15 20 25 30 35 40
Marshall Islands
Cook Islands
Kiribati
Micronesia, Fed. States of
Nauru
Papua New Guinea
Solomon Islands
Tonga
Tuvalu
Vanuatu
Fiji Islands
Cou
ntrie
s
No. of Subscribers
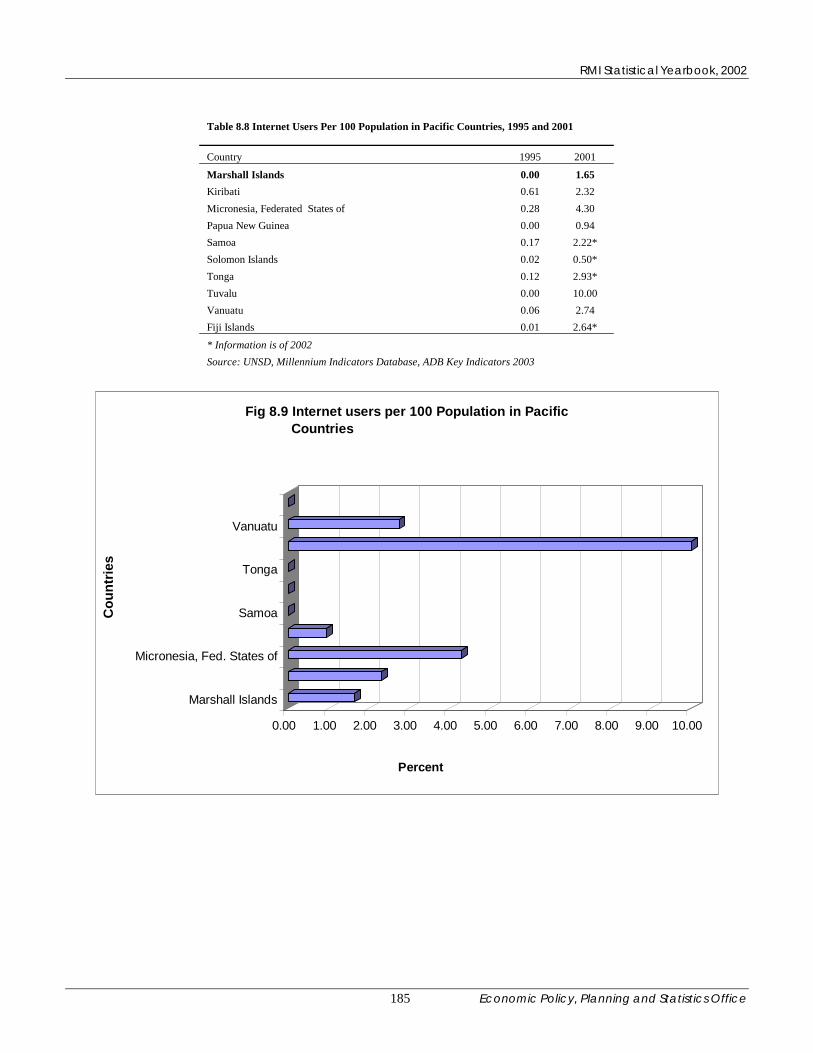
RMI Statistical Yearbook, 2002
Economic Policy, Planning and Statistics Office 185
Table 8.8 Internet Users Per 100 Population in Pacific Countries, 1995 and 2001
Country 1995 2001
Marshall Islands 0.00 1.65 Kiribati 0.61 2.32 Micronesia, Federated States of 0.28 4.30 Papua New Guinea 0.00 0.94 Samoa 0.17 2.22* Solomon Islands 0.02 0.50* Tonga 0.12 2.93* Tuvalu 0.00 10.00 Vanuatu 0.06 2.74 Fiji Islands 0.01 2.64*
* Information is of 2002 Source: UNSD, Millennium Indicators Database, ADB Key Indicators 2003
0.00 1.00 2.00 3.00 4.00 5.00 6.00 7.00 8.00 9.00 10.00
Percent
Marshall Islands
Micronesia, Fed. States of
Samoa
Tonga
Vanuatu
Cou
ntrie
s
Fig 8.9 Internet users per 100 Population in Pacific Countries

RMI Statistical Yearbook, 2002
Economic Policy, Planning and Statistics Office 186
Table 8.9 Percent Households with Radio in Selected Pacific Countries, 2000
Percent Country Households w/ Radio
CNMI 76.0 A.Samoa 79.1 Palau 89.8 FSM 44.3 RMI 85.6
Source: Ben Graham, Statistical Enhancement program, U.S. Census Bureau
��������������������������������
����������������������������������������������������������������������������������������
�������������� ����������������������������������������
����������������������������������������������������������������������������������������
���������������������������������������������������
���������������������������������������������������������������������������������������������������
��������������
��������������������
�������������������������������������������������������
��������������
���������������������������������������������
����������������������������������������������������������������������������������������
������������������������������
0.0
20.0
40.0
60.0
80.0
100.0
Perc
ent H
ouse
hold
s
CNMI A.Samoa Palau FSM RMICountry
Fig 8.10 Percent Households with Radio, Pacific Countries, 2000
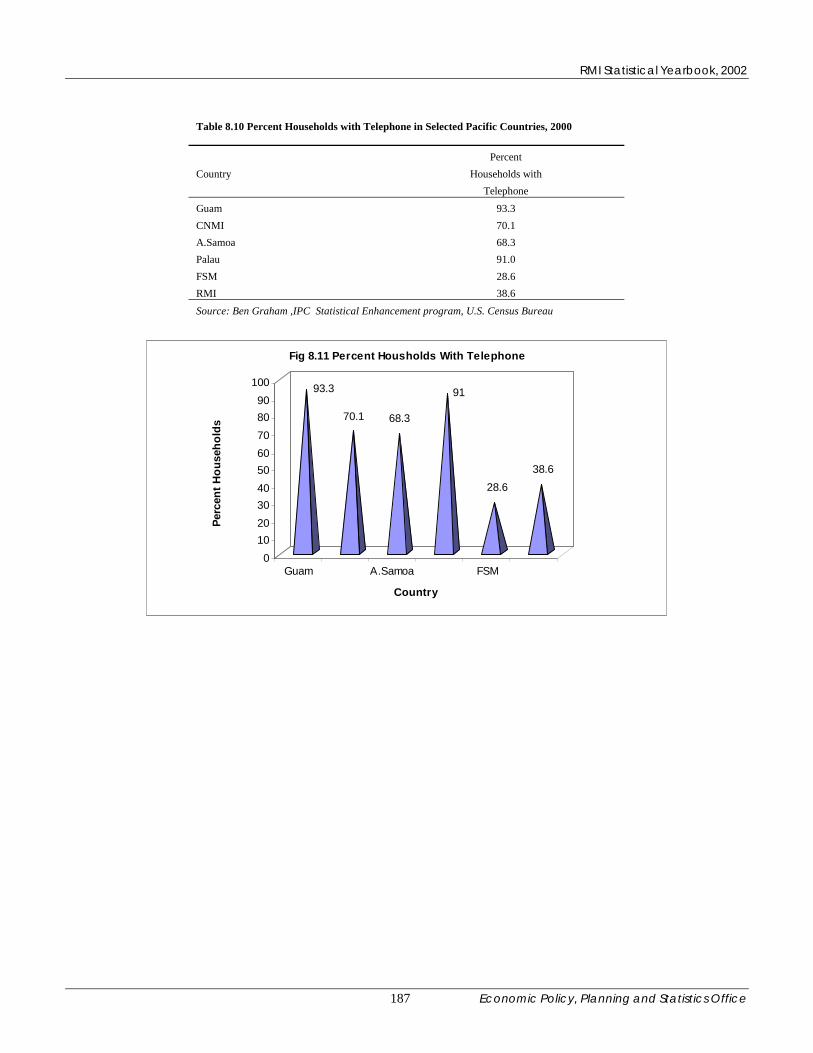
RMI Statistical Yearbook, 2002
Economic Policy, Planning and Statistics Office 187
Table 8.10 Percent Households with Telephone in Selected Pacific Countries, 2000
Percent Country Households with Telephone
Guam 93.3 CNMI 70.1 A.Samoa 68.3 Palau 91.0 FSM 28.6 RMI 38.6
Source: Ben Graham ,IPC Statistical Enhancement program, U.S. Census Bureau
93.3
70.1 68.3
91
28.638.6
0102030405060708090
100
Perc
ent H
ouse
hold
s
Guam A.Samoa FSM
Country
Fig 8.11 Percent Housholds With Telephone

RMI Statistical Yearbook, 2002
Economic Policy, Planning and Statistics Office 188
Table 8.11 No. of Subscribers of the Marshall Islands Weekly Journal, 1995-2002
Year Copies distributed Estimated Majuro Ebeye/Kwajalein All others Total Readers * 2002 2000 325 200 2525 22,725 Source: Editor, The Marshall Islands Journal * Estimated @one copy for 9 ** Figures of previous years not available, but only modest growth over years.
������������������������������������������������������������������
������������������������������������������������������������������������������������������������������������������������������������
Fig 8.12 Subscribers of Marshall Islands Weekly Journal
Majuro79%
All others8%
Ebeye/Kw ajalein13%
Table 8.12 Staff to Computer Ratio, 2002
Staff to % level of % level of Sector Computer Local Area Wide Area Ratio Networking Networking
Government Agencies 1.97 21 14 Government Statutory 1.67 83 17 Private 1.42 56 44 Higher learning Institute 2.25 50 0 High schools 5.76 0 0 Primary 6.3 0 0 Hospitals 3.62 0 0
Source: Marshall Islands IT Master Plan, February, 2002

RMI Statistical Yearbook, 2002
Economic Policy, Planning and Statistics Office 189
Table 8.13 Availability of Computers in RMI, 2002
Sector Server PCs
Government 43 461 Education 8 425 Private 13 238 Health 2 20 Total 66 1143
Source: Marshall Islands IT Master Plan, February, 2002
Fig 8.13 Computers in RMI
0
50
100
150
200
250
300
350
400
450
500
Government Education Private Health
Num
ber
ServerPCs

RMI Statistical Yearbook, 2002
Economic Policy, Planning and Statistics Office 190
Chapter 9-Environmental Protection Environmental Protection The Republic of Marshall Island’s Environmental Protection Authority (RMIEPA) was created throughout the islands by an Act in 1984. The EPA is responsible for preserving and improving the quality of the environment. It is an autonomous body and is regulated by a statutory board. This authority has broad general powers to regulate issues related to: • Primary and Secondary Drinking Water • Pollutants • Pesticides and Chemicals • Waste • Cultural and Heritage Protection The EPA’s tasks include enforcement of environmental regulations concerning marine and fresh water quality standards, solid waste disposal, sewage systems, earthmoving, pesticides, hazardous/toxic materials and coastal erosion. At present, the EPA has a staff of 14 employees, headed by the General Manager. Two international volunteers, one each from Japan and Australia are also presently working with the organization. Two of the officials of EPA are stationed at the Ebeye sub office. The RMIEPA has working relationship with international organizations in the field of environment protection and bio-diversity. RMI has already ratified seven International Conventions and Protocols on environment and thus EPA was able to access 1.8 million US dollars from the GEF for implementation of these International Environment Conventions including the recent approval of $340,000 for the Stockholm Convention. RMI continued to receive both technical and financial assistance from the South Pacific Regional Program particularly in institutional strengthening of the agency. Structurally, the EPA is divided into the following six divisions: • Water Quality Monitoring Laboratory Services • Climate Change and Biodiversity Conservation • International Waters Program • Education, Information and Training • Coastal Management and Geographical Information System • Environmental Health and Sanitation Under water quality monitoring, the water quality of catchments, city water, ground water, drinking water in restaurants, processed water and coastal in Mauro and the outer islands is tested. The sanitation division is responsible for public and private landfills and coordinates the activities of solid waste management with the Majuro Atoll local Government and Ministry of Public Works. Inspections of restaurants and hotels in Majuro are carried out to ensure hygienic conditions and quality catering of foods. The division is also responsible for the coordination of the inspection and assessment of the damage to the environment caused by ships that ran aground. The division also supervised the oil clean up activities of a Chinese fishing vessel that ran aground on Ujelang atoll. The Coastal Management Division continued to review and issue permits for earthmoving activities in Majuro for minor and major development projects. The division is also responsible for the digital mapping of the conservation areas in Jaluit Atoll Lagoon.
RMI Statistical Yearbook, 2002
Economic Policy, Planning and Statistics Office 191
The Education and Information Division is responsible for creating public awareness on the environmental issues that face the country. Publicity is done through the print media and as well as through a regular radio program. A quarterly newsletter is also produced where cooperation and help is solicited from the public to protect the environment. The public is also approached at public gatherings, community assemblies and meetings. Schools are visited to present information to the teachers and the students on environmental issues. Under the International Waters Program, waste problems at the Jenrok area in Majuro have been attended to for the last two years. The traditional leaders, youth groups, local councilmen, and the businesses are involved for the implementation of this pilot project. Under UNDP, a biodiversity project with a budget of $450,000 is also being implemented. A national biodiversity strategy action plan is being prepared under the project. One new endemic mangrove species was recently discovered at Ae Mangrove forest. Such species are not known to grow any where in the Marshall Islands or nearby neighboring islands in Micronesia. The present systems of solid waste collection and disposal in the RMI are in serious need of improvement and upgrading. Both at Majuro and Ebeye the landfills are filled beyond capacity and need expansion. Trash bins are needed at more places in the towns for people and businesses to place the garbage and litter.

RMI Statistical Yearbook, 2002
Economic Policy, Planning and Statistics Office 192
56.9
24.2
7.113.6
23.7
10.8
0
10
20
30
40
50
60
Perc
ent S
ampl
es F
ailed
Catchments Coastal City Water Ice/ProcessedWater
Wells(GroundWater)
Restaurants Drink. Water
Fig 9.1 Percentage of Samples of Water Found contaminated in Majuro City
56.9 percent of the water catchments sampled were not of proper quality. Even the city water and the processed water samples showed that 7.1 percent and 13.6 percent respectively were contaminated. 10.8 percent of the water samples taken from the restaurants were also contaminated.

RMI Statistical Yearbook, 2002
Economic Policy, Planning and Statistics Office 193
Table 9.2 Testing of Quality of Catchment Water in different Outer Islands in RMI, 1995, 2001-2003 (up to June)
1995 2001 2002 2003 Outer Island No. No. No. No.
No. con- No. con- No. con- No. con- Tested taminated Tested taminated Tested taminated Tested taminated Arno 0 0 0 0 0 0 120 45 Jaluit 0 0 0 0 43 15 0 0 Kili 0 0 0 0 0 0 228 63 Likiep 0 0 0 0 0 0 90 35 Mili 0 0 0 0 0 0 98 77 Wotje 10 5 0 0 94 35 0 0 Lae 0 0 14 13 0 0 0 0 Namdrik 0 0 1 1 0 0 0 0 Total 10 5 15 14 137 50 536 220 Source: General Manager, RMI Environmenmental Protection Authority
10 5 15 14137
50
536
220
0100200300400500600
Num
ber o
f Sam
ples
1995 2001 2002 2003
Years
Fig 9.2 Samples of Catchment Water Tested and No. Found contaminated in Outer Islands
TestedContaminated
In Lae, 13 out of 14 water catchments were found to be contaminated. In Mili, out of 98 samples taken of catchment water for testing, 77 were were found to be contaminated.
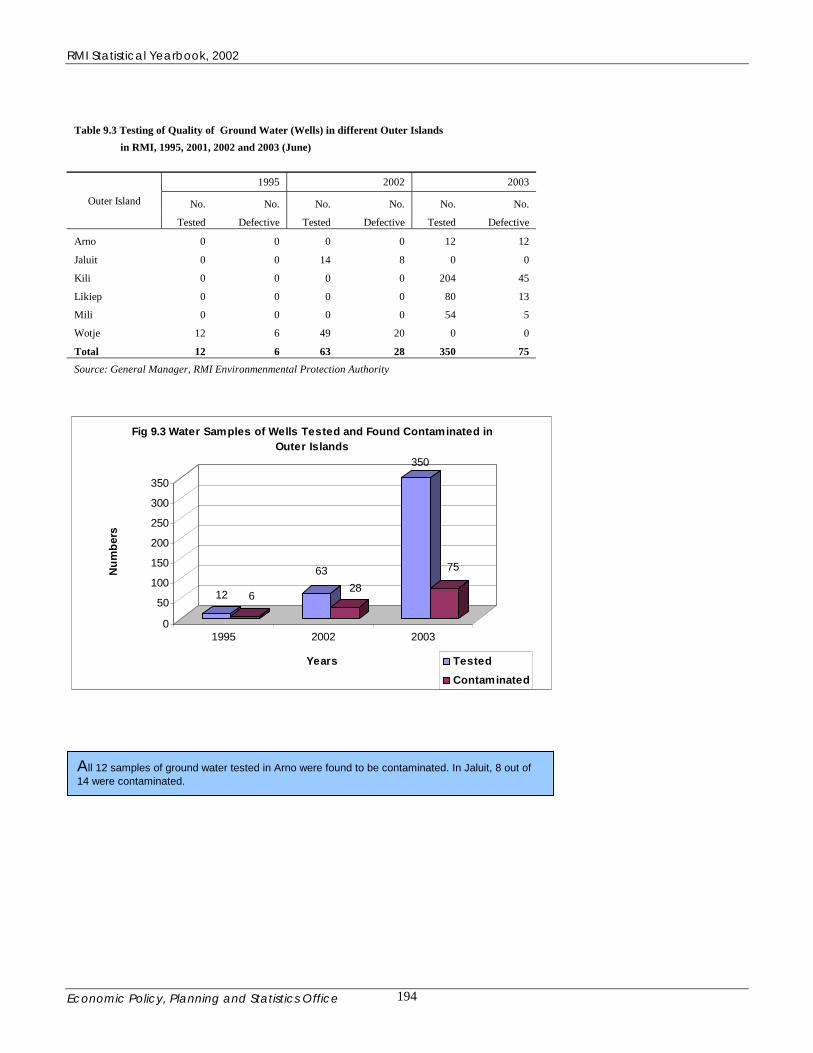
RMI Statistical Yearbook, 2002
Economic Policy, Planning and Statistics Office 194
Table 9.3 Testing of Quality of Ground Water (Wells) in different Outer Islands in RMI, 1995, 2001, 2002 and 2003 (June)
1995 2002 2003
Outer Island No. No. No. No. No. No. Tested Defective Tested Defective Tested Defective Arno 0 0 0 0 12 12 Jaluit 0 0 14 8 0 0 Kili 0 0 0 0 204 45 Likiep 0 0 0 0 80 13 Mili 0 0 0 0 54 5 Wotje 12 6 49 20 0 0 Total 12 6 63 28 350 75 Source: General Manager, RMI Environmenmental Protection Authority
12 6
6328
350
75
0
50
100
150
200
250
300
350
Num
bers
1995 2002 2003
Years
Fig 9.3 Water Samples of Wells Tested and Found Contaminated in Outer Islands
TestedContaminated
All 12 samples of ground water tested in Arno were found to be contaminated. In Jaluit, 8 out of 14 were contaminated.

RMI Statistical Yearbook, 2002
Economic Policy, Planning and Statistics Office 195
Table 9.4 RESTAURANT INSPECTION FOR FY 2001-2002 MONTH Grade A Grade B Grade C Closed No. Inspected Oct.- Dec. 3 7 5 0 15 Jan.- Mar. 6 8 6 0 20 Apr.- Jun 7 7 7 2 23 Jul.- Sept. 10 14 5 1 30
Total 26 36 23 3 88 Source: General Manager, RMI Environmenmental Protection Authority
Fig 9.4 Inspection of Restaurants in Majuro and Action Taken
02468
10121416
Grade A Grade B Grade C Closed
Oct.- Dec.Jan.- Mar.Apr.- JunJul.- Sept.

RMI Statistical Yearbook, 2002
Economic Policy, Planning and Statistics Office 196
Table 9.5 Vessel Clearance and Fees Charged by the EPA, 2001-02 and 2002-03
FY2001-02 FY2002-03 Month # of Vessel Cost($) # of Vessel Cost($) October 38 1,775 16 500 Nov 40 2,300 9 300 Dec 8 875 47 1,475 Jan 15 1,500 37 1,225 Feb 37 1,325 23 825 March 7 325 12 400 April 21 875 4 150 May 36 1,250 1 25 June 35 1,225 6 200 July 21 625 13 525 Aug 21 675 5 125 Sep 19 700 9 275 Total 298 13,450 182 6,025 Source: General Manager, RMI Envirionment Protection Authority
Fig 9.5 Vessels Cleared in Majuro by EPA: 2001-02 and 2002-03
05
101520253035404550
Octobe
rNov Dec Ja
nFeb
March
April
MayJu
ne July
Aug Sep
Months
No.
of V
esse
ls
FY2001-02
FY2002-03

RMI Statistical Yearbook, 2002
Economic Policy, Planning and Statistics Office 197
Table 9.6 Public Awareness Activities Undertaken by EPA in 2001 and 2002 2001 2002 Activity Number of Events Total Attendance Number of Events Total Attendance Majuro Outer Total Majuro Outer Total Majuro Outer Total Majuro Outer Total Islands Islands Islands Islands Radio Program 52 Same 52 General Same General 52 Same 52 General Same General (once a week) Public Public Public Public Quarterly 4 Same 4 General Same General 4 Same 4 General Same General Newsletter Public Public Public Public School Visits Elementary Schools 50 6 56 936 214 1,150 60 6 66 995 264 1,259 High Schools 6 2 8 680 442 1,122 6 2 8 700 500 1,200 SDA Job Fair 1 0 1 600 0 600 1 0 1 650 0 650 Community Awareness Mayors Conference 1 0 1 32 0 32 1 0 1 32 0 32 WUTMI 1 0 1 132 0 132 1 0 1 140 0 140 Church Youth 1 0 1 6,000 0 6,000 2 0 2 500 0 500 National Youth 1 0 1 34 0 34 0 0 0 0 0 0 Traditional Leaders 4 0 4 20 0 20 6 4 10 80 40 120 Community Meetings 4 0 4 400 0 400 6 2 8 600 60 660 Annual Environmental Events Earth Day 1 0 1 300 0 300 0 0 0 0 0 0 Water Day 1 0 1 800 0 800 1 0 1 900 0 900 Source: General Manager, RMI Environmenmental Protection Authority

RMI Statistical Yearbook, 2002
Economic Policy, Planning and Statistics Office 198
Chapter 10-Tourism MIVA Mission Statement: To create a policy, infrastructure and natural environment that are conducive to foreign and domestic private sector investment in tourism, and to ensure that tourism development is well planned and managed to ensure long-term economic, environmental and social sustainability. With the above objectives as set by its mission statement, the MIVA has striven to carry out its duties and responsibilities mandated within the Tourism Amendment Act (Public Law 1997-43), namely: • Policy, Planning and Product Development • Marketing & Promotion • Tourism & Environmental Awareness • Training and Human Resources Development • Research and Statistics Tourism Trends in the RMI: Tourism in the RMI is in its early stages of development and therefore both the total visitor numbers (26,358 since 1998) and the total in-country hotel room numbers (317) are relatively small. The RMI has seen a 2% average annual increase in visitors since 1998, however, with a corresponding 9.3% annual growth rate for holiday visitors. By country of origin, the US and Japan represent the highest potential markets for RMI tourism. Combined, these two markets have accounted for nearly 75% of all inbound holiday travelers to the RMI from 1998-2002. Noteworthy constraints to tourism development include high costs of international travel to the RMI and poor solid waste management in RMI urban centers. MIVA in 1997 identified. The RMI has comparative advantages in all three of these areas and MIVA will therefore concentrate on developing these markets for the next 3 to 5 years. Additionally, have also been identified as significant markets for RMI tourism. MIVA has worked closely with the private sector to promote and market the Marshall Islands within the key niche markets identified for promotion in the short to medium term: scuba diving, sports-fishing, WWII historic tourism, nautical tourism and ecotourism/special interest tourism. There have been many achievements both for MIVA and the industry in this regard, as indicated by the great number of publications written, TV shows televised, media and familiarization groups hosted, and overseas travel shows and events attended (compete list available upon request). Further marketing and promotional activities must continue and strengthen in the future. Ultimately, as tourism facilities and air access improve and the RMI has gained more exposure as a tourism destination, MIVA will begin promoting general interest or beach-oriented tourism. There are over 1,200 individual islands in the RMI, most of which are uninhabited and therefore available for tourism development. Most of these islands are very pristine and attractive for beach-oriented tourism. This type of tourism will bring into the RMI much larger numbers of visitors in years to come.

RMI Statistical Yearbook, 2002
Economic Policy, Planning and Statistics Office 199
Both technical and funding assistance have been provided by MIVA to outer atoll local governments and communities, including Arno, Ailuk, Bikini, Jaluit, Likiep, Mili and Rongelap atolls, which have exhibited support for tourism development as a means to better the economic opportunities of their respective atolls. The acquisition of a Dash-8 aircraft by Air Marshall Islands further supported these efforts.
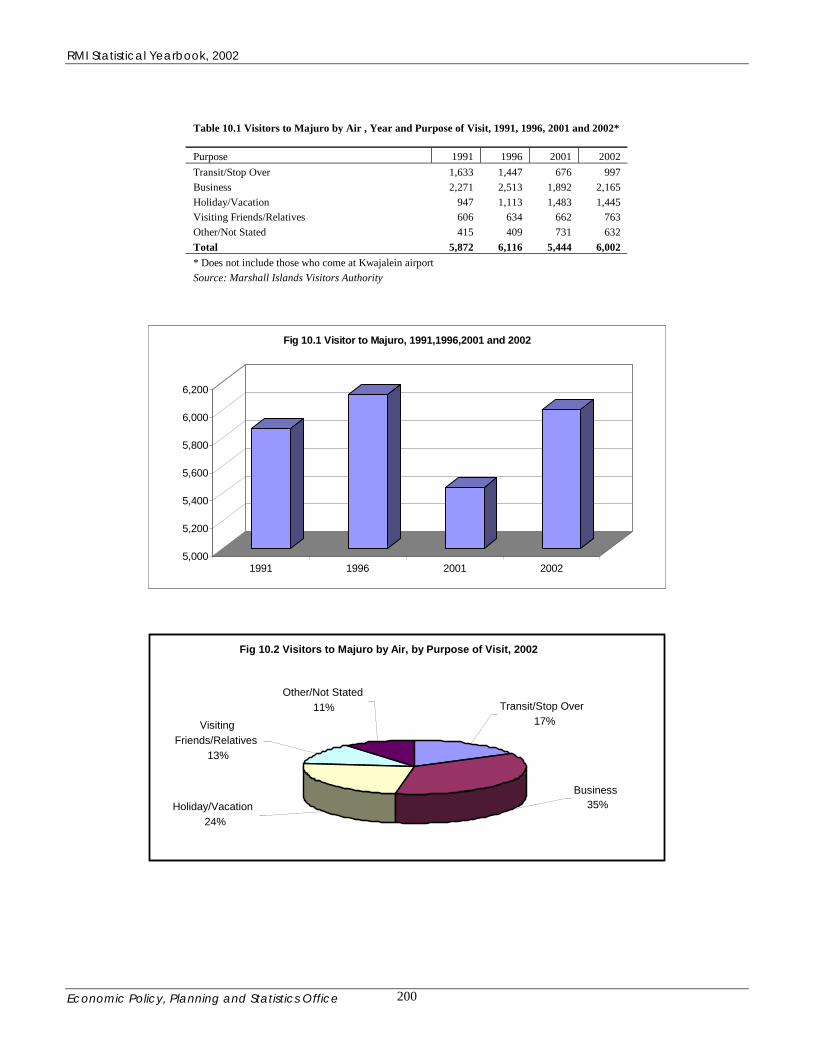
RMI Statistical Yearbook, 2002
Economic Policy, Planning and Statistics Office 200
Table 10.1 Visitors to Majuro by Air , Year and Purpose of Visit, 1991, 1996, 2001 and 2002* Purpose 1991 1996 2001 2002 Transit/Stop Over 1,633 1,447 676 997 Business 2,271 2,513 1,892 2,165 Holiday/Vacation 947 1,113 1,483 1,445 Visiting Friends/Relatives 606 634 662 763 Other/Not Stated 415 409 731 632 Total 5,872 6,116 5,444 6,002 * Does not include those who come at Kwajalein airport Source: Marshall Islands Visitors Authority
5,000
5,200
5,400
5,600
5,800
6,000
6,200
1991 1996 2001 2002
Fig 10.1 Visitor to Majuro, 1991,1996,2001 and 2002
Fig 10.2 Visitors to Majuro by Air, by Purpose of Visit, 2002
Other/Not Stated 11%
Business 35% Holiday/Vacation
24%
Visiting Friends/Relatives
13%
Transit/Stop Over 17%

RMI Statistical Yearbook, 2002
Economic Policy, Planning and Statistics Office 201
Table 10.2 Visitors to Majuro by Sex and Age, 2001 and 2002* Age 2001 2002 Male Female Total % to Total Male Female Total % to Total 0-19 68 39 107 2.0 95 43 138 2.3 20-29 79 36 115 2.1 73 33 106 1.8 30-39 313 128 441 8.1 361 106 467 7.8 40-49 814 294 1,108 20.4 878 242 1,120 18.7 50-59 931 394 1,325 24.3 1,099 447 1,546 25.7 60+ 1,442 901 2,343 43.0 1,770 836 2,606 43.4 Not stated 3 2 5 0.1 13 6 19 0.3 Total 3,650 1,794 5,444 100.0 4,289 1,713 6,002 100.0 *Does not include who come at Kwajelein airport Source: Marshall Islands Visitors Authority
0
500
1,000
1,500
2,000
No.
of V
isito
rs
0-19 20-29 30-39 40-49 50-59 60+ Notstataed
Age Groups
Fig 10.3 Visitors to Majuro by Age and Sex in 2002 MaleFemale

RMI Statistical Yearbook, 2002
Economic Policy, Planning and Statistics Office 202
Table 10.3 Visitors to Majuro by Occupational Group, 2001 and 2002*
Occupational Group 2001 2002 No. Percent No. Percent Legislators, Senior Officials and Managers 615 11 705 11.7 Professionals 1,342 25 1,464 24.4 Technicians and Associate Professionals 761 14 788 13.1 Clerks 302 6 307 5.1 Service Workers & Shop/ Market Sales Workers 305 6 292 4.9 Skilled Agricultural & Fishery Workers 40 1 81 1.3 Craft & Related Workers 39 1 40 0.7 Plant & machine Operators & Assemblers 229 4 542 9.0 Elementary Occupations 17 0 9 0.1 Armed Forces 27 1 37 0.6 Not Classified/Not Stated 1,767 33 1,737 28.9 Total 5,444 100 6,002 100.0 * Does not include visitors going to Kwajalein airport Also those Marshallese who are settled/working in other countries and
visiting RMI are also not accounted for. Source: Marshall Islands Visitors Authority
Fig 10.4 Visitors to Majuro in 2002 by Occupational Groups
11.7
24.4
13.1
5.1
4.9
1.3
0.7
9.0
0.1
0.6
28.9
0.0 5.0 10.0 15.0 20.0 25.0 30.0 35.0
Legislators, Senior Officials and Managers
Professionals
Technicians and Associate Professionals
Clerks
Service Workers & Shop/ Market Sales Workers
Skilled Agricultural & Fishery Workers
Craft & Related Workers
Plant & machine Operators & Assemblers
Elementary Occupations
Armed Forces
Not Classified/Not Stated

RMI Statistical Yearbook, 2002
Economic Policy, Planning and Statistics Office 203
Table 10.4 Visitors to Majuro by Nationality, 2002* Country 2001 2002 No. Percent No. Percent USA/Canada & other America 2,107 38.7 2,156 35.9 Australia/ New Zealand 291 5.3 263 4.4 Other Pacific Island countries 785 14.4 1,072 17.9 European Countries 221 4.1 147 2.4 Japan 996 18.3 828 13.8 Taiwan 412 7.6 347 5.8 People's China 114 2.1 159 2.7 Phillipines 222 4.1 239 4.0 Other Asian Countries 256 4.7 489 8.1 Others & Not Stated 40 0.7 302 5.0 Total 5,444 100.0 6,002 100.0 * Does not include those who come at the Kwajalein airport. Source: Marshall Islands Visitors Authority
Fig 10.5 Visitors to Majuro by Nationality, 2002
35.9
4.4
17.9
2.4
13.8
5.8
2.74.0
8.1
5.0
0.0
5.0
10.0
15.0
20.0
25.0
30.0
35.0
40.0
USA/Canada &other America
Australia/ NewZealand
Other PacificIsland countries
EuropeanCountries
Japan Taiwan People's China Phillipines Other AsianCountries
Others & NotStated

RMI Statistical Yearbook, 2002
Economic Policy, Planning and Statistics Office 204
Table 10.5 Visitor to Majuro on Holidays, 2000 to 2002
Month 2000 2001 2002 January 75 63 85 February 48 73 91 March 197 120 87 April 57 82 94 May 66 86 119 June 73 139 118 July 280 194 192 August 166 256 191 September 117 247 171 October 96 86 84 November 72 76 120 December 76 61 93 Total 1,323 1,483 1,445 Source: Marshall Islands Visitors Authority (MIVA), EPPSO
Fig 10.6 Visitors to Majuro on Holidays, 2000 to 2002 by Months
0
50
100
150
200
250
300
Janu
ary
Februa
ryMarc
hApri
lMay
June Ju
ly
Augus
t
Septem
ber
Octobe
r
Novem
ber
Decem
ber
Num
bers
2000
2001
2002

RMI Statistical Yearbook, 2002
Economic Policy, Planning and Statistics Office 205
Table 10.6 Visitor to Majuro by Usual Residence, 1998 to 2002
usual residence Total 1998 1999 2000 2001 2002
Canada 154 40 25 20 43 26 USA 10,041 1,926 2,043 1,999 1,945 2,128 Other America 23 9 3 3 6 2 Australia 686 145 123 140 134 144 Fiji 669 107 108 148 147 159 FSM 1,521 308 273 420 241 279 Kiribati 1,839 674 295 321 279 270 Nauru 230 5 7 18 70 130 New Zealand 453 84 100 62 88 119 Palau 215 48 35 65 35 32 Tuvalu 80 29 15 17 12 7 Other Pacific 951 147 131 192 286 195 China 572 165 85 83 80 159 Taiwan 2,166 670 585 211 353 347 Japan 2,828 104 100 856 940 828 Korea 639 205 175 72 75 112 Philippines 1,080 211 280 170 180 239 Other Asia 722 35 48 109 153 377 UK 215 40 31 31 41 72 Germany 114 35 25 25 9 20 Other European Union 168 10 29 43 44 42 Other Europe 74 4 6 30 21 13 Other Countries 72 - 0 30 20 22 N/A 846 43 100 181 242 280
Total 26,358 5,044 4,622 5,246 5,444 6,002
Source: Marshall Islands Visitors Authority (MIVA), EPPSO
���������������������������������������������
���������������������������������������������������������������������������������������������������������������������
����������������� ���������������������������������������������
��������������������������������������������������������������������������������������������������������
����������������������������������
���������������������������������������������
���������������������������������������������������������������������������������������������������������������������
�������������������������������������������������������������������
���������������������������������������������������������������������������������������������������������������������
����������������������������������
�������������������������������������������������������
����������������������������������������������������������������������������������������������������������������������������������
����������������������������������
0
1,000
2,000
3,000
4,000
5,000
6,000
7,000
No.
of V
isito
rs
1998 1999 2000 2001 2002
Fig 10.7 Visitors to Majuro by Usual Residence, 1999 to 2002

RMI Statistical Yearbook, 2002
Economic Policy, Planning and Statistics Office 206
Chapter 11-Non Governmental Organizations
Non-governmental Organizations in RMI Civil Society, or non-state actors, are those groups and organizations that are not part of the government or the private sector. NGOs are non-profit organizations that seek to promote social and economic development, particularly at the grass roots level. In past years, NGOs had difficulty in finding the right circumstances to grow and develop in the RMI. Recently in the changing socio-economic and political environment, the government has begun to recognize the role of NGOs in ensuring people’s participation in nation building efforts. The recognition of the importance of NGOs is reflected in government’s decision to allocate 15 percent of 9th EU development funds to support activities and programs administered by NGO’s. A 1998 report supported by the Canada Fund identified 600 organizations associations in the RMI. Two thirds of these NGOs were involved with the church related activities. The following chapter is a brief description of some programs and activities by the larger and more active NGOs
RMI Statistical Yearbook, 2002
Economic Policy, Planning and Statistics Office 207
Women United Together Marshall Islands Women United Together Marshall Islands (WUTMI) was established in 1987 to serve as the voice of women throughout the Marshalls. WUTMI’s primary goal is to support and strengthen Marshallese women and in so doing, to strengthen Marshallese families. WUTMI seeks to encourage and ensure activities that preserve and strengthen the values of traditional Marshalllese culture as well as addressing the realities of modern life in the islands. The current focus of WUTMI are projects that prepare younger women to take their role in society as mothers, educators, health professionals, leaders and businesswomen. WUTMI actively seeks resources for projects such as empowerment, life skills development, research into areas such as child abuse and training in areas of greatest need. WUTMI has 24 Chapters and is represented in all the outer- islands of the RMI. Each of the Chapters are represented on the Executive Board of WUTMI. For the management of its finances, WUTMI has two major accounts: the Recurrent Account, which is the general operational budget, and the Development or Capital account for the organization’s projects. WUTMI’s recurrent account comes from each of the Chapter’s annual fees ($5,000 from Majuro and Kwajalein and $500 from each of 22 rural Chapters, a total of $11,000, a year), the money from WUTMI and Chapters’ fundraising activities, WUTMI’s fee for establishing and monitoring the grants, and other funds from individuals such as from two iroijs –Imata Kabua and Anjua Loeak. The funds are used maintain WUTMI operations. The development account includes all the listed projects granted to WUTMI such as the CDC WAVE grant, the PREL PAT grant, the Canada Fund WUTMI Assessor Training grant, the AusAid Office Upgrade grant, and so forth. WUTMI’s Projects • Australian Volunteer International (AVI- 2002-2004). The assignment of AVI Coral Jones to
WUTMI will end in January 2004. The services of Coral have helped in reviving/revitalizing WUTMI and strengthening its institutional capacity. The total amount of grant from the donor agency is 49,440 US Dollars.
• Workforce Investment Act (WIA) Internship (2002-03). Intern Romania Joribwij is scheduled to complete her training in September 2003 and after that WUTMI will hire her in the management of the WUTMI office. 4,900 US Dollars is the total budget under this project.
• Women Against Violence through Education (WAVE – 2002-03). The project ended in September. A pilot survey has recently been completed on violence against women. 50,000 US Dollars were provided by the CDC-MOH.
• Parents as Teachers (PAT), PREL project (2003-06). The project targets 10 low-income families per year preferably teen parents with 0-5 years of age children to strengthen parenting skills to better prepare children for schooling. The total assistance given was 81,740 US Dollars.
• WUTMI assessor Training (WAT) Project. Women from 5 of the outer-islands are trained so they could assess their needs, develop and manage projects, and write grants. The project ends on 31st March 2004. This capacity building project has a grant of 27,984 US Dollars.

RMI Statistical Yearbook, 2002
Economic Policy, Planning and Statistics Office 208
Collaborators and Associates of WUTMI WUTMI regularly works with the following NGOs:
1. Aelon Kein Ad Technical Support, Inc. (AKTS Inc.) 2. Pacific Resources for Education and Learning (PREL) 3. Jodrikdrik-Jodrikdrik ilo Ejmour (JNJIE)
WUTMI along with the following NGOs is in the process of forming an umbrella organization: JNJIE, Waan Aelon in Majel (WAM), Mission Pacific, and AKTS Inc. The purpose of forming an umbrella organization is to further organize the their efforts and coordinate activities with a view to ensure optimum service delivery in different areas and sections of the society. In addition WUTMI has created its own website.
Survey conducted on: Violence Against Women This is the first survey of its kind conducted in the RMI. The sample size was 111, covering 19 women in Majuro, 33 in Mili, 37 in Ebon and 22 in Ebeye. Some preliminary findings of the survey were:
• 87 percent reported physical abuse, and 60 percent reported sexual abuse. Sixty five percent of the
women abused, reported that they were abused more than ten times. • 40 percent reported the age of first abuse to occur in the teens, 40 percent in 20’s, 14 percent in
30’s and 2 percent in 40’s. 12 percent cases reported the occurrence of abuse while they were at work.
• 92 percent of the cases, the violence was perpetrated by the husband. • Police help was sought by only 12 percent of the victims.
The findings of the survey will be an eye opener. WUTMI will develop an action plan on the basis of the results of the study.

RMI Statistical Yearbook, 2002
Economic Policy, Planning and Statistics Office 209
Youth to Youth in Health The late Darlene Keiju Johnson founded youth to Youth in Health in 1986. Originally founded to address the rapid population growth issues in the RMI, the organization very quickly expanded its focus from family planning and contraceptive use to numerous issues affecting the health of young people. These issues include STDs, HIV/AIDS, teenage pregnancy, alcohol and substance abuse, peer pressure, suicides, educational attainment, and nutrition. Much of its focus was primarily in the field of adolescent reproductive health. Topics like gang violence, sexual/physical abuse, and juvenile delinquency have been added as factors that affect the overall health of young people in the RMI. The program has three main objectives. Its first objective is to educate young people in health issues that affect their quality of life and health. This is done through youth peer educator health and leadership training seminars that are carried out every summer, school and community outreach activities are also conducted by trained peer educators. Outreach activities are achieved through various means such as skits, plays, radio, video productions, lectures, counseling sessions, development of health brochures and information leaflets. The success of the NGO in reaching the youth is due to its utilization of young people to spread the messages of healthy and risky behaviors and how they affect their quality of life. Youth who are not attending school are the main target group recruited for the peer educator training seminars. Its second objective is to provide clinical and counseling services of young people who would otherwise not normally go to main hospitals or health dispensaries for preventive care and counseling. The ground floor of the Center is devoted entirely to clinic and provision of counseling services. However, the clinic services have been suspended because there is no trained nurse at this time. Counseling services are available presently on limited scale. The third objective is to network with other health, education, and grassroots agencies/organizations to encourage the sharing of vital information, resources and responsibilities to deal with the various social problems of the RMI. This is to ensure that programs are relevant, efficient, and effective in reaching young people.

RMI Statistical Yearbook, 2002
Economic Policy, Planning and Statistics Office 210
Pacific Resources for Education and Learning in RMI Pacific Resources for Education and Learning (PREL serves 10 Pacific Island political entities, whose affiliation with the U.S ranges from statehood to free association. PREL’s main office is located in Honolulu, Hawaii, with service centers in the Republic of the Marshall Islands, Commonwealth of the Northern Mariana’s, Republic of Palau, American Samoa, Guam and one each in the Federated States of Micronesia ( Pohnpei, Chuuk, Kosrae and Yap). PREL seeks to transform schools and other learning environments to help Pacific islanders, English language learners and other students reach their full potential. PREL provides expertise in all areas of education, as well as in project management, networking, and product development. PREL offers a variety of professional development services for teachers, both in person and using advanced distance education technologies. PREL’s mission is to strengthen culture, increase literacy, and improve quality of the life locally, nationally, and globally. Guiding Beliefs These are guiding beliefs of PREL:
• All children can learn • It is essential to educate the whole child • Pacific education is a dynamic partnership. Learning and sharing throughout the Pacific
educational community are essential in achieving our vision for the Pacific child.
The following services are provided to the RMI by the PREL Service Center at Majuro:
1. Regional Education Laboratory Program. A research – based program focusing on reading. Delap Elementary School is the Site for this study.
2. Mathematics & Science Education The goal of this program is to strengthen Technical Assistance to schools in Science and Mathematics Education.
3. Parents Information and Resource Center Program This Project has two main components. Component One is tasked to work with Primary schools in RMI to improve the quality of parental involvement to improve learning and teaching. Component Two is developing the foundation of Child development with a home-based “Parents As Teachers” program in Early Childhood focusing on children 0 to 3 years old. The goal of this work is to improve parenting skills in the most important years of a child’s growth. Information dissemination via Parent Training, PTA meetings and other activities via community faith-based groups are a few ways information is getting out to communities. Agency collaboration, networking partners such as WUTMI, Head Start and local school improvement teams are working to improve Early Childhood Education. Another aspect of the program is translation of relevant materials into Marshallese so our target audience can have better access to information. This is an on-going process of collaboration with other agencies and education programs, such as Ministry of Education, Ministry of Health and Ministry of Internal Affairs.

RMI Statistical Yearbook, 2002
Economic Policy, Planning and Statistics Office 211
WAAN AELON IN MAJEL Waan Aleon In Majel (WAM), the Canoes of the Marshall Islands uses the medium of canoe and boat building to spread its message. WAM directly contributes to the achievement of national development objectives by fostering cultural and economic development, national unity and self-identity. It empowers the youth of today by teaching them traditional and modern sustainable skills, providing skills needed for employment and income generation. This helps reduce poverty in the Marshall Islands while empowering youth with the ability to contribute to their family and community. Skills include outrigger canoe building, maintenance and repair, sailing and navigation ensure that this unique aspect of Marshallese culture is kept alive. With an eye to modern circumstances, WAM has added modern boat building and fiberglass training to its formal curriculum.
WAM builds capacity into the trainees and their trainers in a drug and alcohol free setting and plans to add a counseling and life skills section to strengthen the effectiveness of this portion of the program. To further expand this life skill component, WAM intends to participate in a pilot program in which up to four individuals who are currently incarcerated will be rehabilitated through their involvement with vocational training and counseling portions of the WAM program. The goals of WAM have been: • To develop the infrastructure necessary to support sustained transference of traditional
Marshallese maritime skills. • To endow the young men and women of the Marshall Islands with a skillset relevant to the
contemporary realities of Pacific Island societies. • To promote sustainable economic and cultural development in the RMI.
• To focus on building capacity in the youth -at- risk. • To enhance the RMI’s spirit of national unity and self-identity.
WAM is committed to assist in the transfer of traditional skills and knowledge to future generations of Marshall Islanders. WAM will search to find the best methods of transferring this important knowledge of traditional skills and contemporary vocational and life skills. WAM develops markets for the end products of woodworking, boat building and fiberglass training projects, using the proceeds to help sustain the program and promote development of cottage industries. WAM builds bridges across cultures, establishing collaborative partnerships with agencies, counterparts, colleagues, funders, private and public sector organizations worldwide that are concerned with the promotion of sustainable economic development while connecting the culture and tradition to a modern set of economic circumstances. 84 percent of the persons trained under the program, are using the skills they have learned while at WAM. As many as 4,714 students visited the WAM canoe house and were shown activities that are undertaken at WAM.
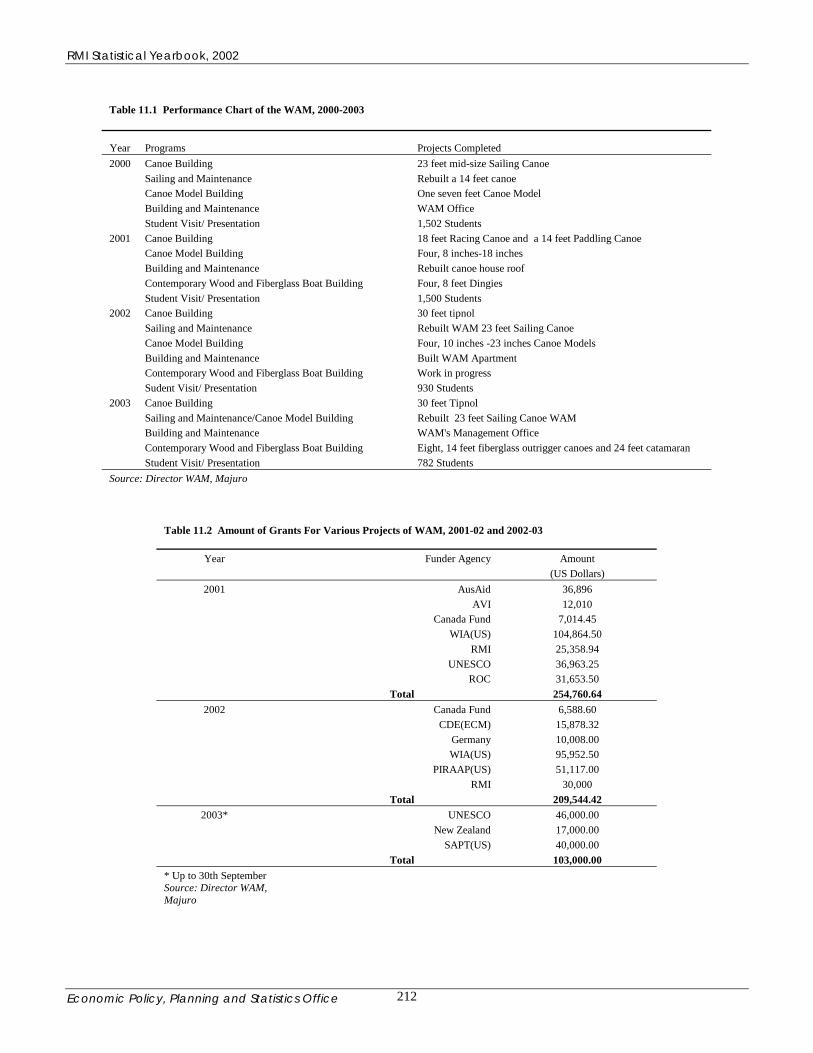
RMI Statistical Yearbook, 2002
Economic Policy, Planning and Statistics Office 212
Table 11.1 Performance Chart of the WAM, 2000-2003
Year Programs Projects Completed 2000 Canoe Building 23 feet mid-size Sailing Canoe
Sailing and Maintenance Rebuilt a 14 feet canoe Canoe Model Building One seven feet Canoe Model Building and Maintenance WAM Office Student Visit/ Presentation 1,502 Students
2001 Canoe Building 18 feet Racing Canoe and a 14 feet Paddling Canoe Canoe Model Building Four, 8 inches-18 inches Building and Maintenance Rebuilt canoe house roof Contemporary Wood and Fiberglass Boat Building Four, 8 feet Dingies Student Visit/ Presentation 1,500 Students
2002 Canoe Building 30 feet tipnol Sailing and Maintenance Rebuilt WAM 23 feet Sailing Canoe Canoe Model Building Four, 10 inches -23 inches Canoe Models Building and Maintenance Built WAM Apartment Contemporary Wood and Fiberglass Boat Building Work in progress Sudent Visit/ Presentation 930 Students
2003 Canoe Building 30 feet Tipnol Sailing and Maintenance/Canoe Model Building Rebuilt 23 feet Sailing Canoe WAM Building and Maintenance WAM's Management Office Contemporary Wood and Fiberglass Boat Building Eight, 14 feet fiberglass outrigger canoes and 24 feet catamaran Student Visit/ Presentation 782 Students
Source: Director WAM, Majuro
Table 11.2 Amount of Grants For Various Projects of WAM, 2001-02 and 2002-03
Year Funder Agency Amount (US Dollars)
2001 AusAid 36,896 AVI 12,010 Canada Fund 7,014.45 WIA(US) 104,864.50 RMI 25,358.94 UNESCO 36,963.25 ROC 31,653.50 Total 254,760.64
2002 Canada Fund 6,588.60 CDE(ECM) 15,878.32 Germany 10,008.00 WIA(US) 95,952.50 PIRAAP(US) 51,117.00 RMI 30,000 Total 209,544.42
2003* UNESCO 46,000.00 New Zealand 17,000.00 SAPT(US) 40,000.00 Total 103,000.00 * Up to 30th September Source: Director WAM, Majuro
RMI Statistical Yearbook, 2002
Economic Policy, Planning and Statistics Office 213
Chapter 12-Agriculture, Fisheries and Rural Development In this chapter, information has been provided on fisheries, tuna fish processing plant, production of subsistence primary agriculture products and meat products including the number of pigs and poultry, horticulture, copra and marketing. The details of the projects under implementation in outer islands have also been provided in this chapter. Agriculture The land area of the country is only 70 square miles. The soil is poor and it is not suitable for growing of crops like wheat, barley and corn. Some places like at Laura agriculture farm, Majuro Atoll, success has been achieved in growing vegetables, root crops and fruits though on a limited commercial scale. Experimental farms like in Laura could be tried at other places as well with financial and technical help from the government or private sector. The Coconut tree, the tree of life, is the main traditional agriculture resource of the nation but it is facing a serious problem of maintenance of coconut trees at past levels due to continuous decline in copra prices in the world market. Some times, due to non-availability of adequate and timely shipping, copra produce could not be marketed and was wasted for lack storing facilities, causing a great loss to the farmers. The fall in copra production from 5,256 short tons in 2001 to 2,653 short tons in 2002 was primarily due to non-lifting of produce from the farmers in outer islands. The price of the copra has declined from 300 US dollars per short ton in 1999 to 180 US dollars per short ton. However, copra still remains the main source of income and employment for farmers in the outer islands. Greater use of copra oil for various commercial purposes and its byproducts has potential for export. The Tobolar Copra Processing Company in Majuro is trying to exploit these external markets. The government has been helping the farmers in the replacement of the senile coconut trees with the younger and superior plants to improve on copra production. Efforts are also being made to provide timely and assured transport to the farmers. The banana, bread fruit, pandanus, taro and other vegetables are mainly grown for subsistence use in the outer islands. Due to marketing problems, the farmers are not inclined to produce these crops in excess of their consumption needs. Similarly, the scope of development of piggery and poultry farming is also constrained by marketing problems. Fisheries The fisheries sector is the single most important productive sector in the RMI and is also a key export sector. The RMI has an exclusive economic zone (EEZ) of over two million square kms. of ocean that supports a significant tuna resource, the value of annual catch from which is conservatively estimated to be over US$50 million. The RMI pursues a policy similar to that in other Pacific Island Countries of collecting bilaterally and multi-laterally negotiated license revenue from distant fishing nations for access to tuna resources in the RMI EEZ. The fees are currently charged at the rate of approximately 5 percent of the landed value of the catch. The RMI has become an increasingly important regional port for transshipment, even for vessels fishing outside of the RMI EEZ and earnings from transshipment fees are substantial. The crews spend time in the country during transshipment and money is earned on meals ashore, hotels, rental cars and agency fees.

RMI Statistical Yearbook, 2002
Economic Policy, Planning and Statistics Office 214
Then there are the benefits accruing to the local economy through the purchase of bunker fuel and jet fuel (for helicopters), It is estimated by MIMRA that total expenditure in the local economy is 15-20,000 US dollars per vessel per port call, equivalent to perhaps an annual expenditure of 5-6 million US dollars in the local Majuro economy. The Tuna loining plant at Majuro provides employment to over 500 persons. This Plant exports fish and animal feed worth over 3 million US dollars every year. The capacity of the Plant has been expanding continuously since its inception.
Since 1999-2000, the Marshall Islands have flagged a ship for fishing operations in the region. The operations of the Flag Ship are very encouraging as the fish catch by the Flag Ship went up from 7,560 metric tons in 1999-2000 to 73,020 metric tons in the year 2001-02. Coastal Fisheries Efforts are being made to develop coastal fisheries with the active involvement of the outer islands’ local communities. The fishermen are encouraged to form fisheries cooperatives for the management of their ventures by themselves. Fishermen have benefit of fish bases for selling their catch at Majuro, Arno, Ine, Aur, Maloelap Ebeye, Likiep, Ailinglaplap, Namu and Jabwor. Similar projects in other atolls are in the offing. The local fishermen have an ability to sell their fish at these fish collecting/marketing stations. Household Water Catchments After the El Nino event of 1997 – 98, the RMI received assistance from the U.S. Federal Emergency Management Administration (FEMA) for the provision of household water catchments to the outer islands. This FEMA program distributed 1,068 fifteen hundred gallon household water catchments to the outer islands during 2001 and 2002, however, according the 1999 Census there were a total of 2,352 homes on the outer islands. The RMI government appropriated $500,000 in the FY 2002 budget for the further provision of 760 catchments of the same type. During FY 2003 the RMI government appropriated an additional $250,000 for catchments, as well as receiving a further $125,000 from FEMA and $25,000 from the Canada Fund. It is expected that at the end of the calendar year 2003, only 25 – 30 homes on the outer islands will be without a water catchments. Household Solar Program The government of RMI recognizes that the provision of a cost-effective and a sustainable source of electricity to its outer islands is a key to the improvement of the standard of living of its people. Providing good public services such as clean water, power and telecommunications to these populations is also viewed as a major tool to reduce urban drift from the outer islands into Majuro and Ebeye and its impact on the countries welfare. The RMI government, in its commitment to the global effort to reduce GHG emission while ensuring sustainable development for its people believes that for the remote and scattered outer islands populations, stand alone solar systems represent the best technical and economic solution to supply electricity on the outer islands. Three solar photovoltaic projects for outer islands are currently being implemented with funding from Secretariat of the Pacific Community/PREFACE, France and United Nations development fund for a total of $600,000. These systems will be installed in 11 health centers and 200 households on the outer islands. The government has also allocated in FY2002 an additional $1,000,000 from the national capital projects budget to supply and install an additional 500 household solar systems. This represents 700 homes scheduled for 2003 - 2004.

RMI Statistical Yearbook, 2002
Economic Policy, Planning and Statistics Office 215
In addition the government has appropriated an additional $500,000 from the FY 03 capital budget to continue expansion of this program. By engaging in these highly important projects, the RMI government would like to ensure that the barriers to the sustainable and widespread application of renewable energy, in particular solar photovoltaic, are removed thus ensuring that this total 1.6 US$ million investment will effectively promote win-win activities in its renewable energy sector. In 2001 the Republic of the Marshall Islands became a signatory of the Cotonou Agreement. Under the 9th European Development Fund (EDF) the RMI has allocated approximately $400,000 to support the Household Solar Program. This funding will cover a period of 5years. This will be combined with the $1.5 million already appropriated by the RMI to the project.
According to the 1999 Census of the Marshall Islands over two – thousand homes on the outer islands use kerosene for both lighting and cooking. The price for kerosene on the outer islands is over $2 per gallon. It is also dangerous as most homes on the outer islands are constructed of wood or local materials. Use of solar systems should be cheaper for the average household and reduce some of the dangers of using petroleum products and open flame in small wooden or thatch dwellings. The monthly fee for the solar systems will be in the range $8 - $12 per month. After scrutinizing various management approaches utilized throughout the Pacific region and fully comprehending the strengths and weaknesses of the approaches used, the Energy Office in the Ministry of Resources and Development, with approval from the Cabinet, is opting to gradually turn over the installation and maintenance of the Outer Island Electrification Project to MEC (Marshalls Energy Company – the electricity utility on Majuro atoll). The success of MEC has been borne of its diligent and well established management and accounting systems. Furthermore MEC has a customer-oriented approach that enables people to see that their payments are translated into a service. In addition MEC has several trained technicians and electricians to oversee substantial technical elements of this project. Manual Cement Block Making Machines One of the major roadblocks for community development on the outer islands is the lack of access to construction materials. All materials have to be shipped in from either Majuro or Ebeye. The shipping of these materials to the outer islands from these two urban areas is expensive and subject to irregular schedules. This places an added burden on these people and communities where cash income is already relatively scarce. A 4- inch wide cement block will cost $1.10 each, then the cost for shipping must be added. This can make even the most modest of construction or housing projects extremely expensive for people and communities with little cash. One of the challenges is locating appropriate materials or tools that can make a difference in these cash poor communities. The average budget for outer island local governments is between $15,000 - $20,000 and average household incomes are between $500 - $1,500. A partial solution has been the introduction of manual cement block making machines, particularly in areas that do not have access to power. These machines will drastically reduce the cost of new/improved housing, pigpens and other community or public projects. The cost of the average block from this machine is $.30 cents, translating into a savings of over 70% per block. These machines can make the outer islands less dependant on resources from the urban centers, stretch the limited incomes in a very effective manner and improve the quality of life in these isolated communities. To date these machines are in operation on Ebon, Mili, Arno, Likiep, and Wotje atolls and Mejit island.

RMI Statistical Yearbook, 2002
Economic Policy, Planning and Statistics Office 216
Increased Technical Assistance from the National Government Since mid – year of 2000, it has been a policy of the government and the Ministry of Finance, to assist local governments in preparing grant applications for a wide variety of bi-lateral and multilateral donors. Most mayors have limited knowledge of the types of programs and assistance that are available to them; many local government officials are not comfortable working in English and are not experienced in using computers or the internet. Staff from the Ministry of Finance have presented information to the annual Marshall Islands Mayor Association meetings (MIMA) as well as help research and write grant proposals. These proposals have covered projects from the U.S. Department of Labor to provide agriculture training directly in the outer islands. Japan Grassroots Grants for the construction of dispensaries, school buildings and cultural centers. U.S. Department of Agriculture has assisted with construction of medical dispensary, solar powered water pumps, and pick – up trucks for the outer islands. USDA has also been very active in housing loans for low-income households throughout the RMI. U.S. Department of Agriculture – Rural Development Service USDA Rural Development is committed to helping improve the economy and quality of life in all of rural America, its territories and the Freely Associated States of the Pacific. Through these programs, rural communities are touched in many ways. USDA Rural Development financial programs support such essential public facilities and services as water and sewer systems, housing, health clinics, emergency service facilities and electric and telephone service. We promote economic development by supporting loans to businesses through banks and community-managed lending pools. We offer technical assistance and information to help agricultural and other cooperatives get started and improve the effectiveness of their member services. And we provide technical assistance to help communities undertake community empowerment programs. Community Facilities Program This program has been targeted for outer island communities. In the last two years the RMI has been reasonably successful in winning some of these competitive grants. These grants are provided on a 75% - 25% matching basis, where the local government or national government match 25% of the proposed project cost. 2001 – Likiep Atoll - $12,000 for the purchase one pick – up truck 2001 – Ministry of Education - $50,000 for purchase of two school buses
2002 – CMI - $42,000 for upgrading computer networks 2002 – Maloelap Atoll - $75,000 for the purchase of Solar Powered Water Pumps 2003 – Ebon Atoll - $38,000 for the construction of a medical dispensary 2003 – Majuro Atoll - $7,000 for the purchase of a police patrol car Rural Housing Program Rural Housing 504 Loan and Grant Program The objective of the program is to assist eligible, very low income, owner occupants to repair single-family homes located in rural area. Repairs made be made to improve or modernize the home, to make it safe, more sanitary, or to remove health and safety hazards. The interest rate for the 504 program loans is one percent (1%) per annum. The 504 program grant is given to those people who are 62 years of age or older and unable to repay a loan.

RMI Statistical Yearbook, 2002
Economic Policy, Planning and Statistics Office 217
Rural Housing 502 Loan Program The objective of the program is to provide eligible households who live in rural areas and opportunity to obtain adequate, but modest, decent, safe, and sanitary dwellings. The interest rate for the program can be as low as one percent (1%) but at the current time the rate is 5.75%.
Since the start of the USDA Rural Housing programs in 1991, there have been more than 50 trips made to the outer islands. The details of loans and grants given are shown in the
Overseas Development Partners The following the rural development programs are under execution in outer islands:
1. Japan Grassroots Grant Program (GGP)
2001 GGP Projects: $433,858 awarded - $342,174 (79%) for economic and social development.
Project Amount Majuro Atoll/Ejit Island Dock Construction 75,000 Mili Atoll Craft Center/Community Center 92,910 Likiep Atoll School Improvement 44,055 Ebon Atoll (Taka Island) Dispensary Improvement 54,191 Arno Atoll- Hybrid Solar/Wind Energy unit for St. Paul School 76,018 Total 342,174
2002 GGP Projects: $241,896 Awarded
Project Amount Mejit Island School Improvement 47,500 Majuro Atoll Cooperative School Improvement 79,807 Alinglaplap Atoll Water Catchment Installation 12,987 WUTMI (Women's Congress support) 3,039 University of the South Pacific - Majuro Continuing Education Enhancement 20,355 Majuro Atoll - Rong Rong Island Marshalls Christian High School Improvement 78,208 TOTAL 241,896
2. Canada Fund
• 2002 - Provided $28,000 to assist with improvements in services and collections at the national archives, Alele museum and the public library.
• 2001 - Provided $30,000 towards the construction of a community center on Likiep atoll.
• 2000 - $23,000 to support school libraries, primarily on the outer islands
3. Food and Agriculture Organization (FAO) Provided $10,000 for the construction of pig – pens and chicken coops on Likiep Atoll.
4. Australian Small Grant Scheme – Unfortunately this popular and productive program has
been drastically reduced due to changing budget priorities and reduced funding. 2001 - Jaluit High School - $16,000 for instructional computer lab
RMI Statistical Yearbook, 2002
Economic Policy, Planning and Statistics Office 218
2001 - Northern Islands High School - $14,000 for instructional computer lab 2002 - Marshall Islands High School - $38,000 for mathematics textbooks
5. United States Department of the Interior (DOI)
2002 – $81,000 - Approved reallocation of some outstanding program funds to construct basketball courts on the outer islands and assist the Wan Aelon en Majol (WAM) traditional canoe and crafts education programs.
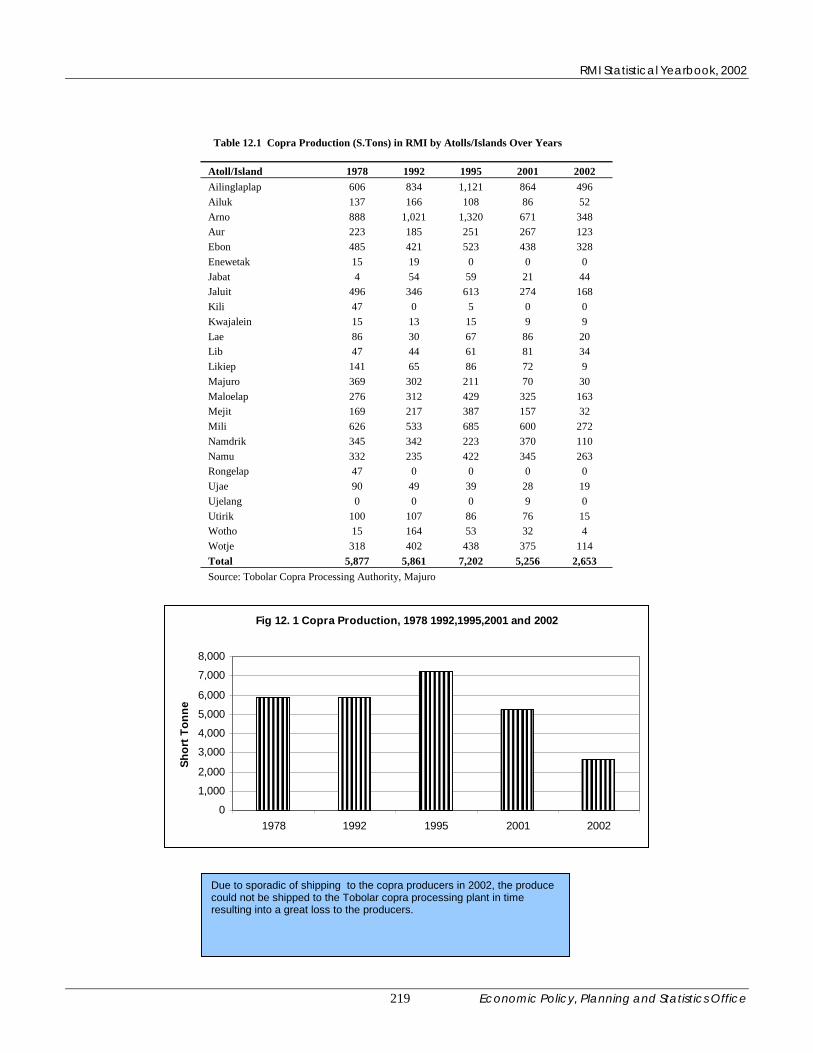
RMI Statistical Yearbook, 2002
Economic Policy, Planning and Statistics Office 219
Table 12.1 Copra Production (S.Tons) in RMI by Atolls/Islands Over Years Atoll/Island 1978 1992 1995 2001 2002 Ailinglaplap 606 834 1,121 864 496 Ailuk 137 166 108 86 52 Arno 888 1,021 1,320 671 348 Aur 223 185 251 267 123 Ebon 485 421 523 438 328 Enewetak 15 19 0 0 0 Jabat 4 54 59 21 44 Jaluit 496 346 613 274 168 Kili 47 0 5 0 0 Kwajalein 15 13 15 9 9 Lae 86 30 67 86 20 Lib 47 44 61 81 34 Likiep 141 65 86 72 9 Majuro 369 302 211 70 30 Maloelap 276 312 429 325 163 Mejit 169 217 387 157 32 Mili 626 533 685 600 272 Namdrik 345 342 223 370 110 Namu 332 235 422 345 263 Rongelap 47 0 0 0 0 Ujae 90 49 39 28 19 Ujelang 0 0 0 9 0 Utirik 100 107 86 76 15 Wotho 15 164 53 32 4 Wotje 318 402 438 375 114 Total 5,877 5,861 7,202 5,256 2,653 Source: Tobolar Copra Processing Authority, Majuro
������������������������������������������������������������������������������������������������������������������������������
���������������������������������������������������������������������������������������������������������������������
����������������������������������������������������������������������������������������������������������������������������������
��������������������������������������������������������������������������������������������������������
����������������������������������������������������������������������
Fig 12. 1 Copra Production, 1978 1992,1995,2001 and 2002
0
1,000
2,000
3,000
4,000
5,000
6,000
7,000
8,000
1978 1992 1995 2001 2002
Shor
t Ton
ne
Due to sporadic of shipping to the copra producers in 2002, the produce could not be shipped to the Tobolar copra processing plant in time resulting into a great loss to the producers.

RMI Statistical Yearbook, 2002
Economic Policy, Planning and Statistics Office 220
Table 12.2 Copra Production, Average Produce Price and Total income from the Produce in RMI Calendar Total Production Average Producer Total Producer Income
Year (Short Tons) Price Per S.Ton ($,000) 1951 4980 84 418 1961 6060 126 764 1971 5344 154 823 1981 5760 171 985 1991 4213 155 653 2001 5256 187 949 2002 2653 180 478
1 Short Ton=0.984 Metric Ton=907.2 Kgs. Source:Tobolar Processing Plant and EPPSO
Fig 12.1 Average Producer Price and Income
0
200
400
600
800
1000
1200
1951 1961 1971 1981 1991 2001 2002
Average Producer Price
Total Producer Income
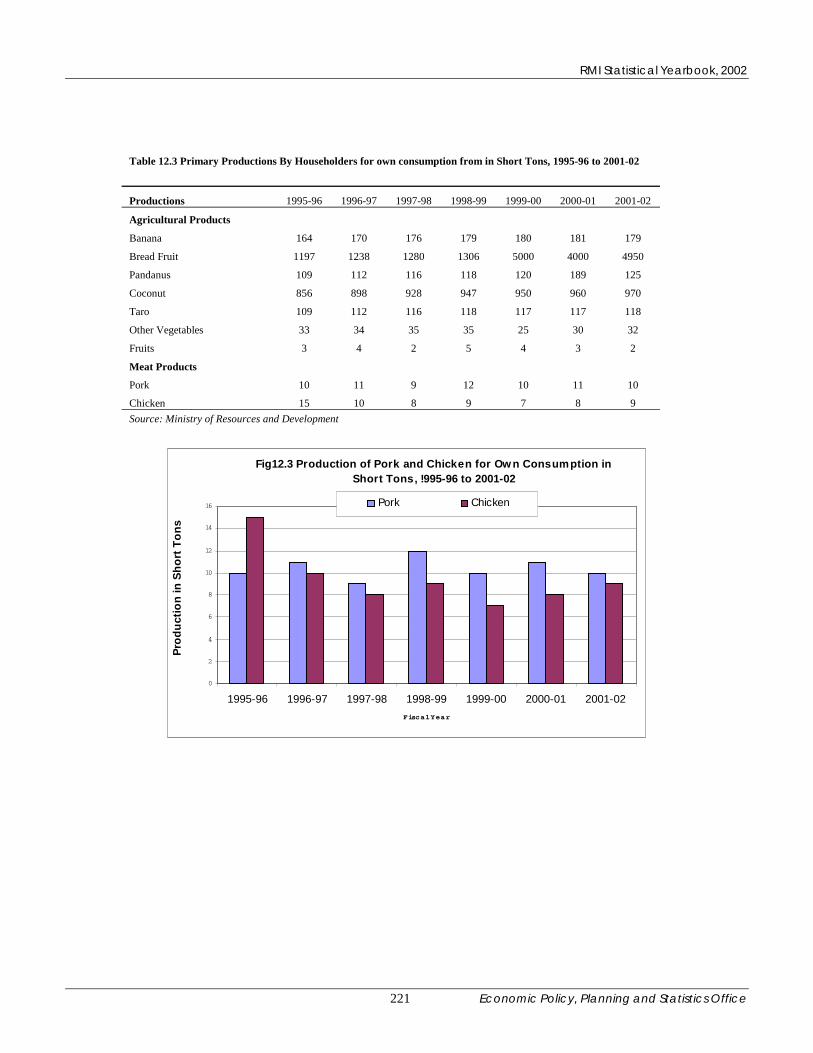
RMI Statistical Yearbook, 2002
Economic Policy, Planning and Statistics Office 221
Table 12.3 Primary Productions By Householders for own consumption from in Short Tons, 1995-96 to 2001-02
Productions 1995-96 1996-97 1997-98 1998-99 1999-00 2000-01 2001-02 Agricultural Products Banana 164 170 176 179 180 181 179 Bread Fruit 1197 1238 1280 1306 5000 4000 4950 Pandanus 109 112 116 118 120 189 125 Coconut 856 898 928 947 950 960 970 Taro 109 112 116 118 117 117 118 Other Vegetables 33 34 35 35 25 30 32 Fruits 3 4 2 5 4 3 2 Meat Products Pork 10 11 9 12 10 11 10 Chicken 15 10 8 9 7 8 9 Source: Ministry of Resources and Development
Fig12.3 Production of Pork and Chicken for Ow n Consumption in Short Tons, !995-96 to 2001-02
0
2
4
6
8
10
12
14
16
1995-96 1996-97 1997-98 1998-99 1999-00 2000-01 2001-02Fiscal Year
Prod
uctio
n in
Sho
rt T
ons
Pork Chicken

RMI Statistical Yearbook, 2002
Economic Policy, Planning and Statistics Office 222
Table 12.4 Estimated Number of Pigs and Poultry in RMI, 1990-91 to 2001-02
Year Pigs Poultry (Number) (Number)
1990-91 11,024 48,232 1991-92 11,420 51,608 1992-93 11,877 53,465 1993-94 11,794 55,391 1994-95 12,222 57,385 1995-96 13,216 57,814 1996-97 13,341 56,728 1997-98 13,159 58,805 1998-99 14,778 89,563 1999-00 13,300 87,400 2000-01 13,859 88,535 2001-02 12,565 86,354
Source: Ministry of Resources and Development
Fig 12.4 Estimated Number of Pigs and Poultry in RMI
0
20,000
40,000
60,000
80,000
100,000
1990-91
1991-92
1992-93
1993-94
1994-95
1995-96
1996-97
1997-98
1998-99
1999-00
2000-01
2001-02
Num
ber

RMI Statistical Yearbook, 2002
Economic Policy, Planning and Statistics Office 223
Table 12.5 PM&O Tuna Loining Plant Majuro….Achievements for the years 1999 to 2002
Number of Employees Fish Processed Value of fish Animal Feed Produced Financial Year Male Female Total (Short Tons) Exported($) Quantity(S.Tons) Value($)
1999 20 80 100 300 60,000 50 15,000 2000 60 240 300 10,000 2,500,000 1,600 480,000 2001 80 320 400 9,700 2,450,000 1,400 420,000 2002 100 400 500 10,200 2,550,000 1,750 525,000 Source: PM&O Tuna Loining Plant, Majuro
Fig 12.5 Achievements of Tuna Loining Plant Majuro ,1999-2002
0
500,000
1,000,000
1,500,000
2,000,000
2,500,000
3,000,000
1999 2000 2001 2002
Year
Valu
e in
US
Dol
lars
Value of FishExported
Value of AnimalFeed Produced
Table 12.6 Total Fish Catch (Metric Tons) by Marshall Islands Flag Ship in Entire Region, 2000-2002
Type of Fish Fiscal Year Bigeye Yellowfin Skipjack Total
2000 0 935 6,625 7,560 2001 50 2,215 24,953 27,218 2002 128 1,057 37,057 38,242 Total 178 4,207 68,635 73,020
Source: Marshall Islands Marine Resources Authority
178 4,207
68,635
0
10,000
20,000
30,000
40,000
50,000
60,000
70,000
Met
ric T
ons
Bigeye Yellow fin Skipjack
Type of Fish
Fig 12.6 Total Fish Catch by Marshall Islands Flag Ship, Outside RMI EEZ, FY2000-2002

RMI Statistical Yearbook, 2002
Economic Policy, Planning and Statistics Office 224
Table 12.7 Total Fish Catch (Metric Tons) in RMI EEZ By Method, 1998-2002
Fiscal Year Method of catch Long Line Purse Line Pole and Line Total
1998 2,146.5 65,551.3 18,392.0 86,089.8 1999 4,828.6 23,742.9 3,943.8 32,515.3 2000 2,110.1 20,403.1 8,207.5 30,720.7 2001 4,176.4 36,324.4 16,242.5 56,743.3 2002 1,992.1 28,915.0 7,316.3 38,223.4 Total 15,253.7 174,936.7 54,102.1 244,292.5
Source: Marshall Islands Marine Resources Authority
15,253.7
174,936.7
54,102.1
0.020,000.040,000.060,000.080,000.0
100,000.0120,000.0140,000.0160,000.0180,000.0
Met
ric T
ons
Long Line Purse Line Pole and Line
Method of Catch
Fig 12.7 Total Fish Catch by Foreign Vessels by Method in RMI EEZ, 1998-2002
Fig 12.8 Total Fish Catch by Foreign Vessels in FY 1998-2002 in EEZ of RMI
86,089.8
32,515.3 30,720.7
56,743.3
38,223.4
0.0
20,000.0
40,000.0
60,000.0
80,000.0
100,000.0
1998 1999 2000 2001 2002
Fiscal Year
Met
ric T
ons

RMI Statistical Yearbook, 2002
Economic Policy, Planning and Statistics Office 225
Table 12.8 Loans and Grants Provided to Rural Low Income Families for Repair/Modernization of Houses of Houses Under USDA Rural Development Loan And Grant Program, 1990-91 to 2001-02
Year Number of
Beneficiaries Amount Advanced($) Average Per
Beneficiary($) Loans Grants Loan Grant Loan Grant 1990-91 142 8 353,580 23,000 2,490 2,875 1991-92 47 19 107,190 63,500 2,281 3,342 1992-93 79 14 395,000 52,030 5,000 3,716 1993-94 165 48 410,160 237,500 2,486 4,948 1994-95 12 7 29,880 35,000 2,490 5,000 1995-96 8 6 19,920 30,000 2,490 5,000 1996-97 93 14 182,580 60,040 1,963 4,289 1997-98 151 38 298,443 184,500 1,976 4,855 1998-99 143 42 783,441 174,628 5,479 4,158 1999-00 49 26 210,421 108,500 4,294 4,173 2000-01 86 43 459,368 172,251 5,341 4,006 2001-02 84 28 723,127 171,598 8,609 6,129 2002-03 85 70 1,302,683 274,000 15,326 3,914 Grand Total 1,144 363 5,275,793 1,586,547 4,612 4,371 Source: US Department of Agriculture, Majuro Local Office
Fig 12.9 No. of Beneficiaries of Loans and Grants Under USDA, Rural Development, Housing Program
0200,000
400,000600,000
800,0001,000,000
1,200,0001,400,000
1990-91
1991-92
1992-93
1993-94
1994-95
1995-96
1996-97
1997-98
1998-99
1999-00
2000-01
2001-02
2002-03
Year
Am
ount
in U
S D
olla
rs
Loans Grants

RMI Statistical Yearbook, 2002
Economic Policy, Planning and Statistics Office 226
Table 12.9 Loans and Grants Provided to Rural Low Income Families for Repair/Modernization of Houses by Atoll Under USDA Rural Development Loan And Grant Program, 2001-02 Atoll Number of Beneficiaries of: Amount Given ($) Loan Grant Loan Grant Majuro 69 18 590,597 101,598 Likiep 4 0 52,530 0 Wotje 1 0 15,000 0 Jaluit 6 6 35,000 40,000 Ebeye 4 4 30,000 30,000 Source: US Department of Agriculture, Majuro Local Office
Table 12.10 Loans and Grants Provided to Rural Low Income Families for Repair/Modernization of Houses by Atoll Under USDA Rural Development Loan And Grant Program, 1992-93
Atoll Number of Beneficiaries of: Amount Given ($) Loan Grant Loan Grant Mejit 23 12 57,270 60,000 Likiep 26 22 64,740 110,000 Wotho 10 11 24,900 55,000 Utrik 10 6 24,900 30,000 Wotje 26 11 64,740 55,000 Enewetak 14 6 34,860 30,000 Ailuk 30 17 74,700 85,000 Aur 28 4 69,720 20,000 Maloelap 44 12 109,560 60,000 Source: US Department of Agriculture, Majuro Local Office
Fig 12.11 Loans and Grants Advanced by USDA to Rural Low Income Families for Housing, 1992-93
020,000
40,00060,00080,000
100,000120,000
Mejit
Likiep
Wotho UtrikWotje
Eneweta
kAilu
kAur
Maloela
p
Am
ount
in U
S D
olla
rs Loan
Grant
Fig 12.11 Loans and Grants to Low Income Rural Families for Housing by USDA 2001-02
0 100,000 200,000 300,000 400,000 500,000 600,000 700,000
Majuro Likiep Wotje Jaluit Ebeye
$ Loan Grant
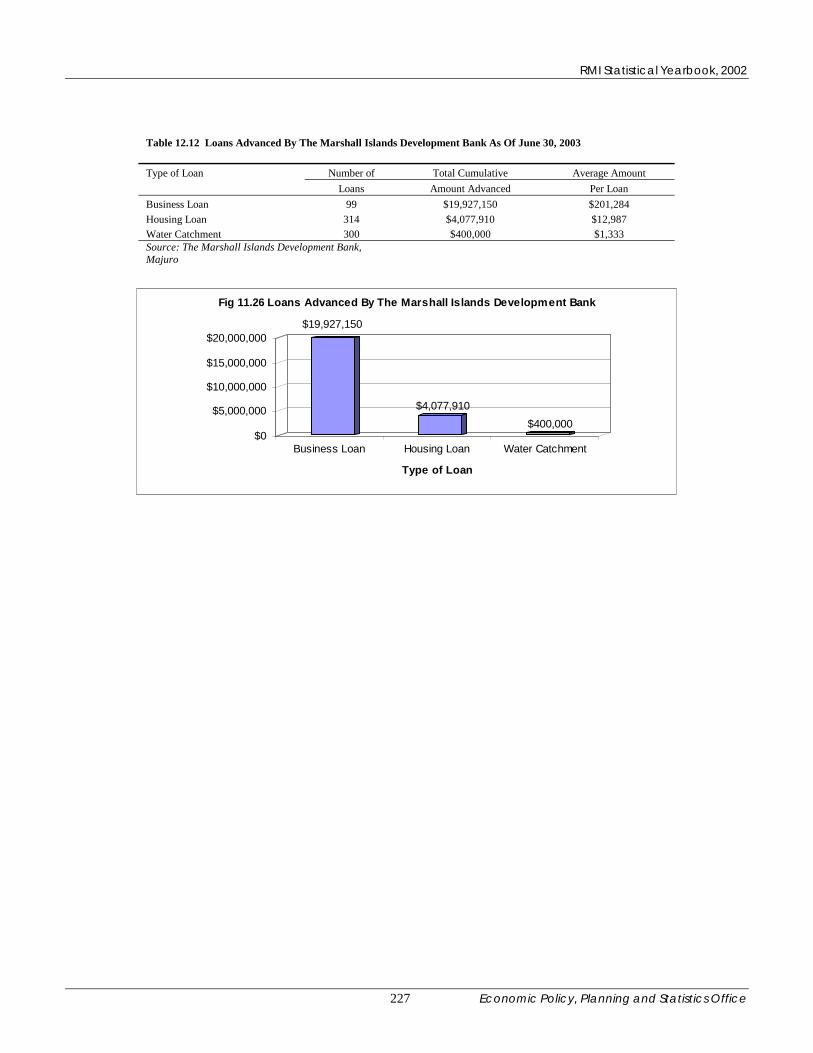
RMI Statistical Yearbook, 2002
Economic Policy, Planning and Statistics Office 227
Table 12.12 Loans Advanced By The Marshall Islands Development Bank As Of June 30, 2003 Type of Loan Number of Total Cumulative Average Amount Loans Amount Advanced Per Loan Business Loan 99 $19,927,150 $201,284 Housing Loan 314 $4,077,910 $12,987 Water Catchment 300 $400,000 $1,333 Source: The Marshall Islands Development Bank, Majuro
$19,927,150
$4,077,910$400,000
$0
$5,000,000
$10,000,000
$15,000,000
$20,000,000
Business Loan Housing Loan Water Catchment
Type of Loan
Fig 11.26 Loans Advanced By The Marshall Islands Development Bank