foreword - defense acquisition university system readiness outcomes—requires a life cycle...
TRANSCRIPT
1

2
3
Foreword
As DoD moves forward with weapon system acquisition reform, attention to product support
must be increased, and life cycle management must be better focused to achieve affordable
operational Warfighter outcomes. Too often in the past, weapon system product support has been
neglected in acquisition and logistics transformation efforts. Therefore, if the Department is
going to truly reform the business of delivering weapon system capabilities to the Warfighter, it
must also reform the stewardship of the $132 billion spent each year in product support.
Reformed stewardship—driven by improving product support and achieving more cost-effective
weapon system readiness outcomes—requires a life cycle management focus, committed
leadership, and cooperative efforts from the operational, acquisition, and logistics communities.
This DoD Weapon System Acquisition Reform Product Support Assessment captures the
findings and recommendations needed to drive the next generation of product support strategies.
During its year-long study, our 65-member pan-DoD and industry team, led by the Office of the
Deputy Under Secretary of Defense for Logistics and Materiel Readiness, identified eight
principal areas that, if developed or improved, will make product support more effective and
acquisition reform more far-reaching:
1. Product Support Business Model
2. Industrial Integration Strategy
3. Supply Chain Operational Strategy
4. Governance
5. Metrics
6. Operating and Support Costs
7. Analytical Tools
8. Human Capital
I appreciate the team’s work to arrive at these findings and to publish this comprehensive report.
Please be assured you will have my support during implementation of the eight recommendations.
I look forward to working with the DoD Components and Agencies, Congress, Industry, and the
Warfighter as we implement successful change in weapon system product support and acquisition
reform. Your cooperation is paramount. Let’s drive this effort home!
Ashton B. Carter
Under Secretary of Defense
for Acquisition, Technology and Logistics

4
Table of Contents
Executive Summary ........................................................................................................................ 7 Chapter 1: The Product Support Challenge .................................................................................. 15 Chapter 2: Management and Analytical Approach ....................................................................... 22 Chapter 3: Next-Generation Business Model for Life Cycle Product Support ............................ 29
Chapter 4: Strategies for Implementing the Life Cycle Product Support Business Model .......... 41 Chapter 5: Recommended Processes and Enablers for Implementing the Product Support
Business Model ........................................................................................................... 54 Chapter 6: Life Cycle Product Support Implementation .............................................................. 71
Chapter 7: Critical Path and Accountability ................................................................................. 77 Appendix A: PSAT Weapon System Data Analysis .................................................................... 81 Appendix B: PSAT Weapon System Data Sources and Strategy Assignation Rationale ............ 92
Appendix C: Product Support Business Model Detailed Elements ............................................ 104 Appendix D: Product Support Cost Estimation Methodology ................................................... 113

5
Figures
Figure 1: PSAT Recommendation Areas ................................................................................... 12
Figure 2: Significant Service Policy Initiatives in Support of Performance-Based
Approaches ................................................................................................................. 17 Figure 3: Defense O&S Needs Keep Growing and are Likely to Grow beyond DoD’s
Capacity to Meet Them ............................................................................................... 20 Figure 4: Working Group Representative Organizations ........................................................... 22
Figure 5: Senior Steering Group Representative Organizations ................................................ 23 Figure 6: Product Support Assessment Team Structure ............................................................. 24 Figure 7: PSAT Project Plan with Key Activities and Milestones ............................................. 24 Figure 8: The Life Cycle Product Support Vision and Guiding Principles ................................ 26
Figure 9: Partnering Strategies Produce Higher Sustained Readiness Improvement................. 32 Figure 10: The Product Support Business Model Is a Hierarchical Level of Functions
Integrated with PBAs .................................................................................................. 34
Figure 11: Decision Matrix for Product Support—Options Framework Examines the
Intersection of Integration and Weapon System Strategy ........................................... 36
Figure12: Implementation Elements Example—Option 2.1 Industry-Centric Subsystem
Strategy ....................................................................................................................... 37 Figure 13: Opportunities Exist for Commodity and Enterprise Product Support Management .. 38
Figure 14: High Correlation among Factors Cited as Success Factors in Partnerships ............... 44 Figure 15: Industry Partnerships Yield Better Readiness Improvement and Cost
Management ................................................................................................................ 46 Figure 16: The Supply Chain Architecture Provides the Structure for Converting Material
into Warfighter-Defined Outcomes ............................................................................ 49
Figure 17: The Joint Supply Chain Architecture (JSCA) Provides a Hierarchy of Processes
Tied to Common High-Level Metrics......................................................................... 50 Figure 18: The ―e-Hub‖ Combines Supply Chain Information from the Services and
Supporting Agencies to Create a Common Operating Picture ................................... 52
Figure 19: The Sustainment Chart ................................................................................................ 57 Figure 20: Product Support Lives in All Neighborhoods of the Acquisition and Logistics
Communities ............................................................................................................... 68
Figure 21: The Core Team Concept Identifies High-Level Roles and Responsibilities and
Forms the Foundation of Strong Change Management .............................................. 72 Figure 22: The Product Support Executive Council Representation Ensures Initiatives are
Properly Supported and Aligned with DoD Strategy and Life Cycle Product
Support Vision and Guiding Principles ...................................................................... 74
Figure 23: Product Support Management Cadence Ensures Implementation Progress Is
Tracked and Reported in a Scheduled and Repeatable Manner ................................. 74
Figure 24: PSAT Weapon System Analyses Used Extensive Cost and Performance Data
from Each of These Weapon Systems ........................................................................ 81 Figure 25: Quantitative and Qualitative Questions Asked in the February 2009 OSD
Data Call ..................................................................................................................... 82 Figure 26: Several Databases Helped Fill Data Gaps after Conducting the OSD Data Call
and Subsequent Specific Data Requests ..................................................................... 83 Figure 27: Program Uniqueness Required a Relative Comparison across Similar Domains....... 84

6
Figure 28: Sustained Readiness Improvement Is Equivalent to Taking a ―First Derivative‖
of Availability Data and Allows Comparison of Trends across Weapon System
Programs within a Domain ......................................................................................... 85 Figure 29: Partnering with Industry at the Subsystem and Platform Level Leads to Higher
Sustained Readiness Improvement ............................................................................. 86 Figure 30: Systems with Better Sustained Cost Management Used Subsystem and Platform-
Level Partnering Strategies ......................................................................................... 87 Figure 31: Subsystem and Platform-Level Industry Partnerships Designed to Achieve
Target Outcomes Yield Higher Sustained Readiness Improvement........................... 88
Figure 32: Subsystem and Platform-Level Industry Partnerships Designed to Achieve
Target Outcomes Manage Cost Best........................................................................... 88 Figure 33: Outcome-Focused Support Strategies Produce Higher Readiness Improvement ....... 89 Figure 34: Industry and Partnering Strategies Produce Higher Sustained Readiness
Improvement ............................................................................................................... 89 Figure 35: Subsystem and Platform Strategies Yield Higher Sustained Readiness
Improvement ............................................................................................................... 90 Figure 36: Industry and Partnering Comprise Almost 100% of High-Upside Strategies ............ 90
Figure 37: Outcome and Blended Strategy Costs Are at Least as Predictable as Transactional.. 91 Figure 38: Subsystem and Platform Strategies Yield Same or Better Cost Management............ 91 Figure 39: Product Support Cost Framework ............................................................................. 114
Figure 40: OP-32 Line Items Are Decomposed and Categorized to Build Total Product
Support Costs ............................................................................................................ 116
Figure 41: Maintenance Operations Rolled-up Element Cost Calculation Example ................. 117 Figure 42: Product Support Cost Calculation Results ................................................................ 118
Tables
Table 1: Summary of Study Findings ....................................................................................... 11
Table 2: 1999 Factors for Improved Product Support .............................................................. 16 Table 3: Implementation Master Schedule ............................................................................... 76 Table 4: Rationale behind Weapon Systems Strategy Category Assignation........................... 92
Table 5: Overview and Contents ............................................................................................. 104 Table 6: Target Metrics (Outcome Objectives) ...................................................................... 105 Table 7: Representative Example Rationales .......................................................................... 106 Table 8: Product Support Roles .............................................................................................. 107 Table 9: Government and Industry Incentives ........................................................................ 108
Table 10: Product Support Responsibility ................................................................................ 110 Table 11: Analytic Tools Approach .......................................................................................... 112
Table 12: Product Support Cost Estimation Assumptions, Data Points, and Sources .............. 115

7
Product support, vital to both
acquisition and logistics, has been treated as the stepchild of both
functions. The acquisition community
has neglected it, and the logistics community seems mismatched to
effectively perform its demanding scope.
Executive Summary
Introduction
Weapon system product support operates at the intersection of Defense acquisition and logistics.1
Product support, also referred to as system sustainment, is the package of support functions
required to maintain the readiness and operational capability of weapon systems, subsystems,
software, and support systems. It encompasses materiel management, distribution, technical data
management, maintenance, training, cataloging, configuration management, engineering support,
repair parts management, failure reporting and analysis, and reliability growth. Product support
considerations, germane to both acquisition and logistics, are necessary throughout the DoD life
cycle framework, beginning with early requirements determination and continuing through
system design, development, operational use, retirement, and disposal.
Spurred by perceived and documented shortcomings in the cost-effective procurement and
affordable operation of DoD systems, acquisition and logistics processes have been the recurring
focus of Defense studies, reform efforts, and transformation initiatives. Despite more than 130
studies and commissions on Defense acquisition since World War II, acquisition core problems
persist, according to the Secretary and Deputy
Secretary of Defense. And, despite more than 90
logistics reform, reengineering, modernization,
and similar strategic studies and plans in the past
20 years, no broad consensus has emerged on
DoD logistics transformation. Both areas have
been on the Government Accountability Office
(GAO) High-Risk List for the past 19 years—the
only Defense business areas with this unenviable
track record. Acquisition processes pay too little attention to supportability and consistently trade
down-stream sustainability for required capability or program survival. Some Program Managers
assert that ―logistics is their only discretionary account,‖ making it a frequent target for
inevitable resource reductions. In acquisition decision reviews, sustainment is often relegated to
the back-up charts. Hampered by functionally stove-piped organizational structures and lacking
life cycle management qualifications in their diverse workforce, the logistics community fails to
achieve effectively integrated and affordable Warfighter operational readiness. Instead, it
remains focused on managing commodities, parts, and services.
It is crucial to our national interest that product support achieves a level of performance equal to
its critical importance. This report, inspired by a Warfighter-driven operational perspective,
offers clearly defined, implementable recommendations to drive the next generation of product
support strategies toward that objective, with a clear vision to achieve aligned and synchronized
operational, acquisition, and sustainment communities working together to deliver required
and affordable Warfighter outcomes.
1 The term ―weapon system product support‖ will be used routinely in this report. The authors acknowledge that all
DoD systems are not weapon systems. Many are business, information technology, command and control, and
other types of materiel systems. The scope of this report is applicable to the product support of all such systems.

8
Background
Defense product support is big business, costing at least $132 billion in FY 2008.2 This scope is
not surprising given that in FY 2008, DoD logistics accounted for about $190 billion3 of
Operations and Maintenance and Personnel appropriations and that DoD acquisition spending
was about $165 billion.4 The clamor for more effective and affordable product support faces
many challenges. The exigencies of irregular warfare, harsh theaters of operation, and intense
operational tempos put severe upward pressure on support costs. But despite these challenges,
progress has been made and the opportunity for more progress is available. There has been an
increasing focus on product support over the last ten years, as exhibited in DoD policy and
guidance. Responding to Congressional direction to reengineer product support, DoD completed
a comprehensive review summarized in the 1999 report Product Support for the 21st Century
that became the impetus for many of the strategies applied over the last decade. As a result of
that effort, the DoD strategy for product support is evolving from traditional ―transactional‖
logistics concepts, in which the components of readiness are acquired as discrete unit
transactions, to a stronger emphasis on acquiring the operational readiness outcomes themselves.
The poster child of this latter approach (and by policy, DoD’s preferred sustainment concept) is
called Performance Based Logistics, more commonly referred to by its acronym PBL.
PBL was and is transformative. Jacques Gansler, Under Secretary of Defense for Acquisition,
Technology, and Logistics, from 1997 to 2001 described the context of what needed
transforming at that time:
…to reverse this trend—with current short-term needs consuming an ever-increasing „share
of the pie‟ at the expense of longer-term military capability—will be extremely difficult. I
have called this situation a „death spiral;‟ and, in fact we will come to that…if we do not act
decisively, now. It will require significant cultural change, a sense of urgency, and difficult
program funding decisions. The result may be that we will have to put some sacred cows out
to pasture—not just keep trying to milk them.
Developed in response to the death spiral of decreasing readiness and increasing costs in the
1990s, PBL strategies were an attempt to reverse this trend. Today, there are approximately 200
PBL applications in DoD. The number appears inflated because many platform systems have
multiple PBL subsystem applications, so currently, only about 20 percent of DoD weapon
systems utilize a PBL strategy in whole or part. Despite a relatively slow adoption rate, the
strategy shows signs of institutionalization in the military Services.
PBL has its critics, consequences, and challenges. For example, few argue with PBL’s
performance improvements, but many question its cost effectiveness. Although fully intended as
a product support strategy embracing the best of the public and private sector to produce system
readiness outcomes, PBL has been viewed by many as primarily a ―contracting for logistics‖
strategy. All PBL approaches, like all traditional strategies, rely on a combination of organic and
contractor support. Unlike traditional strategies, PBL has significantly leveraged and
incentivized use of private sector competencies, capabilities, and processes to create the
perception of outsourcing logistics. Other cited shortcomings are a failure to spawn the desired
2 Not counting the procurement and R&D costs associated with product support.
3 See Appendix D for details.
4 FY 2010 DoD Financial Summary Tables, page 1. http://www.defenselink.mil/comptroller/Budget2010.html,
accessed 03 September 2009.

9
While military operations have become
increasingly joint, sustainment processes remain overwhelmingly
Service-centric.
product support competitive base, a failure to establish long-term contractual off-ramps, and
difficulty in displaying auditable financial benefits. Given these consequences and challenges,
critics are quick to urge abandonment or change. Still, there remains a strong consensus that an
outcome-based, performance-oriented product support strategy is a worthy objective, but
currently, these labels are inextricably linked to PBL. In that context, ―what to do about PBL,‖ or
―where to go after PBL,‖ is the major product support strategy debate. That issue, and that view,
is too narrow. There are broader issues confronting product support for the next generation.
The issues that hamper our institutional sustainment processes are systemic. While military
operations have become increasingly joint, sustainment processes remain overwhelmingly
Service-centric. Product support, despite
significant policy and guidance on increased
governance and the need to transition to
performance-based strategies, reflects only
marginal progress on both fronts. Determination of
best value support strategies is based on a Business Case Analysis (BCA) process that has been
consistently criticized by internal and external reports, citing reliance on immature data,
inconsistent application, and overreliance on a one-size-fits-all analytic approach that fails to
acknowledge differences in criteria, such as life cycle phase, level of planned product support,
and availability of credible data. The logistics information technology infrastructure has been
slow to modernize and is challenged to optimize the integration of vertical weapon system
supply chains with traditional horizontal commodity-based supply chain processes. Acquisition
and logistics workforce assessments have reported weaknesses in both communities, citing
shortcomings in competencies and culture needed to translate Warfighter performance
requirements into cost-effective product support spanning the weapon system life cycle.
Despite these endemic structural issues, there are rich opportunities for change. The military,
political, and economic stars are aligned for fundamental reform of product support as part of
acquisition reform, providing a unique window of opportunity in which fundamental reforms are
not only possible, but required. In that context, the Office of the Secretary of Defense (OSD)
Logistics & Materiel Readiness (L&MR) realized this opportunity and established a group of
senior government and industry personnel—the Product Support Assessment Team (PSAT)—to
assess and offer opportunities for improving product life cycle support.5 The PSAT established
ambitious objectives for the review effort:
Identify the current status of product support and implementation across the DoD
enterprise,
Identify areas for improvement to procedures and associated policies, and
Publish a state of product support assessment with recommendations describing a
way forward to develop and implement a next-generation life cycle product
support business model and related enabling strategies.
To accomplish these objectives, the team implemented a three-phase general process
methodology:
5 U.S. Department of Defense, Deputy Under Secretary of Defense for Logistics and Materiel Readiness, Product
Support Assessment Team Memorandum, 05 September 2008.

10
Discovery and Assessment: The team analyzed over 20 major topics, collecting
and examining weapon system data related to the product support environment.
The team focused on the perspectives of strategy, policy, processes, and resources
to qualitatively and quantitatively assess the major topic areas.
Product Build: The team collectively synthesized the key issues, root causes, and
findings, distilling over 100 recommendations down to eight principal
recommendations for improving DoD product support processes.
Implementation Ramp-up: The team identified implementation actions for each
recommendation.
Concurrent with the three review phases, weapon system data was collected and analyzed for 34
programs. This data provided insight into a diverse range of product support strategies associated
with a historical profile of operating and support costs and availability levels of respective
programs. The weapon system analysis provided a quantitative baseline, which, combined with
qualitative data, forms the foundation upon which the resulting recommendations have been
validated in each of the major topic areas.
PSAT guidance was provided by a Senior Steering Group (SSG) that guided the overall PSAT
process and reviewed the emerging findings and recommendations. Members of the SSG
consisted of general/flag-level officers, senior executives, and leaders from the Department of
Defense and industry associations.
Summary of Findings
There were three major categories of analyses conducted during this study:
1. Maturity assessments of product support processes and identification of major issue
areas
2. Root-cause analysis of major product support issue areas
3. Insight and supporting information from the weapon system data analysis
As highlighted in Table 1 and below, the summary of findings is as follows:
The maturity assessments reflected consistent weaknesses in virtually all key product support
processes. None of the areas studied achieved a maturity rating above average. The most mature
process areas were customer-facing metrics and performance outcomes, while the weakest areas
were business case analysis process and cross-Service alignment.

11
Table 1: Summary of Study Findings
The team conducted root-cause analysis on major product support issue areas and found
consistent themes throughout. Specifically, product support suffers largely from continued
reliance on transactional based systems and processes, inadequate human capital, need for smart
managers and smart buyers, organizational challenges, and a lack of shared goals.
While there are a range of indicators resulting from the maturity assessments and root-cause
analysis, the weapon system data analysis clearly shows that performance-based (outcome-
based) product support strategies, particularly when coupled with government-industry
partnering approaches, have consistently delivered improved materiel readiness across numerous
weapon system applications over the past decade. Cost benefits are more difficult to assess; as
cited in several GAO reports, many outcome-based support strategies have claimed cost
reductions and cost avoidance, but DoD financial systems lack the visibility and fidelity to
validate these benefits consistent with audit standards. In summary, performance-based product
support strategies consistently deliver improved materiel readiness, but assessing the true cost of
both traditional (transactional) and performance-based strategies is difficult, if not impossible,
given current financial systems.
Recommendations
Eight principal recommendations resulted from the collection and analysis of the study data.
Figure 1 summarizes the eight recommendation areas, reflecting the symbiotic relationship
among the recommendation categories. Within the pyramid model, the top two bands are
recommendations that reflect strategic priority initiatives; the third band reflects the critical
governance processes necessary to provide product support accountability across the life cycle;
Maturity Assessments
of Product Support Processes
Maturity assessments reflected consistent weaknesses in virtually all key product
support processes
None of the areas studied achieved a maturity rating above average
The most mature process areas were customer-facing metrics and
performance outcomes
The weakest areas were business case analysis process and cross-service
alignment
Root-Cause Analysis
of Major Product Support Issue Areas
Continued reliance on transactional based systems and processes
Inadequate human capital
Need for smart managers and smart buyers
Organizational challenges
Lack of shared goals
Weapon System Data
Analysis
Performance-based (outcome-based) product support strategies, particularly when
coupled with government-industry partnering approaches, have consistently
delivered improved materiel readiness across numerous weapon system
applications over the past decade
Cost benefits are more difficult to assess; as cited in several GAO reports, many
outcome-based support strategies have claimed cost reductions and cost
avoidance, but DoD financial systems lack the visibility and fidelity to validate these
benefits consistent with audit standards

12
and the pyramid base reflects the aspects, which enable the recommendations necessary to
implement the higher-level reforms.
Figure 1: PSAT Recommendation Areas
Product Support Business Model: The PSAT recommends adoption of a new model that
capitalizes on an integrated defense industrial base and performance outcomes to enable cost
effective capability across the weapon system life cycle. The business model, described in the
full report, provides a clearly defined framework that will facilitate the continuous identification
of the appropriate product support strategy consistent with the objective of the system over its
life cycle. The model is supported with a decision matrix using two fundamental axes:
1. Application Strategy: system, subsystem, or component level
2. Product Support Integration: industry, organic, or integrated partnership6
Industrial Integration Strategy: Study data clearly showed tangible benefits from government-
industry partnering. In conjunction with assessing programs utilizing partnerships, the team
compiled a framework outlining the characteristics of good partnerships. This recommendation
emphasizes the need for continued evolution of public-private partnering strategies beyond the
current depot maintenance focus into other support functions. This will facilitate more effective
industrial integration that will provide broad-ranging product support capabilities, leveraging the
talents, expertise, and infrastructure of both the commercial and organic industrial base.
Supply Chain Operational Strategy: Given the critical relationship of maintenance and supply
in the DoD composite supply chain, the team recognized the critical need to connect platform
product support strategies to the enterprise supply chain approaches that produce the best value
across the DoD Components. DoD supply chains, focused largely on commodity management
practices, must extend into both system-level and enterprise-level strategies, enabling and
leveraging the consolidated benefits of a cross-enterprise, joint management approach.
6 Unless defined as a Public-Private Partnership, ―partnership‖ means Performance Based Partnership (PBP) where
there is a defined formal performance expectation between at least two organizations, where one partner performs
any relevant product support function that complements the functions performed by the other partners.
Product Support
Business Model
Industrial Integration
Strategy
Supply Chain Operational
Strategy
Governance
Metrics O&S CostsAnalytical
ToolsHuman Capital

13
Governance: Despite increased rhetoric emphasizing the importance of product support, no
compelling or cohesive life cycle governance framework that includes formal consideration of
product support has been defined, much less implemented. There is little attention to, incenting
of, or penalties for not achieving effective sustainment objectives over the life cycle. Systemic
governance of product support must be institutionalized via policy, guidance, and review
activities that strengthen, develop, and enforce organization and management sustainment
processes.
Metrics: Performance-based (outcome-based) product support strategies will continue to be
emphasized and implemented in both industry and organic sustainment approaches. As such, the
establishment of more comprehensive guidance regarding the selection and application of
metrics to assess, incent, and monitor product support over the life cycle is critical to both
effective governance and management of sustainment strategies.
Operating and Support Costs: The lack of an affordability requirement and adequate visibility
of operating and support costs has been a long-standing barrier to effectively assessing,
managing, and validating the benefits or shortcomings of product support strategies. The report
defines specific initiatives necessary to make the much needed, fundamental improvements in
financial visibility and accountability.
Analytical Tools: The use of the BCA process to make life cycle product support decisions,
mandated by policy since 2004, has been plagued with problems of inaccuracy, inconsistent
application across the Services and weapon systems, and a general failure to achieve the purpose
for which it was intended. For BCAs to improve in effectiveness as a decision-making tool, it is
necessary to address, clarify, and codify the larger group of ―analytical tools‖ by which the
analysis should be conducted. The report provides a specific plan of action to achieve this
objective.
Human Capital: Both the DoD acquisition and logistics workforces face significant challenges
in attaining the professionalism and knowledge base to serve as smart buyers and managers of
integrated life cycle product support. DoD must set clear objectives to integrate product support
competencies across the acquisition and logistics workforce domains to institutionalize the
successful traits of an outcome-based culture. Further, industry product support personnel, along
with their government colleagues, must be more seamlessly equipped to acquire requisite
product support competencies and proficiencies.
Implementation Actions
Implementation of the proposed recommendations can be facilitated by empowering three
integrated product teams (IPTs) to move forward with precise agendas:
IPT #1: Product Support Business Model. This strategically focused team is
responsible for developing and institutionalizing the product support business
model. This is accomplished by pursuing initiatives to align and expand
government/industry partnerships and connect weapon system product support
strategies to outcome-based approaches utilizing enterprise-focused supply chain
management practices.
IPT #2: Governance. This team is responsible for developing and
institutionalizing improved governance of product support across the life cycle,

14
including sustainment metrics and governance activities, such as milestones,
reviews, and other product support assessment actions.
IPT #3: Human Capital. This team is responsible for defining and shaping the
professional workforce necessary to execute the new product support
environment, which clearly requires a more skill-matched, flexible,
knowledgeable, and professionally trained human capital component.
Management oversight for these three teams should be provided by reorganizing the PSAT
Senior Steering Group into a standing Product Support Executive Council (PSEC). This
executive group’s efforts should be aligned with other related senior-level groups, such as the
Maintenance Executive Steering Committee, the Joint Logistics Board, the Weapon Systems
Lifecycle Management Group, and the DoD Logistics Human Capital Executive Steering Group.
Conclusion
Transforming product support will require not only strong leadership in the Department of
Defense, but also an open-minded, reform-driven DoD-Congressional partnership and a
collaborative DoD-Industry relationship to realize the report objectives. The national security
and economic environments dictate tough-minded acquisition reform and logistics
transformation. The challenges of affordability constraints, the need to upgrade equipment and
infrastructure, and a continuing, persistent operations tempo prescribe a clear need for DoD
implementation of an integrated plan to address product support across the Defense enterprise.
Successful change in weapon system product support will be demonstrable by reducing costs
while maintaining equal or greater equipment readiness support for key warfighting capabilities.
As DoD moves forward with acquisition reform and improved life cycle management practices,
product support improvement is a key enabler of these critical implementation efforts. The
recommendations included in this report will yield a higher level of effectiveness in overall
acquisition and logistics processes, and in turn, significantly improve the sustained capability and
affordability of our weapons systems.
Organization of This Report
This report describes the PSAT’s analytical methodology, recommendations, and necessary
implementation actions for achieving long-term logistics and product support transformation
consistent with the objectives and initiatives of Acquisition Reform, the Department’s 2009
Quadrennial Defense Review (QDR) and other strategic change processes.
Chapter 1 of this report defines the product support challenge from past to present. Chapter 2
describes the PSAT methodology. Chapter 3 outlines the product support business model that
provides a structure to enable and facilitate more effective performance-based relationships.
Expanding on two elements of the model, Chapter 4 discusses recommendations and key tasks
related to public-private partnerships and the supply chain operational strategy.
Recommendations related to product support governance, metrics, O&S costs, analytical tools,
and human capital are core to Chapter 5. Chapter 6 defines the management tools and actions
necessary to achieve implementation of the recommendations found in Chapters 3 through 5.
Finally, Chapter 7 closes the report by establishing leadership accountability and defining the
critical paths for realizing PSAT success.

15
Chapter 1: The Product Support Challenge
Background
Product support, also referred to as system sustainment, is the package of support functions
required to maintain the readiness and operational capability of weapon systems, subsystems,
software, and support systems. It encompasses materiel management, distribution, technical data
management, maintenance, training, cataloging, configuration management, engineering support,
repair parts management, failure reporting and analysis, and reliability growth. The source of
product support may be organic or commercial, but its primary focus is to optimize customer
support and achieve maximum weapon system availability at the lowest total ownership cost.
Product Support is the primary means by which Warfighter-driven materiel readiness
expectations are accomplished over the weapon system life cycle.
Product support is an essential competency in DoD’s portfolio of military capabilities, drawing
on organic (government-owned) and commercial industry labor, facilities, and assets. Product
support decisions involve integrating various capabilities and options to optimize Warfighter
support and weapon system availability within affordability constraints. Ultimately, product
support is anchored in the needs of the Warfighter in that it must consistently deliver those
capabilities required at the ―tip of the spear.‖
The concepts behind today’s product support date back more than a decade to FY 1998 Section
912(c) of the National Defense Authorization Act and the July 1999 Product Support for the 21st
Century: Report of the Department of Defense Product Support Reengineering Implementation
Team, which responded to the Section 912(c) Congressional requirement.
The 1999 report focused on DoD’s ability to realize four key ―focus areas.‖ These were:
1. Reengineering product support processes to best commercial practices
2. Competitively sourcing product support
3. Modernizing through spares
4. Expanding prime vendor and virtual prime vendor
Measures of success toward enabling and implementing these focus areas were determined by
the factors in Table 2.

16
Table 2: 1999 Factors for Improved Product Support
In 2000, DoD delivered a status report on product support reform. The initial progress report
documented some successes, providing promise of continuing improvements in product support
reform. However, the events of September 11, 2001, changed the focus of the Department almost
overnight—the impetus of product support transformation was transcended by the compelling
need to support the Warfighter in two remote and austere environments. Affordable
supportability became less of a priority as Warfighter-readiness needs became paramount.
Yet, in spite of prolonged Warfighter involvement in contingency actions over the past decade,
key product support initiatives were still implemented. Foremost among these was DoD’s
adoption of Performance Based Logistics (PBL), an outcome-based approach, as its preferred
sustainment strategy. This approach linked sustainment objectives and resources to system
performance, not repair and supply activities; goals and incentives became structured around
system performance, not failure; and risk was shifted to the support provider. PBL became the
Department’s preferred sustainment strategy because it delivered higher equipment readiness
levels, applied best commercial practices, provided inherent product support integration, and
provided a common strategy to bridge the acquisition and sustainment communities. Public-
Private Partnerships, in which DoD Depot Maintenance activities established formal cooperative
agreements with defense contractors, became the norm in many system support strategies. DoD
maintenance depots benefitted from a natural association between PBL and public-private
partnering; these partnerships enabled the best use of both public and private sector
competencies, while preserving the vital organic industrial base.
DoD also initiated policies to facilitate life cycle product support management and to raise
awareness of the need to bridge acquisition and sustainment communities. Foremost among these
was the assignment of the Total Life Cycle Systems Management (TLCSM) role to the DoD
Program Manager, making them accountable not only for acquisition of DoD systems, but also
planning, implementing, and managing sustainment of the system throughout its life cycle. Other
changes in Acquisition and Requirements policy enabled increased focus on a ―life cycle‖
perspective, codifying the ―concept to disposal‖ integration of weapon system acquisition,
sustainment planning, and oversight. In the process, DoD began to transform how it develops
and supports its weapon systems.
Success Indicators
Integrated logistics chains focused on customer service
Customer relationships based on output
Logistics chains integrated across industry and government
Best-valueproviders selected from government, industry, or partnerships
Support environment that maintains long-term competitive pressures
Secure, integrated info system across industry and government, enabling supply chain
integration and full asset visibility
Continuous improvement of weapon systems RM&S-dedicated investments
Effective integration of weapon system-focused support to provide total combat logistics

17
The Military Departments displayed examples of excellence in product support reform. Since
2005, the Secretary of Defense has recognized 18 programs across all Services for excellence in
outcome-based product support approaches. There are over 200 examples of performance-based
initiatives, with notable examples of success at the component, subsystem, and system levels.
The Services have each developed a broad set of Service-specific initiatives and policies based
on enterprise-wide product support goals; a sample set is outlined below.
Figure 2: Significant Service Policy Initiatives in Support of
Performance-Based Approaches
Product Support Today
Ten years later, the need for reform still exists and the effectiveness of product support is an
enduring challenge within DoD. Despite the documented success of many programs, there
remain significant obstacles to effective implementation of performance-based, outcome-based
strategies, especially when viewed against the 1999 product support reform goals.
Notwithstanding the success of performance-
based support, 80 percent of DoD product support
remains largely transaction-driven. Supply chains
are still functionally-driven and maintenance is
not fully integrated with the end-to-end supply
chain. Supply chain visibility for developed
software that is being incorporated into critical DoD systems is particularly troublesome. In spite
of ongoing initiatives and progress, the critical need for comprehensive end-to-end total asset
visibility has still not been achieved. DoD has emphasized joint requirements and joint strategies,
Air Force
Integrated Life Cycle
Management (ILCM) Policy
ILCM Executive Forum
(ILCM-EF)
ILCM Product Support Strategy
PBL Best Tenets
Contractor Logistics Support
(CLS) Next Generation
Air Force Global Logistics
Support Center (AFGLSC)
Aircraf t Availability and
Improvement Program (AAIP)
Asset Marking and
Tracking (AMT)
Expeditionary Combat Support
System (ECSS)
Repair Network Integration (RNI)
Product Lifecycle
Management (PLM)
Army
AR 700-127 PBL Policy
Automated PBL Reporting Tool
PBL IPT
BCA Policy
BCA Module in the Systems
Planning and Requirements
System (SYSPARS)
Sustainment Readiness Review
(SRR) Policy
Reliability Measures
Materiel Release Policy
Weapon System Reviews
Navy
PBL Guidance Document
SECNAVINST 5000.2C
Guidebook for Developing
PBL BCAs
ASN (RD&A) Memo for the DoN
Guide for Developing PBL BCAs
SECNAVINST 4105.1 ILA and
Certif ication Requirements Process
and Handbook
RAM Policy/RAM Incorporated into
Acquisition Governance Process
―Operational Availability (Ao)
as a Key Performance
Parameter‖ Memo
Product support has been afflicted by
uneven implementation messages and a lack of a consistent, senior
leadership-endorsed strategy.

18
yet few joint sustainment strategies exist. In spite of intense Human Capital improvement efforts,
segments of the DoD workforce still make claims of insufficient product support integration
knowledge and skills. While the current product support process generally meets military Service
readiness standards, it does so while continuing to harbor inherent inefficiencies and higher-than-
necessary costs.
More work also needs to be done to foster competition across the Defense industrial base. DoD
5000-series policy emphasizes the power of competition, yet opportunities remain to promote
competitive pressures throughout the life cycle. Title 10 requirements hinder the ability to
allocate workloads based on best capability and best value. In spite of several efforts, there
remains a need to reengineer financial processes to accommodate and enable performance-based
sustainment strategies—a major challenge for Program Managers (PMs) charged with
responsibility and accountability for life cycle product support.
For the past ten years, life cycle management has been the strategic product support framework
while PBL has been the tactical approach. In the face of a challenging national security threat,
PBL provided greatly improved material readiness. While many PBL applications have been
implemented over the last decade, most do not meet the key characteristics of a mature PBL or
only cover a very small portion of the weapon system; having greater availability on tires or an
auxiliary power unit can positively affect Warfighter capability, but that effect may be limited if
other subsystems (e.g., avionics or engines) are not similarly availability-driven. The pressure to
increase Service numbers of PBL programs has prompted misclassification of product support
strategies—traditional transactional contracts with a minor performance incentive clause have
been incorrectly labeled as ―PBL,‖ resulting in not only inaccurate counts of PBL programs but
creating confusion regarding what is, and what is not, a PBL strategy. With this PSAT effort,
DoD is committed to gleaning the lessons learned from the past decade with a richer
understanding of successful business models for product support. It is now time to examine the
lessons of PBL and formulate a path ahead culling the best practices of the outcome-based
approach to drive down costs while retaining high material readiness.
Independent Report Findings and Implications
Independent agencies echo the need for continued product support reform. Acquisition and
sustainment processes, areas both spanned by product support, are the subject of continuing
scrutiny from outside the Department. In 2003, GAO criticism focused on the requirements
development process itself and recommended an outcome-driven life cycle approach.7 Over the
past several years, the GAO has released two reviews of the implementation of PBL,
highlighting a set of implementation gaps that must be addressed.8 The findings of both reports
note the need for more robust and ongoing analysis of outcome-based product support results.
The Defense Business Board (DBB) has also taken an interest in product support and, in January
2009, echoed some of the 1999 recommendations. The DBB suggested a key priority should be
7 Report to the Subcommittee on Readiness and Management Support, Committee on Armed Services, U.S. Senate
Best Practices: Setting Requirements Differently Could Reduce Weapon Systems’ Total Ownership Costs, GAO-
03-57, February 2003. 8 ―Defense Management: DOD Needs to Demonstrate That Performace Based Logistics Contracts Are Achieving
Expected Benefits,‖ GAO-05-966, September 2005, and ―Defense Logistics: Improved Analysis and Cost Data
Needed to Evaluate the Cost-effectiveness of Performace Based Logistics,‖ GAO-09-41, December 2008.

19
to align the manufacturing and service suppliers with the Department to optimally meet the
Department’s mission requirements.9
There have also been significant analyses commissioned by
the Services, looking at various aspects of PBL. For example, the Center for Naval Analysis
pointed out the need for more PBL contracts to be competitively awarded.10
In 2008, the USAF,
in partnership with the University of Tennessee, completed a review of the current status of PBL
implementation across a broad cross section of programs. While some best practice
implementations of PBL were seen, and in spite of PBL policy set forth in Air Force Instruction
63-101, in general, the USAF implementations of PBL were deemed inconsistent in scope,
impact, and application of best practice.
These are sobering critiques, but they do not challenge the underlying logic or success of
performance-based, outcome-driven strategies. Instead, they collectively challenge whether the
implementation of the strategy is as effective as it should be. They do not support abandonment
of the approach; rather, they identify opportunities to deliver even more powerful results.
Supporting Data Analysis
Previous product support reform efforts have been conspicuous in the absence of supporting data
analysis. The PSAT team considered it critical to not only put forward solid recommendations to
improve the DoD sustainment environment, but that those recommendations are solidly
supported by comprehensive data analysis. Thirty-four (34) separate DoD systems were included
in this analysis (see Appendix A for a full discussion of the results). The results were consistent:
outcome-based, partnership-oriented strategies consistently provided greater readiness at more
affordable cost than traditional, transactional support strategies. The data provides the basis for
tangible conclusions and recommendations, versus the subjective proposals offered by many
previous studies.
The Case for Change
As we progress into the 21st century, DoD faces the dual challenges of a persistent expeditionary
military presence and a period of enduring conflict. Success in this context is measured by
DoD’s ability to sustain forces and maintain equipment, while concurrently preserving its ability
to display flexibility in meeting the evolving and changing operational conditions of irregular
warfare and stateless actors.
Furthermore, the global economic environment and internal competing domestic requirements
for scarce resources create an imperative for DoD to do more with less. The reality is that
supplemental expenditures will not continue at their current levels indefinitely and, as they
diminish, system sustainment will again be a target for obtaining needed cost reductions. If not
addressed with well-planned reform initiatives, product support costs can cripple DoD’s budget.
There will be continued pressure on DoD to reform and to deliver cost-effective product support
while accommodating rapid and agile acquisition.
9 ―Focusing a Transition: Key Priorities for the Senior Leadership,‖ January 2009.
10 Cost and Performance Characteristics of Navy Performace Based Logistics (PBL) Contracts. Ronald H. Nickel,
Glenn Ackerman, Brent Boning, Tom DePalma, Craig Goodwyn, and Rebecca Kirk, Center for Naval Analysis,
12 November 2008.
20
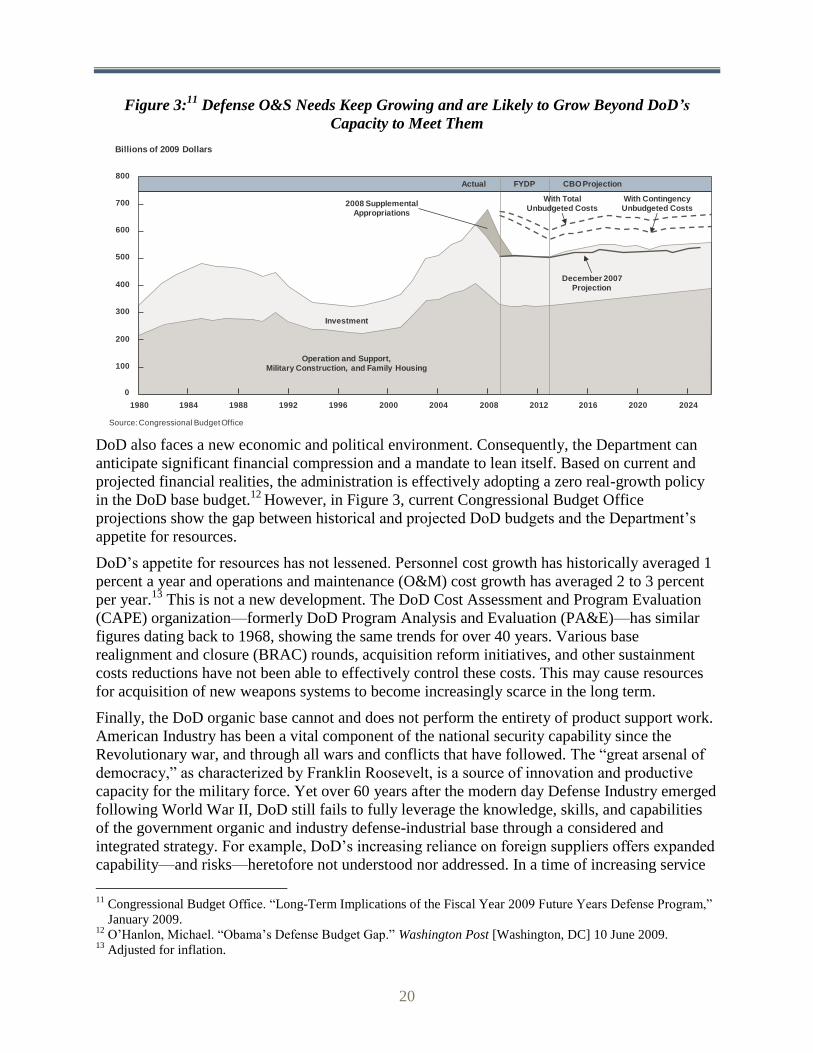
Figure 3:11
Defense O&S Needs Keep Growing and are Likely to Grow Beyond DoD’s
Capacity to Meet Them
DoD also faces a new economic and political environment. Consequently, the Department can
anticipate significant financial compression and a mandate to lean itself. Based on current and
projected financial realities, the administration is effectively adopting a zero real-growth policy
in the DoD base budget.12
However, in Figure 3, current Congressional Budget Office
projections show the gap between historical and projected DoD budgets and the Department’s
appetite for resources.
DoD’s appetite for resources has not lessened. Personnel cost growth has historically averaged 1
percent a year and operations and maintenance (O&M) cost growth has averaged 2 to 3 percent
per year.13
This is not a new development. The DoD Cost Assessment and Program Evaluation
(CAPE) organization—formerly DoD Program Analysis and Evaluation (PA&E)—has similar
figures dating back to 1968, showing the same trends for over 40 years. Various base
realignment and closure (BRAC) rounds, acquisition reform initiatives, and other sustainment
costs reductions have not been able to effectively control these costs. This may cause resources
for acquisition of new weapons systems to become increasingly scarce in the long term.
Finally, the DoD organic base cannot and does not perform the entirety of product support work.
American Industry has been a vital component of the national security capability since the
Revolutionary war, and through all wars and conflicts that have followed. The ―great arsenal of
democracy,‖ as characterized by Franklin Roosevelt, is a source of innovation and productive
capacity for the military force. Yet over 60 years after the modern day Defense Industry emerged
following World War II, DoD still fails to fully leverage the knowledge, skills, and capabilities
of the government organic and industry defense-industrial base through a considered and
integrated strategy. For example, DoD’s increasing reliance on foreign suppliers offers expanded
capability—and risks—heretofore not understood nor addressed. In a time of increasing service
11
Congressional Budget Office. ―Long-Term Implications of the Fiscal Year 2009 Future Years Defense Program,‖
January 2009. 12
O’Hanlon, Michael. ―Obama’s Defense Budget Gap.‖ Washington Post [Washington, DC] 10 June 2009. 13
Adjusted for inflation.
800
700
600
500
400
300
200
100
0
19841980 1988 1992 1996 2000 2004 2008 2012 2016 2020 2024
Operation and Support,Military Construction, and Family Housing
Investment
December 2007Projection
2008 SupplementalAppropriations
Actual FYDP CBO Projection
With TotalUnbudgeted Costs
With ContingencyUnbudgeted Costs
Billions of 2009 Dollars
Source: Congressional Budget Office

21
life for deployed weapon systems, spiraling cost estimates for scheduled acquisitions, there is a
clear need for innovation to provide more accurate life cycle planning, more affordable product
support, and more effective delivery of readiness to the Warfighter. Outcome-based and
integrated partnering strategies provide the opportunity to effectively optimize existing military
assets, retire excess assets, and provide much needed relief from continuing budgetary pressure.
Conclusion
The national security and economic environments dictate tough-minded acquisition reform and
logistics transformation. The challenges of affordability constraints, the need to reset equipment
and infrastructure, and a continuing, persistent operations tempo prescribe a clear need for DoD
implementation of an integrated plan to address product support across the Defense enterprise.
Successful change in weapon system product support will be measured by a reduction in costs
while maintaining equal or greater equipment readiness supporting required warfighting
capabilities. As DoD moves forward with acquisition reform and improved life cycle
management practices, product support improvement is at the nexus of these critical efforts.
The recommendations included in this report promote the implementation actions necessary to
significantly improve product support capabilities and affordability.

22
Chapter 2: Management and Analytical Approach
Purpose and Membership
In September 2008, a DoD Product Support Assessment Team (PSAT) was formed to analyze
DoD product support enterprise activities, performance, and cost and to outline actions to
improve life cycle product support management.14
The team was also tasked to assess overall
and program-specific progress in capturing, managing, and improving weapon system support
costs while maintaining necessary readiness levels and mitigating sustainment risk.
The PSAT’s first-year goal was to produce an informative and actionable report for OSD, the
Military Services, Defense Agencies, and Congress. Specifically, the report would document:
Current state of product support across the DoD enterprise
Specific product support-related topical and weapon system analysis
Areas within product support that need improvement
Recommended actions, integrators, and enablers necessary to improve the
selected areas
The next generation of life cycle product support in a model that integrates and
enables improvements
Findings, recommendations, and an initial implementation plan
In designing the PSAT structure, great care was taken to recognize the benefits of diversity and
wide representation. PSAT Working Group (WG) members consisted of representatives from
government, industry, and academia as illustrated below.
Figure 4: Working Group Representative Organizations
14
U.S. Department of Defense, Deputy Under Secretary of Defense for Logistics and Materiel Readiness, Product
Support Assessment Team Memorandum, 05 September 2008.
Se
rvic
es
Army
USA (AMC)
USA (ASA ALT)
USA (DCS G-4)
USA PM (FCS)
Air Force
USAF (A4LX)
USAF (AFMC)
USAF (SAF/AQXA)
USAF (SAF/IEL)
Marine Corps USMC (I&L)
Navy
USN (ASNRDA,
DASNALM)
USN (N4)
Ac
ad
em
ia
DAU
Auburn
University
University of
Tennessee
Cro
ss
-Do
D
DLADLA (DSCR)
DLA (J-31/-74)
Joint StaffJS (J4)
JS (J8)
OSD
OSD (ATL)
• L&MR
• DPAP
• PSA
• S&SE
• ARA
OSD (PA&E)
OSD (COMPT)
Ind
us
try
AIA &
NDIA
Lockheed Martin
Raytheon
General Dynamics
SAIC
Sikorsky
Honeywell
Boeing
Northrop Grumman
BAE Systems
Institute of Defense
and Business
OSD
L&MR Consultants
SC Visions
PRTM Management
Consultants
23
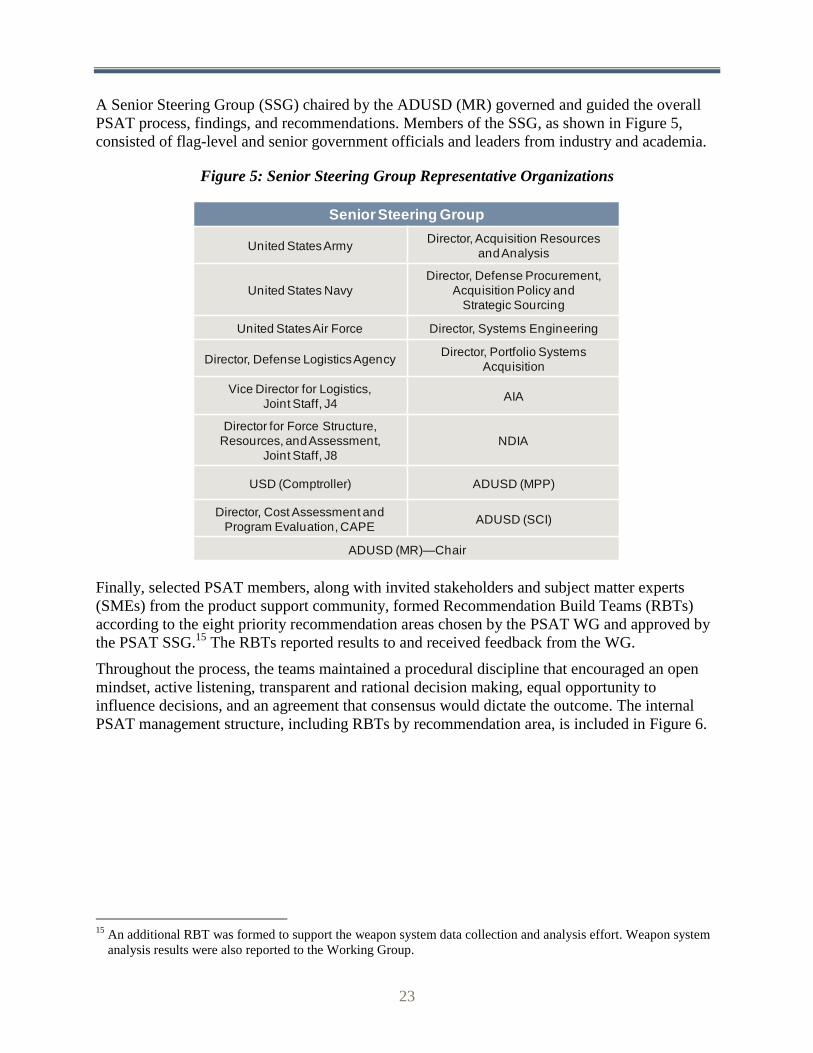
A Senior Steering Group (SSG) chaired by the ADUSD (MR) governed and guided the overall
PSAT process, findings, and recommendations. Members of the SSG, as shown in Figure 5,
consisted of flag-level and senior government officials and leaders from industry and academia.
Figure 5: Senior Steering Group Representative Organizations
Finally, selected PSAT members, along with invited stakeholders and subject matter experts
(SMEs) from the product support community, formed Recommendation Build Teams (RBTs)
according to the eight priority recommendation areas chosen by the PSAT WG and approved by
the PSAT SSG.15
The RBTs reported results to and received feedback from the WG.
Throughout the process, the teams maintained a procedural discipline that encouraged an open
mindset, active listening, transparent and rational decision making, equal opportunity to
influence decisions, and an agreement that consensus would dictate the outcome. The internal
PSAT management structure, including RBTs by recommendation area, is included in Figure 6.
15
An additional RBT was formed to support the weapon system data collection and analysis effort. Weapon system
analysis results were also reported to the Working Group.
Senior Steering Group
United States ArmyDirector, Acquisition Resources
and Analysis
United States Navy
Director, Defense Procurement,
Acquisition Policy and
Strategic Sourcing
United States Air Force Director, Systems Engineering
Director, Defense Logistics AgencyDirector, Portfolio Systems
Acquisition
Vice Director for Logistics,
Joint Staff, J4AIA
Director for Force Structure,
Resources, and Assessment,
Joint Staff, J8
NDIA
USD (Comptroller) ADUSD (MPP)
Director, Cost Assessment and
Program Evaluation, CAPEADUSD (SCI)
ADUSD (MR)—Chair

24
Figure 6: Product Support Assessment Team Structure
Approach and Methodology
The PSAT effort was divided into three separate phases: Discovery and Assessment, Product
Build, and Implementation Ramp-up. The timeline, primary activities, and key milestones are
highlighted in Figure 7 and discussed below.
Figure 7: PSAT Project Plan with Key Activities and Milestones
Industrial Integration
Strategy
Product Support Business
Model
O&S Costs
Supply Chain Operational
Strategy
Governance
Weapon System Data
Metrics
Human Capital
Analytical ToolsWorking Group
Senior Steering Group
Oct 08 Nov Dec Jan 09 Feb Mar Apr May Jun Jul Aug Sept Oct 09
Discovery and Assessment Product BuildImplementation
Ramp-up
Product Support Assessment Team (PSAT) Working Group and Recommendation Build Teams
Assess overall progress and
emerging requirements
Facilitated Working Group
discussions of as-is environment
20 topical examinations (strategy,
policy, process, resource)
Fact-based weapon system
program analysis
Develop the recommendations and
implementation roadmap for PSBM
Facilitated Working Group and Recommendation
Build Team (RBT) discussions of to-be
environment
Develop Product Support Business Model
Draf t assessment report
Finalize implementation actions
Finalize written report
Facilitate buy-in through executive
and new administration out-briefs
Form Integrated Product Teams
(IPTs)
Working Group (WG) Meetings
Senior Steering Group (SSG) Meetings
Recommendation Build Teams (RBTs)
Interim Assessment and Initial Insights
Initial Product Support Recommendations
Final Recommendations and Implementation Actions

25
Discovery and Assessment
The key focus for the four-month Discovery and Assessment phase was to first conduct an ―as-
is‖ assessment of the current product support environment, and then create a vision and guiding
principles for product support going forward.
To conduct an ―as-is‖ assessment, the larger PSAT WG examined approximately 20 product
support topics, which were eventually grouped and investigated under eight broader topics:
Milestone Reviews, End-to-End Alignment, Cross-Service Alignment, Customer-Facing Metrics
and Performance Outcomes, Internally-Facing Metrics and Performance Outcomes, Business
Case Analyses, Legislative Environment, and Partnering Strategy.
The methodology used to examine these topics was to approach them from four different
investigative perspectives:
1. Policy: Is policy adequate to successfully drive desired behavior for total life cycle
product support?
2. Strategy: Is there a useful, consistent, understandable, and executable strategy for life
cycle product support?
3. Processes: Are processes sufficient and aligned to enable accurate, consistent life
cycle product support?
4. Resources: Are resources (people, skills, funding, data, IT tools, training) adequate
and appropriate to conduct and support effective life cycle product support?
The larger WG of 45 members broke into four sub-teams and deconstructed each topic in these
ways, deriving both a qualitative and a quantitative current-state assessment of the eight topics.16
Results from this assessment validated Resources17
as the area with the most significant gaps in
terms of its ability to meet life cycle product support requirements at current maturity. There was
a consensus among PSAT members that current product support strategies have not always been
effectively or resourced. For example, it is difficult to quantify the effectiveness of financial
resources because their measure is based on a lack of consistent, useable data. Lack of consistent,
useable data is further caused by a failure to acquire data, inconsistent reporting, and a lack of
data documentation requirements.
Understanding the current state of product support provided the baseline for PSAT members to
establish the Vision and Guiding Principles for product support going forward. These are
illustrated in Figure 8.
16
The teams also conducted a quick look of what product support gains could be achieved on a particular topic in
five years. The purpose of this ―to-be‖ exercise was to understand where product support could capture realistic
and quick wins in the near future. 17
Where Resources are ―people, skills, funding, data, IT tools, and training.‖

26
Figure 8: The Life Cycle Product Support Vision and Guiding Principles
The PSAT WG developed a future product support vision that emphasizes aligned and
synchronized operational, acquisition, and sustainment communities working together to deliver
required and affordable Warfighter outcomes. Guiding principles collectively channel the next
generation of product support actions into a cohesive action plan to support the vision. This
vision and set of guiding principles is supported by a set of implementation guidelines for
cohesive and coordinated action.
During the Discovery and Assessment phase and concurrent with analysis performed by the WG,
PSAT analysts conducted a weapon system data assessment effort to gain a better understanding
of (1) which product support strategies lead to improved readiness and (2) which practices better
support the Warfighter in terms of materiel availability per sustainment dollar spent. The
Services provided data and analytical insight for 34 weapon systems.18
Product Build
During the five-month Product Build phase, the WG evolved in purpose and structure from an
―assessment‖ body into a ―recommendation‖ body. To accomplish this role, the restructured WG
assessed the gaps documented in the Discovery and Assessment phase and developed
recommendations to close those gaps.
Initially, the WG identified over 100 recommendations for improving life cycle product support.
The SSG, after reviewing the initial recommendations, directed the WG to develop a smaller
number of focused, overarching recommendations. In response, the WG identified eight priority
18
The weapon systems assessment and outcomes are described in detail in Appendix A.
Implementation Guidelines
Ruthlessly separate needs
from appetites
Understand portfolio of
alternatives
Tie metrics directly to
Warfighter outcomes
Implementation Guidelines
Govern sustainment as
part of the life cycle
Design for sustainability,
and integrate acquire-to-
retire processes
Manage predictable costs
throughout the life cycle
Integrate human capital
planning into life cycle
focus
Implementation Guidelines
Exhaust opportunities for
joint economy and reduce
unnecessary redundancy
Build the capability to
make good enterprise
decisions
Enforce consistency in
product support processes
and infrastructure
Implementation Guidelines
Optimize public and
private product support
capabilities
Leverage core
competencies
Partnerships are effective,
equitable, transparent,
bilateral, and long term Implementation Guidelines
Manage with facts and drive accountability
for performance and costs
Build and evolve BCAs that enhance
decision making
Incentivize Accountability
for Performance
Aligned and
synchronized
operational, acquisition,
and sustainment
communities working
together to deliver
required and affordable
Warfighter outcomes
27
recommendation areas that would undergo further analysis to determine root cause problems and
develop tangible actions to resolve issues and achieve the transformation objectives. These areas
were:
Product Support Business Model
Industrial Integration Strategy
Supply Chain Operational Strategy
Governance
Metrics
O&S Costs
Analytical Tools
Human Capital Strategy
To facilitate deep-dive analysis on these recommendation areas, selected PSAT members and
product support SMEs formed four- to eight-person Recommendation Build Teams (RBTs). A
weapon systems performance and cost data RBT was also established to formally elicit Service
and stakeholder participation in providing weapon system data and in interpreting analytical
findings.19
The recommendations outlined in this report were derived from the RBTs’ root-cause analysis,
which consisted of an end-to-end assessment of the top-eight priority recommendation areas. The
root-cause analysis is summarized below.
Root-Cause Analysis
Continued Reliance on Transactional Systems and Processes
Many of the existing systems and processes have been designed for transactional logistics.
Current systems and processes do not provide the necessary data and functionality to measure
and manage outcome-based sustainment. As a result, DoD lacks the capability to accurately
assess the cost and cost benefits of various product support strategies. Furthermore, DoD has
difficulty confirming cost benefits to the satisfaction of independent overseers.
Inadequate Human Capital
Government human capital resources have been slow to develop the knowledge and skills
necessary to plan, implement, integrate, and manage complex outcome-based product support
strategies. While there are examples of very good progress in this area, DoD lacks an adequate
across-the-board foundation of qualified sustainment managers equal to the product support
challenge. Industry, benefitting from its commercial sector experience, has exhibited better
capabilities in this regard. Also, over the last two decades, the Department has outsourced some
product support functions, supply chain management, technical data management, configuration
management, and sustaining engineering. Where high levels of product support expertise do
19
Each of the eight priority areas is discussed in detail in Chapters 3 and 4, and the weapon system analysis is
discussed in Appendix A.

28
exist, it is often functionally-focused, which matches the organizational culture of many Defense
logistics organizations.
Need for Smart Managers and Smart Buyers
There is a need for better-informed customers that
can perform as either efficient managers of product
support or as ―smart buyers‖ of product support
services, thus encouraging more responsive and
responsible suppliers.
In addition, Warfighters are too often
organizationally removed from both the acquisition
and product support communities, leading to
product support solutions that are neither responsive
nor cost-effective enough to affordably meet
changing operational priorities.
Organizational Challenges
There are significant organizational challenges associated with improving product support. These
challenges reflect alignment gaps from a life cycle (concept through disposal) perspective, a joint
(cross-Service and cross-Agency) perspective, and a government-industry perspective. Currently,
the Department’s organizational and governance structure has been unable to fully embrace
performance-based, outcome-oriented opportunities or a holistic closed-loop process for
improved enterprise decision making.
At the program level, some Program Managers have not been properly equipped to fully assume
and execute total life cycle management responsibilities. The organic product support structure is
organized on a functional basis (e.g., supply, maintenance, and engineering), often precluding (1)
decision making based on an integrated view of all relevant product support elements and (2)
effective tradeoffs among those elements to achieve the optimum outcome.
Lack of Shared Goals
The functional stovepipes that exist between the acquisition and sustainment communities are
ultimately rooted in organizations that are funded separately and lack incentives for shared goals
and financial transparency. In addition, the current guidance and vision for PBL has not
proliferated across the logistics community. There are uniquely different product support
strategies and interpretations of ―performance-‖ or ―outcome-based‖ approaches across DoD.
Implementation Ramp-up
The final phase of the effort, Implementation Ramp-up, involved team consensus of the product
support recommendations, refining the written report, and a high-level, first-draft
implementation plan. The RBTs continued to serve as the primary vehicle for achieving project
work, with the WG serving as a reviewing body for RBT-generated products.
In the future, RBTs will evolve into Integrated Product Teams (IPTs), formed to drive the
initiatives recommended in this report to realization.
Recommendations are derived from
root-cause analysis on major product support issue areas. In summary,
these root causes are:
Antiquated systems and processes
Inadequate human capital
Need for ―smart buyers‖
Organizational challenges
Lack of shared goals

29
Chapter 3: Next-Generation Business Model for Life Cycle Product Support
This chapter explains the characteristics and framework of a new DoD business model for
improving product support. It provides a requirements overview, explanation of the design, a
summary of how it can be applied, and further steps to ensure its successful implementation.
The current and future environment requires a significant change in the way DoD makes and
executes product support decisions. As described in Chapters 1 and 2, resource constraints and
dynamic operational requirements continue to exacerbate product support challenges. Product
support is extremely complex and requires integration of the full range of stakeholders and
processes crossing civilian, military, political, financial, industrial, academic, and multinational
boundaries. Individual weapon system product support outcomes are an imperative, but they
should capitalize on efficiencies available through commodity and enterprise management
approaches. Cross-functional and cross-Agency teams need a central focus on enterprise
objectives but a decentralized execution construct to achieve desired weapon system outcomes.
This requires moving beyond functional excellence to portfolio and platform excellence. The
best solutions can no longer rely on functional stovepipes. They require an integration of the best
suited participants to create hybrid organic and commercial capability to effectively and
affordably deliver Warfighter-based outcomes.
This new focus changes product support strategy, processes, policy, and resourcing to achieve
the appropriate balance of weapon system capability, total ownership cost, and risk to deliver
optimum value. While there are other factors affecting these elements, product support decisions
are clearly a major cost driver and readiness-influencing factor throughout the product life cycle.
Accordingly, the PSAT recommends a new business model that will improve the product support
execution and decision-making processes.
Requirements of the Product Support Business Model
A typical business model looks at the business logic of a company from its internal and external
perspective. It includes client interfaces, revenue streams, cost structures, and the necessary
value chain to execute and implement a business. A DoD business model provides a
representation of how DoD intends to provide a valued product or service. In this case, that
product is optimized product support through balancing maximum weapon system availability
with the most affordable and predictable total ownership cost.
Requirements for this new business model were developed using the life cycle product support
vision and guiding principles, standard business model characteristics, and PSAT findings. These
sources concluded that the business model must:
Focus on affordable Warfighter outcome-based objectives
Enable fact-based decisions supported by data
Recommendation:Adopt a ―product support business model‖ that drives cost-effective performance
and capability for the Warfighter across the weapon system life cycle and enables the most advantageous use of an integrated defense industrial base.

30
Use lessons learned over the last decade to evolve and improve on Performance
Based Logistics (PBL)
Be compliant with statutes and policy (subject to recommended changes)
Provide usable information that is integrated in logistics enterprise, planning
programming, budgeting and execution (PPBE), Defense acquisition and
operational decision making
Identify and assign actions, roles, responsibilities, and standards of performance
that facilitate collaboration and partnering
Capitalize on the extensive organic and commercial defense industrial base
Be flexible and responsive to address emergent warfighting requirements
Utilize a toolbox of product support options
The product support business model (PSBM) should help requirement generators, Program
Managers, Department logisticians, industrial base
members, and policy makers work together to
make and implement more informed life cycle
product support decisions. This requires a
common focus to balance a tridimensional
combination of cost, risk, and capability, thereby
creating the value proposition of an affordable
level of outcome-based performance. The
difference between the capability requirement and capability that can be achieved with available
resources creates risk. Throughout a program’s life cycle, decisions will involve making trades
between capability, cost, and risk. Although programs have known and frequently document
product support risk, it is seldom acknowledged in a substantive, problem-solving way.
The ideal situation would be steady state, where resources are adequate to fully support
requirements. The reality is this rarely occurs; requirements consistently exceed available
resources. The uncertain environment creates dynamic capability, capacity, and resource
requirements. Competing demands for limited resources, consistent schedule pressures, time-
phased value of money, and type-of-funding availability also add to the complexity.
The ability to choose wisely among the alternatives requires a culture that is focused on
delivering performance (outcomes) and manages by facts. The business model must provide the
mechanism to measure, assess, and compare performance outcome, cost, and risk objectives to
make informed programmatic through-life decisions.
Weapon system support improvement is a continuous journey that will use an iterative approach
for refining processes, adapting to changes, and eliminating obstacles. It must capitalize on best
practices and provide a closed-loop feedback process. Therefore, the proposed model should
incorporate lessons learned and success stories from DoD’s experience with PBL, contractor
logistics support, public-private partnerships, performance-based agreements, and other
sustainment solutions over the last decade.
Product support decisions have a direct impact on Warfighters and the operational planners. The
model must enable military departments to meet their unit-centric support outcomes, and
generate sufficient unit availability, reliability, and affordability. This requires acknowledgement
and incorporation of the way Warfighters execute their mission via the Brigade Combat Team
Program support risk is driven by a
number of different variables, including system performance variance,
unplanned operational environment,
changing economic situations, and availability of resources.

31
Understanding, integrating, and
capitalizing on the value each organization brings is a tough
product support challenge.
(USA), Carrier Battle Group (USN), Expeditionary Air Wing (USAF), or other unit-centric
mechanisms. History is replete with examples of how logistics wins or loses wars. Product
support constitutes approximately 70 percent of logistics cost20
and, while cost alone should not
dictate Warfighter decisions, the elements that drive product support cost undoubtedly have an
impact on a Warfighter’s freedom of action. In addition to the logistics footprint, there is an
opportunity cost—every dollar spent on support could be spent elsewhere. While the objective
may be individual system performance, the model
cannot ignore the economies of scale and efficiencies
that can be harnessed by consolidating like items for an
enterprise or commodity management approach. The
model must be designed to not only address specific
program decisions, but also provide information that is
integral to logistics enterprise and operational decision making.
The magnitude and scope of product support involve many disciplines, perspectives, and
organizations. Rarely does one find a more diverse group that can produce such significant value.
But, this group faces tough challenges in achieving efficient integration within the boundaries of
statute, policy, guidance, and historical paradigms. Orchestrating this effort is a monumental task
and begins with defining clear roles, responsibilities, and standards of performance. The business
model must articulate, leverage, and communicate competencies to help create effective,
equitable, and transparent relationships based on common Warfighter-desired outcomes. That
includes private industry as emphasized by AT&L leadership:
“In our country we buy our military equipment from private industry, so they‟re our partners
in equipping our forces…I would like to have a relationship of candor and dialogue…we‟re
in this together.”21
The PSAT weapon system assessment reinforced the potential that partnering strategies can
produce higher sustained readiness improvement as shown in Figure 9.
20
See Appendix D for details. 21 Ashton Carter, Under Secretary of Defense for Acquisition, Technology and Logistics, The Wall Street Journal,
01 May 2009.
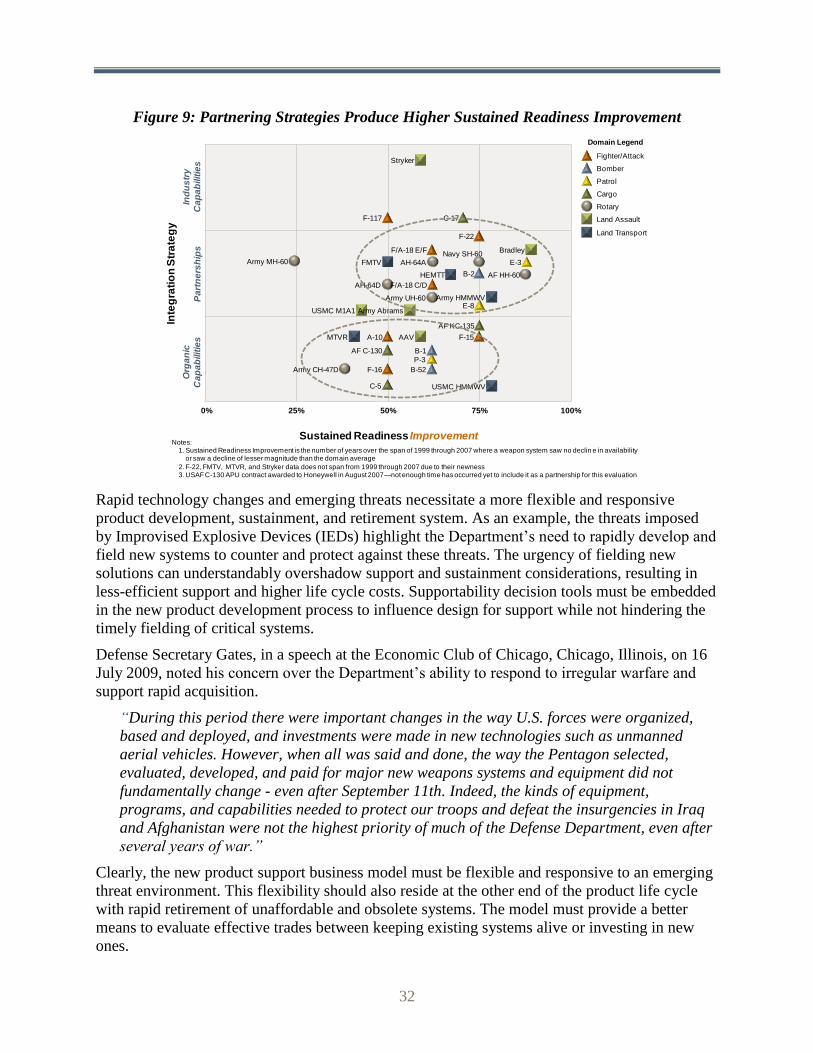
32
Figure 9: Partnering Strategies Produce Higher Sustained Readiness Improvement
Rapid technology changes and emerging threats necessitate a more flexible and responsive
product development, sustainment, and retirement system. As an example, the threats imposed
by Improvised Explosive Devices (IEDs) highlight the Department’s need to rapidly develop and
field new systems to counter and protect against these threats. The urgency of fielding new
solutions can understandably overshadow support and sustainment considerations, resulting in
less-efficient support and higher life cycle costs. Supportability decision tools must be embedded
in the new product development process to influence design for support while not hindering the
timely fielding of critical systems.
Defense Secretary Gates, in a speech at the Economic Club of Chicago, Chicago, Illinois, on 16
July 2009, noted his concern over the Department’s ability to respond to irregular warfare and
support rapid acquisition.
“During this period there were important changes in the way U.S. forces were organized,
based and deployed, and investments were made in new technologies such as unmanned
aerial vehicles. However, when all was said and done, the way the Pentagon selected,
evaluated, developed, and paid for major new weapons systems and equipment did not
fundamentally change - even after September 11th. Indeed, the kinds of equipment,
programs, and capabilities needed to protect our troops and defeat the insurgencies in Iraq
and Afghanistan were not the highest priority of much of the Defense Department, even after
several years of war.”
Clearly, the new product support business model must be flexible and responsive to an emerging
threat environment. This flexibility should also reside at the other end of the product life cycle
with rapid retirement of unaffordable and obsolete systems. The model must provide a better
means to evaluate effective trades between keeping existing systems alive or investing in new
ones.
100%0% 25% 50% 75%
Ind
us
try
Ca
pa
bilit
ies
Inte
gra
tio
n S
tra
teg
y
B-2
F-117
P-3
A-10
F-16
F/A-18 E/F
F-22
B-1
F-15
E-3
Bomber
Domain Legend
Patrol
Cargo
Land Assault
Fighter/Attack
Land Transport
Rotary
C-17
AF KC-135
AF C-130
C-5
Org
an
ic
Ca
pa
bilit
ies
Pa
rtn
ers
hip
s
AH-64D
Navy SH-60
Army UH-60
Army MH-60
Army CH-47D
Stryker
AAV
USMC M1A1 Army Abrams
USMC HMMWV
Army HMMWV
FMTV
MTVR
Bradley
F/A-18 C/D
AH-64A
AF HH-60HEMTT
B-52
E-8
Sustained Readiness ImprovementNotes:
1. Sustained Readiness Improvement is the number of years over the span of 1999 through 2007 where a weapon system saw no declin e in availability or saw a decline of lesser magnitude than the domain average
2. F-22, FMTV, MTVR, and Stryker data does not span from 1999 through 2007 due to their newness3. USAF C-130 APU contract awarded to Honeywell in August 2007—not enough time has occurred yet to include it as a partnership for this evaluation
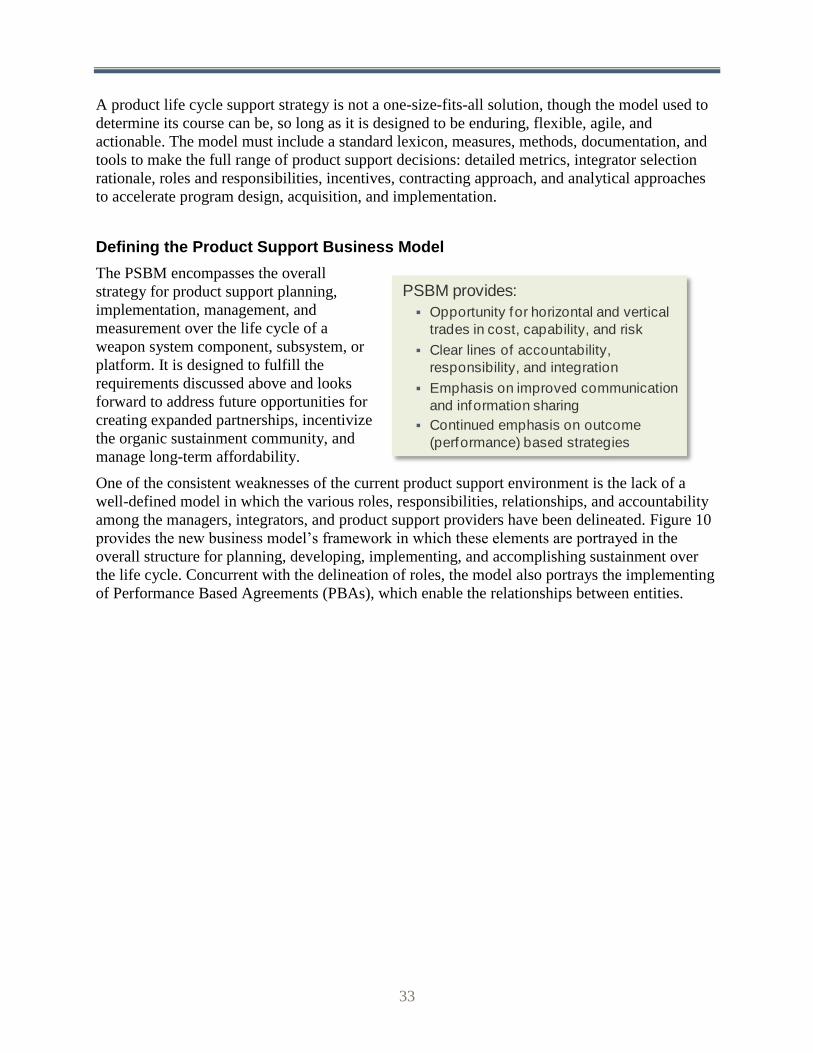
33
PSBM provides:
Opportunity for horizontal and vertical
trades in cost, capability, and risk
Clear lines of accountability,
responsibility, and integration
Emphasis on improved communication
and information sharing
Continued emphasis on outcome
(performance) based strategies
A product life cycle support strategy is not a one-size-fits-all solution, though the model used to
determine its course can be, so long as it is designed to be enduring, flexible, agile, and
actionable. The model must include a standard lexicon, measures, methods, documentation, and
tools to make the full range of product support decisions: detailed metrics, integrator selection
rationale, roles and responsibilities, incentives, contracting approach, and analytical approaches
to accelerate program design, acquisition, and implementation.
Defining the Product Support Business Model
The PSBM encompasses the overall
strategy for product support planning,
implementation, management, and
measurement over the life cycle of a
weapon system component, subsystem, or
platform. It is designed to fulfill the
requirements discussed above and looks
forward to address future opportunities for
creating expanded partnerships, incentivize
the organic sustainment community, and
manage long-term affordability.
One of the consistent weaknesses of the current product support environment is the lack of a
well-defined model in which the various roles, responsibilities, relationships, and accountability
among the managers, integrators, and product support providers have been delineated. Figure 10
provides the new business model’s framework in which these elements are portrayed in the
overall structure for planning, developing, implementing, and accomplishing sustainment over
the life cycle. Concurrent with the delineation of roles, the model also portrays the implementing
of Performance Based Agreements (PBAs), which enable the relationships between entities.

34
Figure 10: The Product Support Business Model Is a Hierarchical Level of Functions
Integrated with PBAs
The top tier of the framework designates the inherently governmental functions of developing
and managing the overall product support strategy across the life cycle, beginning with the
Warfighter’s performance requirements. The Program Manager has the responsibility to develop
an appropriate sustainment strategy to achieve effective and affordable operational readiness
consistent with the Warfighter resources allocated to that objective. The PM’s responsibilities for
oversight and management of the product support function are typically delegated to a Product
Support Manager (PSM22
) who leads the development, implementation and top-level integration
and management of all sources of support to meet Warfighter sustainment and readiness
requirements. This top-level government role is crucial to the delivery of not only system-level,
but also portfolio- and enterprise-level capabilities across the spectrum of defense resources.
The framework’s bottom tier portrays the product support-implementing agents. Consistent with
the model’s emphasis on a performance-/outcome-based product support approach, there is a
requirement for one or more Product Support Integrators (PSIs) who are chartered with
integrating sources of support, public and private, defined within the scope of their implementing
agreements, to achieve the documented outcomes. There is a clear need for entities (public or
private) to be assigned the responsibility for delivering performance outcomes, to be endowed
with authority to integrate, manage, and provide oversight over the lower level support functions
that, in combination, achieve the specified outcomes. The PSI role is assigned within the scope
(component, subsystem, or system level) designated by the PSM and is performed under the
22
Here, PSM is an overarching term characterizing various Service function titles: Assistant Program Manager for
Logistics (APML), Deputy Program Manager for Logistics (DPML), System Sustainment Manager (SSM), etc.
Product Support Integrators
Warfighter
Program Manager (PM)
Product Support
Manager (PSM)
Product Support Providers
Performance Based Agreement (PBA)
PBA/Partnering Agreement
Defined Performance Outcomes
Inherently
Governmental
Integrated
Industrial Base: Commercial and Government
Accountability
Responsibility/Authority
PSI PSI PSI
Depots DLA ICPs OEMs DPO Tier X

35
Good communication, common goals
and reliable decision-making data cannot be overemphasized because
any element in this chain can impact
overall performance.
direction and oversight of the PSM. The PSIs accomplish their product support role through use
of lower-level Product Support Providers (PSPs), which, per the business case analytical
assessment process and consistent with statute and policy, are assigned responsibilities to
perform and accomplish the foundation functions comprising the product support for the
objective capability (enterprise, portfolio, system, subsystem, component). The PSPs comprise
the range of best value (or statutorily designated) entities-assigned workloads that achieve the
Warfighter support outcomes.
The foundation documents that enact and
implement the relationships across this
framework are PBAs. It begins with the
Warfighter (user) defined performance
requirements that are initiated through the
Joint Capabilities Integration and
Development System (JCIDS). The PSM
(acting on behalf of the PM) incorporates the
appropriate needs and constraints in
agreements with PSIs. They, in turn, ensure
that the necessary performance requirements
to meet their agreements are properly passed to the lower-tier PSPs, who accomplish the product
support activities.
The model should not be interpreted as allowing any product support solution. Rather, it should
be interpreted as meaning a thoughtful approach to product support solution design is required
and that this approach appropriately balances life cycle readiness and cost. This approach’s
resultant analysis will result in several solutions with elements that reside in various cells of the
Decision Matrix for Product Support shown in Figure 11. The locus of these solution elements
will depend on where in the life cycle the system resides, the maturity of the commercial and
organic industrial base supporting the system, and on the needs of the individual Services using
and supporting that system.
The model and accompanying text represent a simplified explanation of a very elaborate and
complex value chain. The model illustrates the range of roles and relationships that develop,
manage, and accomplish product support. Although the hierarchy focuses on the down-flow of
requirements, it enables a feedback loop in which actual performance data and other information
can be used to improve overall product support and performance. This also provides an indicator
when trade-off decisions between cost, performance, and risk may be necessary. Like any chain,
its strength is determined by its weakest link. The
communication requirement strengthens the links
and should be included in the PBA. Chapter 4
discusses how the adoption of a Joint Supply Chain
Architecture provides standard metrics and lexicon
for consistent measures and communication at all
levels of the supply chain.
The Decision Matrix for Product Support (DMPS), Figure 11, assists Program Managers in
identifying their product support strategy, which drives decisions on PSI composition, metrics,
incentives, PBAs, and analytical tools. The matrix is based on a framework that outlines nine
Performance Based Agreement (PBA) is a
generic term representing the range of implementing agreements, such as contracts,
Memorandums of Understanding (MOUs),
Memorandums of Agreement (MOAs), Commercial Service Agreements (CSAs),
Service Level Agreements (SLAs), and similar formal agreements to ensure performance
expectations (on both sides) are clearly
articulated.

36
product support options as defined by the intersection of two key strategic system characteristics
that drive the appropriate support strategy:
1. Weapon system strategy—focused on the level at which sustainment outcomes are
measured and managed: platform, subsystem, or component
2. Integration strategy—focused on the desired (or required) industry, organic, or
partnership capabilities
The following is the overview of the DMPS options framework:
Figure 11: Decision Matrix for Product Support—Options Framework Examines the
Intersection of Integration and Weapon System Strategy
Each of the product support options in this model has been designed to address applicable
product support scenarios within a context of outcome-based, industry-government
collaboration. This framework provides a decision tool to support selection of the most
appropriate product support approach. A key attribute of the model is the integration of organic
and industry roles under the umbrella of performance-based, outcome-oriented approaches to
product support. For each product support option, ―implementation elements‖ have been
developed, which provide the guidance for designing, building, and managing weapon system
programs. Below is an example of these implementation elements. More detail on these support
elements are provided in Appendix C.
Integration Strategy
We
ap
on
Sys
tem
Str
ate
gy
Co
mp
on
en
tS
ub
syste
mS
yste
m
Industry Capabilities Partnerships Organic Capabilities
1.1
Industry-Centric Platform Strategy
(Example: C-12 Huron)
1.2
Blended DoD-Industry Platform Strategy
(Example: Stryker)
1.3
DoD-Centric Platform Strategy
(Example: Common
Ground Station)
2.1
Industry-Centric Subsystem Strategy
(Example: HIMARS)
2.2
Blended DoD-Industry Subsystem Strategy
(Example: APU)
2.3
DoD-Centric Subsystem Strategy
(Example: M119-A2
Howitzer)
3.1
Industry-Centric Component Strategy
(Example: Military Tires)
3.2
Blended DoD-Industry Component Strategy
(Example: USAF IPV)
3.3
DoD-Centric Component Strategy
(Example: War Reserve,
Contingency Stock)

37
Figure12: Implementation Elements Example—Option 2.1 Industry-Centric
Subsystem Strategy
Applying the Product Support Business Model
As shown in Figure 12, the PSBM and the DMPS are a means to evaluate and compare support
options over the life cycle of a weapon system. They provide considerations for metrics, best
practices, roles, incentives, analytical approaches, and processes to help accelerate program
design, performance agreements, and implementation.
The approach is not prescriptive. Each of the Services must adapt the overall parameters and
selection criteria in the context of its individual and unique product support requirements,
legislative and financial constraints, and weapon system performance goals.
Managing Enterprise Product Support Portfolios
In addition to making program-specific decisions, the PSBM provides a framework for managing
product support portfolios across programs, common subsystems, and commodities (e.g.,
propulsion, fire control, etc.). Figure 13 illustrates the ability for horizontal integration. Although
the immediate objective is weapon system performance, there are considerable economies of
scale that can be obtained through enterprise- and commodities-based management. By
capitalizing on these opportunities while maintaining weapon system accountability, DoD can
increase its effectiveness and gain efficiencies. Chapter 4 outlines how the PSBM is supported
by operational strategies in supply chain management and industrial integration. These are two
examples of potential portfolio opportunities for cross-platform, cross-Service, and cross-
industry efficiencies.
Target Metrics
(Outcome Objectives)
Materiel availability, materiel reliability, cost, and/or additional high-level ―driving‖ metrics to achieve Am and/or Rm, i.e., NMCS, ready for tasking, mission capable rate, etc.
Representative Example
Rationales
Strong OEM/industry capabilities in areas of supplier base, technical data, supply sourcing, sustaining engineering, and production/upgrade capabilities; focus on product improvement and cost reduction. Ability to partner with organic industry base IAW core capability
requirements and best-value analysis
Product Support RolesSupply chain management, tech support, engineering support, maintenance and repair, support equipment, information systems, configuration management, and training facilities
Government and Industry
Incentives
Leverage commercial expertise and value; utilize government capabilities where clear best value
Product and Support
Integration
PSI accountability and responsibility for delivering outcomes, utilizing industry responsibility for selected activities and outcomes
PBA Approach
Strong consideration of firm fixed price/fixed price per unit of operation contracts for mature legacy subsystems. Use of cost-plus incentive contracts phasing toward fixed price with less mature subsystems. Incentives (award term, incentive fee) tied to achievement of target
metrics/outcomes
Analytical Tools Approach BCA, equal or better-value proposition

38
Figure 13: Opportunities Exist for Commodity and Enterprise Product Support Management
By looking across the supply chain and weapon system portfolios, PMs and Service logisticians
have an approach to identify and capitalize on opportunities for enterprise visibility and
efficiency, resulting from the common management and aggregation of components and
common subsystems, as depicted by Option 3.1 in the diagram above.
Implementation Actions
The new PSBM provides a catalyst for improving weapon system availability while focusing on
total ownership cost. This is only the beginning, however. The success of the PSBM will depend
on the level of sophistication DoD possesses in four key areas: leadership, structure,
management, and culture. The focus and combination of these areas become the basis for a
successful business model execution that drives organizational outcomes. A description of each
area and a brief summary of future opportunities are provided in the following paragraphs.
Chapters 5 and 6 address these opportunities in more detail.
Leadership
A good strategy allows leaders to control through a cloud of uncertainty and provides
subordinates authority and resources to respond collaboratively with speed and precision. It
begins with a core strategic vision (CSV) that unquestionably communicates the leader’s intent
and the value proposition associated with these objectives. The PSAT SSG has established the
2.3
DoD-Centric Subsystem Strategy
1.3
DoD-Centric Platform Strategy
1.2
Blended DoD-Industry Platform Strategy
1.1
Industry-Centric Platform Strategy
2.1
Industry-Centric Subsystem Strategy
3.2
Blended DoD-Industry Component Strategy
3.3
DoD-Centric Component Strategy
Other Systems
3.1
Industry-Centric Component Strategy
(Tires)
2.2
Blended DoD-Industry Subsystem Strategy
(APU)
Align for enterprise
efficiency and visibility
1.1
Industry-Centric Platform Strategy
2.1
Industry-Centric Subsystem Strategy
1.3
DoD-Centric Platform Strategy
2.2
Blended DoD-Industry Subsystem Strategy
2.3
DoD-Centric Subsystem Strategy
3.2
Blended DoD-Industry Component Strategy
3.3
DoD-Centric Component Strategy
Stryker
1.2
Blended DoD-Industry Platform Strategy
3.1
Industry-Centric Component Strategy
(Tires)
1.1
Industry-Centric Platform Strategy
1.3
DoD-Centric Platform Strategy
2.1
Industry-Centric Subsystem Strategy
2.3
DoD-Centric Subsystem Strategy
3.3
DoD-Centric Component Strategy
F/A-18E/F
3.1
Industry-Centric Component Strategy
(Tires)
1.2
Blended DoD-Industry Platform Strategy
(F/A-18 Integrated
Readiness Support Teaming (FIRST))
2.2
Blended DoD-Industry Subsystem Strategy
(APU, F404, AN/ALR-
67(V)3)
3.2
Blended DoD-Industry Component Strategy
(AN/ARC-210)
39
life cycle product support vision and guiding principles to provide that vision and direction, but,
as this effort matures, leadership must continue their persistence in making this change.
Leadership gets people and organizations to align in support of accomplishing a common task
(Warfighter support) by making it a priority. That takes more than saying ―this is a top priority,‖
however. Although the vision is clear, more effort on actionable and quantifiable performance
targets that include enterprise performance, not just program performance, will be required. As
information becomes available, more guidance will be required for making choices or strategic
trades when there are competing priorities for the same resources. But more importantly,
leadership must ensure that the visibility, tools, and other resources to accomplish the effort are
commensurate with their expectations.
Structure
The PSBM provides a joint structure to facilitate DoD alignment, appropriate resource
allocation, and accelerated information flows. However, as this effort evolves, there must be
more detailed effort in articulating structures for processes, governance, cost, and
communication.
Management
Management methods align execution and provide a closed-loop system that motivates high
performance. In establishing the strategy for PSBM, there are three key management areas:
portfolio, workforce, and performance management.
Portfolio management aligns enterprise resources (money, assets, and people)
with priorities to improve the potential of achieving the CSV
Workforce and infrastructure management includes human capital strategy
(assuring the right labor mix of quantity, skills, and location) as well as the
facility and asset ownership, control, and utilization decisions
Performance management is the monitoring and controlling of behavior to
ensure alignment with the CSV
Culture
Webster’s dictionary defines culture as ―the set of shared attitudes, values, goals, and practices
that characterizes an institution or organization.‖ Culture is the pattern of behavioral norms that
members believe will make them successful. This includes values, expectations, and work
practices. The tenets for the PSBM address these very well, but the challenge remains to
institutionalize this model and inculcate the culture throughout the Department. This requires
development and integration into official Department policy guidance, into acquisition reform
thrusts, and incorporation in the Quadrennial Defense Review (QDR) and future strategic
reviews. There will also be a significant effort to develop and roll out a training and educational
plan for the PSBM.
Conclusion
The PSBM directly supports the product support vision and guiding principles by providing a
structure and decision matrix that focuses on weapon system outcomes, controlling product life

40
cycle cost, and optimally aligning DoD and commercial industry capabilities. It provides options
that enable this (industry/government) balanced perspective and outlines desired product support
roles and responsibilities, integration responsibility, the recommended contracting approach, and
necessary incentives across government and industry. This model not only provides the
framework for individual programs and their subsystems, but also creates a foundation for
standardizing financial and operational data elements that enable cross-program capability,
product support enterprise benchmarking, information sharing, and improved decision making
across DoD.
The model provides a strong foundation on which to dramatically improve product support. The
successful implantation of the model will require tangible actions, as indicated in the box below:
Recommendation Key Tasks
Finally, strong and committed leadership is necessary. Every DoD transformation effort faces the
inherent obstacles of institutional resistance to change and the intrinsic deliberate pace of
bureaucracy. Effecting transformation in this environment—even when widely acknowledged as
vitally needed—requires visionary and determined leadership. They must accept the reality that
given the current environment and national priorities, there is no alternative but to transform
product support. Only this level of commitment will be able to overcome the tendency to devolve
into tedious dialogues and debates, and keep the focus on the major reform objectives. The
PSAT SSG has established the life cycle product support vision and guiding principles, but
effecting the transformation must involve the collective support of OSD, Military Departments,
DoD Agencies, and industry as well.
1. Revise DoD and military Service product support policy to incorporate the PSBM
2. Prepare a PSBM guidebook for program managers
3. Formalize the logistics and product support cost structure to be used as the baseline to assess future improvement

41
Chapter 4: Strategies for Implementing the Life Cycle Product Support Business Model
The product support business model (PSBM) introduced in Chapter 3 captures the overarching
strategy for life cycle product support. This chapter introduces two underlying strategic
recommendations for the product support business model: the industrial integration strategy and
the supply chain operational strategy.
These recommendations enable the PSBM strategy and begin to describe the framework needed
to perpetuate product support improvement. The industrial integration strategy speaks to the
opportunity for synergy from a more collaborative organic and commercial industrial base; the
supply chain operational strategy provides tools for a common language and measures to
benchmark and improve the performance and progress of that relationship.
Industrial Integration Strategy
Interdependence between the government and industry is a fact of product support.
The US defense industry is certainly not without its flaws and limitations. Yet, in comparison
with other countries‟, it is certainly the most impressive and enviable. The US industrial base
has been a source of American strategic advantage in the past, and there is every reason to
think that, with enlightened policies and behavior on the part of the federal government, it
can continue to be a source of enduring advantage in the future…to ensure the United States
has the strong, innovative defense industry the nation will certainly require in the decades
ahead, the federal government will need to develop more consistent, thoughtful, long-term,
and effective policies toward the defense-industrial base.
—Barry Watts: The US Defense Industrial Base: Past, Present and Future, 2008
It is undeniable that effective product support requires contribution from both the public and
private sectors. As established in the previous chapter, the government is fully responsible and
accountable for product support delivered to the Warfighter, and often, product support must be
performed by the government, particularly by the military in forward deployed environments.
Further, there is a huge, long-standing investment in organic support capabilities, particularly in
DoD inventory control, distribution, and maintenance depots, that should be effectively and
efficiently employed. Certainly, the organic base does much, though cannot do all of DoD’s
product support work. American industry—or more poetically in the words of President Franklin
Roosevelt, the ―great arsenal of democracy‖—is a source of innovation and productive capacity
for the military force. More than 60 years after World War II, when the standing commercial
industry still seen today formed, DoD has yet to fully leverage the knowledge, skills, and
capabilities of the defense industrial base through a considered and deliberate integration
strategy.
Recommendation:Align and expand the collaboration between government and industry that
produces best value partnering practices.

42
Emergent product support best practices have been defined and refined at the maintenance
depots over the course of the past decade, providing cogent lessons on how to approach
industrial integration. These best practices are not specific to depot-level maintenance. They span
across all components of the supply chain and can be generalized across the breadth of product
support activities and the full life cycle of weapon systems commonly referred to as ―beyond
maintenance.‖ Viewed as ―Through Life Support‖ in the United Kingdom, these best practices
describe an approach to extend the notion of successful partnership beyond depot-level
maintenance activities and catalyze innovation in both government and industry. This expands
the scope of partnering from a narrow, statute defined maintenance-based approach to a broader,
fully-integrated approach across the product support spectrum.
Much remains to be done. While progress has been made in terms of moving away from ―arms
length‖ contracting, much room remains to truly achieve ―Partnering for Outcomes.‖ Future
product support is not all public or all private; it is instead based on relationships that fully use
the expertise and capabilities of both parties.
Congress and various administrations have debated for many years to determine who should
perform depot work and where it should be performed. Central to this debate is the interplay
between various forms of private sector and organic facility collaborations in depot maintenance
and Title 10 provisions that:
1. Limit private sector workloads to 50 percent of available funding in a fiscal year,
2. Require the government to maintain certain core capabilities in military depots, and
3. Require public-private competitions for certain workloads.
The public-private partnership concept for improving government operations provides a
cooperative atmosphere for resolving this debate and highlights the path to developing a
framework for implementing a forward-looking industrial integration strategy.
Public-private partnerships23
are a specific form of industrial integration and are proven to
enhance product support. Documented results include better parts availability, reduced parts cost,
reduced repair time, reduced backorders, and reduced depot support costs. Public-private
partnerships have stimulated private sector investment in facilities and equipment, improved
facilities utilization, reduced costs of ownership, and promoted more efficient business
processes. Public-private partnerships capitalize on what each partner does best, sharing best
practices between industry and government, opening the door to innovation in the organic base.
This values-based partnership approach to product support across the life cycle is proven.
While the success factors at the heart of partnership serve to provide an objective
framework, successful working relationships are characterized by soft factors such as
teamwork, trust and honesty. When the Department and its industry partners display these
23
Title 10 Section 2474 defines these as ―public-private cooperative arrangements‖ to achieve multiple objectives,
including ―foster cooperation between the armed forces and private industry.‖
Create a partnership approach, which is less ―adversarial‖ in style, based on a mutual
understanding of where the motivations and interests of each party lie, acknowledging and managing the areas of divergence and tension, and a willingness to share
information in a spirit of openness and transparency at all levels.

43
behaviors they are more likely to develop a common understanding of the task, the progress
being made and give early warning of problems. 24
This approach to innovation lies in the business environment itself—a partnership approach
which is less ―adversarial‖ in style, based on a mutual understanding of where the motivations
and interests of each party lie, acknowledging and managing the areas of divergence and tension,
and a willingness to share information in a spirit of openness and transparency at all levels.
Implementation of this next-generation industrial integration strategy requires work captured in
three specific key tasks.
Recommendation Key Tasks
1. Support the capture of a broader set of baseline data, including types, size, structure,
and characteristics of partnering agreements.
The Department needs to establish a more comprehensive partnering data baseline to assess
decisions and make better ones in the future. The emphasis should be on Major Defense
Acquisition Programs (MDAPs). For each partnership, facts like type of partnership, correlation
with success characteristics, size of workload, timeframe, performance incentives, award fees,
termination rationale, and gain sharing should all be captured. Program structures should be
correlated with key success factors.
While debate still continues on the proper business structure for partnering, whether it is direct
sale, teaming, or work share, there are best practices that transcend the various flavors of
partnering and are generally common across the portfolio. Figure 14 details the success factors of
good partnering. First documented by the Government Accountability Office (GAO) in 2003, the
PSAT used this same framework in 2009 to test the contemporary understanding of ―good
partnering.‖
With a rich foundation of over 350 partnerships to date, capturing and characterizing partnering
best practices common across the portfolio is possible. A 2007 DoD report, ―Public-Private
Partnerships for Depot-Level Maintenance through the End of Fiscal Year 2006‖ details the
cumulative impact of the 348 partnerships executed as of that time:
Creating or sustaining almost 5,000 government jobs
$3.7 billion in total revenue
$50.2 million of private sector investment
Improved product support, performance, and business practices; updated
technology and cost avoidance; and increased facility utilization
24
The United Kingdom’s National Audit Office – Driving the successful delivery of major projects, HC30 Session
2005–06.
1. Support the capture of a broader set of baseline data, including types, size, structure, and
characteristics of partnering agreements
2. Establish policy and training to expand partnering ―beyond maintenance,‖ drive standardization across Services, and promote proactive establishment of single-source repair capability
3. Propose modifications to Title 10 to enable maximum implementation of industrial integration

44
Input on these partnerships was sought from both industry and government sources:
Depot Commanders at the annual ―Peer-to-Peer‖ (P2P) meetings
Industry representatives from the Aerospace Industries Association (AIA)
Industry representatives from the National Defense Industries Association
(NDIA)
A ―Tiger Team‖ working on the Joint Strike Fighter (JSF), including both
industry and government members
Figure 14: High Correlation among Factors Cited as Success Factors in Partnerships
The 2003 GAO findings have stood the test of time and are as valid now as they were six years
ago. These data, taken as a set, provide a rich description of the success characteristics of good
partnerships and are equally valid within and beyond maintenance.
There are a myriad of interesting findings embedded in the consolidated description of success
characteristics of good partnership. These are particularly compelling in considering the
implementation of ―partnership‖ in the context of a product support business model:
Long-term committed relationships, executed with flexibility and integrated
across organizational boundaries, with complementary skill sets and abilities, are
both essential and possible.
Explicitly cited in source documents Partially or implicitly cited in source documents Blank = Not cited in source documents

45
Shared partnership vision and objectives with the right metrics and incentives
drive alignment and are especially effective when supported by a clear delineation
of complementary roles and responsibilities.
Full coordination with all stakeholders, supported by transparency, open
communication, and the flexibility to change partnership scope, is an essential
ingredient to success.
Clearly documented objectives support alignment and fuel the success of the
partnership. This can be achieved through incentives that drive desired outcomes
and are supported by sound economic analysis.
2. Establish policy and training to expand partnering “beyond maintenance,” drive
standardization across Services, and promote proactive establishment of single-source
repair capability.
To meet its goals, DoD should create a partnership guidebook using data collected for partnering
across the sustainment competencies. It must incorporate the best practice success characteristics
developed at the depot, arsenal, and ammunition plant level as the benchmark, and collaborate
with Defense Acquisition University (DAU) to update training curriculum to expand the concept
of partnership ―beyond maintenance.‖ Further, policy should be established to promote the use of
supply chain partnering early in program life cycle planning to leverage government and industry
capabilities and establish a single authoritative source of depot repair for the programs. This
source of repair is then expanded only as
throughput requirements dictate. There is
nothing that restricts the application of
partnership to the maintenance arena.
Even if specific statutory authority is not
provided for a given situation,
government has the inherent authority to
conduct its business in a reasonable manner. Making use of government resources in
collaboration with industry, with work share agreements as an example of using both public and
private sector facilities and employees to perform work for the public sector, to leverage
expertise and optimize product support is reasonable.
In a recent study,25
OSD reported that 99 of the 348 depot maintenance partnerships demonstrate
―Explicit Product Support Performance Improvement.‖ Analysis of the narratives associated with
these improvements indicates these improvements were related to ―supply support (parts and
material), tech data, information systems, test, training, technical assistance, transportation,
packaging, engineering analysis, inventory management, quality support, logistical services,
materiel movement, etc.‖ While these areas also enable maintenance, this report uses them as
examples of product support ―beyond maintenance.‖
Analysis of Service-provided weapon system data shows strategies involving partnering with
industry yield an 8 percent higher sustained readiness than pure organic approaches. They also
yield a 10 percent higher sustained cost management, as shown in Figure 15. Appendix A
25
Office of the Secretary of Defense, ―Public-Private Partnerships for Depot-Level Maintenance through the End of
Fiscal Year 2006,‖ dated July 2007. Prepared for the Deputy Under Secretary of Defense (Logistics and Materiel
Readiness) by the Joint Depot Maintenance Activities Group.
Even if specific statutory authority is not
provided for a given situation, government has the inherent authority to conduct its business in
a reasonable manner.

46
provides deeper exploration of, and analytical details behind, the quantified benefits. However,
the pursuit of industrial integration on a larger scale presents real and fundamental challenges to
the Department of Defense.
Figure 15: Industry Partnerships Yield Better Readiness Improvement and Cost
Management26
The strategy will not deliver unless the whole of the community, including both government and
industry, is able to make the necessary shifts in behaviors, organizations, and business processes.
Historically, private industry has been more nimble in the development and implementation of
new best practices; via partnering, private industry has been instrumental in directly assisting the
incorporation of these best practices into public facilities. DoD has seen the impact that this has
had at the depots, with examples such as Lean Six Sigma impact at Letterkenny (LEAD) via the
HMMWW Recap partnership between DLA, LEAD, and AM General; GE-driven continuous
improvement activities at Jacksonville; and the emergent approaches embedded in the Joint
Strike Fighter.
Adoption of partnership approaches on a broader scope necessarily provides impetus to the
cross-fertilization of best practices between industry and the organic base. At the same time,
there exists considerable core competency in the government community, particularly in human
capital and infrastructure, which means that there should be cross-fertilization from the organic
base to industry.
DoD therefore must establish policy and training to expand partnering ―beyond maintenance,‖
driving standardization across the Services and promoting proactive establishment of single
source of repair capability early in a program’s life cycle.
26
See Appendix A for analysis details.
66%
1.7%
0.4%
58%
0.2%
0.1%
Sustained Readiness Improvement
Avg Year-over-Year Readiness Change
Overall Readiness Trend
64%
95%
54%
91%
Sustained CostManagement
Avg Year-over-YearCost Control
Integration Strategy
Industry Capabilities and Partnerships Organic Capabilities

47
3. Propose modifications to Title 10 to enable maximum implementation of industrial
integration.
DoD must recognize that different objective drivers apply to industry and the government. The
prime drivers for the government are inherently those of mission accomplishment and
compliance, while industry is accountable to a bottom line. This does not mean that goals cannot
be aligned. As has been seen at the depots, a common ground can be found, and the inherent
tensions associated with these divergent drivers can drive more optimal outcomes.
A rethinking of the nature of partnership includes statutory requirements and issues which may
impede effective and affordable implementation of a Warfighter-based product support strategy.
A more consistent approach to financial rules and incentives, putting organic and commercial
organizations on equal footing, will inevitably lead to more predictable results. Revised or new
statutory requirements should do three things:
1. Propose a strategy for enabling, requiring, and monitoring the ability of the
Department of Defense supply chain offices and industrial activities to produce
performance-driven outcomes and meet materiel readiness goals with respect to
availability, reliability, total ownership cost, and repair cycle time.
2. Enable industry investment in DoD’s industrial and other product support activities
by submitting a legislative change to modify the government ownership requirement
of depot and other support equipment and facilities used in support of core
capabilities.
3. Establish reporting constructs to stimulate financial and cost reporting equivalency
(i.e., comparable) between industry and the government and require cost transparency
to the greatest extent possible while respecting the need to protect competition
sensitive information.
As with competition, partnership can eliminate unnecessarily duplicative capabilities and
increase efficiency. This recommendation provides the organic base with the same opportunities
available to the industry.
Supply Chain Operational Strategy
There are three phases in the DoD product life cycle: Requirements, Acquisition, and
Sustainment. All are supported by the Planning, Programming, Budgeting, and Execution
(PPBE) process. When looking for immediate O&S cost saving opportunities, sustainment is a
logical target since it is a current year expense which encompasses 60 to 75 percent of the life
cycle support costs. The majority of that cost is enveloped in its supply chain. This supply chain
is a network of elaborate, complex, and integrated segments where any element, down to the
basic raw material, impacts materiel readiness.
Warfighters depend on all repair parts, raw materials, equipment, consumable supplies,
warehouses, transportation assets, maintenance/manufacturing facilities, and service elements of
this supply chain to carry out their mission. DoD supply chain practitioners understand this and
Recommendation:Connect platform product support strategies to enterprise supply chain
approaches that produce best value across the DoD components.

48
often make herculean efforts to execute their perceived role in the supply system. Without an
end-to-end perspective, they cannot tell whether their efforts are contributing to making the
entire product support supply chain more effective. They should know how they impact Order
Fulfillment Cycle Time (OFCT), Perfect Order Fulfillment (POF), and Supply Chain
Management Costs (SCMC) because these metrics (for speed, reliability, cost, and efficiency)
have a direct impact on readiness.
From a program’s perspective, the supply chain has a direct impact on the total cost and
readiness of a weapon system. The better a Program Manager (PM) can understand and influence
the supply chain, the more likely he is to achieve the weapon system performance objectives.
Managing and balancing the supply chain requires the PM to know how the supply chain
elements (plan, source, make/maintain, deliver and return) interact and then to make informed
trades between these elements. A supply chain reference model provides product support
managers a tool to consistently measure supply chain attributes and performance, conduct root
cause analysis, and benchmark against other systems to determine realistic program expectations
and potential best practices. Once the weapon system’s required outcomes are established, the
product support manager can use the reference model’s tiered metrics structure to determine the
weapon system’s supply chain requirements.
The supply chain operational strategy must be more than just architecture. The idea that it must
enable an ―enterprise‖ approach to product support is recognized in the PSAT guiding principle,
―Enterprise Means Enterprise.‖ In meeting this guiding principle, DoD must:
Capture every opportunity for joint economy and reduce unnecessary redundancy,
Build the capability to make
good enterprise decisions,
and
Enforce consistency in
product support processes and
infrastructure.
These implementation guidelines form the basis for the supply chain operational strategy. This
strategy provides the framework and standards of performance to drive joint and cross-program
efficiencies. Data collection and analysis continually reinforces ongoing decision making. The
supply chain operational strategy also provides the best practices, metrics, processes, and
enablers to support enterprise stakeholders in day-to-day sustainment execution.
DoD Supply Chain Management’s linkage to product support is its coordination of the
government and commercial processes (plan, source, make/maintain, deliver, and return) and
resources required to ensure that Warfighters’ equipment are ready to accomplish the mission. A
depiction of this is shown in Figure 16.
Currently, there is no single entity that has
responsibility for or can effectively manage the complex end-to-end DoD supply chain.

49
Figure 16: The Supply Chain Architecture Provides the Structure for Converting Material
into Warfighter-Defined Outcomes
Defense supply chain management poses significant challenges. If focused on an individual
weapon system, the supply networks would likely follow the product support programs they
service and be largely structured around weapon system platforms. Funding for supply chain
resources is often budgeted and managed within platforms, with limited visibility across
programs and across Services to drive efficiencies that would result from leveraging a common
supply base, transportation and distribution infrastructure, and maintenance infrastructure. While
some improvements have been made by DLA and TRANSCOM in aligning the supply base and
the defense distribution and transportation networks, there is still significant work to be done to
reduce overall system inventory and optimize the time it takes for system sustainers to get the
parts they need. The defense supply chain must align common processes, materials, and
resources to deliver better performance at lower cost. Global sourcing and distribution must be
considered to meet today’s supply chain challenges. Commercial best-in-class providers will
provide benchmarks that help shape the DoD standards for speed, reliability, and efficiency of all
supply chain processes. Metrics measure how DoD is performing and provide the basis for
targeting continued improvements over time. Linking resources, material, information, and
processes to deliver the outcomes the Warfighter needs requires development, implementation,
and use of an operational strategy or configuration of supply chain elements.
The supply chain operational strategy outlined in this chapter addresses critical challenges
identified in the PSAT discovery process and weapon systems analysis. DoD has efforts
underway to improve the supply chain processes, roles, and responsibilities. But there is still
much to be done to align incentives, metrics, and processes and enforce consequences for poor
Ra
wM
ate
ria
ls/R
eq
uir
em
en
ts
Wa
rfig
hte
rC
ap
ab
ilit
y
DoD Joint Supply Chain
Planning Processes
Execution Processes
Source Make/Maintain Deliver
Return
All supplier/customer interactions are visible, from aggregate demand
to the fulfillment of each order

50
performance. In addition, IT tools do not support integrated supply chain decision making, a
result of poor visibility across programs and Services.
The supply chain operational strategy provides the frameworks, ―go-to‖ resources, and tools to
enable implementation of supply chain best practices across DoD and Industry that are aligned
for effective product support.
Recommendation Key Tasks
1. Institutionalize the joint supply chain architecture across Department, Service, and
private industry suppliers.
Implementation of this recommendation is accomplished through rollout and application of the
ADUSD-SCI Joint Supply Chain Architecture (JSCA) reference model. The JSCA provides the
structure for product support managers to understand and influence the supply chain elements
that impact product support. Figure 17 shows a more detailed view of the JSCA model, which
focuses on three top level performance metrics: supply chain management costs, order
fulfillment cycle time, and perfect order fulfillment to improve materiel readiness through
efficiency, speed, and reliability.
Figure 17: The Joint Supply Chain Architecture (JSCA) Provides a Hierarchy of Processes
Tied to Common High-Level Metrics
1. Institutionalize the joint supply chain architecture across Department, Service, and private
industry suppliers
2. Establish a common enterprise information architecture and visibility (e-hub) to provide consistency and synchronization services between supply chain participants
3. Develop and manage a Supply Chain Management Body of Knowledge (SCM BOK)
Source Maintain/Repair Deliver
Supply Chain GovernanceDemand
Signals Supply Chain Overview Outcomes
• Identify source of supply (S1)
• Negotiate and select
suppliers (S2)
• Receive and verify
product/services (S3)
• Release payment for
materiel/services (S4)
• Finalizing engineering (MR1)
• Develop repair/maintenance
schedule (MR2)
• Issue/requisition product (MR3)
• Perform repair/maintenance
(MR4)
• Release for use/stock product
(MR5)
• Requisition entry, conf irmation,
and order processing (D1)
• Pick/pack/move forces (D2)
• Consolidation and packing for
shipment (D3)
• Transportation execution (D4)
• Customer receipt and billing
(D5)
• Returns determination (R1)
• Obtain return authorization (R2)
• Pack/transport materiel
(defective/excess/MRO) and forces (R3)
Reliability
Efficiency/
Economy
Mate
riel R
ead
iness
Warfighter
Requisition
Maintenance
Requirement
Replenishment
Action
Return
Requirement
….
Return Return
•Receive materiel
(defective/excess/MRO) (R4)
Plan End-to-End Supply Chain
Top-Level Performance Metrics
Supply Chain Management Costs | Order Fulfillment Cycle Time | Perfect Order Fulfillment
• Supply/demand forecasting, planning, and
balancing (P1)
• Repair and maintain requirements
identif ication and planning (P2)
• Retrograde (materiel)/redeployment (forces)
requirements planning (P3)
•Def ine supply chain resources,
required outputs, and required
outcomes (P4)
• Inventory, warehousing, distribution
and deployment planning (P5)
Vis
ibilit
y
Speed

51
Derived from the Supply-Chain Operations Reference-model® (SCOR
®), the standard for
commercial supply chain management, JSCA reflects the unique attributes of the defense supply
chain, serving as the basis for identifying performance and configuration opportunities for
maintaining and improving materiel readiness and supply chain efficiency. JSCA looks across
organizational and funding boundaries for the purposes of improving the DoD’s supply chain
effectiveness and efficiency by employing an enterprise wide, end-to-end perspective to achieve
or improve materiel readiness at best value. JSCA is not a software application; it is a framework
for implementation and is focused on driving process improvements, enabling informed supply
chain decision making, and facilitating communication and unity of effort across the DoD supply
chain enterprise. JSCA is a fairly new initiative that will evolve and be enhanced over time.
The details of JSCA specifically identify best practices, metrics, and enablers for key stakeholder
in the DoD Supply Chain. Fundamentally important to these stakeholders is the balance between
supply and demand and the quality of the collaborative relationships required to achieve this
balance. JSCA provides the common language and metrics, such as Demand Plan Accuracy
(DPA), that allow the measurement of these collaborative relationships’ outcomes. It also
provides the foundation for performance benchmarks across Service and industry joint supply
chains to include benchmarking against other weapon systems. This allows identification of
intra-DOD best practices, and provides a framework for exploring and evaluating supply chain
configuration options.
2. Establish a common enterprise information architecture and visibility (e-hub) to
provide consistency and synchronization services between supply chain participants.
A viable common enterprise information architecture that enables the seamless, instantaneous
flow of information across the Services and their suppliers is needed for end-to-end supply chain
from retail through wholesale; from the Warfighter to the supplier’s supplier. This architecture
supports JSCA management via an open system architecture that captures and associates
partnerships. Examples are already being used for real-time collaborative integrated supply chain
applications for line-side replenishment, outbound logistics, and constraint management. These
examples have demonstrated benefits, such as:
Only one interface to manage
Standardized information exchange methods
Reduced Service-specific ERP integration issues
Increased security (Information Assurance)
Supports Service Oriented Architectures (SOAs)
Scalability, upgradability, and interchangeability
Currently, Service-specific Enterprise Resource Planning (ERP) systems discretely manage
supply chain applications such as repair line replenishment, outbound logistics, and depot
management. The next step is to combine the Services’ and Agencies’ supply chain management
tools through an open system architecture, an example of which is shown in Figure 18, to create
DoD-spanning supply chain visibility, improve cross-Service supply chain usage, and promote
enterprise-wide supply chain optimization.

52
Figure 18: The “e-Hub” Combines Supply Chain Information
from the Services and Supporting Agencies to Create a Common Operating Picture
3. Develop and manage a Supply Chain Management Body of Knowledge (SCM BOK).
Structured around the JSCA, the SCM body of knowledge is used to help standardize and
improve training and skill development for supply chain competency and best practices as they
relate to product support.
The SCM BOK will be process based, meaning it describes work as being accomplished by
processes. This approach is consistent with other management standards such as ISO 9000, and
the DoD Extension to the Project Management Body of Knowledge (PMBOK® Guide), all of
which describe processes in terms of:
Inputs (documents, plans, designs, etc.)
Tools and Techniques (mechanisms applied to inputs)
Outputs (documents, products, etc.)
The SCM BOK should be a detailed repository institutionalizing the five basic process groups
that are typical of almost all supply chains, government, and commercial, as referenced in DoD
4140.1-R, the DoD Supply Chain Materiel Management Regulation.
1. Plan
2. Source
3. Make/Maintain
4. Deliver
5. Return
Supply and Distribution Domain
Operations DomainMaintenance Domain
Asset Allocation
Service-Oriented Architecture
Service-Oriented Architecture
Service-Oriented Architecture
Asset
Part Health
P2 H2 Asset
Part Health
P1 H1
P2 H2
- -
MissionRequirements
(Reliability,
Capability, Safety, etc.)
MissionRequirements
(Reliability,
Capability, Safety, etc.)
MissionRequirements
(Reliability,
Capability, Safety, etc.)
t1
t2
t3
Materiel Inventory
Part # AV CostTime to Replace
Sourcing Time
Source
P1 n1 c1 t1 r1 s1
P2 n2 c2 t2 r2 s2
--
--
--
--
--
--
Pt nt ct tt rt st
Logistics Panning
Open System Architecture
“e-Hub”

53
A Government/Industry not-for-profit association (AIA, NDIA, SCC, etc.) is the best way
forward in developing a DoD SCM BOK. The primary objective is to serve as a forum to
exchange views and information directly related to supply chain planning, sourcing,
manufacturing and maintaining, delivering, and returning processes.
Conclusion
The industrial base has and will continue to provide innovation, infrastructure, and skills for a
modern, ready defense force. The PSBM seeks to capitalize on this tremendous asset through
more industrial collaboration and partnering between organic and commercial entities…moving
more to a single defense industrial base. This requires more information sharing, common focus
and consistent metrics to measure progress and make informed decisions. The supply chain
operational strategy provides that standard lexicon, benchmarking and decision metrics and a
proposed information sharing construct needed to manage this integrated industrial base and the
broader end-to-end DoD supply chain.

54
Chapter 5: Recommended Processes and Enablers for Implementing the Product Support Business Model
The product support business model provides the vision of and framework to achieve evolved
and improved sustainment. A better integrated industrial base helps establish the partnerships
needed to use the best capabilities of government and commercial industries to build that
framework into a vibrant product support infrastructure. Further, the supply chain operational
strategy explains and provides tools to manage how government and commercial industry will
work together through sharing common language, metrics, and measurement tools. Chapter 5
expounds on the strategies outlined in Chapters 3 and 4. It provides operational
recommendations that make these strategies tangible.
Despite the fact that the vast majority of life cycle costs—at least 70%—are expended after
systems have been acquired, sustainment-related inputs have historically been underrepresented
during weapon systems investment decision deliberations. Today’s weapon systems are fielded
in an environment of significant and growing uncertainty. We face a complex and evolving
threat, and the Secretary of Defense has made a call
to balance conventional modernization programs
with capabilities needed for today’s conflicts.27
Training and sustainment strategies, the main
elements of O&S costs, continue to evolve. Given
these uncertainties, it is extremely difficult to
forecast O&S costs with confidence. Exacerbating
these problems, the Departmen has not established a
process for systematically tracking and assessing
O&S costs.
The challenge facing DoD in transforming weapon system life cycle product support can be
described like a puzzle, where each piece must fit with not just one but several adjoining pieces,
and the final puzzle solution (i.e., the big picture) is not apparent until all of the pieces are in
place. The study team found deficiencies in the major corner piece of this puzzle, sustainment
governance—the consistent and cohesive oversight across the management, policies, processes,
and decision-making for sustainment to ensure that sustainment information is a critical
component of weapon system acquisition and throughout the life cycle. Governing and managing
the weapon system life cycle is further challenged by inconsistent collection and use of
sustainment metrics. Of primary importance in today’s economic climate is better collection and
management of O&S costs, which are rising at the macroscopic level. Without the ability to
make consistent and fair cost comparisons across programs within the same Service or across
Services, DoD will never achieve the ability to identify, manage, and mitigate major cost drivers
within programs and within portfolios of capabilities. Compounding these challenges are
documented historical difficulties in selecting and executing appropriate analytical tools to
derive meaning from these cost and performance metrics and facilitate product support strategy
decisions. The final piece of this puzzle is the critical need to ensure that the DoD acquisition
and logistics work force has the requisite skills for executing outcome-based support, driving the
need for a more integrated human capital strategy.
27
Gates, Robert M., ―A Balanced Strategy, Reprogramming the Pentagon for a New Age.‖ Foreign Affairs,
January/February 2009 Edition.
Despite the fact that the vast majority
of life cycle costs—at least 70%—are expended after systems have been
acquired, sustainment-related inputs
have historically been underrepresented during weapon
systems investment decision deliberations.

55
Governance
Every programmatic decision made during the entire life cycle of a DoD system should be made
with the knowledge of how that decision will impact the life cycle sustainment of that system.
While that objective sounds relatively easy to accomplish, decades of experience show that it is
actually extremely difficult. There are two primary reasons for this difficulty: lack of perceived
relative importance of long-term costs—in other words, current cost impacts drive today’s
decisions that tomorrow’s leaders will be left to address—and lack of valid, measurable
sustainment metrics, especially cost projections.
Historically, a ―field-and-forget syndrome‖ has dominated acquisition decision making. DoD’s
planning, programming, budgeting, and execution system (PPBES) has not effectively focused
on the materiel readiness, reliability, maintainability, and life cycle cost of a weapon system.
Dismissal of these key factors has long-lasting consequences for systems that operate 30–50
years before their retirement. Yet this is what generally occurs since future year defense plans
(FYDPs) are limited to relatively near-term budget considerations and Program Managers are
more focused on the immediate issues occurring on their watch.
Furthermore, there are limited formal consideration points for sustainment information and data
into acquisition decision-making processes and forums. As sustainment information evolves,
there is no formal structure to update this information for ease of decision-making or historical
comparison during milestone reviews. Relevant insertion points—from Materiel Development
Decision (MDD) to initial operational test and evaluation (IOT&E)—currently lack the relevant
data necessary to understand costs and other sustainment factors associated with supporting the
weapon systems long term.
Improving sustainment governance to make information more visible and decision-making more
disciplined throughout the weapon systems life cycle will result in improved product support
outcomes. Understanding and managing toward a consistent set of metrics, particularly
ownership costs drivers, will allow decision makers to make better informed investment
decisions across the portfolio of weapon systems. So, how can life cycle sustainment
considerations be a viable factor in the acquisition decisions made during the design,
development, and production of DoD’s weapon systems? The following recommendation key
tasks help to address this challenge.
Recommendation Key Tasks
Recommendation: Improve weapon system governance so sustainment factors are better
considered early and consistently across a weapon system life cycle.
1. Strengthen guidance and policy so that sustainment factors are sufficiently addressed and
governed at key life cycle management decision points (MDD, milestones, etc.)
2. Issue DoD policy to require the Components to conduct an independent logistics assessment (ILA) prior to Milestone B, Milestone C, and FRP, and provide the ILA report to DUSD (L&MR) 30
days before the milestone decision
3. Create a post-IOC review led by DUSD(L&MR) and the respective Service(s) responsible for life
cycle management

56
1. Strengthen guidance and policy so that sustainment factors are sufficiently addressed
and governed at key life cycle management decision points (MDD, milestones, etc.).
DoD stakeholders have invested significant resources in updating guidance and policy as they
relate to the acquisition process and life cycle sustainment. Specifically, OSD has published two
sustainment-centric memorandums28
and an updated instruction.29
The updated Defense
Acquisition Guidebook (DAG) describes the ―what‖ and the ―how‖ of being able to meet the
instruction’s requirements. Guidance is also being developed for the Analysis of Alternatives
(AoA) event, the Technology Development (TD) phase, and Portfolio Systems Acquisition.
Moreover, the Services have demonstrated progress with sustainment governance. For example,
the Department of Navy has instituted ACAT ―Gate Reviews‖ for major acquisition milestone
decision points and beyond. Included in those reviews is a post-IOC "Sustainment‖ Gate to
assess Probabilities of Program Health per measured initial systems performance. Sustainment
Gates raise and resolve operational command sustainment issues in terms of readiness,
KPP/KSA metric performance, Life Cycle Sustainment Plan (LCSP) execution, logistics
interoperability and investment opportunities, and supportability effectiveness and ownership
cost affordability to date.
A new tool is also recommended for use throughout the weapon system life cycle. Much like the
―Spruill Chart‖ depicts a program’s funding status, the ―Sustainment Chart‖ ensures sustainment
information relative to strategy, metrics, and cost is addressed at milestones and reviews. The
Sustainment Chart (Figure 19) is intended as a key decision-making tool because it readily
identifies a weapon system’s product support business model and captures its operating and
support costs and operational metrics data.
28
USD (AT&L) memo dated 31 July 09, Implementing a Life Cycle Management Framework; DUSD (AT&L)
memo dated 10 March 07, Life Cycle Sustainment Outcome Metrics. 29
DoDI 5000.02 dated 08 December 08.

57
Figure 19: The Sustainment Chart
Even though sustainment policy and guidance are readily available and Services and
stakeholders, by varying degrees, are working to address and follow them in their acquisition
processes, policy and guidance are still not uniformly executed or enforced. Given the lack of
readily available data, this is not surprising. Each life cycle management decision point needs
specific, accurate, and timely information with sufficient breadth and fidelity to adhere to current
policy and guidance. Lacking specificity, data analysis is left to interpretation. Accordingly, this
recommendation key task will:
1. Determine the information currently required in guidance
2. Identify the actual information needs for sound governance at each of the critical life
cycle management decision points
3. Recommend the minimum set of data/actions required for decision makers to make
sound life cycle product support decisions
2. Issue DoD policy to require the Components to conduct an independent logistics
assessment (ILA) prior to Milestone B, Milestone C, and FRP, and provide the ILA
report to DUSD (L&MR) 30 days before the milestone decision.
The Services routinely conduct ILAs as a standard, though not standardized, business process.
ILAs are a compilation of information that the Services recognize as important to their life cycle
product support governance. It is also important in OSD product support governance. This
recommendation builds on the Services’ efforts and recognizes the value they potentially add to
DoD-wide product support decision-making processes by requiring the Services to conduct ILAs
based on their existing ILA templates on (at least) all major defense acquisition programs
Product Support Approach
MetricXYZ
Actual
Original
Goal
Current
Goal
Current
Estimate/
Actual*
Materiel
Availability76% 80% 77% 71%
Materiel
Reliability37 hrs 50 hrs 50.5 hrs 51 hrs
Ownership
Cost 245.6B 385.5B 395.1B 395.1B
Mean Down
Time12 hrs 20 hrs 18 hrs 15 hrs
Metric Data
* Test or f ielding event data derived f rom _______
Notes:
Sustainment Schedule O&S Data
MS B MS C IOC FRP FOC Sustainment
BCA
LCSP
CLS Start
Depot Standup
LRIP Contract Award
Blended Partnership
Startup
PBL Recompete
Avionics PBL
PBL Recompete
Sustainment Approach
Current (initial CLS covering total system)
Future (sub-system based PBL contracts)
Issues Shortfall in O&M funding in FYDP
Reliability and availability estimates are below goals
LCSP requires update before DAB
Resolution POM request for O&M restoration submitted
Reliability improvement plan with clear RAM goals up for
final signature
LCSP in draft
BCA BCA BCA
Antecedent
Program
Cost Element XYZ CostABC Original
BaselineABC Current
Cost
1.0 Unit-Level Manpower 3.952 5.144 5.750
2.0 Unit Operations 6.052 6.851 6.852
3.0 Maintenance 0.739 0.605 0.688
4.0 Sustaining Support 2.298 2.401 2.401
5.0 Continuing System Improvements 0.129 0.025 0.035
6.0 Indirect Support 1.846 1.925 1.956
Total 15.046 16.951 17.682
Cost based on average annual cost per squadron
Total O&S Costs XYZ ABC
Base Year $M 102,995.2 184,011.9
Then Year $M 245,665.3 395,147.2
SAMPLE PROGRAM: “ABC”

58
(MDAPs), with other programs strongly encouraged. Moreover, this recommendation enhances
existing ILA templates by requiring critical information identified in the previous task to be
included in all ILAs as a minimum OSD requirement. Finally, it requires the Services to provide
the DUSD (L&MR) their completed ILA with sufficient time before each listed decision point to
ensure the DUSD (L&MR) can provide an informed and relevant recommendation for milestone
assessments and other key decision reviews. Reciprocally, the Office of the DUSD (L&MR) can
provide ILA best practice summaries back to the Services to improve corporate DoD sustainment
planning.
3. Create a post-IOC review led by DUSD(L&MR) and the respective Service(s)
responsible for life cycle management.
There is blurred delineation between acquisition and sustainment in the weapon system life
cycle. A new post-IOC review can represent the key transition point between the acquisition and
sustainment phases of the weapon system life cycle. A post-IOC review with distinct entry and
exit requirements30
marks the passage of a system funded and supported with acquisition
processes and dollars to the responsibility of the Service’s life cycle command. During the post-
IOC review, the system program is formally reviewed, along with its list of known product
support issues and corresponding solution recommendations. This review also provides the first
post-IOC opportunity for OSD to commit resources to assisting the Service life cycle command
in addressing outstanding sustainment issues. Areas to be addressed in a post-IOC review should
include:
Assessment of weapon system performance against its operational and
sustainment requirements, particularly sustainment key performance parameters
and key system attributes
Performance against Service unique metrics, such as contractual or performance-
based agreement requirements
Results of Service-independent logistics assessments and business case analyses
Recommended system improvements that support improved capability or
sustainment and Service metrics
Planned evolution of sustainment strategies
Downstream (post-IOC) reviews can provide improved corporate accountability for long-term
operational performance and also inform the planning and decision making for key product
support factors, such as availability, reliability, and life cycle cost for future programs. A formal
post-IOC review is warranted to both assess operational performance and put back-pressure on
existing acquisition reviews to be more disciplined in their attention to down-stream
consequences.
30
Requirements will be developed when implementing this recommendation key task.

59
Metrics
This recommendation strengthens and operationalizes the overarching formal metrics strategy for
all MDAPs laid out in the 31 July 2008 (AT&L) memorandum, called Implementing a Life Cycle
Management Framework, and encourages the Services to apply it to all non-MDAPs. In turn,
weapon system life cycle management is made more effective and efficient by institutionalizing
how metrics are used in the strategic management of the weapon system life cycle. To
accomplish this, the metrics recommendation will:
Align metrics collection and usage with desired sustainment outcomes
Codify the use of these metrics, including the specific IT tools that rely on these
metrics to aid management decision making
Standardize metrics collection and use processes
Automate business rules used to filter and process data into information for
management decisions
This recommendation and its tasks are critical because relevant metrics have been used
inconsistently to manage weapon system cost and performance over the weapon system life
cycle. This has directly led to unpredictable cost and performance variance at each stage of the
life cycle, leading to program cancellations and difficulty managing weapon systems over their
life cycles, as demonstrated by:
The restructuring of the Joint Air-to-Surface Standoff Missile (JASSM) due to
systemic reliability issues and subsequent cost growth
Cancellation of Extended Range Munition (ERM) due to repeated reliability
failures
These examples represent billions of potentially wasted tax dollars. Had they been spent in an
acquisition process that fostered more life cycle management insight and control, that money
could have been spent toward greater capabilities and better financial stewardship.
This recommendation ensures that present and future platforms are managed to assure
availability to the Warfighter and responsible managing of tax dollars.
Recommendation: Develop an overarching Departmental sustainment metrics and management
strategy for life cycle product support that strengthens formal data collection and analysis capabilities, while providing insight and learning to support life cycle planning and operational management.
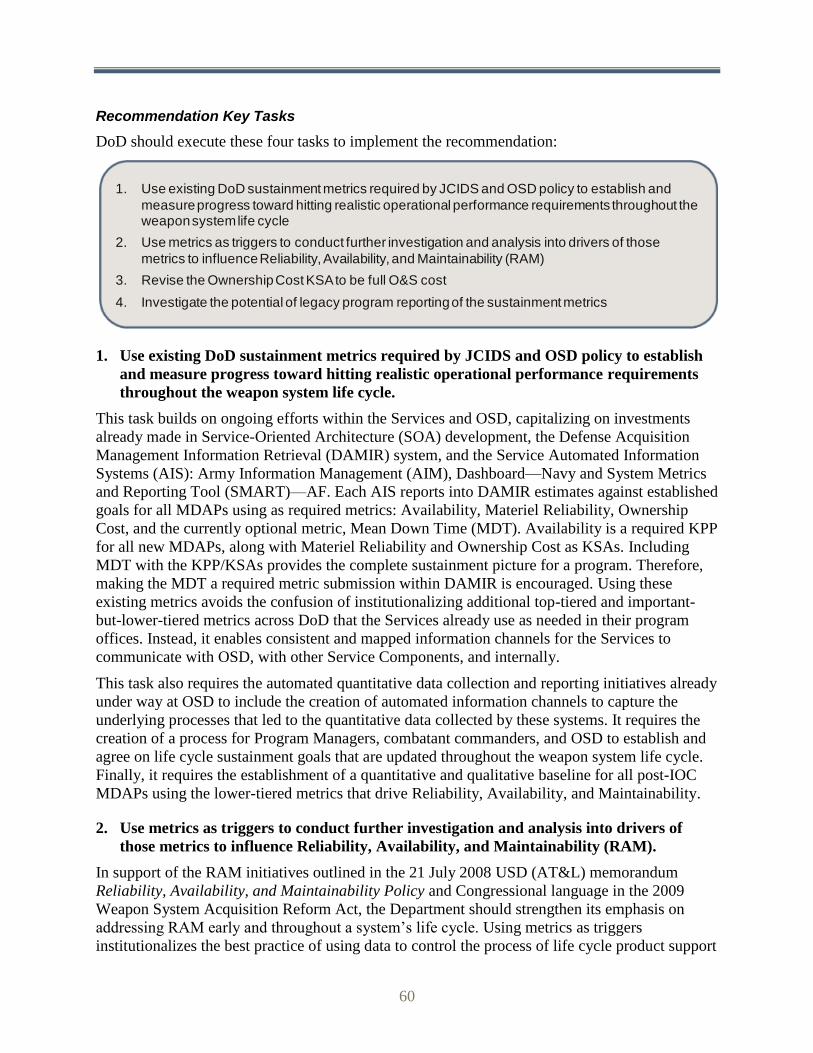
60
Recommendation Key Tasks
DoD should execute these four tasks to implement the recommendation:
1. Use existing DoD sustainment metrics required by JCIDS and OSD policy to establish
and measure progress toward hitting realistic operational performance requirements
throughout the weapon system life cycle.
This task builds on ongoing efforts within the Services and OSD, capitalizing on investments
already made in Service-Oriented Architecture (SOA) development, the Defense Acquisition
Management Information Retrieval (DAMIR) system, and the Service Automated Information
Systems (AIS): Army Information Management (AIM), Dashboard—Navy and System Metrics
and Reporting Tool (SMART)—AF. Each AIS reports into DAMIR estimates against established
goals for all MDAPs using as required metrics: Availability, Materiel Reliability, Ownership
Cost, and the currently optional metric, Mean Down Time (MDT). Availability is a required KPP
for all new MDAPs, along with Materiel Reliability and Ownership Cost as KSAs. Including
MDT with the KPP/KSAs provides the complete sustainment picture for a program. Therefore,
making the MDT a required metric submission within DAMIR is encouraged. Using these
existing metrics avoids the confusion of institutionalizing additional top-tiered and important-
but-lower-tiered metrics across DoD that the Services already use as needed in their program
offices. Instead, it enables consistent and mapped information channels for the Services to
communicate with OSD, with other Service Components, and internally.
This task also requires the automated quantitative data collection and reporting initiatives already
under way at OSD to include the creation of automated information channels to capture the
underlying processes that led to the quantitative data collected by these systems. It requires the
creation of a process for Program Managers, combatant commanders, and OSD to establish and
agree on life cycle sustainment goals that are updated throughout the weapon system life cycle.
Finally, it requires the establishment of a quantitative and qualitative baseline for all post-IOC
MDAPs using the lower-tiered metrics that drive Reliability, Availability, and Maintainability.
2. Use metrics as triggers to conduct further investigation and analysis into drivers of
those metrics to influence Reliability, Availability, and Maintainability (RAM).
In support of the RAM initiatives outlined in the 21 July 2008 USD (AT&L) memorandum
Reliability, Availability, and Maintainability Policy and Congressional language in the 2009
Weapon System Acquisition Reform Act, the Department should strengthen its emphasis on
addressing RAM early and throughout a system’s life cycle. Using metrics as triggers
institutionalizes the best practice of using data to control the process of life cycle product support
1. Use existing DoD sustainment metrics required by JCIDS and OSD policy to establish and
measure progress toward hitting realistic operational performance requirements throughout the weapon system life cycle
2. Use metrics as triggers to conduct further investigation and analysis into drivers of those
metrics to influence Reliability, Availability, and Maintainability (RAM)
3. Revise the Ownership Cost KSA to be full O&S cost
4. Investigate the potential of legacy program reporting of the sustainment metrics

61
governance at all levels, from the strategic to the tactical. It ties with the governance
recommendation presented earlier by allowing automated comparison of actual performance
against agreed-on reliability, availability, maintainability, and cost goals. This includes both the
actual performance of fielded systems and the predicted performance through modeling and
simulation (M&S) of systems in development and helps inform ongoing governance within the
Services and OSD.
This task operationalizes Task 1’s metrics through the use of enterprise dashboards that help
drive decision makers to good choices. Moreover, it requires the creation of standard operating
procedures for those immediate and initial analyses that should be completed whenever agreed-
on trigger points are reached.
3. Revise the Ownership Cost Key System Attribute (KSA) to be full O&S cost.
Revise the Ownership Cost KSA to be full operating and support cost. This builds on the
Sustainment Key Performance Parameter (KPP) and its mandatory supporting KSA of
Ownership Cost defined in the CJCS Joint Capabilities Integration and Development System
(JCIDS) Manual dated 31 July 2009. This document specifies ownership cost be comprised of
several elements developed under the Cost Analysis Improvement Group (CAIG), now Cost
Assessment and Program Evaluation (CAPE). This cost should further account for the cost of all
direct and indirect labor associated with a system and should consider clarifying the definition of
―fully burdened cost of fuel‖ to include the cost of managing fuel supply lines and the risk of
disruption of those supply lines, as discussed in the JCIDS selectively applied Energy Efficiency
KPP. Finally, the standard estimated weapon system lifespan of 20 to 25 years should be
reevaluated to determine if longer estimated life spans are warranted.
This change will provide OSD and the Services with a more comprehensive picture of the actual
cost to operate and support systems and will allow improved decision making across the system
life cycle when evaluating alternatives during development.
4. Investigate the potential of legacy program reporting of the sustainment metrics.
DAMIR should be viewed as the primary tool to display metrics data for fielded systems as it
currently is the warehouse for active MDAP sustainment reporting. In addition, legacy programs
already house fields under the inactive programs function in DAMIR. The Services have
implemented collection and reporting of the sustainment metrics on select programs in
accordance with the 31 July 2008 USD (AT&L) memorandum Implementing a Life Cycle
Management Framework and the subsequent 11 December 2008, ARA/L&MR memorandum
Implementation of Life Cycle Sustainment Outcome Metrics Data Reporting. As directed in the
31 July 2008 AT&L LCM memorandum, legacy programs that have ceased SAR and DAES
reporting should be reviewed for sustainment metrics reporting. Applying metrics reporting
across the entire weapon system life cycle will enable true sustainment management. Fielded
systems have access to existing metrics databases, which can be leveraged to supply sustainment
metrics data.
Implementation of this task requires a mix of investigation and analysis to understand existing
capabilities of legacy programs to collect and report data; what changes are feasible from a
financial and execution standpoint; development of a plan to fund, pilot, and then roll out data
collection and analysis processes for candidate systems; and the execution of that plan.
62
O&S Cost Management
Making life cycle affordability or resource allocation a core process enables several key
transformations. Namely, it:
Moves beyond the traditional approach of estimating costs, focusing on what the
Department can afford over the life cycle to achieve required capabilities
Shifts from the current DoD focus on the acquisition element of the life cycle cost
(LCC) and limited emphasis on the O&S costs of individual programs to
increased emphasis on ownership costs for the entire enterprise
Provides flexibility in achieving holistically affordable system operational
effectiveness without prescribing specific initiatives or provider biases
This recommendation and its resultant transformations address two fundamental issues with how
DoD manages O&S costs:
1. DoD does not take an integrated view of O&S costs across portfolios (e.g., tactical air
warfare, heavy lift, etc.) or across the enterprise—either Service or DoD wide. DoD
tends to look at O&S costs from an individual vertical weapon systems perspective,
and not across all weapon systems to see the overall Total Obligation Authority
(TOA) impact.
2. DoD does not take a long-term view when budgeting for the major supply chain
elements (e.g., the horizontal perspective including maintenance, transportation,
spares procurement, etc.). Supply chain budgets only consider a small portion31
of the
costs incurred by all the programs within the DoD weapon system inventory, many of
which operate for more than the 20 years planned for during acquisition.
These transformations are critical since O&S cost comprises 60 to 75 percent of the life cycle
cost, which is growing as systems operate longer than planned. Considering that DoD spends at
least $132 billion on product support costs across the DoD enterprise each year, even a small
O&S cost improvement results in significant savings to the Department. Moreover, despite the
five base realignment and closure (BRAC) rounds and numerous initiatives, such as the Defense
Management Review Decisions (DMRD) in the 1990s, Reduction in Total Ownership Cost
(RTOC), etc., DoD has historically experienced over 2 percent O&M growth and 1 percent
manpower cost growth over and above inflation each year. This recommendation addresses this
growing gap.
31
O&M budgets cover one year, MILCON three years, and overall programming only looks out six years into the
future. Consequently, the long-term cost impact to DoD is not taken into account, especially when fielding new
systems, which often are more costly than the systems they are replacing.
Recommendation: Make life cycle affordability a core business process for all communities and
stakeholders involved in system acquisition and sustainment.

63
Recommendation Key Tasks
The major tasks to implement this recommendation build off recent DoD and Congressional
initiatives, including the Weapon Systems Acquisition Reform Act of 2009. These tasks are to:
1. Establish an O&S affordability requirement, including linking O&S budgets to
readiness.
Readiness and affordability must jointly drive product support strategies across weapon systems
life cycles and across capability portfolios. A key element of establishing an O&S cost
requirement based on what the Service can afford, backed by even stronger governance
processes, is to use existing Service pilot initiatives to link resources to readiness, building off
the Service lessons learned from using the life cycle sustainment cost. This task expands upon
the concept across the enterprise by including appropriate metrics to help ensure the supply chain
is aligned in how cost relates to performance to achieve the outcome needed by the Warfighter
without suboptimizing supply chain segments.
2. Develop and implement processes and procedures with key communities, engaging
them in the affordability process.
This task creates buy-in from all primary DoD stakeholders. It requires that:
Combat and materiel developers must use realistic estimates of O&S costs in
Analyses of Alternatives (AoAs) and other trade studies that support milestone
decision review LCC considerations be given serious consideration during design
tradeoffs within the programs, as well as in OSD and the Service’s acquisition
milestone decisions
The financial and program management community apply a balanced set of
outcome, quality, responsiveness, and cost metrics to each element of the supply
chain
3. Increase visibility of O&S costs and their drivers across the supply chain.
This task builds off lessons learned from several recent initiatives and recognizes insights from
the ongoing GAO review of O&S cost and the Cost Assessment and Program Evaluation
(CAPE) study in response to the Weapons System Acquisition Reform Act of 2009. It is
structured to gain better insight of actual O&S costs and key drivers. Accomplishing these efforts
helps with future projections and validates that actual costs are in line with the estimates on
which decisions are based. Determining the extent to which O&S-related accounts need to be
parsed at the weapon system level, or the extent that any required budget element changes, are
early activities within this task. That analysis will then be used to determine the investment
required to ensure information systems are capable of disaggregating the O&M accounts.
1. Establish an O&S affordability requirement, including linking O&S budgets to readiness
2. Develop and implement processes and procedures with key communities, engaging them in the affordability process
3. Increase visibility of O&S costs and their drivers across the supply chain

64
Analytical Tools
The use of the business case analysis (BCA) process to make life cycle product support
decisions, mandated by policy since 2004, has been plagued with problems of inaccuracy,
inconsistent application across the Services and weapon systems, and a general failure to achieve
the purpose for which it was intended. The shortcomings of the BCA process include inaccurate
data, inappropriate deadlines for BCA completion, and the perception that there is a one-size-
fits-all BCA process, which, if followed, is both expensive and requires excessive manpower to
execute. It is no surprise that decision makers cannot be sure if the BCA outputs they are using to
support their decisions have been determined using a consistent or sound methodology.
Current BCAs focus mainly on finite cost comparisons. This is inconsistent with DoD policy
directing a life cycle total ownership cost perspective that provides superior ―best value‖
decision making. They ignore the fact that there are also statutory (Title 10) and policy factors
that dictate workload allocation regardless of best value, or that some product support strategies
promote long-term investment in cost reduction and improved performance over the life cycle
but may be marginally more expensive in the short term. And, finally, current DoD policy
mandates the use of BCAs only for PBL product support strategies. This policy is both
incongruous and inappropriately exclusive because all product support strategy decisions should
be subject to an analytic process.
The analytic process by which product support decisions are made should vary by data elements,
timing within the life cycle, and the unique characteristics of the objective system and its
operational environment. New acquisition and development program analysis should be
markedly different from that accomplished for out-of-production legacy systems. Conditions
early in the life cycle are marked by immature data and the absence of a ready organic product
support infrastructure; later in the life cycle, costs are more mature and organic support
infrastructures have been established. Accordingly, there is no single-point-in-time life cycle
product support decision, but rather an evolving, iterative process that addresses the changing
data, environment, and operational outcomes of each system. The analytical tools must align
with the phase of a weapon system life cycle to be effective. Since the maturity of weapon
system data and information evolves as the weapon system moves through the life cycle
management process, the product support analysis should become a living document that is
updated at regular intervals based on current data. Thus, it becomes a decision-making enabler
rather than a static snapshot for one-time use.
An effective analysis balances both cost and readiness. For BCAs to improve in effectiveness as
a decision-making tool, it is necessary to address, clarify, and codify the larger group of
―analytical tools‖ by which the analysis should be conducted. DoD cannot ―fix the BCA process‖
alone without addressing the core systemic issue that traditional BCAs are just one of many
analytical tools in the toolbox, and that each tool should be examined for its applicability within
the life cycle of a program.
Implementing the analytical tools recommendation helps decision makers compare weapon
systems programs that have followed a similar methodology to arrive at business analysis
Recommendation: Clarify and codify policies and procedures pertaining to the use of analytical tools
in the life cycle product support decision-making process.

65
outputs. Using standardized analytical tools leads to standardized data collection expectations
and standardized analytical outputs across Services, resulting in greater opportunities for joint
approaches. Ultimately, joint approaches maximize supply chain and product support channels
and reduce overall risk and costs for programs.
Finally, the benefit of expanding the analytical tools examination beyond BCAs provides DoD a
greater opportunity to satisfy BCA root-cause problems found by GAO auditors. A consistent
analytical tools approach will allow DoD to provide consistent responses to internal reviews and
external audits.
Recommendation Key Tasks
After addressing the larger group of analytical tools, DoD should narrow its scope to provide
specific improvements for the use of BCAs to support decision making. DoD should implement
the following three tasks to realize this objective:
Rather than prescribe a single inflexible analysis process, these three tasks are intended to
provide decision makers with a better understanding of not only what types of analysis are
appropriate for various programs at various periods within their life cycle, but also what
information they should be requesting and receiving to make better analytical decisions. These
tasks are meant to shift DoD’s perspective from one that is BCA-focused to one that includes a
variety of options to aid in their decision making. Each task is discussed in more detail below.
1. Publish a product support analysis “toolbox” handbook.
OSD should establish and facilitate a team of representatives (e.g., Services, DLA, industry,
Joint Staff, modeling and simulation (M&S), test and evaluation, DAU, etc.) to collect known
available analytical tools to understand what is currently available within the community that
supports decision making. This should ensure consistency in processes and analytical outcomes
among community stakeholders across the life cycle management framework.
This team should identify gaps between tools that are available, identify tools that should be
available, and propose new analytical tools or models to fill gaps.
The representative team will define and publish the toolbox handbook. The toolbox handbook
will include the analytical tools that are available to decision makers, how and when different
analytical tools are used, and what necessary inputs and outputs are associated with each tool.
2. Provide guidance on conduct of the product support analysis process and establish
policy on the use of analytical tools to support decision making.
OSD will provide guidance in DODI 5000.02 and the Defense Acquisition Guidebook (DAG)
regarding implementation of the product support toolbox analysis handbook.
1. Publish a product support analysis ―toolbox‖ handbook
2. Provide guidance on conduct of the product support analysis process and establish policy on the use of analytical tools to support decision making
3. Develop updated training on sustainment analysis to include BCAs

66
This guidance will define and address the core elements, factors, criteria, and analytic tools
consistent with analysis across the range of DoD systems pertinent to (at minimum) the
following characteristics:
Type of program (new acquisition/development or legacy program)
Maturity of the program (various stages of the life cycle from early
[e.g., Milestone A] through later [e.g., IOC])
Specific criteria to be included, including quantitative, qualitative, and non-cost
boundary conditions (Title 10, Service Policy, other)
Level of objective system: system, subsystem, or component
Recommended iterative review cycles for updating the analysis
The appropriate level (depth) of analysis, recognizing that early program analysis
may be less comprehensive and have short-term time value, whereas later
program analysis will be more comprehensive and have longer-term applicability
Until formal policy and guidance (i.e., DODI 5000.02 and the DAG) can be revised, a policy
memorandum should be issued by OSD AT&L and cosigned by Cost Assessment and Program
Evaluation (CAPE) directing that all programs use analytical tools to assist in determining a
weapon system’s support strategy and to provide rationale for contract arrangements. The policy
should be broad enough to allow the Services to incorporate the guidance they already have; it
should encourage all communities—e.g., Joint Staff, M&S, testing, CAPE—to work together;
and it should amend the AoA to include analytical alternatives more attentive to product support.
3. Develop updated training on sustainment analysis to include BCAs.
Lastly, DAU should leverage the toolbox handbook to develop and offer additional training
courses and CLMs on analytical tools for use in sustainment analysis, including BCAs. DAU’s
approach should cover the characteristics of each tool and how and when it can be applied during
a program’s life cycle.
Furthermore, recognizing that BCAs are presently conducted using a team of representatives
from different organizations and with differing expertise, DAU should work with Service SMEs
to develop and schedule BCA-specific team (vice general) training to coincide with the kickoff
of a product support analysis team. Additional and more detailed training on product support
analysis should be given to cover the use of analytical tools and processes such as core logistics
analysis and source of repair analysis that may provide feeder data into the objective system
analysis.

67
Human Capital
Product support human capital derives primarily from two sources: the defense logistics
workforce and the defense acquisition workforce.32
Neither workforce domain demonstrates
widespread product support competency across all career fields in the respective domains. Yet,
the ability to achieve improved product support outcomes consistent with the recommendations
of this report depends on a broader constituency capable of effective product support
management. The encouraging news is that the logistics and defense acquisition workforce are
the beneficiaries of effective and exemplary human capital strategic planning efforts over the
past several years.
The DoD Logistics functional community is comprised of more than 615,000 active duty
military and civilian personnel33
who fall into one of four logistics workforce categories. Of
these four logistics workforce categories, ―Life Cycle Logistics‖ is most closely associated with
product support competencies. The Life Cycle Logistics area is comprised of approximately
13,400 personnel who make up 2 percent of the total logistics workforce.
The life cycle logistics workforce stands at the nexus between the 615,000-member logistics
workforce and the 125,900-member defense acquisition workforce. As shown in Figure 20,
besides the life cycle logistics career field, there are other career fields in the acquisition
workforce that must demonstrate product support competencies, specifically the program
management, systems engineering, production/quality management, and to some degree the
contracting career field.
The seven Life Cycle Logistics competency areas identified in the May 2008 DoD Logistics
Human Capital Strategy (HCS) are generally descriptive of the product support competency set
and therefore must be fully incorporated into defense acquisition workforce training. Key focus
areas for competency incorporation, enhancement, and improvement include life cycle
sustainment planning; life cycle cost management; PBL strategy implementation; supportability
analysis; reliability, availability, and maintainability (RAM) analysis; configuration
management; and technical data management/product data management.
32
The DAWIA-coded workforce. 33
Augmented by over 200,000 Guard/Reserve personnel.
Recommendation: Integrate product support competencies across the logistics and acquisition
workforce domains to institutionalize successful traits of an outcome-based culture.
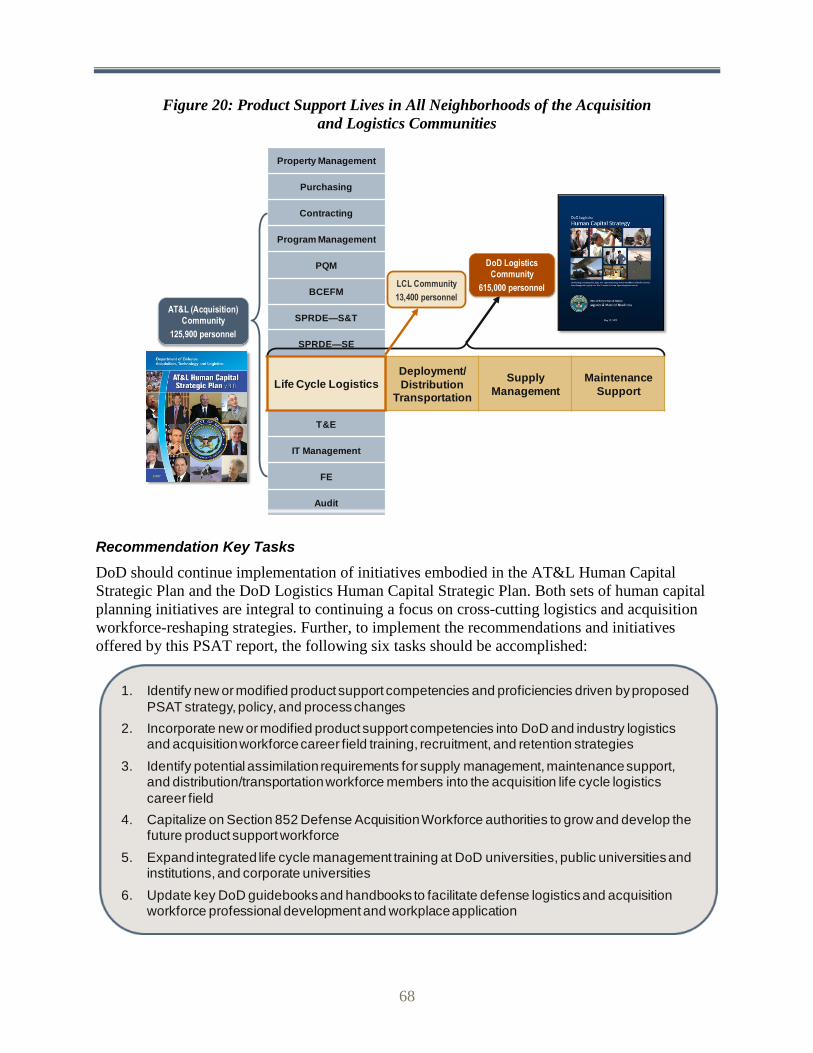
68
Figure 20: Product Support Lives in All Neighborhoods of the Acquisition
and Logistics Communities
Recommendation Key Tasks
DoD should continue implementation of initiatives embodied in the AT&L Human Capital
Strategic Plan and the DoD Logistics Human Capital Strategic Plan. Both sets of human capital
planning initiatives are integral to continuing a focus on cross-cutting logistics and acquisition
workforce-reshaping strategies. Further, to implement the recommendations and initiatives
offered by this PSAT report, the following six tasks should be accomplished:
Deployment/
Distribution Transportation
Supply
Management
Maintenance
Support
Property Management
Purchasing
Contracting
Program Management
PQM
BCEFM
SPRDE—S&T
SPRDE—SE
Life Cycle Logistics
T&E
IT Management
FE
Audit
DoD Logistics
Community
615,000 personnel
AT&L (Acquisition)
Community
125,900 personnel
LCL Community
13,400 personnel
1. Identify new or modified product support competencies and proficiencies driven by proposed
PSAT strategy, policy, and process changes
2. Incorporate new or modified product support competencies into DoD and industry logistics and acquisition workforce career field training, recruitment, and retention strategies
3. Identify potential assimilation requirements for supply management, maintenance support, and distribution/transportation workforce members into the acquisition life cycle logistics
career field
4. Capitalize on Section 852 Defense Acquisition Workforce authorities to grow and develop the future product support workforce
5. Expand integrated life cycle management training at DoD universities, public universities and institutions, and corporate universities
6. Update key DoD guidebooks and handbooks to facilitate defense logistics and acquisition workforce professional development and workplace application
69
1. Identify new or modified product support competencies and proficiencies driven by
proposed PSAT strategy, policy, and process changes.
The DoD Senior Functional Leader for Life Cycle Logistics should take the lead on this action.
Using the existing competency sets identified in current acquisition career fields per the AT&L
competency studies performed by the Center for Naval Analysis (CNA) and logistics career
fields per the May 2008 DoD Logistics Human Capital Strategy as a baseline,34
a ―gap analysis‖
should be conducted to identify what strategic, functional, policy, processes, and related
training/learning assets change in the future as a result of PSAT recommendations, thereby
requiring new competency sets to be incorporated into training curriculum and other workforce
management activities.
2. Incorporate new or modified product support competencies into DoD and industry
logistics and acquisition workforce career field training, recruitment, and retention
strategies.
Extending from Task 1, the DoD Senior Functional Leader for Life Cycle Logistics should
coordinate with other acquisition career fields (particularly program management, systems
engineering, and contracting) and logistics workforce categories (particularly supply
management and maintenance support) to incorporate new and revised competencies into
applicable curriculum and other workforce-management activities. This coordination can be best
effected by working through the Defense Acquisition University, the Logistics Functional IPT,
the Acquisition Management Functional Group, the Overarching Functional IPT, the DoD
Logistics Human Capital Executive Steering Group, and the National Defense Industrial
Association.
3. Identify potential assimilation requirements for supply management, maintenance
support, and distribution/transportation workforce members into the acquisition life
cycle logistics career field.
The defense acquisition Life Cycle Logistics workforce has 13,400 members, increasing by 7
percent since 2005 as a result of increasing the designation of positions as acquisition. Increased
DoD attention to life cycle management initiatives and the inclusion of product support
strengthening would signal that continued growth should be expected in this career field. In FY
10–11, indications are that approximately 3,800 additional Life Cycle Logistics career field
personnel will be assimilated into the acquisition workforce by the Defense Components and the
Defense Logistics Agency. Government insourcing strategies will likely influence an upward
trend in such assimilation as well. This action will be led by the Defense Components, who
independently determine which of their workforce positions are identified as part of the
acquisition workforce.
4. Capitalize on Section 852 Defense Acquisition Workforce authorities to grow and
develop the future product support workforce.
In Section 852 of the 2007 National Defense Authorization Act, Congress directed the Secretary
of Defense to establish a fund to be known as the Department of Defense Acquisition Workforce
34
DoD Logistics HCS implementation is awaiting an enterprise tool for capturing and validating competencies and
their levels. This enterprise tool will not only capture competency identification and proficiency levels of the
current workforce but will also achieve a more accurate baseline of competency sets.
70
Fund to provide resourcing for the recruitment, training, and retention of DoD acquisition
personnel. The purpose of the fund is to ensure that the DoD acquisition workforce has the
capacity needed, in both personnel and skills, to properly perform its mission, provide
appropriate oversight of contractor performance, and ensure that the Department receives the
best value for the expenditure of public resources. DoD should ensure that life cycle
management and product support workforce members receive the benefits of the statutory
authority. Most of the prerogative for taking advantage of Section 852 opportunities rests with
the DoD Components and the Defense Acquisition University in aggressively and expeditiously
implementing new course development and updates to incorporate the new DoD logistics
competency set into their learning assets.
5. Expand integrated life cycle management training at DoD universities, public
universities and institutions, and corporate universities.
Life cycle management and product support professional development occur at many sources
today including the Defense Acquisition University, military Service Academies, defense
institutes, public universities, independent contractor training, and industry corporate
universities. All should be the focus for expanded integrated life cycle management training.
Such a widely distributed task cannot be well instrumented by a single entity; however, the Life
Cycle Logistics Senior Functional Leader and the Defense Acquisition University can be integral
in leading the coordination and sharing of competency requirements and existing curriculum
products. It is worth investigating the potential of a DoD/industry clearinghouse approach for
such curriculum sharing.
6. Update key DoD guidebooks and handbooks to facilitate defense logistics and
acquisition workforce professional development and workplace application.
Processes and procedures for applying key competencies contained in the DoD Logistics Human
Capital Strategy are addressed in a variety of key DoD publications, handbooks, and guidebooks,
which require revision. These include:
Designing and Assessing Supportability in DoD Weapon Systems: A Guide to
Increased Reliability and Reduced Logistics Footprint Guidebook (Oct 03)
Performance Based Logistics: A Program Manager's Product Support Guide (Mar
05)
Acquisition Logistics Guide (Dec 97)
MIL-HDBK-61A Configuration Management (Feb 01)
MIL-HDBK-502 Acquisition Logistics (Jan 05)
MIL-PRF-49506 Logistics Management Information (Jan 05)
GEIA-STD-007 Logistics Data Product Data (Aug 07)
GEIA-HDBK-007 Handbook for Logistics Data Product Data (Jun 07)
Human capital management is a vital enabler to all recommendations resulting from this report.
The tasks above provide an effective institutionalization of expanded product support
competency coverage for the logistics and acquisition workforce in both DoD and industry. This
allows the ability to leverage existing structures and innovative opportunities.

71
Chapter 6: Life Cycle Product Support Implementation
This chapter provides the operational details of implementing the Product Support Assessment
Team (PSAT) recommendations. It starts with an overview of the core change management
philosophy used to minimize the transition stress associated with every large-scale change. It
continues with a detailed view of the core team that implements the PSAT recommendations, as
well as the management structure that ensures this implementation is effective, timely, and
aligned with the life cycle product support vision and guiding principles. Finally, it ends with the
high-level tasks for each recommendation in a section referred to throughout this chapter as the
―Implementation Plan.‖
Change Management Philosophy
Planned and effective change management greatly increases the chance of successful change.
This change management high-level plan is founded on three bedrock tenets:
1. Department-wide change requires Department-wide leadership—Parent
organizations must lead implementation of the recommendations detailed in this
document to ensure all changes are logically applied, executable, and have the buy-in
of those who execute or are affected by them.
2. What gets measured gets done—Progress on implementing each recommendation is
communicated to the most senior DoD stakeholders on a regular and periodic basis.
3. Maintain complete transparency and openness—Successful transformation is
paramount; a climate of complete transparency and openness to ideas is maintained to
ensure complete visibility into obstacles to implementing these recommendations and
receptiveness to the innovative solutions that overcome them.
Core Team Concept
The core team, shown in Figure 21, provides a focused and flexible framework to facilitate
successful PSAT recommendation implementation. The core team leader is responsible for the
overall management of the team’s routine effort and is staffed from the Office of the Assistant
Deputy Under Secretary of Defense for Materiel Readiness. Assisting the core team leader is the
process leader, who manages day-to-day change management processes, such as tracking
progress against the Implementation Plan and helping fix any problems that occur during
implementation.
A core team of approximately 15–20 vested stakeholders leads the implementation of PSAT
recommendations. This team is composed of OSD staff, members from each Service and DLA,
and select Aerospace Industries Association (AIA), National Defense Industrial Association
(NDIA), and academia members who (1) have in-depth knowledge of the PSAT
recommendations and of the stakeholders these recommendations will impact, and (2) are
influential within their respective organizations to drive buy-in and collaboration across the
enterprise.
The extended team supports the core team and allows reach back to resources who are involved
in the project but do not attend core team meetings. These extended team members typically

72
have infrequent, but important, impact on the project—data rights, contracts and legal
organizations, as well as those who play a supporting role such as engineering or testing. The
extended team can also include those who provide strategic or advisory expertise; usually
functional experts who lend part of their time to the core team on an as-needed basis. As such,
extended team members are identified when resources are constrained or when the core team is
unsure of with whom to work.
Figure 21: The Core Team Concept Identifies High-Level Roles and Responsibilities and
Forms the Foundation of Strong Change Management
The recommendations that the core team implements are broad and require focused effort for
success. Accordingly, the core team is divided into three integrated product teams (IPTs), each of
which is dedicated to implementing between one and four recommendations. Each IPT is
comprised of cross-functional groups of experts who have the skills required to understand and
execute the key tasks required by their IPT’s recommendations. The core team leader coordinates
resource allocation when skills resident in one IPT are needed to help another. These IPTs and
the recommendations for which they are responsible follow:
IPT #1: Product Support Business Model. This team will:
– Formulate guidance and actions necessary to implement the product support
business model, ensuring consistent application of the defined PSBM roles,
responsibilities, and interrelationships
– Develop and plan initiatives to align and expand partnerships beyond depot
maintenance across the range of product support functions
– Develop enabling actions and guidance necessary to transition weapon system
product support strategies to outcome-based approaches utilizing enterprise-
focused supply chain management practices
Product Support
Business Model
Governance
Human Capital
Strategy OADUSD
MR
Systems
Engineering
Sustaining
Engineering
Inventory
Management
ContractingComptroller
Requirements
Definition
Independent Cost
Estimating
Distribution
Process Owner
Combatant
Commanders
Program
Managers
ProcurementMaintenance
Core Team
Extended Team
Core Team Leader
and Process Leader

73
IPT #2: Governance. This team will:
– Develop the implementing actions necessary to insert and institutionalize
governance of product support across the life cycle
– Fully implement and institutionalize use of approved sustainment metrics,
including cost, as part of product support governance activities, milestones,
reviews, and other product support assessment actions necessary to ensure
appropriate life cycle management oversight across the entire Defense
enterprise
– Develop recommendations and implementing actions necessary to provide for
full visibility, transparency, consistent estimation, and consistent reporting of
Operating and Support costs across the Defense enterprise
– Develop and implement an analytical toolbox-based methodology that will
enable the selection of product support options among the business model
alternatives over the defense system life cycle
IPT #3: Human Capital. This team will:
– Develop the recommendations and implementing actions required to define
and shape the professional workforce necessary to execute the new product
support environment. The objective is a fully integrated acquisition and
logistics team that can plan and manage product support while expanding and
leveraging broader integration of the public and private sector industrial base
Management oversight for these three teams will be provided by reorganizing the PSAT Senior
Steering Group (SSG) into a standing Product Support Executive Council (PSEC). This
executive group’s efforts should be aligned with other related senior-level groups such as the
Maintenance Executive Steering Committee (MESC), the Joint Logistics Board (JLB), and the
Weapon Systems Lifecycle Management Group (WSLM).
Product Support Executive Council
Effective management defines how all parts of the DoD enterprise are involved in designing and
deploying the PSAT recommendations, as well as the specific decision rights and contribution
expected of each person involved. Even as the core team and core team leader provide
management of the strategic, operational, and tactical aspects of implementing the PSAT
recommendations, oversight, management, and senior guidance for the implementation of the
PSAT recommendations are provided by the PSEC. This body is the evolution of the SSG and is
independent of other senior-level groups such as the MESC, the JLB, and the WSLM. The PSEC
has a high-level composition, shown in Figure 22, ensuring proper visibility of and support for
the implementation of the PSAT recommendations. The exact composition of the PSEC is
initially recommended by the PSAT SSG at its final meeting of FY 2009.

74
Figure 22: The Product Support Executive Council Representation Ensures Initiatives are
Properly Supported and Aligned with DoD Strategy and Life Cycle Product Support Vision
and Guiding Principles
Management Cadence
The PSEC, core team leader, and core team all work together to provide implementation
management. This teamwork requires commonly understood roles, responsibilities, and
communication channels, the starting points of which are shown in Figure 23.
Note that the regularly scheduled meetings required by this management cadence ensure that
implementation progress is smooth and well known to all stakeholders. Also, any problems with
implementing the PSAT recommendations are known and brought to the appropriate decision
body before unrecoverable schedule variance occurs.
Figure 23: Product Support Management Cadence Ensures Implementation Progress Is
Tracked and Reported in a Scheduled and Repeatable Manner
Implementation Plan
This section shows the relationship between the high-level tasks required for full PSAT
recommendation implementation via the overarching implementation master schedule, which is
part of the implementation plan. Critical to successful implementation is a robust
communications strategy and plan; identifying people and organizations that must be
communicated with and the appropriate channels in which to conduct this communication, laying
Product Support Executive Council
ADUSD MR OSD Staff Joint StaffService
ComponentsAgencies Industry
Role Responsibilities Communications Cadence
PSEC Ensures alignment of PSAT recommendation
implementation with DoD strategies and with the
life cycle product support vision and guiding
principles
Makes executive decisions that impact across
service and industry borders
Meets quarterly
Core Team Leader Leads core team in accomplishing the
implementation plan
Facilitates operational-level decisions made by the
core team
Manages all implementation management official
communications
Reports to PSEC quarterly
Transmits feedback from the PSEC
to the core team as applicable
Core Team Implements PSAT recommendations in
accordance with guidance from the PSEC
Makes operational- and tactical-level decisions
Attends meetings monthly or as
needed

75
out the communications sequencing plan, and then aligning resources to create and deliver the
communications is one of the first tasks the core team leader completes to kick off
implementation.
Implementation Master Schedule
The implementation master schedule provides an executive-level view of how the PSAT
recommendations are implemented on a task-by-task basis. Detailed schedules are developed by
the core team using the guidance from the initial PSEC meeting, and are agreed on by all
stakeholders prior to kicking off their respective recommendations. Generally speaking, though,
kickoffs occur according to this schedule.

76
Table 3: Implementation Master Schedule

77
Chapter 7: Critical Path and Accountability
There is a strong desire among the PSAT participants, and most certainly among the report
authors, not to create yet another piece of shelf-ware. To that end, a set of accountabilities must
be assigned and a critical path to success must be established. Accountable parties will be those
with the most at stake: OSD, the Military Services, the supporting Defense Agencies, and
Industrial partners.
In many cases, these reports are more influential than generally credited, but they lack predictive
criteria on which one may evaluate their impact. For example, the Product Support Report of
1999 is remembered by few—just the authors and those who recognize that the report did
promote some lasting change in Defense product support. Had the 1999 report placed a
predictive stake in the ground, we would have had a better means of judging its efficacy.
Nonetheless, many initiatives were spawned from this effort. Performance Based Logistics, total
life cycle systems management, reduction in total ownership costs, prime vendor arrangements,
logistics footprint reduction, weapon system integrated supply chains, and product support
integrators are among the initiatives that were catalyzed by that 1999 report.
To what accountability standards can this 2009 report be held as a future touchstone to judge
whether its implementation moved ahead the management and science of life cycle support—or
fell short?
Ten Long-Term Accountability Indicators
However desirable in the minds of this report’s authors, it is unlikely, nay, unprecedented for a
review body to still keep score on this report’s recommendations, sub-recommendations, and
specific action items in five years. It is likely and indeed a certainty that defense product support
will still be in need of continued reform and policy change, and subject to critical resource
decisions in five years. So, how will strategy and policy makers know whether the DoD product
support process has improved? To answer this, consider that instead of keeping score on how
many of the recommendations were fully or partially implemented, borrow a page from the
PSAT’s outcome-based playbook and recommend that posterity should assess the health and
progress of product support and the accountability for this report against the following ten
indicators:
1. Future acquisition reform legislative and policy initiatives are life cycle management
focused.
2. Program Managers are equipped by life cycle management enablers consistent with
PM accountability and responsibility to focus on life cycle cost and readiness.
3. Operating and support costs are visible at the Program, Service, and DoD level and
managed in conjunction with acquisition investment costs to make life cycle cost
decisions.
4. Sustainment governance influences Defense Acquisition Boards and related weapon
system review forums.
5. Product support is more transparent to the Warfighter, but Warfighters are more
integral to advocating affordable, readiness-based product support objectives.

78
6. Supply chains perform at best-in-class levels and are better integrated for weapon
system management operational outcomes.
7. An enterprise perspective is not limited to the province of a single military Service,
Agency, or information technology backbone.
8. Product support capability assessments are performed at national and global levels,
not with a limited or bifurcated view to public versus private capability.
9. Expanded partnering opportunities drive industry to routinely include life cycle cost
and performance in the design of weapon systems and enable more robust, integrated
industrial base product support.
10. DoD organic organizations are more capable of managing the complex incentives and
integration inherent in effective performance-based strategies.
Accountability and Governance
As noted at the beginning of this report, numerous studies and initiatives have been conducted
but product support remains an issue. What makes this report and its recommendations different
is that it realizes success does not rest in one activity’s efforts, but requires a much larger
perspective and enterprise approach. In general, the ownership of PSAT recommendations and
assignments is straightforwardly assigned to those organizations identified in the first paragraph
of this chapter:
OSD must drive the cultural changes in values, expectations, and work practices through
policy changes and budgetary action to resource those policy changes, with oversight and
governance to ensure continued progress toward the vision
Military Services, who need these changes to execute their Title 10 responsibilities, must
be proactive in the implementation of the PSAT direction and interactive with their
assistance and support of OSD policy changes
Industry, that provides the foundation for design, innovation, and manufacturing, must
provide forward-leaning activist support and provide the bridge that links the design
chain with the supply chain
Supporting Defense Agencies, who are viable supply chain product support providers
and have critical Warfighter support capability within the areas of procurement, inventory
management, distribution, transportation and disposal operations, must work together
with the Military Services and industry for a seamless enterprise approach
Chapter 3 discussed the importance of leadership’s core strategic vision and designing the
structure to easily and readily facilitate alignment, resource allocation, and accelerated
information flows. This overall accountability must rest at one of the highest levels of OSD
AT&L. Without becoming bureaucratic and entangling the Services in redundant executive
steering committees, it is recommended that the PSAT Senior Steering Group be reshaped to
become the PSEC and ensure its membership includes the stakeholders responsible for
implementation. The PSEC will be accountable for implementation of this report and annual
assessments of its progress. It will be critical to integrate this group’s insights into existing
similar executive oversight groups such as the Joint Logistics Board, the Maintenance Executive
Steering Committee, Supply Chain Integration Executive Groups, and Logistics Human Capital

79
Executive Steering Groups. There may be a time when the PSAT’s executive steering can fully
transition and be subsumed within the standing oversight of these or other groups. How these
teams are designed and integrated will be a critical piece of the governance recommendation.
OSD will need to hold the torch high and establish and enforce the standards for life cycle
management. This will also place the onus on OSD to determine how best to balance competing
acquisition vs. logistics priorities. The Military Services (and Defense Agencies) must buy in to
the PSAT recommendations and directions, make them their own, and in many cases step out
and lead without waiting on OSD impetus. The Services must also embrace that increasingly
combat operations are joint in nature—logistics and support operations must follow suit. Industry
must continue being a good national security capability partner, promoting innovation,
responding to competitive pressures, and flowing down competitively-driven incentives through
the supply chain. Together, DoD and industry must recognize there are strengths and weaknesses
to both industrial and organic assets, but the synergy together provides tremendous capability,
capacity, and technology that must be captured for the good of the Warfighter.
Critical Path
Many important initiatives fail by taking on too much, too fast, underestimating the continuing
resource commitment required for success. It is not enough to come up with the great idea. The
idea must be vetted and embraced by a very diverse constituency. Implementation must be
planned, resourced, monitored, and guided if real change is to be effected.
To be successful, this effort must be viewed and managed as a program with time-phased and
prioritized actions. These actions provide the bases for the critical path that dictates the direction,
magnitude, and speed in which to proceed. Without a doubt, the first item on the critical path is
an understanding of where the effort fits on the list of current administration priorities. Without
proper support from senior DoD leadership, this endeavor will become just another good idea not
properly executed and resourced. Therefore, the top priority moving forward will be to secure the
proper commitment from the administration to ensure this good work lives on and produces the
transformation required for the good of our national defense.
There are a number of considerations that determine critical path. The current economic situation
demands, however, that actions with a quick potential return on investment become the priority.
Another consideration will be opportunities that offer potential offsets, adding something but
forgoing an existing effort. While some of these choices will be intuitively obvious, many will
require a detailed review and a formal comparison against other new and existing opportunities.
As discussed in Chapter 3, this will necessarily be a portfolio management approach that enables
the governance structure to make informed enterprise-wide decisions. Once these portfolio
elements are in place, the governance structure can proceed with prioritizing and assigning
responsibilities for the actions necessary to move the product support improvement to its next
level within budgetary constraints.

80
Simply put, the critical path to PSAT success is:
OSD provides strong stakeholder support from the administration
Military Services interpret and implement the report for Service immediate and long-
term use
Industry embraces the intent of PSAT and infuses it in all existing developmental
design and sustainment efforts
Stand up PSEC to monitor and guide the effort

81
Appendix A: PSAT Weapon System Data Analysis
This appendix describes the collection and analysis process used in the final Product Support
Assessment Team (PSAT) report.
Weapon System Population
The PSAT weapon system population (Figure 24) was selected to accomplish two main
objectives:
1. Contain a diverse range of product support strategies to make the analyses options as
broad as possible and minimize the likelihood of bias errors
2. Capture a complete picture of operating and support (O&S) cost, availability data,
and documented support strategies to ensure data-driven analysis and
recommendations
The selected weapon systems accomplish these objectives. Most have seen extensive use in the
last two wars, all represent a solid mix of product support strategies across Services and battle
spaces, and all have relatively complete quantitative and qualitative data pictures available.
Most of the 34 weapon systems are a subset of a larger number suggested by the Services,
though a few weapon systems were added by the PSAT analysts to broaden the overall
population. Due to legacy information systems, and because not all of the data requested is
typically captured by the Services, data gaps existed. Therefore, these 34 weapon systems
represent the entirety of systems for which the PSAT analysts were able to get complete data.
Figure 24: PSAT Weapon System Analyses Used Extensive Cost and Performance Data from
Each of These Weapon Systems
Fixed-Wing Fighter/Attack
F/A-18 C/D F/A-18 E/F
F-117 F-15
F-16 F-22
A-10
Bomber
B-2 B-52
B-1
Fixed-Wing Patrol
AWACS P-3
JSTARS
Fixed-Wing Cargo
C-130 C-5
C-17 KC-135
Rotary Wing
AH-64 A AH-64 D
HH-60 UH-60
MH-60 (Army) SH-60
CH-47 D
Land Assault
AAV Bradley
Stryker M1 FOV (Army)
M1 Abrams
(USMC)
Land Transport
FMTV MTVR
HEMTT HMMWV (Army)
HMMWV (USMC)
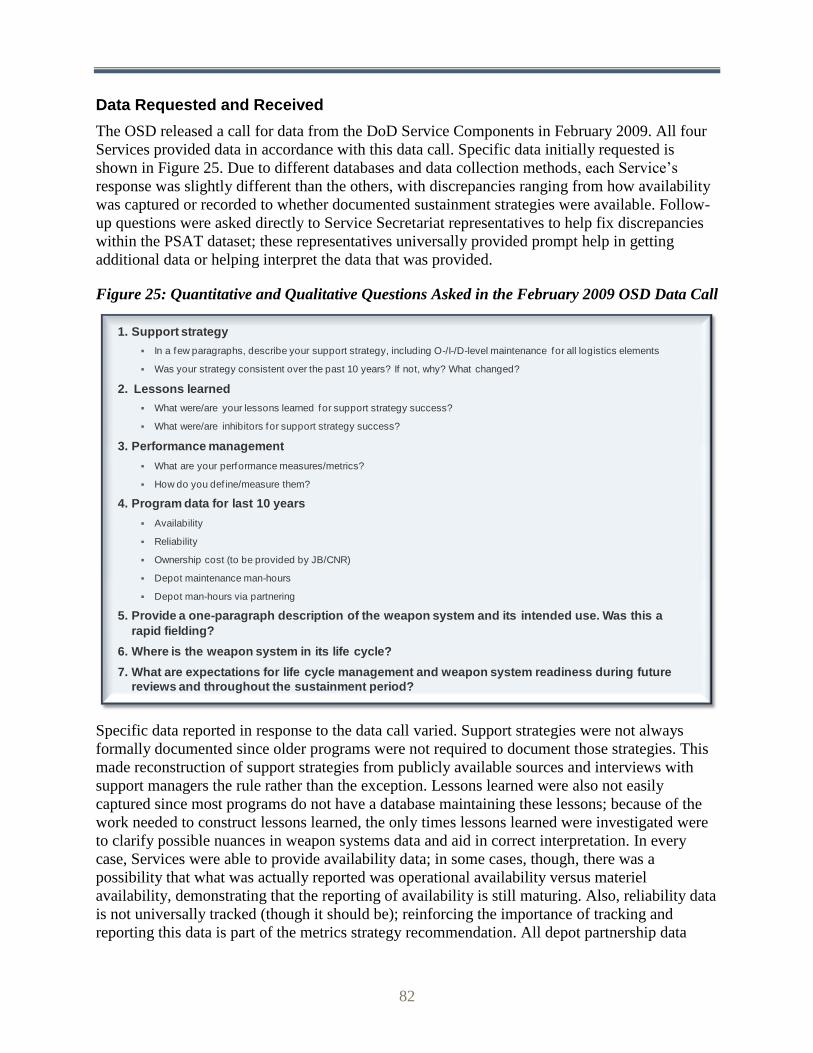
82
Data Requested and Received
The OSD released a call for data from the DoD Service Components in February 2009. All four
Services provided data in accordance with this data call. Specific data initially requested is
shown in Figure 25. Due to different databases and data collection methods, each Service’s
response was slightly different than the others, with discrepancies ranging from how availability
was captured or recorded to whether documented sustainment strategies were available. Follow-
up questions were asked directly to Service Secretariat representatives to help fix discrepancies
within the PSAT dataset; these representatives universally provided prompt help in getting
additional data or helping interpret the data that was provided.
Figure 25: Quantitative and Qualitative Questions Asked in the February 2009 OSD Data Call
Specific data reported in response to the data call varied. Support strategies were not always
formally documented since older programs were not required to document those strategies. This
made reconstruction of support strategies from publicly available sources and interviews with
support managers the rule rather than the exception. Lessons learned were also not easily
captured since most programs do not have a database maintaining these lessons; because of the
work needed to construct lessons learned, the only times lessons learned were investigated were
to clarify possible nuances in weapon systems data and aid in correct interpretation. In every
case, Services were able to provide availability data; in some cases, though, there was a
possibility that what was actually reported was operational availability versus materiel
availability, demonstrating that the reporting of availability is still maturing. Also, reliability data
is not universally tracked (though it should be); reinforcing the importance of tracking and
reporting this data is part of the metrics strategy recommendation. All depot partnership data
1. Support strategy
In a few paragraphs, describe your support strategy, including O-/I-/D-level maintenance for all logistics elements
Was your strategy consistent over the past 10 years? If not, why? What changed?
2. Lessons learned
What were/are your lessons learned for support strategy success?
What were/are inhibitors for support strategy success?
3. Performance management
What are your performance measures/metrics?
How do you def ine/measure them?
4. Program data for last 10 years
Availability
Reliability
Ownership cost (to be provided by JB/CNR)
Depot maintenance man-hours
Depot man-hours via partnering
5. Provide a one-paragraph description of the weapon system and its intended use. Was this a
rapid fielding?
6. Where is the weapon system in its life cycle?
7. What are expectations for life cycle management and weapon system readiness during future
reviews and throughout the sustainment period?

83
came from a database that was only kept from 2002 to 2006, so it was of limited use. But, as
with reliability data, such information can be of extraordinary importance and is part of the focus
of the industrial integration strategy recommendation. Regarding the remaining questions, little
data was collected since end-to-end life cycle product support maps (from acquisition to
retirement) have not been a requirement for programs to develop or maintain.
Databases Used
The Services all provided quantitative data. The Services all authorized access to their O&S
databases to allow the PSAT analysts to collect additional data and to cross-check provided data.
In every case, the data provided by the Services directly was used rather than that pulled from a
database, making the assumption that the data provided by the Services’ expert analyst is more
accurate than that pulled by an external analyst from the Services’ database. All discrepancies
between the two data sources were discussed by the Service representative to understand why the
discrepancies exist, and to highlight the need for an enterprise-spanning data collection and
reporting system. As a supplement to the Services’ databases, the OSD also provided access to
several years worth of Defense Readiness Reporting System (DRRS) reports; this data helped fill
gaps in the dataset that the Services’ database access and interviews with Service experts could
not close. A listing of the databases used is shown in Figure 26.
Figure 26: Several Databases Helped Fill Data Gaps after Conducting the OSD Data Call and
Subsequent Specific Data Requests
Army Operating and Support Management Information System (OSMIS)
Air Force Air Force Total Ownership Cost (AFTOC)
Navy Visibility and Management of Operating and Support Costs (VAMOSC)
USMC Visibility and Management of Operating and Support Costs (VAMOSC)
OSD Defense Readiness Reporting System (DRRS)
Additional Data Sources
As previously mentioned, sustainment strategies often had to be reconstructed based on publicly
available information on how programs are actually being sustained. Specific sources used in this
analysis are listed in the ―Qualitative Data Source‖ and ―Quantitative Data Source‖ columns of
Appendix B.
Analysis Tools Used
All analysis was conducted using Microsoft Excel 2007.
Sustained Readiness Improvement and Sustained Cost Management Overview
The intent of the PSAT weapon system analyses is to understand the product support strategies
that lead to improved readiness. Even divided within respective domains (as was shown in

84
Figure 27), every weapon system is different enough that direct comparison of availability
numbers between programs is difficult and generally irrelevant. This is because every weapon
system has a unique story explaining exactly why its availability numbers are what they are,
including different availability goals and system design aspects, which may preclude higher or
lower availability metrics. Normalization of weapon system availability data was needed to
allow cross-platform comparison, and the normalization method chosen was to examine
how weapon system availability within a domain trended on a year-over-year basis in
comparison to its domain peers.
Figure 27: Program Uniqueness Required a Relative Comparison across Similar Domains
This examination of year-over-year trending with respect to peers required metrics developed for
this analysis called ―Sustained Readiness Improvement‖ (SRI) and ―Sustained Cost
Management‖ (SCM). These metrics are defined in words below.
These metrics are critical for at least three reasons:
1. They show those support strategies that better manage adverse variability—every
weapon system program faces adversity, such as contingency response, fleet
groundings, and insufficient funding, so programs with strategies that manage
variability in O&S and availability better than their peers score higher than those that
do not.
2. They identify support strategies that contribute to year-over-year improvement to cost
and readiness—even when there are few adverse events a program must contend
with, such as a benign steady state between major contingencies, strategies that
influence continual improvement or at least achieve a status quo of static cost and
availability score higher SRI and SCM.
3. They allow comparisons of support strategies by normalizing for Operational Tempo
(OPTEMPO) and domain—within a domain, all assets analyzed by the PSAT weapon
system analysis team tended to experience OPTEMPO changes together, removing
from the analysis equation one of the largest variables that drive availability.
Percent of years during a given interval where a
weapon system experiences either:
– Constant or improved cost per unit usage (e.g., cost per
flight hour, cost per mile, etc.) year-over-year
– Smaller magnitude increase in cost per unit usage than the
domain average year-over-year
Percent of years during a given interval where a
weapon system experiences either:
– Constant or improved availability year-over-year
– Smaller magnitude decrease in availability than the domain
average year-over-year
Sustained Readiness
Improvement
Sustained Cost
Management

85
Sustained Readiness Improvement and Sustained Cost Management Derivation
Sustained Readiness Improvement can be shown graphically in Figure 28. Using the example
weapon system, WS4 availability changes each year and this change is compared to its peers,
WS1, WS2, and WS3. Between 1999 and 2000, WS4 experienced a decrease in availability and
that decrease was greater than the average of its peers, so WS4 was counted as having not
sustained a readiness improvement for that period. Compare this to between 2000 and 2001,
when WS4 saw an improvement in availability and was counted as having sustained a readiness
improvement that period. Jump ahead to between 2003 and 2004, when WS4 saw no change in
availability; this zero-change counted as a sustained readiness improvement period. Finally,
between 2004 and 2005, WS4 saw a decrease in availability, but that decrease was equal to the
average decrease; WS4 also counted a sustained readiness improvement for this period. There
are eight measurement periods across the time frame of 1999 through 2007 and, for six of them,
WS4 demonstrated a sustained readiness improvement. Therefore, the Sustained Readiness
Improvement for WS4 is 75 percent. Sustained Cost Management is derived identically, except
that where decreases in availability greater than a domain’s average yielded no sustained
readiness improvement, increases in cost per unit of usage greater than a domain’s average yield
no sustained cost management for a period.
Figure 28: Sustained Readiness Improvement Is Equivalent to Taking a “First Derivative”
of Availability Data and Allows Comparison of Trends across Weapon System Programs
within a Domain
-0.2
-0.1
0
0.1
0.2
1999 -2000
2000 -2001
2001 -2002
2002 -2003
2003 -2004
2004 -2005
2005 -2006
2006 -2007
∆%
Av
aila
bilit
y
WS Index
WS1
WS2
WS3
WS430%
40%
50%
60%
70%
80%
1999 2000 2001 2002 2003 2004 2005 2006 2007
Av
aila
bilit
y
WS4 Year-over-Year Change
WS4 decrease in readiness was
smaller than its domain average++
+
+ ++
-
-
WS4 saw no change in availability, improved its availability,
or beat the index of its peers in six of eight measuring periods
WS4 Sustained Readiness Improvement = 75%
Weapon
SystemWS4
+ 6
- 2
% Readiness
Improvement75%
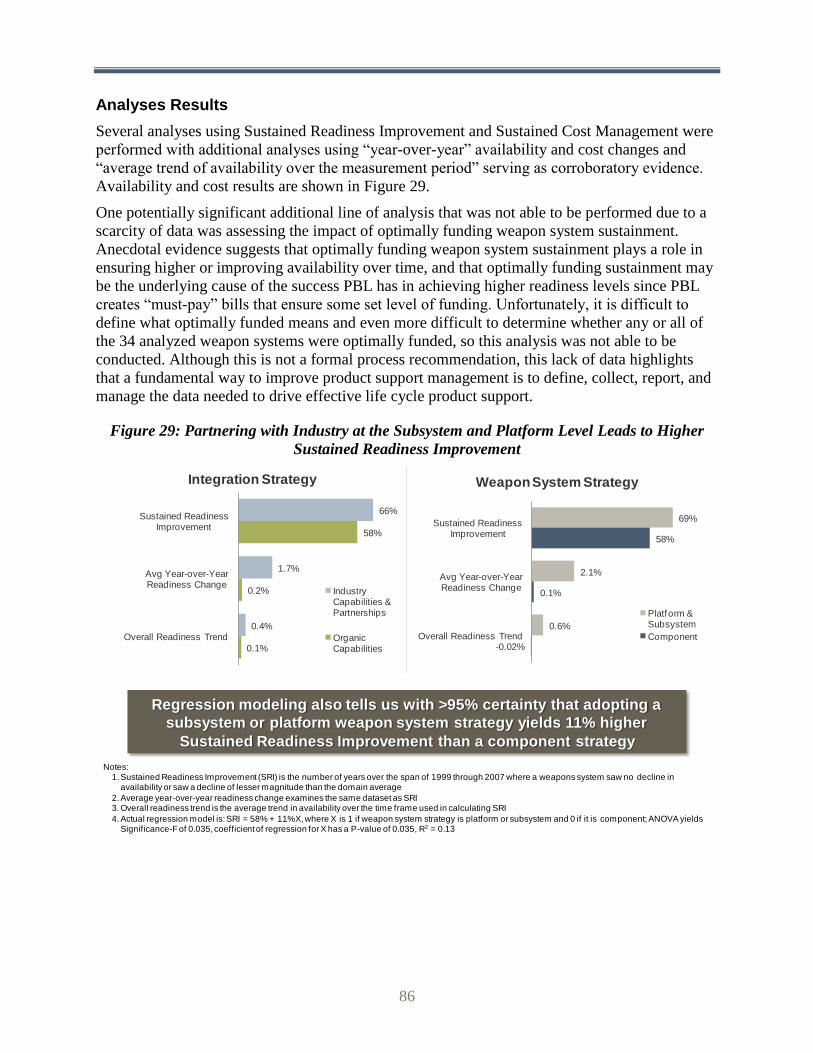
86
Analyses Results
Several analyses using Sustained Readiness Improvement and Sustained Cost Management were
performed with additional analyses using ―year-over-year‖ availability and cost changes and
―average trend of availability over the measurement period‖ serving as corroboratory evidence.
Availability and cost results are shown in Figure 29.
One potentially significant additional line of analysis that was not able to be performed due to a
scarcity of data was assessing the impact of optimally funding weapon system sustainment.
Anecdotal evidence suggests that optimally funding weapon system sustainment plays a role in
ensuring higher or improving availability over time, and that optimally funding sustainment may
be the underlying cause of the success PBL has in achieving higher readiness levels since PBL
creates ―must-pay‖ bills that ensure some set level of funding. Unfortunately, it is difficult to
define what optimally funded means and even more difficult to determine whether any or all of
the 34 analyzed weapon systems were optimally funded, so this analysis was not able to be
conducted. Although this is not a formal process recommendation, this lack of data highlights
that a fundamental way to improve product support management is to define, collect, report, and
manage the data needed to drive effective life cycle product support.
Figure 29: Partnering with Industry at the Subsystem and Platform Level Leads to Higher
Sustained Readiness Improvement
66%
1.7%
0.4%
58%
0.2%
0.1%
Sustained Readiness Improvement
Avg Year-over-Year Readiness Change
Overall Readiness Trend
Integration Strategy
Industry Capabilities & Partnerships
Organic Capabilities
69%
2.1%
0.6%
58%
0.1%
-0.02%
Sustained ReadinessImprovement
Avg Year-over-YearReadiness Change
Overall Readiness Trend
Weapon System Strategy
Platform & Subsystem
Component
Notes:1.Sustained Readiness Improvement (SRI) is the number of years over the span of 1999 through 2007 where a weapons system saw no decline in
availability or saw a decline of lesser magnitude than the domain average
2.Average year-over-year readiness change examines the same dataset as SRI3.Overall readiness trend is the average trend in availability over the time frame used in calculating SRI
4.Actual regression model is: SRI = 58% + 11%X, where X is 1 if weapon system strategy is platform or subsystem and 0 if it is component; ANOVA yields Significance-F of 0.035, coefficient of regression for X has a P-value of 0.035, R2 = 0.13
Regression modeling also tells us with >95% certainty that adopting a
subsystem or platform weapon system strategy yields 11% higher
Sustained Readiness Improvement than a component strategy

87
Figure 30: Systems with Better Sustained Cost Management Used Subsystem and Platform-
Level Partnering Strategies
Looking at just the Sustained Readiness Improvement and Sustained Cost Management metrics,
the points made in the Next-Generation Business Model write-up are shown to be true, as seen in
the following diagrams. Alternative detailed displays of how the weapon system data are aligned
against the various strategies tested are shown below. Detailed rationales of why these weapon
systems are aligned in this manner are contained in Appendix B.
64%
95%
54%
91%
Sustained CostManagement
Avg Year-over-YearCost Control
Integration Strategy
Industry Capabilities & Partnerships
Organic Capabilities
66%
99%
53%
88%
Sustained CostManagement
Avg Year-over-YearCost Control
Weapon System Strategy
Platform & Subsystem
Component
Notes:1.Sustained Cost Management is the number of years over the span of 1999 through 2007 where a weapons system saw no increase in cost per unit usage
or saw a increase of lesser magnitude than the domain average
2.Average year-over-year cost control = 1 – average year-over-year cost change across all weapon systems studied; for example, if a given weapon system saw an average year-over-year cost change of 10% per year, it would have an average year-over-year cost control of 90%, meaning that, for this metric,
higher numbers are better than lower numbers

88
Figure 31: Subsystem and Platform-Level Industry Partnerships Designed to Achieve Target
Outcomes Yield Higher Sustained Readiness Improvement
Figure 32: Subsystem and Platform-Level Industry Partnerships Designed to Achieve Target
Outcomes Manage Cost Best
69%
58%
Platform &Subsystem
Component
Platform and subsystem strategies yield 11% higher sustained readiness than
component
60%
69%
Transactional
OutcomeFocused
Outcome-focused strategies show 9% higher sustained
readiness than transactional
58%
66%
Organic
Industry &Partnering
Industry and partnering strategies show 8% higher
sustained readiness than organic
Notes:1.Sustained Readiness Improvement is the number of years over the span of 1999 through 2007 where a weapon system saw no decline in availability or
saw a decline of lesser magnitude than the domain average
2.F-22, FMTV, MTVR, and Stryker data does not span from 1999 through 2007 due to their newness3.USAF C-130 APU contract awarded to Honeywell in August 2007—not enough time has occurred yet to include it as a partnership for this evaluation
66%
53%
Platform &Subsystem
Component
Platform and subsystem strategies yield 13% higher
sustained cost management than component
54%
64%
Organic
Industry &Partnering
Industry and partnering strategies show 10% higher
sustained cost management than organic
58%
63%
Transactional
OutcomeFocused
Outcome-focused strategies show 5% higher sustained cost management than transactional
Note:1.Sustained Cost Management is the number of years over the span of 1999 through 2007 where a weapon system saw no increase in cost per unit
usage or saw a increase of lesser magnitude than the domain average
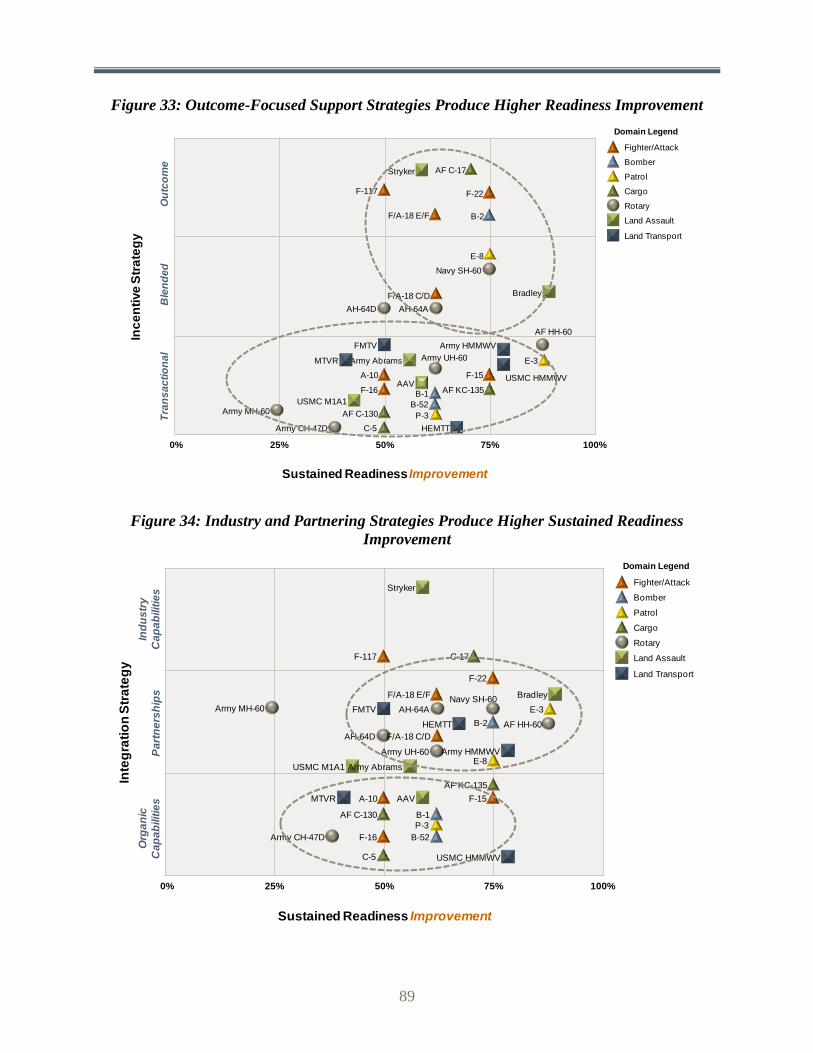
89
Figure 33: Outcome-Focused Support Strategies Produce Higher Readiness Improvement
Figure 34: Industry and Partnering Strategies Produce Higher Sustained Readiness
Improvement
100%0% 25% 50% 75%
Ou
tco
me
Inc
en
tive
Str
ate
gy
B-2
F-117
P-3
A-10
F-16
F/A-18 C/D
E-8
F/A-18 E/F
F-22
B-1
B-52
F-15
E-3
AF KC-135
AF C-130
C-5
Tra
ns
ac
tio
na
lB
len
de
d
AH-64D AH-64A
Navy SH-60
Army UH-60
Army MH-60
Army CH-47D
Bradley
Stryker
Army Abrams
USMC HMMWV
HEMTT
Army HMMWVFMTV
MTVR
AAV
USMC M1A1
AF C-17
AF HH-60
Sustained Readiness Improvement
Bomber
Domain Legend
Patrol
Cargo
Land Assault
Fighter/Attack
Land Transport
Rotary
100%0% 25% 50% 75%
Ind
us
try
Ca
pa
bilit
ies
Inte
gra
tio
n S
tra
teg
y
B-2
F-117
P-3
A-10
F-16
F/A-18 E/F
F-22
B-1
F-15
E-3
Bomber
Domain Legend
Patrol
Cargo
Land Assault
Fighter/Attack
Land Transport
Rotary
C-17
AF KC-135
AF C-130
C-5
Org
an
ic
Ca
pa
bilit
ies
Pa
rtn
ers
hip
s
AH-64D
Navy SH-60
Army UH-60
Army MH-60
Army CH-47D
Stryker
AAV
USMC M1A1 Army Abrams
USMC HMMWV
Army HMMWV
FMTV
MTVR
Bradley
F/A-18 C/D
AH-64A
AF HH-60HEMTT
B-52
E-8
Sustained Readiness Improvement
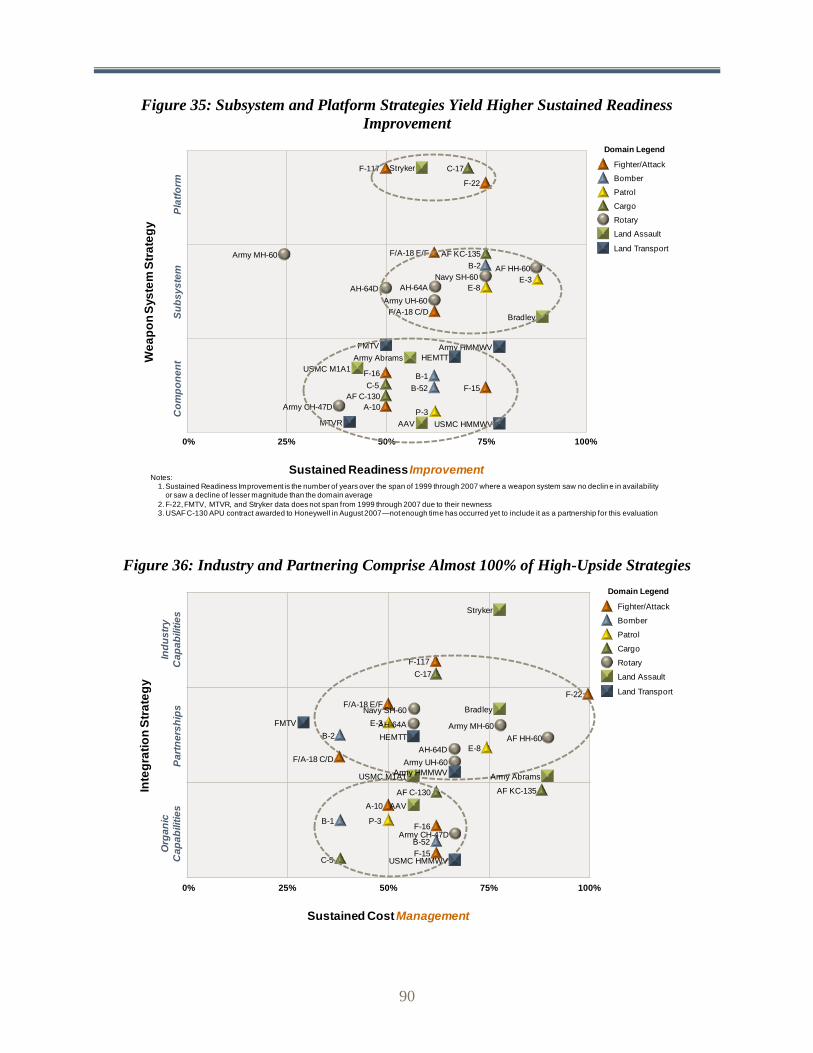
90
Figure 35: Subsystem and Platform Strategies Yield Higher Sustained Readiness
Improvement
Figure 36: Industry and Partnering Comprise Almost 100% of High-Upside Strategies
Notes:1. Sustained Readiness Improvement is the number of years over the span of 1999 through 2007 where a weapon system saw no declin e in availability
or saw a decline of lesser magnitude than the domain average
2. F-22, FMTV, MTVR, and Stryker data does not span from 1999 through 2007 due to their newness3. USAF C-130 APU contract awarded to Honeywell in August 2007—not enough time has occurred yet to include it as a partnership for this evaluation
100%0% 25% 50% 75%
Pla
tfo
rm
We
ap
on
Sys
tem
Str
ate
gy
B-2
F-117
P-3A-10
F-16
F/A-18 E/F
F-22
B-1
F-15
E-3
C-17
AF KC-135
AF C-130
C-5
Co
mp
on
en
tS
ub
sy
ste
m
AH-64D
Navy SH-60
Army UH-60
Army MH-60
Army CH-47D
Stryker
AAV
USMC M1A1
Army Abrams
USMC HMMWV
Army HMMWVFMTV
MTVR
BradleyF/A-18 C/D
AH-64A
AF HH-60
HEMTT
B-52
E-8
Sustained Readiness Improvement
Bomber
Domain Legend
Patrol
Cargo
Land Assault
Fighter/Attack
Land Transport
Rotary
100%0% 25% 50% 75%
B-2
F-117
A-10
F-16
E-8
F-22
B-1
F-15
E-3
C-17
AF KC-135AF C-130
C-5
B-52
Sustained Cost Management
P-3
F/A-18 C/D
F/A-18 E/F
AH-64A
Navy SH-60
AH-64D
Army MH-60
AF HH-60
Army UH-60
Army CH-47D
Stryker
AAV
USMC M1A1 Army Abrams
Bradley
USMC HMMWV
Army HMMWV
FMTV
HEMTT
Inte
gra
tio
n S
tra
teg
y
Ind
us
try
Ca
pa
bilit
ies
Org
an
ic
Ca
pa
bilit
ies
Pa
rtn
ers
hip
s
Bomber
Domain Legend
Patrol
Cargo
Land Assault
Fighter/Attack
Land Transport
Rotary

91
Figure 37: Outcome and Blended Strategy Costs Are at Least as Predictable as Transactional
Figure 38: Subsystem and Platform Strategies Yield Same or Better Cost Management
100%0% 25% 50% 75%
B-2
F-117
A-10F-16
E-8
F-22
B-1
B-52
F-15
E-3
AF KC-135
AF C-130
C-17
P-3
F/A-18 C/D
F/A-18 E/F
C-5
AH-64A AH-64D
AF HH-60
Navy SH-60
ArmyUH-60
Army MH-60
CH-47D
Bradley
Stryker
Army Abrams
AAV
USMC M1A1
USMC HMMWV
HEMTT
Army HMMWVFMTV
Inc
en
tive
Str
ate
gy
Sustained Cost Management
Bomber
Domain Legend
Patrol
Cargo
Land Assault
Fighter/Attack
Land Transport
Rotary
Ou
tco
me
Tra
ns
ac
tio
na
lB
len
de
d
100%0% 25% 50% 75%
Pla
tfo
rm
We
ap
on
Sys
tem
Str
ate
gy
P-3
A-10
E-8
E-3
Co
mp
on
en
tS
ub
sy
ste
m
Stryker
AAV
Note:1. Sustained Cost Management is the number of years over the span of 1999 through 2007 where a weapon system saw no increase in cost per
unit usage or saw a increase of lesser magnitude than the domain average
C-17
AF KC-135
AF C-130
C-5
F/A-18 E/F
F-117F-22
F/A-18 C/D
F-16
F-15
B-52
B-1
B-2
Navy SH-60
AH-64A AH-64D
Army UH-60
AF HH-60
Army CH-47D
Army MH-60
FMTVArmy HMMWV
USMC HMMWV
USMC M1A1
Army AbramsHEMTT
Bradley
Sustained Cost Management
Bomber
Domain Legend
Patrol
Cargo
Land Assault
Fighter/Attack
Land Transport
Rotary

92
Appendix B: PSAT Weapon System Data Sources and Strategy Assignation Rationale
Introduction
Table 4 documents the sources used in the analyses detailed in Appendix A. It explains the
rationale behind each weapon system’s strategy categorization and the qualitative and
quantitative data source used. Hyperlinks to source documents are provided whenever possible
and detailed notes are at the end of this appendix that explain to future analysts how to duplicate
creation of the dataset used in Appendix A’s analyses.
Table 4: Rationale behind Weapon Systems Strategy Category Assignation
Weapon System
Incentive Strategy
Weapon System Strategy
Integration Strategy
Qualitative Data Source
Quantitative Data Source
A-10 Transactional—no outcome-
based contracts identified
Component—no integrated
subsystem or platform-level management
identified
Program Office is the PSI for all
support
Comprehensive literature survey uncovered no
outcome-centric or partnering
strategies
Note 1
AAV Transactional—no outcome-
based contracts identified
Component—no integrated
subsystem or platform-level management
identified
Organic—no industry product
support partnering
identified, though there is a suspect
partnership that ended in 2006
with United Defense where
UDLP uses unutilized USMC
warehouse space to conduct
its work on upgrading AAVs
Comprehensive literature survey uncovered no
outcome-centric strategies
OSD website: http://www.acq.osd.mil/log/mpp/depot_partnerships/Marine_Corps_Snapshot_Synopsis_18_APR_05.pdf
O&S: Note 2 Availability:
DRRS Cost per unit
usage: Note 2

93
Abrams (Army)
Transactional—no outcome-
based contracts identified
Component—no integrated
subsystem or platform-level management
identified
PBP—General Dynamics is completely
refurbishing and upgrading M1A1
MBTs via the Abrams
Integrated Management
contract
Note 6 Comprehensive literature survey uncovered no
outcome-centric strategies
United Press: http://www.upi.com/Security_Industry/2008/09/08/General-Dynamics-
to-refurbish-Abrams-
tanks/UPI-71071220906735/
O&S: OSD data call U.S. Army
response Availability:
OSD data call U.S. Army response
Cost per unit usage: Note 3
(Abrams)
Abrams (USMC)
Transactional—no outcome-
based contracts identified
Component—no integrated
subsystem or platform-level management
identified
PBP—USMC Abrams is being repaired at the
same facility that USA Abrams are being repaired; we suspect it is benefiting from
the Abrams Integrated
Management
Comprehensive literature survey uncovered no
outcome-centric strategies
Verifying PBP assertion with the
USMC
O&S: Note 2 Availability:
DRRS Cost per unit
usage: Note 2
AH-64A Blended—target acquisition designation
sight/pilot night vision sensor (TADS/PNVS)
PBL
Subsystem—target
acquisition designation
sight/pilot night vision sensor (TADS/PNVS)
PBL General Electric
conducts modification, repair, and
overhaul of T700
PBP—depot overhaul and repair PPP
contract for AH-64 A/D common
components
Note 6 TADS/PNVS
source: United Press
http://www.upi.com/Security_Industry/2007/05/11/Lockheed-lands-PBL-
contract-for-Apache/UPI-
83911178917431/ T700 source:
Defense Industry Daily
http://www.defenseindustrydaily.co
m/651m-to-overhaul-t700-
family-helicopter-engines-updated-
0821/ PBP source: OSD
data call army response
O&S: OSD data call U.S. Army
response Availability:
OSD data call U.S. Army response
Cost per unit usage: Note 3
(Apache)

94
AH-64D Blended—target acquisition designation
sight/pilot night vision sensor (TADS/PNVS)
PBL
Subsystem—target
acquisition designation
sight/pilot night vision sensor (TADS/PNVS)
PBL General Electric
conducts modification, repair, and
overhaul of T700
PBP—depot overhaul and repair PPP
contract for AH-64 A/D common
components
Note 6 TADS/PNVS
source: United Press
http://www.upi.com/Security_Industry/2007/05/11/Lockheed-lands-PBL-
contract-for-Apache/UPI-
83911178917431/ T700 source:
Defense Industry Daily
http://www.defenseindustrydaily.co
m/651m-to-overhaul-t700-
family-helicopter-engines-updated-
0821/ PBP source: OSD
data call army response
O&S: OSD data call U.S. Army
response Availability:
OSD data call U.S. Army response
Cost per unit usage: Note 3
(Apache)
B-1 Transactional—no outcome-
based contracts identified
Component—no integrated
subsystem or platform-level management
identified
Organic partnership with
OC-ALC for software support
Comprehensive literature survey uncovered no
outcome-centric or partnering
strategies
Note 1
B-2 Outcome—total systems support
partnership (TSSP) est. 2002, all-
encompassing PBL est. in 2007
Subsystem—total systems
support partnership (TSSP) est. 2002, all-
encompassing PBL est. in 2007
PBP—NG is the PSI for the all encompassing PBL for organic
and industry support
providers that started in 2007
Note 6 Source: Secretary
of Defense Performace
Based Logistics Awards Program for Excellence in
Performace Based Logistics
August 2007 SpaceWar article: http://www.spacewar.com/reports/Northrop_Grumman_Awarded_Contract_To_Implement_More_Efficient_Way_To_Support_B_2_Bomber_9
99.html
Note 1

95
B-52 Transactional—no outcome-
based contracts identified
Component—no integrated
subsystem or platform-level management
identified
Program Office is the PSI for all
support
Note 6 Comprehensive literature survey uncovered no
outcome-centric or partnering
strategies
Note 1
Bradley Blended—Improved Bradley
Acquisition Subsystem
(IBAS) TOW missile launcher
is part of the award for the
Improved Target Acquisition
System (ITAS)
Subsystem—Improved Bradley
Acquisition Subsystem
(IBAS) TOW missile launcher
is part of the award for the
Improved Target Acquisition
System (ITAS)
PBP—Bradley Remanufacture
Program is a partnership with BAE Systems at Red River Army
Depot
Note 6 IBAS source:
Raytheon news release
http://www.prnewswire.com/cgi-
bin/micro_stories.pl?ACCT=910473&TICK=RTNB12&STORY=/www/sto
ry/02-27-2006/0004306551&EDATE=Feb+27
,+2006 Remanufacture: Defense Industry
Daily article http://www.defenseindustrydaily.com/the-us-armys-
bradley-remanufacture-
program-updated-02835/
O&S: OSD data call U.S. Army
response Availability:
OSD data call U.S. Army response
Cost per unit usage: Note 3
(Bradley)
C-5 Transactional—no outcome-
based contracts identified
Component—no integrated
subsystem or platform-level management
identified
Program Office is the PSI for all
support
Note 6 Comprehensive literature survey uncovered no
outcome-centric or partnering
strategies
Note 1
C-17 Outcome—Globemaster III
Sustainment Partnership
Platform—Globemaster III
Sustainment Partnership
Industry—though this is arguably a PBP, Boeing is
the single responsible
entity for performance—its role is actually to determine where workload goes,
including whether it goes
to organic sources of
supply
Note 6 Source: Defense
Industry Daily http://www.defenseindustrydaily.com/did-focus-the-
c17-global-sustainment-partnership-
02756/
Note 1

96
C-130 (Air
Force)
Transactional—no outcome
based contracts identified
Component—no integrated
subsystem or platform level management
identified
Program Office is the PSI for all
support
Note 6 Comprehensive literature survey uncovered no
outcome-centric or partnering
strategies
Note 1
CH-47D Transactional—no outcome-
based contracts identified
Component—no integrated
subsystem or platform-level management
identified
Program Office is the PSI for all
support
Comprehensive literature survey uncovered no
outcome-centric or partnering
strategies
O&S: not required
Availability: DRRS
Cost per unit usage: Note 3
(Chinook)
E-3 AWACS
Transactional—no outcome-
based contracts identified
Subsystem—avionics and
engine life cycle management through the Boeing and
USAF partnership at Oklahoma City
ALC
PBP – Boeing provides
engineering support while the Program Office integrates all
other sustainment
functions
Note 6 Comprehensive literature survey uncovered no
outcome-centric strategies
Source: Integrator USAF newspaper
article http://integrator.hanscom.af.mil/2005/June/06022005/06022005-01.htm
Integration Strategy source: USAF SAF/IEL
Note 1
E-8 JSTARS
Blended—JSTARS Total
Systems Support Responsibility
(TSSR) partnership between the USAF and Northrop
Grumman, but much of the
aircraft is transactional
Subsystem—JSTARS Total
Systems Support
Responsibility (TSSR)
partnership between the USAF and Northrop
Grumman; NG is PSI on multiple
subsystems
PBP—JSTARS Total Systems
Support Responsibility
(TSSR) partnership between the USAF and Northrop
Grumman; NG is PSI on multiple
subsystems
Department of Defense Awards
Program for Excellence in Performace
Based Logistics Nomination, 5 August 2005
Note 1
F-15 Transactional—no outcome-
based contracts identified
Component—no integrated
subsystem or platform-level management
identified
Program Office is the PSI for all
support
Note 6 Comprehensive literature survey uncovered no
outcome-centric or partnering
strategies
Note 1

97
F-16 Transactional—no outcome-
based contracts identified
Component—no integrated
subsystem or platform-level management
identified
Program Office is the PSI for all
support
Comprehensive literature survey uncovered no
outcome-centric or partnering
strategies
Note 1
F/A-18 C/D
Blended—Honeywell APU and GE F404
engine are incentivized on availability, but
much of the aircraft is
transactional
Subsystem—Honeywell APU,
GE F404 engine, and tires are all managed
as discrete entities to drive overall F/A-18 C/D availability
PBP—there is a combination of industry and
organic partners responsible for
the aircraft
F404 source: NAVICP PBL training deck
http://www.acquisition.gov/comp/aap/documents/Appendices/APPENDI
X%2012%20-%20NavyPBL505
05.pdf APU source:
NAVICP Honeywell APU
case study http://www.dtic.mil/ndia/2001system
s/tonoff.pdf
O&S: Note 4 Availability:
NAVAIR provided data,
May 2009 Cost per unit
usage: Note 5
F/A-18 E/F
Outcome—Honeywell, APU, GE F404; Boeing
F/A-18 FIRST manages
majority of the rest of the airframe
Subsystem—Honeywell, APU,
GE F404, Michelin and LMCO tires;
Boeing F/A-18 FIRST manages majority of the
rest of the airframe
PBP—Boeing manages much of the aircraft,
with GE managing
engines and Honeywell
managing APUs, but major sources of
supply are the organic depots
Note 6 F/A-18 FIRST source: Navy
Enterprise website
http://www.navyenterprise.navy.mil/
stories/fa-18-super-hornet-
celebrates.aspx F404 source: NAVICP PBL training deck
http://www.acquisition.gov/comp/aap/documents/Appendices/APPENDI
X%2012%20-%20NavyPBL505
05.pdf APU source:
NAVICP Honeywell APU
case study http://www.dtic.mil/ndia/2001system
s/tonoff.pdf
O&S: Note 4 Availability:
OSD data call US Navy response
Cost per unit usage: Note 5

98
F-22 Outcome—Follow-on Agile Sustainment for
the Raptor (FASTeR); the
engine contract is called
Sustainment Program for the Raptor Engine
(SPaRE)
Platform—Follow-on Agile Sustainment for
the Raptor (FASTeR); the engine contract
is called Sustainment
Program for the Raptor Engine (SPaRE) and uses organic
and contractor sources of
supply
PBP—There are two PBP's; one for the engine with P&W and OC ALC, and
one for the airframe with OO ALC. LMA is the
PSI and has supply support and sustaining engineering, other product
support functions. Current
approach through the BCA is a partnership
where maintenance is
organic and product support
is blended.
Source: OSD data call USAF
response, USAF SAF/IEL
Note 1
F-117 (this
system is retired)
Outcome— F-117 Total
System Support Partnership
(TSSP) award fee was based on
performance outcomes
Platform— F-117 TSSP
placed Lockheed Martin responsible for most elements
of F-117 sustainment
Industry— F-117 TSSP
placed Lockheed Martin
responsible for most elements of
F-117 sustainment
Source: USAF brief on F-117
PBL https://acc.dau.mil/GetAttachment.aspx?id=46633&pname=file&aid=13906&lang=en-US
Note 1
FMTV Transactional—no outcome-
based contracts identified
Component—no integrated
subsystem or platform-level management
identified
PBP—family of medium tactical vehicles reset
program at Stewart &
Stevenson in Sealy, Texas
Note 6 Comprehensive literature survey uncovered no
outcome-centric strategies
Source: Army Logistician magazine
http://www.almc.army.mil/alog/issues/SepOct05/resetf
mtv.html
O&S: OSD data call U.S. Army
response Availability:
OSD data call U.S. Army response
Cost per unit usage: Note 3 (MTV Series)
HEMTT Transactional—no outcome-
based contracts identified
Component—no integrated
subsystem or platform-level management
identified
PBP—Red River Army Depot and Oshkosh Truck
Corporation partnership to remanufacture
HEMTTs
Source: Global Security
http://www.globalsecurity.org/military/library/news/2006
/10/mil-061002-arnews03.htm
O&S: not required
Availability: DRRS
Cost per unit usage: Note 3
(HEMTT Series)

99
HH-60 Transactional—no outcome-
based contracts identified
Subsystem—General Electric
conducts modification, repair, and
overhaul of T700
PBP—General Electric conducts
modification, repair, and overhaul of
T700; Sikorsky provides parts and kits to the Corpus Christi Army Depot
Pavehawk (HH-60) repair line
Comprehensive literature survey uncovered no
outcome-centric strategies
T700 source: Defense Industry
Daily http://www.defenseindustrydaily.co
m/651m-to-overhaul-t700-
family-helicopter-engines-updated-
0821/ Sikorsky—CCAD
partnership Source: Army
Business Transformation
Knowledge Center article
http://armybtkc.army.mil/docs/CorpusChristi_000.pdf
Note 1
HMMWV (Army)
Transactional—no outcome-
based contracts identified
Component—no integrated
subsystem or platform-level management
identified
PBP—customer pay agreement
between AM General LLC and
DLA for recapitalization
at Red River Army Depot, Letterkenny
Army Depot, and Maine Military
Authority
Comprehensive literature survey uncovered no
outcome-centric strategies
Source: DSCC DLA website
http://www.dscc.dla.mil/offices/land/
custops.html
O&S: not required
Availability: DRRS
Cost per unit usage: Note 3
(HMMWV Series)

100
HMMWV (USMC)
Transactional—no outcome-
based contracts identified
Component—no integrated
subsystem or platform-level management
identified
Organic—though DSCC DLA Integrated Logistics
Partnership Division, which
manages customer pay, states on its
website that it is participating in
the multiple award schedule
for USMC HMMWV, this is
probably still organically supported
Comprehensive literature survey uncovered no
outcome-centric strategies
Source: DSCC DLA website
http://www.dscc.dla.mil/offices/land/
custops.html
O&S: Note 2 Availability:
DRRS Cost per unit
usage: Note 2
KC-135 Transactional—no outcome-
based contracts identified
Might be platform but
considering it to be a subsystem strategy in case
only major portions of the
plane are worked on
during PDM—entire plane
used to take 214 days to make it
through contractor
vendor repair line but is now
taking 175 days or less to
complete PDM, which directly
raises availability numbers
Program Office is the PSI—
according to the USAF, the relationship
between Boeing, and the USAF, under the KC-
135 Programmed
Depot Maintenance program, is
transactional
Note 6 Comprehensive literature survey uncovered no
outcome-centric strategies
Source: OSD data call, USAF
SAF/IEL response and Boeing
Frontiers online http://www.boeing.com/news/frontiers/archive/2006/a
pril/i_ids1.html
Note 1

101
MH-60 (Army)
Transactional—no outcome-
based contracts identified
Subsystem—General Electric
conducts modification, repair, and
overhaul of T700
PBP—DynCorp conducts
organization-level,
intermediate, and depot-level
aviation maintenance,
special repairs, and servicing of
electronic components
Note 6 Comprehensive literature survey uncovered no
outcome-centric strategies
Source: Business Wire
http://findarticles.com/p/articles/mi_m0EIN/is_2009_Feb_12/ai_n31349
972/ T700 source:
Defense Industry Daily
http://www.defenseindustrydaily.co
m/651m-to-overhaul-t700-
family-helicopter-engines-updated-
0821/
O&S: OSD data call U.S. Army
response Availability:
OSD data call U.S. Army response
Cost per unit usage: Note 3 (rather than MDS Name, the specific asset was identified)
(MDS = MH-60K)
MTVR Transactional—no outcome-
based contracts identified
Component—no integrated
subsystem or platform-level management
identified
Program Office is the PSI for all
support
Comprehensive literature survey uncovered no
outcome-centric or partnering
strategies
O&S: not collected
Availability: DRRS
Cost per unit usage: not calculated
P-3 Orion Transactional—no outcome-
based contracts identified
Component—no integrated
subsystem or platform-level management
identified
Program Office is the PSI for all
support
Comprehensive literature survey uncovered no
outcome-centric or partnering
strategies
O&S: Note 4 Availability:
NAVAIR provided data,
May 2009 Cost per unit
usage: Note 5

102
SH-60 Blended—only tip-to-tail and
FLIR contracts are outcome-
based—all other maintenance is transactional
Subsystem—tip-to-tail, FLIR,
T700
PBP—tip-to-tail and FLIR both partner with
depots to conduct repairs
Source: NAVAIR H-60 PBL
presentation https://acc.dau.mil/GetAttachment.aspx?id=46624&pname=file&aid=13897&lang=en-US
T700 source: Defense Industry
Daily http://www.defenseindustrydaily.co
m/651m-to-overhaul-t700-
family-helicopter-engines-updated-
0821/
O&S: Note 4 Availability:
NAVAIR provided data,
May 2009 Cost per unit
usage: Note 5
Stryker Outcome—the Stryker CLS was responsible for all
levels of maintenance and supply support—
it had an operational
readiness rate requirement of
≥90%
Platform—the Stryker CLS was responsible for
all levels of maintenance and supply
support
Industry—The Stryker CLS was responsible for all planned and
unplanned maintenance at all levels; as of 2008, Stryker CLS started
transitioning to organic providers
for all unscheduled maintenance
Source: OSD data call U.S. Army
response
O&S: OSD data call U.S. Army
response Availability:
DRRS Cost per unit usage: Note 3
(Stryker)
UH-60 Transactional—no outcome-
based contracts identified
Subsystem—General Electric
conducts modification, repair, and
overhaul of T700
PBP—General Electric conducts
modification, repair, and
overhaul of T700
Comprehensive literature survey uncovered no
outcome-centric strategies
T700 source: Defense Industry
Daily http://www.defenseindustrydaily.co
m/651m-to-overhaul-t700-
family-helicopter-engines-updated-
0821/
O&S: not required
Availability: DRRS
Cost per unit usage: Note 3 (Blackhawk)
Notes
1. USAF O&S and availability data from AFCAP data downloaded February 2009; cost
per unit usage uses AFCAP data elements ―Missing ICS CY‖ and CAIGS CY_1_1,
103
CY_1_2, CY_1_3, CY_2_1, CY_2_2, CY_2_3, CY_2_4, CY_2_5, CY_3_3,
CY_4_1, CY_4_2, CY_4_3, CY_4_4, CY_5_1, CY_5_2, CY_5_3, CY_6_1,
CY_6_3, CY_6_4, CY_6_5, CY_6_6, CY_7_1, CY_7_2) divided by ―Hours—Total‖
2. All USMC Ground O&S cost comes from VAMOSC and equals the summation of
―Regular RAC Parts_Total Parts Cost,‖ ―Deployed Parts_Total Parts Cost,‖ ―Regular
Labor Cost_Total Labor Cost,‖ ―Deployed Labor Cost_Total Labor Cost,‖ and
―Depot Cost‖; USMC ground cost per unit usage is [Average Unit OPTEMPO *
Inventory]/[Ground O&S]
3. U.S. Army cost per unit usage is from Army OSMIS SSF O&S Class IX Summary,
where the parameters are:
Time frame = 1999–2008
Weapon system is selected using MDS name and displayed in the table above in
this format = ―Note 3 [Insert MDS name here]‖
Organization = All MACOMS
All quarters and all MACOMS are summed; all dollars are 2009 dollars
4. Naval Aviation O&S from VAMOSC using the folder named ―ATMSR (97–
Present)‖ and constant 2008 dollars
5. Naval Aviation cost per unit usage uses the sum of CAIGs 1, 2, 3, 4, 5, and 6, divided
by the sum of regular and FRS ―Total Annual Flying Hours‖
6. Service sustainment strategy data was provided, but additional information was
needed to develop determine overall strategy
7. Performance Based Partnership (PBP) is a partnership where there is a defined formal
performance expectation between at least two organizations, where one partner
performs any relevant product support function that complements the functions
performed by the other partners

104
Appendix C: Product Support Business Model Detailed Elements
Introduction
Tables 6 through 12 document the initial supporting details of the product support business
model (PSBM). These details use the Product Support Decision Matrix of Figure 11 as a
reference and amplify key facets of the PSBM; these tables are not all-inclusive nor are they
complete, since the PSBM will be refined and defined in much greater detail during its
recommendation implementation. Table 5 provides an overview of the tables containing these
supporting details.
Table 5: Overview and Contents
Term Definition
Table 6: Target Metrics (Outcome Objectives)
Outcome metrics that programs using a given strategy should use to measure their performance—Required (R), Optional (O), Not Applicable (N/A)
Table 7: Representative Example Rationales
Example situations to alert decision makers that particular product support strategies should be considered
Table 8: Product Support Roles
Product support tasks required for all strategies and the most likely task provider for a given strategy—Government (G), Industry (D), Best Value (BV)
Table 9: Government and Industry Incentives
Benefits Government and Industry will see by adopting a given strategy
Table 10: Product Support Integrator Responsibility
Specific outcomes for which Product Support Integrator is responsible
Table 11: Analytic Tools Approach
Type of decision making tool or decision-making cadence that will provide best life cycle product support outcomes

105
Table 6: Target Metrics (Outcome Objectives)
Legend
R = Required O = Optional N/A = Not Applicable
Strategy
Sys
tem
Mat
erie
l &
Op
erat
ion
al
Ava
ilab
ility
Sys
tem
Mat
erie
l
Rel
iab
ility
Sys
tem
O&
S C
ost
No
n-M
issi
on
Cap
able
Su
pp
ly
No
n-M
issi
on
Cap
able
Mai
nte
nan
ce
Mis
sio
n C
apab
le R
ate
Dep
ot
Flo
w D
ays
Qu
alit
y D
iscr
epan
cy
Rat
e
Su
bsy
stem
Mat
erie
l
Ava
ilab
ility
Su
bsy
stem
Mat
erie
l
Rel
iab
ility
Su
bsy
stem
O&
S C
ost
Ord
er F
ulf
illm
ent
Cyc
le T
ime
Rep
air
Tu
rn A
rou
nd
Tim
e
Dem
and
Pla
n
Acc
ura
cy
Mea
n T
ime
Bet
wee
n
Fai
lure
s
Inve
nto
ry T
urn
s
1.1 Industry-Centric Platform R R R O O O N/A O O O O O O O N/A N/A
1.2 Blended DoD-Industry Platform R R R O O O N/A O O O O O O O N/A N/A
1.3 DoD-Centric Platform R R R O O O R O O O O O O O N/A N/A
2.1 Industry-Centric Subsystem N/A N/A N/A O N/A N/A N/A O R R R O O O O N/A
2.2 Blended DoD-Industry Subsystem N/A N/A N/A O N/A N/A N/A O R R R O O O O N/A
2.3 DoD-Centric Subsystem N/A N/A N/A O N/A N/A R O R R R O O O O N/A
3.1 Industry-Centric Component N/A N/A N/A O N/A N/A N/A O N/A N/A N/A R N/A N/A O N/A
3.2 Blended DoD-Industry Component N/A N/A N/A O N/A N/A N/A O N/A N/A N/A R N/A R O R
3.3 DoD-Centric Component N/A N/A N/A O N/A N/A N/A O N/A N/A N/A R N/A R O R

106
Table 7: Representative Example Rationales
Strategy
Sat
isfy
Co
re a
nd
50
-
50 W
ork
load
Req
uir
emen
ts
Ro
bu
st G
ove
rnm
ent
Infr
astr
uct
ure
Ro
bu
st In
du
stry
Infr
astr
uct
ure
Sig
nif
ican
t
Ob
sole
scen
ce &
DM
S/M
S Is
sues
Co
mm
on
Su
bsy
stem
Acr
oss
Mu
ltip
le
Pla
tfo
rms
Inve
nto
ry In
vest
men
t
Req
uir
ed B
ut
Inve
nto
ry is
Exp
ensi
ve, s
o
Go
vern
men
t
Inve
stm
ent
is N
eed
ed
Co
mm
on
ly U
sed
Co
mm
erci
al
Co
mm
od
itie
s
1.1 Industry-Centric Platform X
1.2 Blended DoD-Industry Platform X X X X
1.3 DoD-Centric Platform X X X
2.1 Industry-Centric Subsystem X X
2.2 Blended DoD-Industry Subsystem X X X X X
2.3 DoD-Centric Subsystem X X X X
3.1 Industry-Centric Component X X
3.2 Blended DoD-Industry Component X X X X X
3.3 DoD-Centric Component X X X X
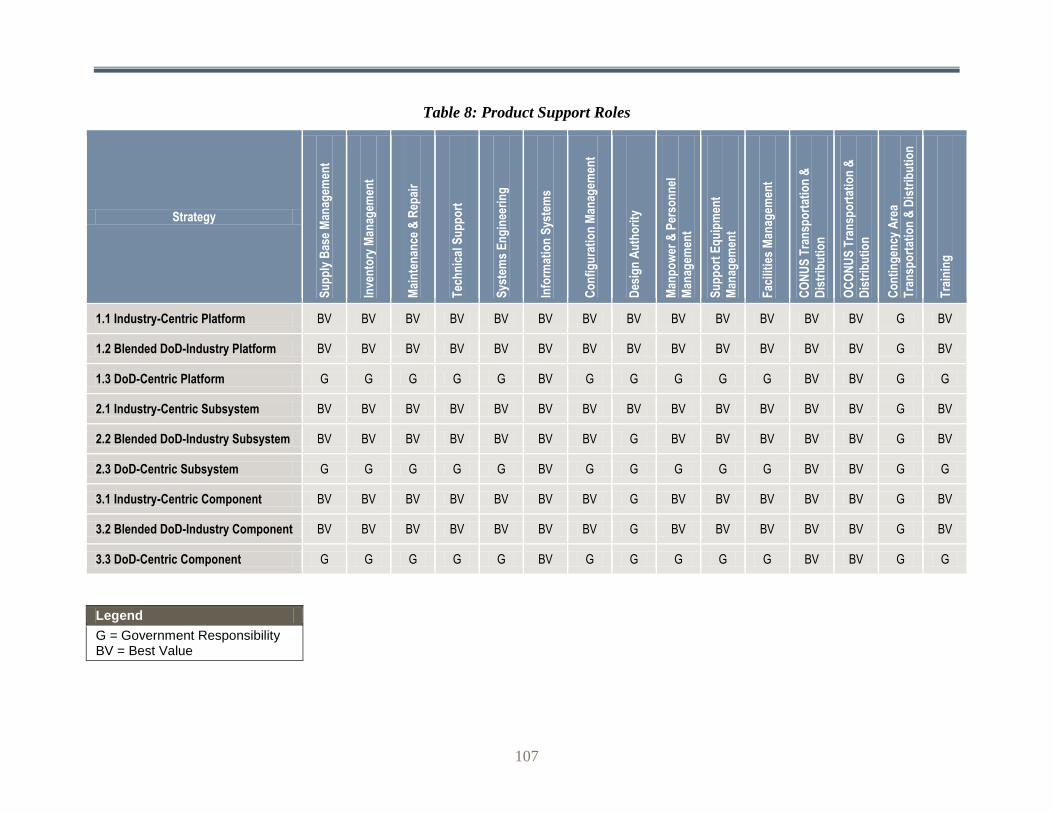
107
Table 8: Product Support Roles
Strategy
Su
pp
ly B
ase
Man
agem
ent
Inve
nto
ry M
anag
emen
t
Mai
nte
nan
ce &
Rep
air
Tec
hn
ical
Su
pp
ort
Sys
tem
s E
ng
inee
rin
g
Info
rmat
ion
Sys
tem
s
Co
nfi
gu
rati
on
Man
agem
ent
Des
ign
Au
tho
rity
Man
po
wer
& P
erso
nn
el
Man
agem
ent
Su
pp
ort
Eq
uip
men
t
Man
agem
ent
Fac
iliti
es M
anag
emen
t
CO
NU
S T
ran
spo
rtat
ion
&
Dis
trib
uti
on
OC
ON
US
Tra
nsp
ort
atio
n &
Dis
trib
uti
on
Co
nti
ng
ency
Are
a
Tra
nsp
ort
atio
n &
Dis
trib
uti
on
Tra
inin
g
1.1 Industry-Centric Platform BV BV BV BV BV BV BV BV BV BV BV BV BV G BV
1.2 Blended DoD-Industry Platform BV BV BV BV BV BV BV BV BV BV BV BV BV G BV
1.3 DoD-Centric Platform G G G G G BV G G G G G BV BV G G
2.1 Industry-Centric Subsystem BV BV BV BV BV BV BV BV BV BV BV BV BV G BV
2.2 Blended DoD-Industry Subsystem BV BV BV BV BV BV BV G BV BV BV BV BV G BV
2.3 DoD-Centric Subsystem G G G G G BV G G G G G BV BV G G
3.1 Industry-Centric Component BV BV BV BV BV BV BV G BV BV BV BV BV G BV
3.2 Blended DoD-Industry Component BV BV BV BV BV BV BV G BV BV BV BV BV G BV
3.3 DoD-Centric Component G G G G G BV G G G G G BV BV G G
Legend
G = Government Responsibility BV = Best Value

108
Table 9: Government and Industry Incentives
Strategy Government Industry
1.1 Industry-Centric Platform
Ties remuneration to outcomes Incentivizes increased reliability
Guarantees all service levels
Enhanced tie between acquisition and sustainment
Opportunity to invest current profit to reduce cost for increased future profit
Opportunity to leverage technical expertise to improve support at reduced cost
Build long-term business relationship with customer
1.2 Blended DoD-Industry Platform
Uses and develops core capabilities
Satisfies 50-50 workload
Reduces unnecessary excess Government capacity
Guarantees some service levels
Enhanced tie between acquisition and sustainment
Opportunity to invest current profit to reduce cost for increased future profit
Opportunity to leverage technical expertise to improve support at reduced cost
Build long-term business relationship with customer
1.3 DoD-Centric Platform
Uses and accelerates development of core capabilities
Satisfies 50-50 workload Reduces unnecessary excess Government capacity
Full funding control
Authorized to invest in improvements
Able to share savings or award incentives with organic and industry providers
Transactional revenue from product support
2.1 Industry-Centric Subsystem
Ties Remuneration to outcomes
Incentivizes Increased reliability
Guarantees contracted subsystem service levels
Enhanced tie between acquisition and sustainment
Opportunity to invest current profit to reduce cost for increased future profit
Opportunity to leverage technical expertise to improve support at reduced cost
Build long-term business relationship with customer
2.2 Blended DoD-Industry Subsystem
Uses and develops core capabilities
Satisfies 50-50 workload
Reduces unnecessary excess Government capacity
Guarantees some service levels
Enhanced tie between acquisition and sustainment
Opportunity to invest current profit to reduce cost for increased future profit
Opportunity to leverage technical expertise to improve support at reduced cost
Build long-term business relationship with customer
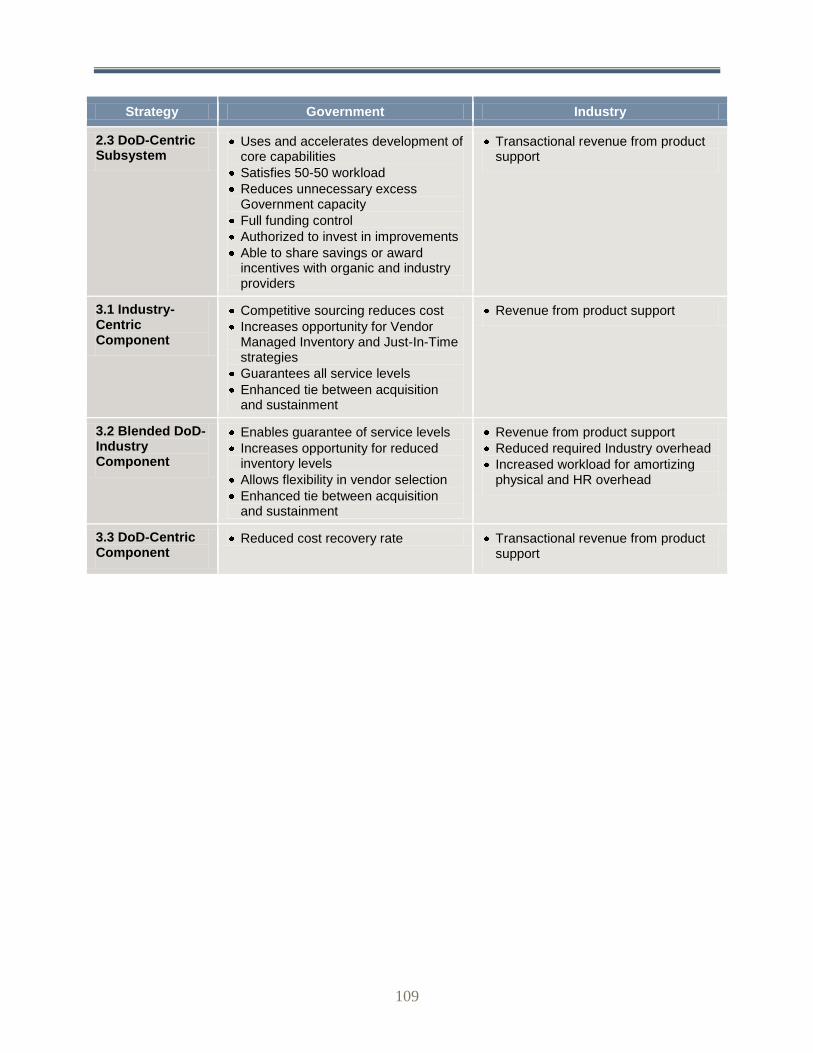
109
Strategy Government Industry
2.3 DoD-Centric Subsystem
Uses and accelerates development of core capabilities
Satisfies 50-50 workload
Reduces unnecessary excess Government capacity
Full funding control
Authorized to invest in improvements
Able to share savings or award incentives with organic and industry providers
Transactional revenue from product support
3.1 Industry-Centric Component
Competitive sourcing reduces cost
Increases opportunity for Vendor Managed Inventory and Just-In-Time strategies
Guarantees all service levels
Enhanced tie between acquisition and sustainment
Revenue from product support
3.2 Blended DoD-Industry Component
Enables guarantee of service levels
Increases opportunity for reduced inventory levels
Allows flexibility in vendor selection
Enhanced tie between acquisition and sustainment
Revenue from product support
Reduced required Industry overhead
Increased workload for amortizing physical and HR overhead
3.3 DoD-Centric Component
Reduced cost recovery rate Transactional revenue from product support

110
Table 10: Product Support Responsibility
Strategy Outcomes For Which PSIs Are Responsible
1.1 Industry-Centric Platform
System sustainment, performance, and cost outcomes as specified in the Performance Based Agreements
Working directly with, monitoring, and evaluating the Industry product support provider
1.2 Blended DoD-Industry Platform
System sustainment, performance, and cost outcomes as specified in the Performance Based Agreements
Working through, monitoring, and evaluating a single Government or Industry product support provider
Enterprise and capability integration using one or more Government and Industry product support providers
1.3 DoD-Centric Platform
System sustainment, performance, and cost outcomes as specified in the Performance Based Agreements
Working directly with the Government product support provider
2.1 Industry-Centric Subsystem
System sustainment, performance, and cost outcomes as specified in the Performance Based Agreements
Working with, monitoring, and evaluating multiple Industry and any number of, including zero, Government subsystem product support providers
Enterprise and capability integration using one or more Government and Industry product support providers
2.2 Blended DoD-Industry Subsystem
System sustainment, performance, and cost outcomes as specified in the Performance Based Agreements
Working with, monitoring, and evaluating multiple Industry and Government subsystem product support providers
Enterprise and capability integration using one or more Government and Industry product support providers
2.3 DoD-Centric Subsystem
System sustainment, performance, and cost outcomes as specified in the Performance Based Agreements
Working with, monitoring, and evaluating multiple Government and any number of, including zero, Industry subsystem product support providers
Enterprise and capability integration using one or more Government and Industry product support providers
3.1 Industry-Centric Component
Overall system performance to an agreed on outcomes and cost
Working with, monitoring, and evaluating multiple Industry and any number of, including zero, Government component providers
Enterprise and capability integration using one or more Government and Industry product support providers

111
Strategy Outcomes For Which PSIs Are Responsible
3.2 Blended DoD-Industry Component
Overall system performance to an agreed on outcomes and cost
Working with, monitoring, and evaluating multiple Industry and Government component providers
Enterprise and capability integration using one or more Government and Industry product support providers
3.3 DoD-Centric Component
Overall system performance to an agreed on outcomes and cost
Working with, monitoring, and evaluating multiple Government and any number of, including zero, Industry component providers
Enterprise and capability integration using one or more Government and Industry product support providers

112
Table 11: Analytic Tools Approach
Strategy Probable Periodically Used Analytic Tools
1.1 Industry-Centric Platform
Business Case Analysis
Equal or better value proposition
1.2 Blended DoD-Industry Platform
Business Case Analysis
Equal or better value proposition
1.3 DoD-Centric Platform
Periodic In-Service Reviews
Best Value Analysis where possible change to the product support strategy is indicated
2.1 Industry-Centric Subsystem
Business Case Analysis
Equal or better value proposition
2.2 Blended DoD-Industry Subsystem
Business Case Analysis
Equal or better value proposition
2.3 DoD-Centric Subsystem
Periodic In-Service Reviews
Best Value Analysis where possible change to the product support strategy is indicated
3.1 Industry-Centric Component
Business Case Analysis
Equal or better value proposition
3.2 Blended DoD-Industry Component
Business Case Analysis
Equal or better value proposition
3.3 DoD-Centric Component
Periodic In-Service Reviews
Best Value Analysis where possible change to the product support strategy is indicated
113
Appendix D: Product Support Cost Estimation Methodology
This appendix explains how the cost of product support was calculated using Logistics Cost
Baseline data. Note that this cost is from the Operations & Maintenance (O&M) and
Military Personnel (MilPers) budget requests only and does not include costs resident in
the Procurement or Research, Development, Test & Evaluation (RDT&E) budget requests. This means that the total product support cost identified later in this appendix should be thought
of as at least $132 billion.
This appendix is intended to enable analysts to estimate the cost for weapon system product
support in future years and assumes the reader has some familiarity with the President’s Budget
Request budget exhibits, though does not require that the reader have expert knowledge. Due to
the non-granular nature of the exhibits used to estimate this cost, this estimate should be refined
in future calculations as higher fidelity information is made available to DoD analysts. The
principal opportunity for improvement is discussed later in this appendix.
Elements of Product Support
Product support cost is a subset of the Logistics Cost Baseline, which is calculated by the DUSD
(L&MR). Accordingly, the product support cost estimate consists of a selection of logistics cost
baseline elements. The elements that comprise product support are summarized in Figure 39.
Due to the high-level nature of the data provided by the Services’ comptrollers, product support
elements must be summarized or ―rolled up‖ to enable categorization of OP-32 line items into
product support categories.

114
Figure 39: Product Support Cost Framework
Product Support Cost Estimation Data
Product support cost estimation requires a variety of data sources and assumptions, which are
described in Table 12.
DUSD (L&MR) analysis depends on OP-32 line items provided by the Services’ comptrollers,
on personnel cost estimates extracted from the O&M (for civilian personnel) and MilPers DoD
President’s Budget Requests, and on estimates of logistics workforce composition provided by
Logistics Management Institute (LMI).
Note that the OP-32 line items the DUSD (L&MR) receives are summed from all of the OP-32
line items provided by the Services in their budget requests. Better estimates of the Logistics
Cost Baseline and product support costs will be achievable when OP-32 line items are provided
in an analyzable format such as MS Excel and are detailed by Subactivity Group (SAG) and
Service O&M budget request. This will allow better categorization of costs identified in OP-32
line items to various logistics categories since the logistics composition of SAGs varies.
Additionally, Service and Agency working capital fund budget documentation provides cost
recovery rates or similar percentages used to estimate management versus direct product support
costs.
Product Support ElementProduct Support Rolled
up Element
Materiel Management
Materiel and Maintenance
Management
Maintenance Management
Technical Data Management
Configuration Management
Systems Engineering
Failure Reporting and Analysis
Industrial Engineering
Maintenance Training
Maintenance Maintenance Operations
Cataloging
Item and Inventory
Management
Inventory Management
Warehousing
Inventory Management Training
Direct Material Spend Inventory Direct Spend
Distribution ManagementDistribution Management
Distribution Training
Distribution Distribution Operations
Product Support Total
Non Product Support Maintenance
Non Product Support Supplies
Non Product Support Transportation
Non-Attributable IT
Other
Product Support
Elements rolled up
to match available
data granularity
Product Support
Elements f rom the
1999 Product
Support Def inition
Log Cost Baseline
Elements not part
of Product Support
Indirect costs such
as sustaining
engineering,
conf iguration
management, etc.
Direct costs, such
as actual ―wrench
turning,‖ or for
inventory or
transportation,
price paid by DoD
to a vendor for
goods or services
Non-Product Support
Examples:• Microcomputers,
printers, etc.• MREs, medical
supplies• Mobility training
exercises

115
Finally, 88 percent of each OP-32 line item is assumed to be product support when no better data
exists, with the remaining 12 percent considered to be non-product support logistics.
Table 12: Product Support Cost Estimation Assumptions, Data Points, and Sources
Product Support Cost Calculation Methodology
The product support cost estimation method is explained using maintenance operations and
maintenance management as examples and applies equally to all product support rolled-up
elements and non-product support elements.
Each OP-32 line item in the Logistics Cost Baseline is decomposed and categorized into the
product support rolled-up elements or non-product support elements of Figure 39. The
mechanics of this decomposition are shown in Figure 40.
The OP-32 line item called ―Army Depot Command System‖ is categorized at a high level as a
maintenance operations and maintenance management product support rolled-up element, of
which 100 percent is considered product support. The Army Working Capital Fund uses a cost
recovery rate of 13 percent. This cost recovery rate is the percent of working capital inflow
intended to fund the management tasks and other activities needed to run maintenance operations
and is used to estimate overhead costs within the Army Depot Command System.
The bottom line of Figure 39, ―Other,‖ represents the combined costs of all OP-32 line items
categorized as maintenance and maintenance operations and provides the non-labor O&M cost
associated with the maintenance operations and maintenance management rolled-up product
support elements.
Data Point or Assumption Source or Logic
OP-32 Line Items OSD (Comptroller)
Log Cost Baseline Summary OADUSD SCI
Army Actual FY 2008 Cost Recovery Rate Army Working Capital Fund FY 2010 Budget Estimates
Navy Actual FY 2008 Cost Recovery Rate Navy Working Capital Fund FY 2010 Budget Estimates
USMC Actual FY 2008 Cost Recovery Rate Navy Working Capital Fund FY 2010 Budget Estimates
USAF Actual FY 2008 Cost Recovery Rate
USAF Working Capital Fund FY 2010 Budget Estimates: CRR = FY 2008
Consolidated Sustainment Activity Group (CSAG) Business Overhead Expenses
($1,305.516M) / Revised Net Sales @ Cost ($3,864.960M)
GSA Cost Recovery Rate U.S. General Services Administration Summary of Rates and Fees, FY 2009
DLA Cost Recovery Rate Defense-Wide Fiscal Year FY 2010 Budget Estimates
Defense Energy CRR = DLA CRRSimilar Skill Sets and Management Inf rastructure Required for Both Agencies;
Of f ices Are Collocated
Credit Card Merchant Fee of 1.5% for Locally Procured
Fund Managed Supplies and MaterialsTypical Merchant Fee
TWCF Cost Recovery RateAir Force Working Capital Fund FY 2010 Budget Estimates with Equation Equal to: 1
- (Cost to Transport Things / Total TCF Cost)
Assumed Percent of Logistics That Is Product Support
When No Better Data Exists = 88%Product Support for the 21st Century – July 1999

116
Figure 40: OP-32 Line Items Are Decomposed and Categorized to Build Total
Product Support Costs
Having estimated the O&M cost for maintenance operations and maintenance management, the
next costs calculated are labor. Figure 41 shows these labor cost calculations and also shows how
the total maintenance operations cost is calculated. To summarize, each rolled-up product
support element is comprised of OP-32 line items that are assigned one of three labor category
labels: maintenance, supply, and transportation. These labels are from LMI’s logistics workforce
composition estimates and resemble but are not equivalent to the product support elements of
Figure 38. Because there are some OP-32 line items that belong in one product support rolled-up
element but have different labor category labels associated with them, each rolled-up element has
some percentage of its cost ascribed to each label.
In the example shown in Figure 41, Maintenance Operations has 45 percent of the total O&M
spend associated with the Maintenance Labor category label, 13 percent of the Supply, and none
of the Transportation. The civilian labor cost for Maintenance Operations is 45 percent of $11
billion plus 13 percent of $7 billion plus 0 percent of $1 billion equal to about $6 billion. A
similar calculation is shown below for military labor. The Maintenance Operations O&M plus
civilian labor plus military labor equals about $53 billion.
% Indirect of
Total Spend
Materiel and
Maintenance
Management
Maintenance
Operations
Product
Support
Spend
Non-Product
Support
Spend
% Spend
That Is
Product
Support
Logistics Function
(for labor
classification)
Maintenance
Total Spend
13.0% $357,030 $2,389,357 $2,746,387 $0 100% Maintenance $2,746,387
Cost
Recovery Rate
(Total Spend) *
(% Spend That Is Product Support)
Total Spend - Product
Support Spend
OP-32
Line Item
(Product Support Spend) *
(1 - % Indirect of Total)
(Product Support Spend) *
(% Indirect of Total Spend)
Army Depot Command System Example
$4,719,961 $31,894,577 $36,614,538 $2,592,436 $39,206,974
Total Product Support
Maintenance O&M Costs
Total Product Support
Direct Maintenance O&M
Costs
Total Product Support
Indirect Maintenance
O&M Costs
Total Non-Product
Support Maintenance
O&M Costs
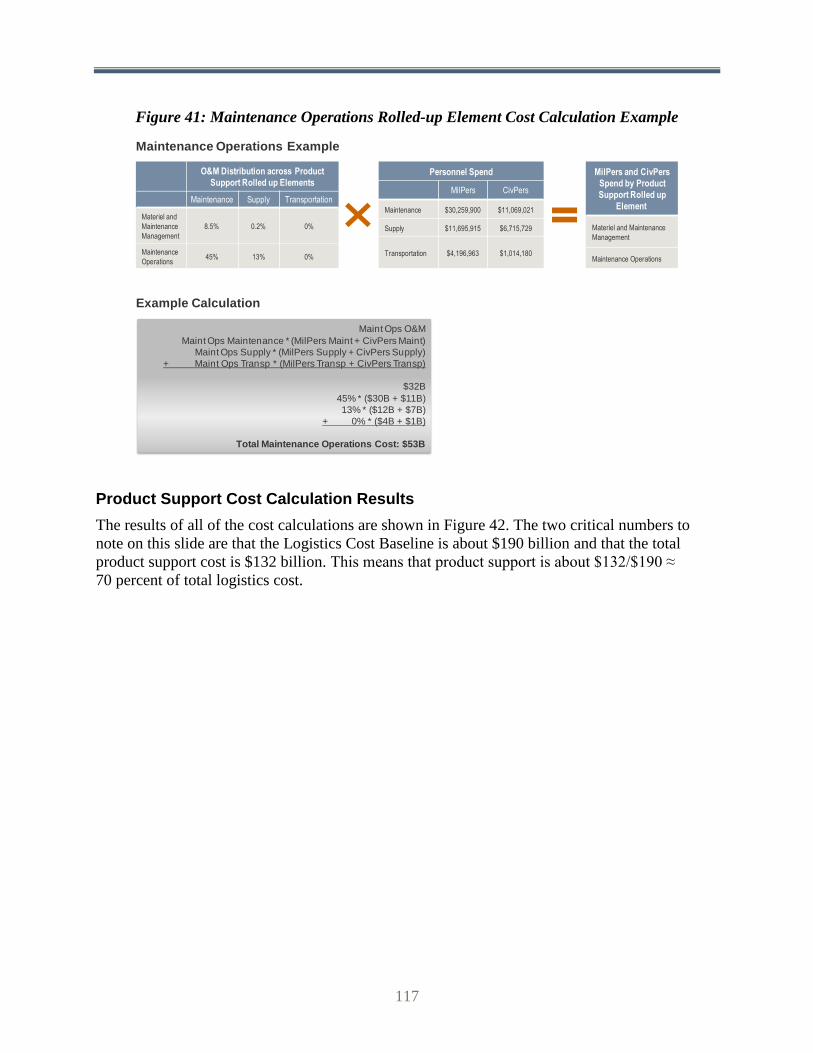
117
Figure 41: Maintenance Operations Rolled-up Element Cost Calculation Example
Product Support Cost Calculation Results
The results of all of the cost calculations are shown in Figure 42. The two critical numbers to
note on this slide are that the Logistics Cost Baseline is about $190 billion and that the total
product support cost is $132 billion. This means that product support is about $132/$190 ≈
70 percent of total logistics cost.
MilPers and CivPers
Spend by Product
Support Rolled up
Element
Materiel and Maintenance
Management
Maintenance Operations
Personnel Spend
MilPers CivPers
Maintenance $30,259,900 $11,069,021
Supply $11,695,915 $6,715,729
Transportation $4,196,963 $1,014,180
O&M Distribution across Product
Support Rolled up Elements
Maintenance Supply Transportation
Materiel and
Maintenance
Management
8.5% 0.2% 0%
Maintenance
Operations45% 13% 0%
Maint Ops O&M
Maint Ops Maintenance * (MilPers Maint + CivPers Maint)
Maint Ops Supply * (MilPers Supply + CivPers Supply)
+ Maint Ops Transp * (MilPers Transp + CivPers Transp)
$32B
45% * ($30B + $11B)
13% * ($12B + $7B)
+ 0% * ($4B + $1B)
Total Maintenance Operations Cost: $53B
Example Calculation
Maintenance Operations Example

118
Figure 42: Product Support Cost Calculation Results
Product Support ElementProduct Support
Rolled up ElementO&M ($K) MilPers ($K) Civ Pers ($K) Total ($K)
Materiel Management
Materiel and Maintenance
Management$4,719,961 $2,586,614 $951,081 $8,257,656
Maintenance Management
Technical Data Management
Configuration Management
Systems Engineering
Failure Reporting and Analysis
Industrial Engineering
Maintenance Training
Maintenance Maintenance Operations $31,894,577 $15,218,084 $5,888,667 $53,001,328
Cataloging
Item and Inventory
Management$6,418,812 $1,356,672 $778,988 $8,554,471
Inventory Management
Warehousing
Inventory Management Training
Direct Material Spend Inventory Direct Spend $33,957,404 $7,177,106 $4,121,054 $45,255,564
Distribution ManagementDistribution Management $4,658,872 $1,362,499 $329,243 $6,350,614
Distribution Training
Distribution Distribution Operations $7,969,933 $2,330,828 $563,236 $10,863,997
Product Support Total $89,619,558 $30,031,803 $12,632,268 $132,283,630
Non Product Support Maintenance $2,592,436 $1,092,909 $444,351 $4,129,696
Non Product Support Supplies $3,978,462 $840,875 $482,825 $5,302,161
Non Product Support Transportation $1,722,110 $503,636 $121,702 $2,347,447
Non-Attributable IT $1,240,201 $689,733 $252,303 $2,182,237
Other $24,945,589 $12,993,823 $4,865,481 $42,804,893
Logistics Cost Baseline Total $124,098,356 $46,152,778 $18,798,930 $189,050,064