forests - seea.un.org · final report - ... study
TRANSCRIPT

Lessons from ecosystem
accounts for forests in the
Central Highlands,
Australia
Heather Keith
Fenner School of Environment and Society
ForestsChallenges for ecosystem accounting

Case study of Experimental Ecosystem Accounts in the
Central Highlands of Victoria
Tall, wet temperate evergreen eucalypt forestCentral Highlands, Victoria, Australia

Trade-offs
3
Native
timber
Plantation
timber
TourismWater
supply
Carbon
sequestration
Agricultural
production
Industries dependent on ecosystem services from the Central Highlands region
1. Policy issues: - contested forest management- conflicting uses of ecosystem services
Ecosystem accounts demonstrated the trade-offs in physical and monetary terms, and this is influencing the decision-making process.

Challenges in the policy context for forests
1. Different land tenures: public, private, corporate
2. Multiple land uses:conservation, production, water supply, recreation, biodiversity
3. Market and non-market valueseg timber vs biodiversity
4. Use of ecosystem services cross asset boundaries
5. Complex ecosystem:long-lived trees, influence of age structure on growth dynamics, stochastic disturbance events
4

2. Defining relevant spatial areas
5
Boundary of the ecosystem accounting unit:- Catchments- Forest ecosystem types- Forest management areas- Natural resource management areas- Biogeographic regions- Local government areas- Statistical areas
Pragmatic boundary related to policy question
Basic statistical unit:- Land cover as raster data- Land use as polygon data
Conversion loses resolution- Continuum of forest states eg primary and
secondary forest, plantationDifficult to classify and define boundaries
Resolutions of data sources:- Biophysical data small-scale and spatially
referenced- Economic data highly aggregated to industries
and sectorsAssumptions associated with changing scales
Forest types and catchments

6
3. Types of ecosystem servicesProvisioning: ➢ water➢ fibre➢ food➢ energy source➢ genetic diversity➢ habitat
Regulating:➢ water filtration➢ air filtration➢ pollination➢ seed dispersal➢ carbon storage➢ carbon sequestration➢ flood mitigation➢ erosion control
Cultural:➢ recreation➢ education and research➢ spiritual

7
4. Measuring ecosystem conditionPurpose: 1. To measure the state of the ecosystem in terms of its capacity to continue to provide services to people related to human use2. To measure the state of the ecosystem in terms of its ability to function without reference to human use related to naturalness
Characteristics Indicators
Vegetation Leaf area index, biomass, mean annual increment, structure
Biodiversity Species richness, relative abundance
Soil Soil organic matter, nutrient availability, water holding capacity
Water River flow, water quality
Carbon Carbon stock, net carbon balance, primary productivity
Habitat Fragmentation, key features
Measurements:
Challenges:Differentiation of types of characteristics and indicators:1. General composite indicators2. Indicators specific for ecosystem types3. Indicators specific to supply of ecosystem services4. Limited indicators of overall ecosystem function

8
years old regeneration period
> 75 before 1939
56 – 75 1939 – 1959
33 – 55 1960 – 1982
7 – 32 1983 – 2008
0 – 6 2009 - 2015
2. Land account – ecosystem condition
Potential characteristics:➢ Forest age
➢ Structural complexity
➢ Tree density
➢ Composition
➢ Canopy cover / leaf area
➢ Ground cover
➢ Fragmentation
Potential indicators:➢ Age class eg old growth
➢ Endangered species
➢ Index of species richness
➢ Biomass / volume
➢ Presence of weeds, pests, diseases
➢ Size, distribution, edges of patches
Challenges:➢ Different characteristics relate to services
➢ No all-encompassing indicators
➢ Indicators are specific to policy issues
➢ Dilemma of the general vs specific
Examples of measuring ecosystem condition
Forest age class

9
5. Defining reference levels for condition
[Kormos et al. 2017]
Reference levels defined in relation to:1. Benefits to people2. Reference to a natural state3. Relative reference to a point in time
Distribution of ‘natural’ forest

Distribution of primary forest
patches in Europe
Demonstrates the possibility of a reference level of a ‘natural’ forest.
10[Sabatini et al. 2018 Diversity and Distributions]

Classification of forest states
11
Stand origin Natural forest Man-made forest
Genesis Self-sown forest Planted forest
Tree species origin Native forest Exotic forest
Processes, structures Primary forest Secondary forest Plantation
Management Conservation objectives Multiple use objectives
Forestry activities Minimum intervention Production
Primary forest Secondary forest Exotic plantation

12
0
100
200
300
400
500
0 100 200 300
Stand age (years)
Tota
l bio
mas
s ca
rbon
sto
ck (t
C h
a-1
)
Carbon Carrying Capacity
Primary
forestSecondary
forest
Current Carbon Stock
Carbon Sequestration Potential
Example: choice of reference level affects ecosystem account
A reference level for forest carbon stock of ‘harvest maturity’ of a secondary forest results in half the carbon stock of that in a primary forest, and so does not reveal the carbon sequestration potential of allowing secondary forest to continue growing.

13
Emissions
Accounting
result
Accounting
result
1990 2020 2020
Accounting
result
2020
Net – NetNet emissions in each year of the commitment period minus the net emissions in 1990.
Activities: cropland, grazing, revegetation
Gross – NetNet emissions in each year of the commitment period without comparing it with 1990.
Activities: af/ re/ de/ forestation
Reference levelNet emissions in each year of the commitment period minus the value of the reference level,eg natural disturbance regimes.
Activities: forest management
Change in condition used in carbon accounting
14
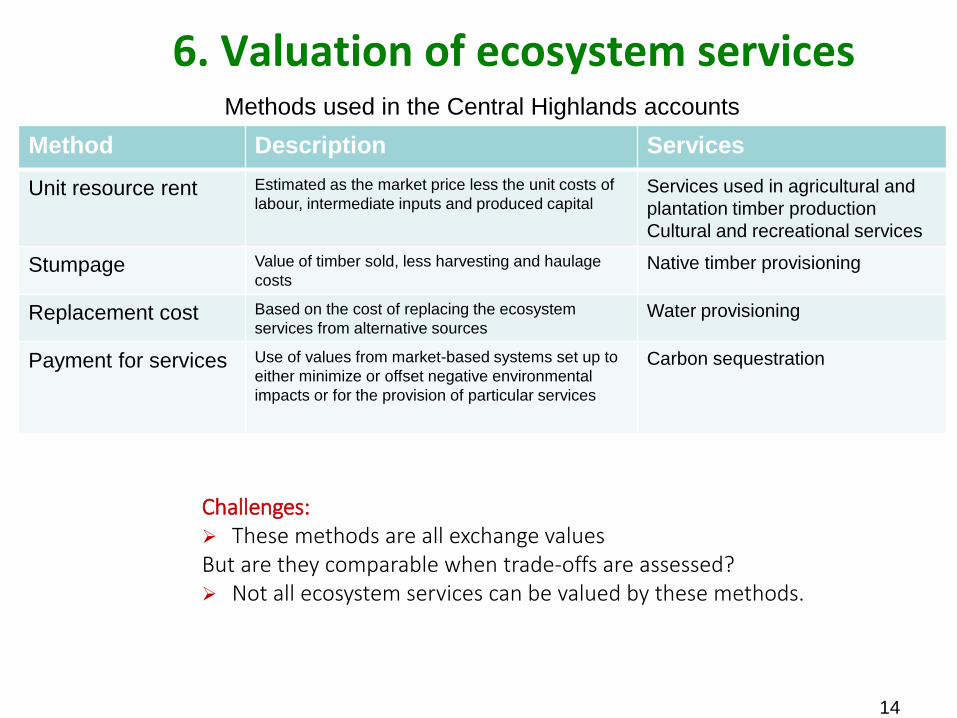
6. Valuation of ecosystem services
Method Description Services
Unit resource rent Estimated as the market price less the unit costs of
labour, intermediate inputs and produced capitalServices used in agricultural and
plantation timber production
Cultural and recreational services
Stumpage Value of timber sold, less harvesting and haulage
costsNative timber provisioning
Replacement cost Based on the cost of replacing the ecosystem
services from alternative sourcesWater provisioning
Payment for services Use of values from market-based systems set up to
either minimize or offset negative environmental
impacts or for the provision of particular services
Carbon sequestration
Methods used in the Central Highlands accounts
Challenges:➢ These methods are all exchange valuesBut are they comparable when trade-offs are assessed?➢ Not all ecosystem services can be valued by these methods.

15
Balancing trade-offs between land use activitiesCeasing native timber harvesting increases ecosystem services for:➢ Carbon sequestration and water provisioning – calculated known gain➢ Plantation timber provisioning and recreational services – estimate potential gain➢ Biodiversity - undefined gain

1. Measuring cryptic creatures
2. General or composite indicators vs specific indicators
3. Identifying the production boundary to differentiate the ecosystem service from production, eg water flows
4. Differentiating ecosystem services conceptually andphysically, eg
carbon sequestration – reducing atmospheric CO2 conc.carbon storage – avoiding loss due to human activities
5. Scaling up site and biophysical data to landscapes
- resolution and consistent time series of remote sensing data
- changes in methods and technologies over time
- ecological relationships between site and spatial data
6. Disaggregating economic data to spatial areas and land use activities.
16
7. Barriers to measurements in forests

Further Information: Experimental Ecosystem Accounts for the Central Highlands of Victoria. July 2017.
Heather Keith, Michael Vardon, John Stein, Janet Stein and David Lindenmayer
Final Report - http://www.nespthreatenedspecies.edu.au/publications-tools/experimental-ecosystem-accounts-for-the-central-
highlands-of-victoria-full-report-high-res-40mb
Appendices - http://www.nespthreatenedspecies.edu.au/publications-tools/experimental-ecosystem-accounts-for-the-central-
highlands-of-victoria-full-report-high-res-31mb
Summary Report - http://www.nespthreatenedspecies.edu.au/publications-tools/experimental-ecosystem-accounts-for-the-
central-highlands-of-victoria-summary
Video - http://www.nespthreatenedspecies.edu.au/news/video-environmental-economic-accounts-a-case-study-in-the-victorian-
central-highlands
Ecosystem accounts define explicit and spatial trade-offs for managing natural resources.
Heather Keith, Michael Vardon, John Stein, Janet Stein and David Lindenmayer. 2017.
Nature Ecology and Evolution 1: 1683 – 1692.
The Conversation 11/10/2017
https://theconversation.com/money-cant-buy-me-love-but-you-can-put-a-price-on-a-tree-84357