forests of the mountain state
TRANSCRIPT

United StatesDepartment of Agriculture
Forest Service
Northern Research Station
Resource Bulletin NRS-17
Forests of the Mountain StateRichard H. WidmannCharles R. DyeGregory W. Cook

Visit our homepage at: http://www.nrs.fs.fed.us/
Published by: For additional copies:USDA FOREST SERVICE USDA Forest Service 11 CAMPUS BLVD SUITE 200 Publications DistributionNEWTOWN SQUARE PA 19073-3294 359 Main Road Delaware, OH 43015-8640April 2007 Fax: (740)368-0152
Manuscript received for publication 11 November 2006
AcknowledgmentThe contributions of NRS-FIA staff members Douglas M. Griffi th, Tonya W. Lister, and Andrew J. Lister were invaluable during the preparation of this bulletin.
The AuthorsRICHARD H. WIDMANN, is a forester with the Northern Research Station’s Forest Inventory and Analysis unit at Newtown Square, PA (www.fs.fed.us/ne/fi a).
CHARLES R. DYE, is the State Forester for the West Virginia Division of Forestry, Bureau of Commerce, Charleston WV.
GREGORY W. COOK, is Assistant State Forester for the West Virginia Division of Forestry, Bureau of Commerce, Charleston WV.
Photo CreditsPhotographs on the following pages are courtesy of forestryimages.org: 20 (Minnesota Department of Natural Resources-archives); 24 (Pennsylvania DCNR-Archives); 26 (Deborah Veen). Photographs on pages 22 and 23 are courtesy of West Virginia Division of Forestry. All other photographs are courtesy of the authors.
1
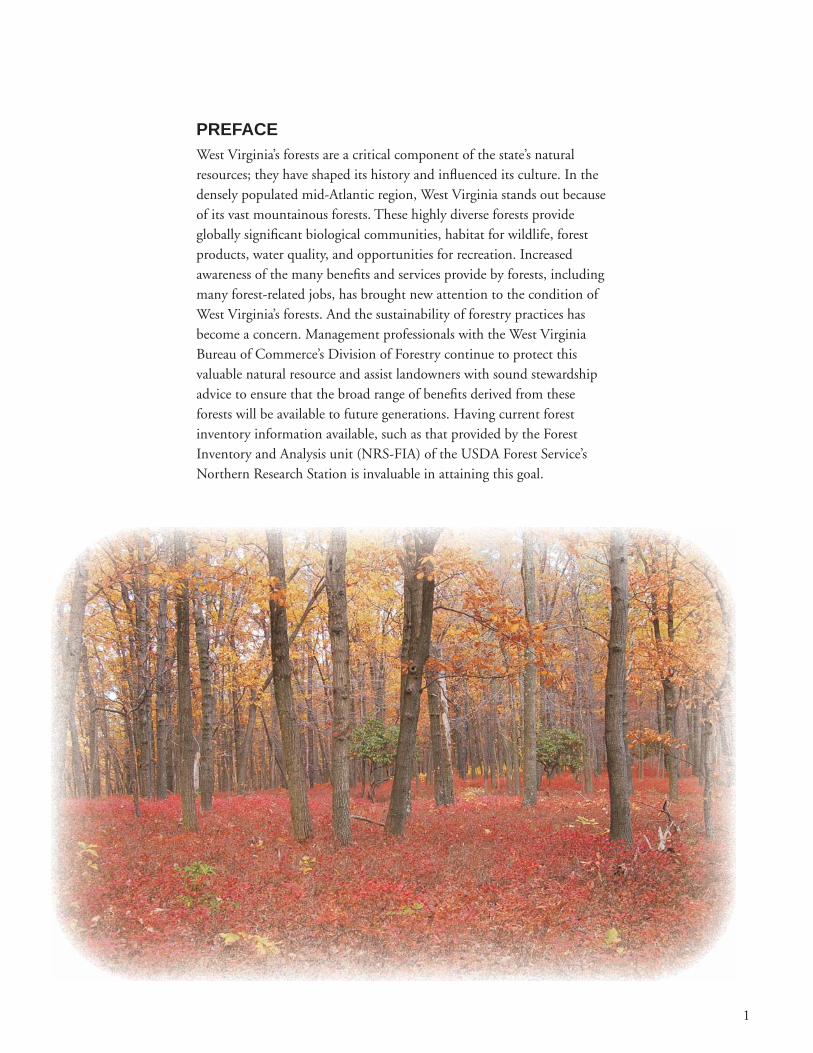
PREFACEWest Virginia’s forests are a critical component of the state’s natural resources; they have shaped its history and infl uenced its culture. In the densely populated mid-Atlantic region, West Virginia stands out because of its vast mountainous forests. These highly diverse forests provide globally signifi cant biological communities, habitat for wildlife, forest products, water quality, and opportunities for recreation. Increased awareness of the many benefi ts and services provide by forests, including many forest-related jobs, has brought new attention to the condition of West Virginia’s forests. And the sustainability of forestry practices has become a concern. Management professionals with the West Virginia Bureau of Commerce’s Division of Forestry continue to protect this valuable natural resource and assist landowners with sound stewardship advice to ensure that the broad range of benefi ts derived from these forests will be available to future generations. Having current forest inventory information available, such as that provided by the Forest Inventory and Analysis unit (NRS-FIA) of the USDA Forest Service’s Northern Research Station is invaluable in attaining this goal.

2
FORESTS OF THE MOUNTAIN STATEIn 2001, the Forest Service’s Northeastern Research Station in cooperation with the West Virginia Bureau of Commerce, Division of Forestry, completed an inventory of West Virginia’s forests (Griffi th 2003). This bulletin summarizes the fi ndings of the most current and previous inventories, and highlights major changes in the state’s forests.
HISTORICAL PERSPECTIVEWhen settlers fi rst came to what is now West Virginia more than 200 years ago, they followed the major rivers and found dense mountainous forests. They settled in the valleys or moved farther west, bypassing most of the state’s steep terrain. As late as 1870, 10 million acres of West Virginia’s forests were untouched and in original growth (Clarkson 1964). On the moist western slopes of the Appalachian Mountains grew a complex mixture of deciduous species with dense stands of red spruce and hemlock at the highest elevations. On the somewhat drier eastern side of the Appalachians grew various mixtures of oak and American chestnut. In the southeastern portion of the state were stands of large white pine; the best were in Greenbrier and Pocahontas Counties.
West Virginia was one of the last eastern states to have its presettlement forest cut. Lumber companies moved there as quality trees were becoming scarce in Pennsylvania and other eastern states. Because of the rough mountainous terrain, it was not until railroads extended their major trunk lines into the state that there was a way to deliver West Virginia lumber to markets in the East. Lumber companies arrived in the state in the late 1800s with a boom, taking large investments and using the latest technology to get trees off the mountains and to the mills, e.g., by logging railroads, and steam-driven log skidders and loaders. Entire towns were built by the lumber companies to support the labor needed to run the mills, some of which were immense even by today’s standards. The lumber industry in West Virginia fl ourished during the fi rst two decades of the 20th century, with peak annual production reaching nearly 1.5 billion board feet from an estimated 1,500 mills (Steer 1948).
Little thought was given to regenerating the forests after the trees were cut. During harvests every tree that could be used was cut, though only the best portions were utilized. Left behind were thick layers of logging slash that dried out and created conditions that were ripe for wildfi res. Despite early efforts at fi re prevention, large blazes frequently broke out across the state. These fi res killed the trees that were left behind after harvesting and impeded the regeneration of the future forest. This scenario was a repeat of what had occurred throughout the Northeastern United States.

3
During the late 1800s and into the early 1900s, the nation’s economy depended on a readily available supply of lumber and wood products. Wood was used for most construction and the railroads and mines used large amounts for rails and mineprops. Out of a concern for the future timber supply, a conservation ethic was embraced by government leaders and the general public. The following examples are evidence of this conservation movement in West Virginia:
In 1908, the governor appointed a Conservation Commission and the West Virginia Forestry Association was formed.
In 1909, the state commissioned a comprehensive study of its forest land and wood-using industries, and, legislation made the Offi ce of Fish and Game Warden responsible for forest protection.
In 1915, the state enacted legislation enabling the appointment of fi re wardens in each county, and the fi rst of many purchases of land was made by the federal government for what would become the Monongahela National Forest.
In 1916, forest-land owners from the southern portion of the state formed the Southern West Virginia Forest Fire Protective Association.
In 1935, classes to train professional foresters began at West Virginia University (Carvell 1998).
Given a chance to grow, trees reestablish themselves fairly quickly in most areas of the state. The chance to grow was enhanced by increasing efforts to control wildfi res and promote good land stewardship during the last century. As a result, the current condition of West Virginia’s forests can be attributed largely to these past efforts.
How residents value West Virginia’s forests also has changed. Originally, they were seen as barriers to progress that needed to be cleared for settlement. Timber products, fuelwood, and wild game were the major benefi ts from the forest. Although these remain valuable assets, today the state’s forests also are valued for watershed protection, opportunities for recreation, conservation of wildlife habitat, diverse landscapes, and an overall increase in the quality of life of West Virginia’s residents.
LAND USE AND FOREST COVERTrends in Forest-land AreaWest Virginia is the third most heavily forested state in the nation, with 78 percent of its area in forest or 12 million acres (Fig 1). Over the last half century, the state’s forest-land area has increased by more than 2 million acres. This increase occurred because new forest land that previously was overgrown fi elds and pastures has more than offset losses to road building, mining, and other development. The most recent inventory shows a small decrease in forest land. Although not statistically signifi cant, this decrease may indicate that the area of forest land in West Virginia has peaked. Most of the loss in forest land occurred in Kanawha and Hampshire Counties.
•
•
•
•
•
0
2
4
6
8
10
12
14
1949 1961 1975 1989 2000Inventory Year
Mill
ions
of A
cres
Timberland Other Forest Land
9.9 11.5 11.612.1 12.0
Figure 1.—Area of forest land, West Virginia, 1949, 1961, 1975, 1989, and 2000.

4
Forest land is categorized by the Forest Service as timberland or “other” forest land (Fig. 2). These categories aid in understanding the availability of forest resources and forest management planning. Most of West Virginia’s forest land, nearly 11.8 million acres, is classifi ed as timberland. These forests are potentially available for harvesting even though many private owners hold forest land for reasons other than timber production. On privately owned forests, FIA does not use the harvesting intentions of the owner as a criterion for determining whether forests should be excluded from timberland.
“Other” forest land includes reserved lands and unproductive forests. Harvesting for timber products on these lands is restricted administratively or economically impractical. Examples include designated “natural” areas on National Forests, wildlife preserves, and rocky mountaintops where growing conditions are poor. This category covers 209,900 acres in West Virginia, nearly the same amount as in 1989.
Distribution of Forest LandMost counties in West Virginia are heavily forested (Fig. 3). In the eastern panhandle, Berkeley and Jefferson are the only counties where forests cover less than half of the land area. McDowell and Webster Counties are the most heavily forested; each is 93 percent forested. In addition to FIA county estimates, satellite imagery provides a detailed picture of the distribution of forest land in the state (Fig. 4).
Timberland11,797,000 acres
77%
Other forest land 209,900 acres
1%
Farm land 1,544,100 acres
10%
Other nonforest land
1,864,400 acres 12%
Figure 2.—Land area by major use, West Virginia, 2000.

5
PEOPLE AND FORESTSTrends in Population and Farm AcreageMany of the major changes that are currently affecting West Virginia’s forests are the result of people. It is people who decide where to clear land for houses, shopping centers, roads, and surface mining and it is people who intentionally or unintentionally decide to allow land to revert to forest. Today, there are about 1.8 million people living in the state, whose population peaked at 2 million in 1950. Although recent data show that West Virginia is the slowest growing state in the nation in terms of population (Fig. 5), a considerable amount of forest land is lost each year to development. These losses have been offset by the loss of farm acreage and the subsequent conversion of this pasture and cropland to forests. In 2000, the amount of land in farms was less than half of that in 1950, a loss of nearly 5 million acres (Fig. 6). In recent years, the overall net effect of these changes on the total area of forest land has been small.
40-69
90+
80-89
70-79
Percent
4478
7278
8079
8288
84
6962
89
93
70
64
6689
74
62
716181
81
75
80
81
83
8266
66
89
79
77
85
93
76
63
69
81
87
82
8484 85
80
6776
87
86
85
0
0.5
1
1.5
2
2.5
1900 1910 1920 1930 1940 1950 1960 1970 1980 1990 2000
Census Year
Mill
ions
of P
eopl
e
8.55
6.7
5.14.2
3.7 3.6
0
4
8
12
1950 1960 1970 1980 1990 2000
Year
Mill
ions
of A
cres
Figure 3.— Percentage of land in forest by county, West Virginia, 2000.
Figure 4.— Distribution of forest land in West Virginia based on the Multi-Resolution Land Characteristics project, 1992. The MRLC uses data from the Landsat satellite to map land across the nation.
Figure 5.—Trend in West Virginia’s population (source: U.S. Census Bureau). Figure 6.—Acreage in farms (including farm woodlots),
West Virginia, 1950-2000 (source: National Agriculture Statistics Service).

6
Most of West Virginia’s Forest Land is in Large PatchesWhen a large portion of a forest is lost to new residential and urban development, the remaining forest land often is broken up into smaller tracts or noncontiguous patches. Known as forest fragmentation, this phenomenon concerns land managers and planners throughout the Northeastern United States. The fragmentation of forests, particularly by urban uses, degrades watersheds, reduces wildlife habitat, increases site disturbances, and favors invasion by exotic plant species. Many wildlife biologists believe that fragmentation is a contributing factor in the decline of some bird and other wildlife species, though fragmentation favors species such as raccoons, squirrels, and white-tailed deer. Fragmentation also changes the character of rural areas as small parcels are more diffi cult to manage for forest products than large tracts, and owners of small tracts are less likely to allow access to their land for activities such as fi shing and hunting.
One way to characterize the distribution and fragmentation of forest land in West Virginia is to determine the size of each forested patch and the frequently with which various sizes occur (Fig. 7). In West Virginia, most of forest land is in large patches; 75 percent of the forest land is in patches of more than 500 hectares in size (ha; 1 ha= 2.47 acres). The largest patch, 17,000 ha or 42,000 acres is in Pocahontas County (Fig. 8). Though there are a large number of patches 1 to 5 ha, they represent less than 1 percent of the state’s forest land.
Who Owns the Forest? Private individuals and enterprises own 87 percent of the West Virginia’s forest land; federal, state, and other public owners hold the remaining 13 percent (Fig. 9). The estimated 260,000 private forest-land owners in West Virginia are represented by individuals, farmers, and corporations, including private land trusts. Fifty-seven percent hold fewer than 10 acres. Although large in number, they own hold only about 3 percent of the private forest land in the state. Nearly 1,500 owners with forested holdings exceeding 500 acres account for one-third of the privately owned forest land.
BERKELEY
JEFFER-SON
BARBOUR
TAYLOR
BROOKE
OHIO
BOONE
BRAXTON
CABELL CLAY
FAYETTE
GILMER
GRANT
GREENBRIER
HAMPSHIRE
HARDY
HARRISON
JACKSON
KANAWHA
LEWIS
LINCOLN
LOGAN
MCDOWELL
MARION
MARSHALL
MASON
MERCER
MINERAL
MINGO
MONONGALIA
MONROE
MORGAN
NICHOLAS
PENDLETON
POCAHONTAS
PRESTON
PUTNAM
RALEIGH
RANDOLPH
RITCHIE
ROANE
SUMMERS
TUCKER
TYLER
UPSHUR
WAYNE
WEBSTER
WETZEL
WIRT
WOOD
WYOMING
PLEASANT
RIDGEDODD-
CAL-HOUN
HANCOCK
043
079
Average Forested Patch Size (Acres)
100 - 175
175-250
250-325
325-400
32 - 100
400+
ForestIndustry,
1,094,800acres 9%
Other Public, 515,959 acres
4%
NationalForest,
1,072,896acres 9%
Other Private, 9,323,170acres 78%
05
1015202530354045
1-5 5-10 10-50 50-100 100-500 500-1,000
1,000-50,000
Patch-size Class (hectares)
Thou
sand
s of
Pat
ches
0
0.5
1
1.5
2
2.5
3
Mill
ions
of H
ecta
res
Number of patches Total area in class( 1 hectare=2.47 acres )
Figure 7.—Fragmentation of forest land, West Virginia, 1990 (computed in 2003 using 1990 satellite imagery).
Figure 8.—Average size of forest patches, West Virginia, 1990.
Figure 9.—Ownership of forest land, West Virginia, 2000.

7
Of the forest-land owners in the Mid-Atlantic Region, of which West Virginia is a part, 42 percent are 65 years old or older. Two percent of private owners have a written management plan for their forest; these owners hold 14 percent of the forest land.
Frequent reasons given for owning forest land are that it is part of the home, part of a family legacy, aesthetic enjoyment, and preserving biodiversity. Timber production ranks low as a reason for owning land, though nearly all owners with more than 1,000 acres have harvested sawlogs or pulpwood from their land. Public ownership of forest land has increased from 1.02 million acres in 1949 to 1.51 million in 2000. The largest public owner is the Monongahela National Forest with 899,000 acres of forest land.
CHANGES IN FOREST STRUCTURE AND COMPOSITIONAs forests mature, the species composition at a particular site goes through what ecologists call “forest succession.” During this continuous process, long-lived plants that can tolerate shaded conditions replace short-lived plants that need full sunlight to thrive. Succession is infl uenced by disturbances from natural and human sources. Examples of forest disturbance in West Virginia include wildfi res, ice storms, droughts, outbreaks of insect pests (such as the gypsy moth caterpillar), logging, and land clearing followed by abandonment. The interaction of these and other factors over time has infl uenced size and number, volume, and composition and distribution of tree species in the state. An understanding of trends in these characteristics is helpful in fully appreciating West Virginia’s forest resource and in making wise decisions about its future.
Trees Have Increased in Size with Fewer Trees per AcreHow well forests are populated with trees is determined by measures of tree size and number. Foresters measure a tree at its diameter at 42 feet above the ground, referring to this as diameter at breast height (d.b.h.). Of trees 5 inches and larger d.b.h., the average diameter has increased from 9.4 to 9.7 inches since 1989; the average number of trees at least 5 inches in diameter has decreased from 149 to 146 trees per acre of timberland (Fig. 10). Generally, as a stand of trees matures and trees become larger, the number of trees per acre decreases due to crowding. The recent decrease in the average number of trees per acre and increase in average diameter corresponds with the overall maturing of West Virginia’s forests.
137149 146
0
20
40
60
80
100
120
140
160
1975 1989 2000
Inventory Year
Tree
s Pe
r Acr
e (n
umbe
r)
8.8
9.4
9.7
8.2
8.4
8.6
8.8
9
9.2
9.4
9.6
9.8
10
1975 1989 2000
Inventory Year
Dia
met
er a
t Bre
ast H
eigh
t (in
ches
)
Figure 10.—Number of trees per acre and average tree diameter (5 inches and larger in d.b.h.), West Virginia.

8
Changes in the numbers of trees have not been distributed evenly across diameter classes (Fig. 11). Generally, the number of trees in the small classes is decreasing as the number of trees in the large classes is increasing. Since 1989, the number of trees has decreased in all diameter classes under 12 inches (Fig. 12). As forests mature and become more crowded, the subsequent lack of sunlight reaching the forest fl oor inhibits the reproduction and growth of seedlings and understory trees.
Most Small Trees are OvertoppedThe crown position of a tree indicates how well it is competing with neighboring trees for light. Once a tree falls into an intermediate or overtopped crown position, it is below the general level of the canopy and is shaded by dominant and codominant neighbors. Overtopped trees generally can be expected to have slower growth and higher mortality rates than trees in more dominant positions. In West Virginia, the crowns of most trees in the 6- and 8-inch diameter classes are in an overtopped or intermediate position, 75 and 52 percent, respectively (Fig. 13).
0
0
100
200
300
400
500
600
6 8 10 12 14 16 18 20
Diameter Class (Inches at breast height)
1961
1975
1989
2000
Inventory Year
0
500
1000
1500
2000
2500
3000
3500
2 4
Mill
ions
of T
rees
11%
17%
10%10%
5%
-2%-6%
-13%-10%-12%
-20%
-10%
0%
10%
20%
2 4 6 8 10 12 14 16 18 20
Diameter Class (inches at breast height)
Perc
ent C
hang
e
Figure 11.—Number of trees by diameter class and inventory year, West Virginia (data for saplings is unavailable for 1961 and 1975).
Figure 12.—Percent change in the numbers of trees by diameter class, West Virginia, 1989-2000.

9
Most Stands are Well Stocked with Trees of Commercial ImportanceStocking levels of growing-stock trees indicate how well a site is being utilized to grow trees of economic value. Foresters determine stocking by the number of trees per acre and their size. In fully stocked stands, trees are using all of the potential of the site to grow. Poorly stocked stands have widely spaced trees or contain trees with little or no commercial value. Poorly stocked stands can develop from abandoned agricultural land or wildfi res, or result from harvesting where only the best and largest trees are cut. What is left are trees with large amounts of rot and cull, as well as many large gaps in the forest canopy. Poorly stocked stands are diffi cult to manage because they will not mature into a fully stocked condition in a reasonable amount of time and are not commercially viable, whereas moderately stocked stands are expected to quickly grow into the fully stocked condition. It is considered good management to thin stands to the moderate stocking level during harvesting operations. Thinning can reduce mortality by removing trees with a high probability of dying and leaving well-spaced residual trees with good vigor and form. In overstocked stands, the growth of individual trees has slowed due to crowding. Trees in crowded stands are less vigorous making them more susceptible to damage from insects and diseases. If not thinned or harvested, valuable trees in these stands die and their value for timber products is lost.
In West Virginia, nearly half the stands (6.4 million acres) are in fully stocked or overstocked with commercially important trees (Fig. 14). The large area of well-stocked stands presents opportunities for forest management without diminishing forest growth. Managing these stands can prevent them from becoming overstocked. Currently, there are few overstocked stands in the state. The 1.5 million acres (13 percent) of poorly stocked forest represents a loss of potential growth, though these forests still contribute to diversity. There was little change in the distribution of area by stocking class since the previous inventory in 1989.
0%
25%
50%
75%
100%
6 8 10 12 14 16 18 20
21-28
.929
.0+
Diameter Class (inches at breast height)
Perc
enta
ge o
f Tre
es in
Cla
ss
Open grownDominantCodominantIntermediateOvertopped
1%
12%
39%
45%
3%1%
40%
44%
2%
13%
0%
10%
20%
30%
40%
50%
Nonstocked Poorly Moderatelystocked
Fully stocked Overstocked
Stocking Class
Perc
ent 1989
2000
Figure 14.—Percentage of timberland by stocking class of growing-stock trees, West Virginia, 2000.
Figure 13.—Percentage of growing-stock trees by diameter and crown position, West Virginia, 2000.

10
Changes in Species CompositionWhen describing a forest, people speak of the species of trees growing there, e.g., a pine, oak, or beech forest. Foresters use the term “forest type” to describe groups of species that frequently grow in association with one another. The 2000 inventory identifi ed 41 forest types in West Virginia.
Similar forest types are combined into forest-type groups. Oak/hickory, the most common group in the state, consists of white oak, northern red oak, hickory species, white ash, walnut, yellow-poplar, and red maple (Fig. 15). The oak/hickory group covers more than two-thirds (8.4 million acres) of West Virginia’s forests, while the northern hardwood group covers 20 percent (2.4 million acres). It tends to grow at higher elevations and has higher concentrations of sugar maple and beech than the oak/hickory group. The loblolly /shortleaf pine group, which covered 179,200 acres in 2000, consists primarily of Virginia pine and pitch pine. These pines tend to grow on dry slopes and frequently originated from past disturbances such as wildfi re. Spruce/fi r forests cover 23,300 acres at high elevations. Two-thirds of the spruce/fi r forests grow on National Forest land. These broad species groups have changed little in area since 1989.
Over long periods, the composition of forests changes due to mortality, harvesting, and general maturation. In West Virginia, oak species now account for 34 percent of total volume compared to 39 percent in 1949 (Fig. 16). During this time, the portion of total volume in yellow-poplar increased from 7 to 15 percent, while red maple increased from 4 to 9 percent. Decreases in the proportion of oak have been attributed to high mortality of this species following gypsy moth infestations and selective harvesting of oak over other species. Another contributing factor is inadequate oak regeneration and the subsequent lack of oak growing into larger diameter classes. Deer browsing of oak seedlings and shaded forest conditions that inhibit oak regeneration have limited the number of sapling-size oaks throughout the Northeastern United States. Long-term changes in forest composition can affect the value of the forest for timber products and alter wildlife habitats. The decline in the oak component of forests in Pennsylvania and Maryland has been greater than in West Virginia.
Oak/hickory71.4%
Northernhardwoods
20.3%
Oak/pine 2.7%
Elm/ash/redmaple 2.7%
Other 3.0%
Other includes the loblolly/shortleaf, white/red pine hemolck, spruce/fir, and aspen/birch forest-type groups
0%5%
10%15%20%25%30%35%40%45%
1949 1961 1975 1989 2000Inventory year
Perc
ent o
f Tot
al V
olum
e
Red maple Hickory Yellow-poplar All oaks
The number of trees by species and diameter class provides insight into future changes in forest composition. Red maple is the most numerous sapling (1 to 4.9 inches in diameter) followed by sugar maple (Fig. 17). Combined oak species are the most numerous among trees, 5 inches and larger in d.b.h.; yellow-poplar ranks fi rst in the number of trees that are 12 inches and larger in d.b.h. As large oak die, they likely will be replaced by species such as red and sugar maple because of the small portion of oaks in the small-diameter classes. Maples will play an increasing role in West Virginia’s future forest.
Figure 15.—Area of timberland by forest-type group, West Virginia, 2000.
Figure 16.—Change in selected tree species as a percentage of total growing-stock volume, West Virginia, 1949-2000.

11
Distribution of Common SpeciesIndividual species are distributed by how well they are suited to particular site conditions. In addition to factors already mentioned, the number and type of animals present affects species distribution. Deer, mice, and squirrels infl uence forest composition by browsing seedlings, consuming available seeds of preferred species, and storing seeds that later geminate. For example, deer prefer to browse oak over red maple seedlings. The major species of trees growing in West Virginia are well distributed throughout the state. Yellow-poplar grows most abundantly on the west side of the Appalachian Mountains, reaching its greatest abundance in the southwestern portion of the state (Fig. 18). Chestnut oak abundance is greatest in the dry rain shadow on the eastern side of the Appalachians. Hickory grows extensively in the western part of the state and overlaps areas with abundant white oak. American beech reaches its greatest abundance in the mountainous area corresponding to the Monongahela National Forest and in southwestern West Virginia.
050
100150200250300350
6 8 10 12 14 16 18 20
Diameter Class (Inches at breast height)
HickoryYellow-poplarBeechSugar mapleAll oaksRed maple
0200400600800
1,0001,2001,4001,6001,800
2 4
Mill
ions
of T
rees
Figure 17.—Number of trees for selected species by diameter class, West Virginia, 2000.

12
Yellow-poplar White oak
Red maple Chestnutoak
RelativeImportance
< 5 %5 – 20 %
20 – 50 %50 % +
Nonforest
How were these maps created?The inventory plots were used as known data. Then the
values at unknown locations were predicted from information from those plots. For example, an unknown area near a group
of plots with large amounts of white oak probably has high amounts of white oak as well. Using this principle, we made
predictions at every location on the map. The values of relative importance are actually the percentage of a stand’s stocking that is composed of that species. The categories used are low (less
than 5 percent of a stand’s basal area), moderate ( 5-19 percent), high (20-49 percent), and very high (50 percent or greater).
pThe inventory plots were used as known data. Then the
values at unknown locations were predicted from information from those plots. For example, an unknown area near a group
of plots with large amounts of white oak probably has highamounts of white oak as well. Using this principle, we made
predictions at every location on the map. The values of relative importance are actually the percentage of a stand’s stocking that is composed of that species. The categories used are low (less
than 5 percent of a stand’s basal area), moderate ( 5-19 percent), high (20-49 percent), and very high (50 percent or greater).
Figure 18.— Distribution of common tree species, West Virginia, 2000.

13
Northern red oak Hickory
Sugar maple Americanbeech
RelativeImportance
< 5 %5 – 20 %
20 – 50 %50 % +
NonforestFigure 18.—Continued

14
Live VolumeTotal cubic-foot volume for live trees in West Virginia increased by 7 percent (cubic-foot volume is a measure of the amount of wood in the bole of a tree between a 1-foot stump and a 4-inch top diameter). The 15 most common species (listed in the accompanying chart) account for 87 percent of the total cubic-foot volume of trees in the state (Fig. 19). Yellow-poplar remained the leading species by volume, followed by white oak. However, red maple and sugar maple showed the largest volume increases, 27 and 28 percent, respectively. The large number of small-diameter maples likely will continue to sustain large increases in maple volume in the future. Beech and Virginia pine are among the few major species that decreased in volume. Beech bark disease is spreading across the state and is having an adverse effect on large beech trees. Virginia pine comes in after heavy forest disturbance. As a pioneer species, its seeds need bare mineral soil and direct light to sprout. It is highly intolerant of the shaded conditions that now prevail in West Virginia’s maturing forest. Many of today’s Virginia pine stands became established after heavy cutting and wildfi res during the early part of the last century.
Small Oaks are Decreasing in Number Besides being commercially important, oaks are a major source of food for nearly 100 species of mammals and birds (Fralish 2004). NRS-FIA data indicate that the number of oaks in the smaller diameter classes has been decreasing. From 1975 to 1989, the number of oaks in the 6-inch class dropped by 15 percent; and from 1989 to 2000, there were additional decreases as the number of oaks in the 6- 8- and 10-inch diameter classes decreased by 30, 21, and 9 percent, respectively (Fig. 20). Oaks 12+ inches in diameter have continued to increase, though at a slower rate.
In the current inventory, oaks represent more than one-third of all trees 12 inches and larger in diameter, but only 9 percent of trees 4 inches d.b.h. and 5 percent of trees 2 inches in d.b.h. (Fig. 21). The low percentage of oaks in the smaller classes and the high percentage in the large classes is another indication that there are insuffi cient small-diameter oaks to replace larger oaks that die. As a result, it is unlikely that the current dominance of oak in the overstory will continue.
0
20
40
60
80
100
120
140
160
6 8 10 12 14 16 18 20 21-28.9
29.0+
Diameter Class (inches at breast height)
Mill
ions
of T
rees oaks 1975oaks 1989oaks 2000
Figure 20.—Number of oak trees by diameter class, West Virginia, 1975, 1989, 2000.
0 1 2 3 4
HemlockVirginia pineSweet birch
White ashBasswood
Black cherryAmerican beech
Sugar mapleHickory
Scarlet/black oakNorthern red oak
Chestnut oakRed mapleWhite oak
Yellow-poplar
Billion Cubic Feet
Total 1989Total 2000
+4%+16%
+27%
+3%
+9%
-9%7%
+28%
-11%
+12%
+19%
+13%
+4%
-8%
+10%
Figure 19.—Change in live volume for selected species, West Virginia, 1989 and 2000.
OaksRed mapleSugar maple
HickoryBeech
Yellow-poplar
All other species
0%
25%
50%
75%
100%
2 4 6 8 10 12 14 16 18 20
21-28
.929
.0+
Diameter Class ( inches at breast height)
Indi
vidu
al s
peci
es a
s a
perc
enta
ge to
tal
num
ber o
f all
tree
s in
dia
met
er c
lass
Figure 21.—Species composition by diameter class, West Virginia, 2000.

15
ShrubsUnderstory vegetation is an important source of food and cover for wildlife. Because of the large number of shrub and herbaceous species that grow in West Virginia’s forests, understory vegetation contributes considerably to forest diversity in the state. In the 2000 forest inventory, the number of woody shrub species was tallied on NRS-FIA plots (Fig. 22). Briers and brambles are the most numerous species followed by blueberry. Autumn olive and barberry rank 12th and 15th, respectively. These are nonnative plants that invade natural plant communities often replacing native species. Many of the bush honeysuckles and rose species also are nonnative; we did not separate these species groups by individual species, though it is assumed that most are nonnative.
Figure 22.--Top 15 shrub species in West Virginia.
Top 15 shrub species in West Virginia
(Millions of stems)
Brier And Bramble 11,895
Blueberry 7,265
Rose Spp. 5,326
Common Spicebush 3,694
Huckleberry 3,411
Mountain-laurel 2,335
Blackhaw 1,949
Witch-hazel 1,453
Maple-leaved Viburnum 1,213
Rhododendron 910
Bush Honeysuckle 882
Autumn Olive 331
Azalea (Deciduous) 324
Azalea 311
Barberry 218

16
THE CHANGING FACE OF WEST VIRGINIA’S FOREST HABITATMore Stands of Large TreesThe types and number of wildlife species that inhabit a forest change as the forest matures. In the seedling-sapling stage that follows major disturbances such as clearcutting, intense wildfi re, strip mine reclamation, and abandonment of farm land, many wildlife species use low-growing herbaceous and shrub vegetation. Typically found in such stands are early successional, pioneer tree species as well as a variety of herb and shrub plants that need full sunlight to survive. These stands provide unique nesting and feeding habitat for wildlife. As larger trees become established and shade out much of the low-growing vegetation, species that depend on this early pioneer vegetation decline in number as others that use the boles of trees move into the area. This intermediate stage corresponds to the poletimber-size class. Many poletimber stands lack the low-growing vegetation of the regeneration stage and the tree boles lack the bark fl aps, cavities, and other bole characteristics that develop as a stand matures. As a result, the number of species present can be low between the dense thicket vegetation of the regeneration stage and the mature or sawtimber-size class, which is dominated by large trees. The number of species reaches a maximum in mature, overmature, and all-age stands. Species that are more likely to inhabit mature stands include the black bear, southern fl ying squirrel, and pileated woodpecker.
In West Virginia, the area in the regenerating or sapling-seedling/nonstocked stage rose to 963,000 acres—8 percent of the timberland (Fig. 23). The acreage in this category has increased since 1989, but remains far below levels prior to 1989. Declines in this size class likely will resume as stands mature into larger size classes and the abandonment of farmland decreases. The area in the mature or sawtimber-size trees has continued to increase because poletimber-size stands are growing to sawtimber size and because typical harvesting practices in the state leave many large residual trees. Such selective harvests do not reduce stands to the sapling-seedling stage. Sawtimber-size stands now cover 8.2 million acres or 70 percent of timberland. These changes have been accompanied by a remarkable recovery and return of many woodland species during the last century.

17
Population increases have been noted for black bear, white-tailed deer, and wild turkey. Besides offering diverse habitat for wildlife and providing a steady fl ow of wood products, forests that contain all stand sizes might be more resistant to devastating outbreaks of insects and diseases.
Hard Mast Production Probably has IncreasedWildlife populations are dependent on the quality of their habitat. Habitat characteristics that increase as stands mature include the size of mast-producing trees and the number of standing dead and cull trees. Hard mast such as nuts and hard seeds produced by overstory trees is an important forage resource for wildlife. Species that depend on acorns and other hard mast include ruffed grouse, wild turkey, red-headed woodpecker, blue jay, squirrel and chipmunk, gray fox, black bear, striped skunk, and white-tailed deer. Important mast-producing species include the oaks, hickory, and beech. Because the amount of mast produced increases as trees become larger, it can be assumed that mast production has increased in West Virginia with the increase in the number of large-diameter oak and hickory trees. Since 1989, the number of oak and hickory trees 11 inches and larger in d.b.h. has increased by 8 and 13 percent, respectively. These gains more than offset the 11-percent decline in large beech trees.
Dead and Cull Trees Benefi t WildlifeStanding dead trees are important feeding and nesting sites for wildlife. These trees have a higher probability of use by primary cavity nesters such as woodpeckers than other trees because their wood is excavated more easily. These and natural cavities caused by disease or injury are used as resting or nesting sites by various bird species and small mammals. In West Virginia, 3 percent of all trees standing in the forest that are more than 5 inches d.b.h. are dead. On average, there are 14 dead trees 5 inches or larger in d.b.h. per acre of timberland; 0.8 of these are 15 inches or larger in d.b.h. (Fig. 24). One-fi fth of the dead trees are species of oak.
Cull trees, also important to wildlife, exceed maximum allowances for defects for use as timber products. Yet some of the same characteristics that make these trees undesirable for timber products benefi t wildlife. Examples include cavities, broken tops, pockets of rot, and boles with numerous forks and limbs. On average, there are 13 cull trees per acre of timberland.
Figure 23.—Percentage of timberland by size class, West Virginia, 1949, 1961, 1975, 1989, and 2000.
11.8
1.60.8
9.6
2.31.1
0
3
6
9
12
15
5.0-10.9 11.0-14.9 15+Diameter class (inches at breast height)
Num
ber o
f tre
es p
er a
cre
DeadCull
Figure 24.—Average number of dead and cull trees per acre of timberland, West Virginia, 2000.
22
33
45
24 27
49
21
3544
7
34
59
8
22
70
0
20
40
60
80
100
Sapling/seedlingNonstocked
Poletimber SawtimberStand-size Class
Perc
enta
ge o
f Tim
berla
nd
1949 1961 1975 1989 2000

18
TIMBER VOLUMEGrowing-Stock VolumeGrowing-stock volume is the volume of wood that is potentially available for use as timber products, including pulpwood, sawlogs, and veneer logs. Trees in this category meet minimum requirements for size, straightness, and rot, and are of commercial species. They form the resource base on which the forest products industry depends. In 2000, West Virginia’s growing-stock volume has increased by 6.5 percent to 22.4 billion cubic feet since 1989 (Fig. 25). The portion of this volume that is large enough to produce sawlogs increased by 14.3 percent to 71.4 billion board feet (Fig. 26). These recent gains are a continuation of increases that have been occurring over the last half century, though the rate of increase is slowing. Gains in growing-stock and board-foot volume between 1975 and 1989 were 37 and 60 percent respectively. Average growing-stock volume per acre is now triple that in 1949, increasing from 626 cubic feet in 1949 to 1,895 cubic feet in 2000. During this same period, board-foot volume increased from 1,780 to 6,050 board feet per acre.
Periodic forest inventories show a steady shift in timber volume toward larger trees (Fig. 27). During the most recent inventory period, the volume of trees decreased in the 6-, 8-, and 10-inch diameter classes, but volume increased in all classes greater than 10 inches (Fig. 28). This refl ects the changes in the number of trees discussed previously. The concentration of volume increases in large sawtimber-size trees (more than 11 inches in d.b.h.) explains why increases in board-foot volume were more than twice that for cubic-foot volume.
625
971
1895
1763
1167
6050
5290
1780
2527
3031
0
500
1000
1500
2000
1949 1961 1975 1989 2000
Cub
ic fe
et p
er a
cre
0
1000
2000
3000
4000
5000
6000
7000
Boa
rd fe
et p
er a
cre
Cubic feet Board feet
0
0.5
1
1.5
2
2.5
3
3.5
6 8 10 12 14 16 18 20Diameter Class (inches at brest height)
Bill
ion
Cub
ic F
eet
1961 1975 1989 2000
Sawtimber sizePoletimber size
22.4
11.1
21.0
13.5
6.2
0
5
10
15
20
25
1945 1955 1965 1975 1985 1995 2005Year
Bill
ion
Cub
ic F
eet
Sampling errors: 0.9 percent in 1989 and 1.3 percent in 2000
Figure 25.—Growing-stock volume by inventory year, West Virginia.
Figure 26.—Average growing-stock volume per acre of timberland, West Virginia. Figure 27.—Growing-stock volume by diameter class, West
Virginia, 1961, 1975, 1989, and 2000.

19
Yellow-poplar leads in volume followed by white oak and red maple (Fig. 29). Red maple and sugar maple had the largest increases in volume (27 percent each). Harvesting and mortality caused by the gypsy moth caterpillar contributed to declines in the chestnut oak and the black and scarlet oak species group.
Ninety-four percent of West Virginia’s sawtimber volume is in hardwood species. In hardwood sawtimber volume, the state ranks second in the nation behind Pennsylvania (Fig. 30). West Virginia and neighboring states form the heart of the valuable Appalachian hardwood resource, known worldwide for producing high-quality oak, cherry, maple, and yellow-poplar lumber.
In board-foot volume, the top ranked species differ little from those for all growing-stock volume (Fig. 31). Yellow-poplar remained the leading species, accounting for 18 percent of total board-foot volume, followed by the four oak species groups. Together, oak species account for 36 percent of total board-foot volume. Red maple again had the largest increase (40 percent), and ranked sixth in volume but third in growing-stock volume. The gain for yellow-poplar volume was low because of the high harvesting rate for this species.
Average volumes per acre are highest in northeastern West Virginia (Fig. 32). This region includes much of the Monongahela National Forest, which has high volumes per acre, averaging 2,566 cubic feet of growing stock per acre. Red maple is now the leading species in this region while sugar maple increased by 43 percent and now ranks fi fth in volume. The northwestern region had the lowest average volumes per acre but the largest percentage increases in volume. The largest share of the increase was in red maple volume, which increased by 52 percent (Fig. 33). The southern region had the smallest increases in volume; board-foot volume increased by 4 percent and the volume of all growing stock decreased by 1 percent. The decrease in this region can be attributed to decreases in the growing-stock volume of chestnut oak, scarlet and black oaks, and yellow-poplar.
-20%
-10%
0%
10%
20%
30%
40%
10 12 14 16 18 20 21-28.9
29.0+
Diameter Class (inches at breast height)
Perc
ent
6 8
Sawtimber size
Poleti
0 1 2 3 4
White pineEastern hemlock
Virginia pineWhite ash
A. basswoodBlack cherry
American beechSugar maple
HickoryBlack/scarlet
Northern red oakChestnut oak
Red mapleWhite oak
Yellow-poplar
Billion Cubic Feet
19892000
+4%
+16%
+27%
+6%
-11%
+10%
+20%
+9%
-8%
+27%
+6%
-9%
+9%
-3%
+21%
0 20 40 60 80 100
Arkansas
Kentucky
Tennessee
New York
Michigan
Georgia
Virginia
North Carolina
West Virginia
Pennsylvania
Billion Board Feet
Figure 28.—Percent change in growing-stock volume, 1989-2000, West Virginia.
Figure 29.—Growing-stock volume by species on timberland, West Virginia, 1989 and 2000.
Figure 30.—Current hardwood growing-stock volume for West Virginia and selected states.
Poletimber size
Sawtimber size

20
Tree Quality Varies by SpeciesThe use of the timber resource for sawn timber products is determined largely by tree quality and species. The best trees are used in the manufacture of furniture, cabinets, and other millwork that command high prices. Lower quality trees are used for pallets, pulpwood, and fuelwood. Quality is indicated by the grade assigned to sawtimber-size trees. Tree grade is based on the amount of the bole that is free of knots, amount of cull, and tree diameter. Grade 1 yields the most high-grade lumber and Tie/local use grades the least.
Because small sawtimber-size trees are assigned a low grade on the basis of size alone, the increase in size of West Virginia’s trees has brought about an increase in sawlog quality. Combined with increases in sawlog volume, this represents a tremendous increase in the value of the forest resource for timber products (Fig. 34). The portion of sawtimber volume in grades 1 and 2 increased from 22 percent in 1989 to 33 percent in 2000.
Tree quality varies by species due to differences in average diameter by species, growth characteristics, and past management practices. In West Virginia, yellow-poplar has the largest volume in Grade 1 and 2 trees, followed by northern red oak and white oak (Fig. 35). These as well as the other oak species groups, black cherry, basswood, and ash have at least half of their sawtimber volume in trees graded 2 or better. Of the other major species in the state, beech had the lowest volume in Grades 1 and 2, followed by red maple. Beech bark disease can severely degrade trees and likely contributes to the poor tree grades for beech. Red maple is graded lower than other species because it typically has more defects and a smaller average diameter.
0 2 4 6 8 10 12 14
Virginia pineWhite pine
Eastern hemlockWhite ash
A. basswoodBlack cherry
A. beechSugar maple
HickoryRed maple
Black/scarlet oakChestnut oak
White oakNorthern red oak
Yellow-poplar
Billion Board Feet
19892000
+13%
+20%
+25%
-6%
+15%
+28%
+13%
-2%
+20%+4%
+5%
+5%
+40%
+14%
+31%
Figure 31.—Board foot volume by species on timberland, West Virginia, 1989 and 2000.

21
In West Virginia, about one-third of hardwood sawtimber volume is in trees less than 15 inches in d.b.h. These trees are too small to given Grade 1. Forest-land owners can receive high fi nancial returns by practicing good forestry and tending trees with the potential to grow into high-quality Grade 1 trees. This rewards the landowner and greatly benefi ts the state’s wood-using industries through the value added in manufacturing.
BiomassTrees play an important role in the world’s carbon cycle. They act as a sink for carbon, removing it from the atmosphere in the form of carbon dioxide (a greenhouse gas) and storing it as cellulose. In this role, forests help mitigate the effect of burning fossil fuels and the resulting global climate change associated with increased levels of carbon dioxide in the atmosphere. West Virginia’s forests contribute greatly to the sequestration of carbon due to the increase in tree volume in the state.
Figure 33.—Top fi ve species by region and percent change by volume, West Virginia, 1989-2000.
Figure 32.—Average volume per acre of timberland by region and percent change by volume, West Virginia, 1989-2000.
Northwestern BF/acre 5659 CF/acre 1791 BF change +25 All G.S. change +13
Northeastern BF/acre 6411 CF/acre 1991 BF change +4 All G.S. change +9
Southern BF/acre 5971 CF/acre 1874 BF change +4 All G.S. change -1
State Average BF/acre 6050 CF/acre 1895 BF change +14 All G.S. change +7 Northwestern
Southern
Northeastern
Yellow-poplar +11White oak +10%Black/scarlet oak -8%Chestnut oak +18%Red maple +52%
Red maple +26%Yellow-poplar +5%Northern red oak +3%Chestnut oak -9%Sugar maple +42%
Yellow-poplar -1%Chestnut oak -7%White oak +24%Northern red oak +11%Black/scarlet oak -16%
0
10
20
30
40
50
60
70
80
1989 2000Inventory Year
Bill
ion
Boa
rd F
eet
Grade 1Grade 2Grade 3Tie/local use
34%
39%
17%
10%
21%
29%
26%
24%
28%
32%
32%
3%
14%
14%
10%
27%
23%
23%
42%
32%
33%
28%
25%
8%
23%
32%
22%
23%
32%
30%
26%
27%
26%
23%
21%
27%
35%
35%
39%
26%
33%
32%
20%
23%
12%
17%
22%
62%
28%
18%
29%
23%
11%
15%
13%
18%
0% 20% 40% 60% 80% 100%
Ash
Basswood
Black Cherry
Beech
Sugar maple
Hickory
Red maple
Black and scarlet oak
Chestnut oak
White oak
Northern red oak
Yellow-poplar
Tree grade 1 Tree grade 2 Tree grade 3 Tie and local use
Figure 35.—Percentage of sawlog volume by tree grade for major species, West Virginia, 2000.
Figure 34.—Hardwood board-foot volume by tree grade, West Virginia, 1989 and 2000.

22
Woody biomass is a measure of how much carbon is being stored on forest land. It is the total weight of both live and dead trees, including branches roots and stumps plus the weight of shrubs. The total dry weight of all biomass on West Virginia’s timberland equals 980.4 million dry tons or an average of 83 tons per acre. The greatest portion (58 percent) is in the merchantable boles of commercially important trees (Fig. 36). It is this component that can be converted to high-value wood products. Other portions of biomass are underutilized and can be considered as a potential source of fuel for commercial power generation. Because it is a renewable source of energy, biomass could help reduce the nation’s dependence on fossil fuels. In some regions of the country, the use of biomass to fuel commercial power-generating plants has provided markets for low-grade trees and other waste wood.
SUSTAINABILITY AND USE OF WEST VIRGINIA’S FORESTSGrowth Exceeds RemovalsWell-tended forests supply a continuous fl ow of products without impairing long-term productivity. Unlike coal and oil, forests are alive and renewable. One way to judge the sustainability of a forest is to look at the components of inventory change-- growth, removals, and mortality.
During the last 50 years, the growth of West Virginia’s forest resource has greatly outpaced losses from the removal of trees by cutting and mortality. Removals include trees harvested on land that remains in forest and trees lost because the forest was developed for a nonforest use. The 2000 inventory revealed that since 1989, on an annual basis, the net growth of growing-stock trees in West Virginia averaged 430 million cubic feet versus 248 million cubic feet in removals (Fig. 37). The net change of 182 million cubic feet was half the increase for the 1975-89 inventory period.
This surplus amounts to an annual net increase of 0.8 percent in the volume of wood on the state’s timberland. Surplus growth over harvest has been accumulating in the forest since the fi rst FIA inventory in 1949, and today’s well-stocked forests are a product of those steady gains over time.
Saplings/seedlings/shrubs
7%
Dead trees1%
Cull trees7%
Stump and roots18%
Branches and foliage9%
Growing stock58%
Figure 36.—Components of woody biomass, West Virginia, 2000. Total woody biomass equals 980 million dry tons.

23
Ninety-two percent of removals are attributed to harvesting and 8 percent to timberland converted to nonforest use. Average annual removals of growing stock from 1989 to 2000 were 80 percent greater than during the 1975 to 1989 period. In board-foot volume, removals more than doubled to 966 million board feet. The harvesting of trees 16 inches and larger in d.b.h. accounted for 70 percent of removals volume. Increases in removals correspond to increases in milling capacity at West Virginia’s sawmills and other wood processors. The increases in removals along with increases in mortality are responsible for the decrease in the annual net change from earlier inventories.
A measure of the sustainability of forest-management practices is the ratio of net growth to removals. The growth-to-removals (G/R) ratio for all species combined averaged 1.7:1 for 1989-2000, but varied considerably between species (Fig. 38). Yellow-poplar had the largest amount of removals but growth still exceeded removals by 2.7 to 1. Oaks generally had low G/R ratios; among the four oak species groups growth exceeded removals only in white oak. Together, oak species accounted for nearly half of the total volume removed. Red maple had the highest ratio, with growth outpacing removals by 5.4 to 1. Comparing individual species to the all-species average ratio (1.7:1) reveals which species are increasing in importance and which are decreasing. Red maple clearly will play a larger role in West Virginia’s forests, particularly as the composition of the forest shifts from oaks to other species.
-248
430
592
183
-160
-400
-200
0
200
400
600
Gross Growth Mortality Net Growth Removals Net Change
Milli
on C
ubic
Fee
t
0 25 50 75 100 125
Basswood
Beech
Ash
Hickory
Northern red oak
Chestnut oak
Black/scarlet oak
Black cherry
Sugar maple
White oak
Red maple
Yellow-poplar
Miillion Cubic Feet
GrowthRemovals
2.7:15.4:1
1.4:1
3.7:1
2.0:1
0.8:1
0.8:1
0.6:1
1.7:15.0:1
0.7:1
1.2:1
Figure 37.—Annual components of change in growing-stock volume, West Virginia, 1989-2000. Ninety-two percent of removals are due to harvesting and 8 percent due to land use changed to non-forest use.
Figure 38.—Average annual net growth, removals, and G/R ratio for major species, West Virginia, 1989-2000.

24
MortalityThe volume of trees that die from causes other than cutting is reported as mortality. In addition to insects and diseases, disturbances such as fi re, wind, and competition among trees contribute to tree mortality. In West Virginia, average annual mortality was 160 million cubic feet or 0.7 percent of the inventory volume. This rate is similar to those for neighboring states and is considered normal. Generally, mortality rates were higher for trees in the lower diameter class and for largest trees (Fig 39). Trees in the 6-inch class and those 29+ inches in d.b.h. each had a mortality rate of 1.6 percent per year, more than twice that for all species combined. In many instances, the smaller trees that died were understory trees that were crowded out by larger trees.
Species groups with high annual mortality rates were Virginia pine and beech at 3.9 and 1.4 percent, respectively (Fig. 40). High mortality rates for Virginia pine can be expected as it is replaced by more shade tolerant hardwood species. The beech bark disease complex, fi rst discovered in Nova Scotia in the late 1890s, consists of a Nectria fungi spread by a scale insect (Evans 2005). It has been slowly spreading south and was detected in northeastern West Virginia in the early 1980s. Typically, many beech trees die in the initial years in which a stand is infected, but it can take many years of infection before trees succumb, with infected trees often rendered highly defective. After many years of infection,
stands typically contain a few large residual beech trees and many small beech originating from both seedling and root sprouts. It is expected that beech in West Virginia will continue to experience high mortality as the disease spreads across the state.
Forest HealthForests are continually stressed by insects, diseases, and other factors that reduce growth and increase tree mortality. How forests withstand them is a measure of their overall health. To a great extent, West Virginia’s forests have withstood these stresses as trees have continued to increase in size and volume. An increasing threat to forest health is the introduction of exotic insects, diseases, and plants from overseas. Introduced species typically have few natural enemies in this country, so unchecked populations can explode under the right conditions.
The loss of the American chestnut to the chestnut blight and the demise of American elm to the Dutch elm disease in the last century demonstrate the destructive nature of nonnative exotic species. Introduced diseases that are not as well known are the butternut canker, which is slowly eliminating butternut trees from the nation’s eastern forests, and dogwood anthracnose, which has greatly reduced the populations of dogwood trees in the forest understory. Since the mid-1980s, periodic outbreaks of the gypsy moth caterpillar have defoliated

25
thousands of acres of forest, resulting in large losses of tree growth and extensive tree mortality. White oak is particularly susceptible to gypsy moth. More recently beech bark disease and the hemlock woolly adelgid have spread into the state, and the emerald ash borer has infested trees in Ohio.
The FIA Program looks at a wide set of indicators that refl ect forest conditions. One of these is crown dieback or the percentage of branch tips that are dead. Dieback can be a sign that a tree is being attacked by an insect or disease or has other health problems. As trees grow and stands become more crowded, the weaker, less competitive trees experience dieback. Fortunately, relatively few forest trees in West Virginia had a signifi cant amount of crown dieback: 84 percent had 0 to 5 percent and only 1 percent had dieback greater than 20 percent (Fig. 41). Differences in dieback among species might indicate differences in tree vigor, though some variation should be expected among species with different growth characteristics. Over time, observations of dieback and similar attributes will help us identify trends and better evaluate forest conditions in West Virginia and elsewhere.
THE FUTURE OF WEST VIRGINIA’S FORESTSIn general, West Virginia’s forests are healthy and resilient, and continue to mature. Current trends indicate that trees are getting larger, timber volumes are increasing, and timber quality is improving. Forests also are gaining in old-growth characteristics and the forest-land base is fairly stable. These improvements have occurred despite a near doubling of the timber harvest since 1989 to almost a billion board feet per year. Because tree growth continues to outpace removals by a wide margin, these improvements should continue, though the margin is narrowing and the species composition of the forest is changing. The lower diameter classes that represent the trees of the future forest are dominated by maples and other non-oak species. Oak trees that now dominate the overstory will increasingly be replaced by red and sugar maples as they succumb to insects, diseases, and harvesting because of the lack of young oak.
0.20.20.20.2
0.40.4
0.40.5
0.70.80.8
0.8
1.11.4
3.9
0.0 1.0 2.0 3.0 4.0 5.0
White pineYellow-poplar
White oakWhite ash
Black cherrySugar maple
Red mapleHemlock
HickoryA. BasswoodChestnut oak
Black/scarlet oakNorthern red oakAmerican beech
Virginia pine
Percentage of Inventory
Average ratefor all speceies = 0.7%
62%
35%
39%
42%
57%
27%
49%
43%
45%
29%
41%
9%
16%
18%
11%
13%
15%43%
0% 20% 40% 60% 80% 100%
Beech
White oak
Sugar maple
Red maple
Yellow-poplar
All species
Percent of trees by dieback class
No Dieback 1-5% 6-20% >20%
1%
Figure 41.—Dieback on trees in West Virginia, 1999-2004.Figure 40.—Average annual mortality rate for major species, West Virginia, 1989-2000.
0.0%
0.5%
1.0%
1.5%
6 8 10 12 14 16 18 20 21-28.9
29.0+
Diameter Class (inches at breast height)
Mor
talit
y R
ate
(%)
Figure 39.—Average annual mortality by diameter class, West Virginia, 1989-2000.
26
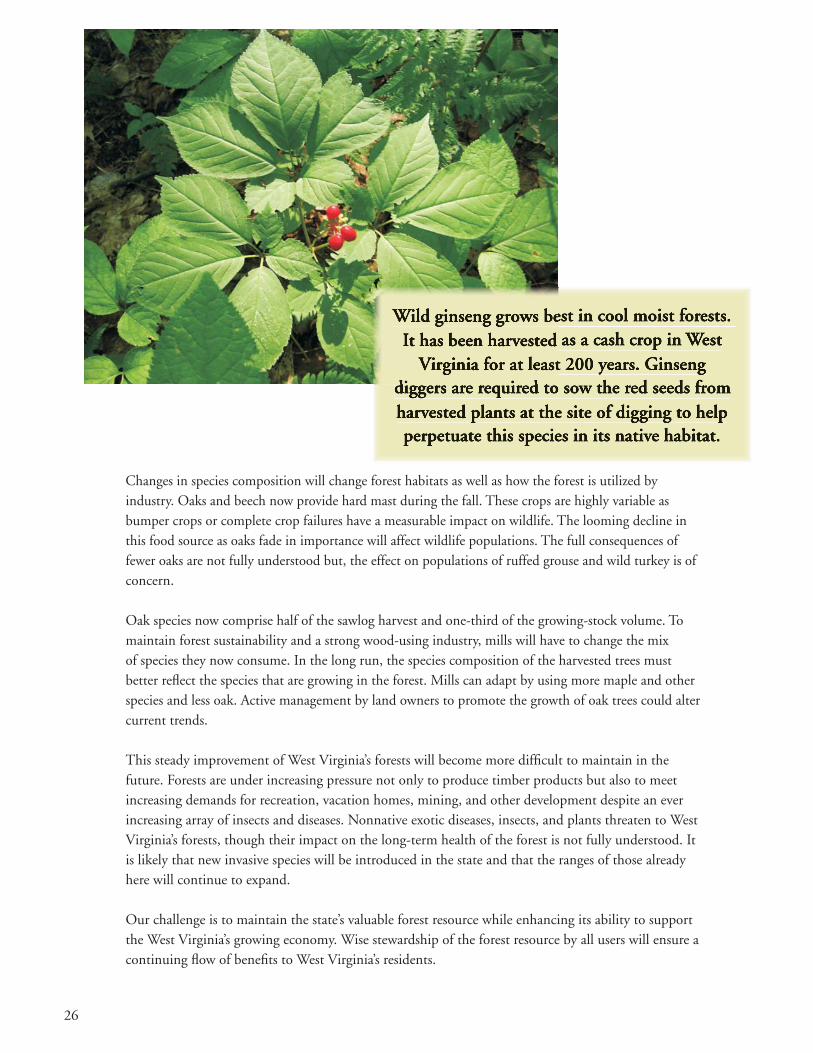
Changes in species composition will change forest habitats as well as how the forest is utilized by industry. Oaks and beech now provide hard mast during the fall. These crops are highly variable as bumper crops or complete crop failures have a measurable impact on wildlife. The looming decline in this food source as oaks fade in importance will affect wildlife populations. The full consequences of fewer oaks are not fully understood but, the effect on populations of ruffed grouse and wild turkey is of concern.
Oak species now comprise half of the sawlog harvest and one-third of the growing-stock volume. To maintain forest sustainability and a strong wood-using industry, mills will have to change the mix of species they now consume. In the long run, the species composition of the harvested trees must better refl ect the species that are growing in the forest. Mills can adapt by using more maple and other species and less oak. Active management by land owners to promote the growth of oak trees could alter current trends.
This steady improvement of West Virginia’s forests will become more diffi cult to maintain in the future. Forests are under increasing pressure not only to produce timber products but also to meet increasing demands for recreation, vacation homes, mining, and other development despite an ever increasing array of insects and diseases. Nonnative exotic diseases, insects, and plants threaten to West Virginia’s forests, though their impact on the long-term health of the forest is not fully understood. It is likely that new invasive species will be introduced in the state and that the ranges of those already here will continue to expand.
Our challenge is to maintain the state’s valuable forest resource while enhancing its ability to support the West Virginia’s growing economy. Wise stewardship of the forest resource by all users will ensure a continuing fl ow of benefi ts to West Virginia’s residents.

27
APPENDIXAbout Forest InventoriesWidespread land abuse in the Eastern United States led to Congressional passage of conservation legislation in the early part of the 20th century. Under this and subsequent legislation, the Forest Service began conducting continuing forest inventories of all states to provide up-to-date information on the nation’s forest resources. Currently inventories are conducted by the Northern Research Station’s FIA unit.
NRS-FIA provides objective and scientifi cally credible information on key forest ecosystem indicators: how much forest there is and whether it is increasing or decreasing, its composition, whether we are gaining or losing species, and how quickly trees are growing, dying, and being harvested. Such important information:
Aids policymakers at the federal and state level in formulating sound forest policy and in assessing the sustainability of current and past policies.
Enables land managers to devise better management plans and better assess the effects of current and past management practices.
Serves as a starting point for scientifi c investigations of factors that contribute to changes in forest ecosystems over time.
Keeps the public informed about the health and sustainability of the nation’s forests.
Helps scientists and land managers address resource issues such as urbanization, forest fragmentation, invasive species, wildfi re risk, global climate change, and water quality.
During the years 1999-2001, the U.S. Forest Service, NRS-FIA Unit, conducted the latest inventory of West Virginia’s forests (Griffi th 2003). This inventory is dated 2000. The West Virginia Bureau of Commerce Division of Forestry cooperated in this effort. Previous inventories were conducted in 1949, 1961, 1975, and 1989 (Ferguson 1964, Bones 1978, DiGiovanni 1990).
FIA uses a scientifi cally designed sampling method that has been adopted by all FIA units in the United States as the basis for the National Inventory Program. Specifi cally, a hexagonal grid, with each cell representing nearly 5,750 acres, was placed over the United States. During the 2000 West Virginia inventory, each hexagon was populated with one sample ground plot. If the hexagon contained one or more ground plots from the 1989 inventory, the plot located nearest the hexagon center was selected for remeasurement. In hexagons with no plot from the previous inventory, a new plot was randomly located. This resulted in a sample that included 1,176 plots established during the previous inventory, and 1,365 ground plots that were established for the fi rst time. Remeasured plots provide important information on growth, removals, and mortality. Field crews collected information on a host of forest attributes, including the number, size, and species of trees. These data enabled researchers to make reliable estimates of the current condition and overall health of West Virginia’s forests, as well as the degree to which this vital resource is changing over time.
In 2004, NRS-FIA began to inventory West Virginia’s forests annually. This entails remeasuring all plots that were measured in 2000. Each year, one-fi fth of the inventory plots will be measured and each year’s plots are located in such a way that they represent the entire state. Therefore, it will be possible to make state-level estimates before the complete inventory is completed.
•
•
•
•
•

28
LITERATURE CITEDBones, James T. 1978. The forest resources of West Virginia. Resour. Bull. NE-56. Broomall, PA:
U.S. Department of Agriculture, Forest Service, Northeastern Forest Experiment Station. 105 p.
Carvell Kenneth L.; Maxey, William R. 1998 Protectors of the forest resources—A history of the West Virginia Division of Forestry 1909-1998. Charleston, WV: West Virginia Division of Forestry. 37 p.
Clarkson Roy B. 1964. Tumult on the mountains Lumbering in West Virginia—1770-1920. Parsons, WV: McClain Printing Company. 410 p.
DiGiovanni, Dawn M. 1990. Forest statistics for West Virginia—1975 and 1989. Resour. Bull. NE-114. Radnor, PA: U.S. Department of Agriculture, Forest Service, Northeastern Research Station. 172 p.
Evans, Celia A.; Lucas, Jennifer A.; Twery, Mark J. 2005. Beech bark disease: proceedings of the beech bark disease symposium. Gen. Tech. Pep. NE-331. Newtown Square PA: U.S. Department of Agriculture, Forest Service, Northeastern Research Station. 149 p.
Ferguson, Roland H. 1964. The timber resources of West Virginia. Resour. Bull. NE-2. Upper Darby, PA: U.S. Department of Agriculture, Forest Service, Northeastern Forest Experiment Station. 123 p.
Fralish, James S. 2004. The keystone role of oak and hickory in the central hardwood forest. In: Spetich, Martin A., ed. Upland oak ecology symposium: history, current conditions, and sustainability. Gen. Tech. Rep. SRS-73. Asheville, NC: U.S. Department of Agriculture, Forest Service, Southern Research Station: 78-87.
Griffi th, Douglas M.; Widmann, Richard H. 2003. Forest statistics for West Virginia: 1989 and 2000. Resour. Bull. NE-157. Newtown Square, PA: U.S. Department of Agriculture, Forest Service, Northeastern Research Station. 119 p.
Steer, Henry B. 1948. Lumber production in the United States, 1779-1946. Misc. Publ. 699. Washington, DC: U.S. Department of Agriculture. 233 p.
For additional information contact:Forest Inventory and Analysis, U.S. Forest ServiceNorthern Research Station11 Campus Boulevard, Suite 200Newtown Square, PA 19073(610) 557-4051; www.nrs.fs.fed.us/fi a/
WV Division of Forestry 1900 Kanawha Blvd., East Charleston, WV 25305-0180 (304) 558-3446; www.wvforestry.com

Printed on Recycled Paper
Widmann, Richard H.; Dye, Charles R.; Cook, Gregory W. 2007. Forests of the Mountain State. Resour. Bull. NRS-17. Newtown Square, PA: U.S. Department of Agriculture, Forest Service, Northern Research Station. 28 p.
A report on the forest inventory of West Virginia conducted in 1999-2001 by the Forest Inventory and Analysis unit of the Northeastern Research Station. Discusses the current condition and changes from previous inventories for forest area, timber volume, tree species, mortality and growth and removals. Graphics depict data at the state level and by county where appropriate.
KEY WORDS: West Virginia, forest inventory, growing-stock volume, biomass, growth, mortality, removals
The U.S. Department of Agriculture (USDA) prohibits discrimination in all its programs and activities on the basis of race, color, national origin, age, disability, and where applicable, sex, marital status, familial status, parental status, religion, sexual orientation, genetic information, political beliefs, reprisal, or because all or part of an individual’s income is derived from any public assistance program (Not all prohibited bases apply to all programs.) Persons with disabilities who require alternate means for communication of program information (Braille, large print, audiotape, etc.) should contact USDA’s TARGET Center at (202) 720-2600 (voice and TDD). To fi le a complaint of discrimination, write to USDA, Director, Offi ce of Civil Rights, 1400 Independence Avenue, S.W., Washington, DC 20250-9410, or call (800)795-3272 (voice) or (202)720-6382 (TDD). USDA is an equal opportunity provider and employer.

www.nrs.fs.fed.us
Capitalizing on the strengths of existing science capacity in the Northeast and Midwest to attain a more integrated, cohesive, landscape-scale research program